
Chris Parmer
November 3, 2026
Types of Charts and Graphs - A Complete Guide to 45 Chart Types
TL;DR
- This page lists 45 chart types, each with one real-data example, what it's for, and a link to a full post on it, usually a complete guide with more examples, styling advice and code.
- The charts are grouped by the question they answer: comparing values, distributions, parts of a whole, flows, change over time, relationships between variables, maps, schedules and KPIs, and clinical statistics.
- A sorted bar chart or a line chart answers most questions. The charts here are for data with a shape those can't show well, such as a hierarchy, a flow, a whole distribution or a ranking that reshuffles.
- AI coding tools write Plotly code for all of them, using Plotly's open-source graphing libraries for Python and JavaScript. Plotly has dedicated traces for many of these charts, and you make the rest from base traces like go.Scatter and go.Bar, as each guide shows.
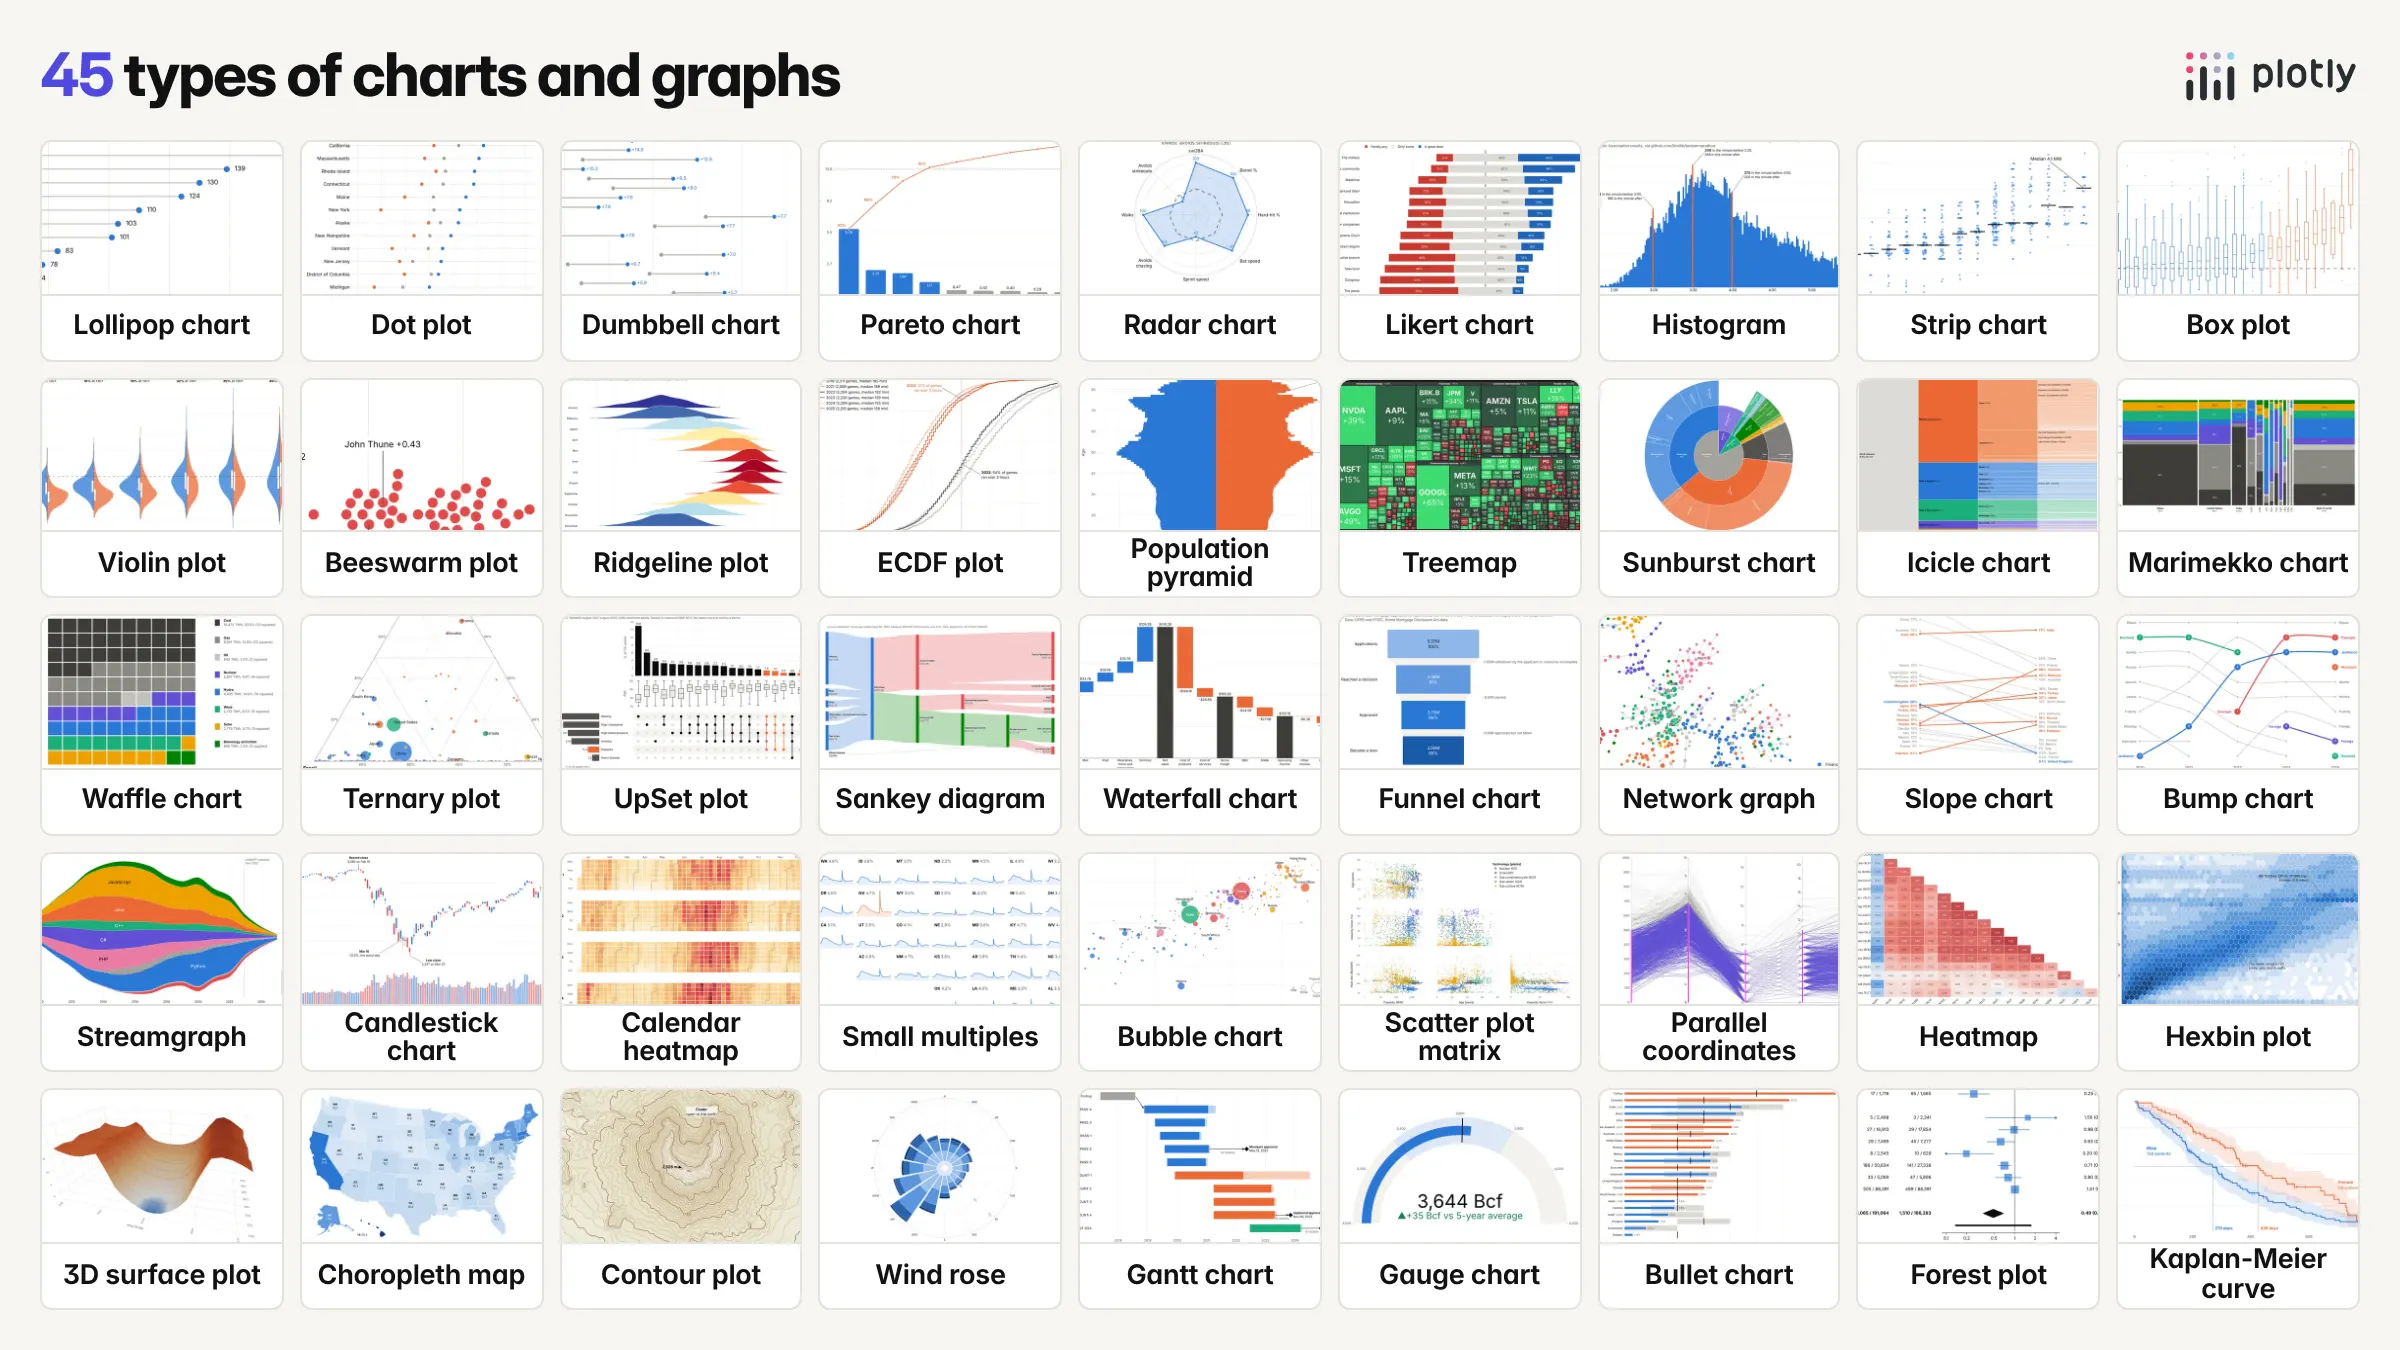
Choosing between all the types of charts and graphs is easier when you start from the question rather than the chart: are you comparing values, looking at how numbers are spread out, splitting a whole into parts, following a flow, or watching something change over time? Find the group below that matches your question, then pick the chart whose example looks most like your data. Each entry links to a full post on that chart, in most cases a complete guide with real-data examples, the code, and the cases where a different chart works better.
The groups on this page:
- Charts for comparing values
- Charts for distributions
- Charts for parts of a whole and hierarchies
- Charts for flows and processes
- Charts for change over time and rankings
- Charts for relationships between many variables
- Maps, terrain and direction
- Schedules and KPIs
- Statistics and clinical charts
Charts for comparing values
These charts compare one number across categories. A sorted bar chart is the default; these are the variations for when there are many rows, two values per row, a target or a survey scale.
Lollipop chart
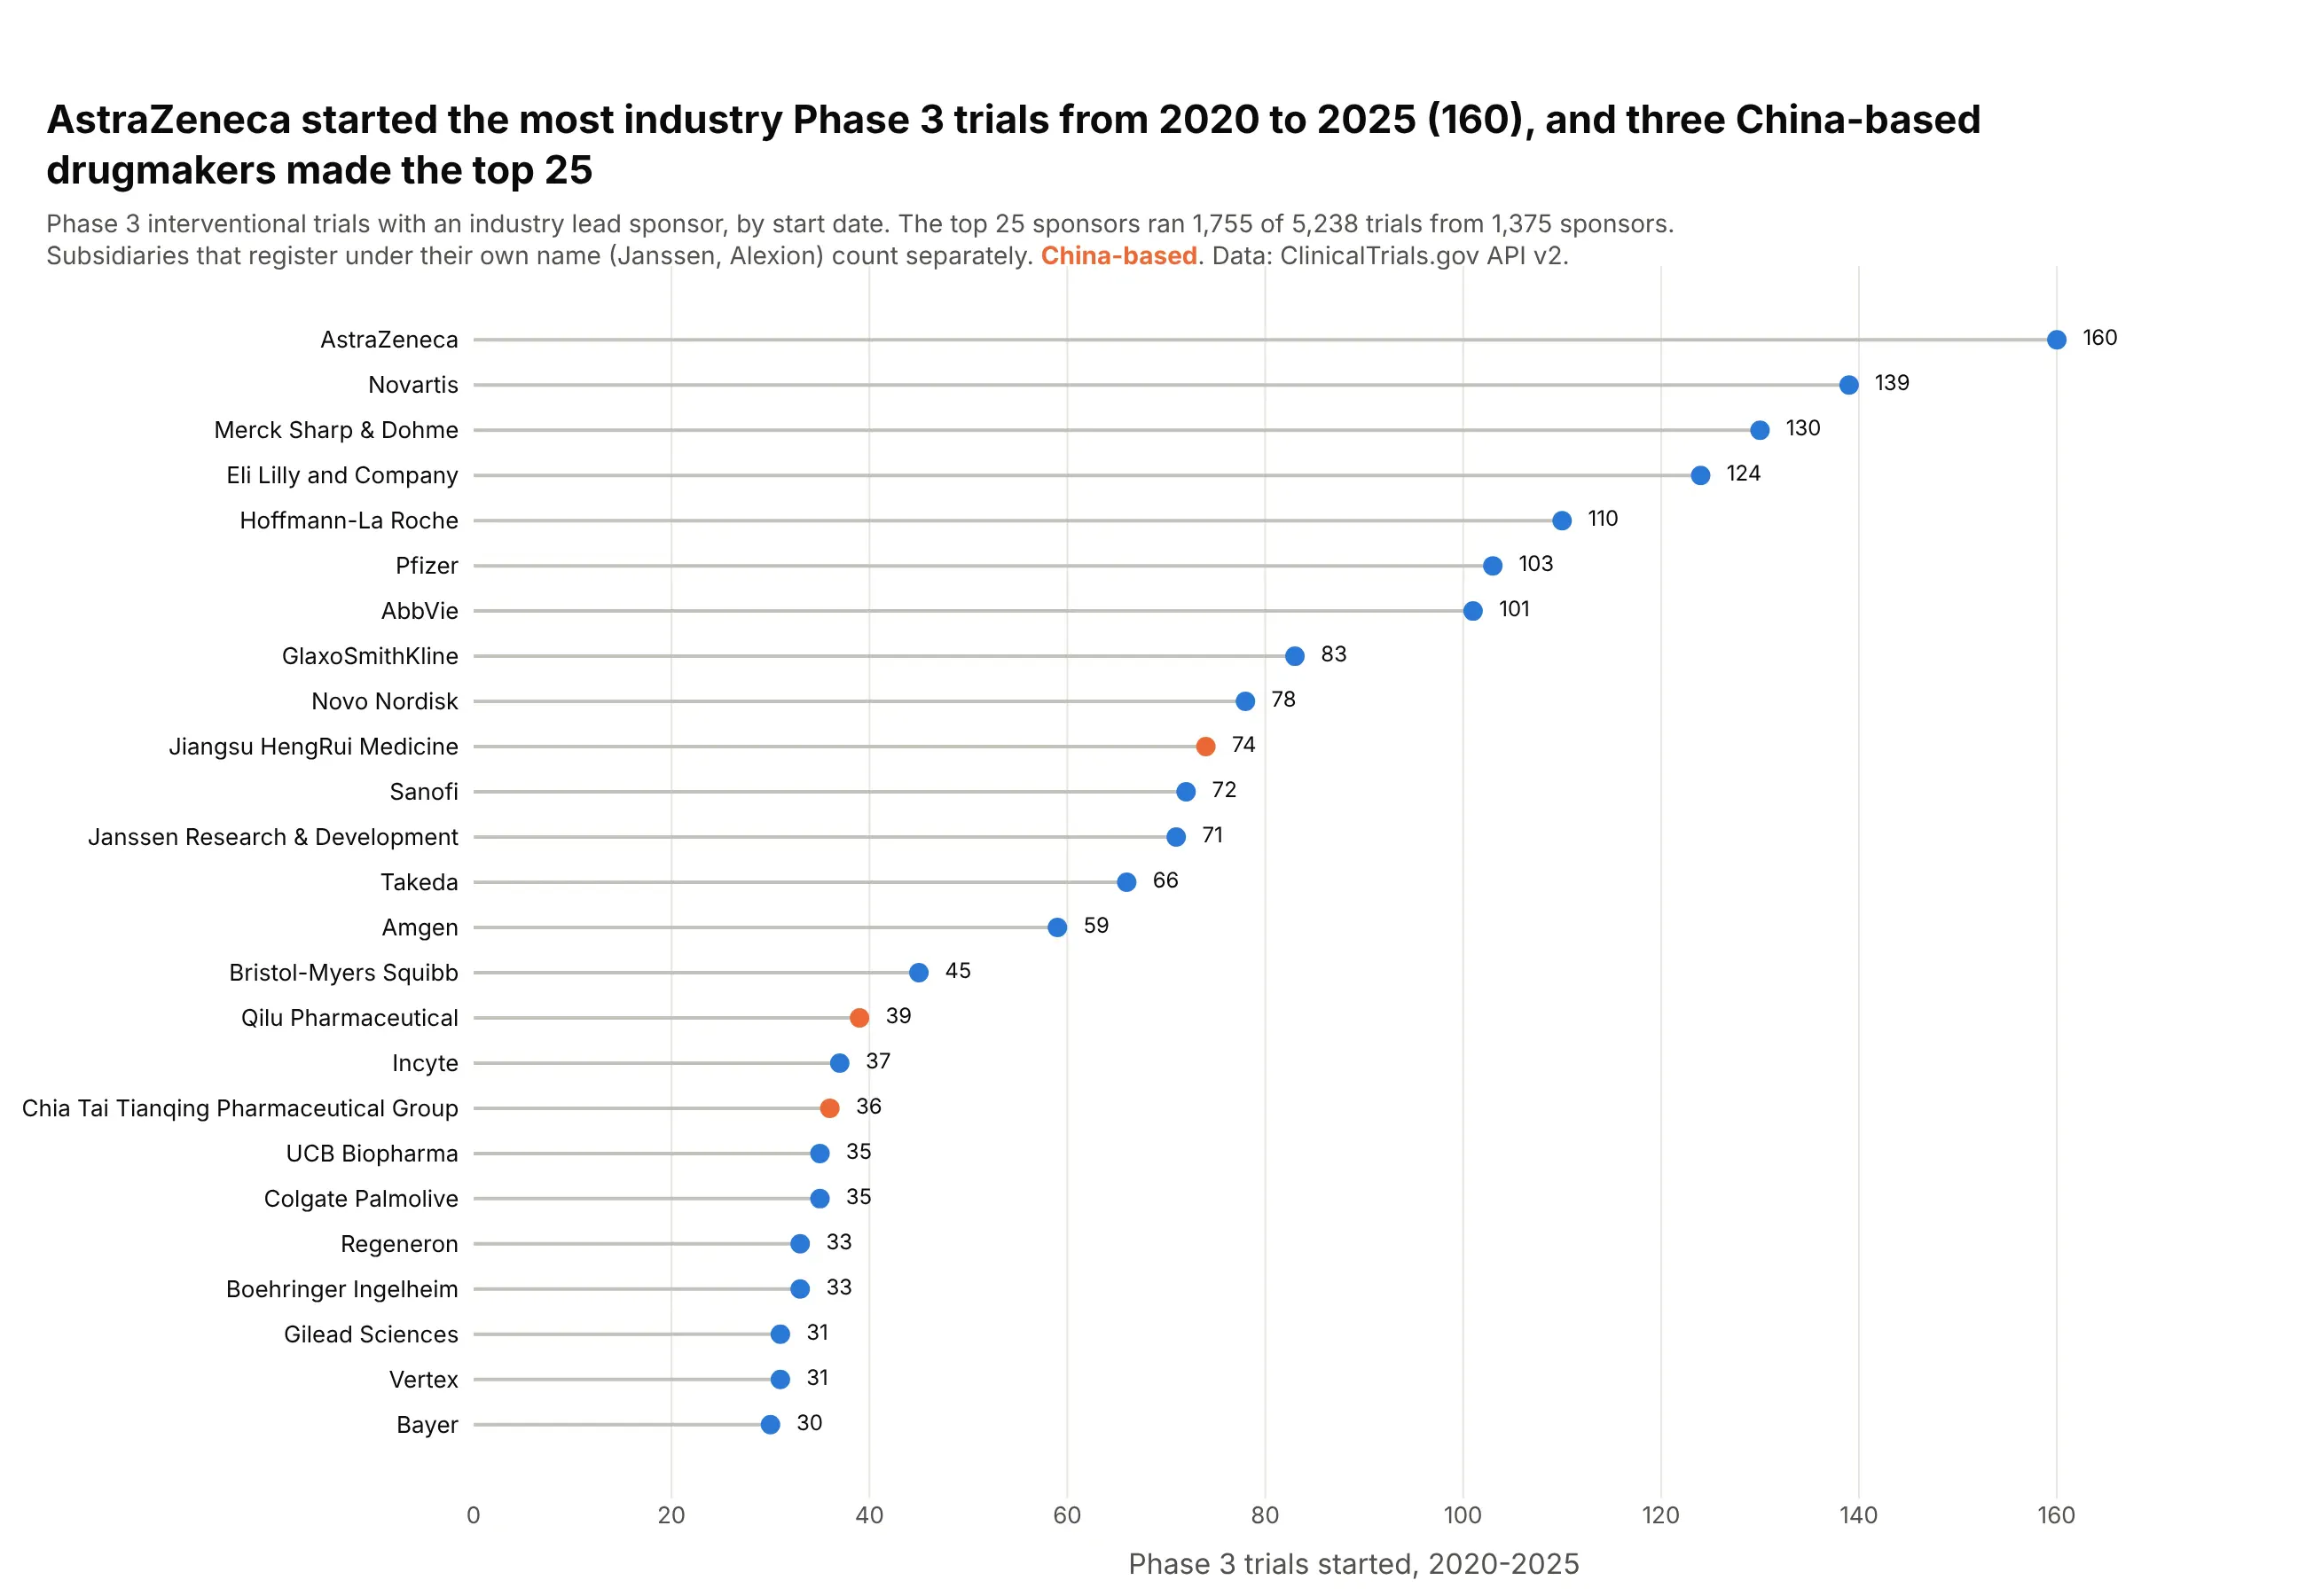
A lollipop chart is a bar chart with each bar drawn as a thin stem and a dot at the value, so it shows the same lengths from zero with much less ink. Use one instead of bars when there are many bars of similar length, values around a benchmark, or ordered categories such as months. Also known as lollipop plots and stem plots.
Read the complete guide to lollipop charts
Dot plot
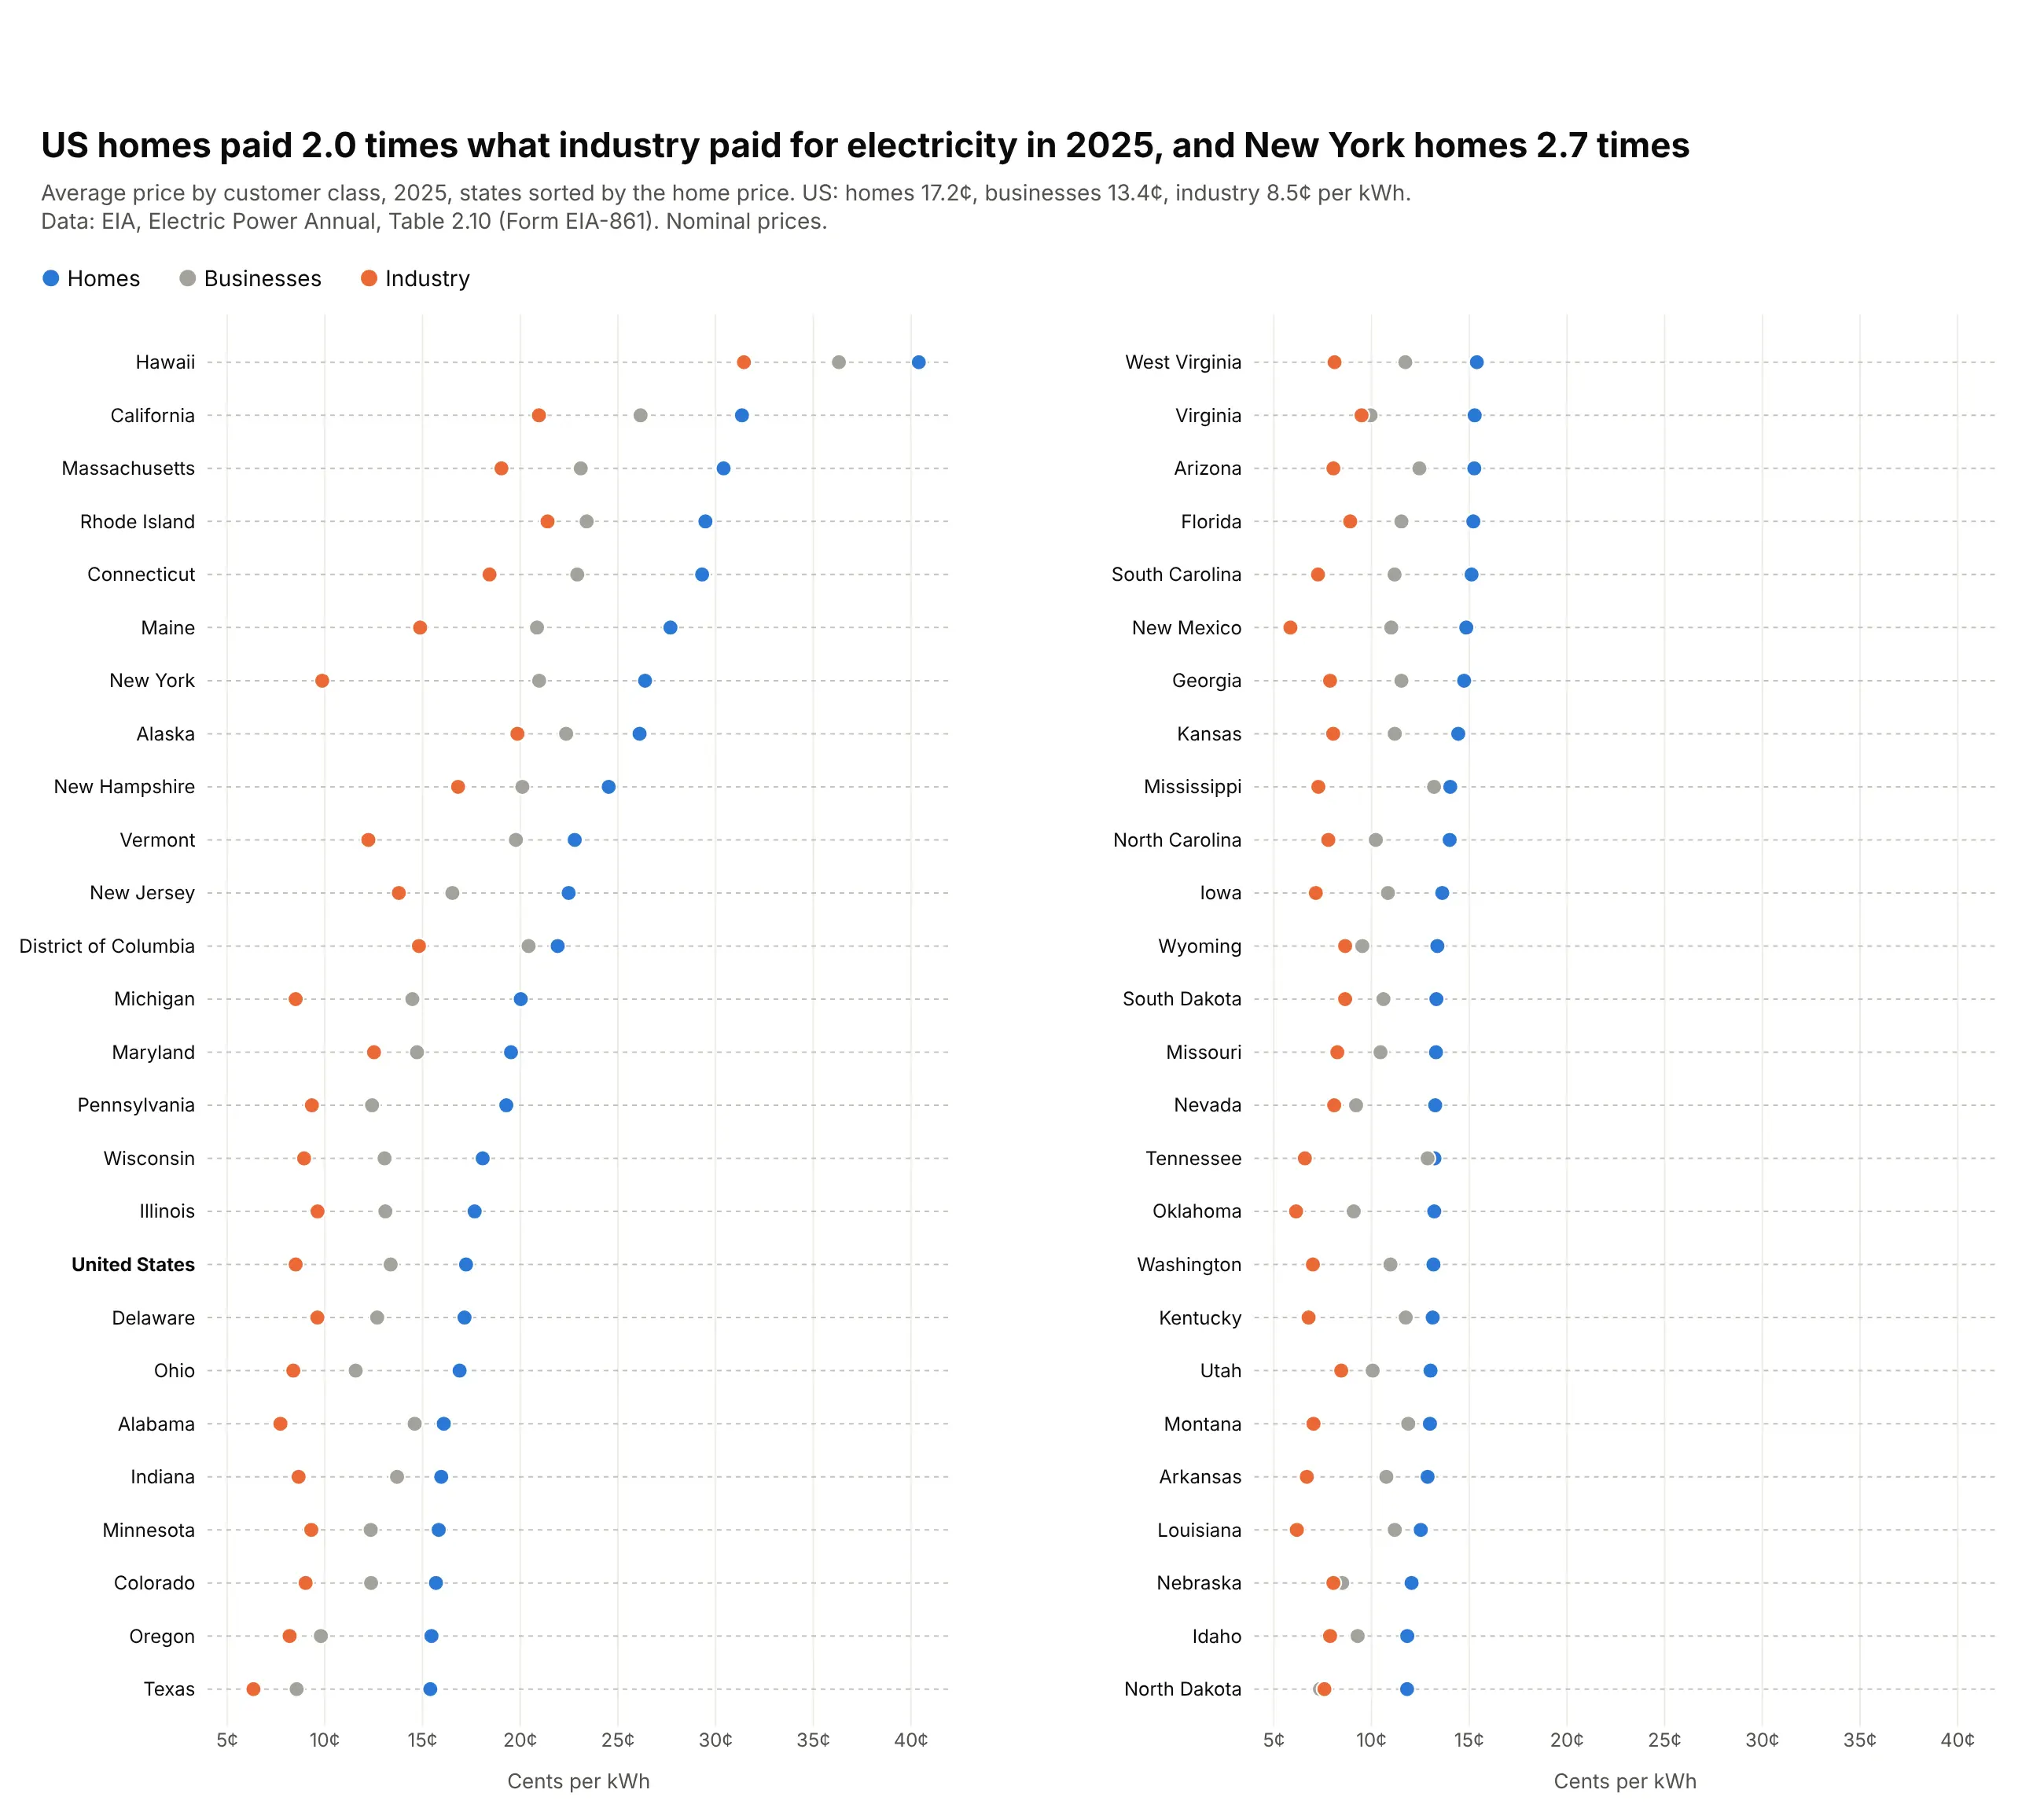
A dot plot puts one dot per value on a common scale, one sorted row per category, with several series on the same line. Use one instead of a bar chart when the axis shouldn't start at zero, when the scale is logarithmic, or when you have two to five values per row. Also known as dot charts and Cleveland dot plots.
Read the complete guide to dot plots
Dumbbell chart
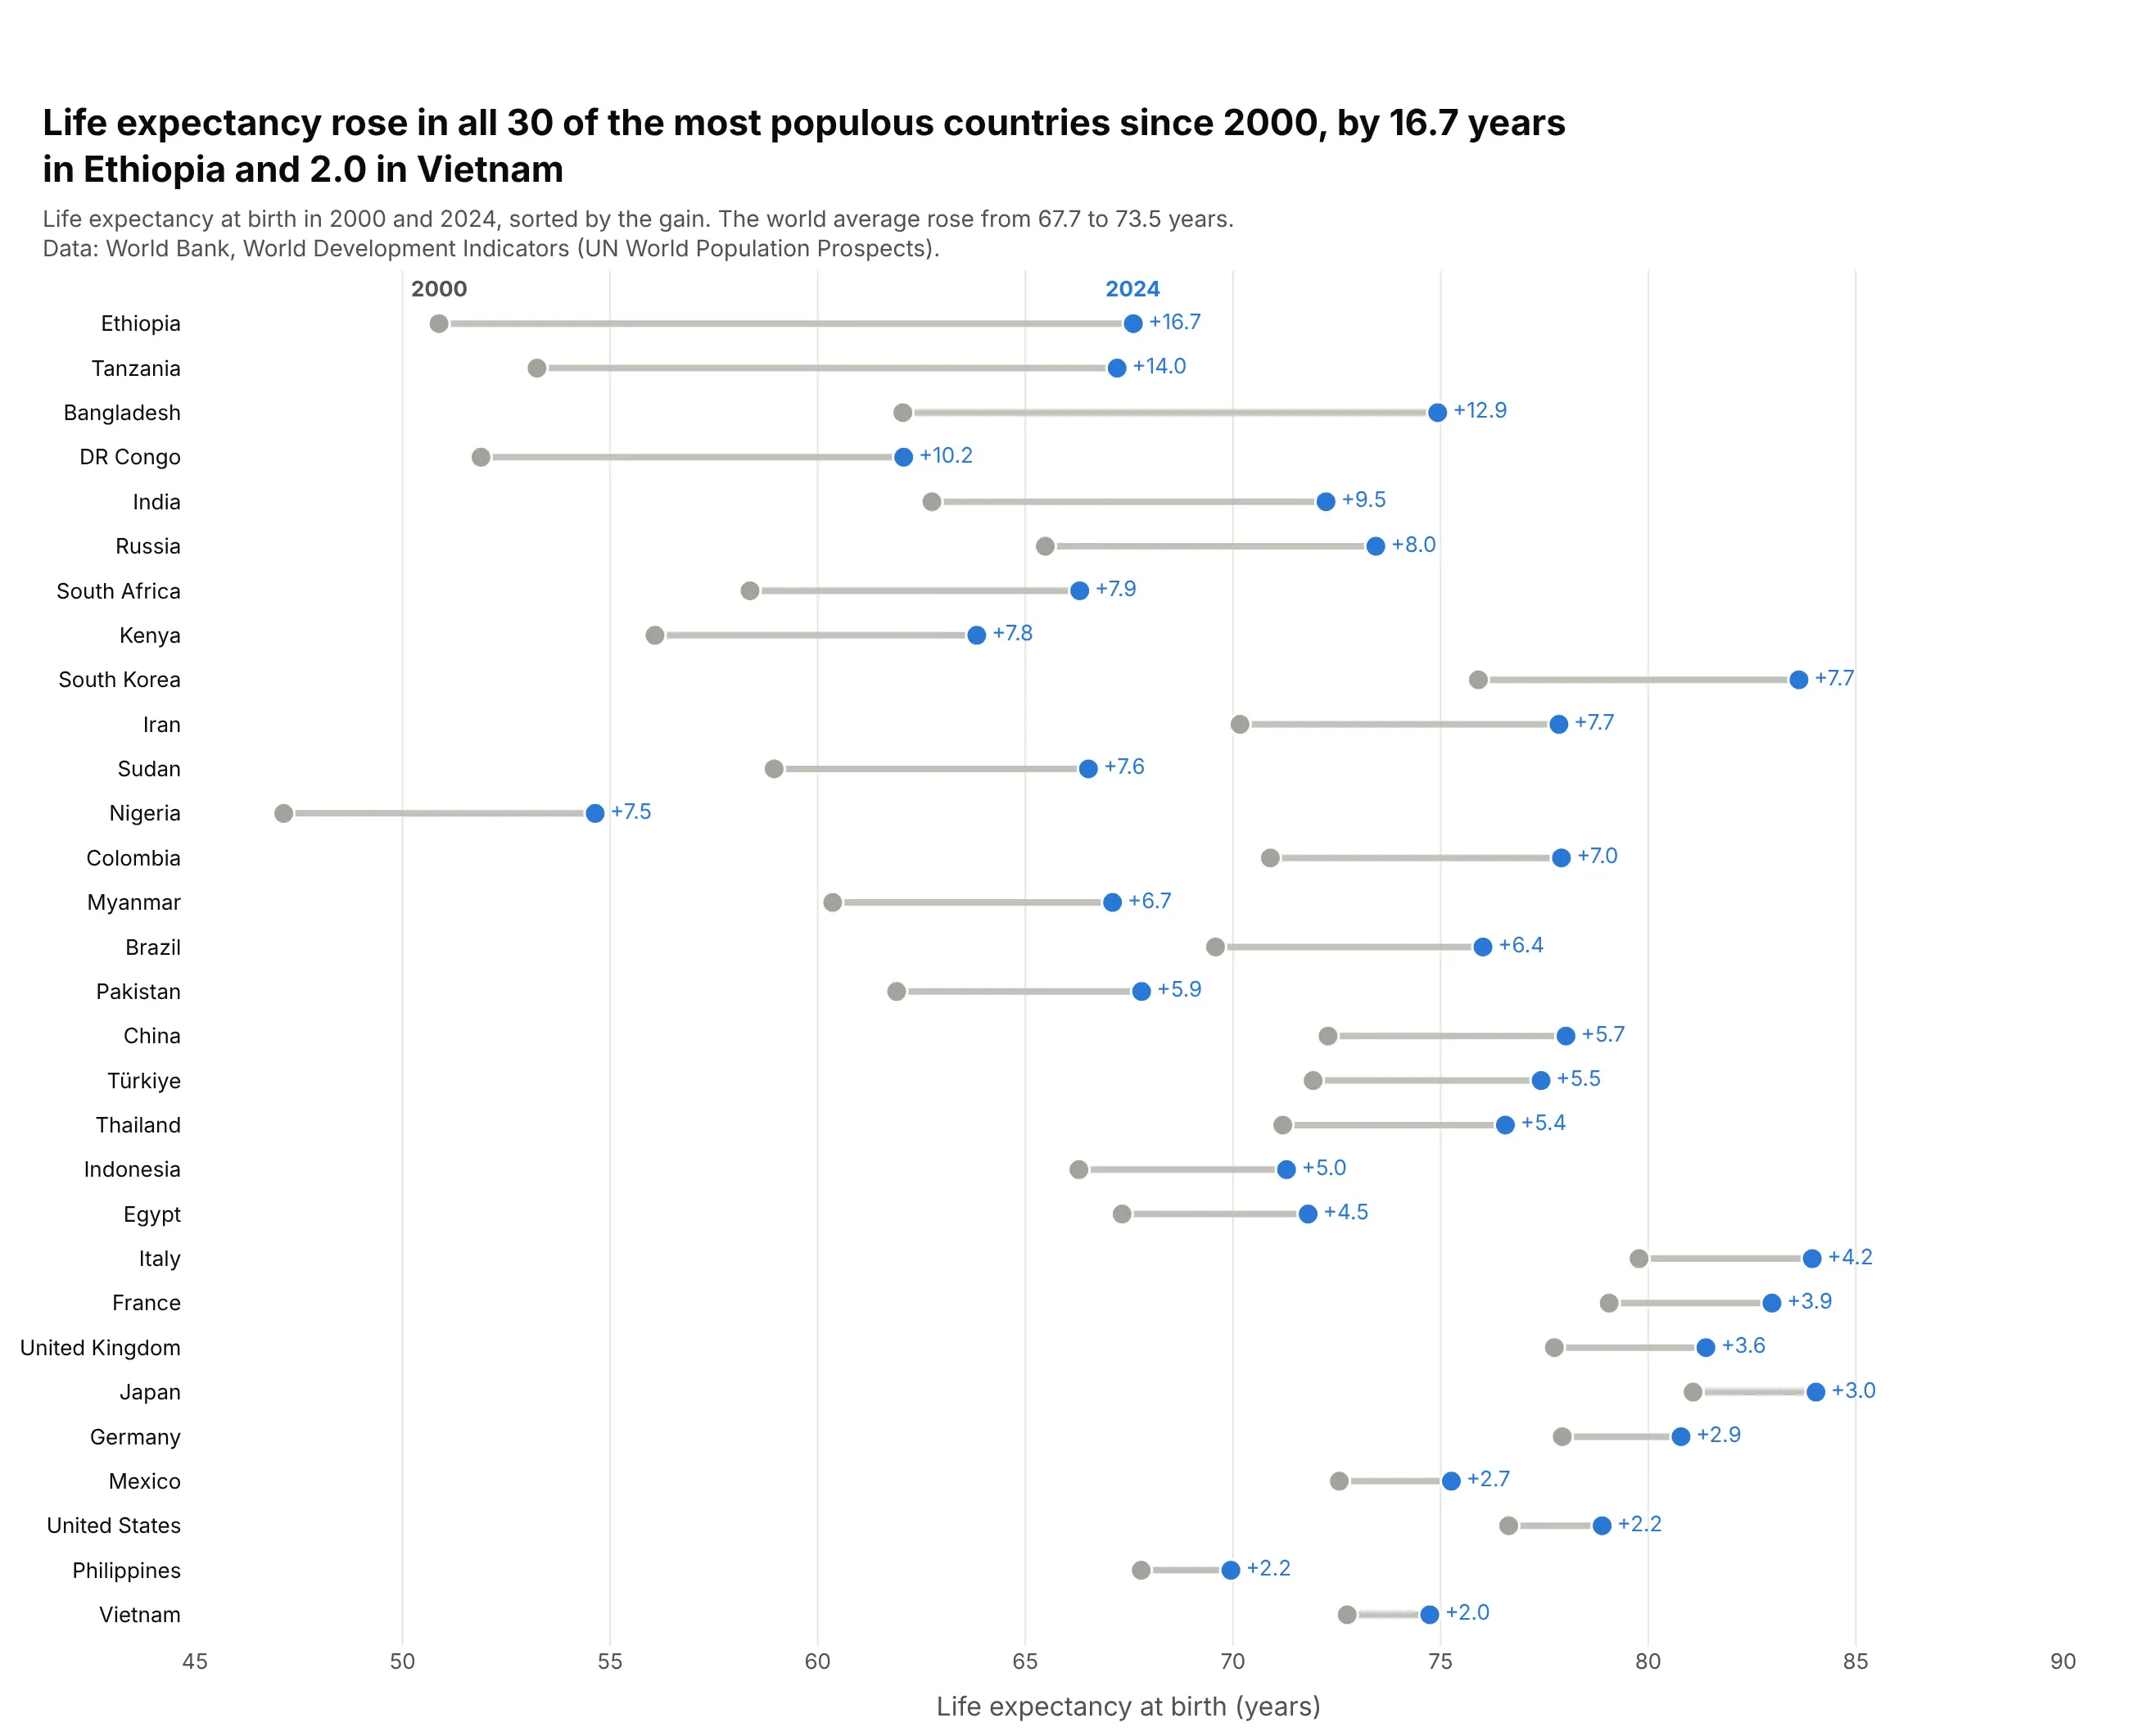
A dumbbell chart puts two dots on each row, joined by a line, so the reader sees both values and the gap between them at once. Use one when every row has two values on the same scale, such as before and after, women and men, or a low and a high. Also known as dumbbell plots, connected dot plots, barbell charts and DNA charts.
Read the complete guide to dumbbell charts
Pareto chart
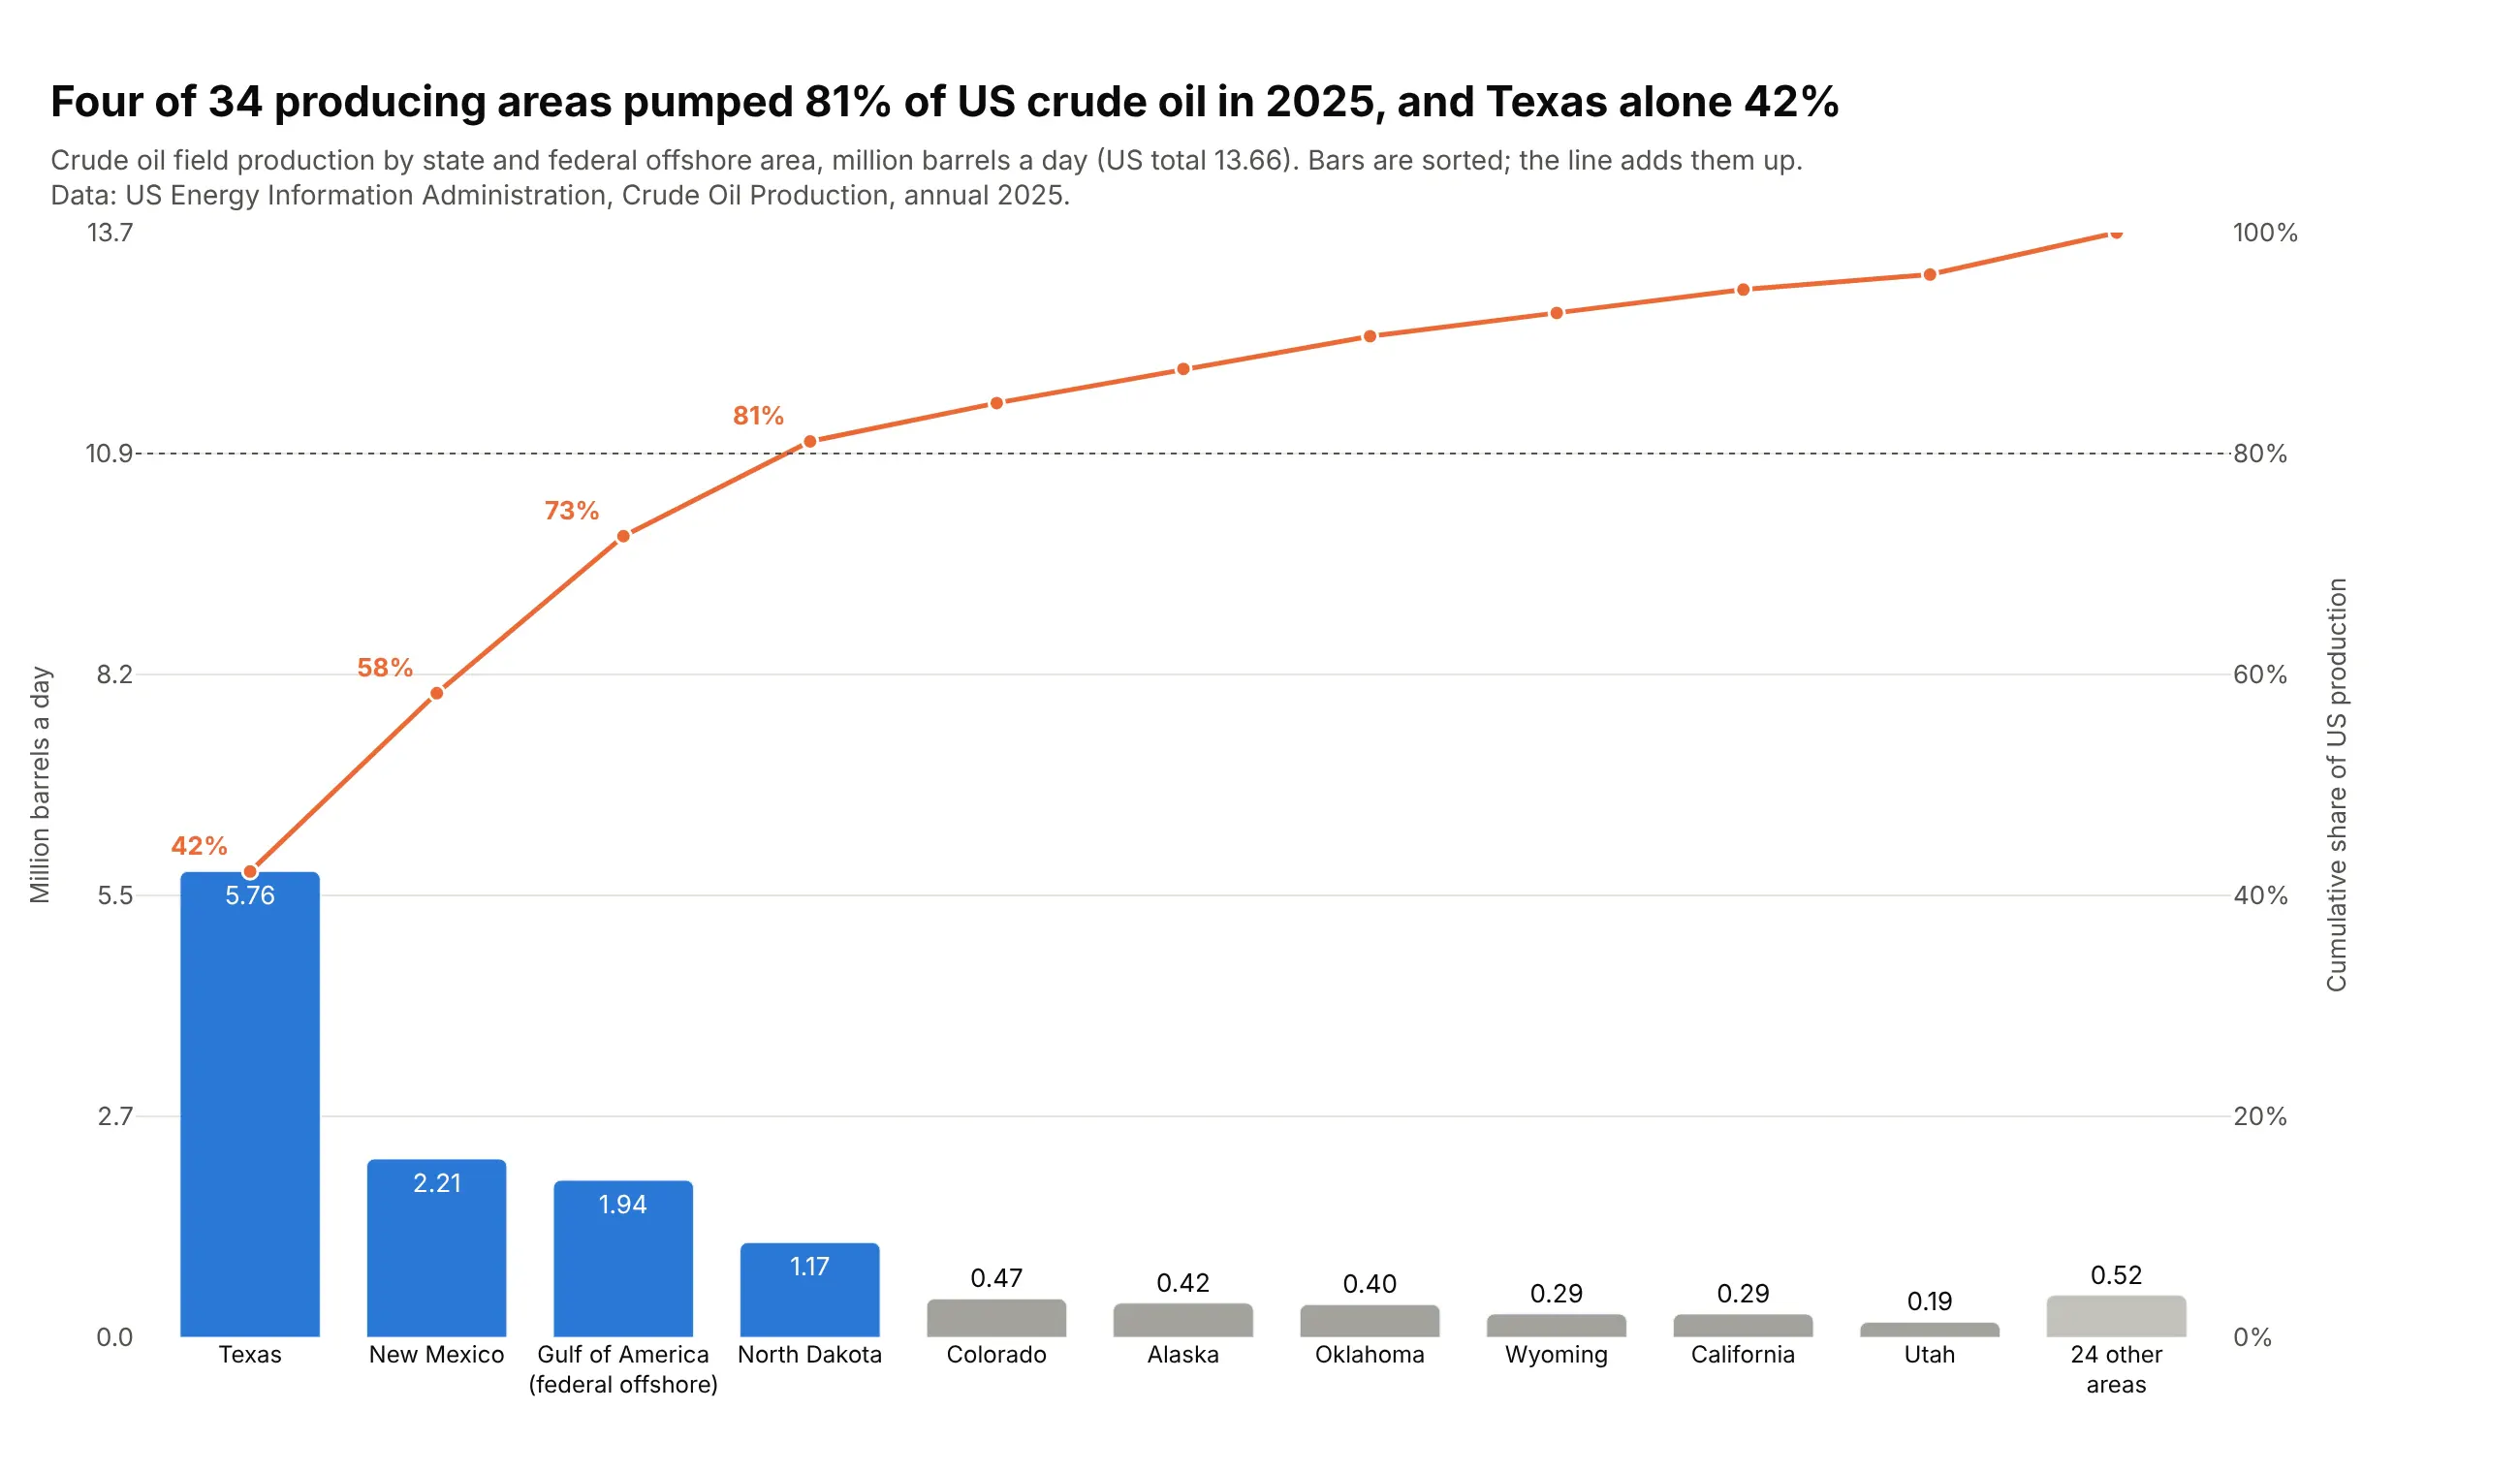
A Pareto chart sorts categories from largest to smallest as bars and adds a line for the cumulative share, so you can see how few categories make most of the total. It's the standard quality-control chart for causes of defects, and it works for any total that splits into many parts, such as complaints, costs, emissions or sales. Also known as Pareto diagrams.
Read the complete guide to Pareto charts
Radar chart
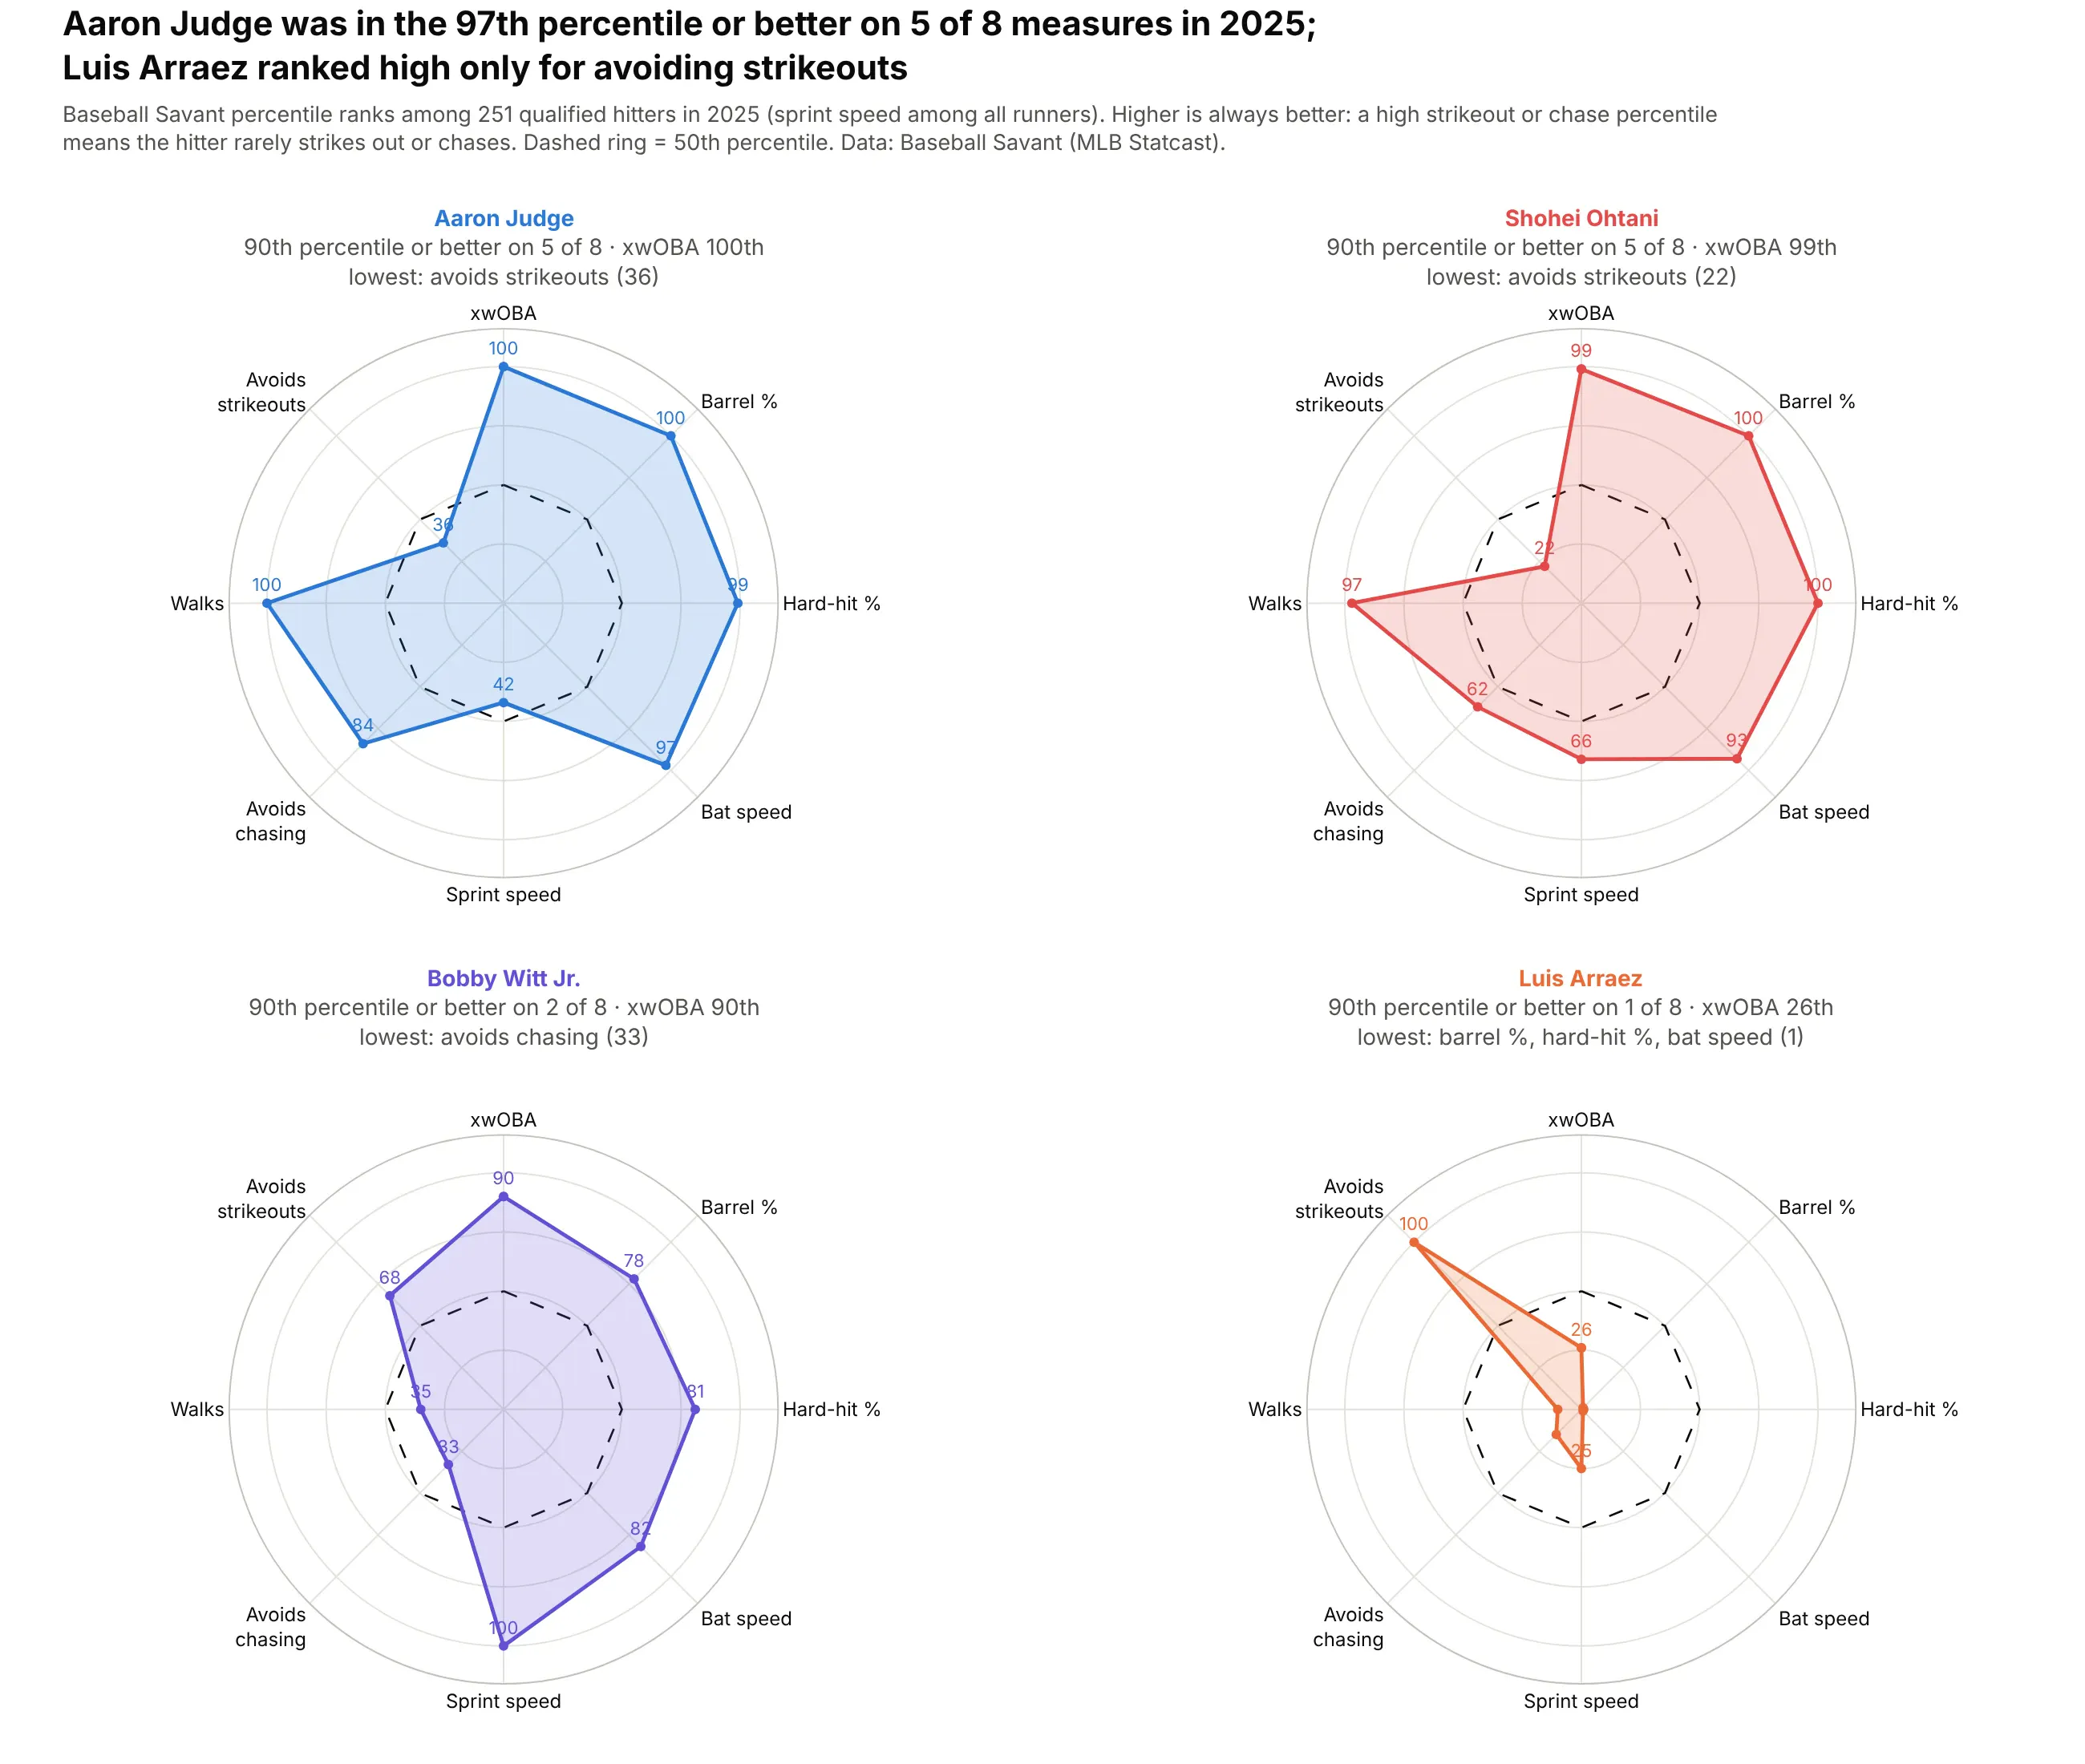
A radar chart, or spider chart, draws several measures as spokes from a center and joins one item's values into a polygon, so each item becomes a shape you can recognize. Use one for a few profiles on axes that share a scale, such as percentiles, and a dot plot or bars when exact values matter. Also known as spider charts, web charts, star plots and Kiviat diagrams.
Read the complete guide to radar charts
Likert scale chart
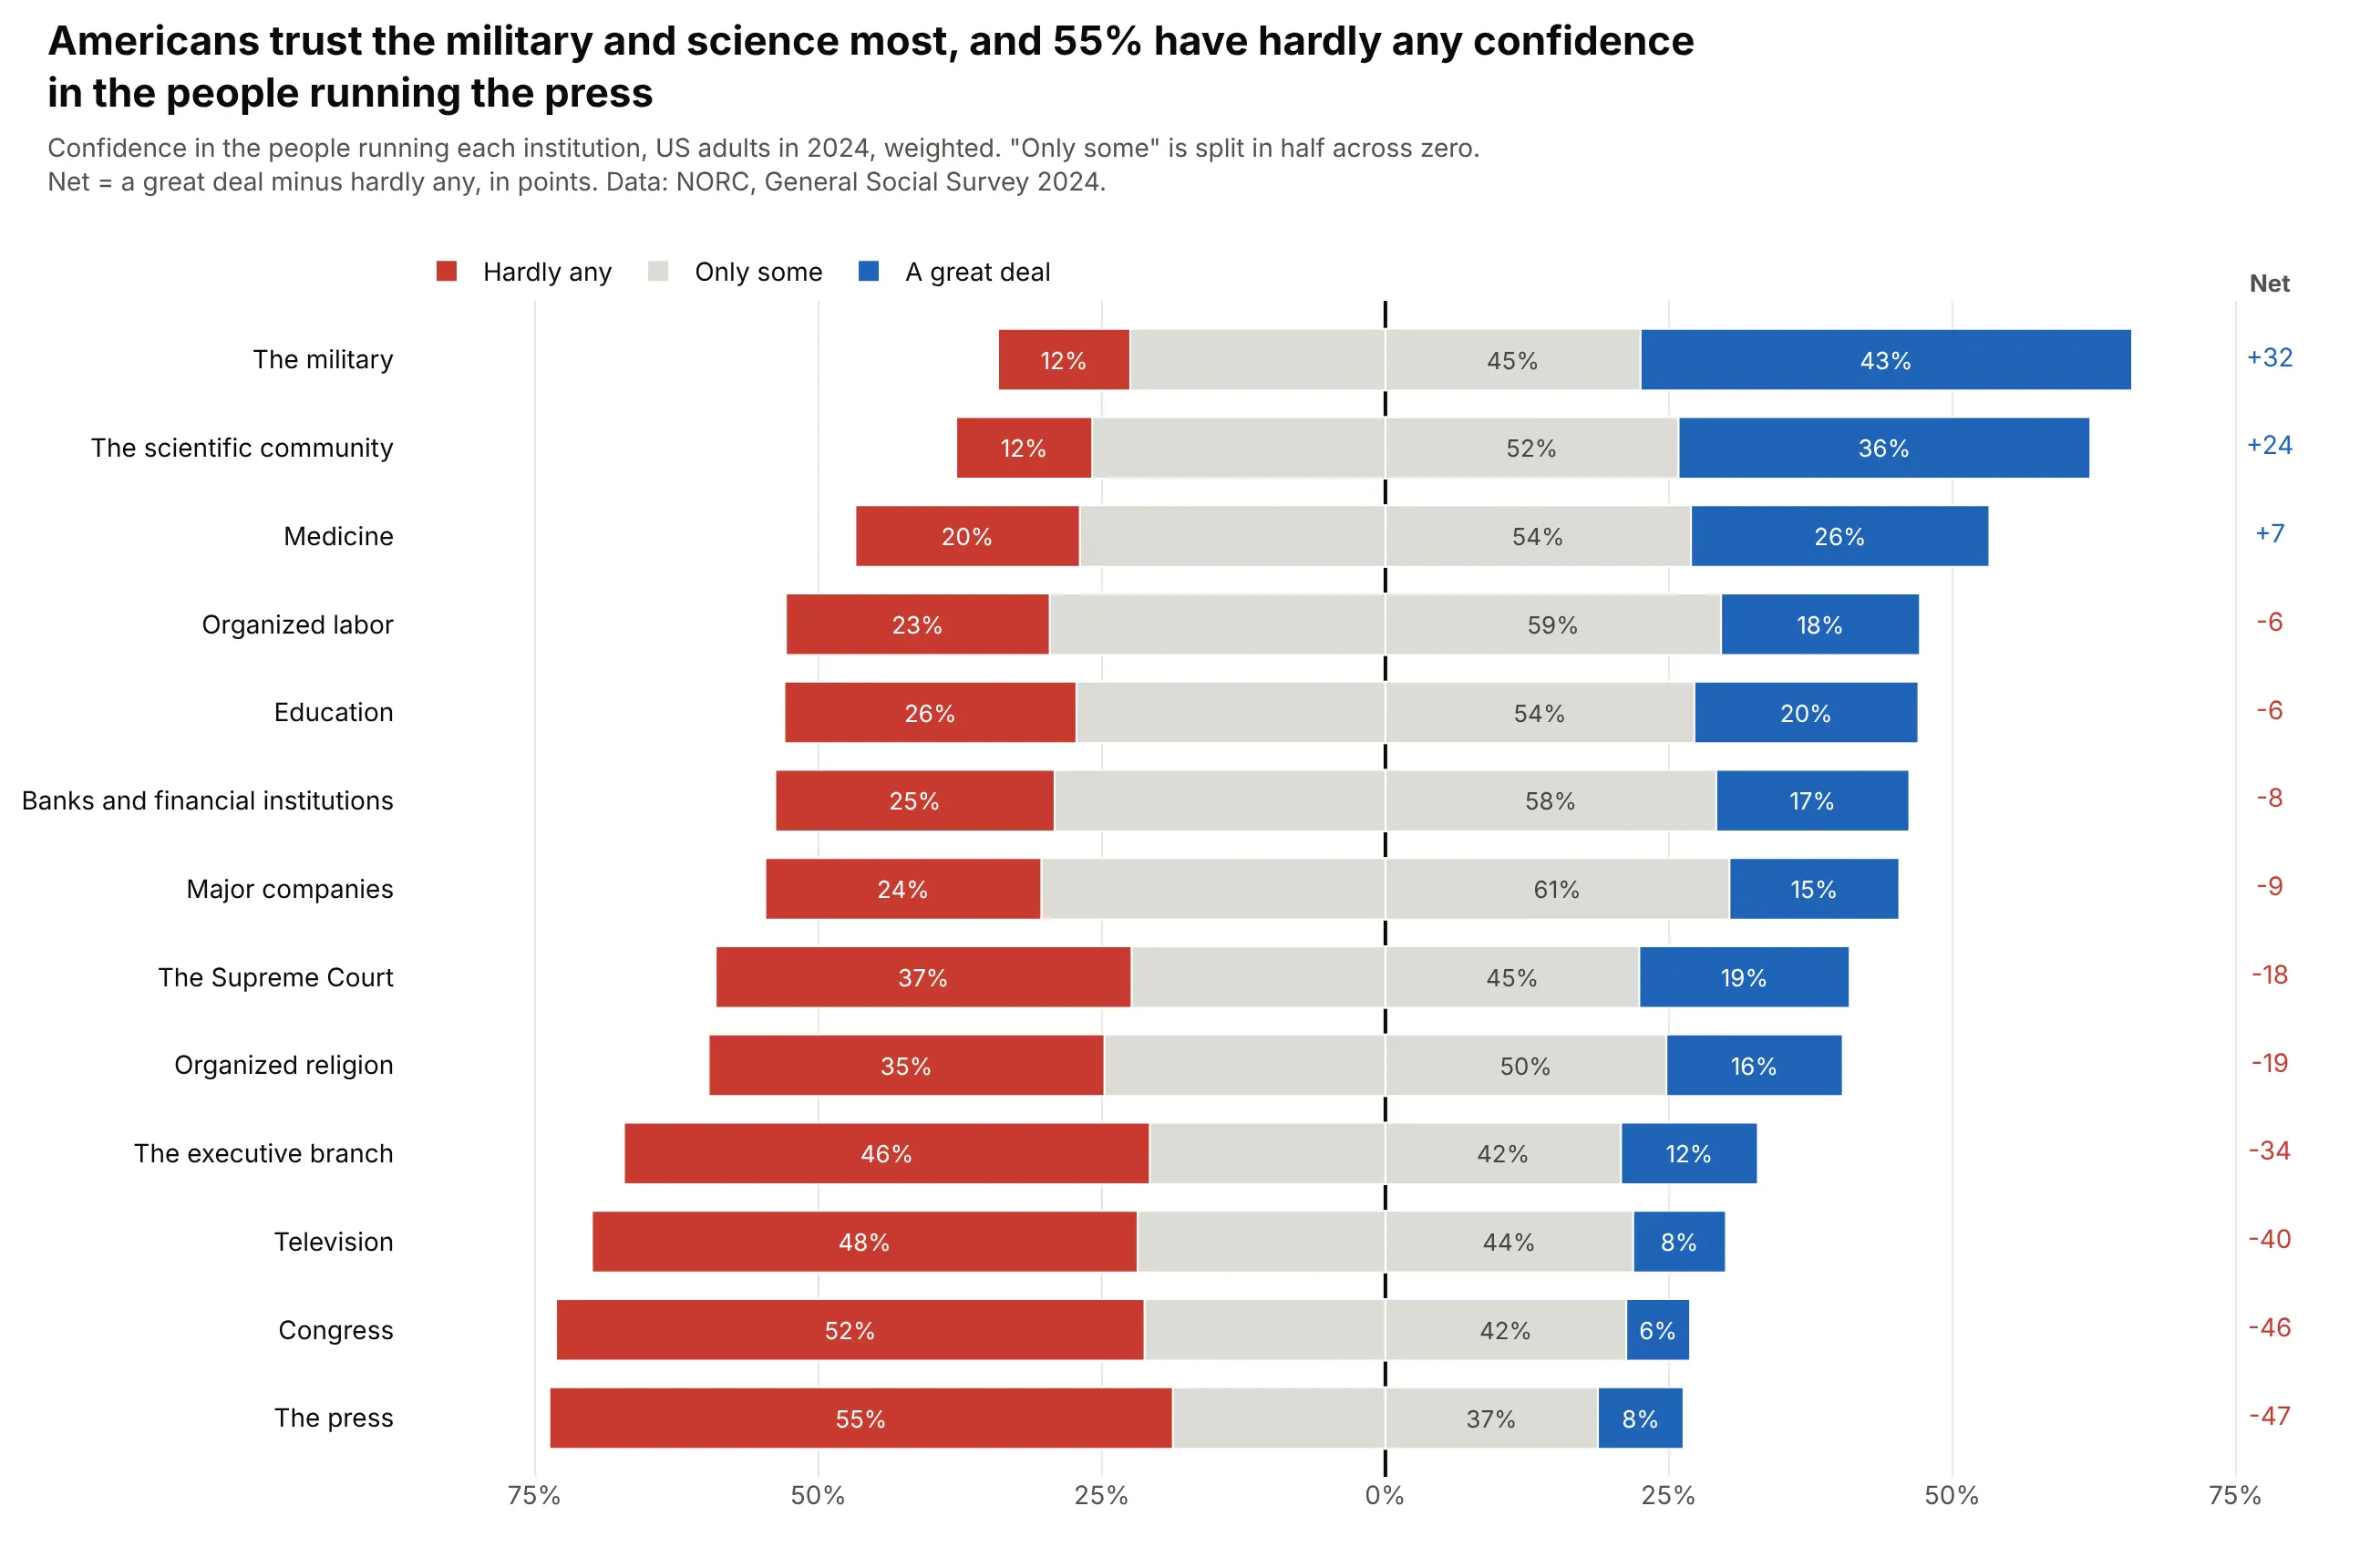
A Likert chart is a diverging stacked bar chart: for each survey question, the negative answers stack to the left of zero and the positive answers to the right. Use one for any survey answered on an ordered scale (agree to disagree, always to never, 0 to 10) when you want to compare items or groups.
Read the complete guide to Likert scale charts
Charts for distributions
These charts show how a set of numbers is spread out: where values pile up, how wide the range is and what the tails look like.
Histogram
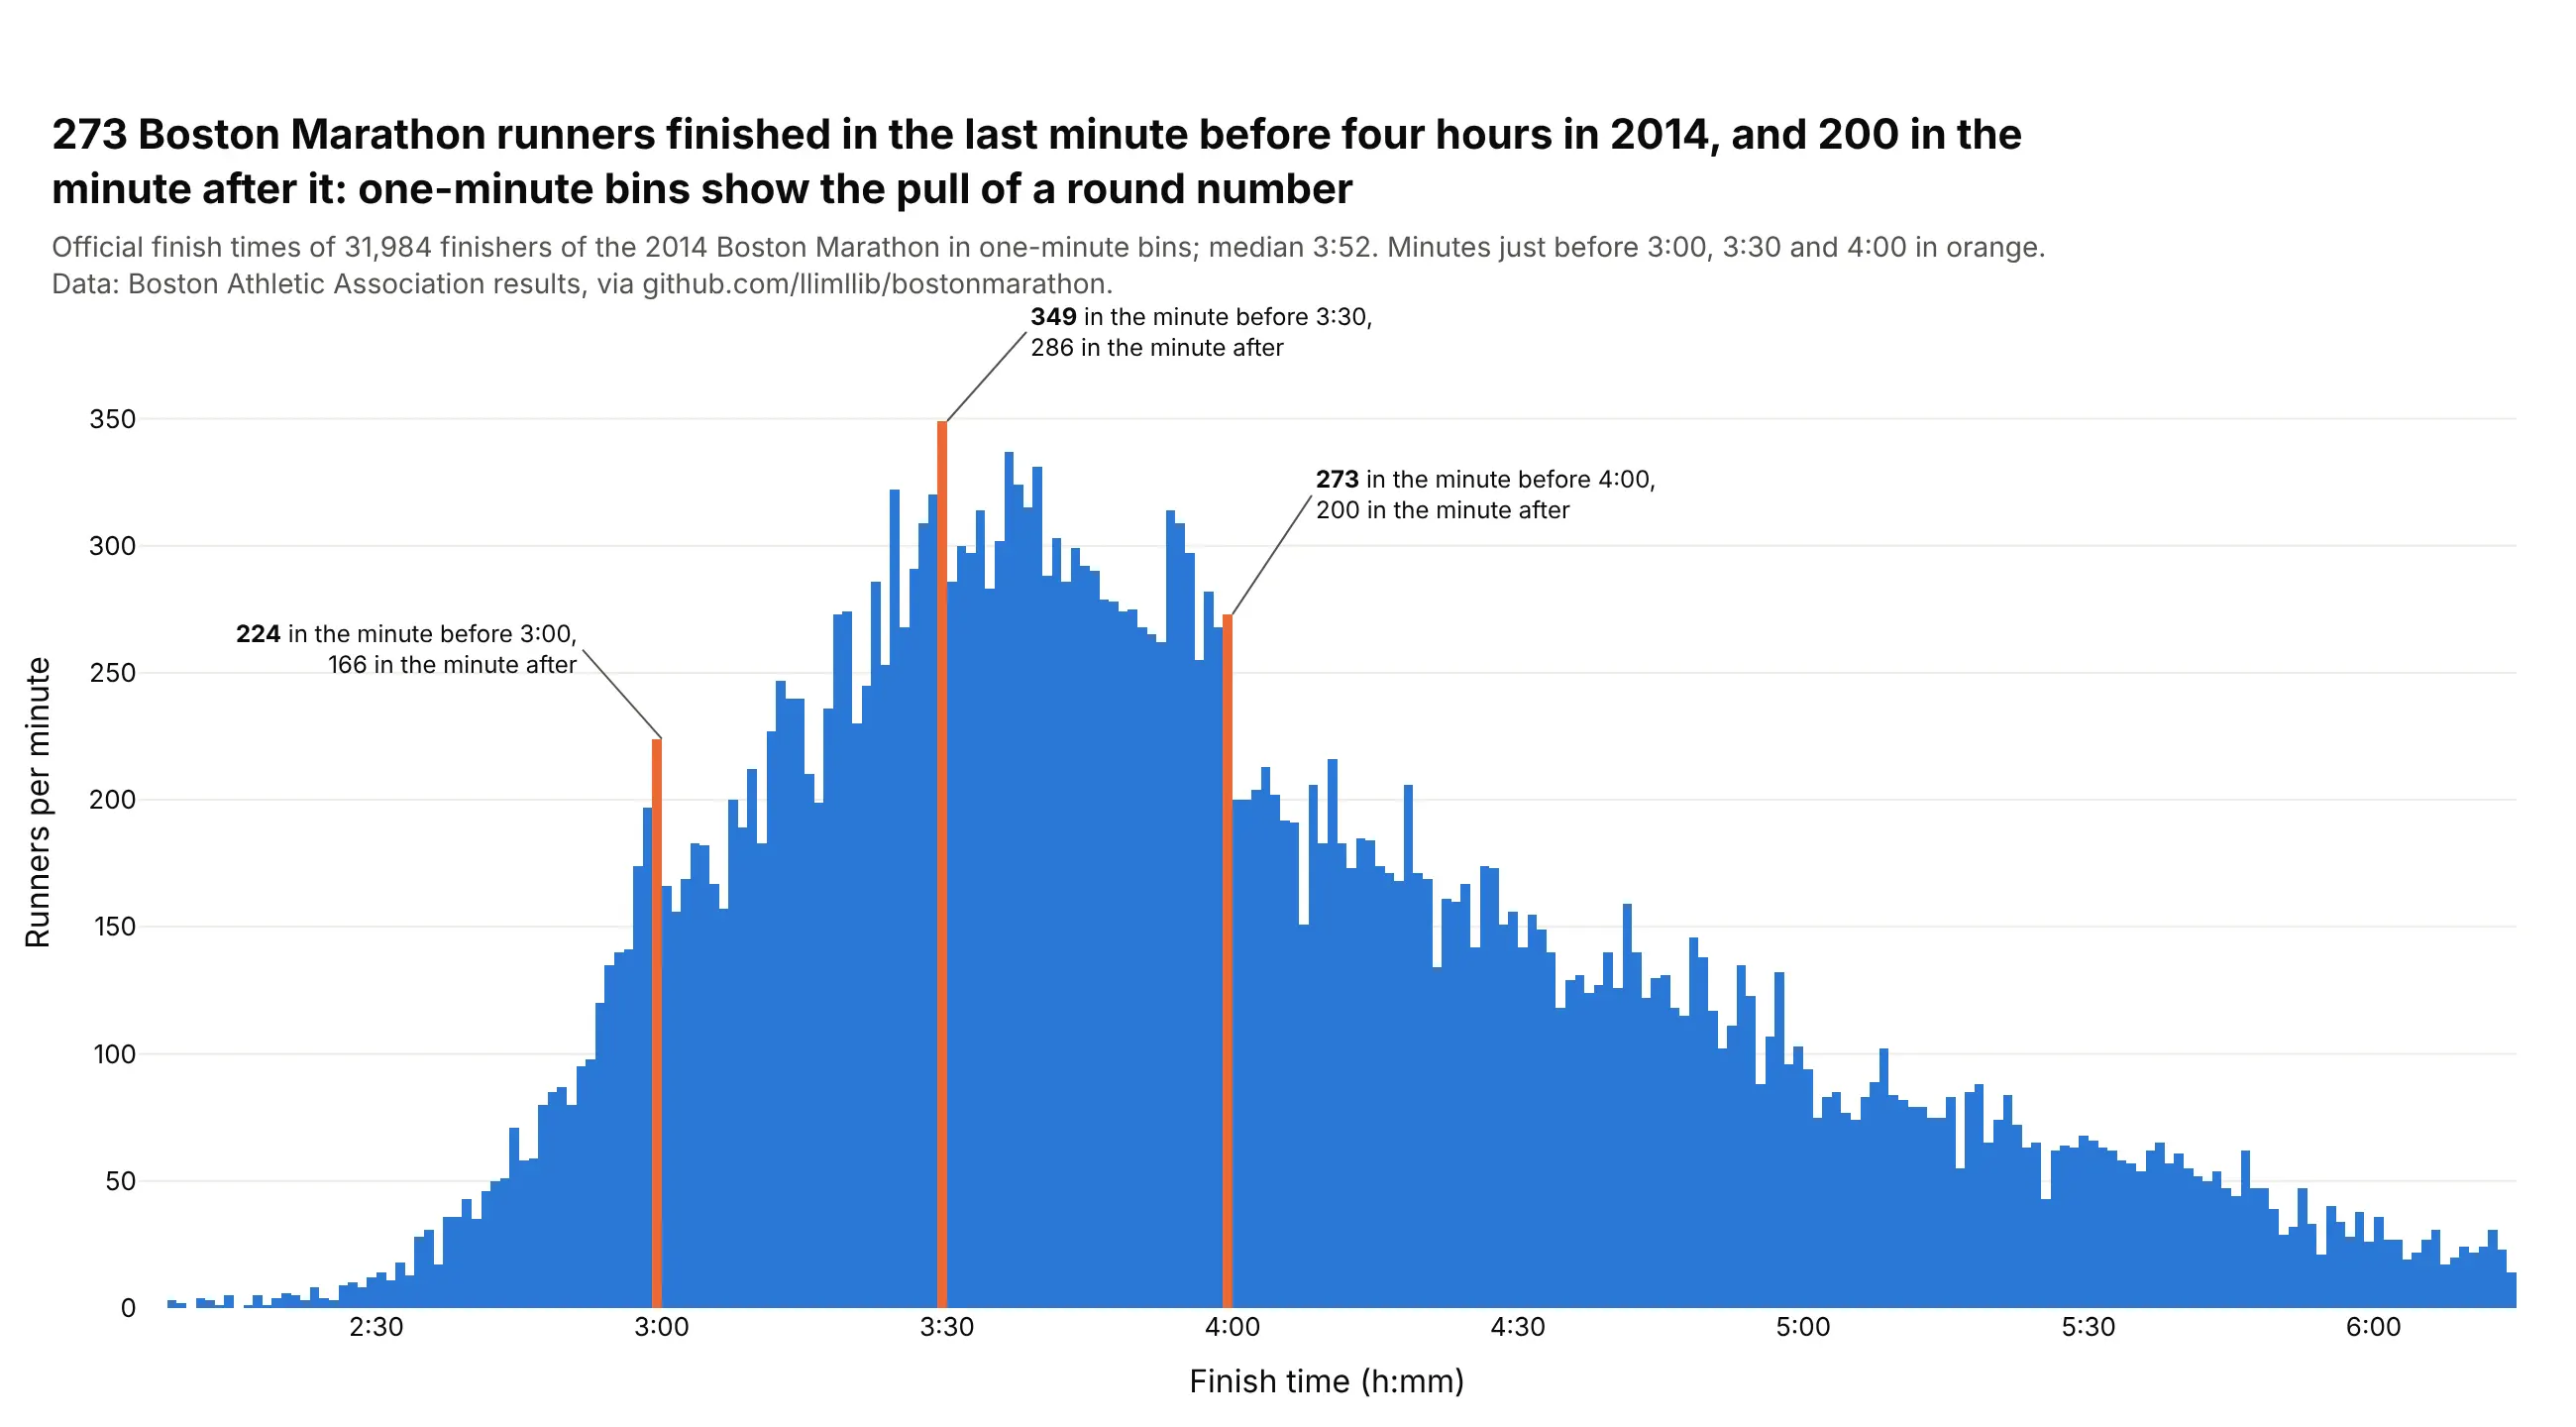
A histogram splits a range of numbers into bins and draws one bar per bin, as tall as the number of values in it, so it shows where values pile up, how far they spread and what the tails look like. The bin width changes what you see, so try a few widths, and use a bar chart (not a histogram) for categories.
Read the complete guide to histograms
Strip chart
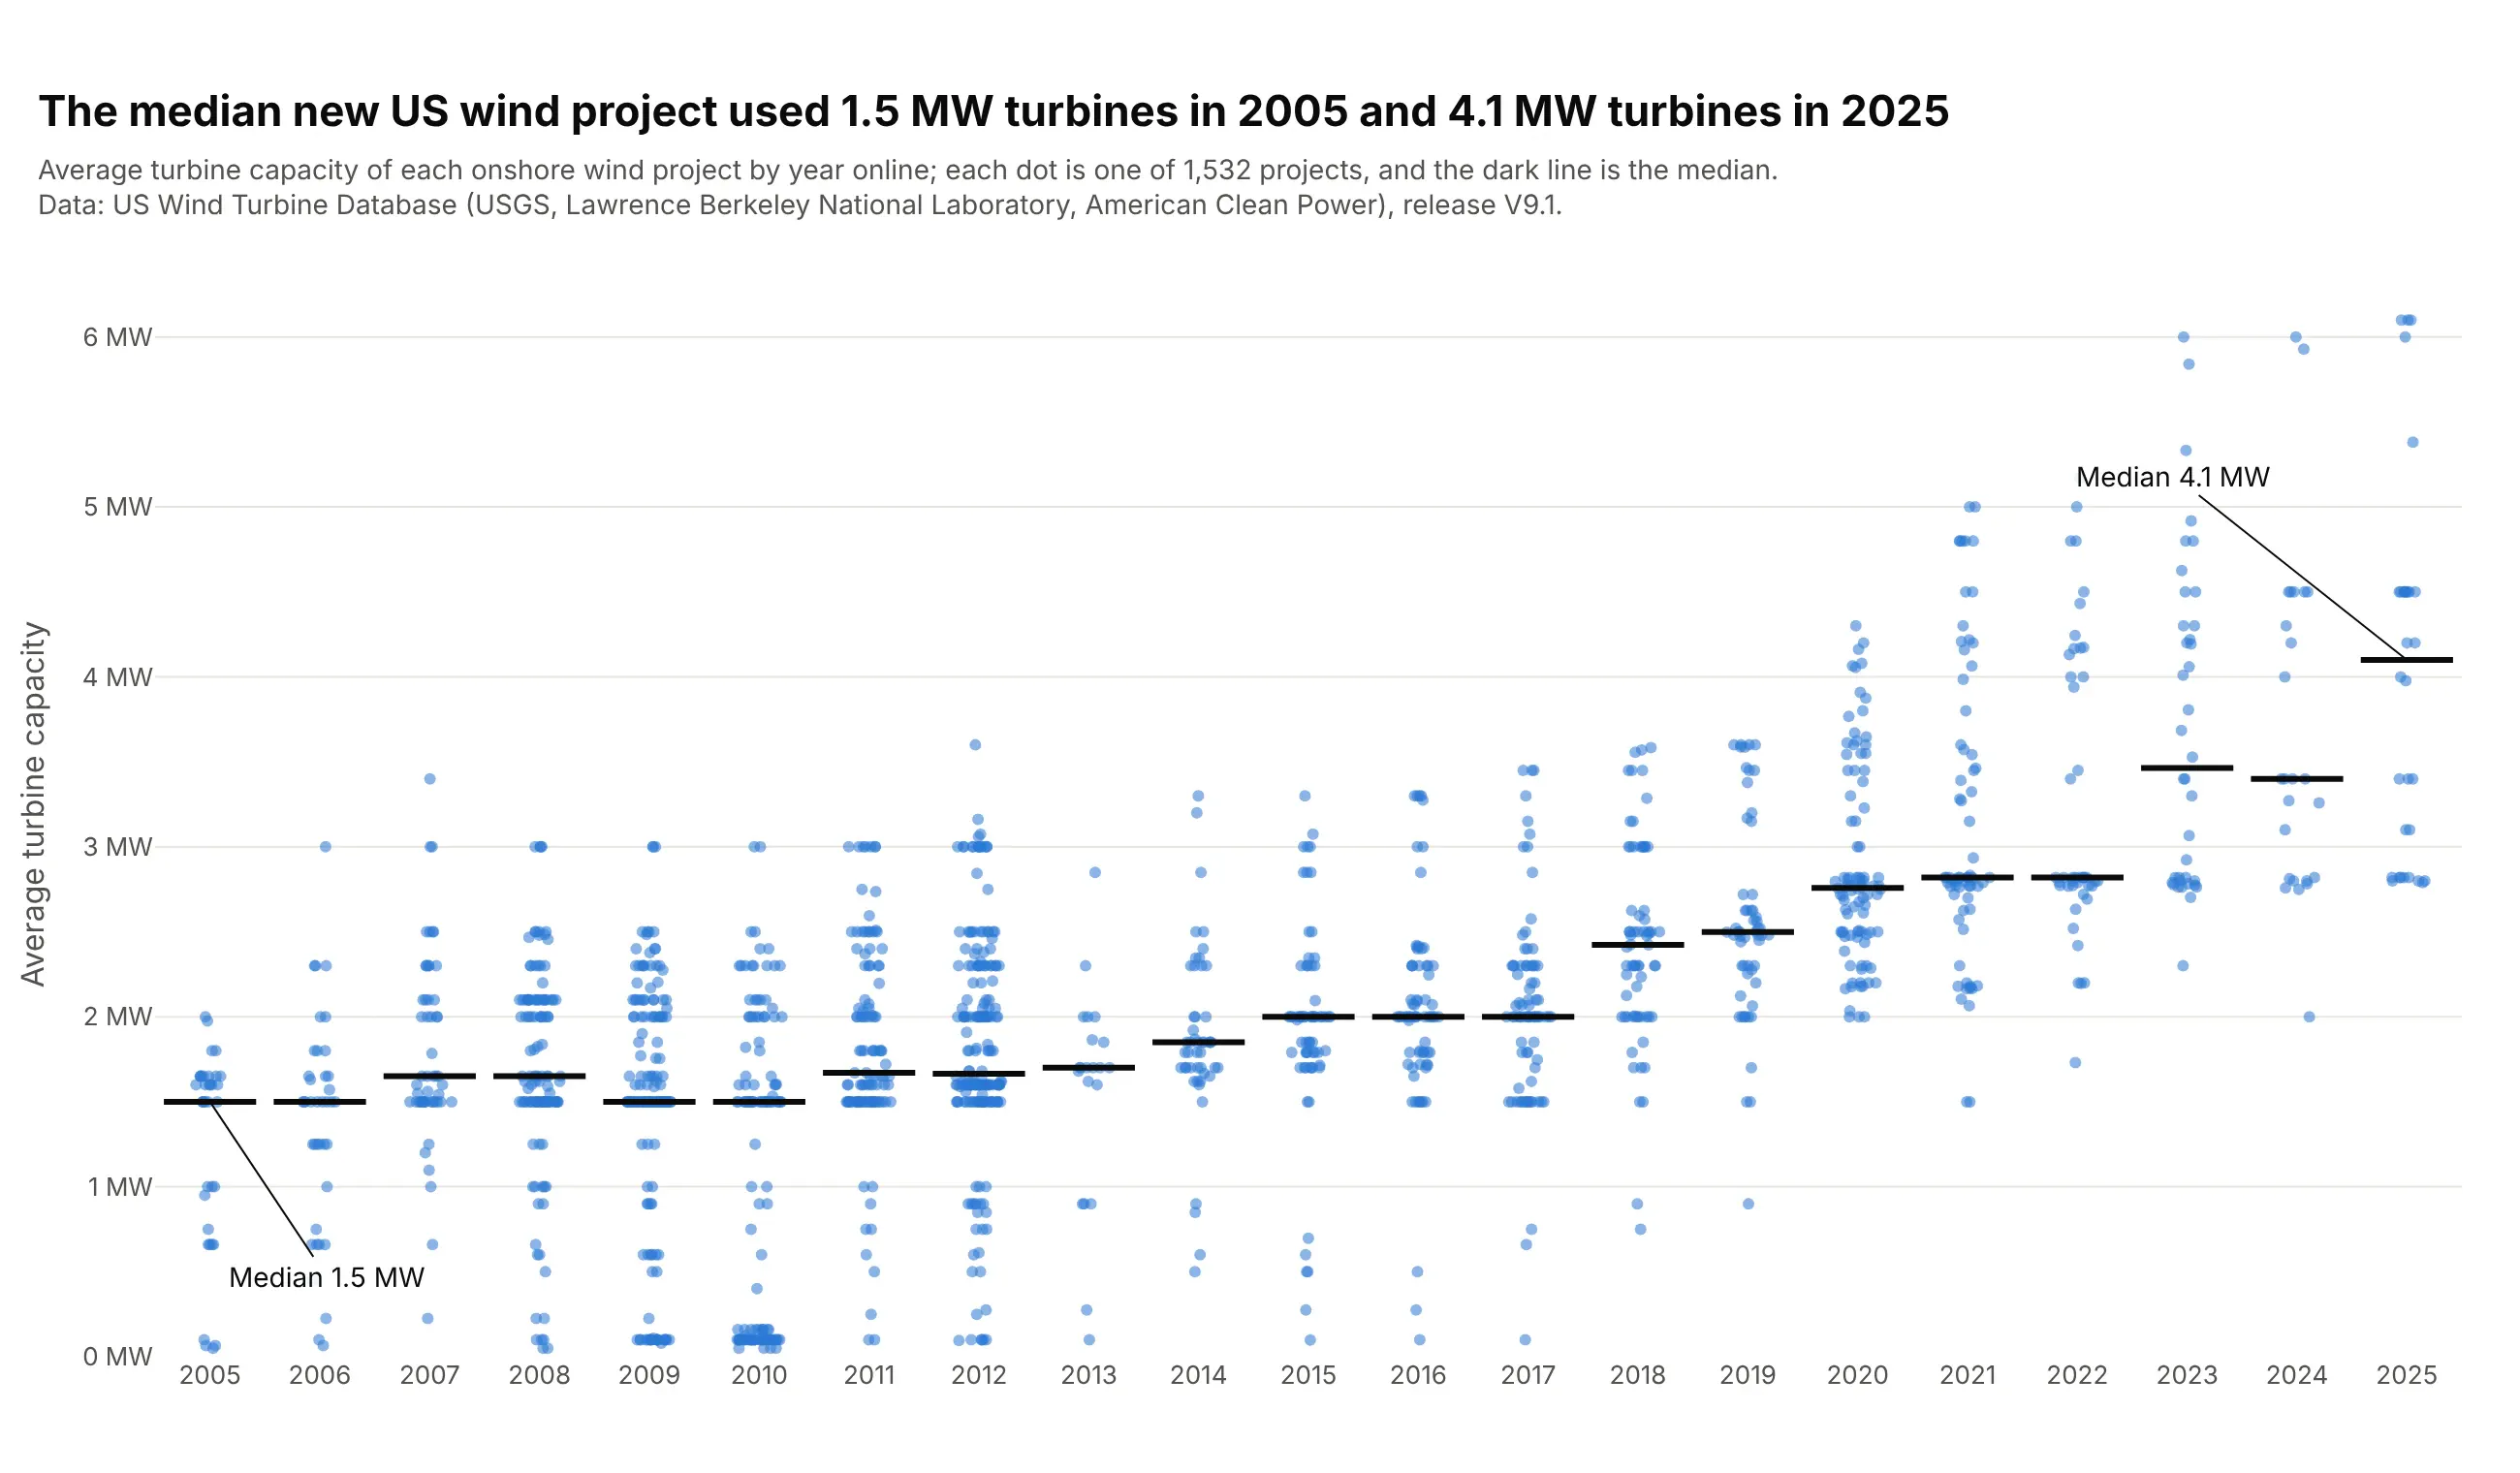
A strip chart draws every value as a dot along one axis, usually one strip per group, and spreads tied values sideways with a little jitter so none hide behind another. Use one for tens to a few thousand values per group, when you want readers to see every observation, the group sizes and the ties. Also known as strip plots, one-dimensional scatter plots, dot plots and jitter plots.
Read the complete guide to strip charts
Box plot
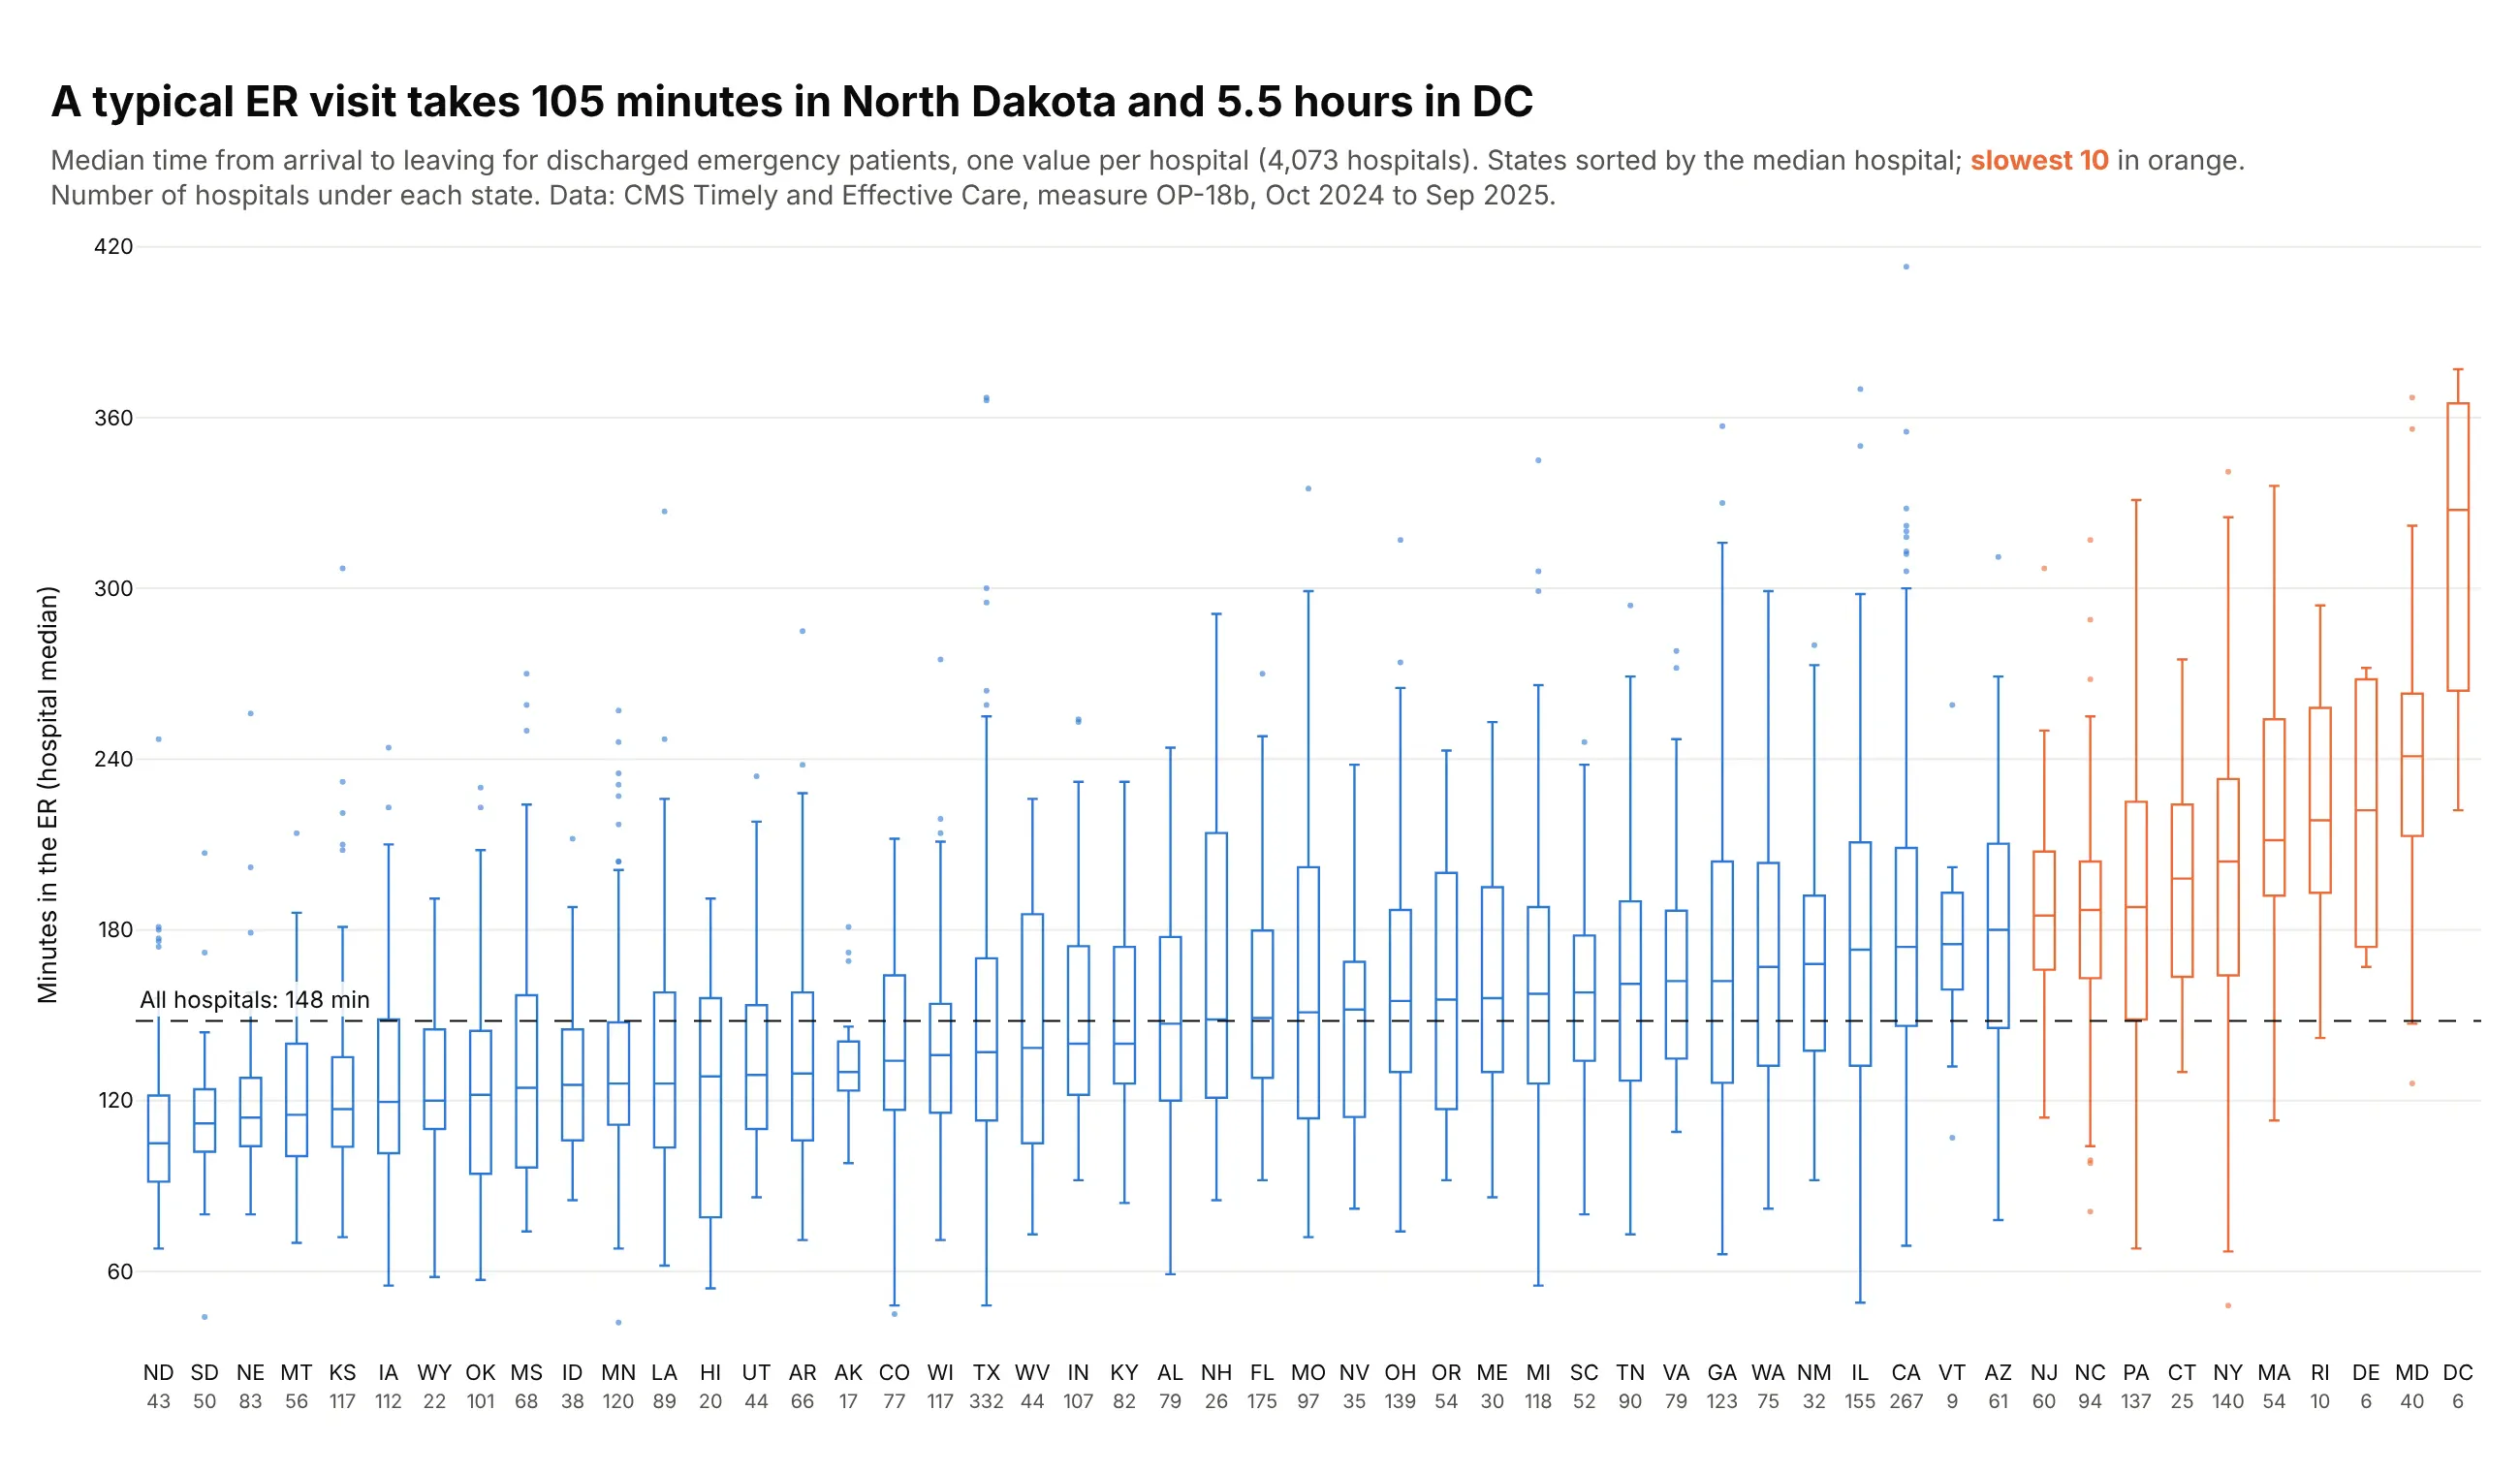
A box plot summarizes a group of numbers with a box from the first to the third quartile, a line at the median, whiskers and outliers. Use one to compare a number across many groups at once, such as 50 states or 49 industries, where a histogram per group would no longer be readable. Also known as box-and-whisker plots, box-and-whisker diagrams and boxplots.
Read the complete guide to box plots
Violin plot
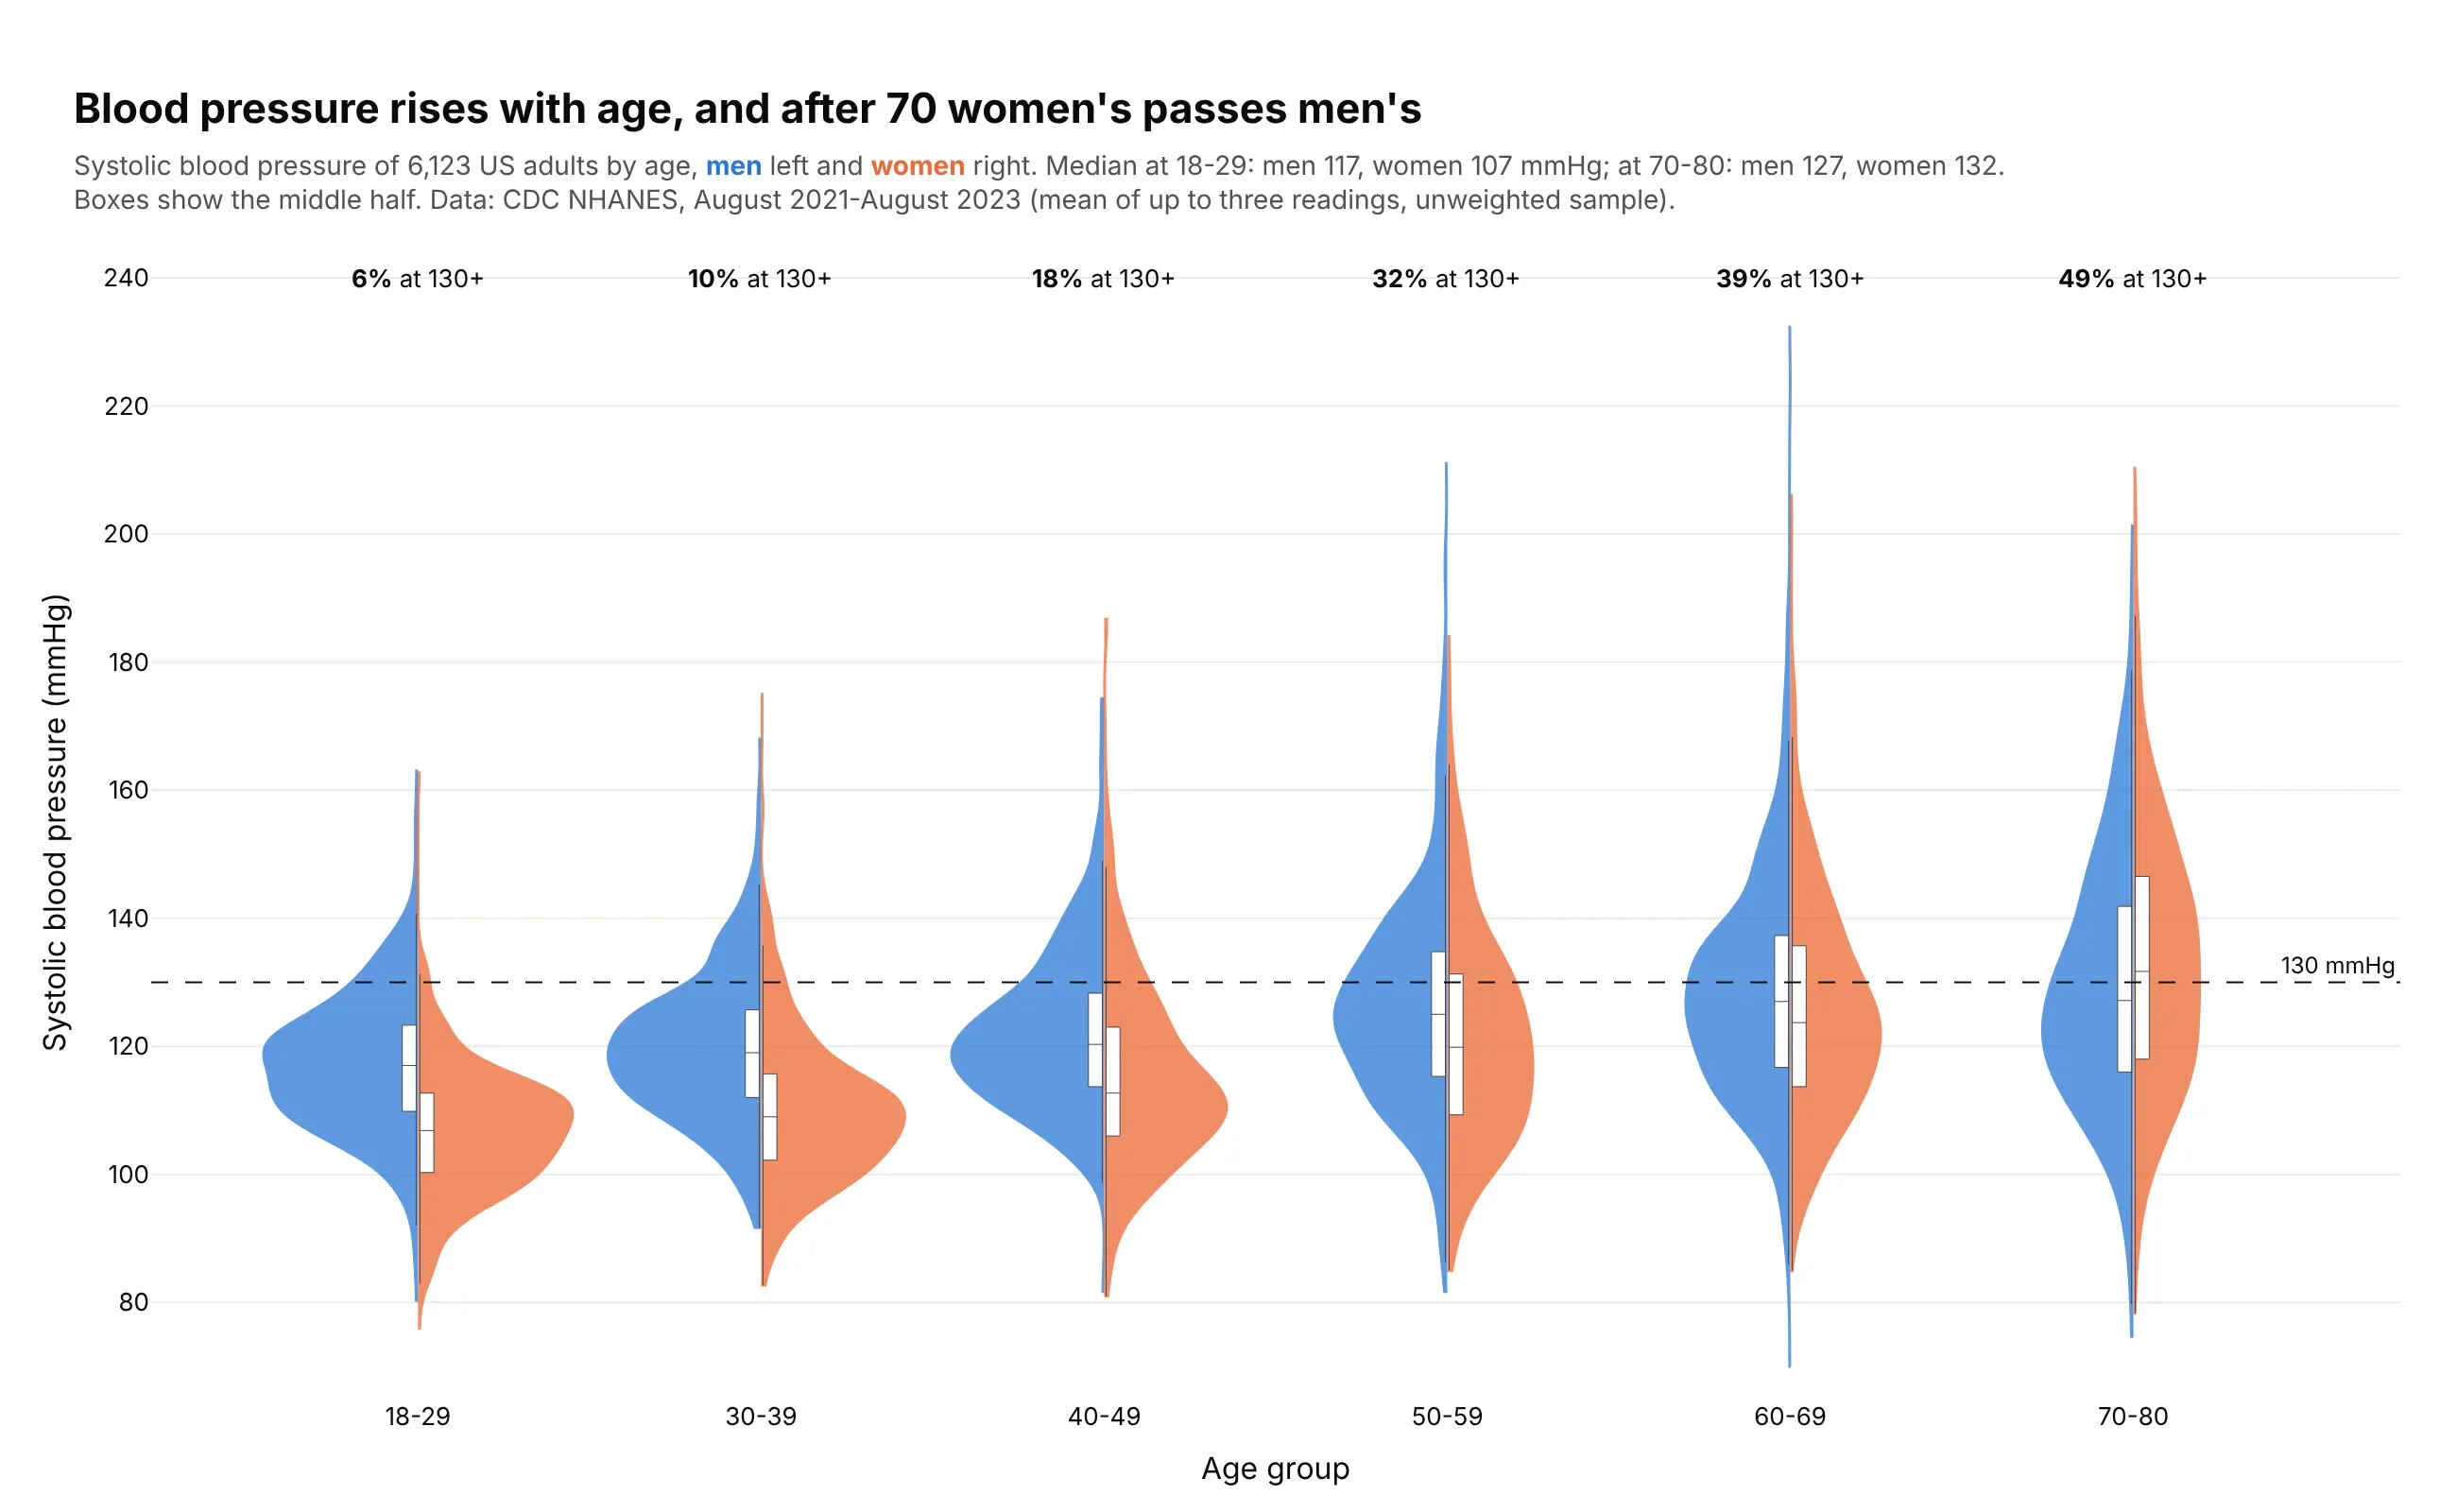
A violin plot draws each group's distribution as a smoothed histogram mirrored around a center line, wide where values are common and thin where they are rare. Use one when groups have hundreds or thousands of values and the shape matters, such as two peaks, a long tail or a hard floor that a box plot would hide.
Read the complete guide to violin plots
Beeswarm plot
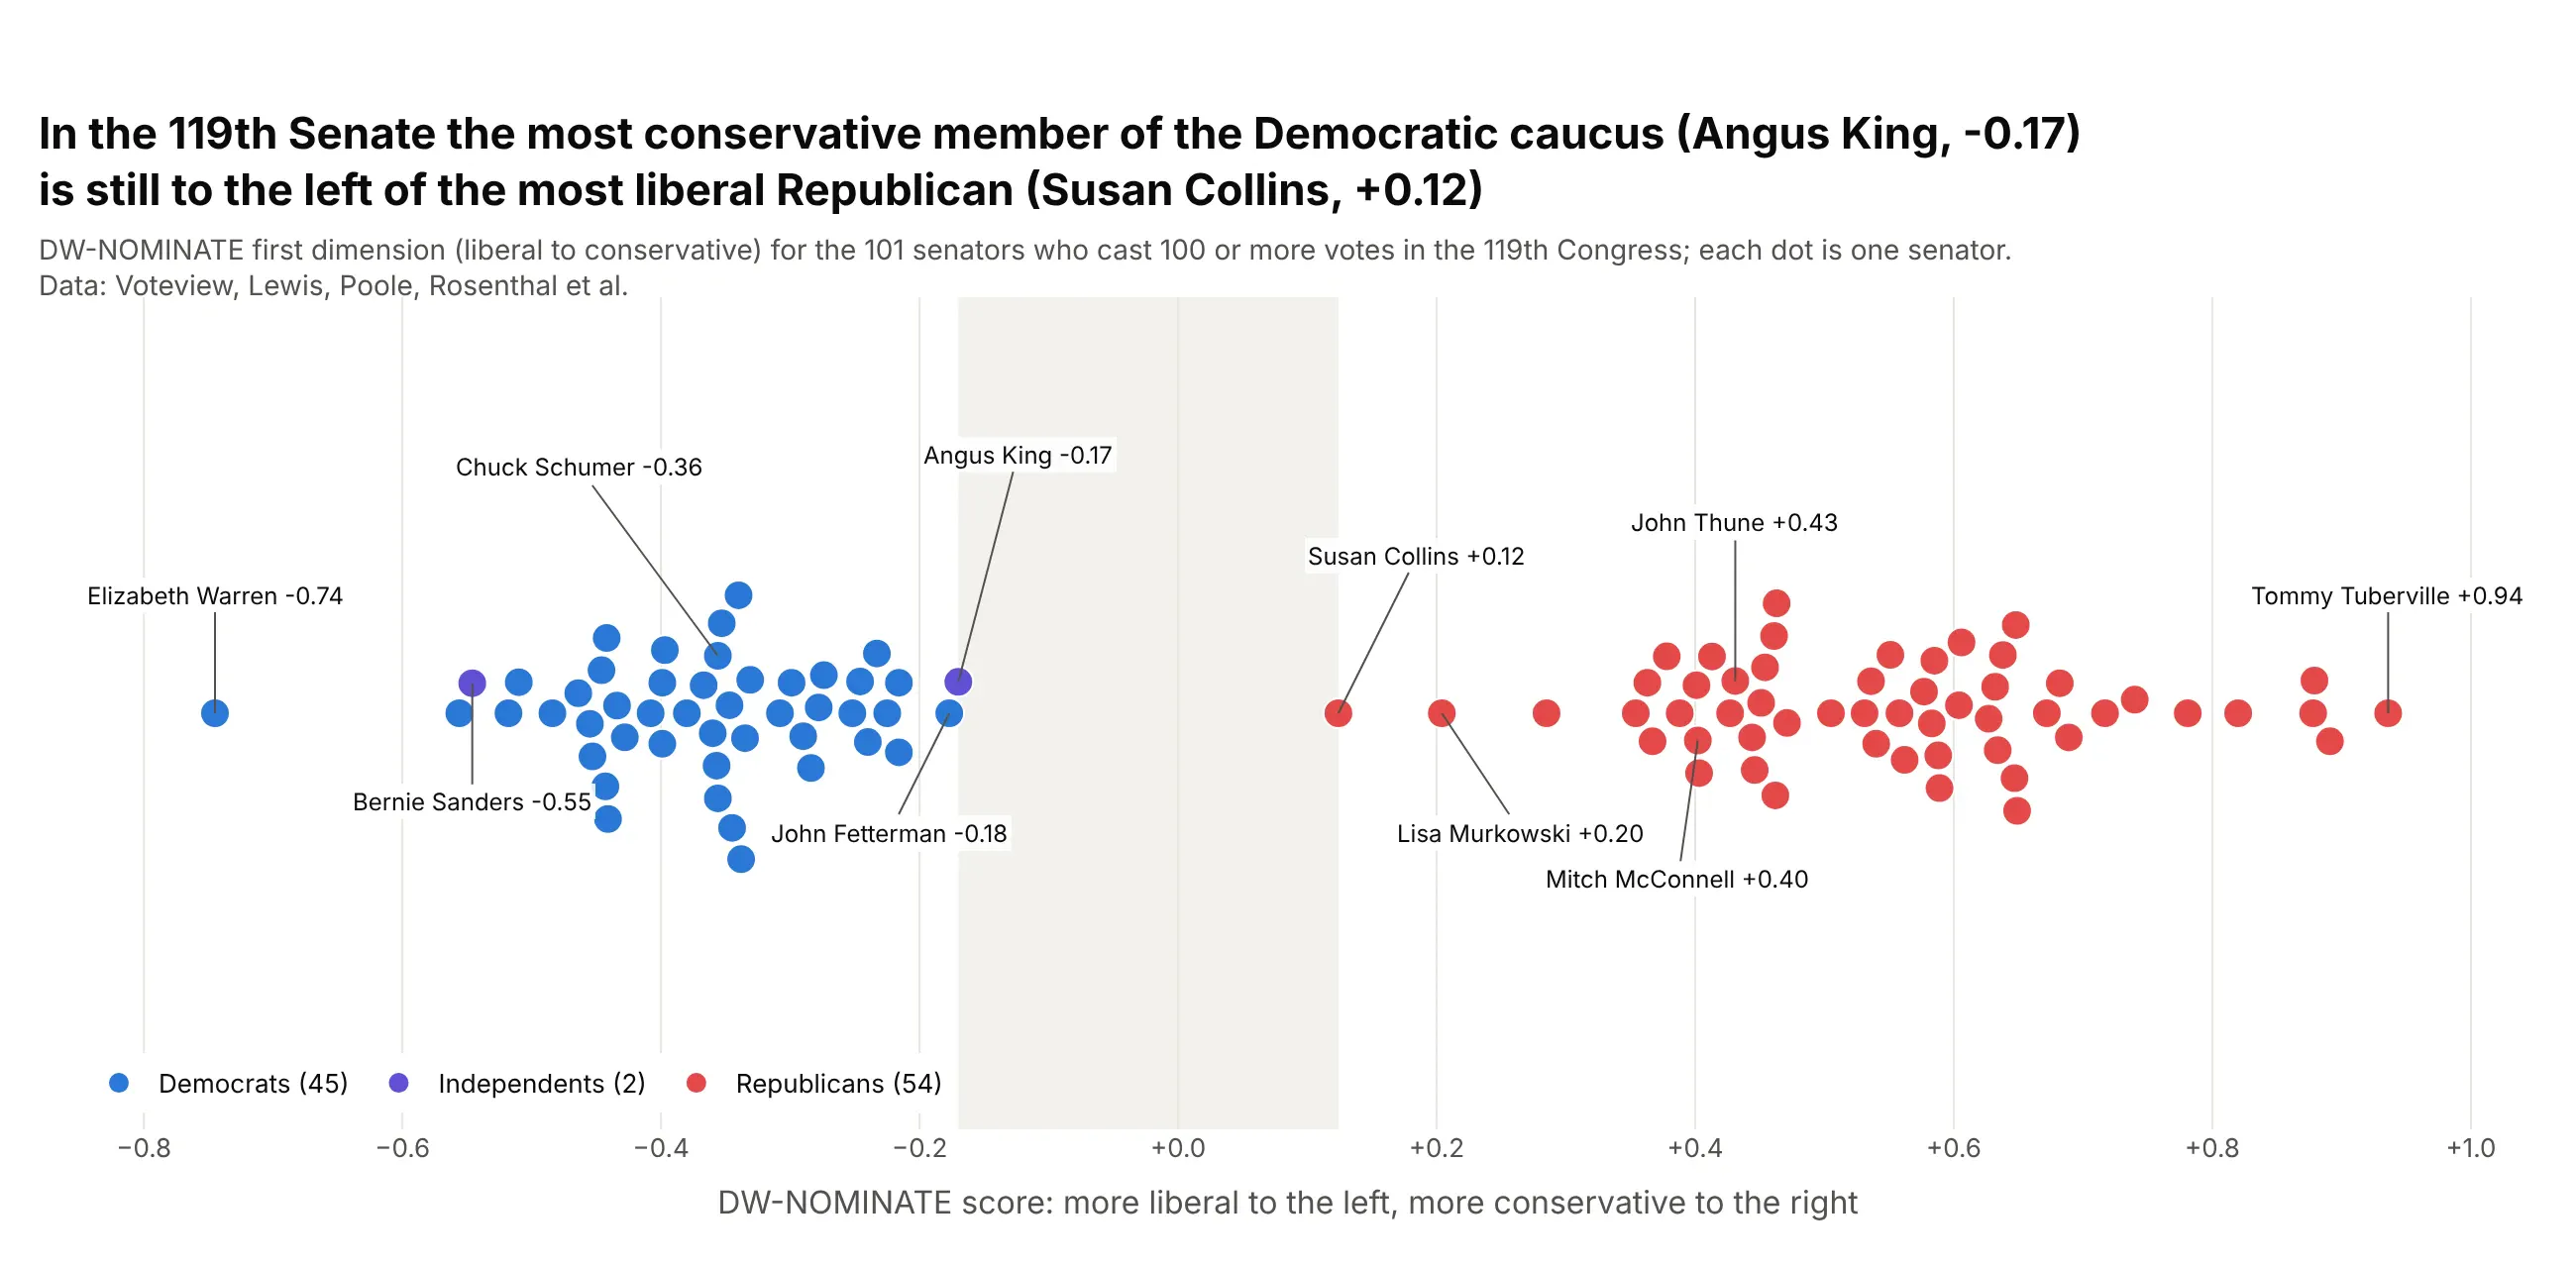
A beeswarm plot puts every item at its value on one axis and moves the dots sideways just enough that none overlap, so the swarm takes the shape of the distribution and every dot is still one named thing. Use one for tens to a few thousand named items, such as companies, countries, drugs, hospitals or senators. A strip chart (px.strip) is the one-line version, but its random jitter lets dots overlap. Also known as swarm plots and bee swarm plots.
Read the complete guide to beeswarm plots
Ridgeline plot
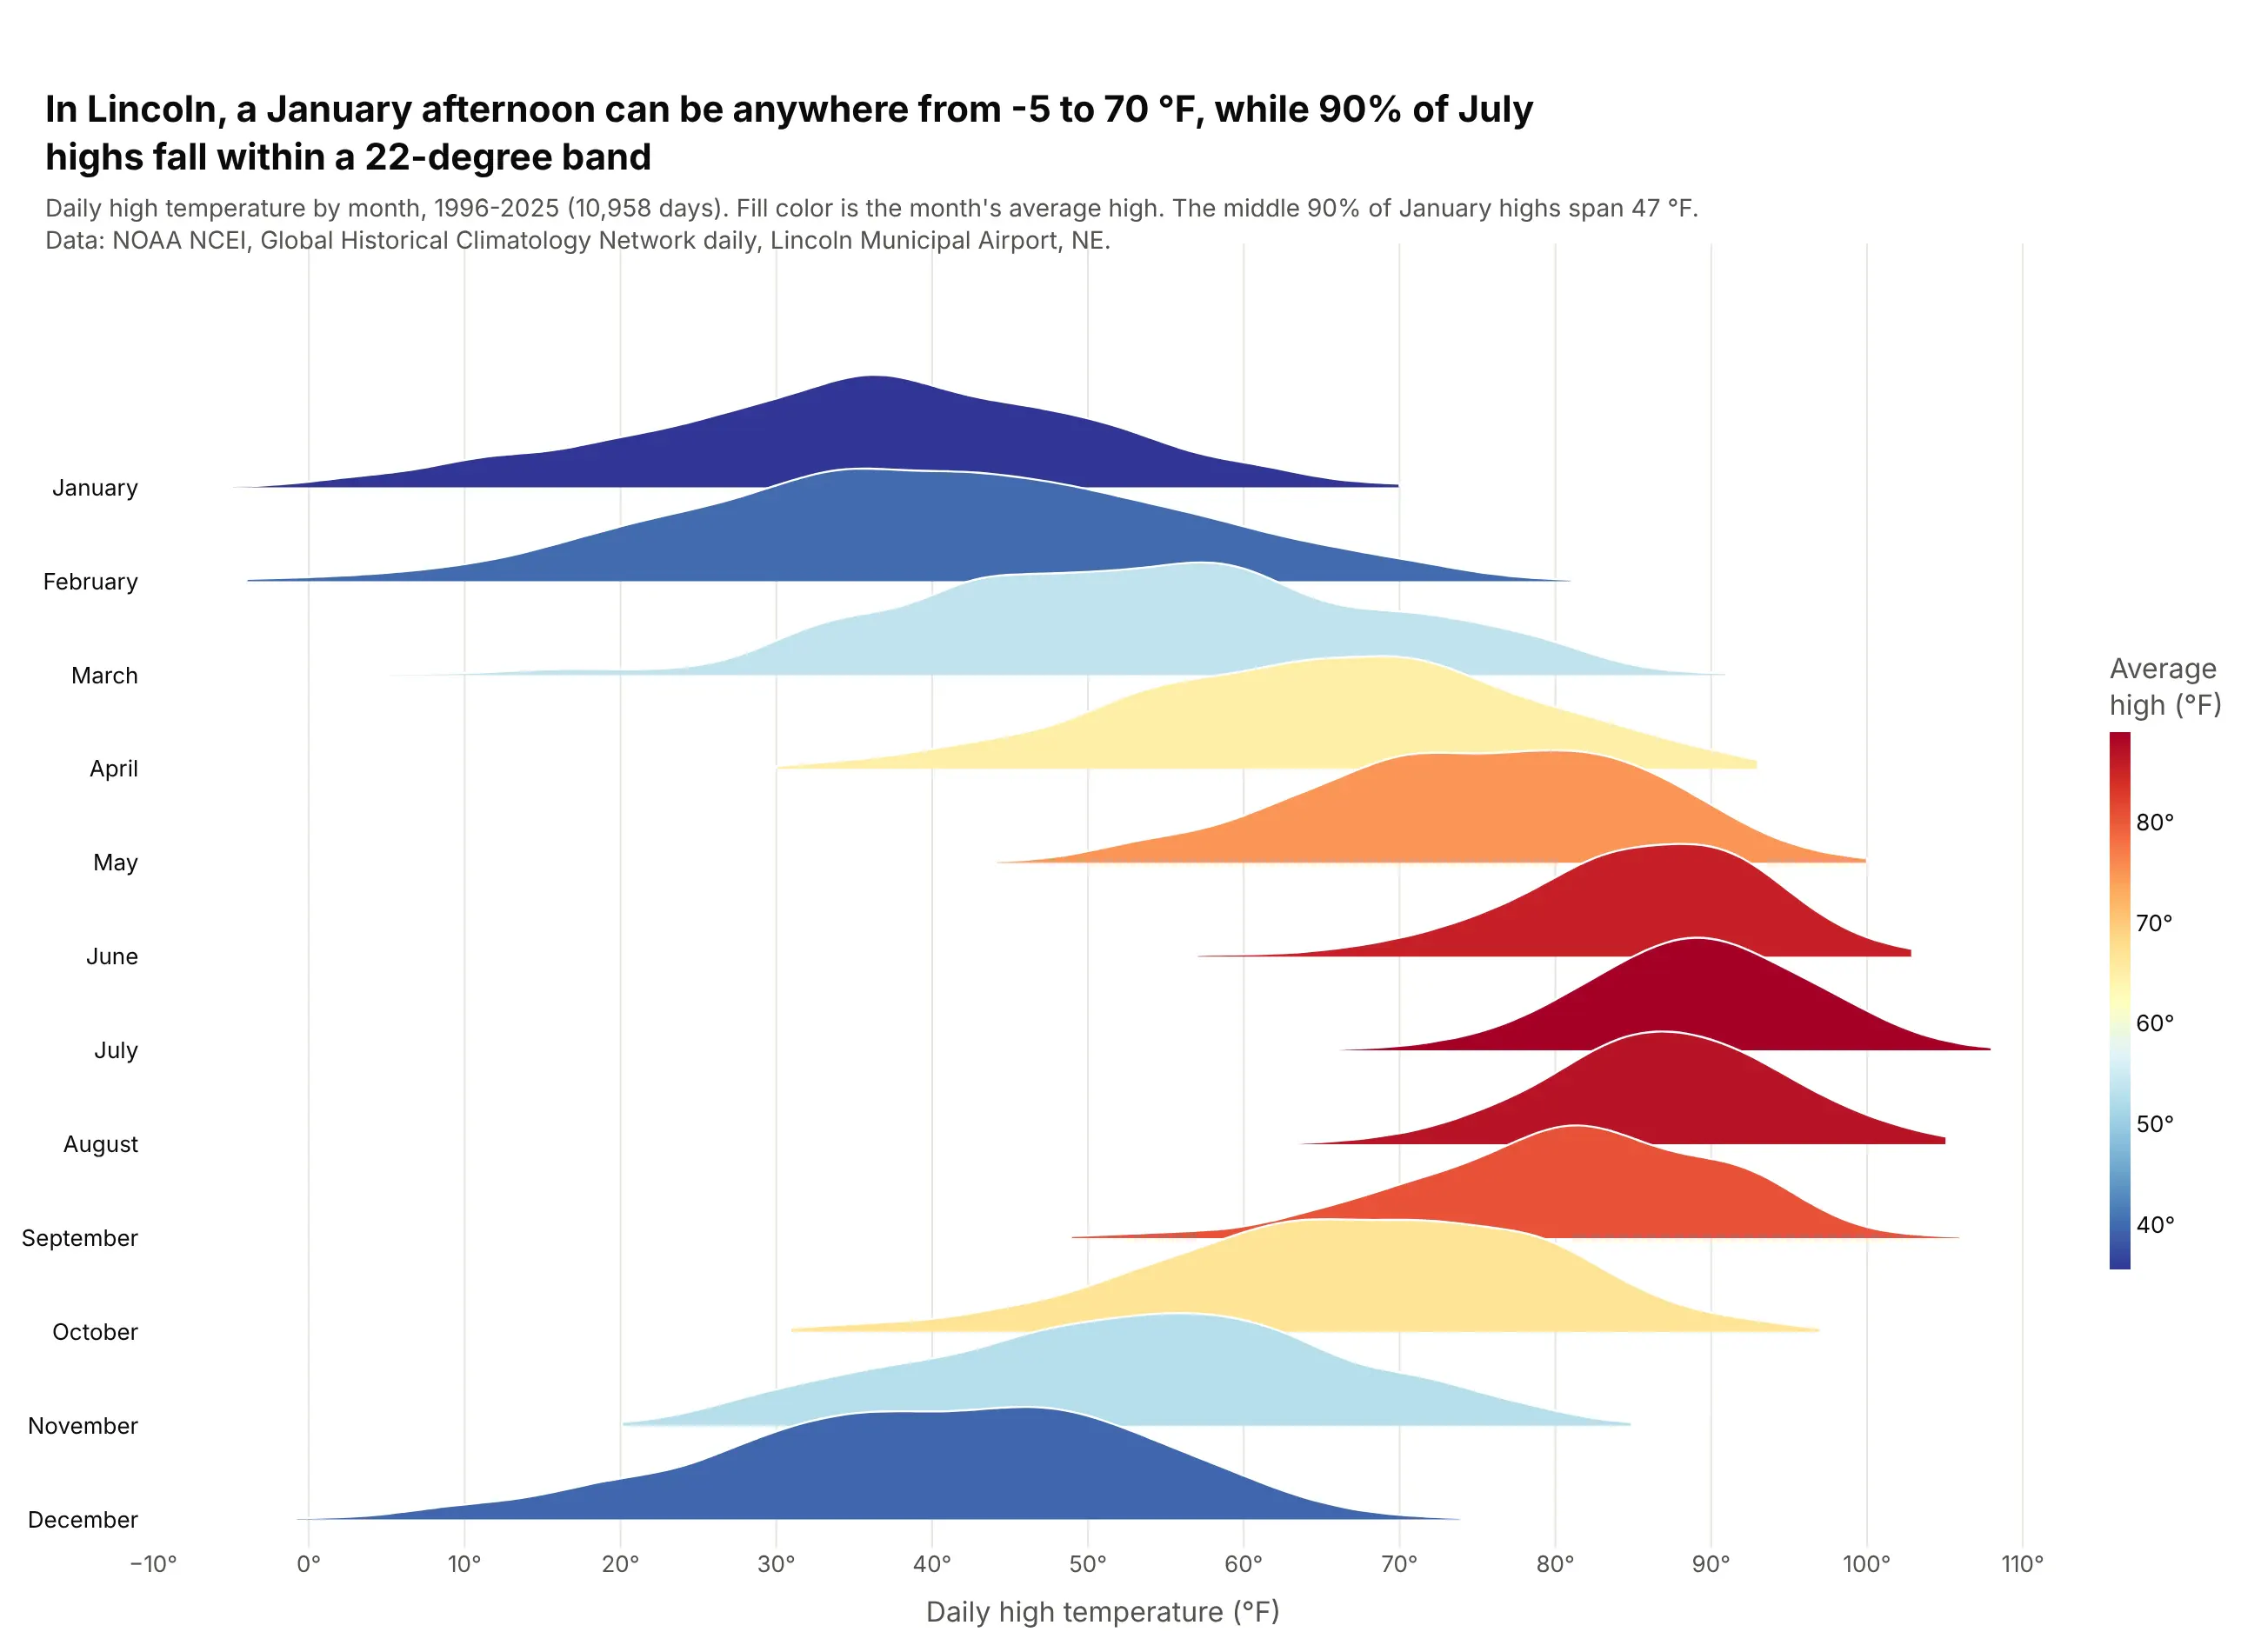
A ridgeline plot stacks one smoothed distribution per group on a shared x axis, each overlapping the row above, so a dozen or more distributions fit in one chart. Use one when the groups have a natural order (hours, months, years) and the question is how the shape shifts from row to row. Also known as joyplots and ridge plots.
Read the complete guide to ridgeline plots
ECDF plot
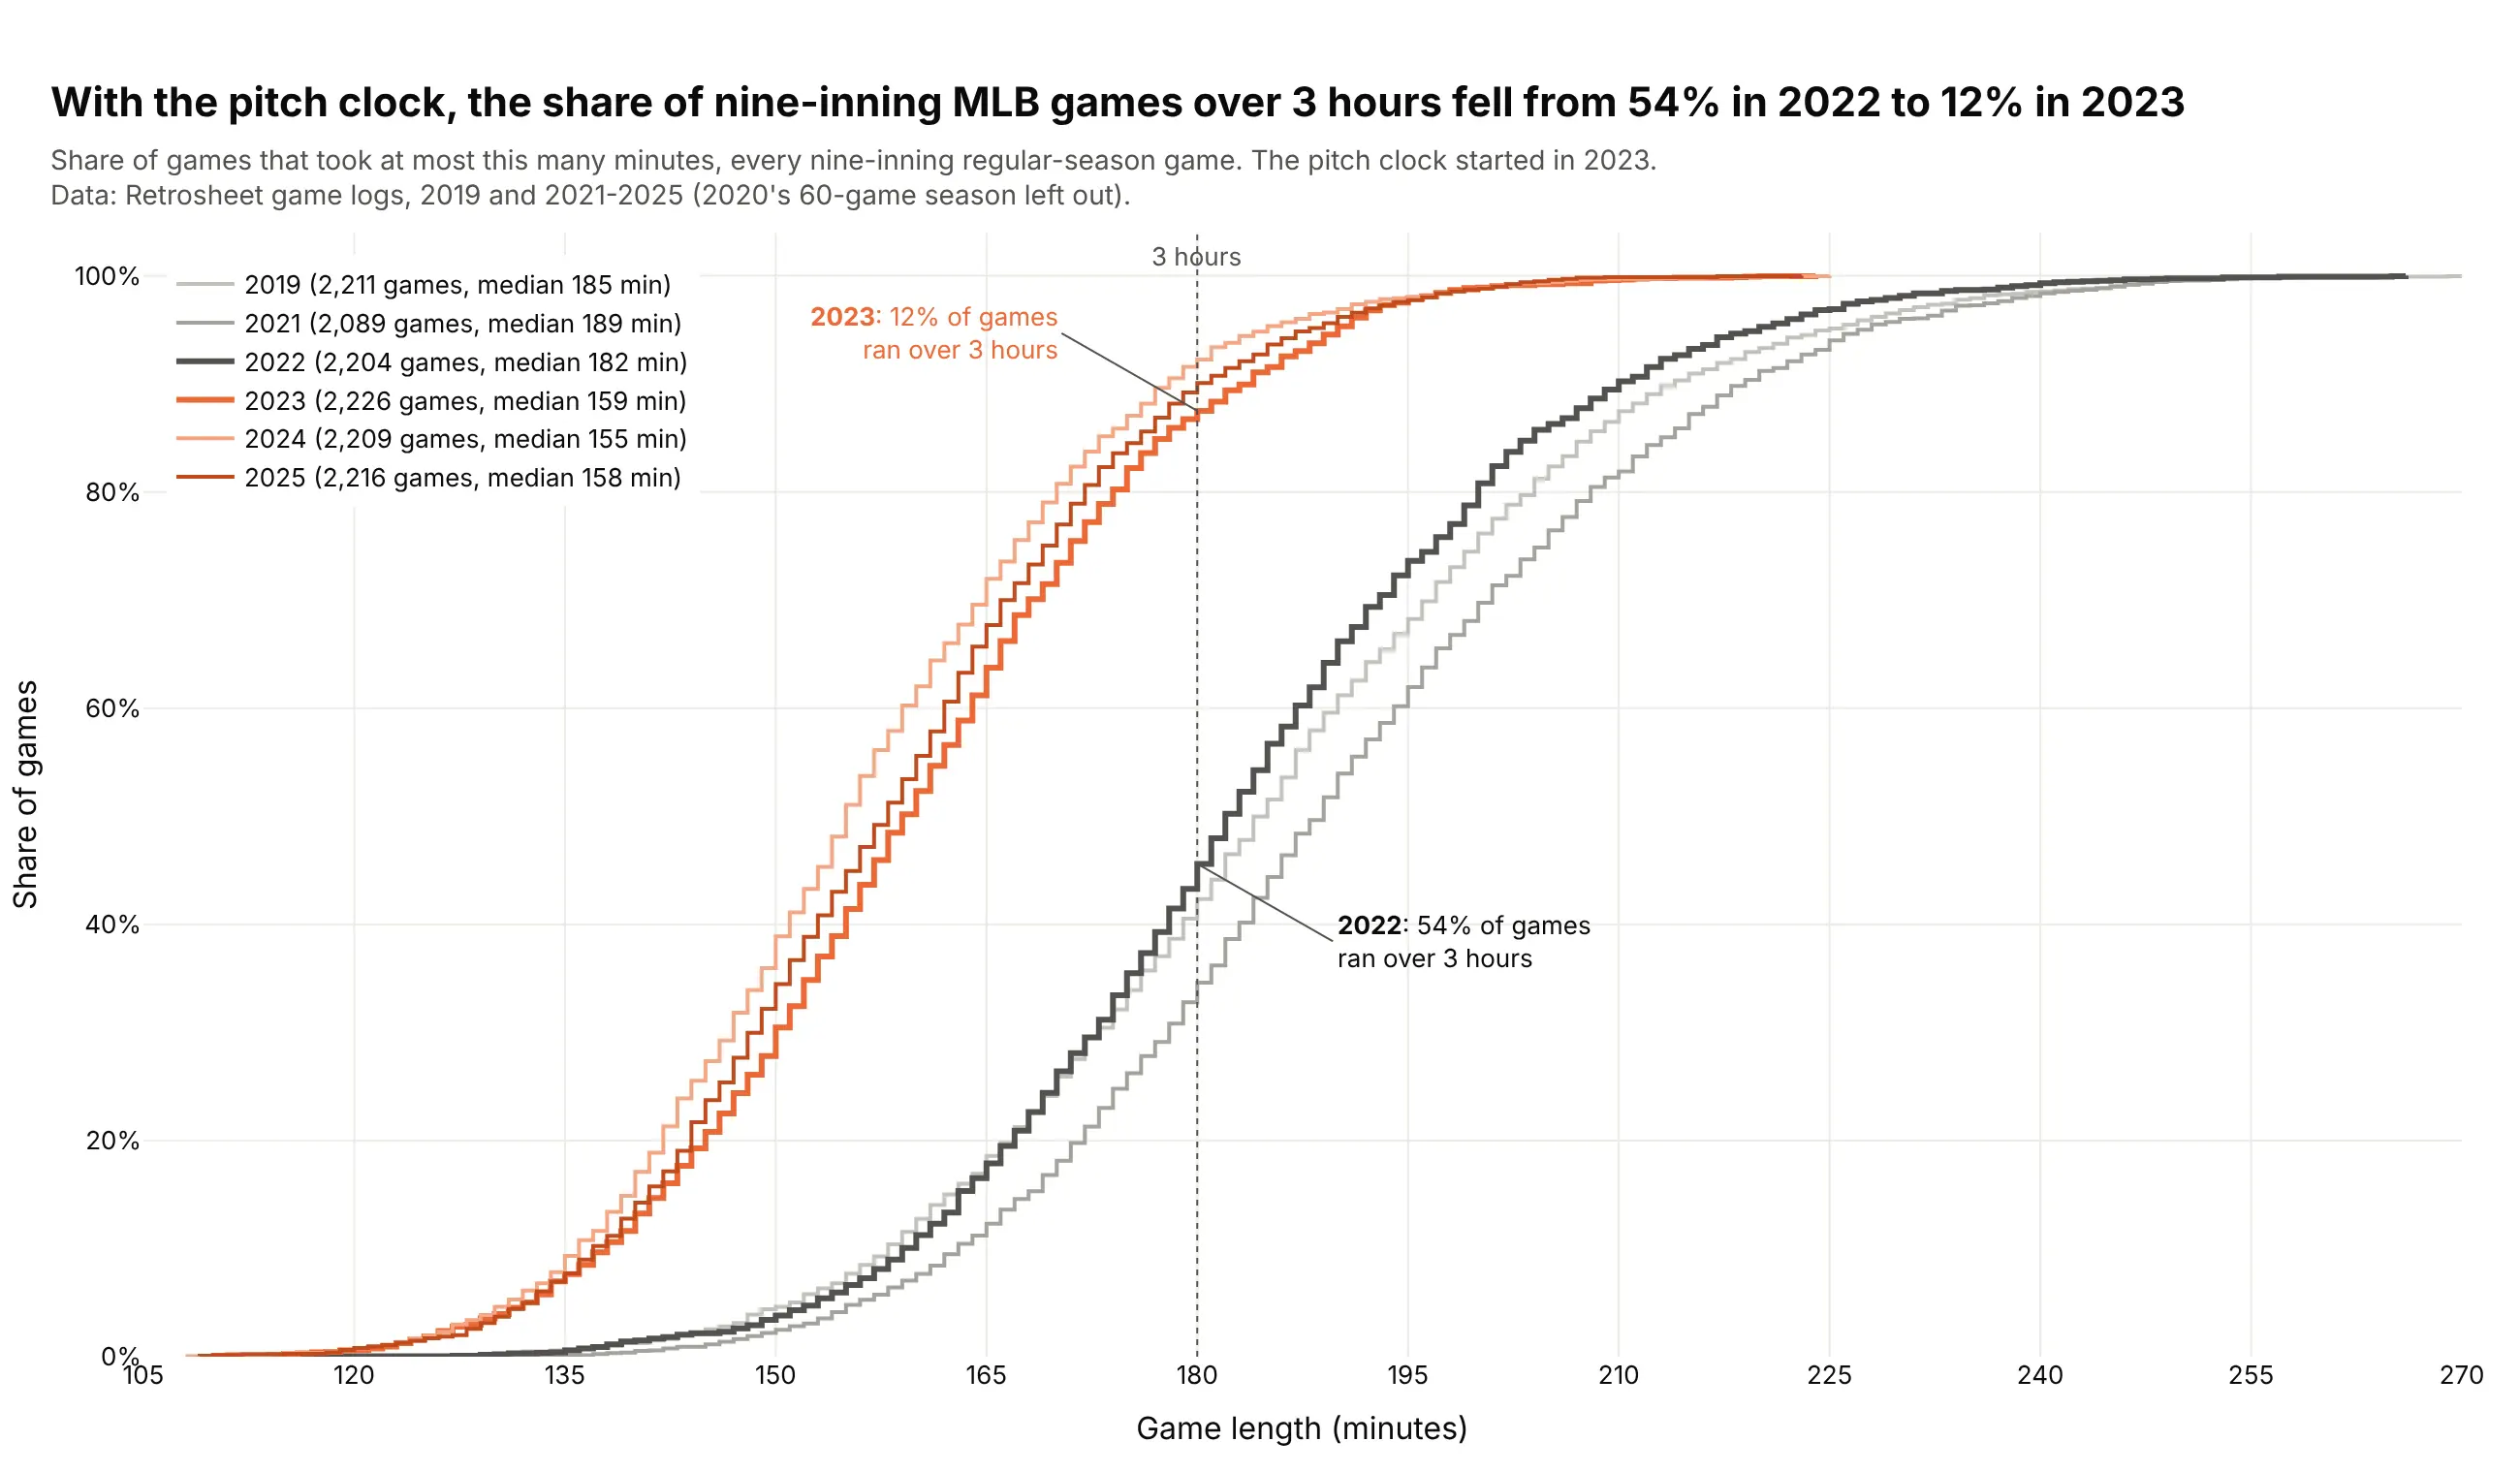
An ECDF plot draws every value in a dataset as one step up a curve, so the height at any x is the share of values at or below x. Use one to compare distributions without choosing bins, and to read medians, percentiles and the share above a threshold straight off the chart. Also known as empirical cumulative distribution function plots and empirical CDF plots.
Read the complete guide to ECDF plots
Population pyramid
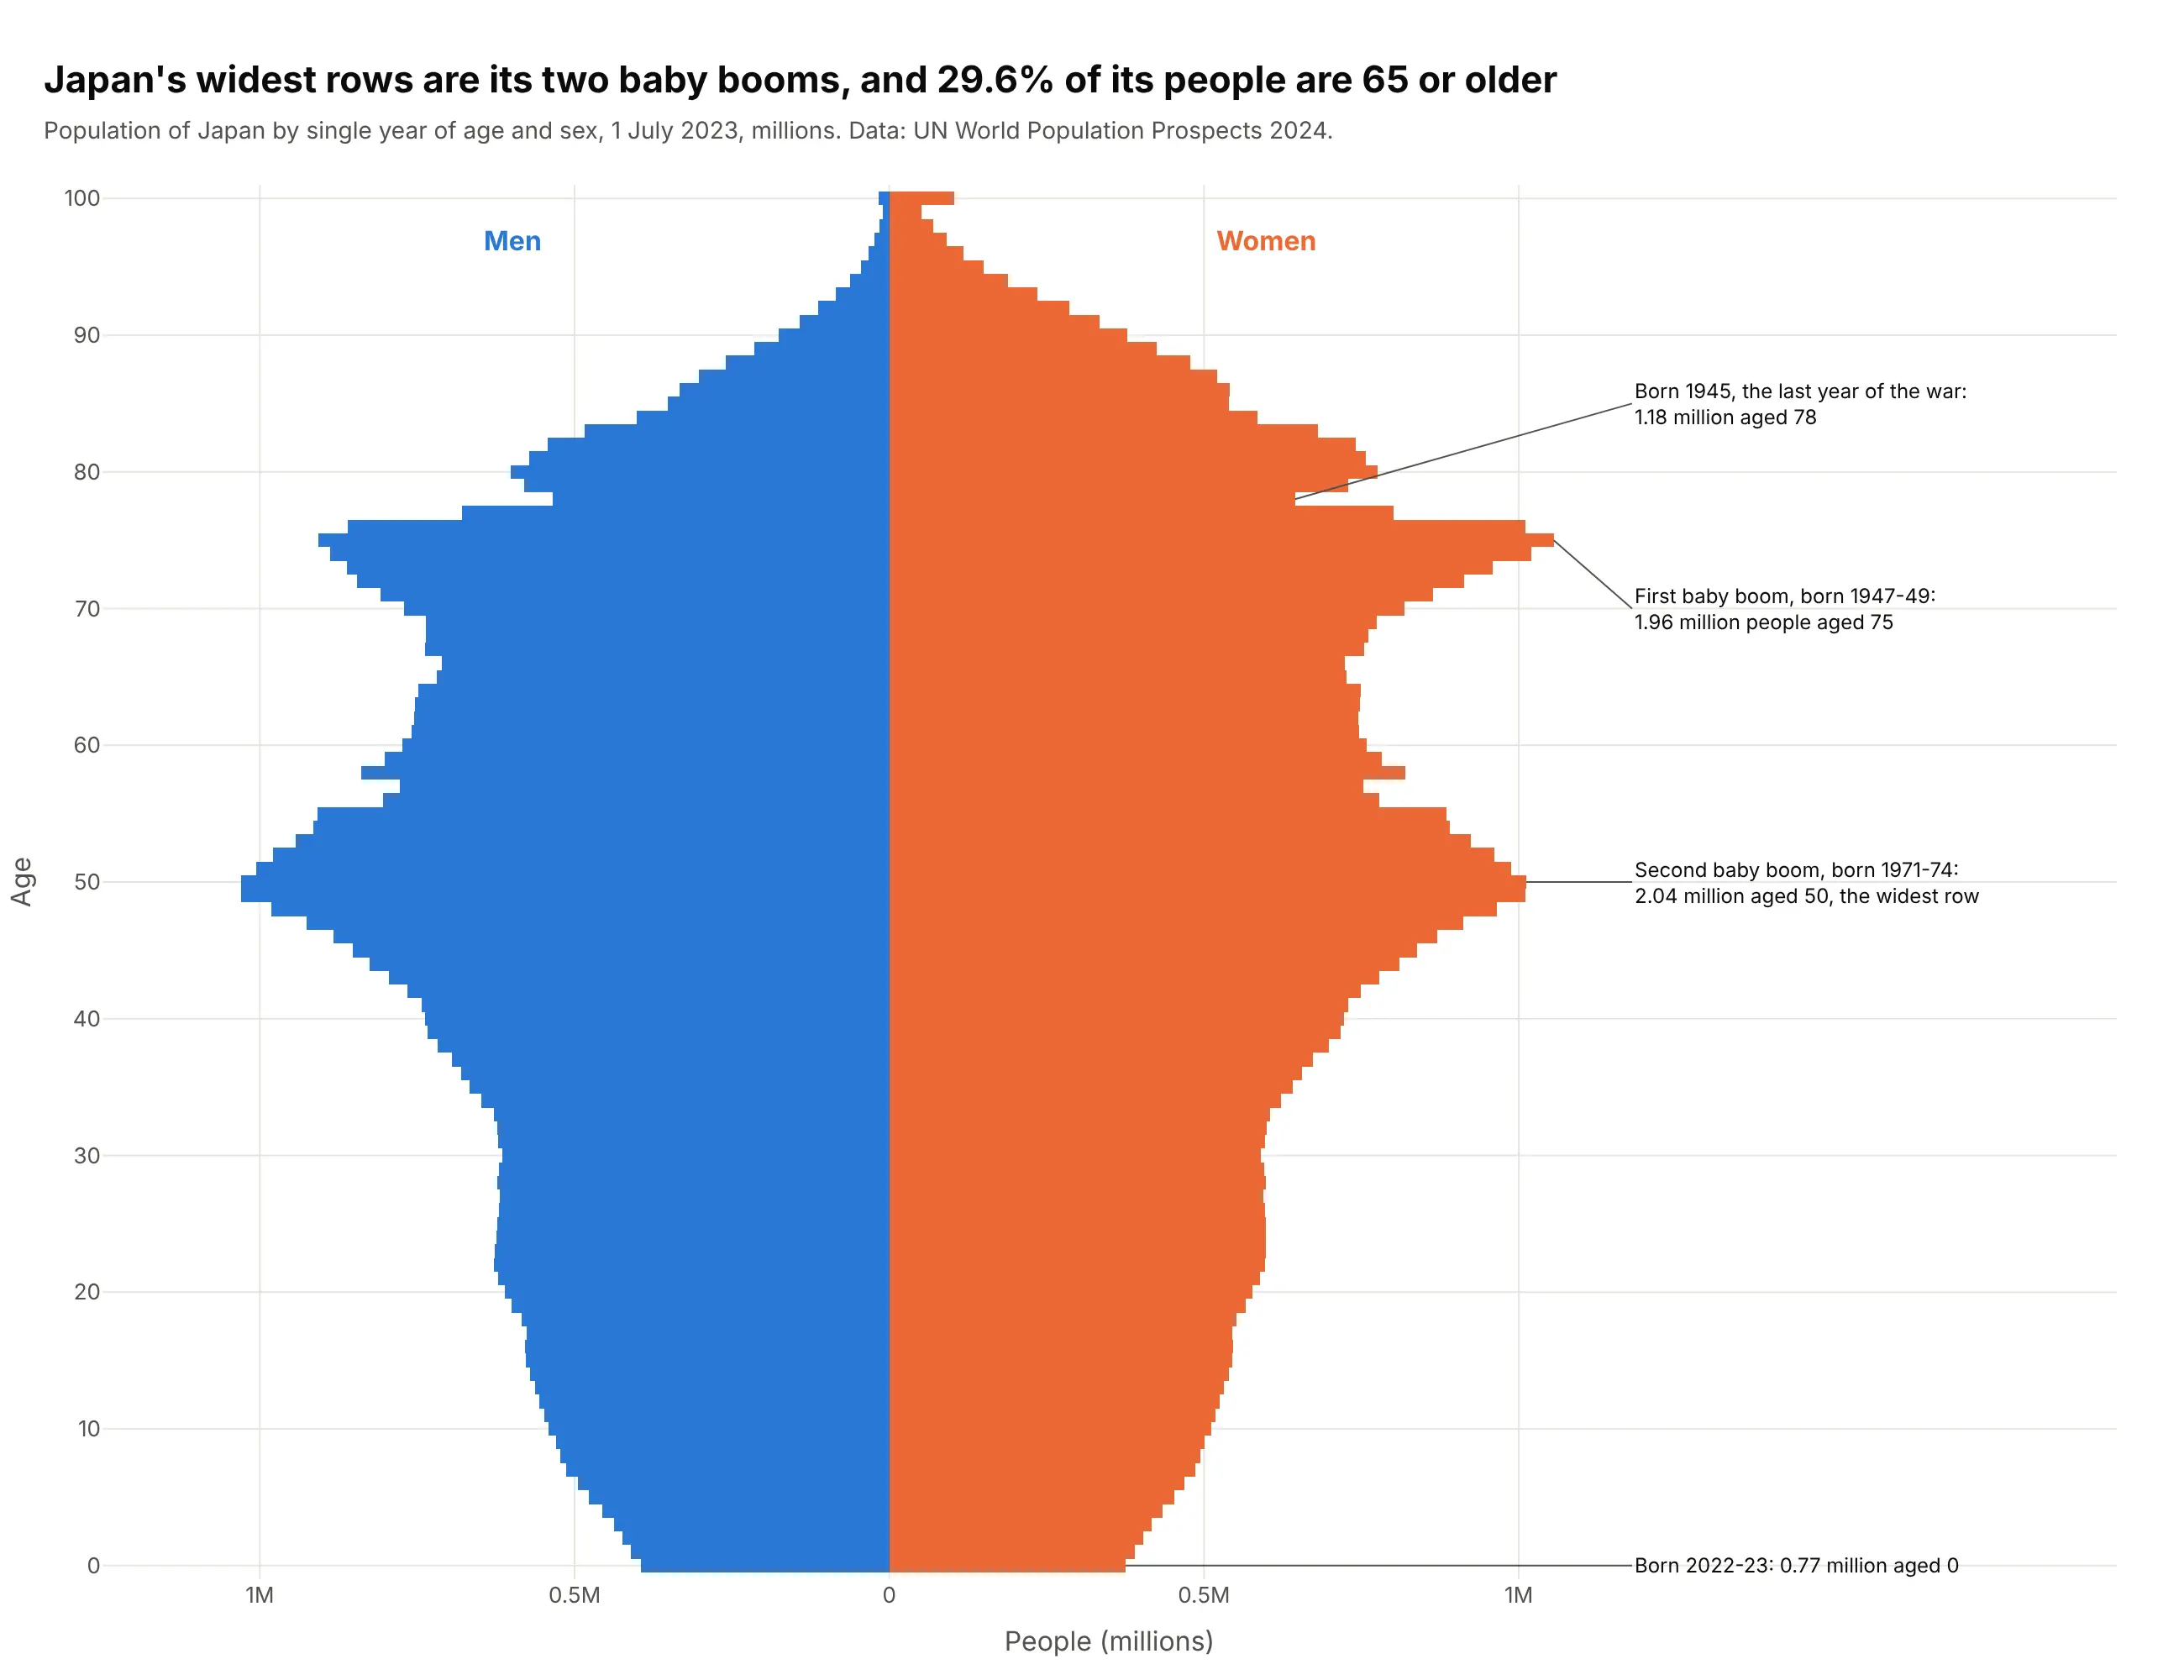
A population pyramid is two horizontal bar charts back to back, men on the left and women on the right, with one row per age and the youngest at the bottom. Its shape tells the story, because a wide base means many children and bulges are baby booms. Also known as age pyramids, age-sex pyramids and age structure diagrams.
Read the complete guide to population pyramids
Charts for parts of a whole and hierarchies
These charts show how a total splits into parts, and in the hierarchical ones, how those parts split again.
Treemap
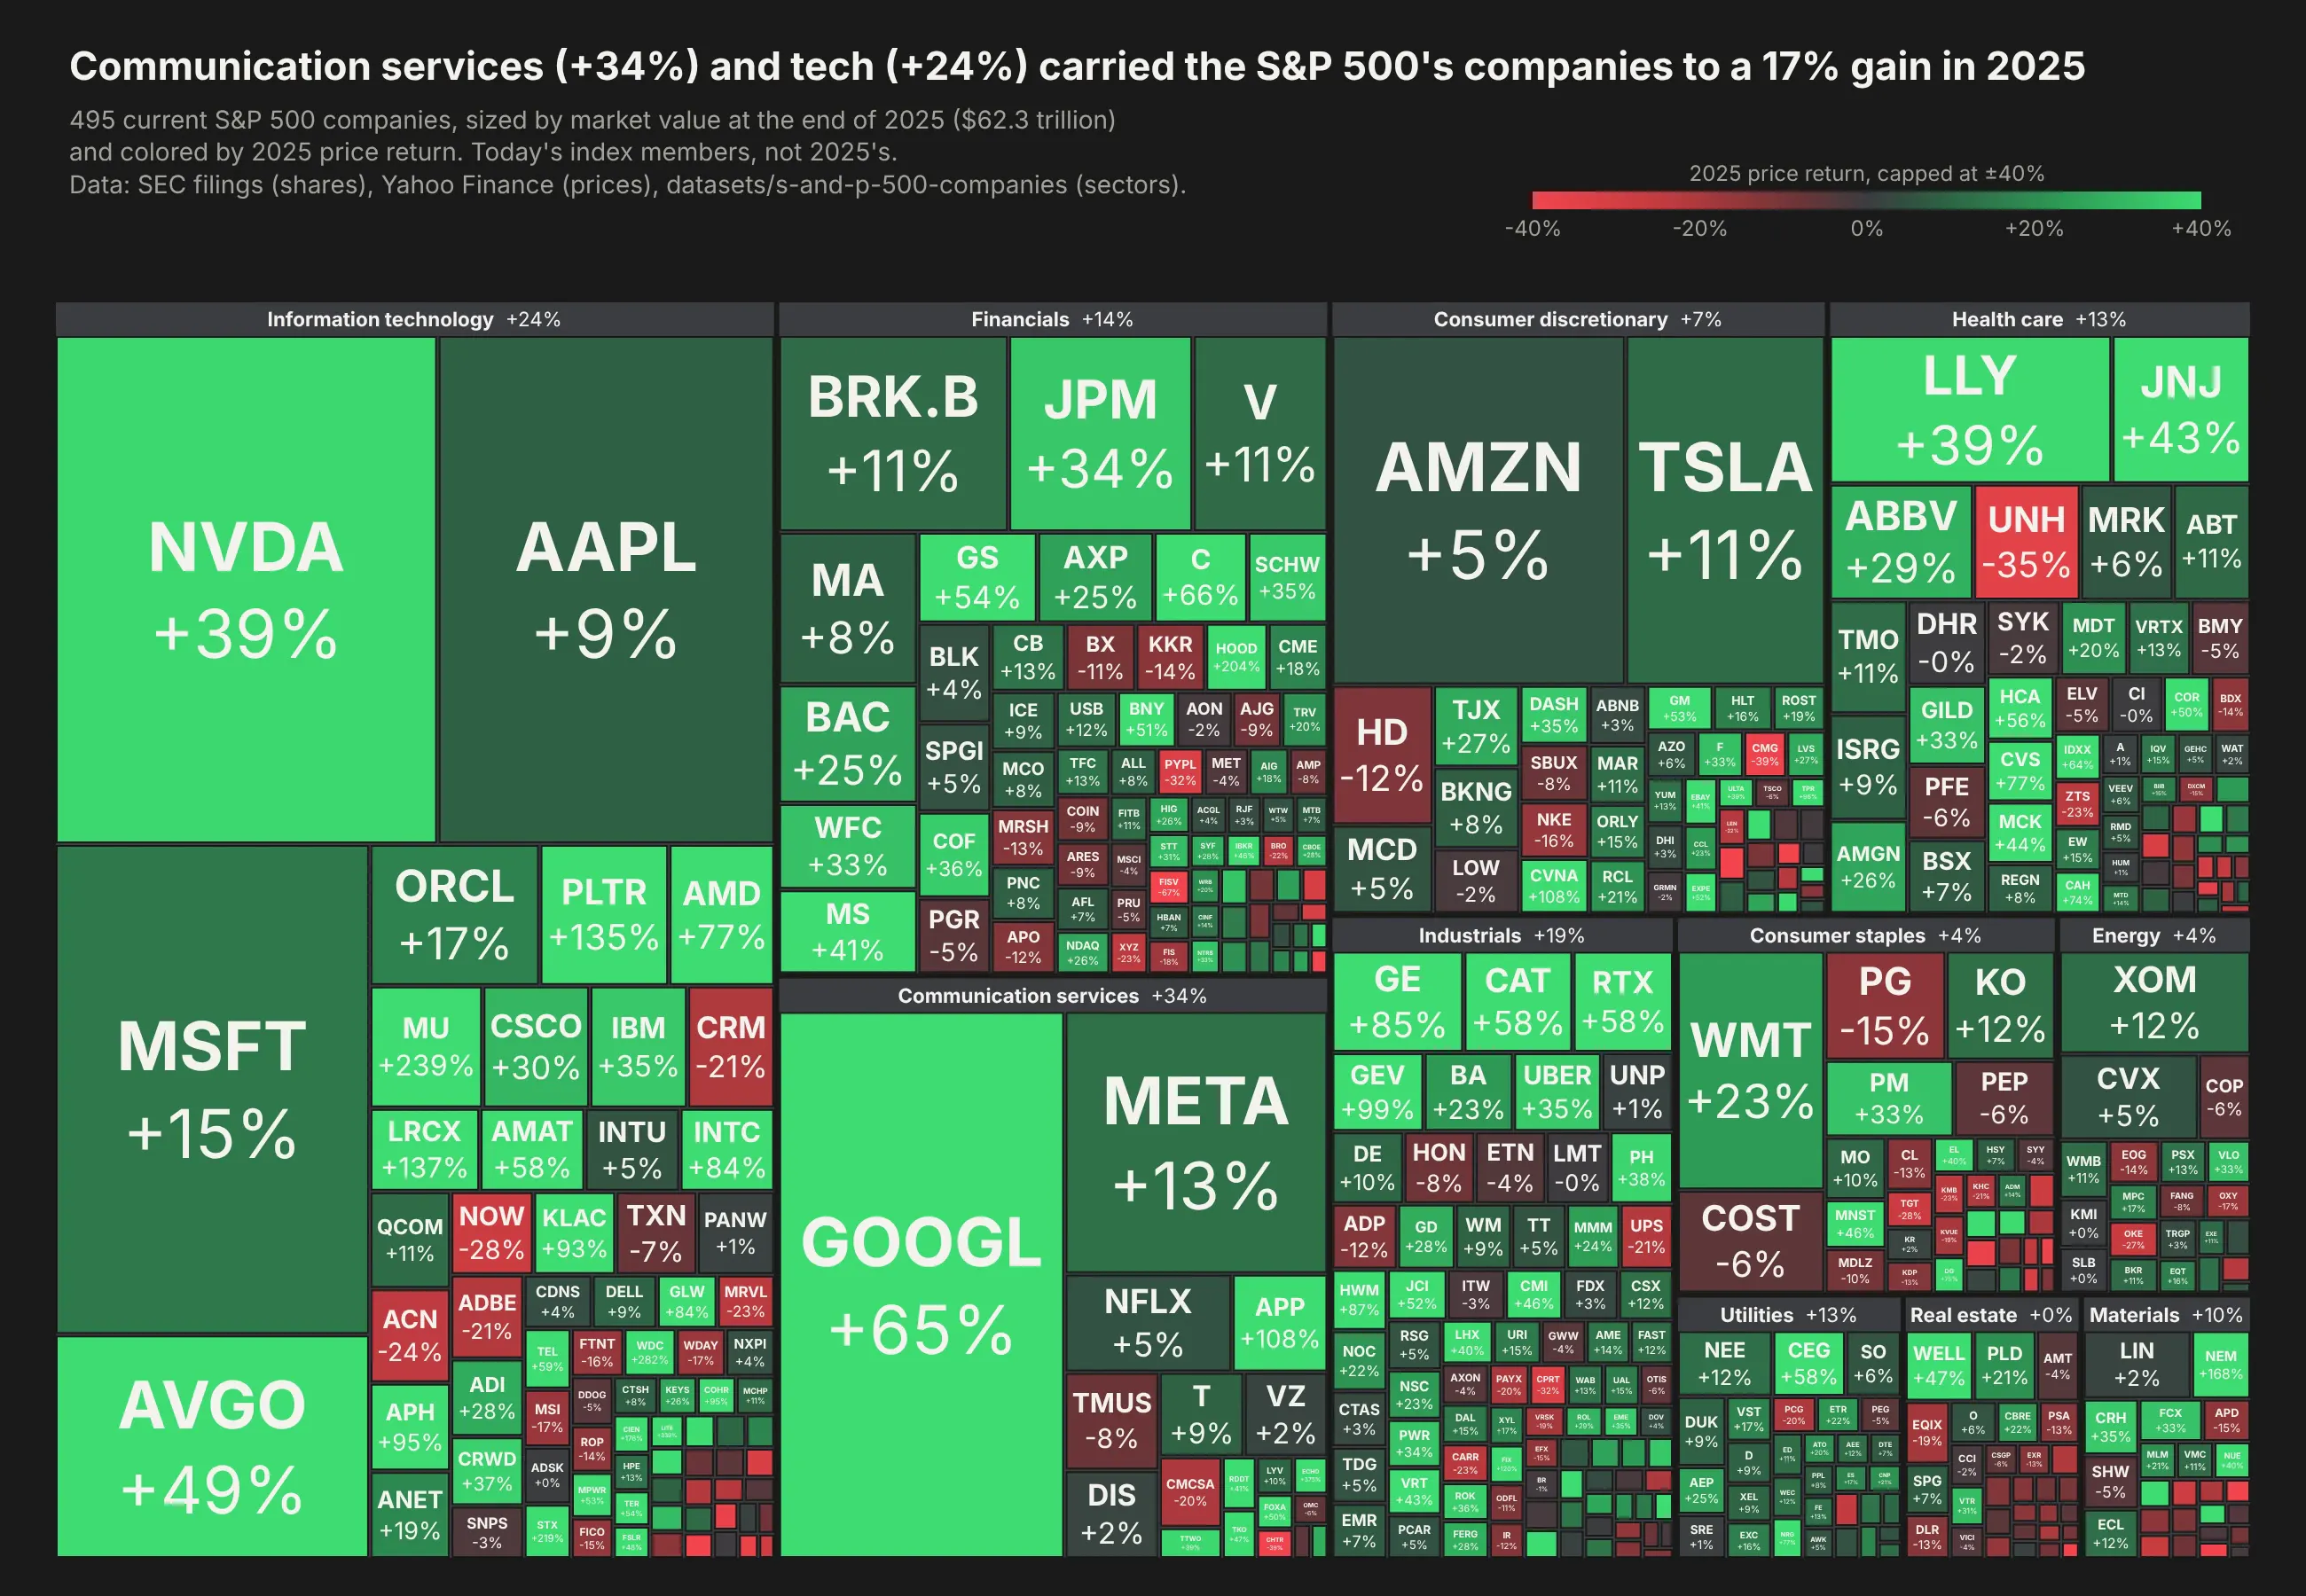
A treemap draws a hierarchy as nested rectangles, with each rectangle's area proportional to its value, so hundreds of parts of a whole fit on one screen. Use one for positive values that add up (budgets, market caps, disk usage) when the question is what's big and where it sits. Also known as tree maps and tree-maps.
Read the complete guide to treemaps
Sunburst chart
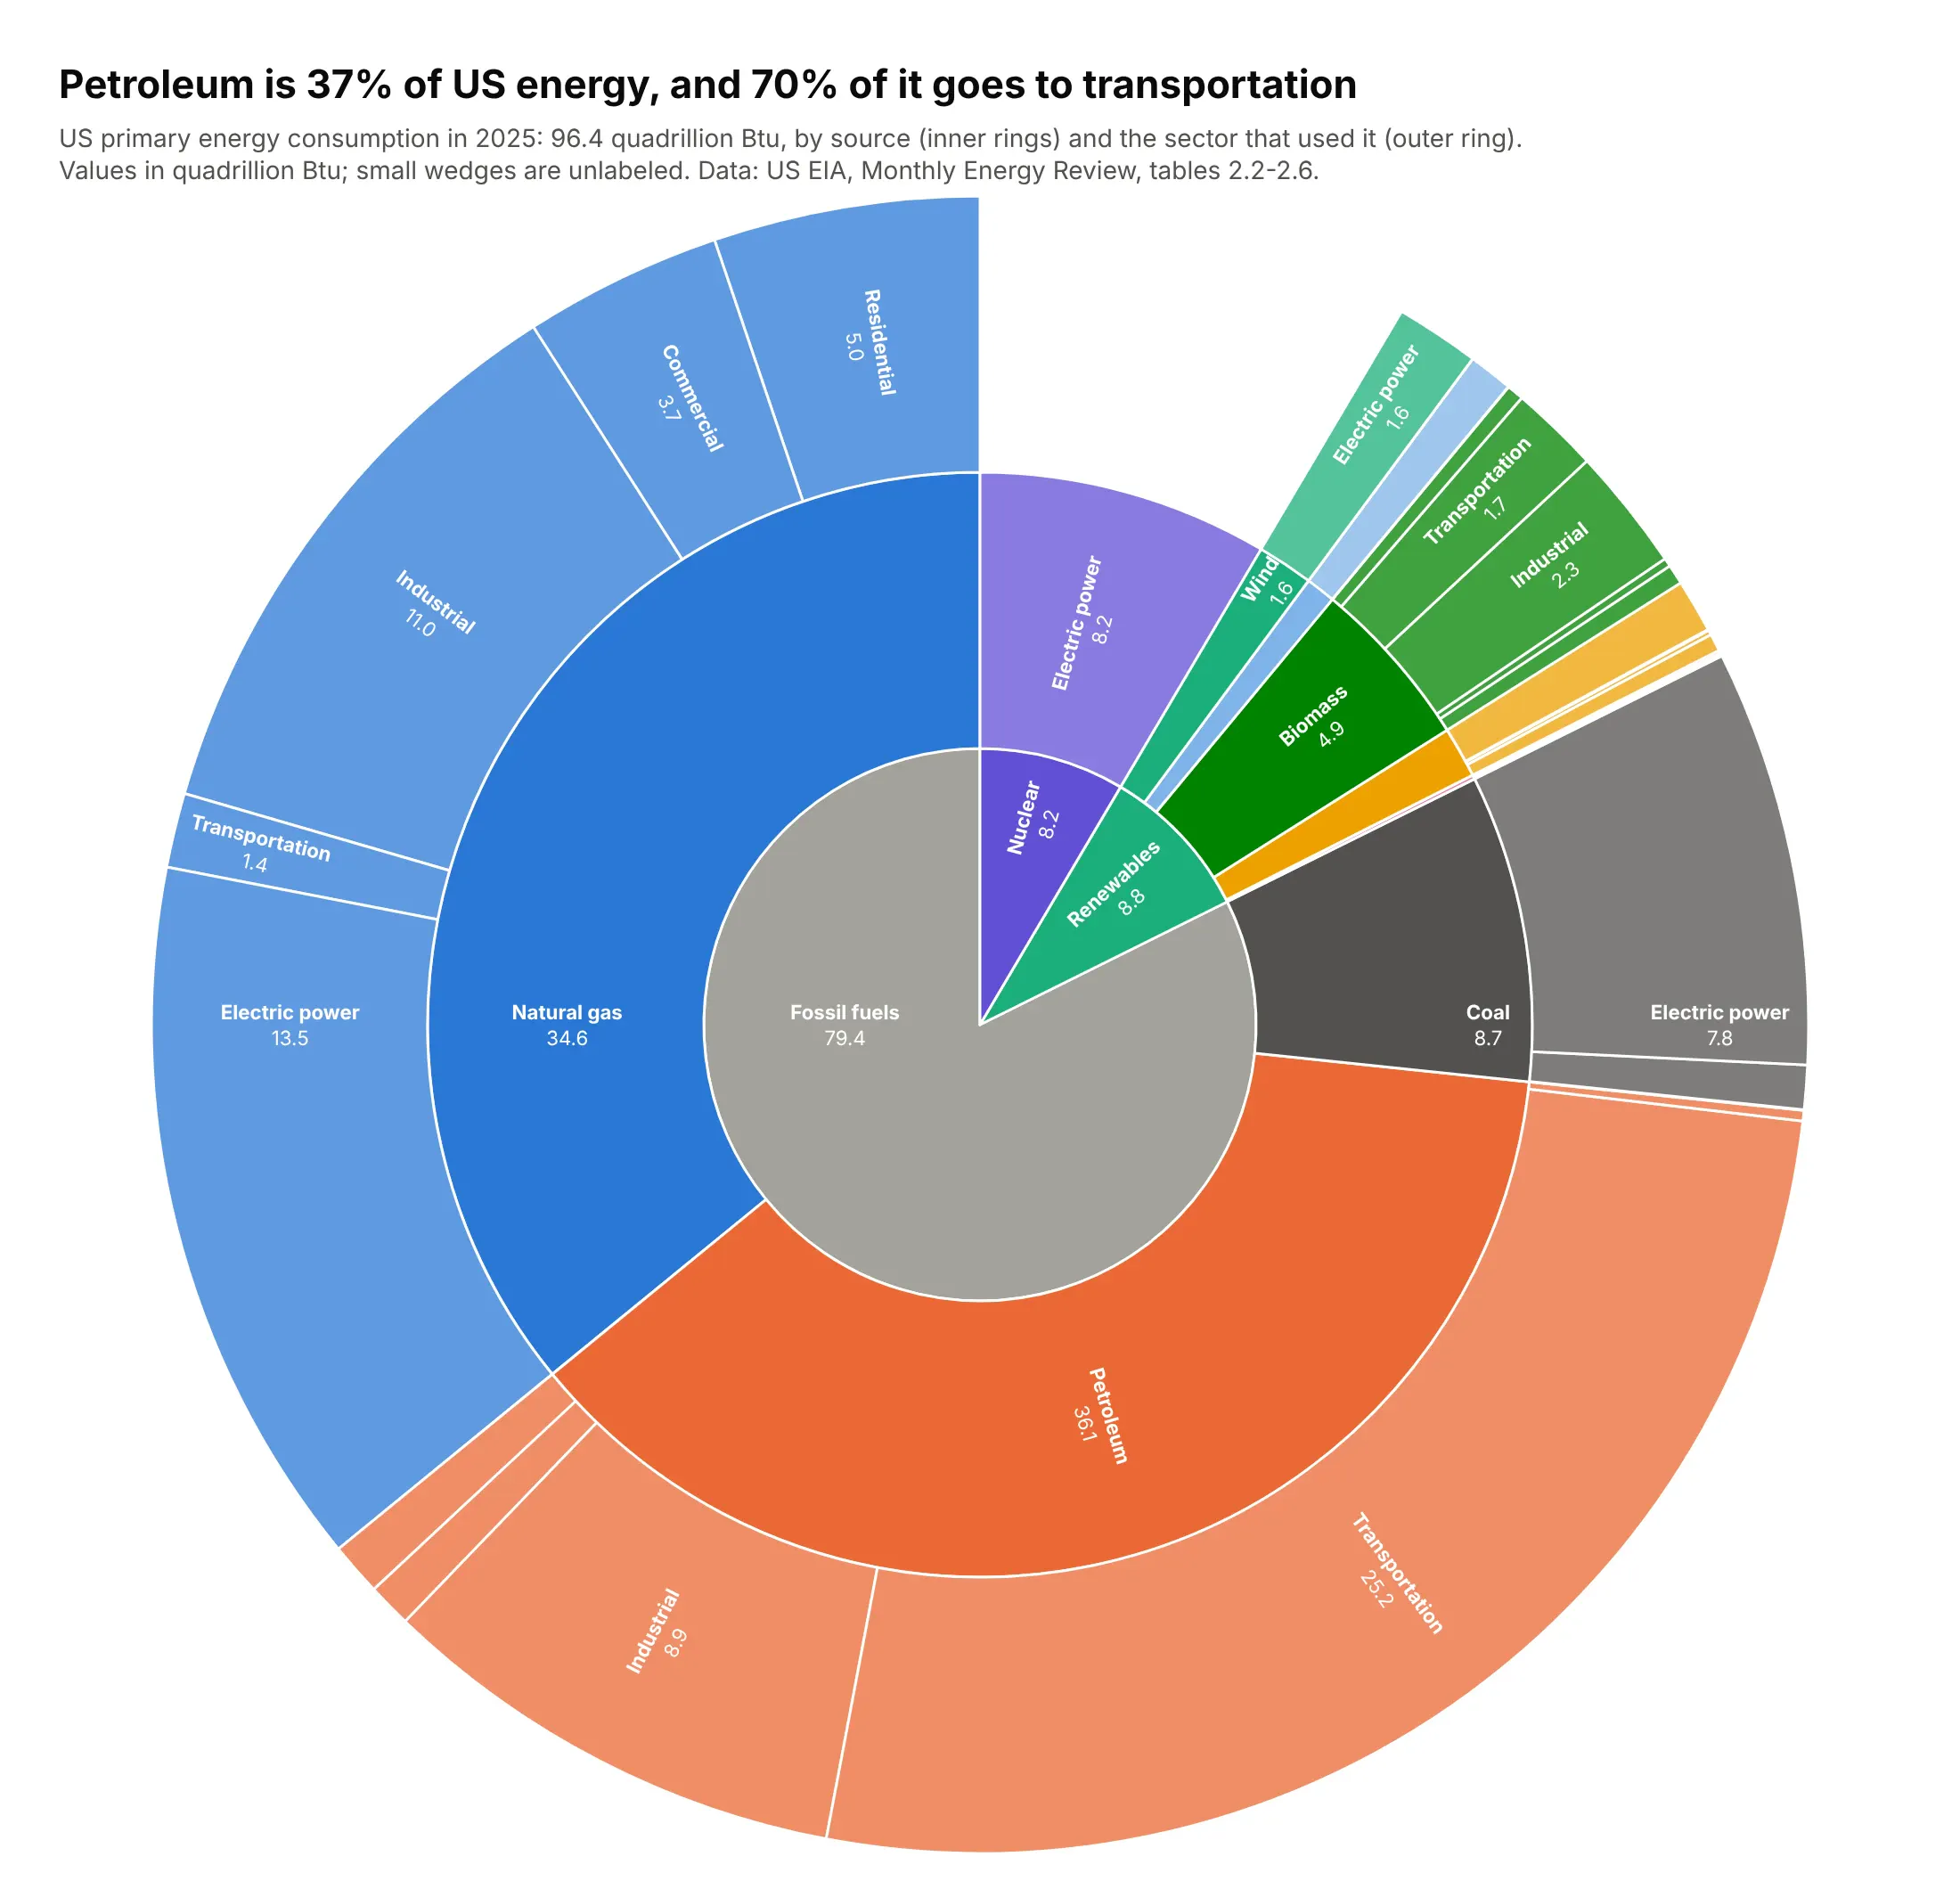
A sunburst chart, or multi-level pie chart, draws a hierarchy as rings around a center, with the total in the middle, each level one ring further out and each wedge's angle proportional to its value. Use one when the depth of the tree matters as much as the sizes, as in taxonomies, budgets, balance sheets or file systems. People often call a two-ring sunburst a nested pie chart. Also known as ring charts, multi-level pie charts and radial treemaps.
Read the complete guide to sunburst charts
Icicle chart
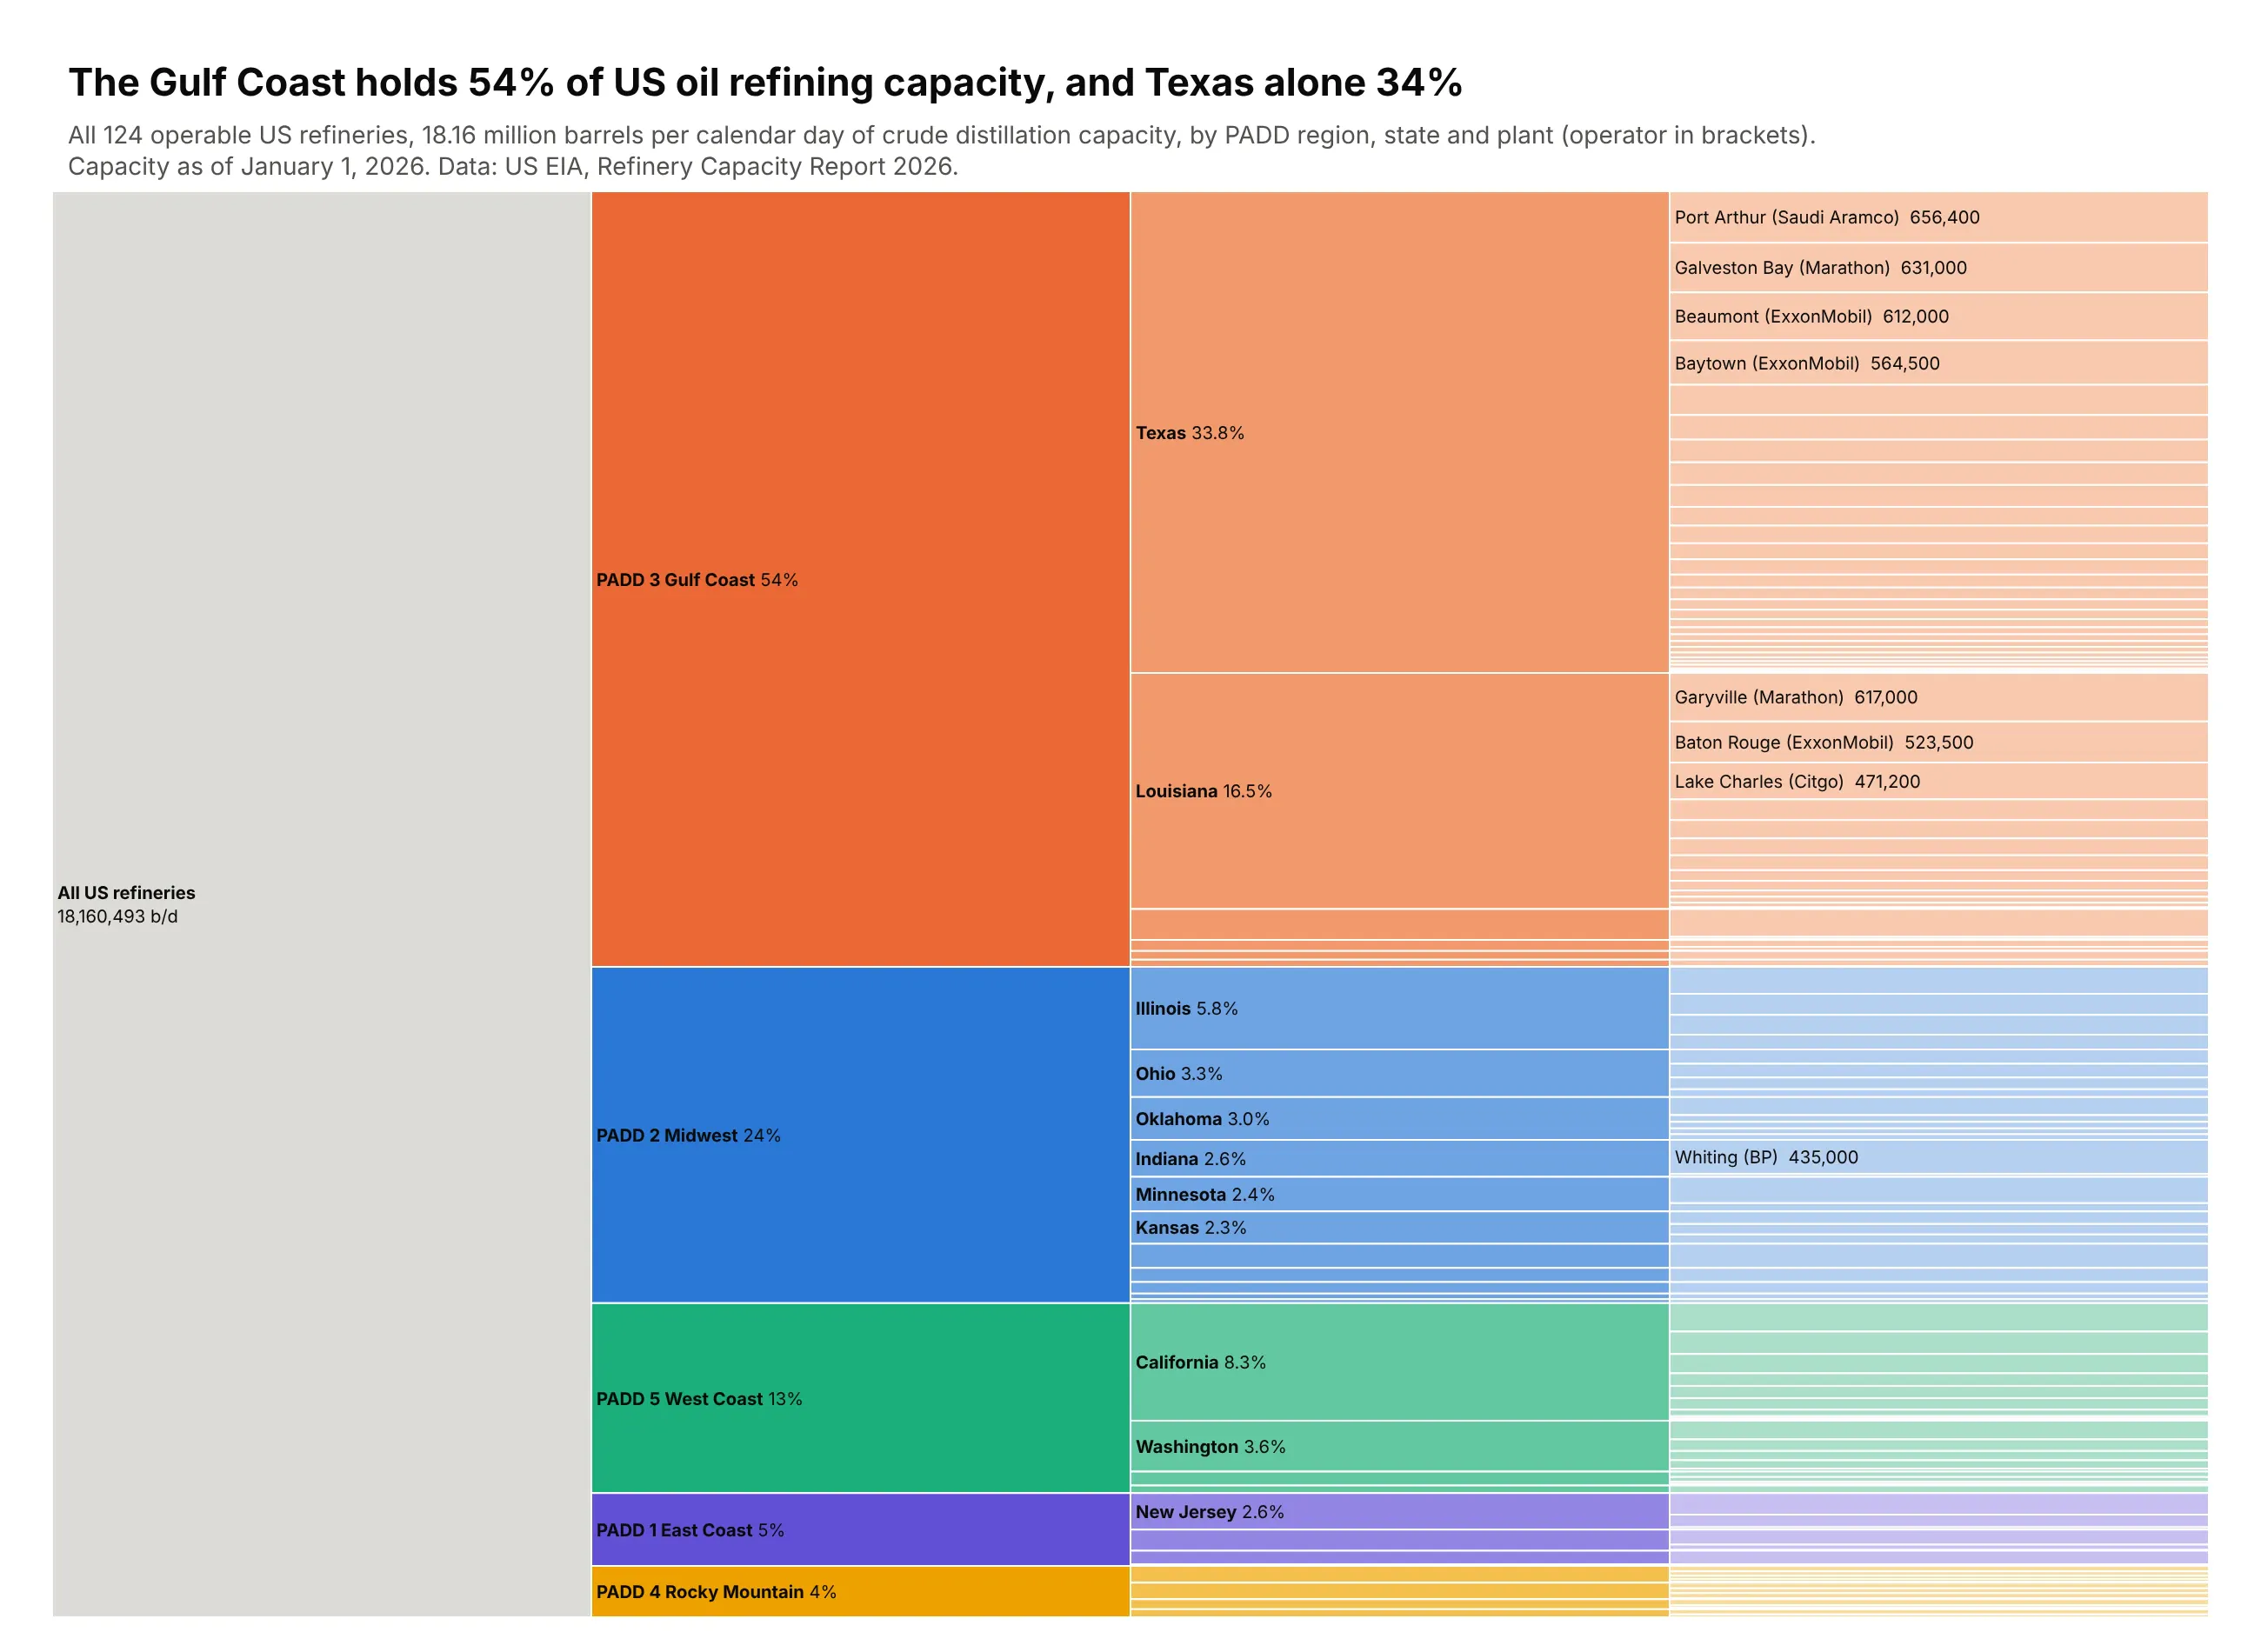
An icicle chart draws a hierarchy as columns of adjacent bars, one column per level, with each bar's length its share of the total. Use one when the reader follows paths through the levels, as in call stacks, code sets, budgets and file systems. A flame graph is an icicle chart of a CPU profile. Also known as icicle plots.
Read the complete guide to icicle charts
Marimekko chart
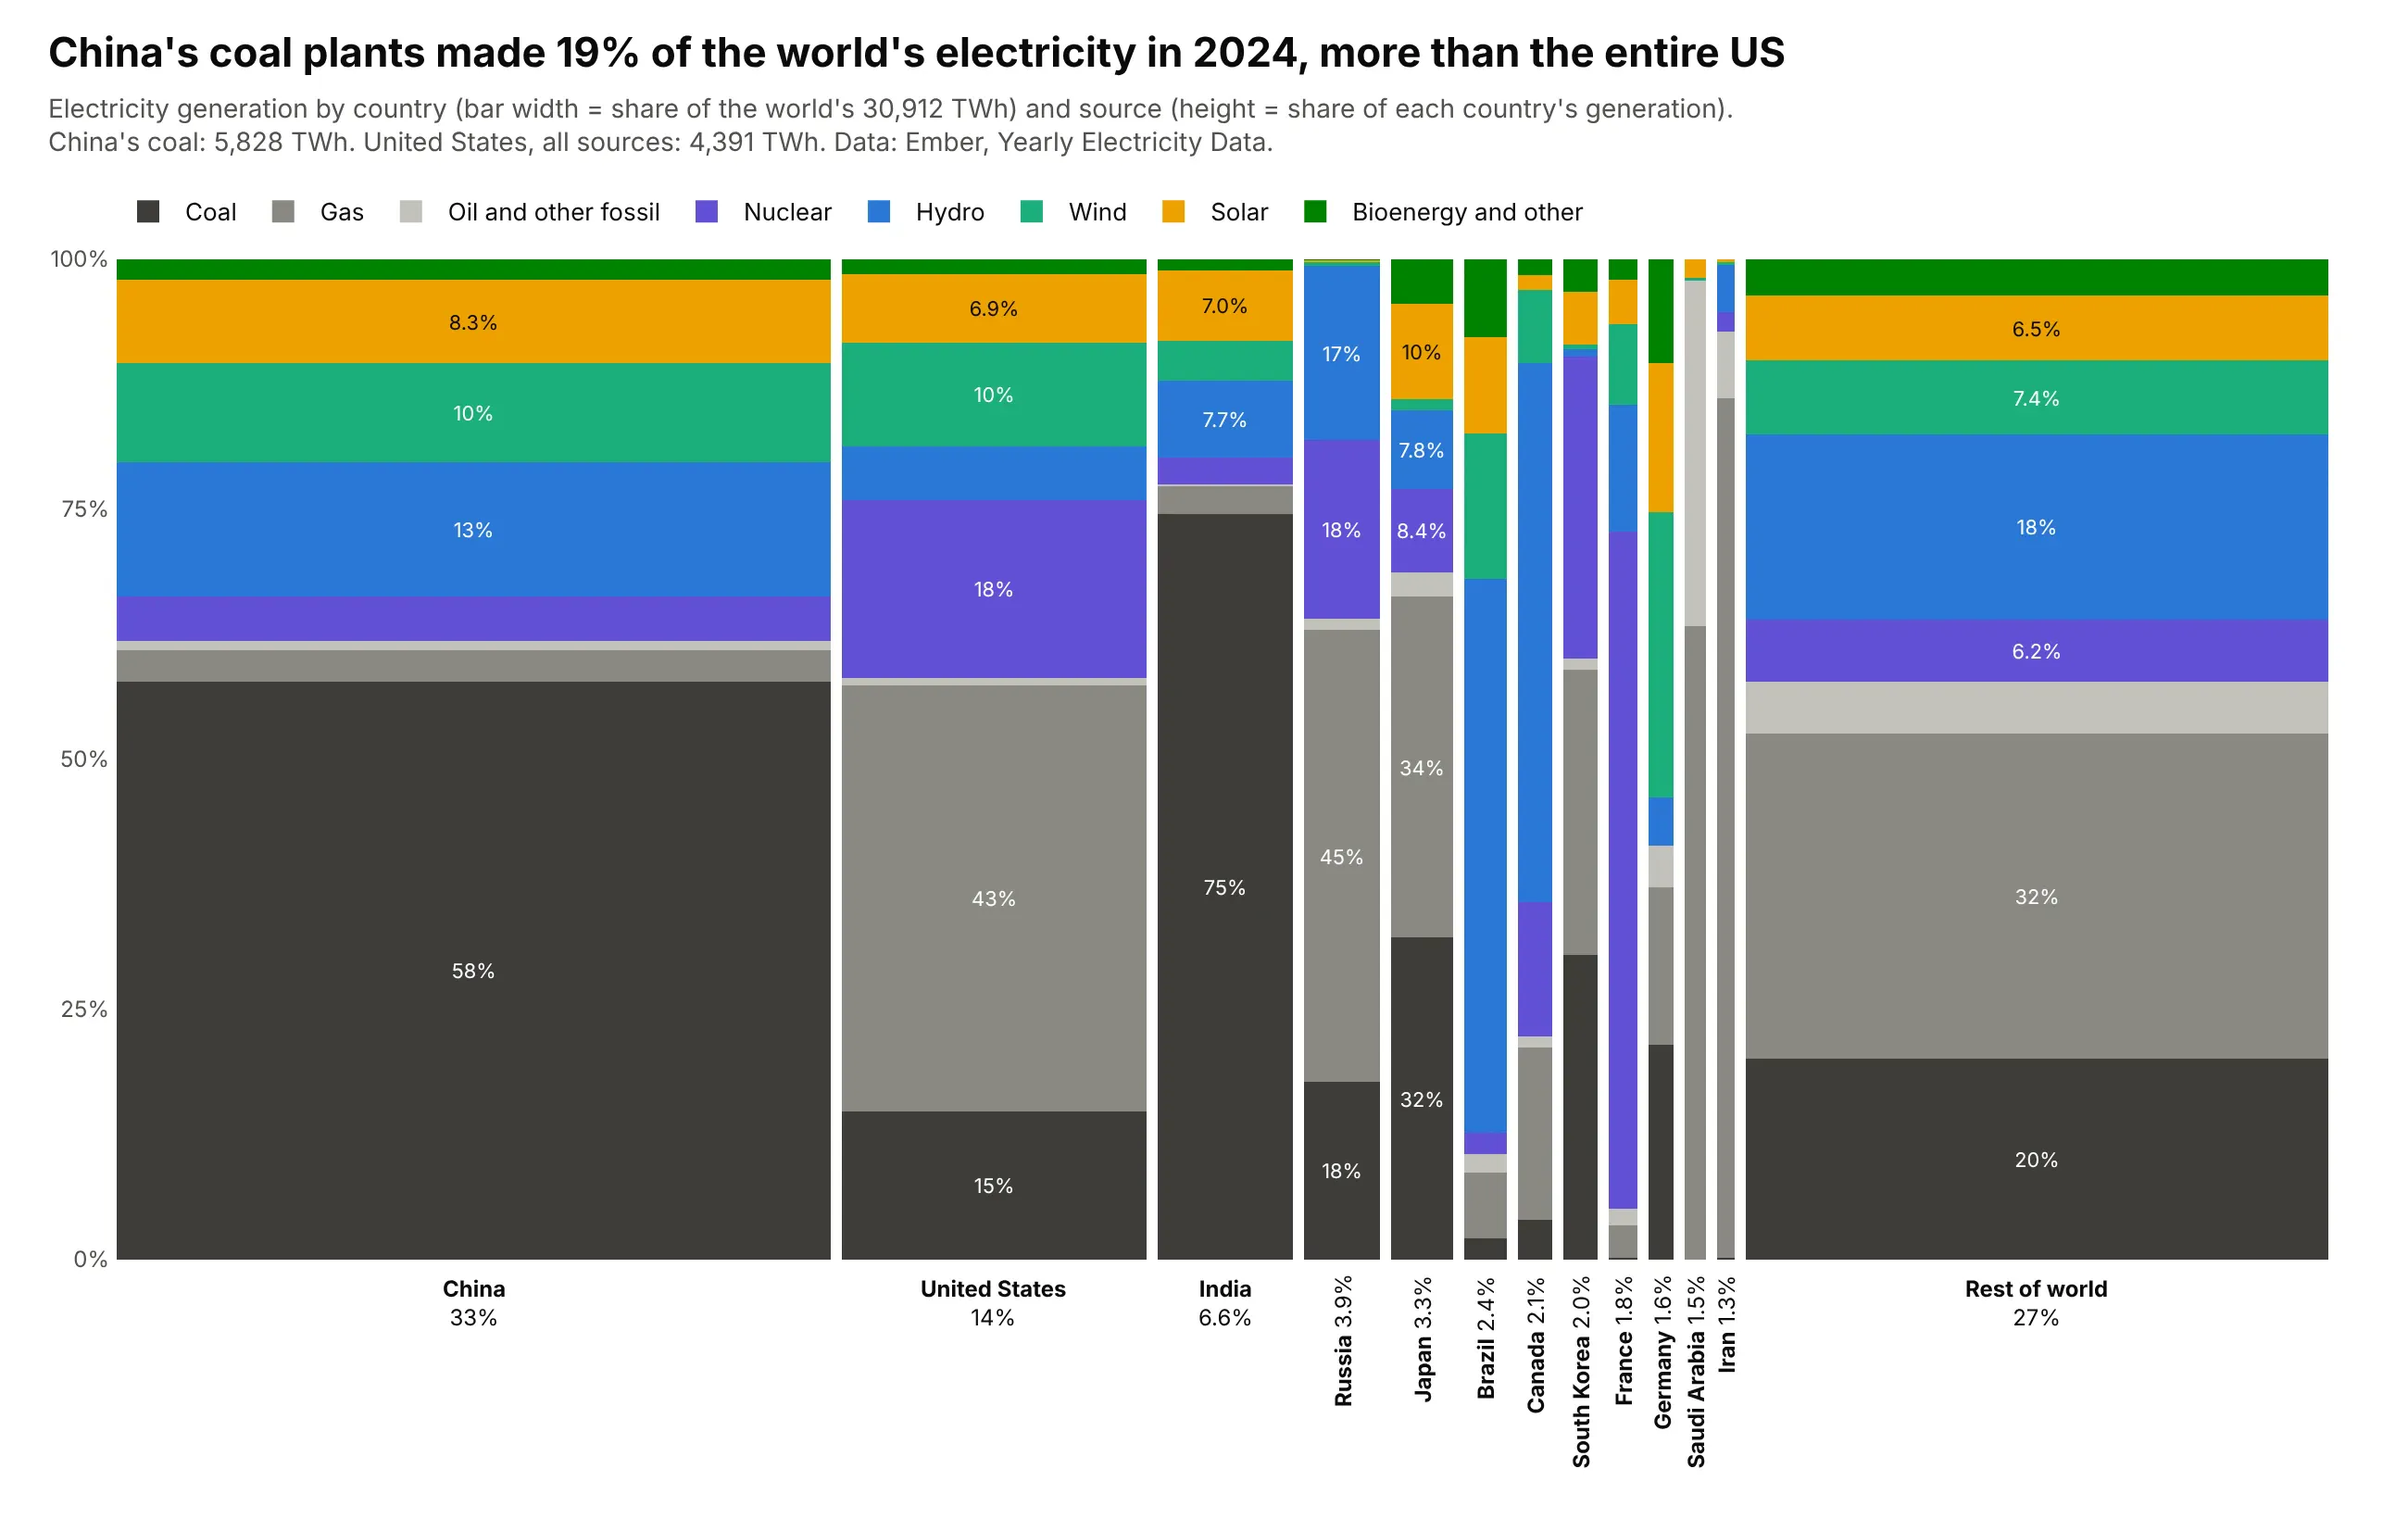
A Marimekko chart is a 100% stacked bar chart where each bar is as wide as its share of the total, so every segment's area is its share of the whole. Use one when the data has two categorical dimensions and both shares matter, such as market share by region and company. Also known as Mekko charts, mosaic plots and percent stacked bar plots.
Read the complete guide to Marimekko charts
Waffle chart
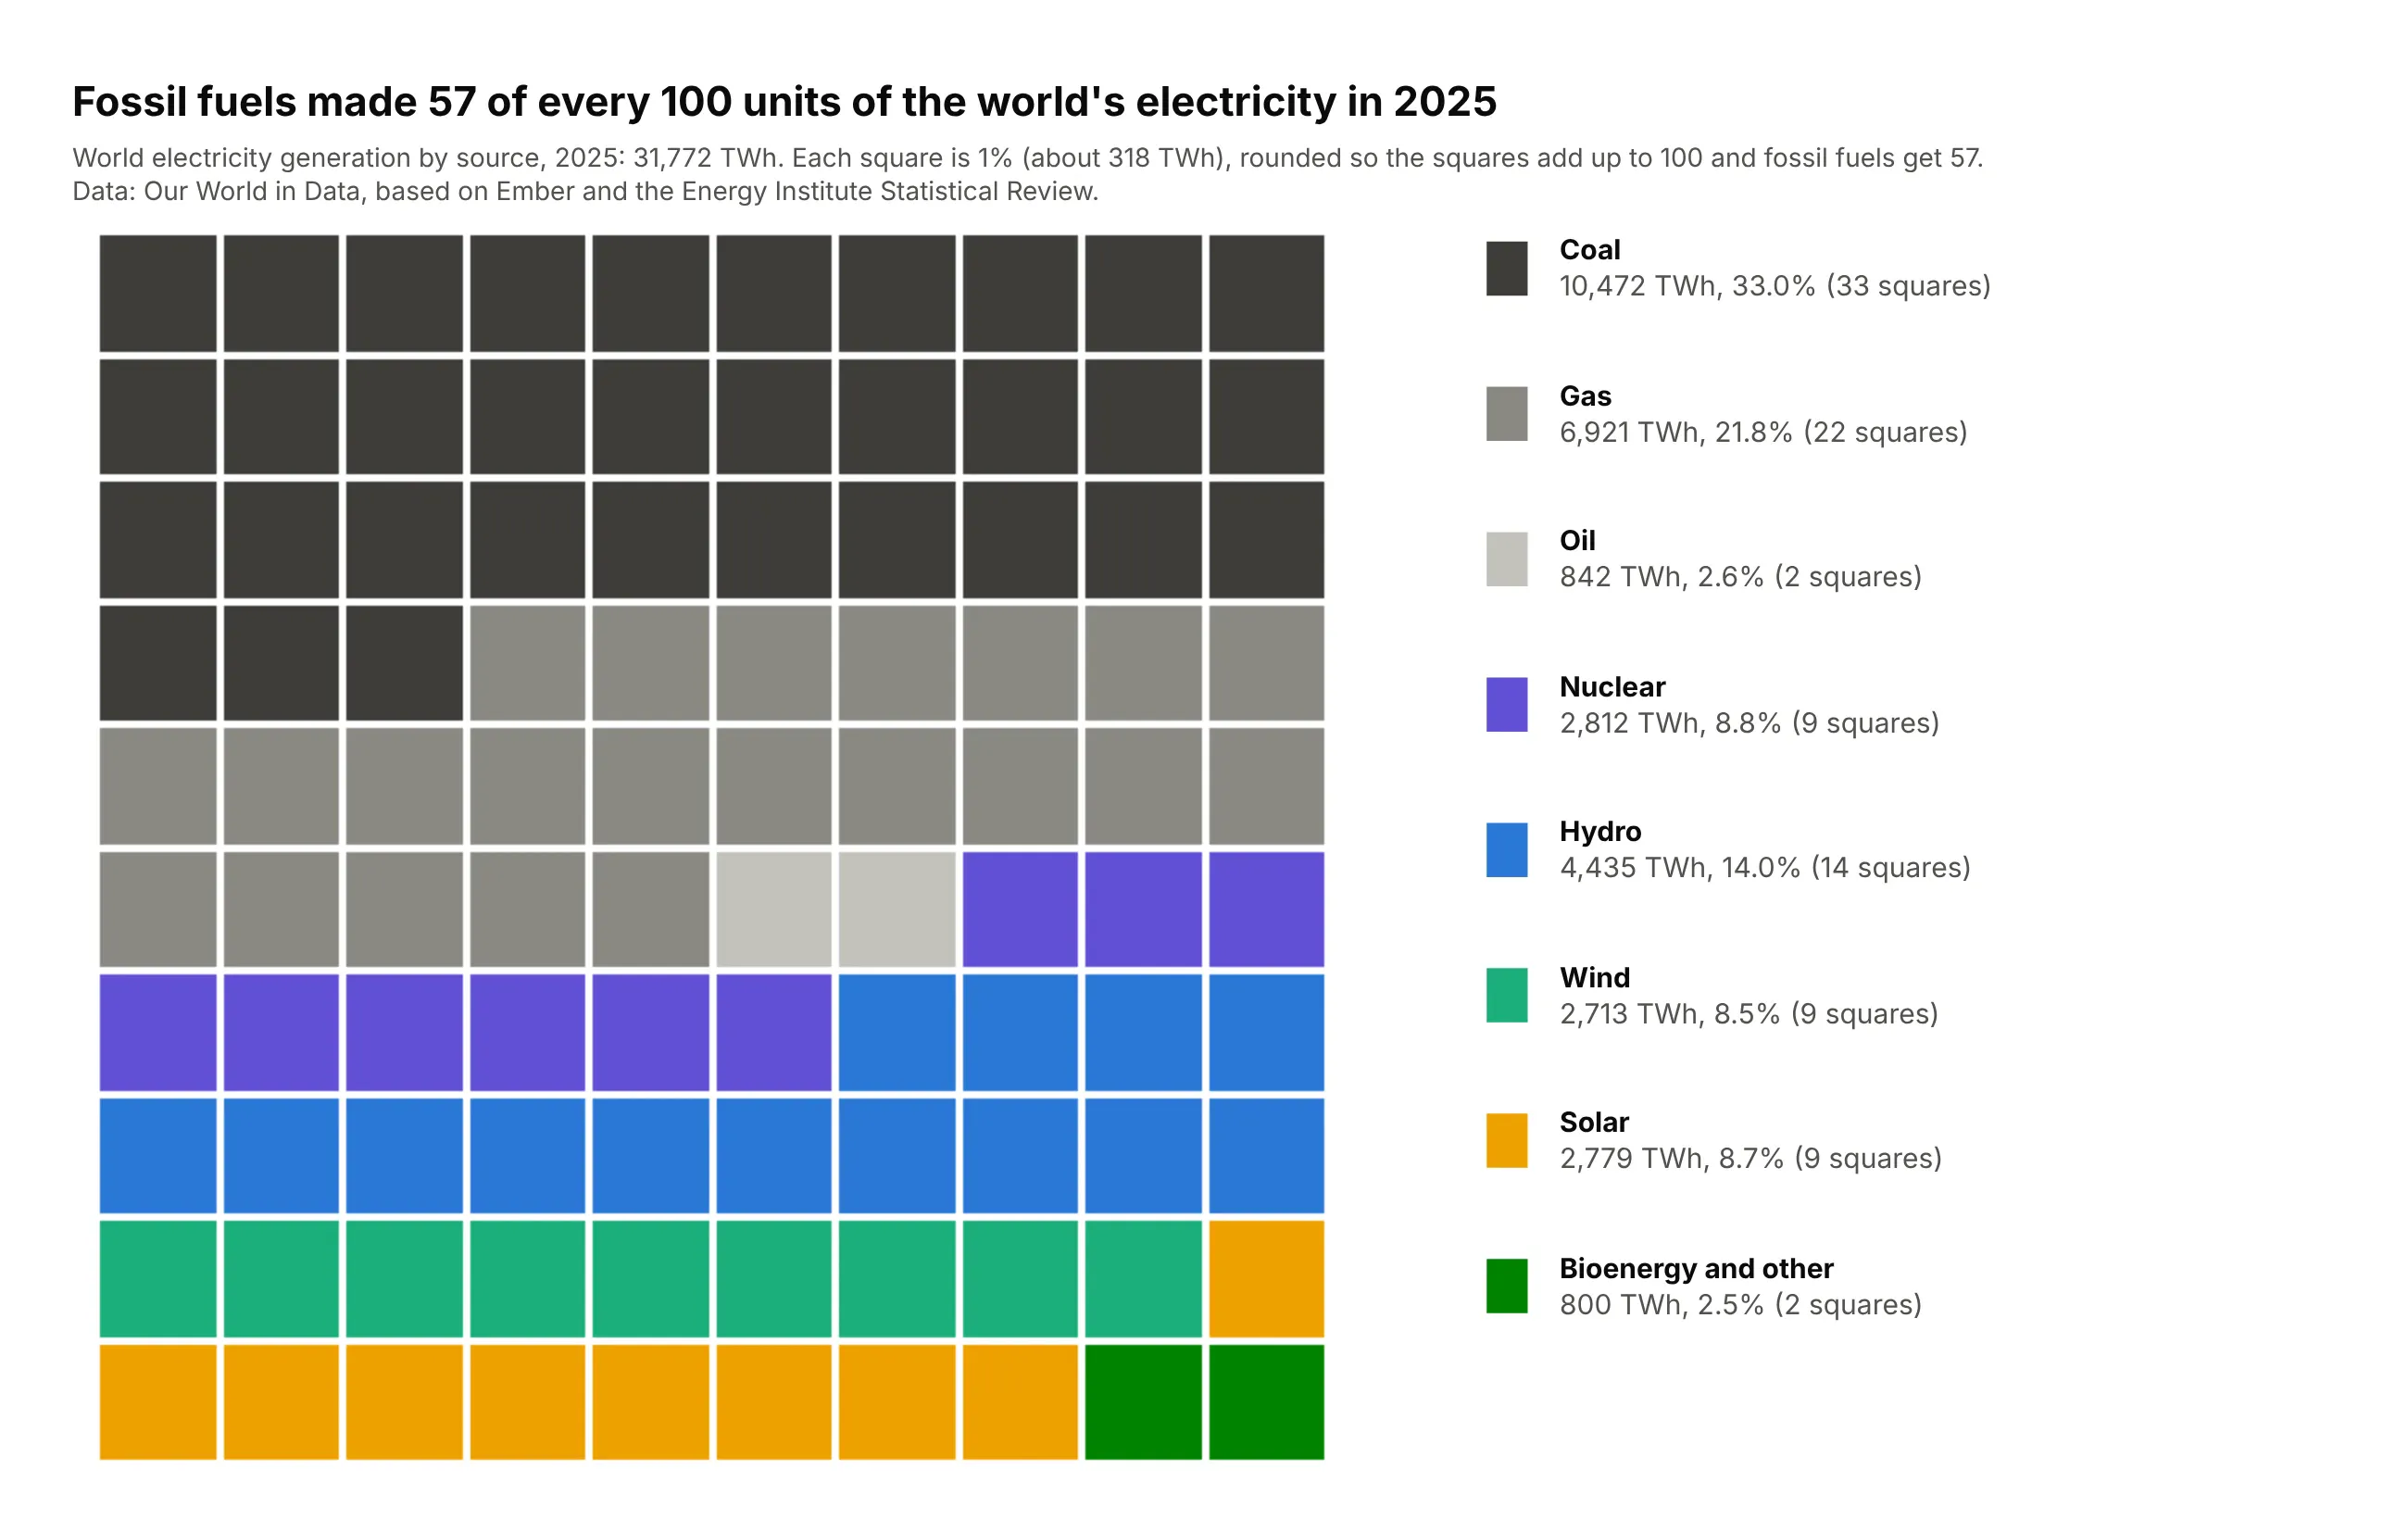
A waffle chart is a grid of squares, usually 10 x 10, where each square is 1% or one unit of a whole and the squares are colored by category. Use one when the message is a count out of a whole ("44 of every 100 people") for a handful of categories. Also known as square pie charts and square charts.
Read the complete guide to waffle charts
Ternary plot
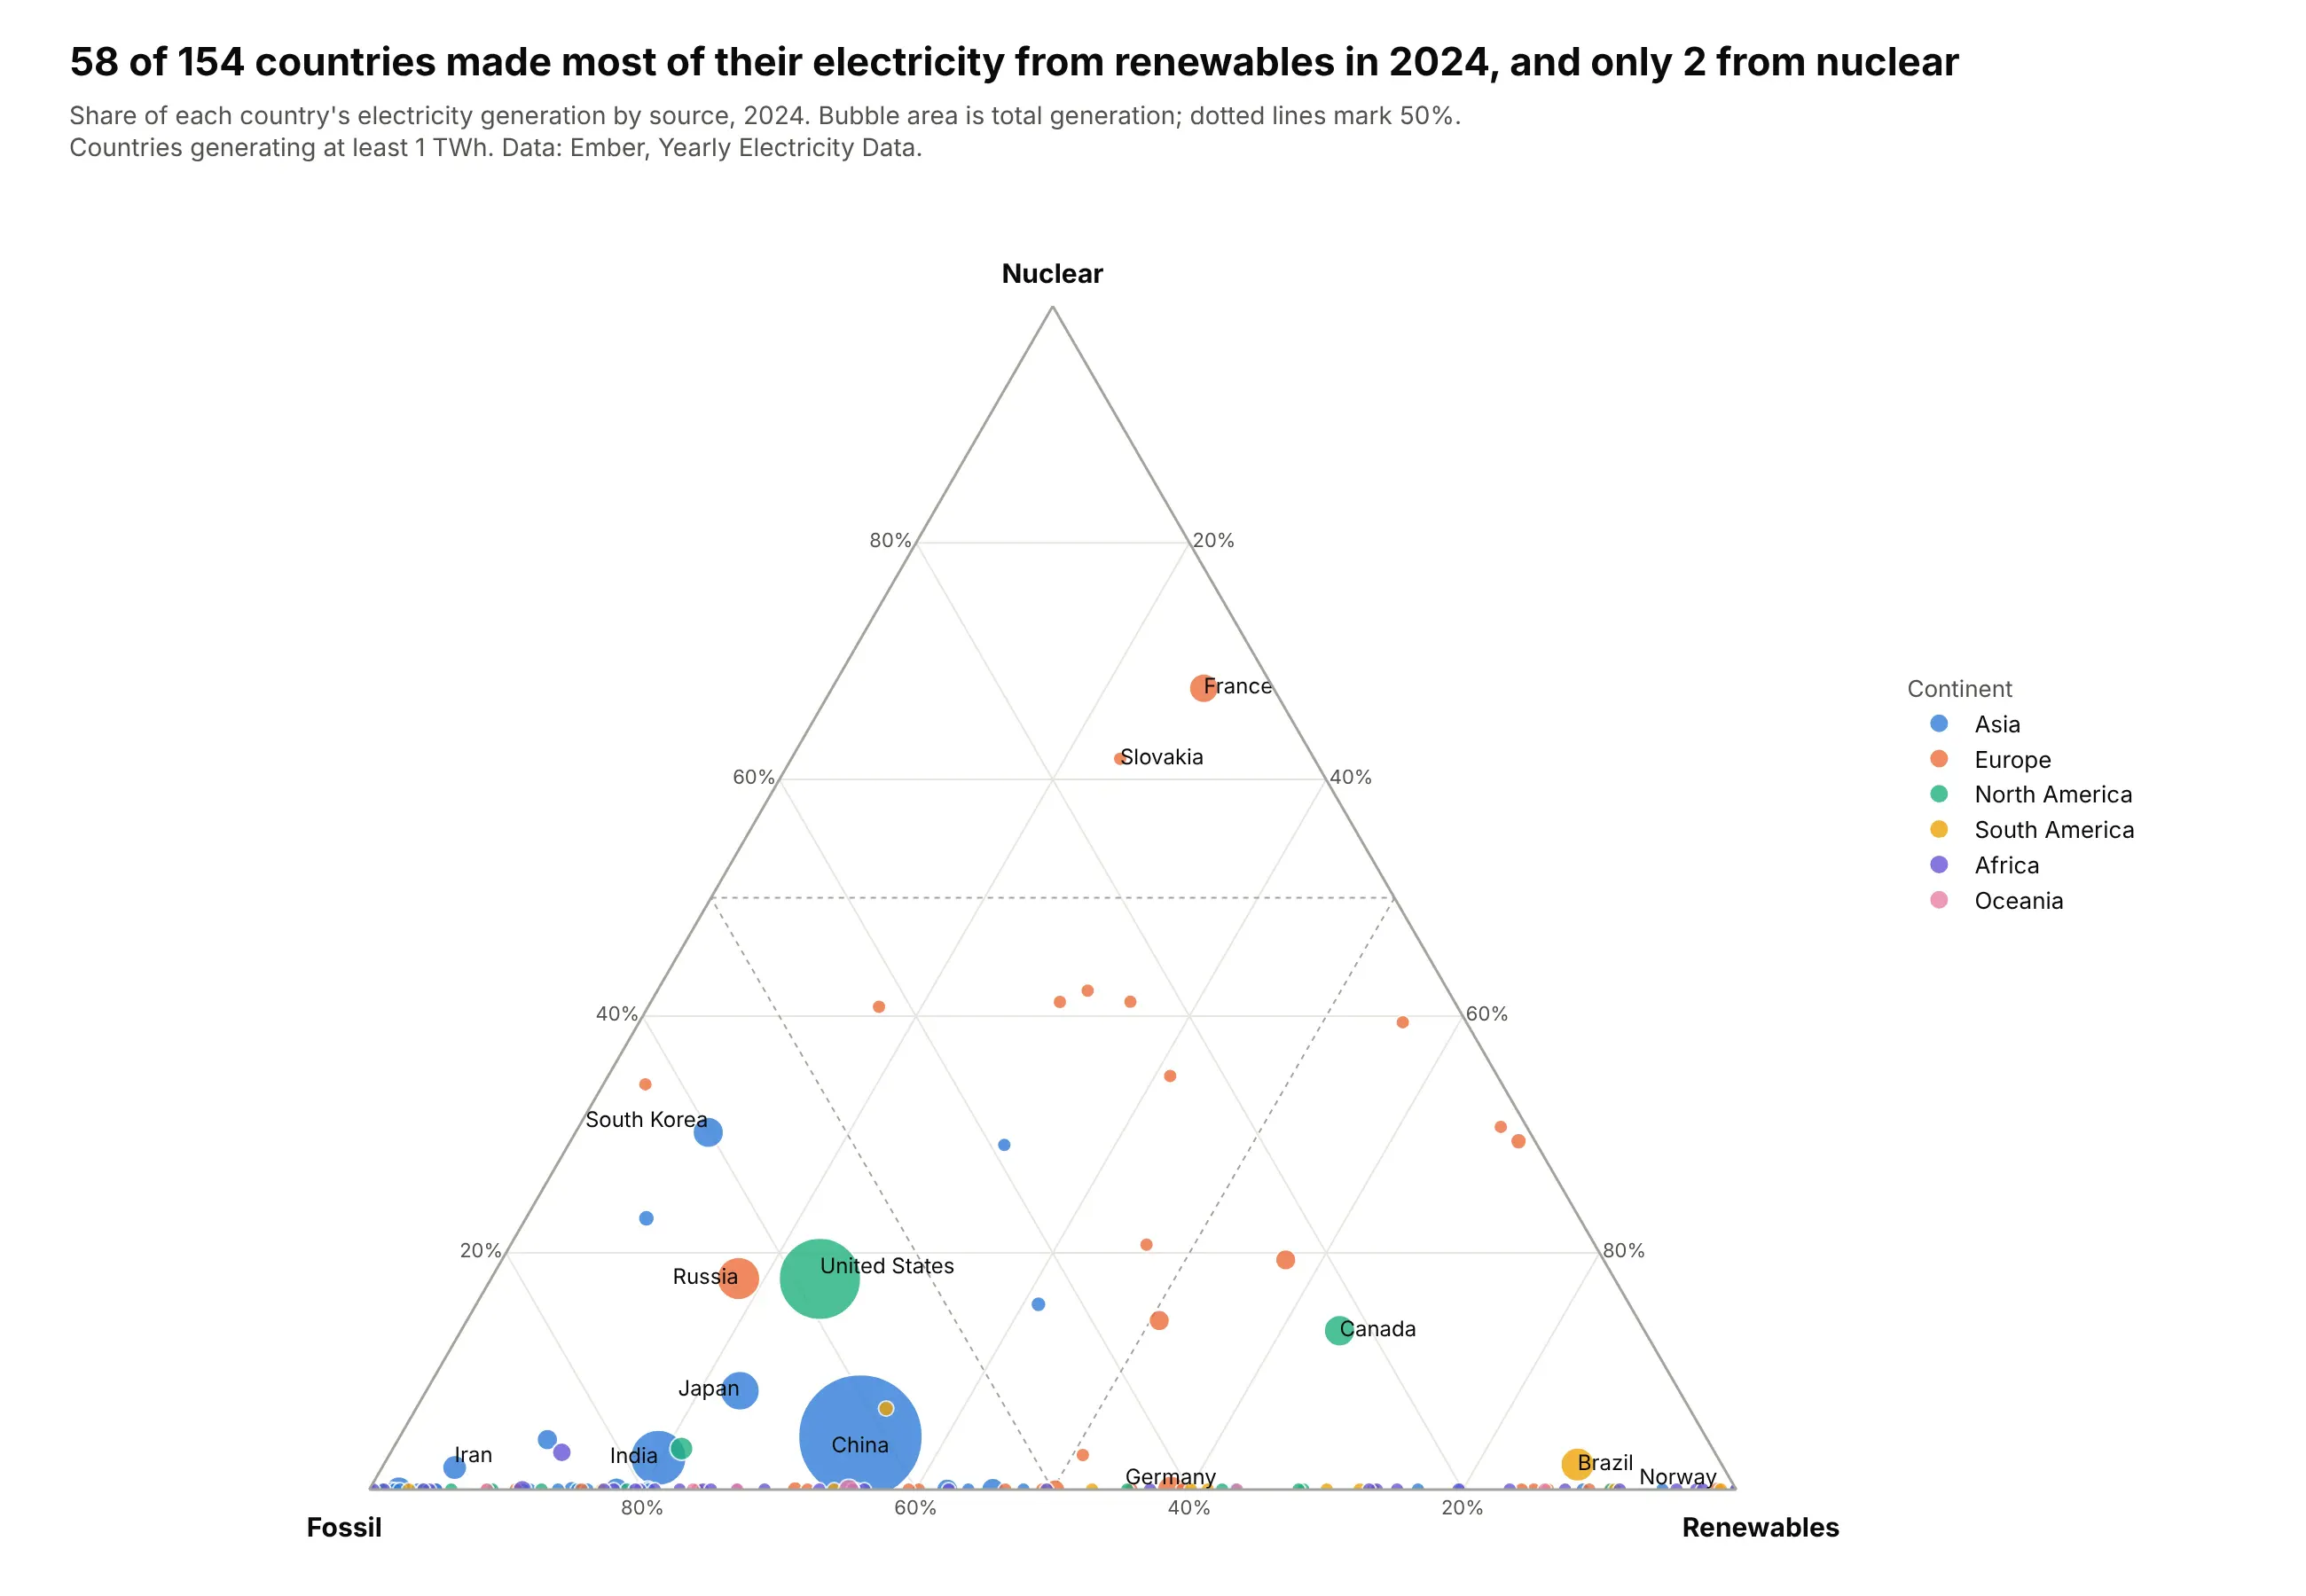
A ternary plot draws items that split into three parts adding up to 100% as points in a triangle, so a point's position shows the whole split at once. Use one for many items with a three-way split, such as electricity mixes, vote shares, soil, diets or budgets. Also known as ternary diagrams, ternary graphs, triangle plots and Gibbs triangles.
Read the complete guide to ternary plots
UpSet plot
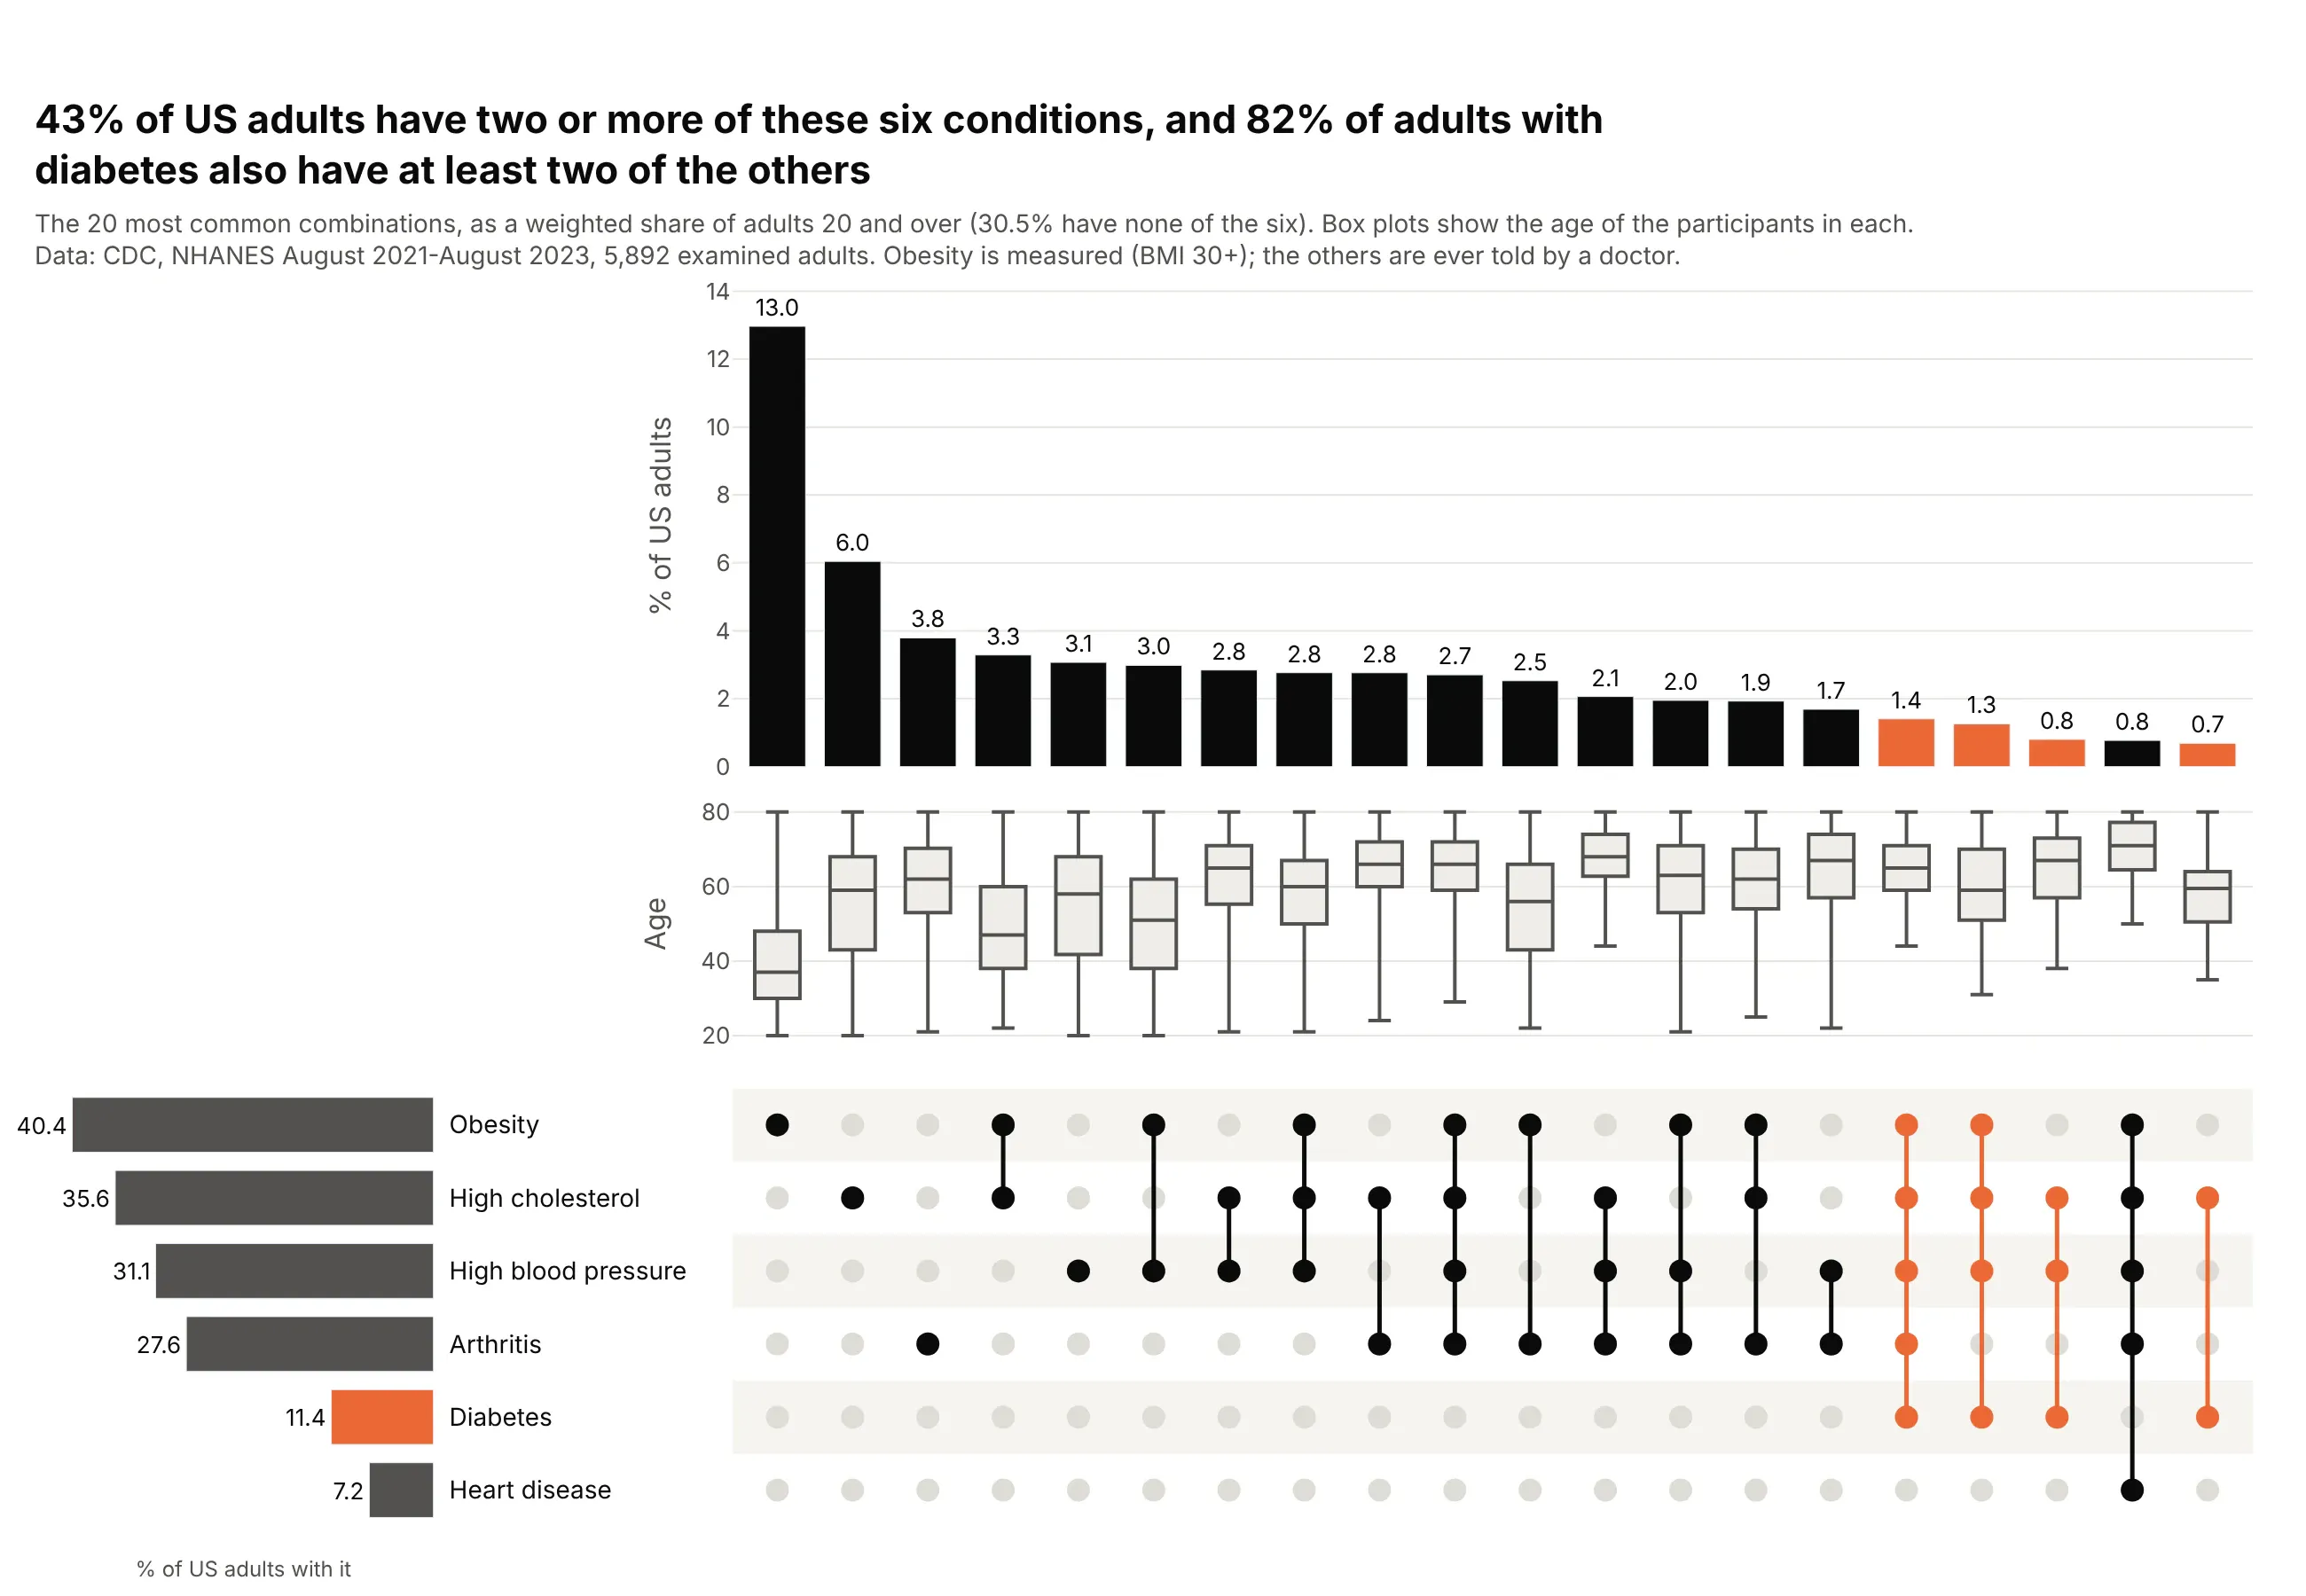
An UpSet plot shows how sets overlap, with one bar per combination of sets and a dot matrix underneath that says which sets each bar is. It replaces the Venn diagram once you have more than three sets, because six sets already have 63 possible combinations.
Read the complete guide to UpSet plots
Charts for flows and processes
These charts show how a quantity moves from one stage or state to the next, or how things connect.
Sankey diagram
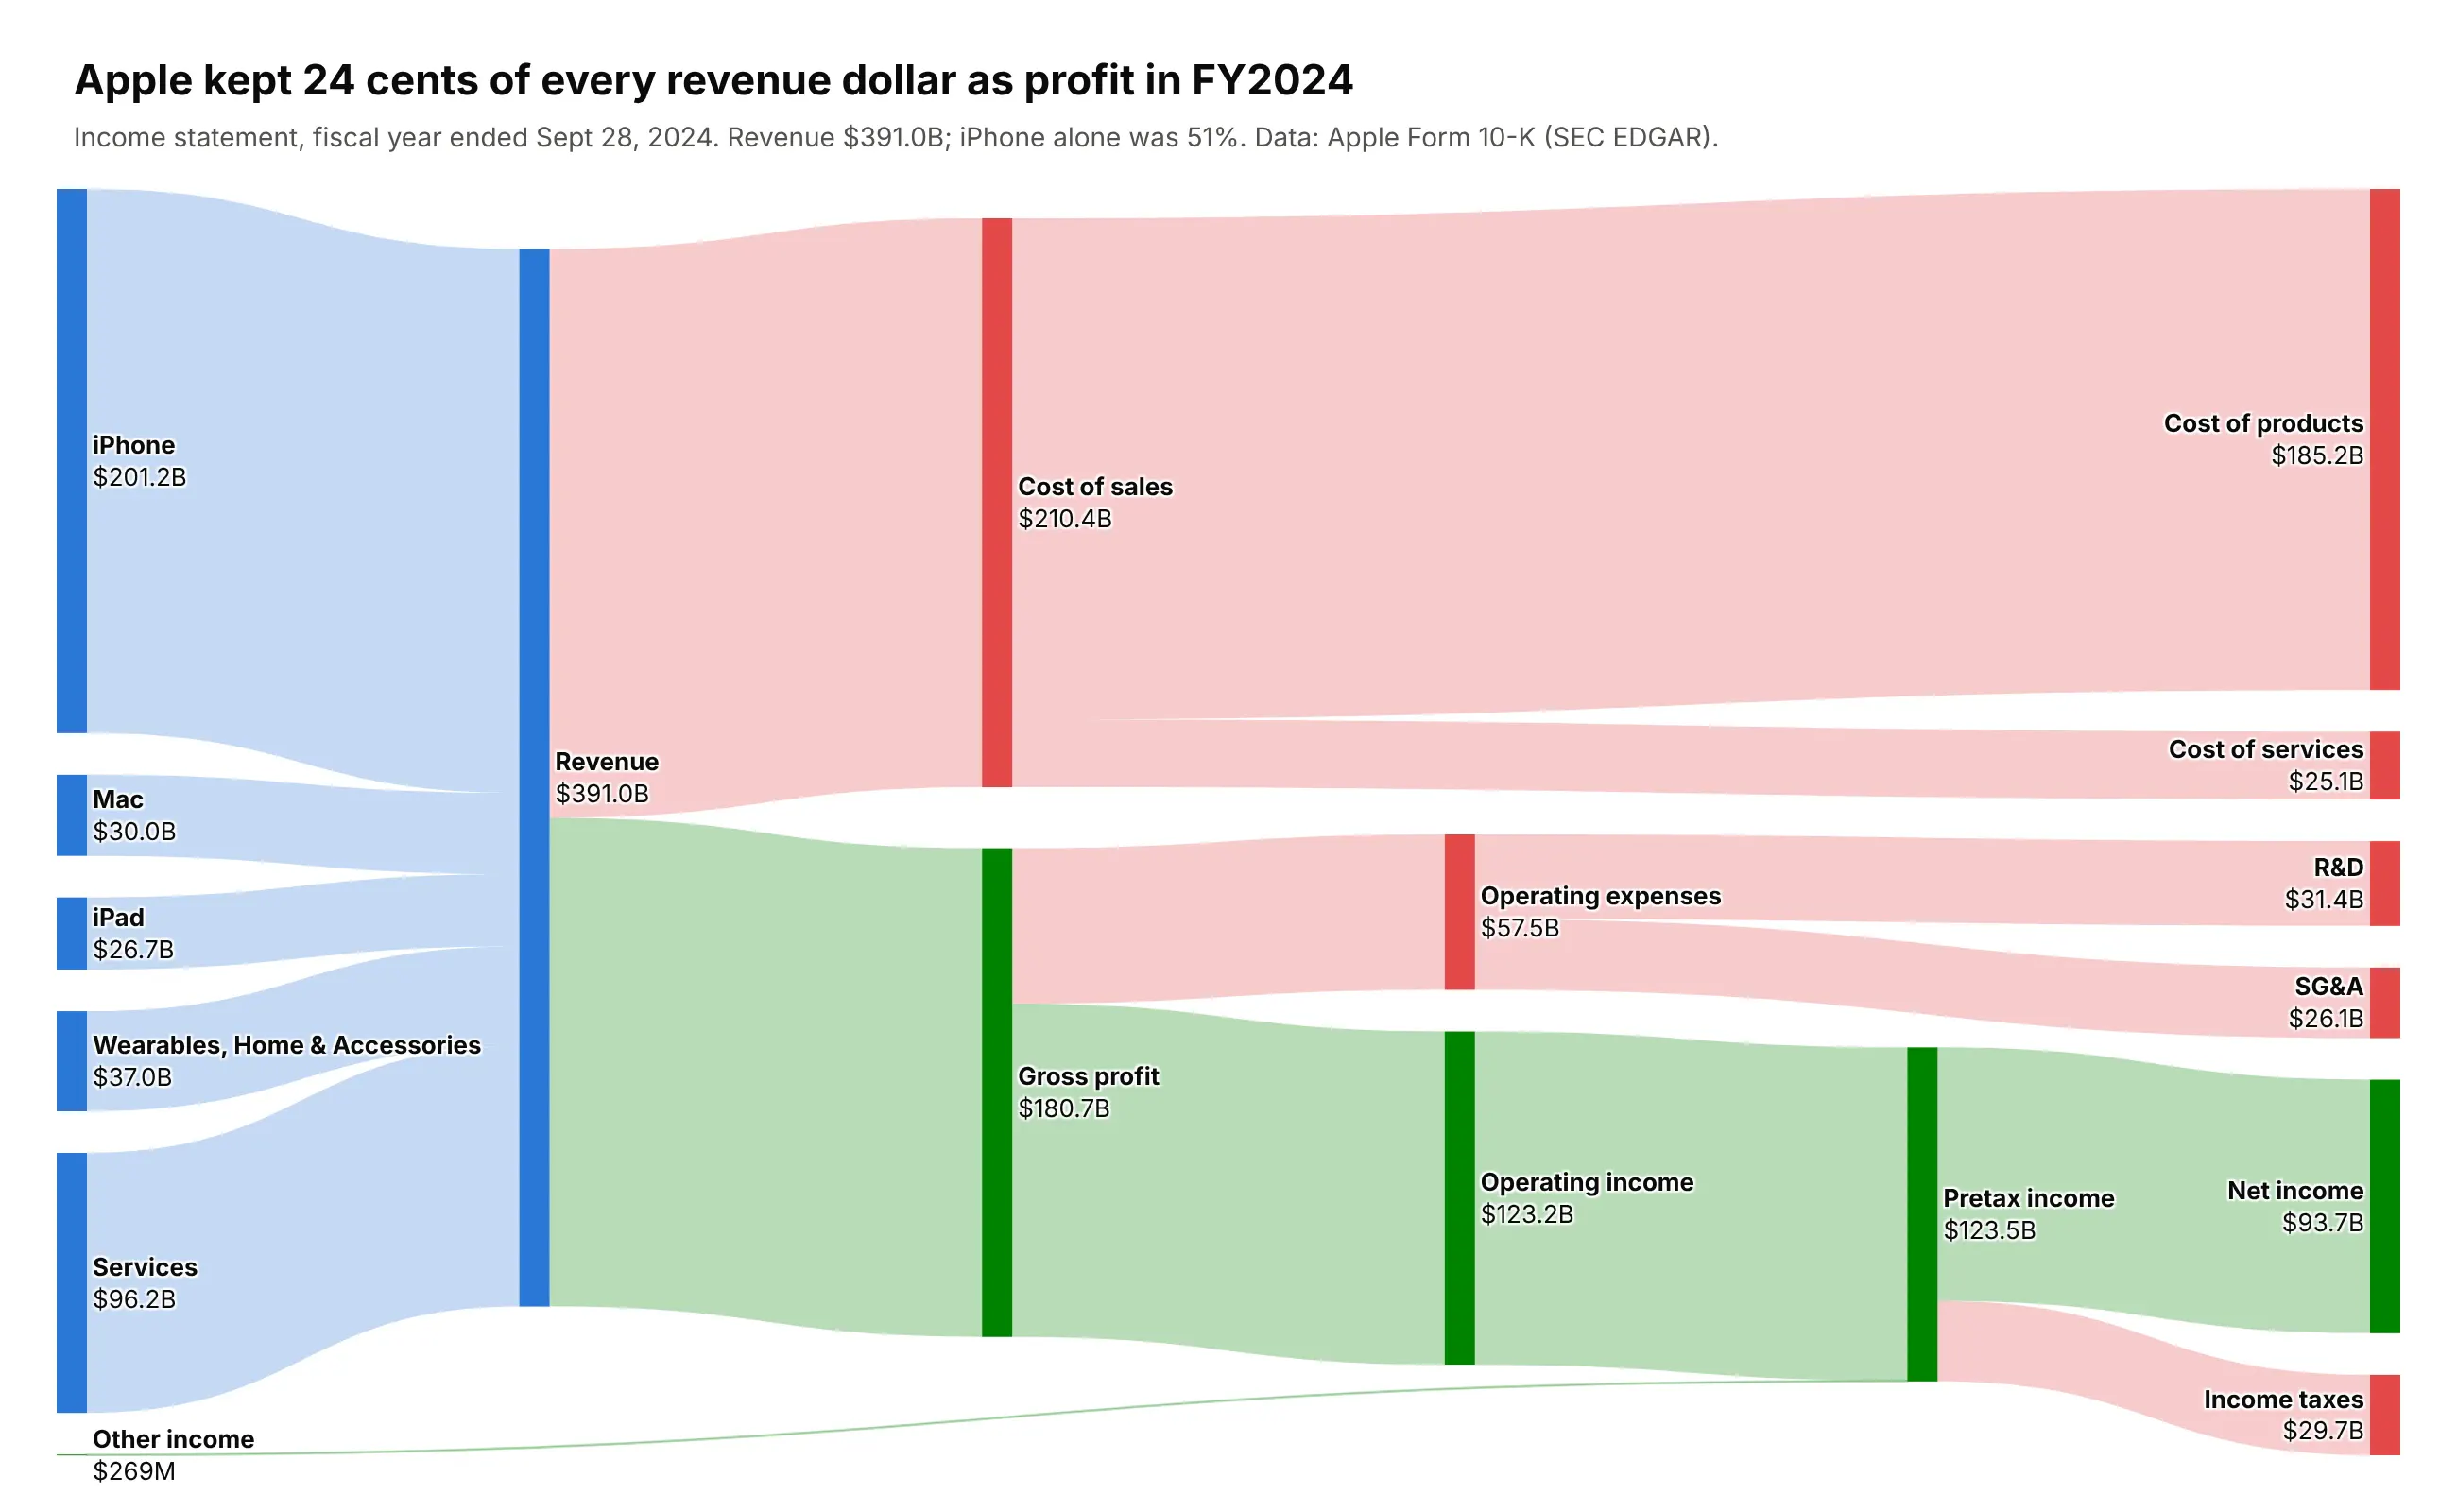
A Sankey diagram draws quantities flowing between stages as ribbons whose width is proportional to the flow, so you can see where a total comes from, how it splits and where it ends up. Use one for money, energy, materials, funnels and people moving between states. Also known as Sankey charts.
Read more about Sankey diagrams
Waterfall chart
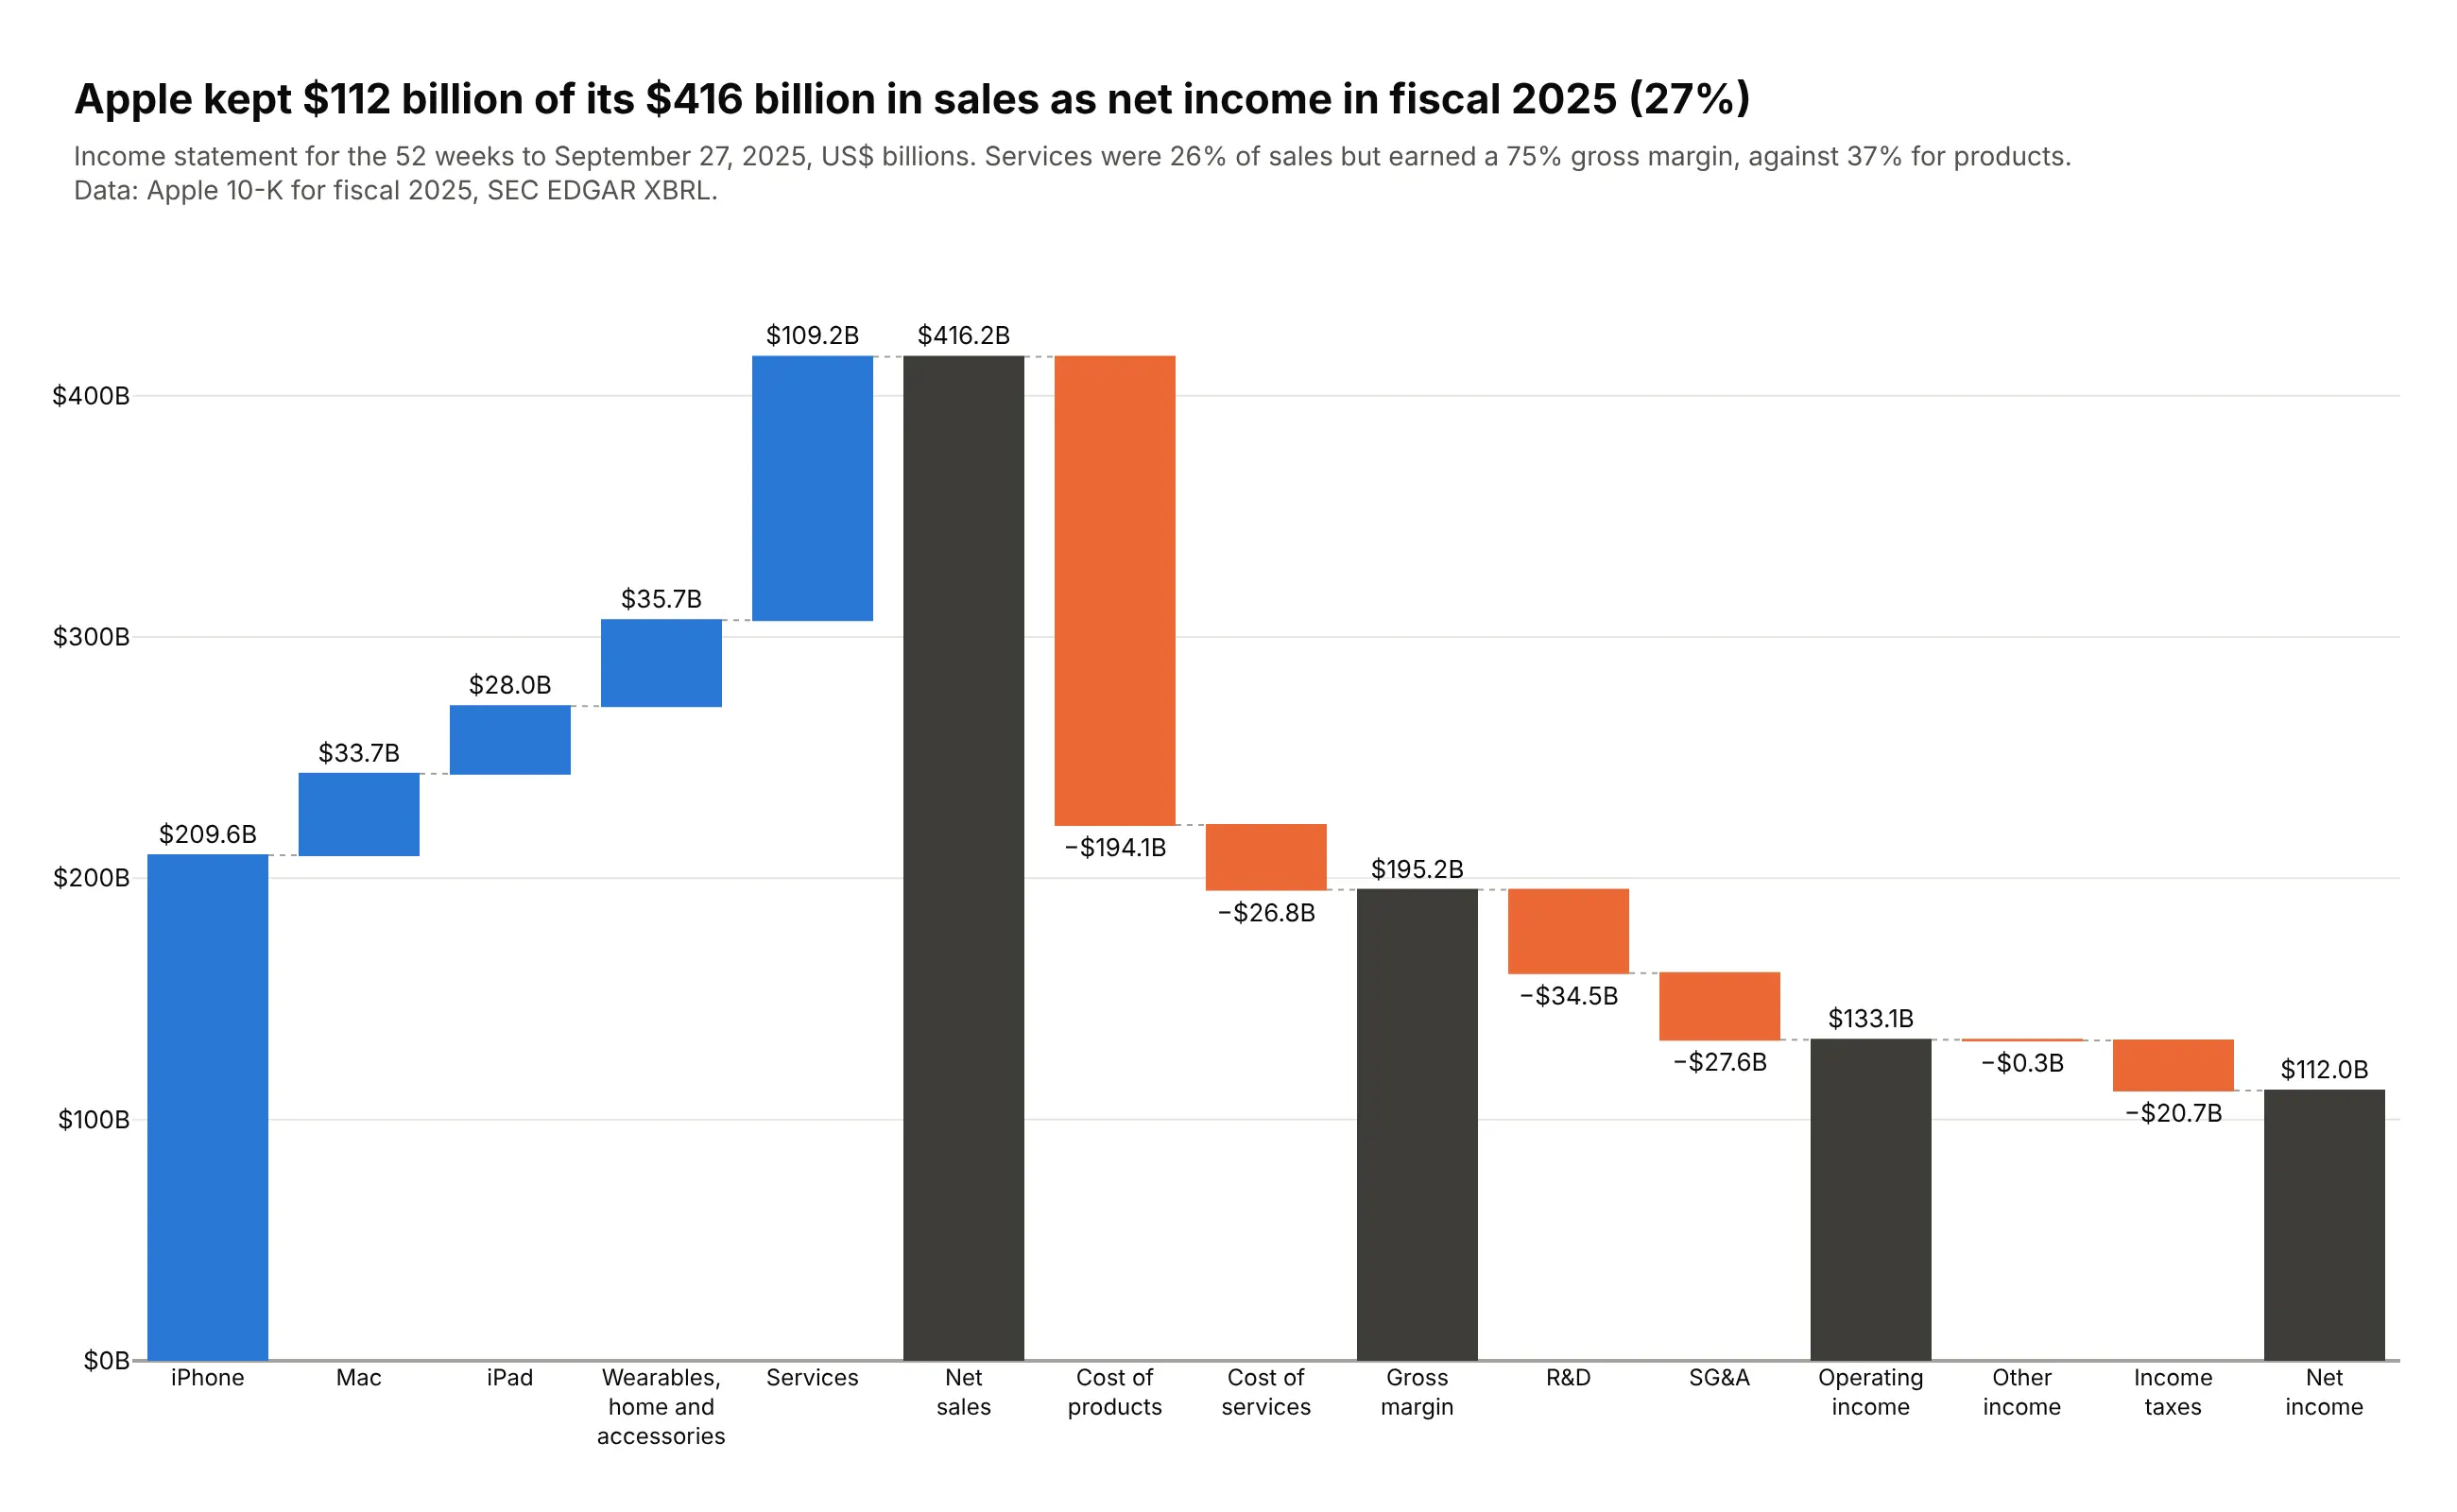
A waterfall chart shows how a starting value becomes an ending value through a series of increases and decreases, with each bar starting where the previous one ended. Use one for anything that is a sum of signed steps, such as an income statement, a bridge from last year to this year or a cash flow. Also known as bridge charts, cascade charts and flying bricks charts.
Read the complete guide to waterfall charts
Funnel chart
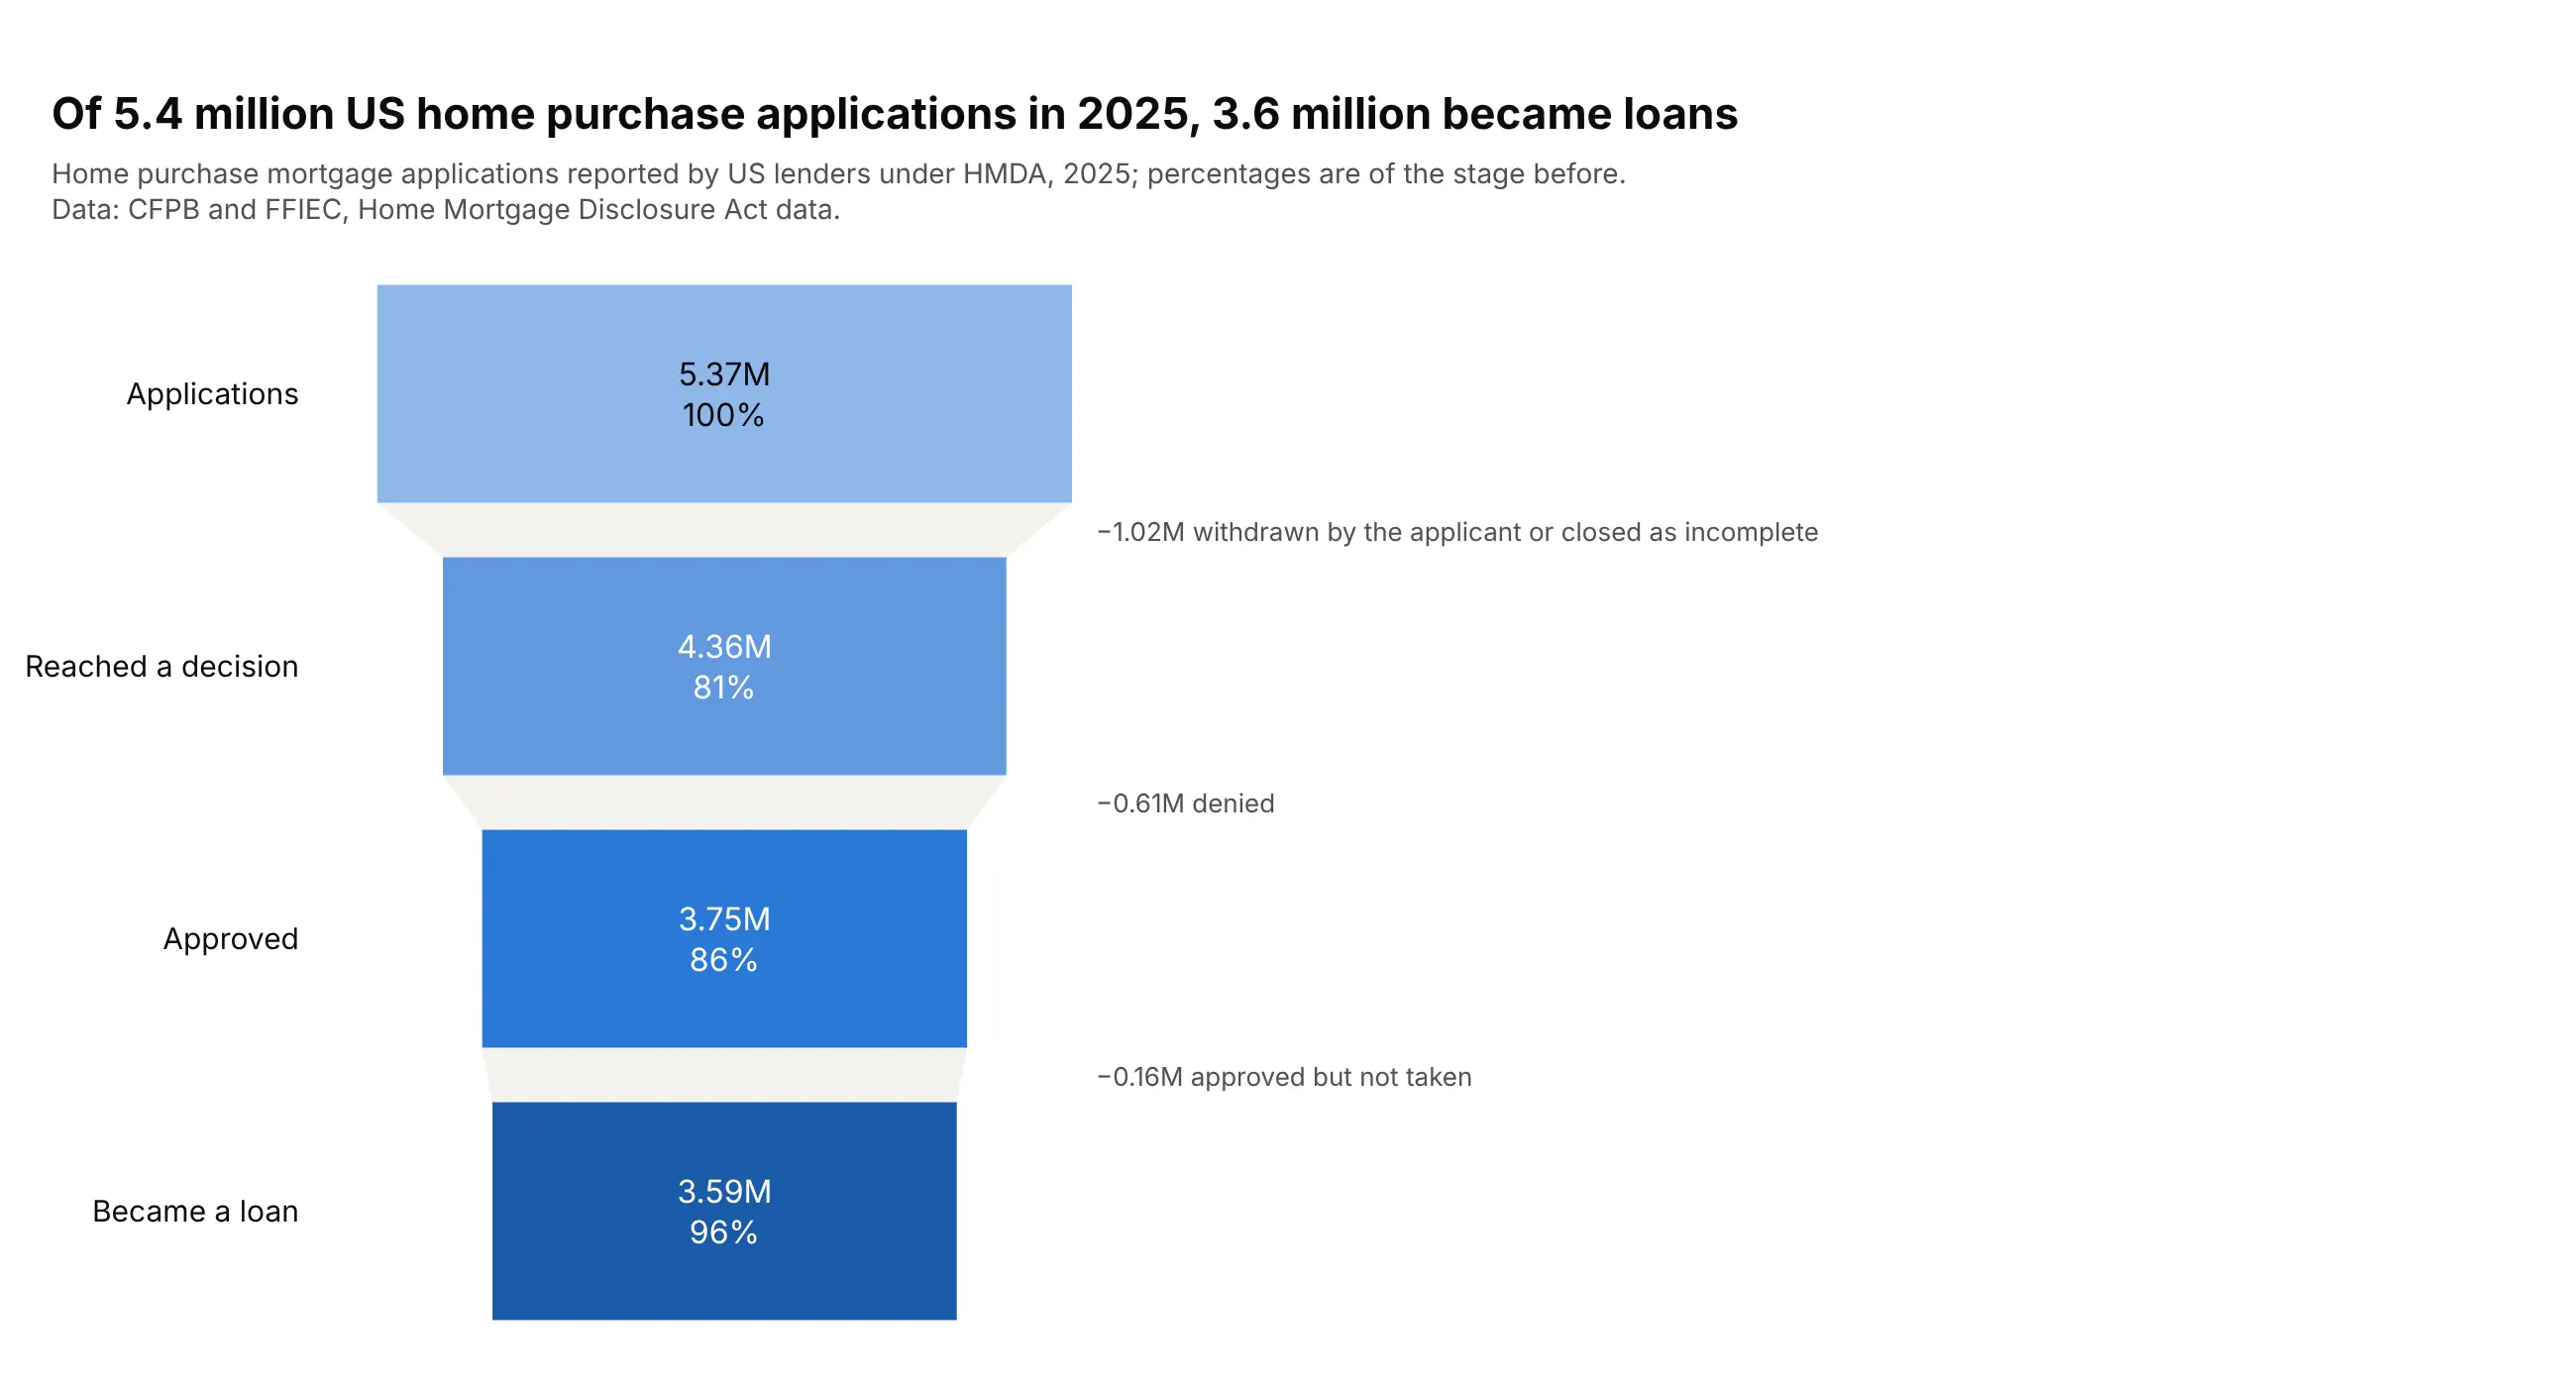
A funnel chart shows how many items reach each stage of a process, one bar per stage in order, so you can see where they drop out. Use one when every stage is a subset of the one before, such as applications that become loans or drugs that reach approval.
Read the complete guide to funnel charts
Network graph
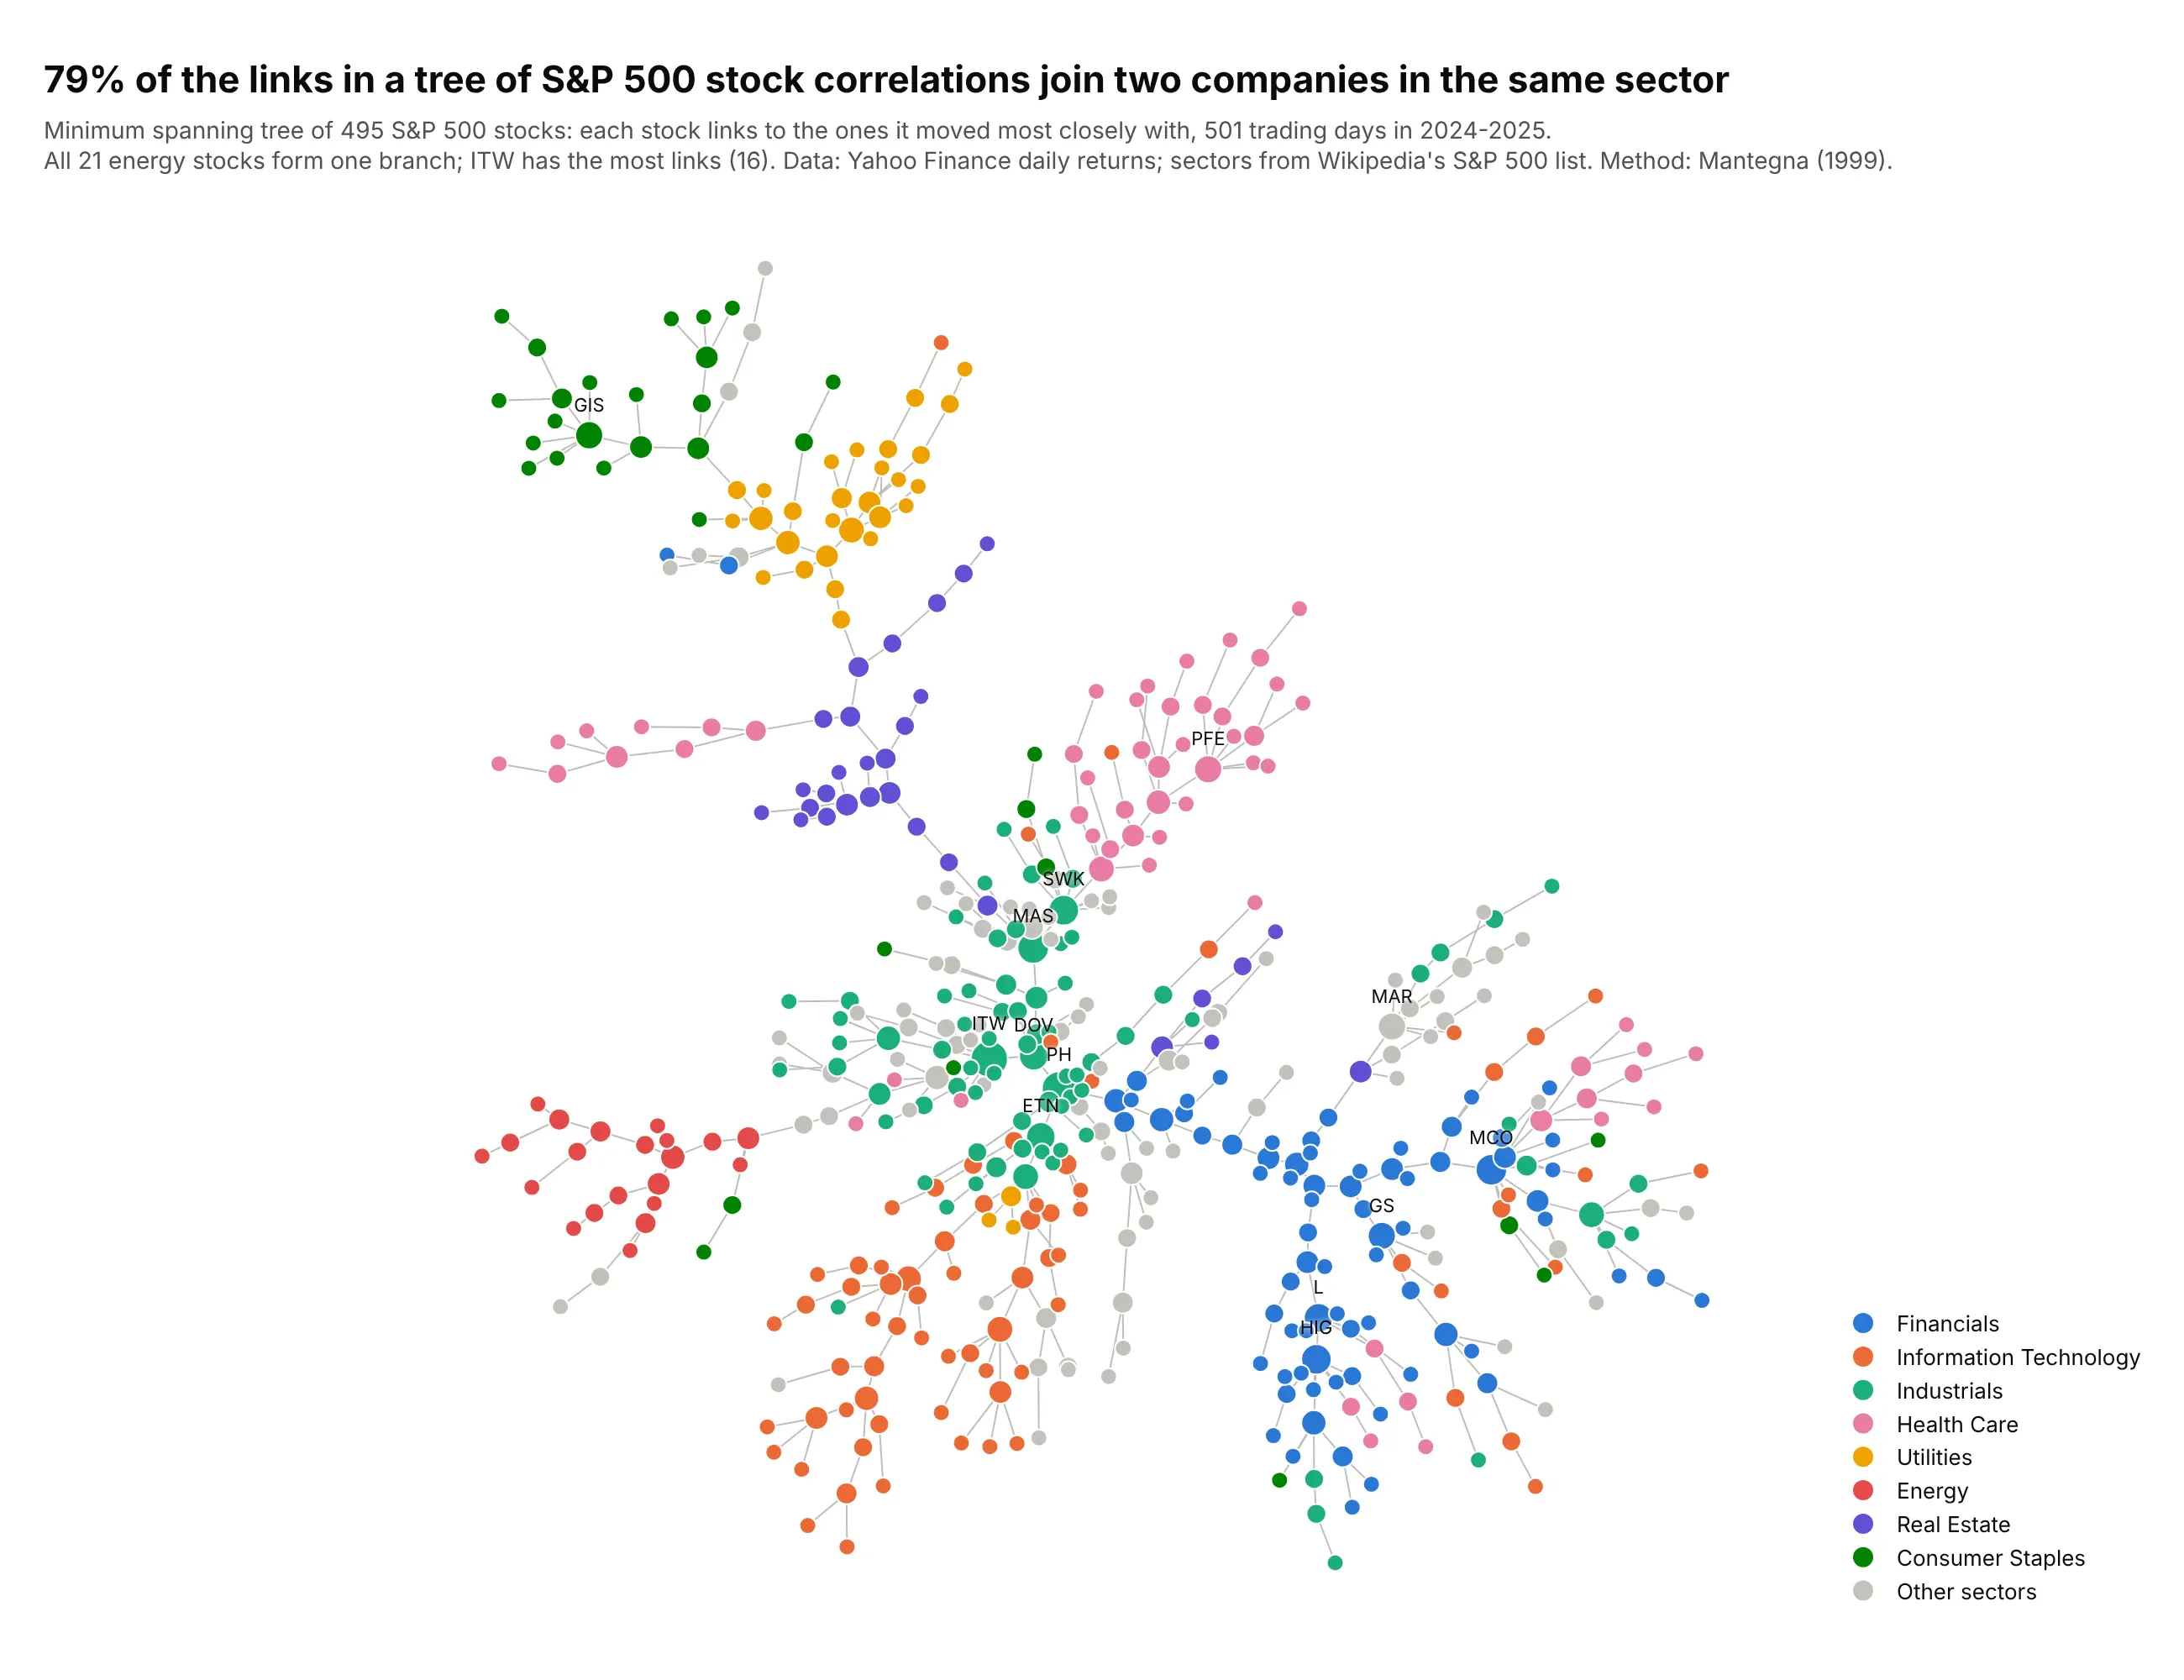
A network graph draws things as dots and the connections between them as lines, so clusters, hubs and bridges become visible. Use one when the links are the point, as in grids, pipelines, payments, supply chains and dependencies. Also known as network diagrams, node-link diagrams and network maps.
Read the complete guide to network graphs
Charts for change over time and rankings
A line chart is still the default for one value over time. These charts handle the cases it doesn't: rankings that reshuffle, many categories at once, prices with a range inside each period and daily patterns.
Slope chart
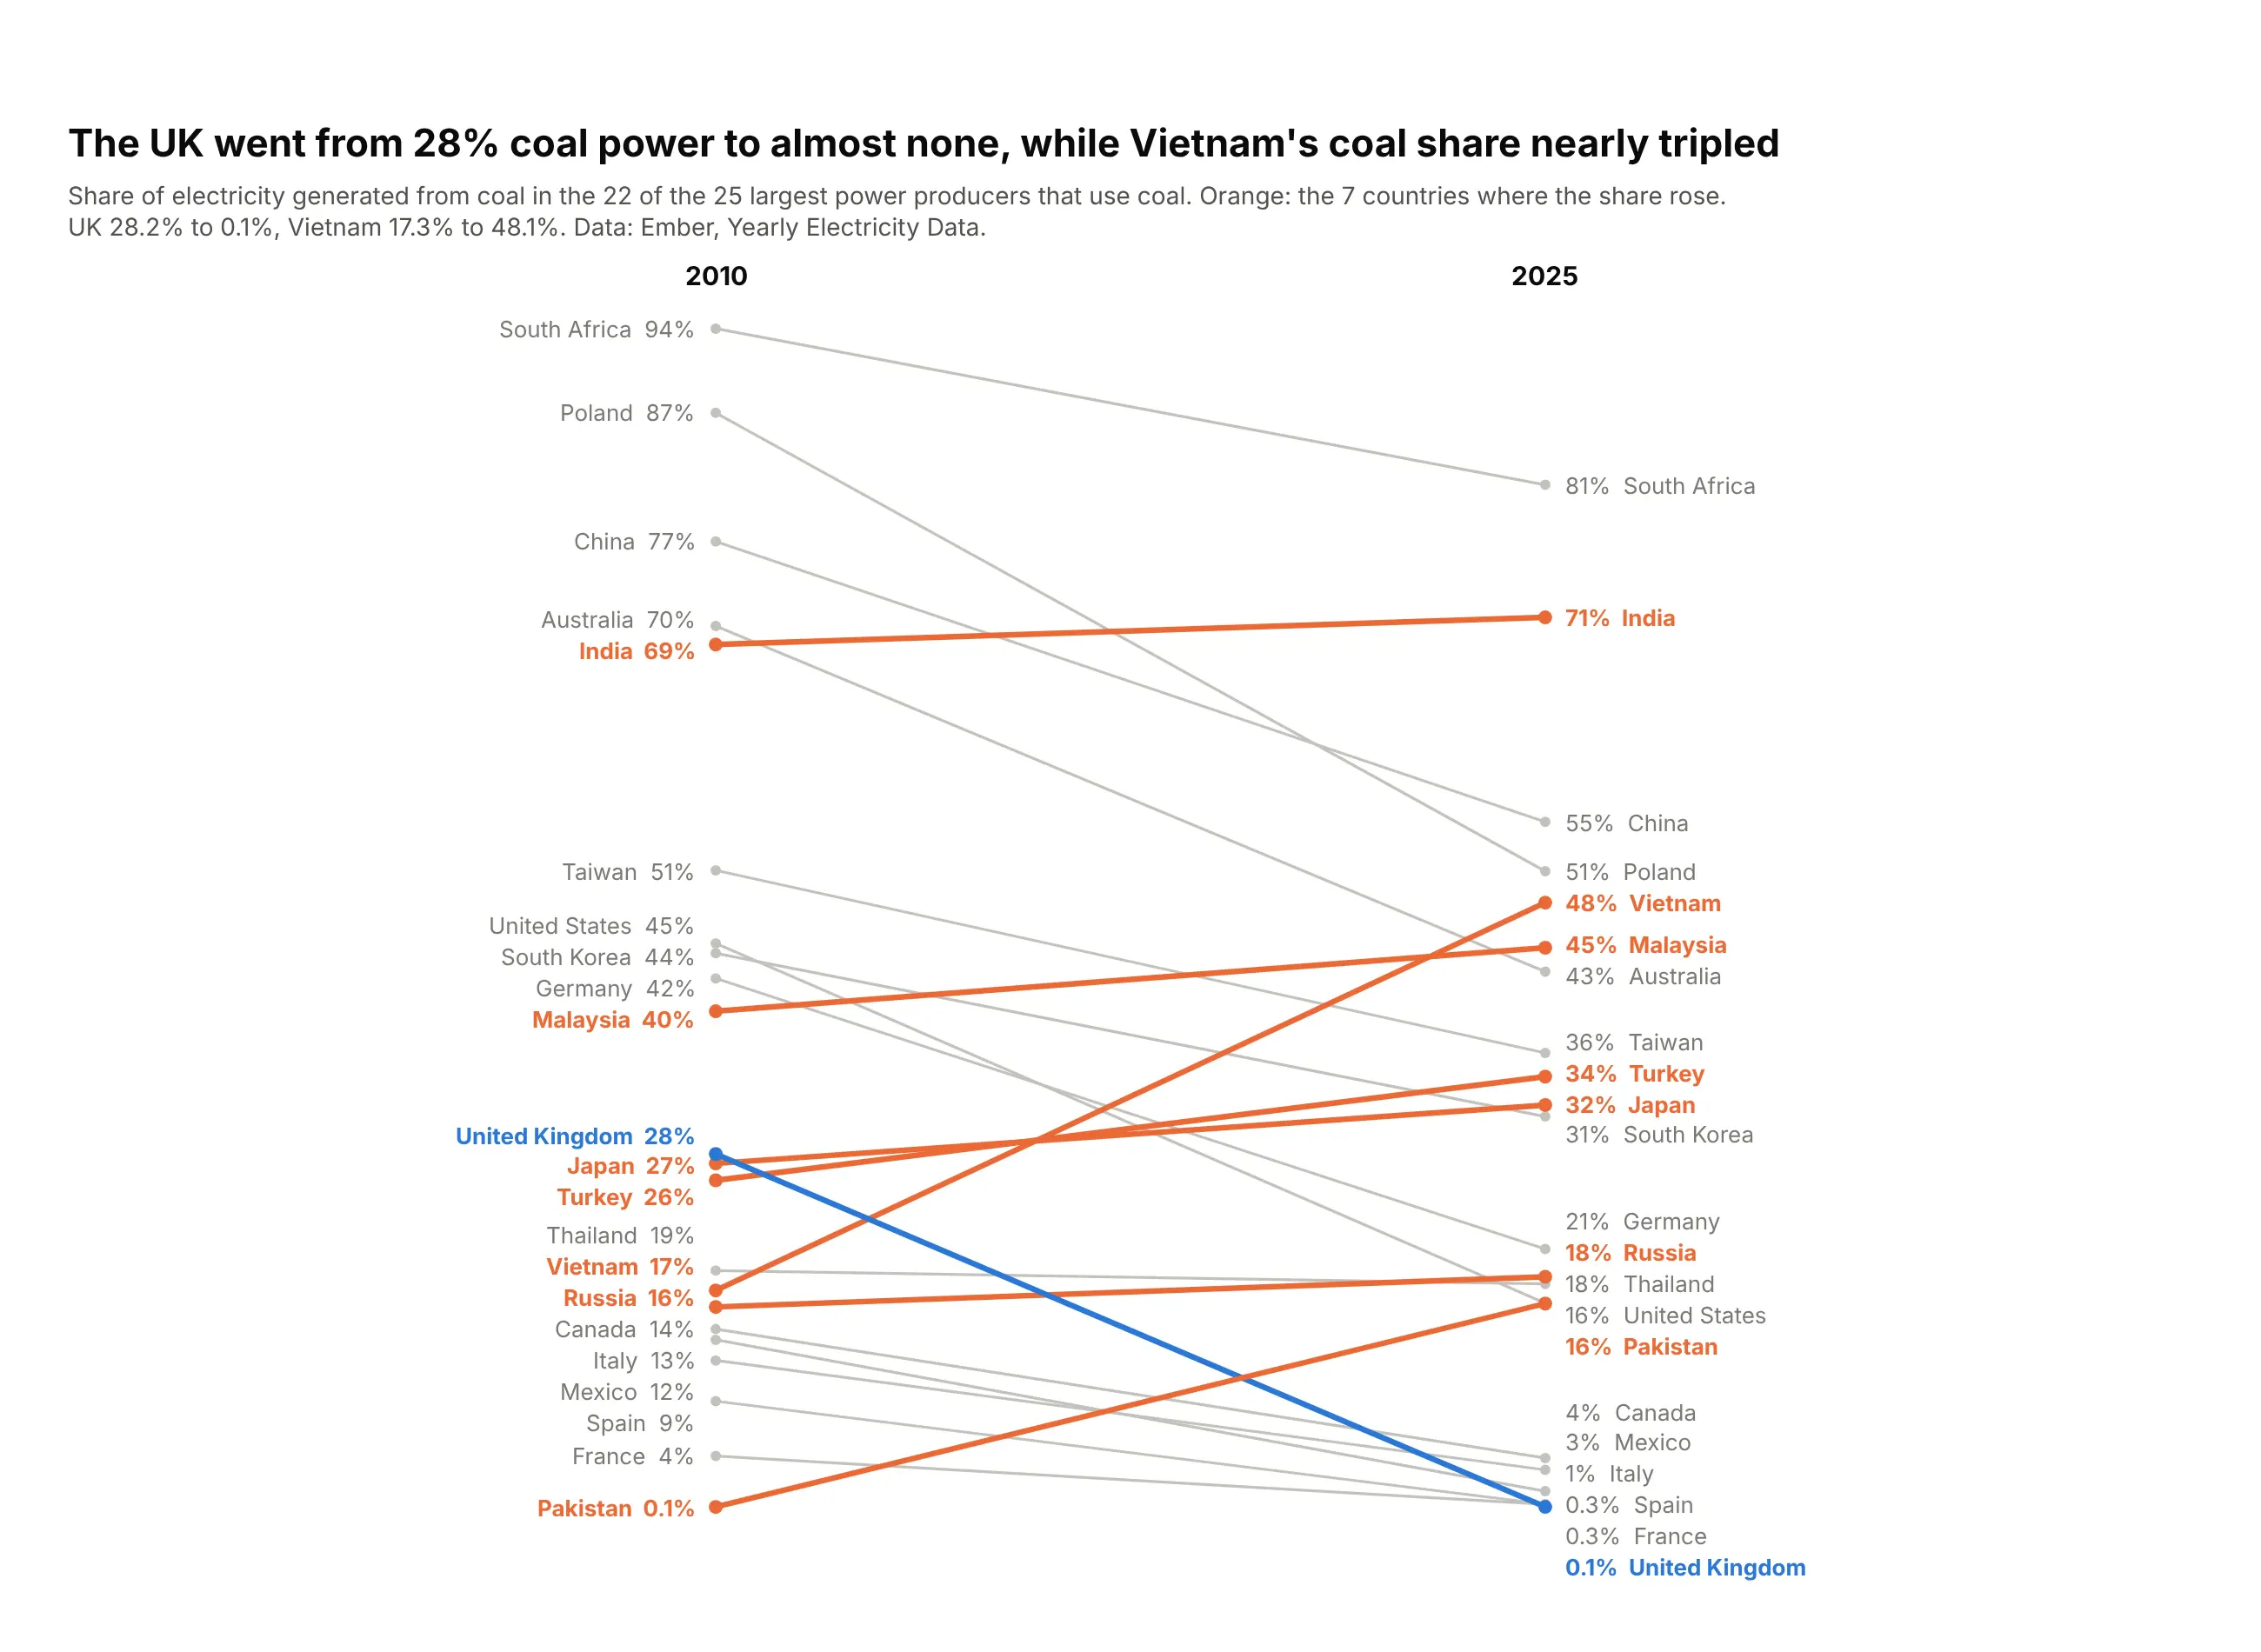
A slope chart draws one line per item between two or three columns, usually two dates, so the slope of each line is the change and the order at each end is the ranking. Use one for before-and-after comparisons of about 5 to 30 items when both the change and the reshuffle matter. Also known as slopegraphs and slope graphs.
Read the complete guide to slope charts
Bump chart
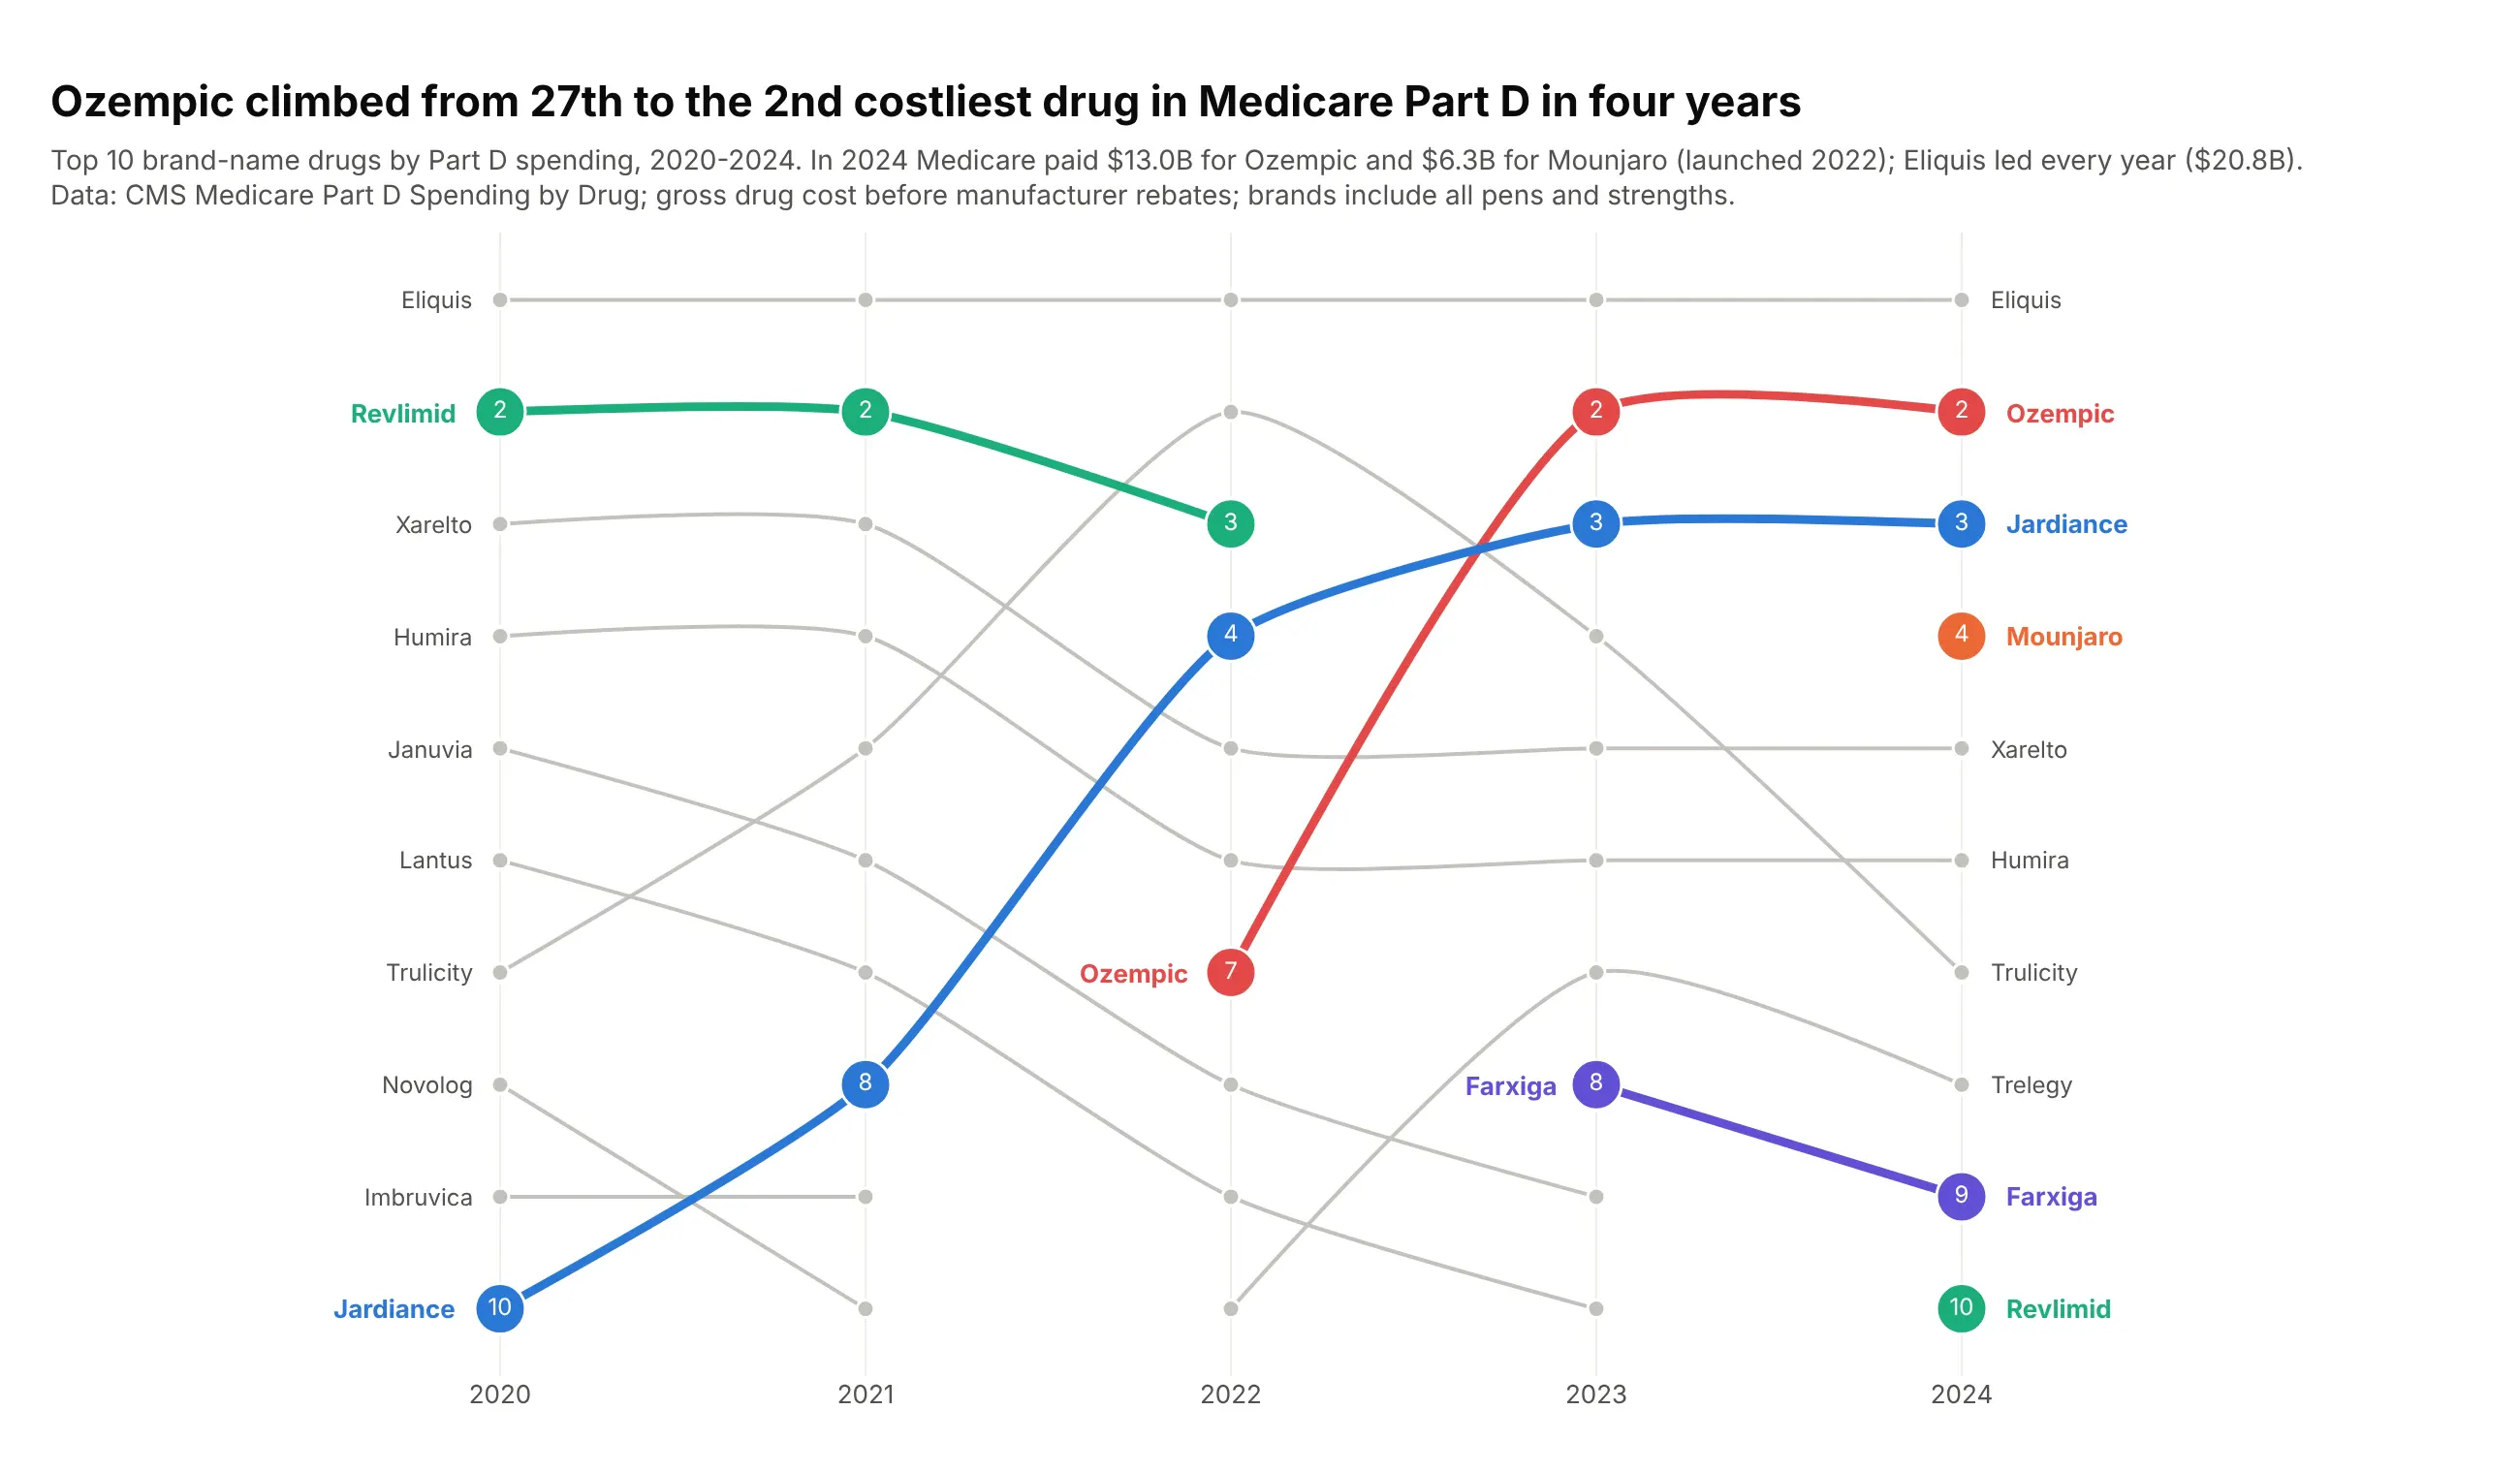
A bump chart shows rankings over time, with one line per item and rank 1 at the top. Use one when the question is who is ahead and when the order changed, such as the largest banks, the costliest drugs or a league table. Also known as bumps charts.
Read the complete guide to bump charts
Streamgraph
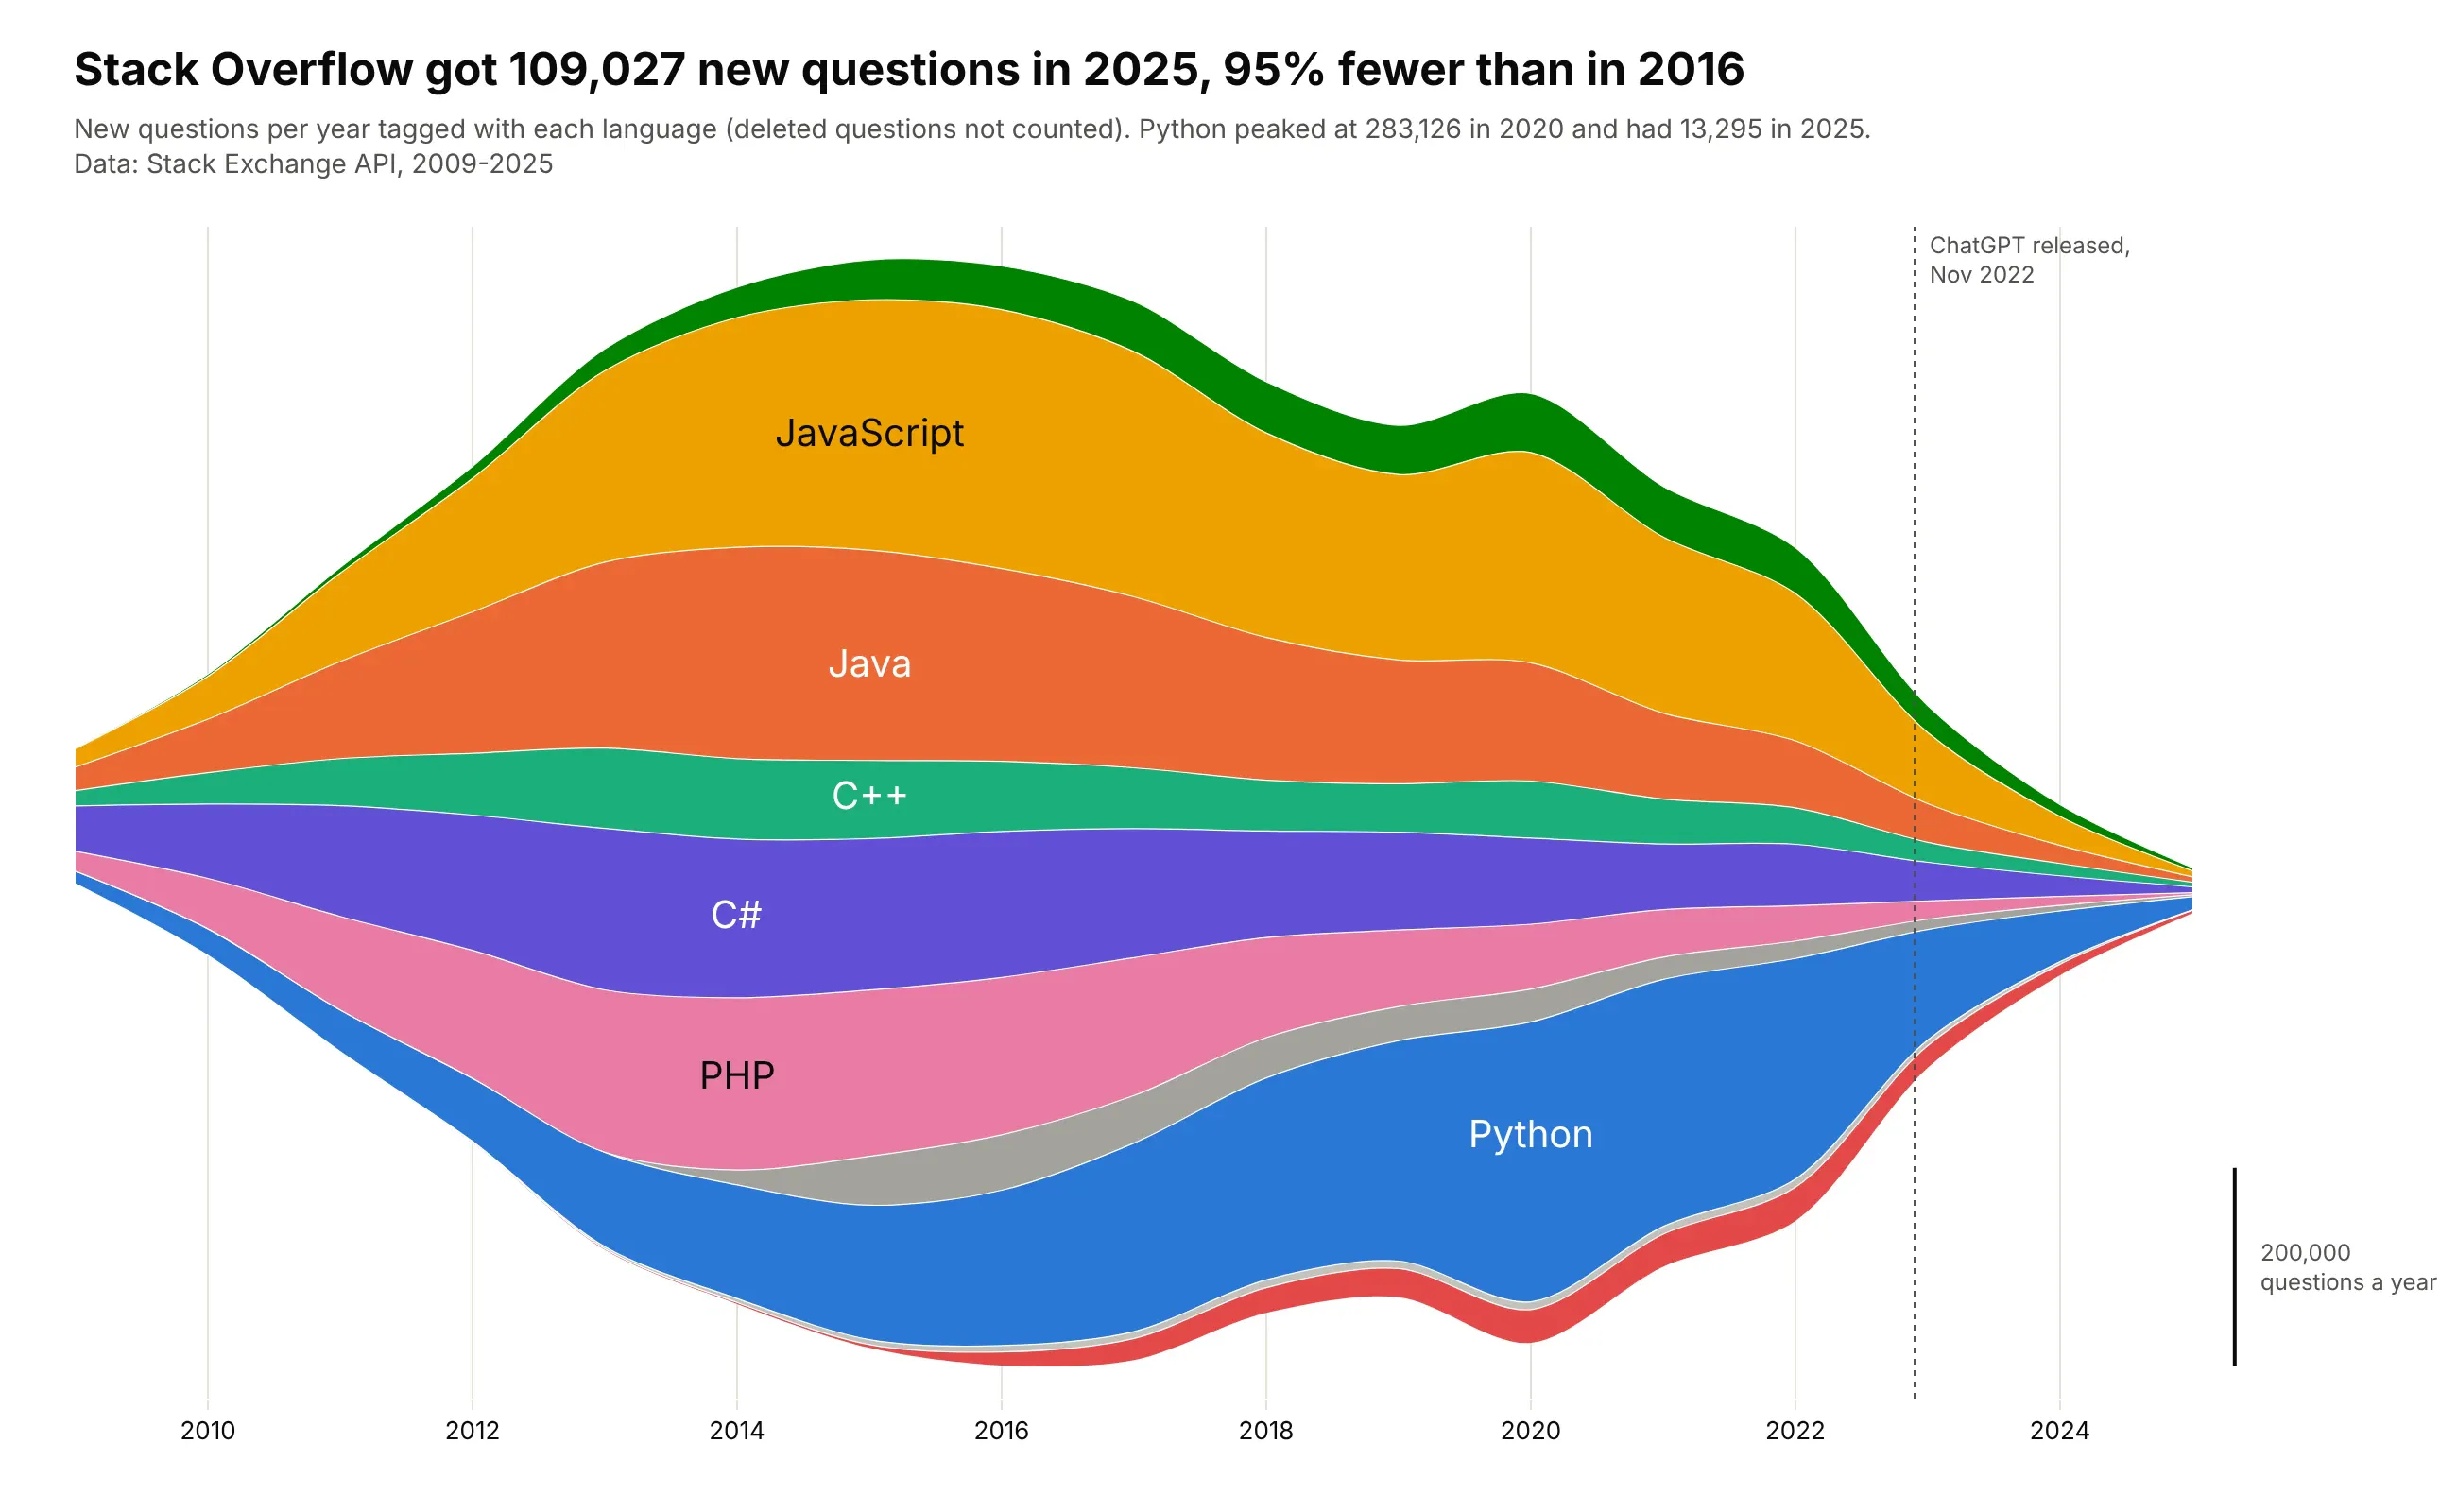
A streamgraph is a stacked area chart whose layers float around a center line instead of sitting on a zero baseline. Use one for many categories over time when the shapes and the turnover matter more than exact values, such as genres, topics or sources of electricity. Also known as stream graphs and ThemeRivers.
Read the complete guide to streamgraphs
Candlestick chart
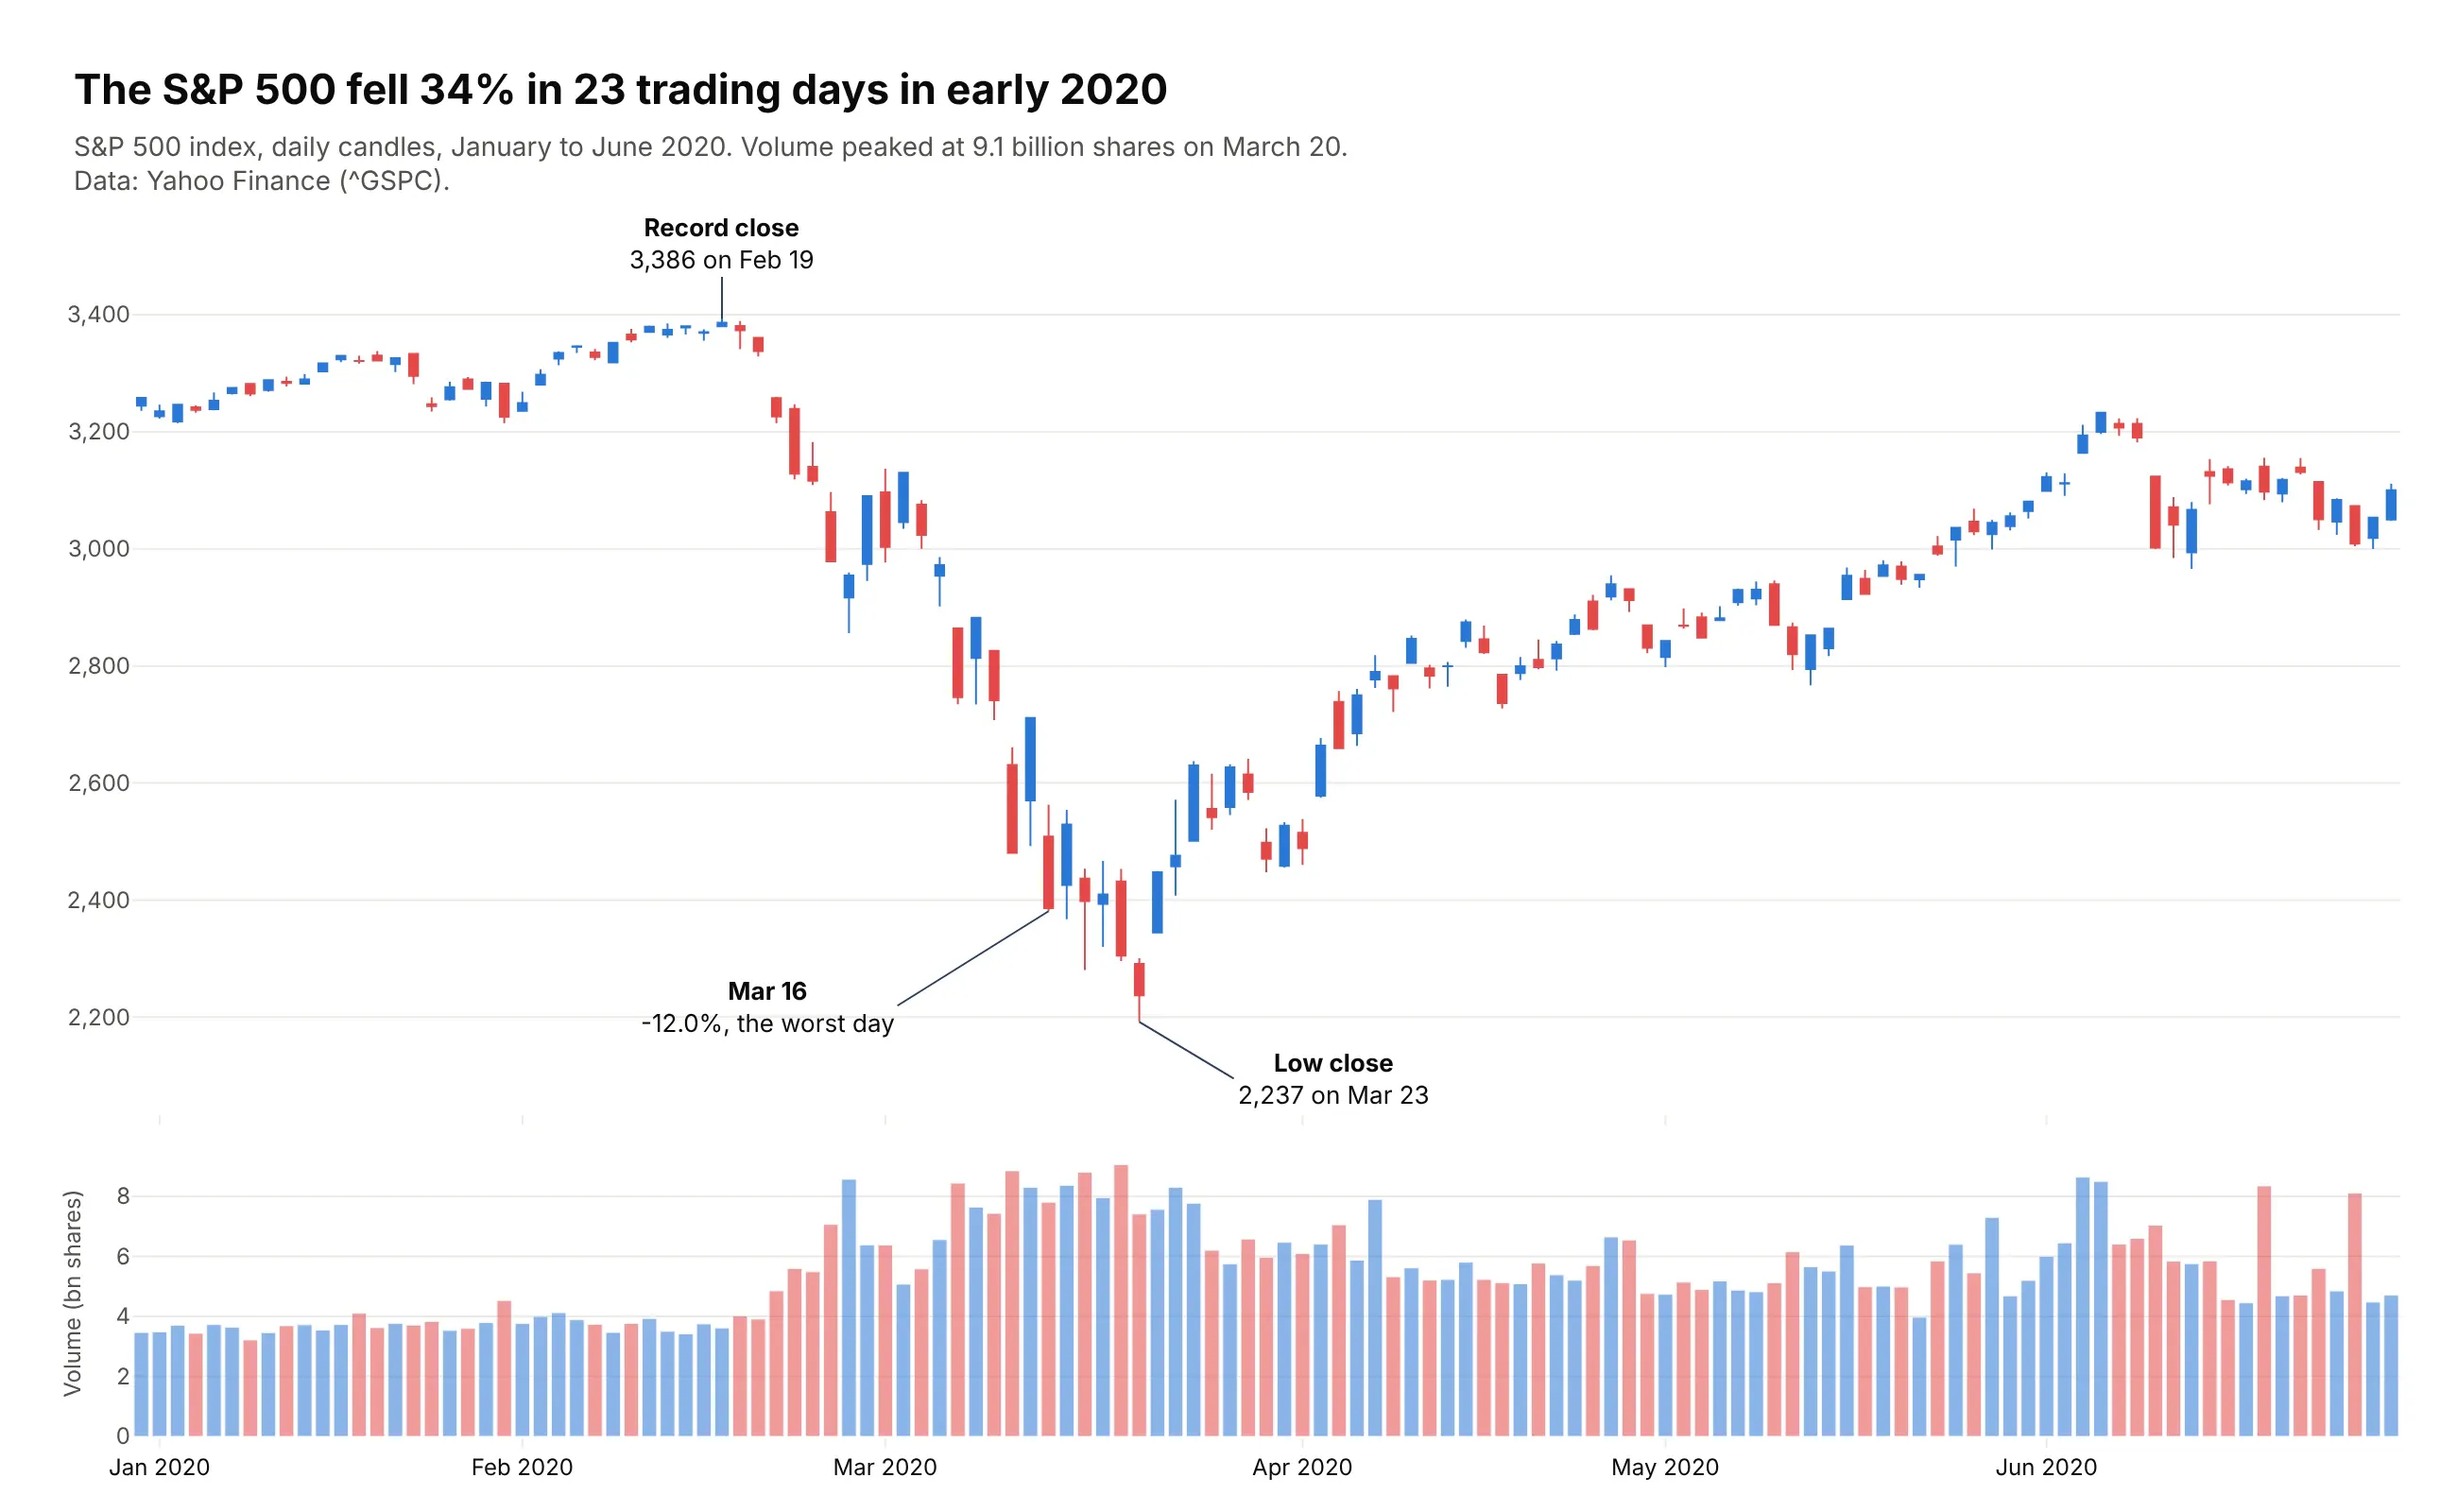
A candlestick chart draws one candle per period, with a body from the open to the close, wicks to the high and the low, and a color for whether the period closed up or down. Use one for stocks, futures, currencies, crypto, yields, power prices and other values with a meaningful open, high, low and close, and an OHLC chart instead when color would suggest good or bad news. Also known as Japanese candlestick charts and K-line charts.
Read the complete guide to candlestick charts
Calendar heatmap
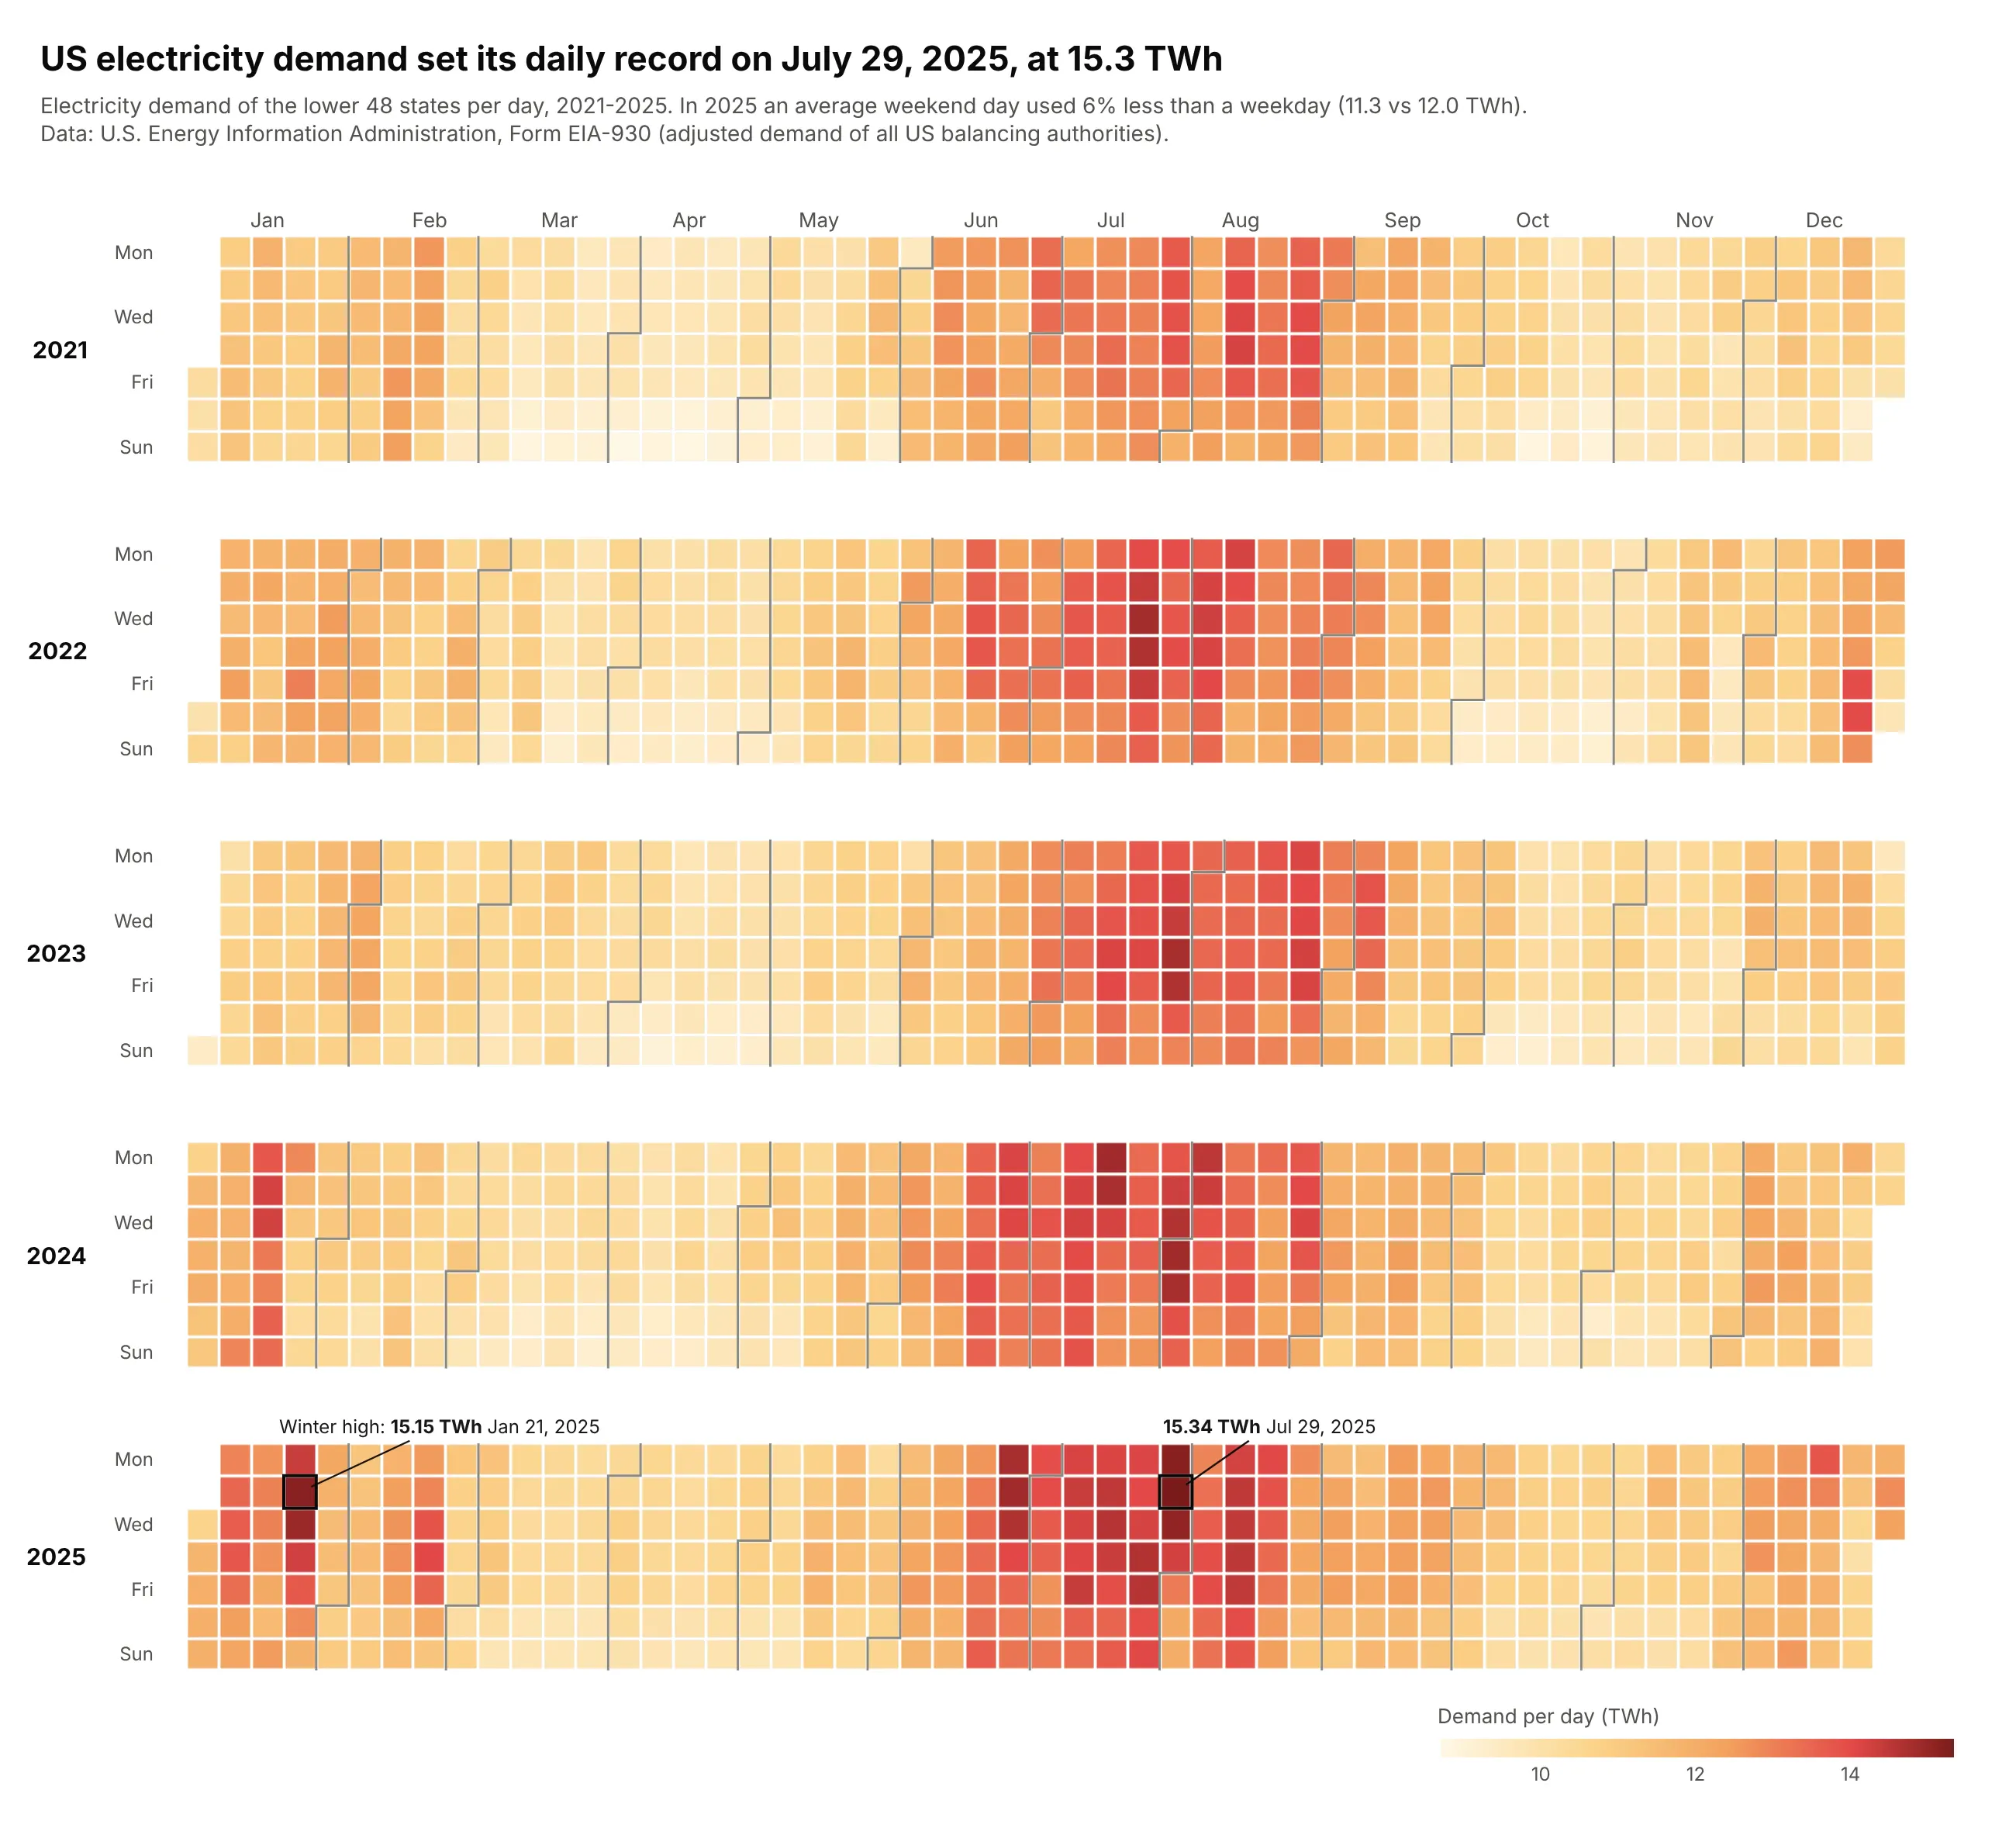
A calendar heatmap draws one colored cell per day, laid out like a wall calendar with weeks as columns and weekdays as rows. Use one for a daily series over one to about eight years when the questions are about weekdays, weeks, holidays and streaks. Also known as calendar charts and calendar plots.
Read the complete guide to calendar heatmaps
Small multiples
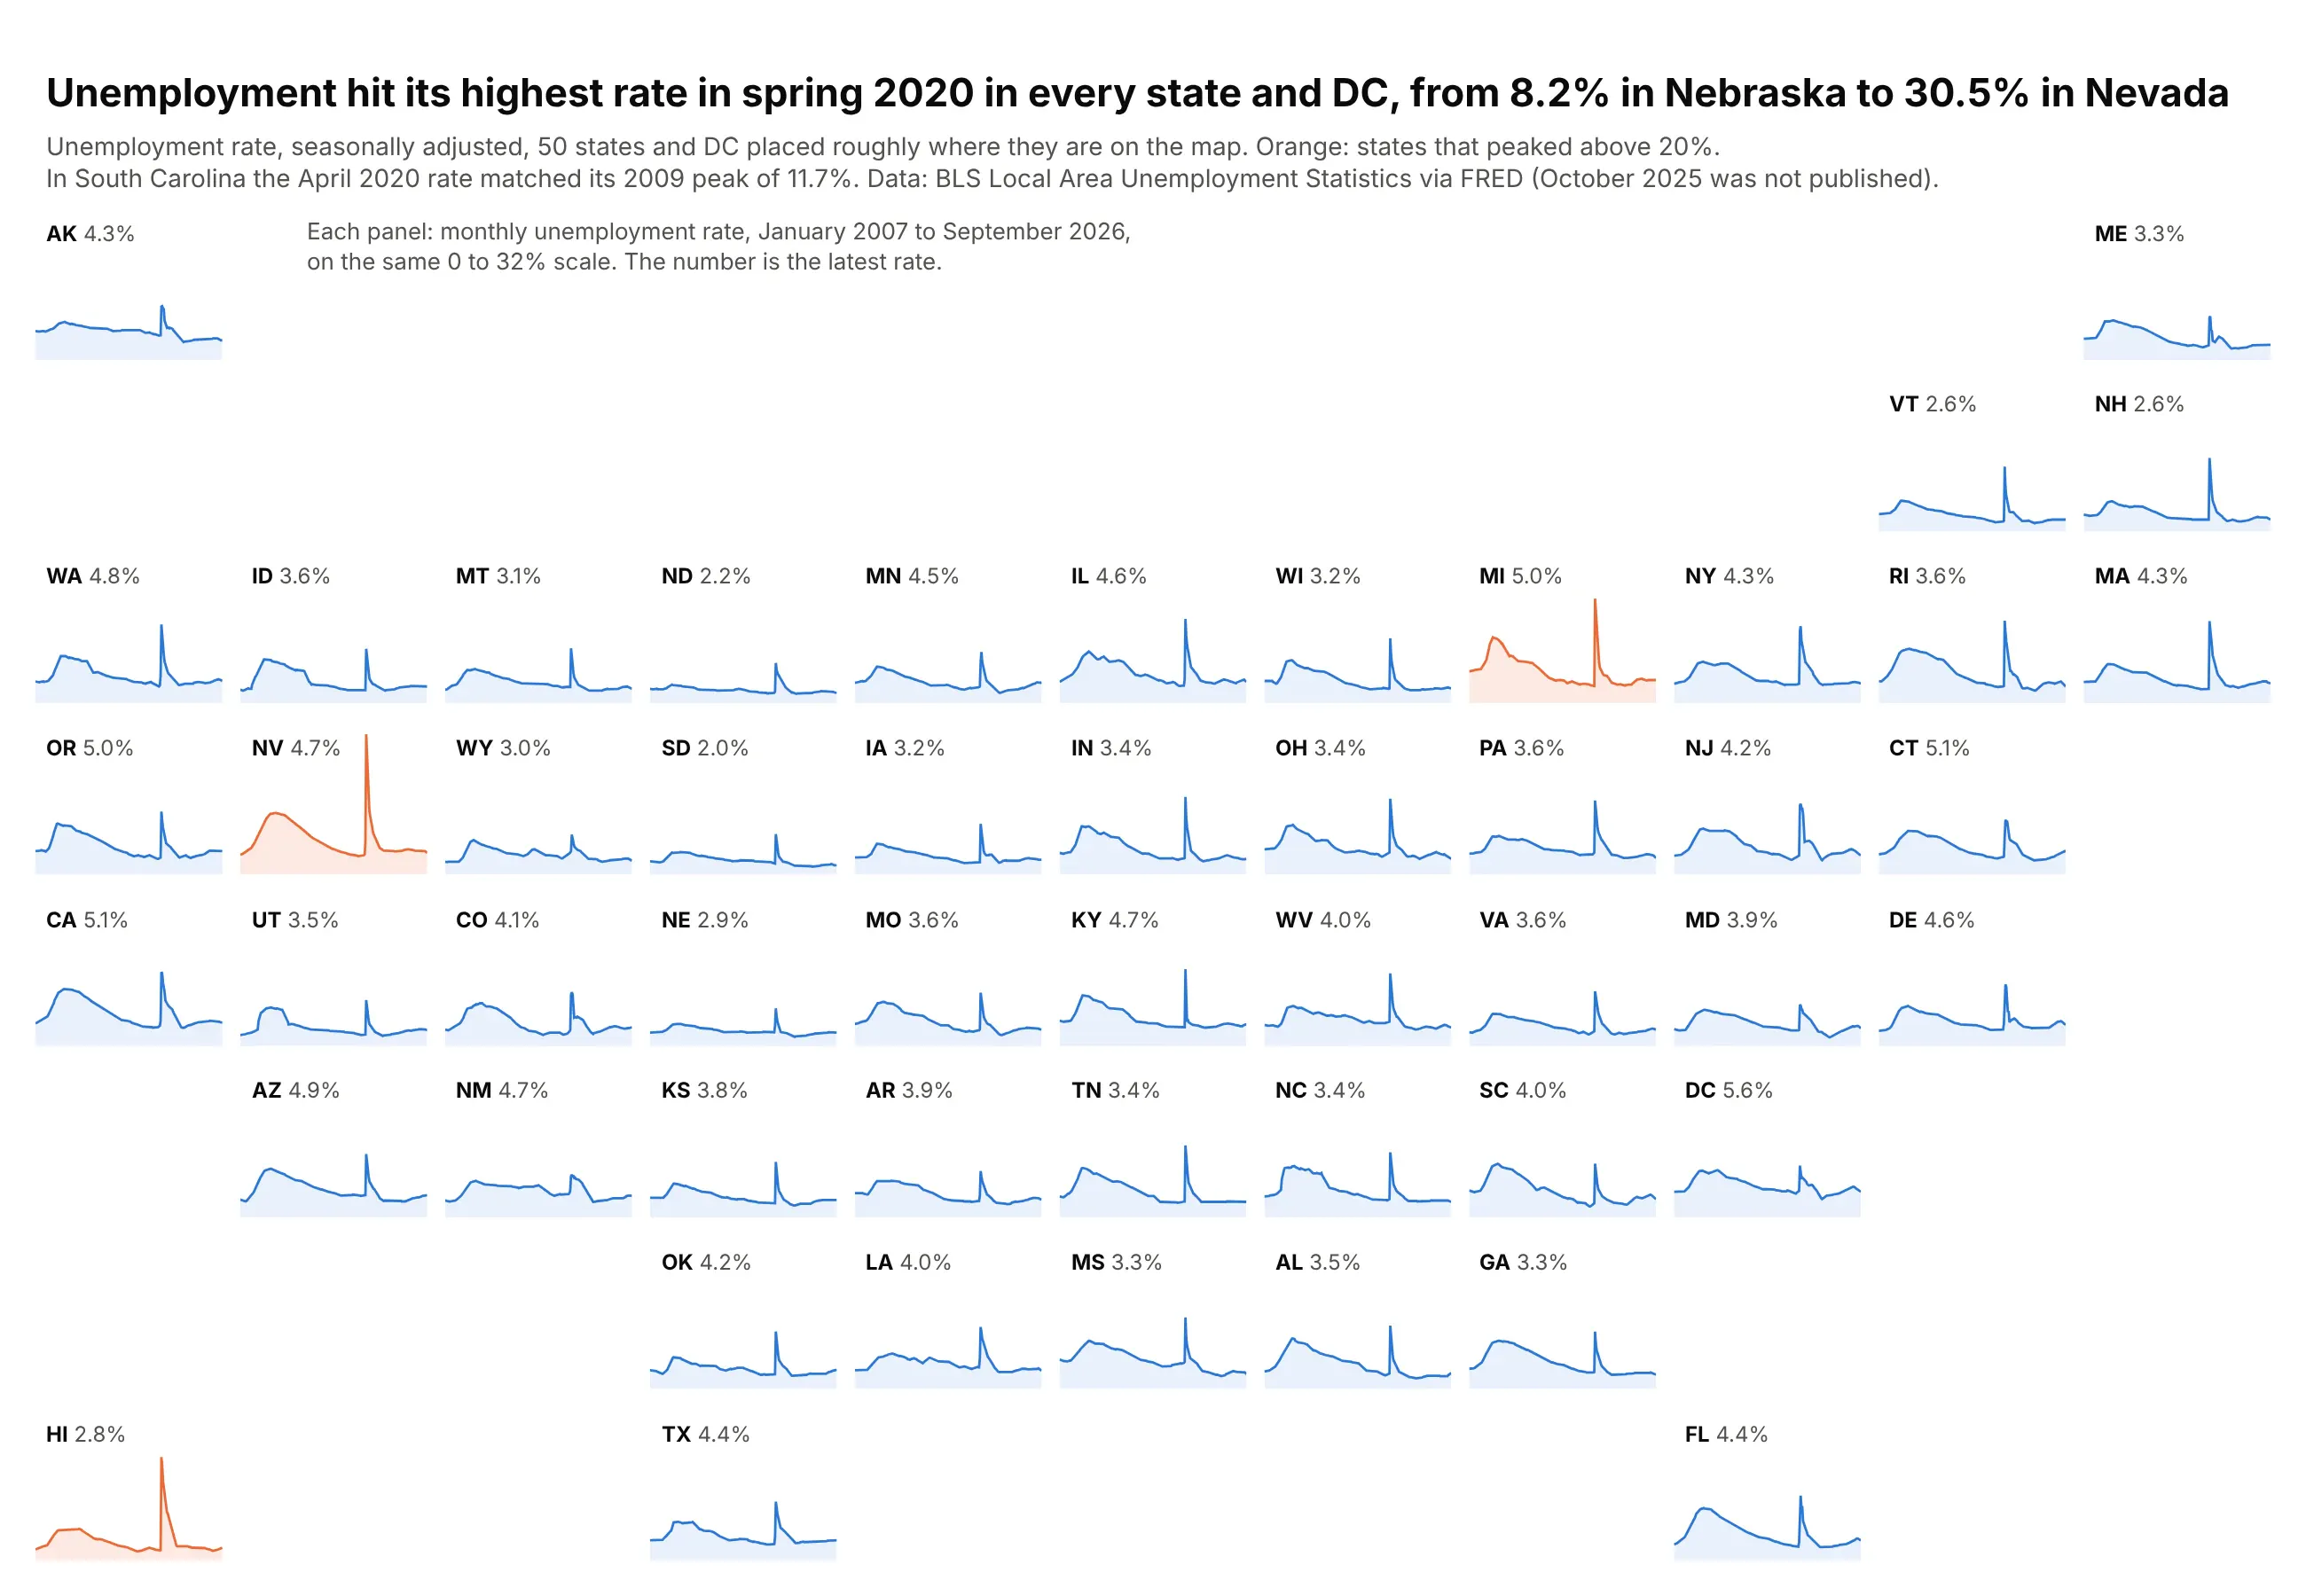
Small multiples repeat the same small chart once per group, with the same axes and encoding, so the eye compares panels instead of untangling lines. Use them when one chart would hold more than about five overlapping series. Also known as trellis charts, lattice charts, panel charts and facet plots.
Read the complete guide to small multiples
Charts for relationships between many variables
These charts show how two or more numbers move together, from a scatter plot with a third value to a whole table of measures.
Bubble chart
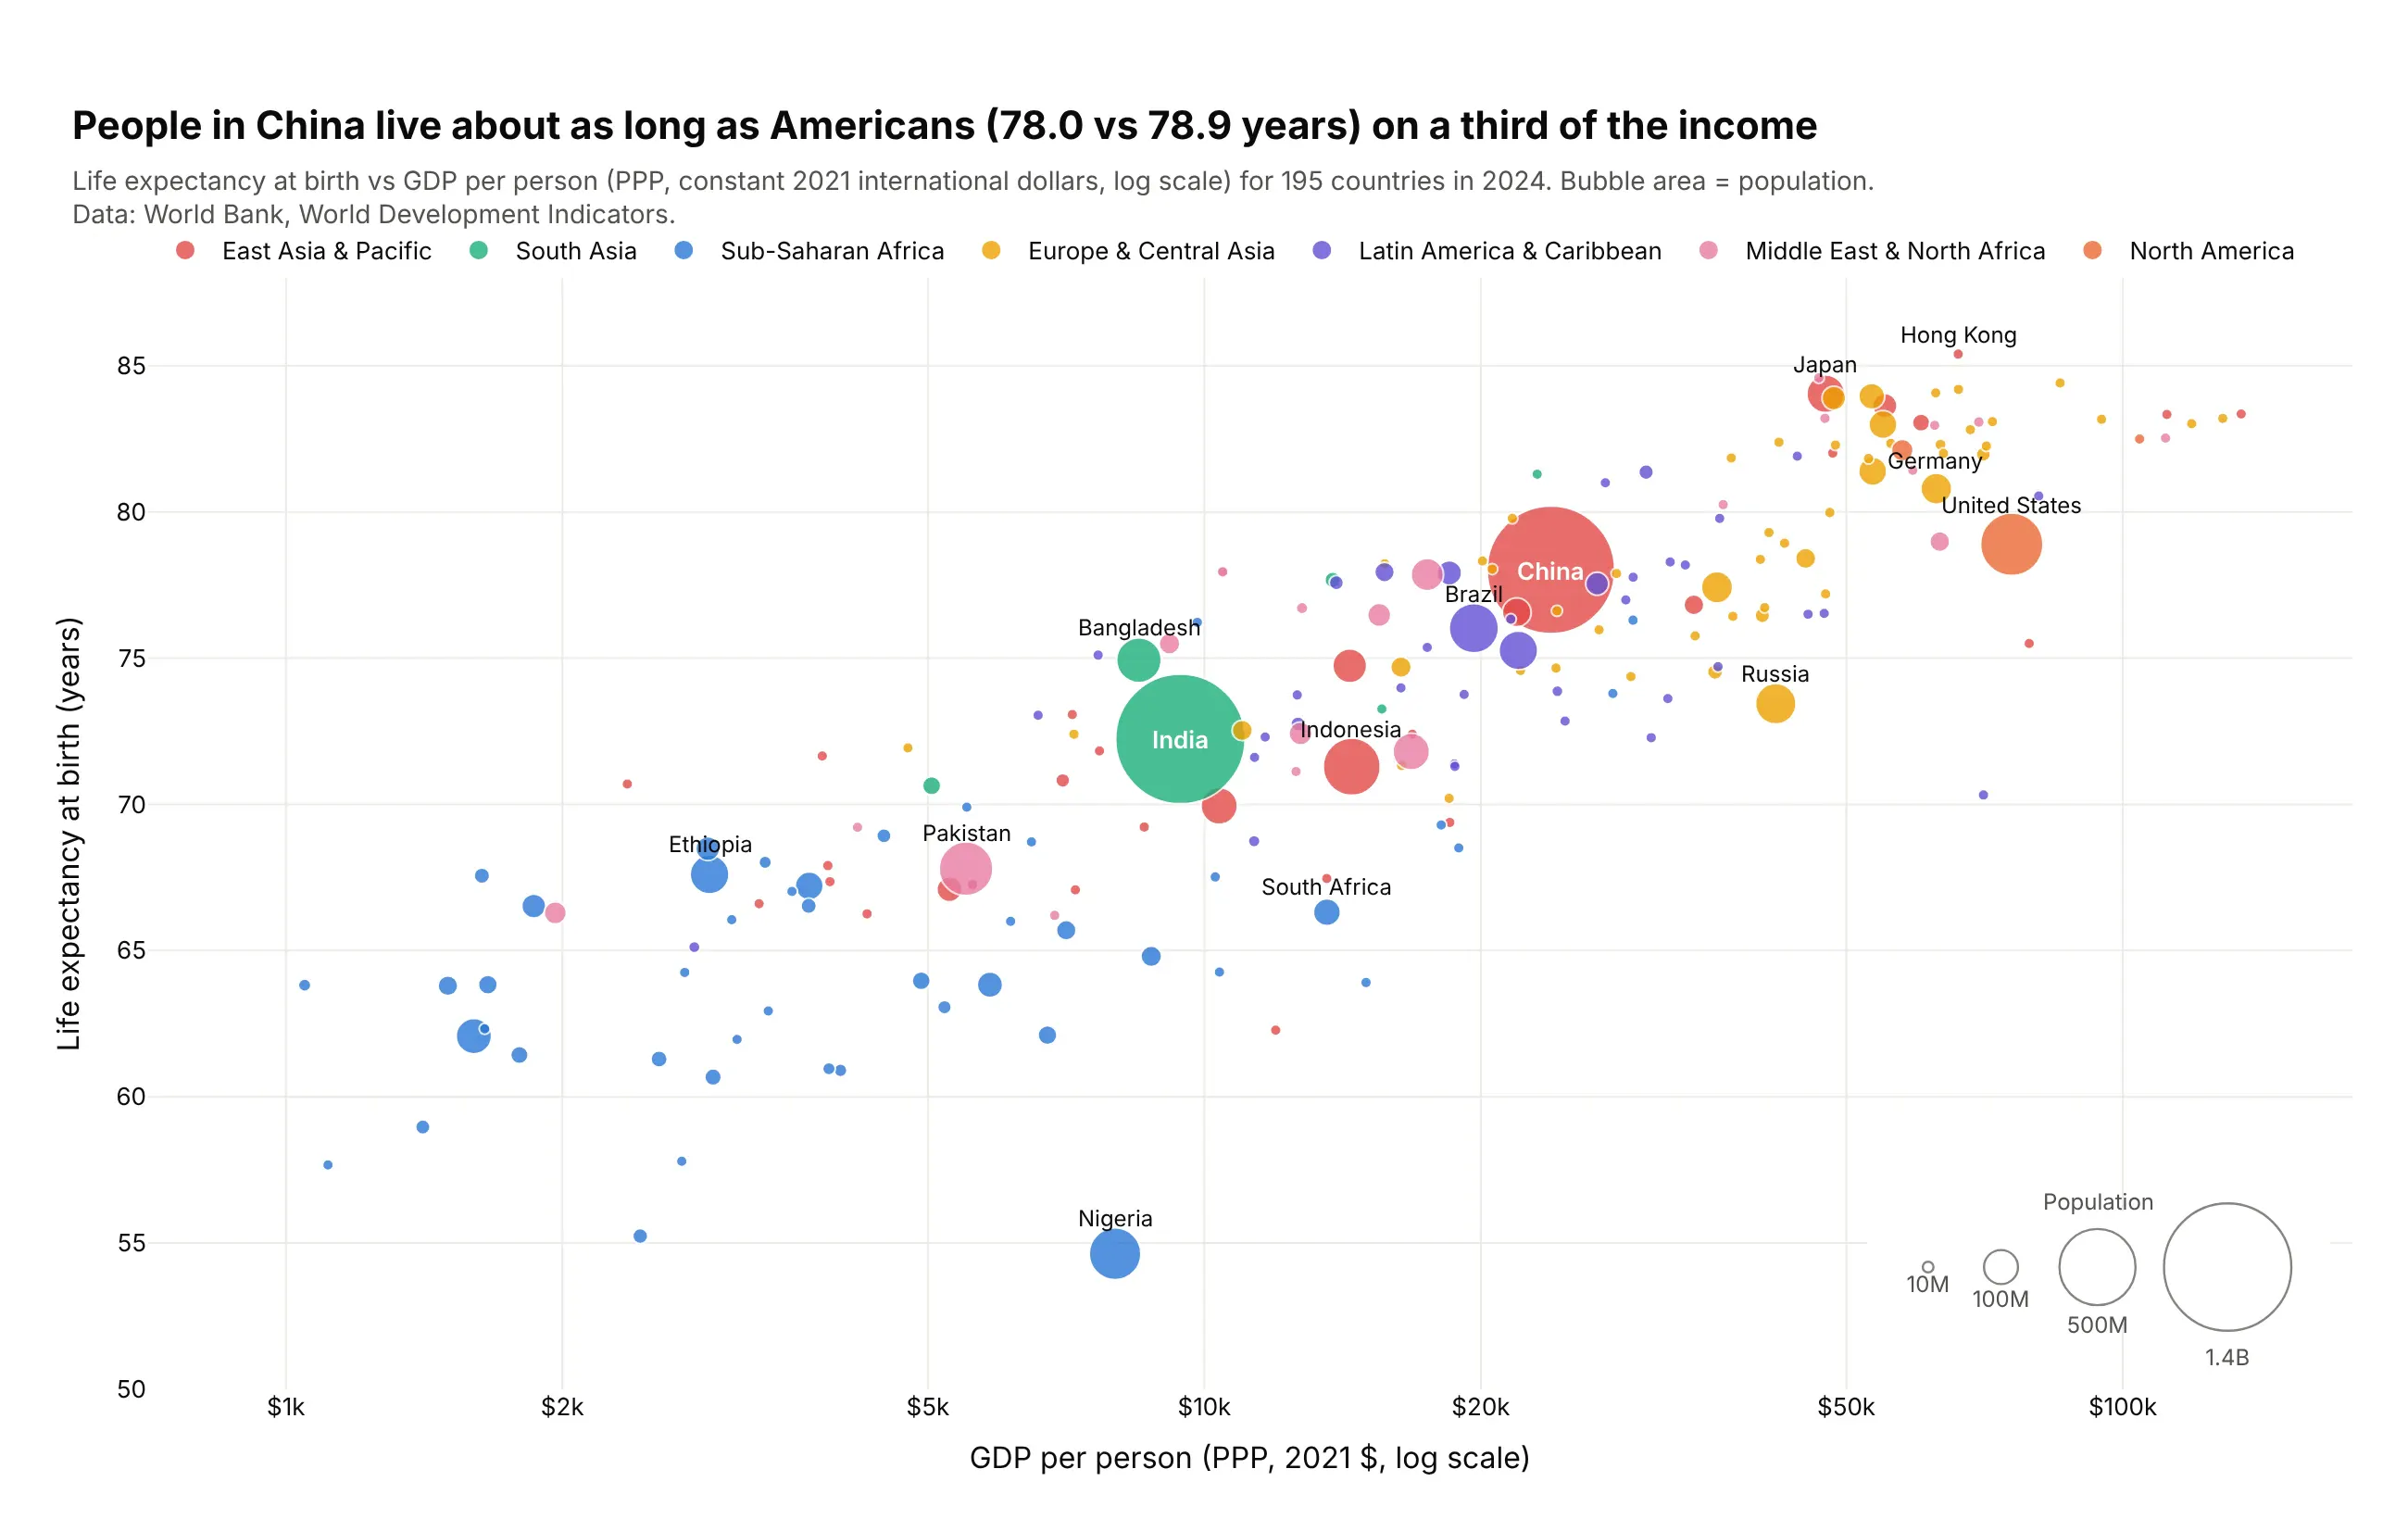
A bubble chart is a scatter plot whose markers are sized by a third number, so each bubble shows x, y and area. Use one when the size of each item changes how you read the relationship, such as countries by population or power plants by capacity. Also known as bubble plots.
Read the complete guide to bubble charts
Scatter plot matrix
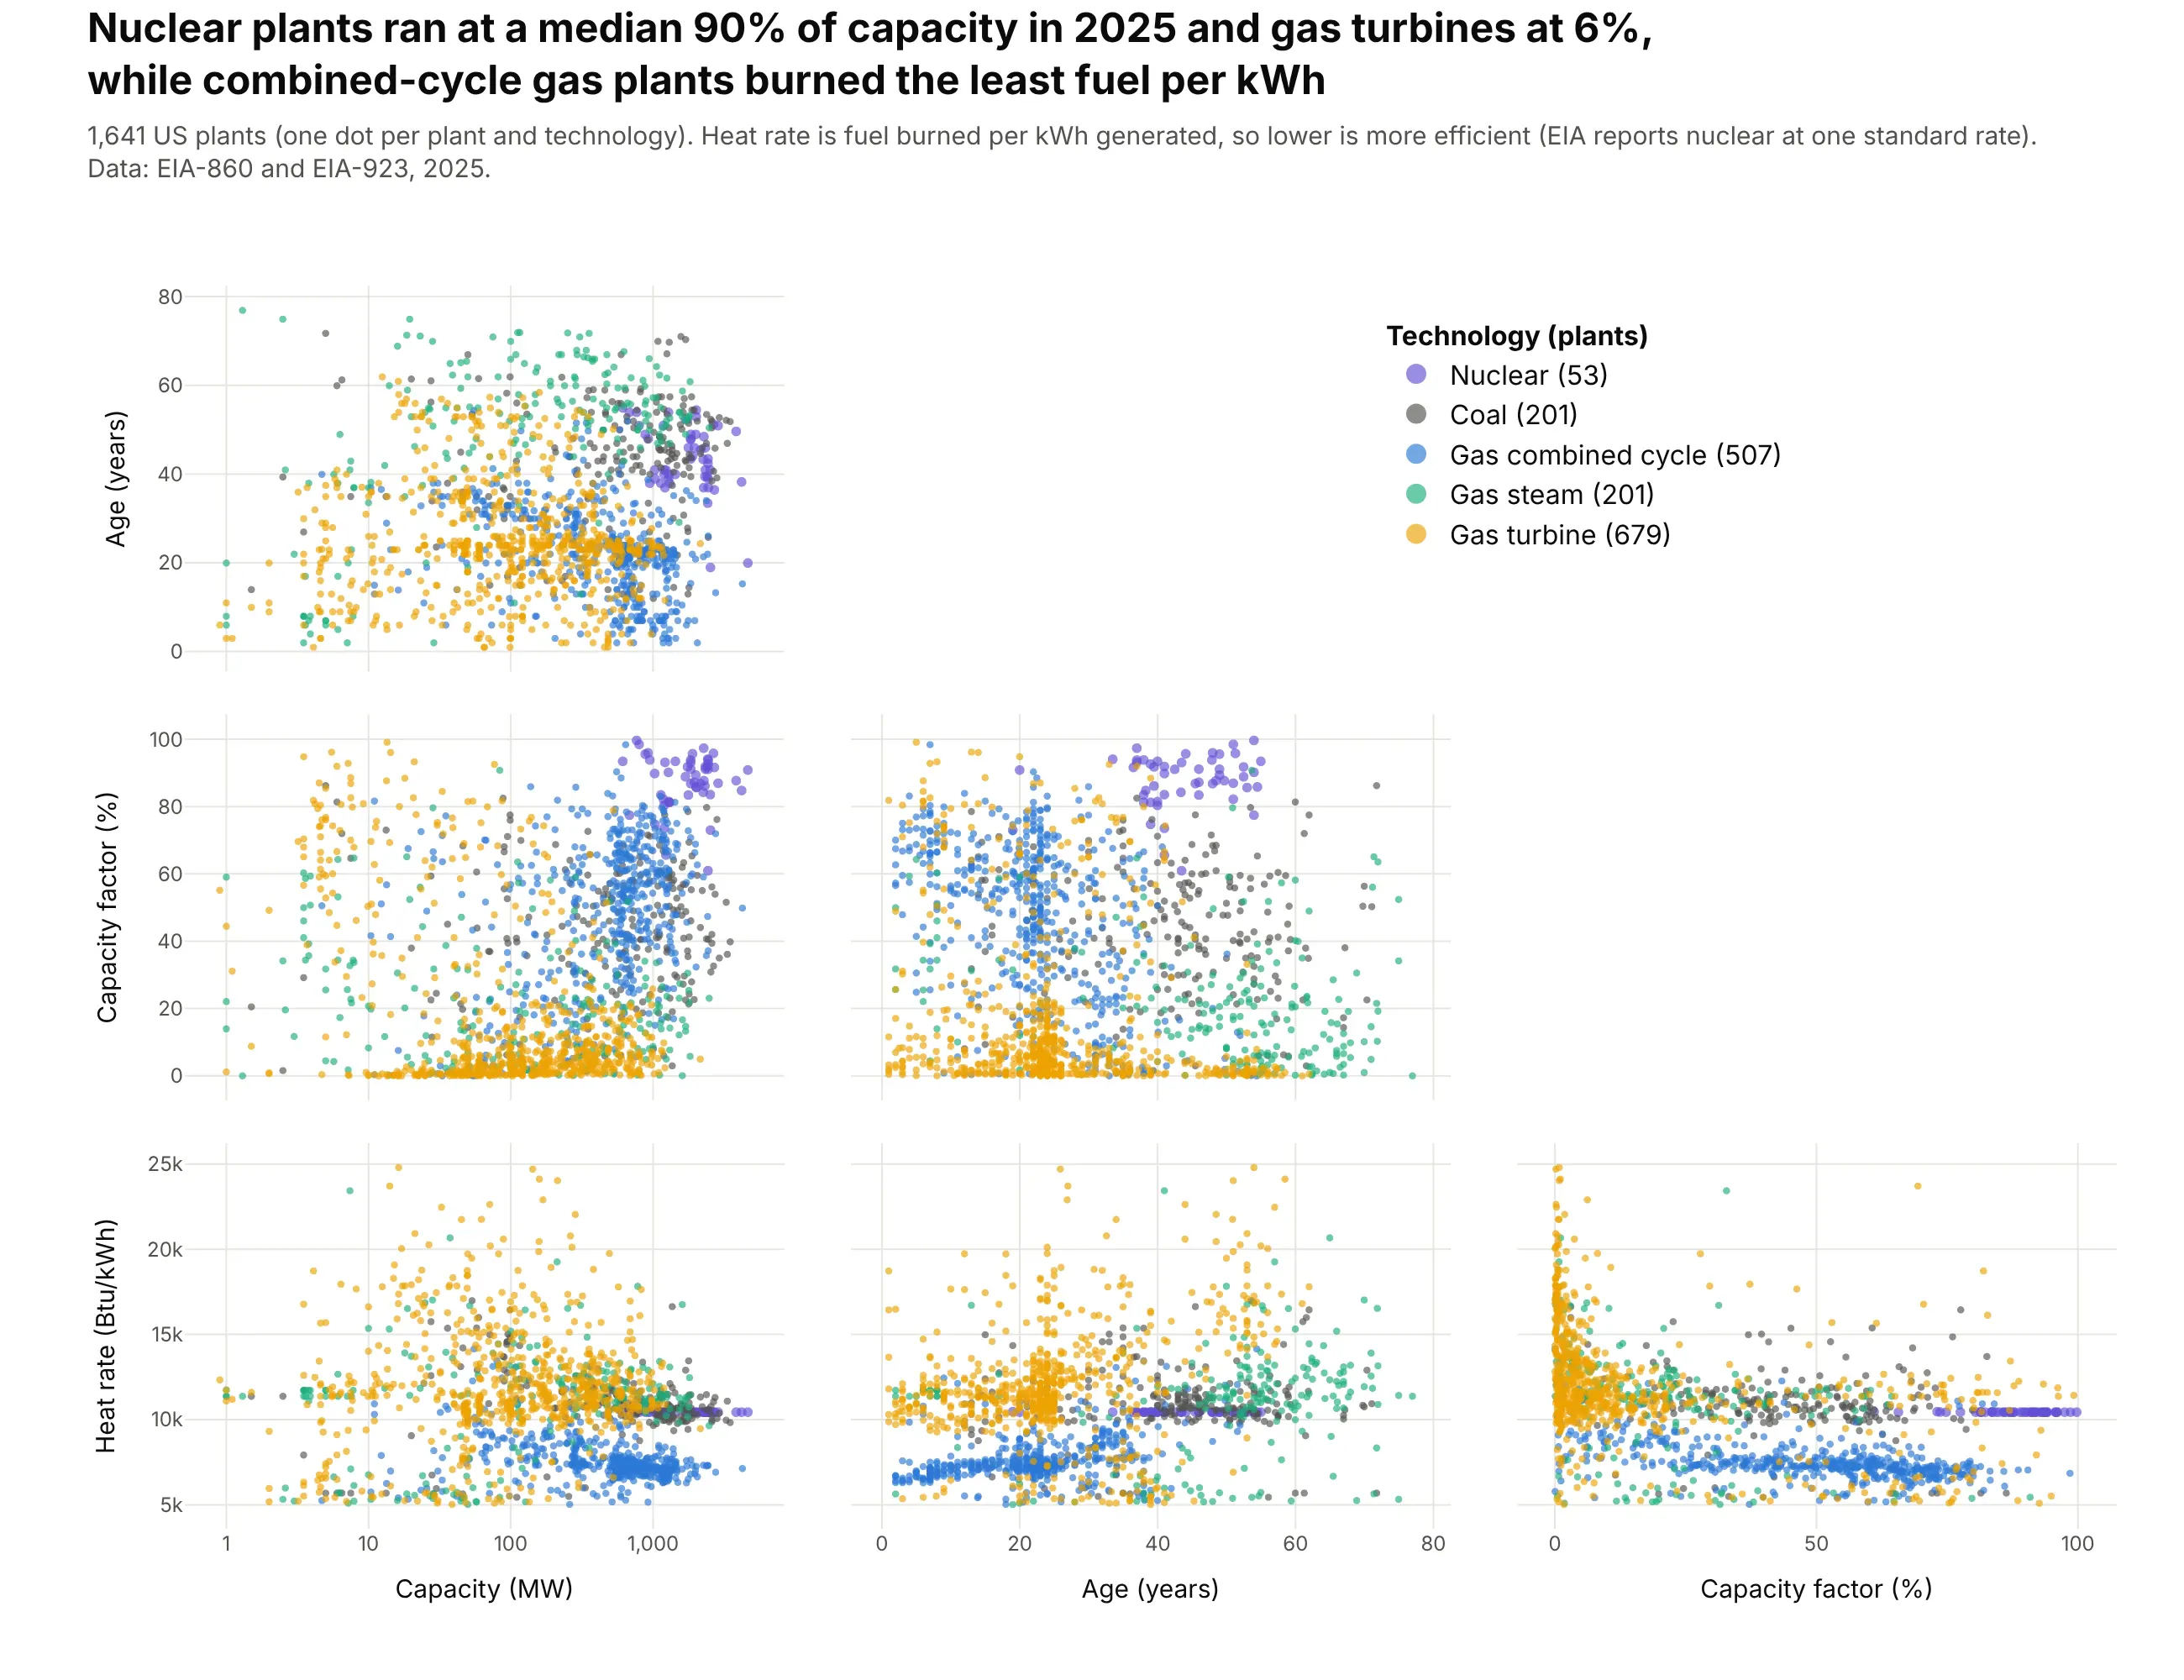
A scatter plot matrix draws a scatter plot for every pair of variables in a grid, so you see every pairwise relationship in a table of 3 to 8 numeric columns at once. Use one as the first look at a new table, before a model, or to see which measures separate your groups. Also known as scatterplot matrices, pair plots and SPLOMs.
Read the complete guide to scatter plot matrices
Parallel coordinates plot
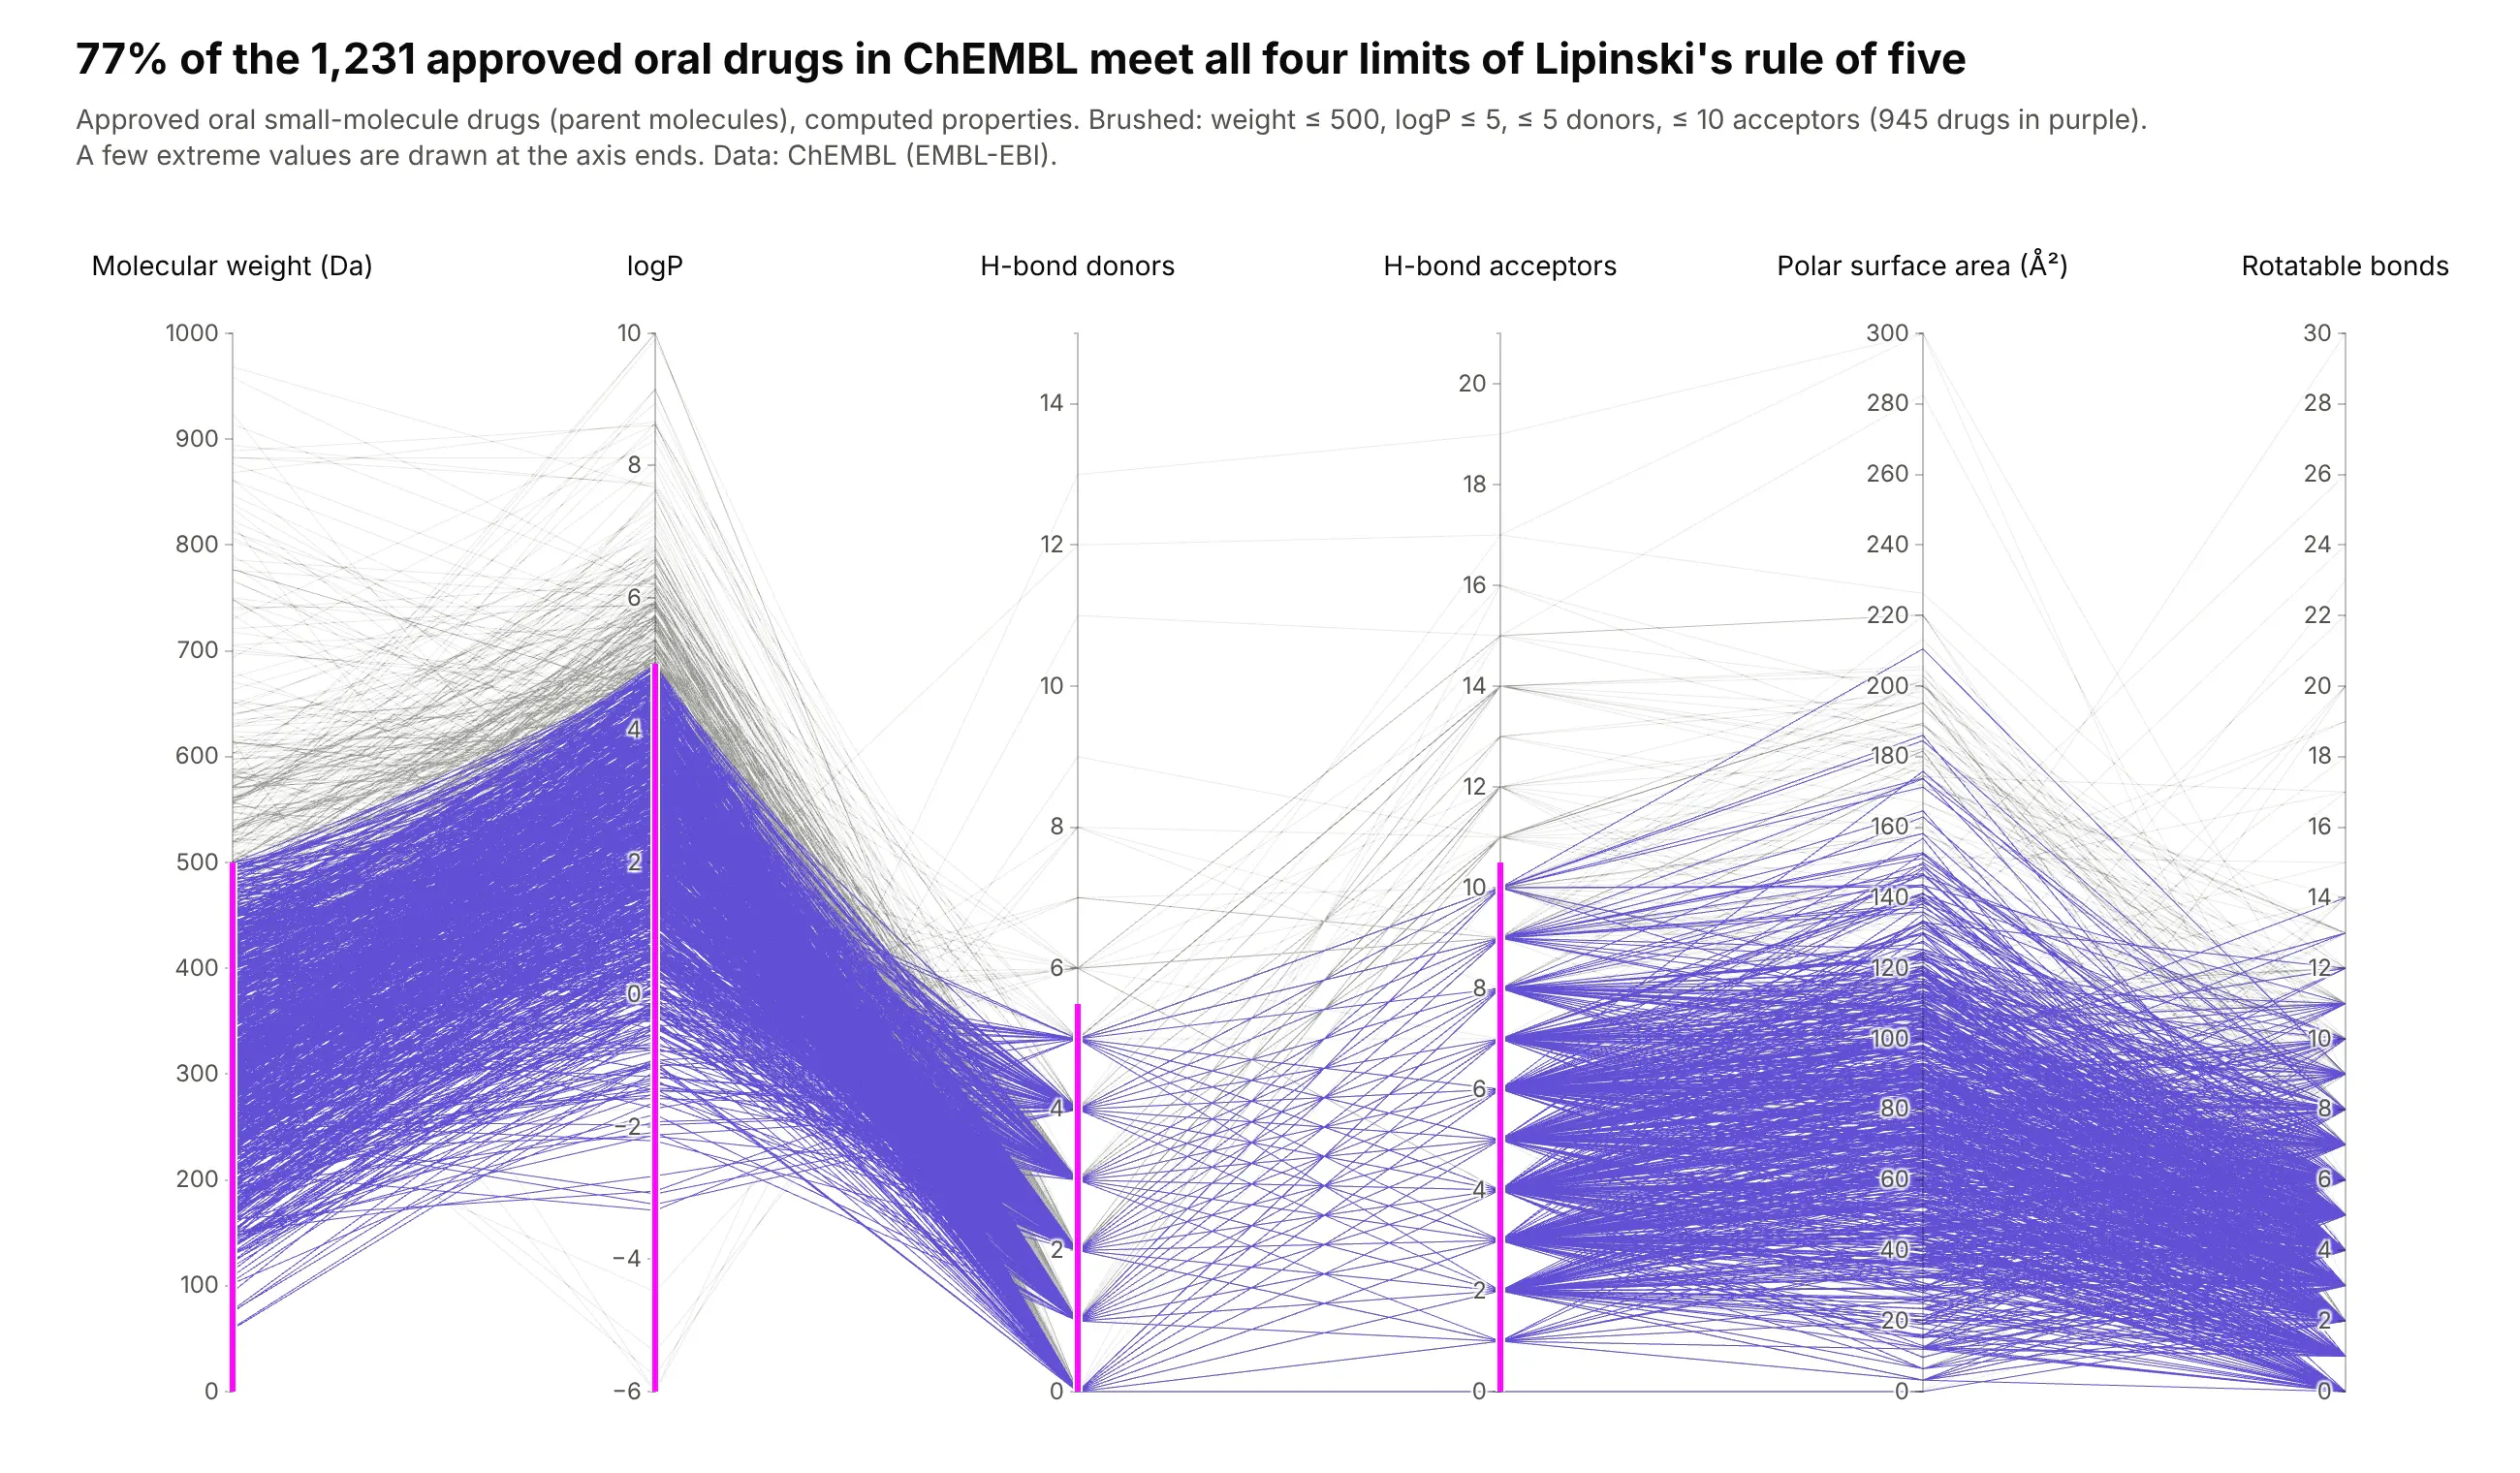
A parallel coordinates plot draws each variable as a vertical axis and each record as a line that crosses every axis at its value, so hundreds or thousands of records across 4 to 10 measures fit in one chart. Its strength is brushing, where you drag a range on an axis and only the lines inside it stay in color. Also known as parallel coordinate plots or PCPs.
Read the complete guide to parallel coordinates plots
Heatmap
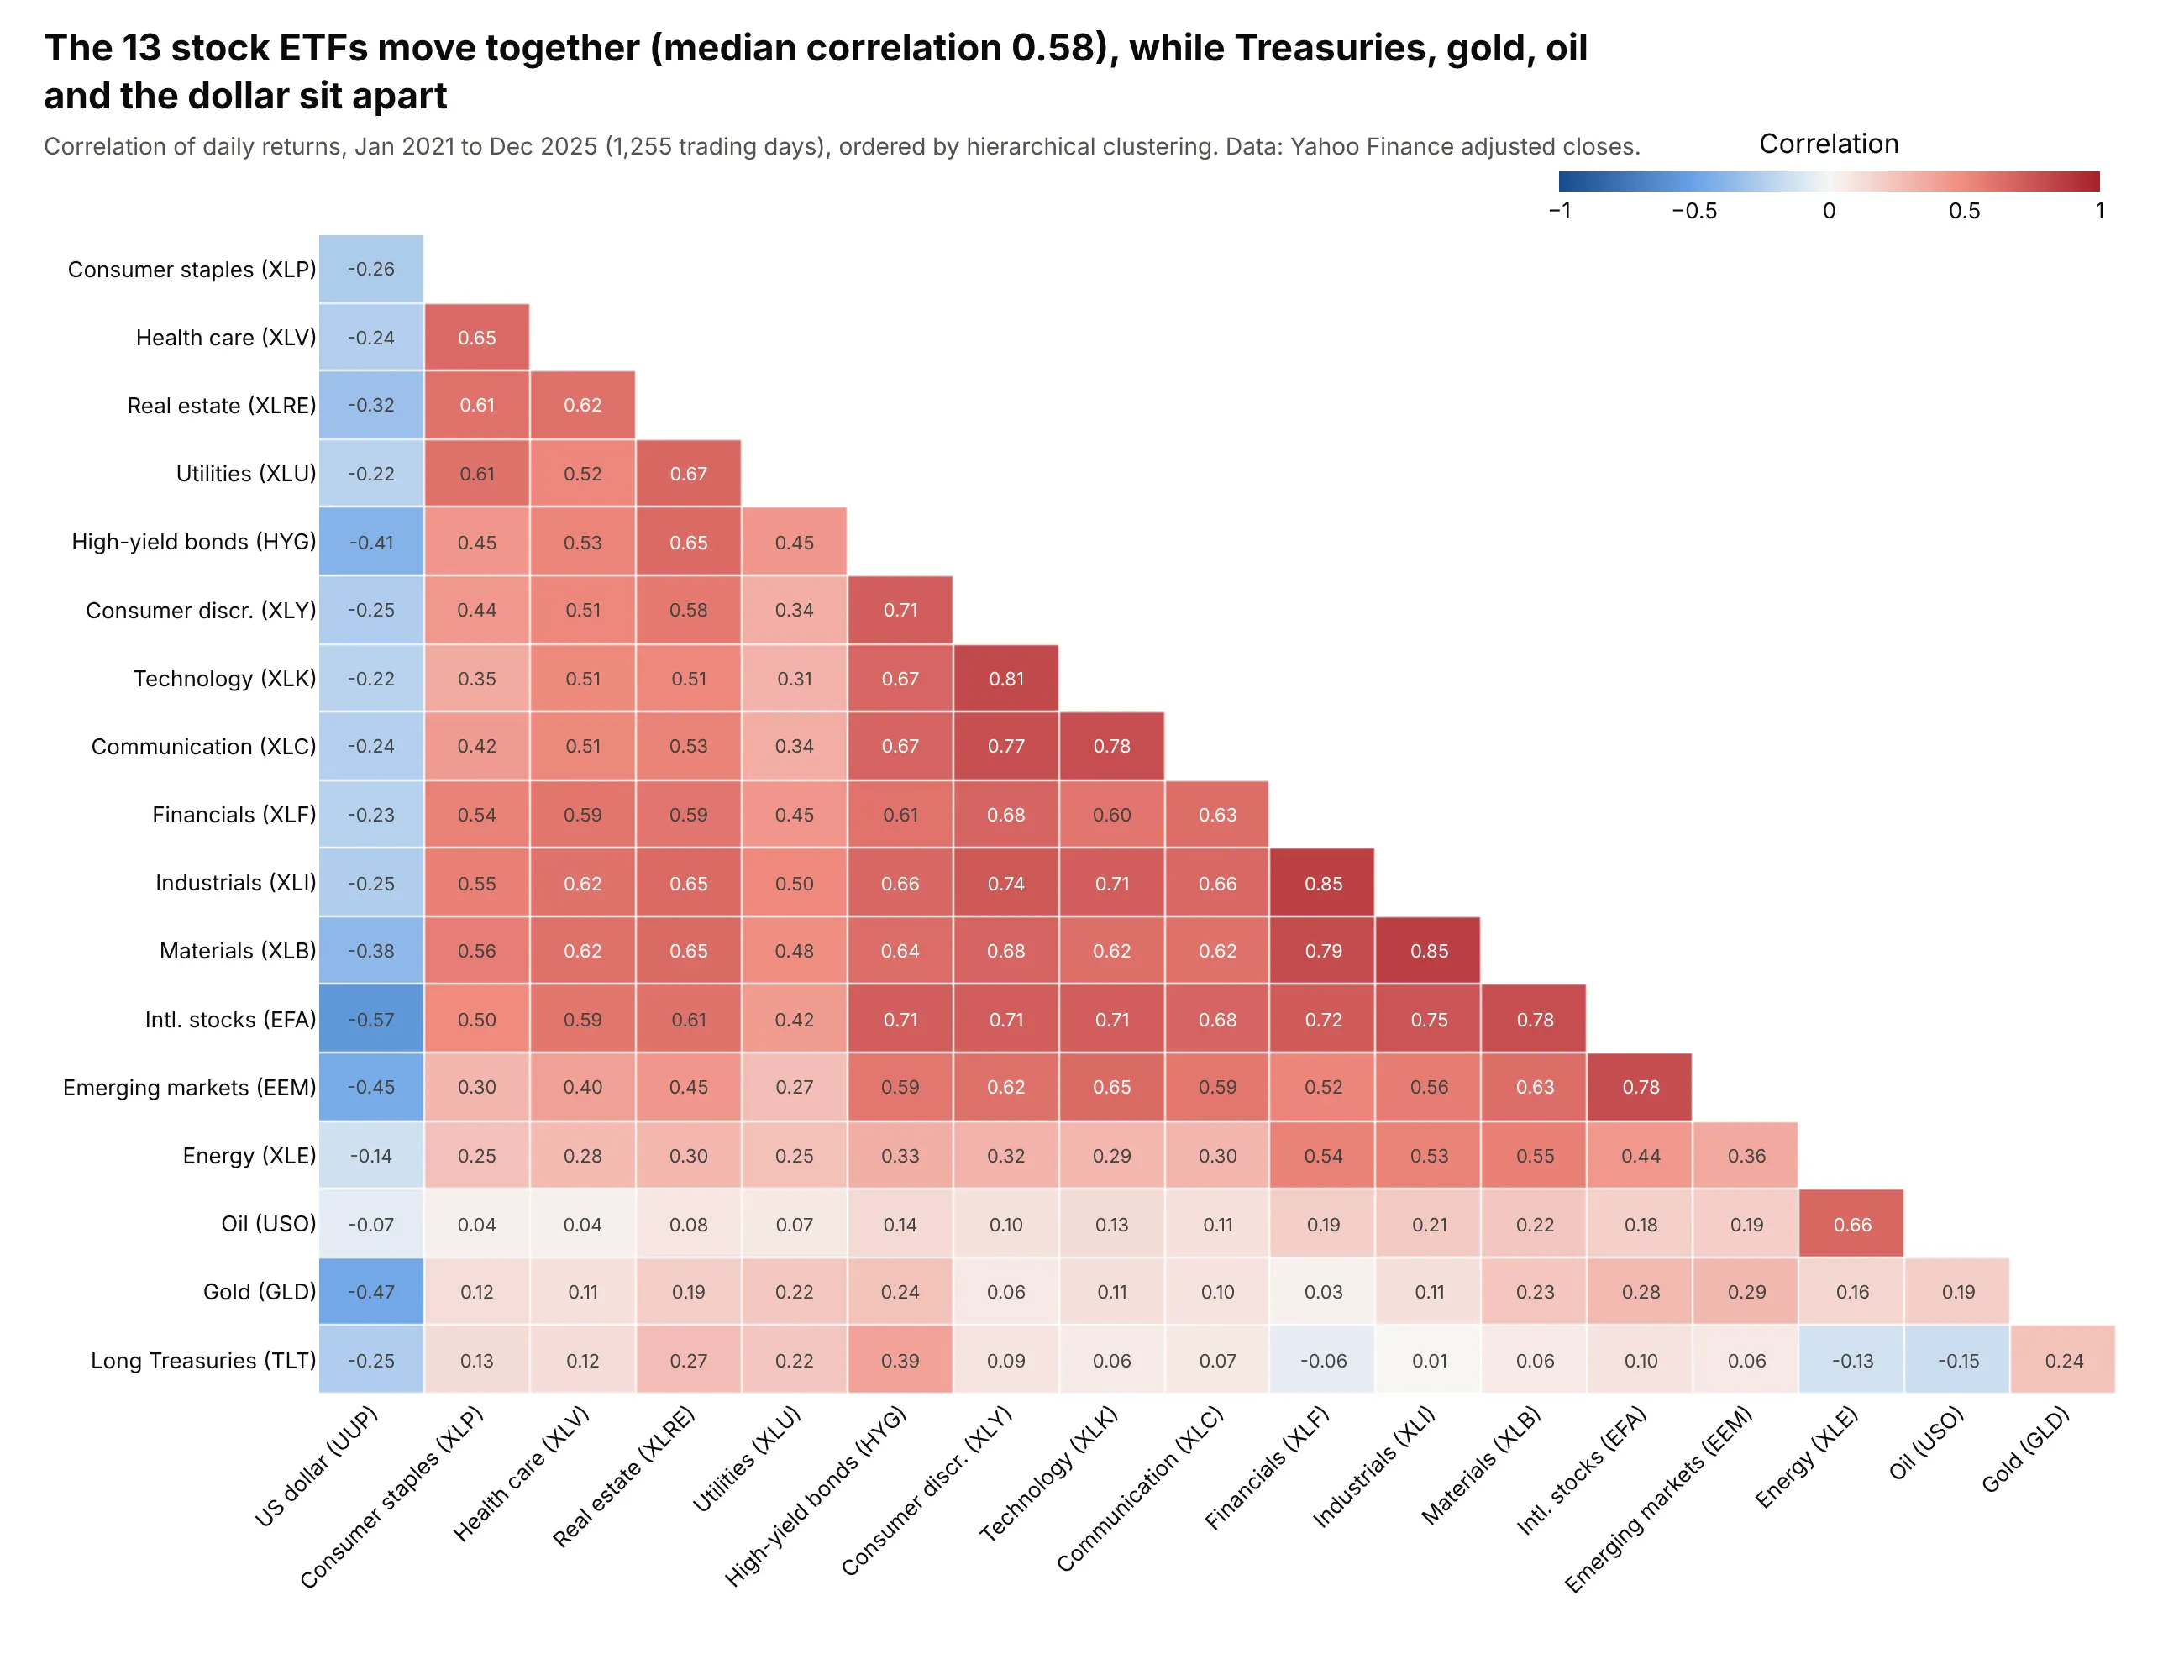
A heatmap draws a table of numbers as a grid of colored cells, so patterns across hundreds or millions of cells show at once. Use one for matrices such as correlations, for a value across two time scales (hour by day, month by year) and for the density of point data. Also known as heat maps and shaded matrices.
Read the complete guide to heatmaps
Hexbin plot
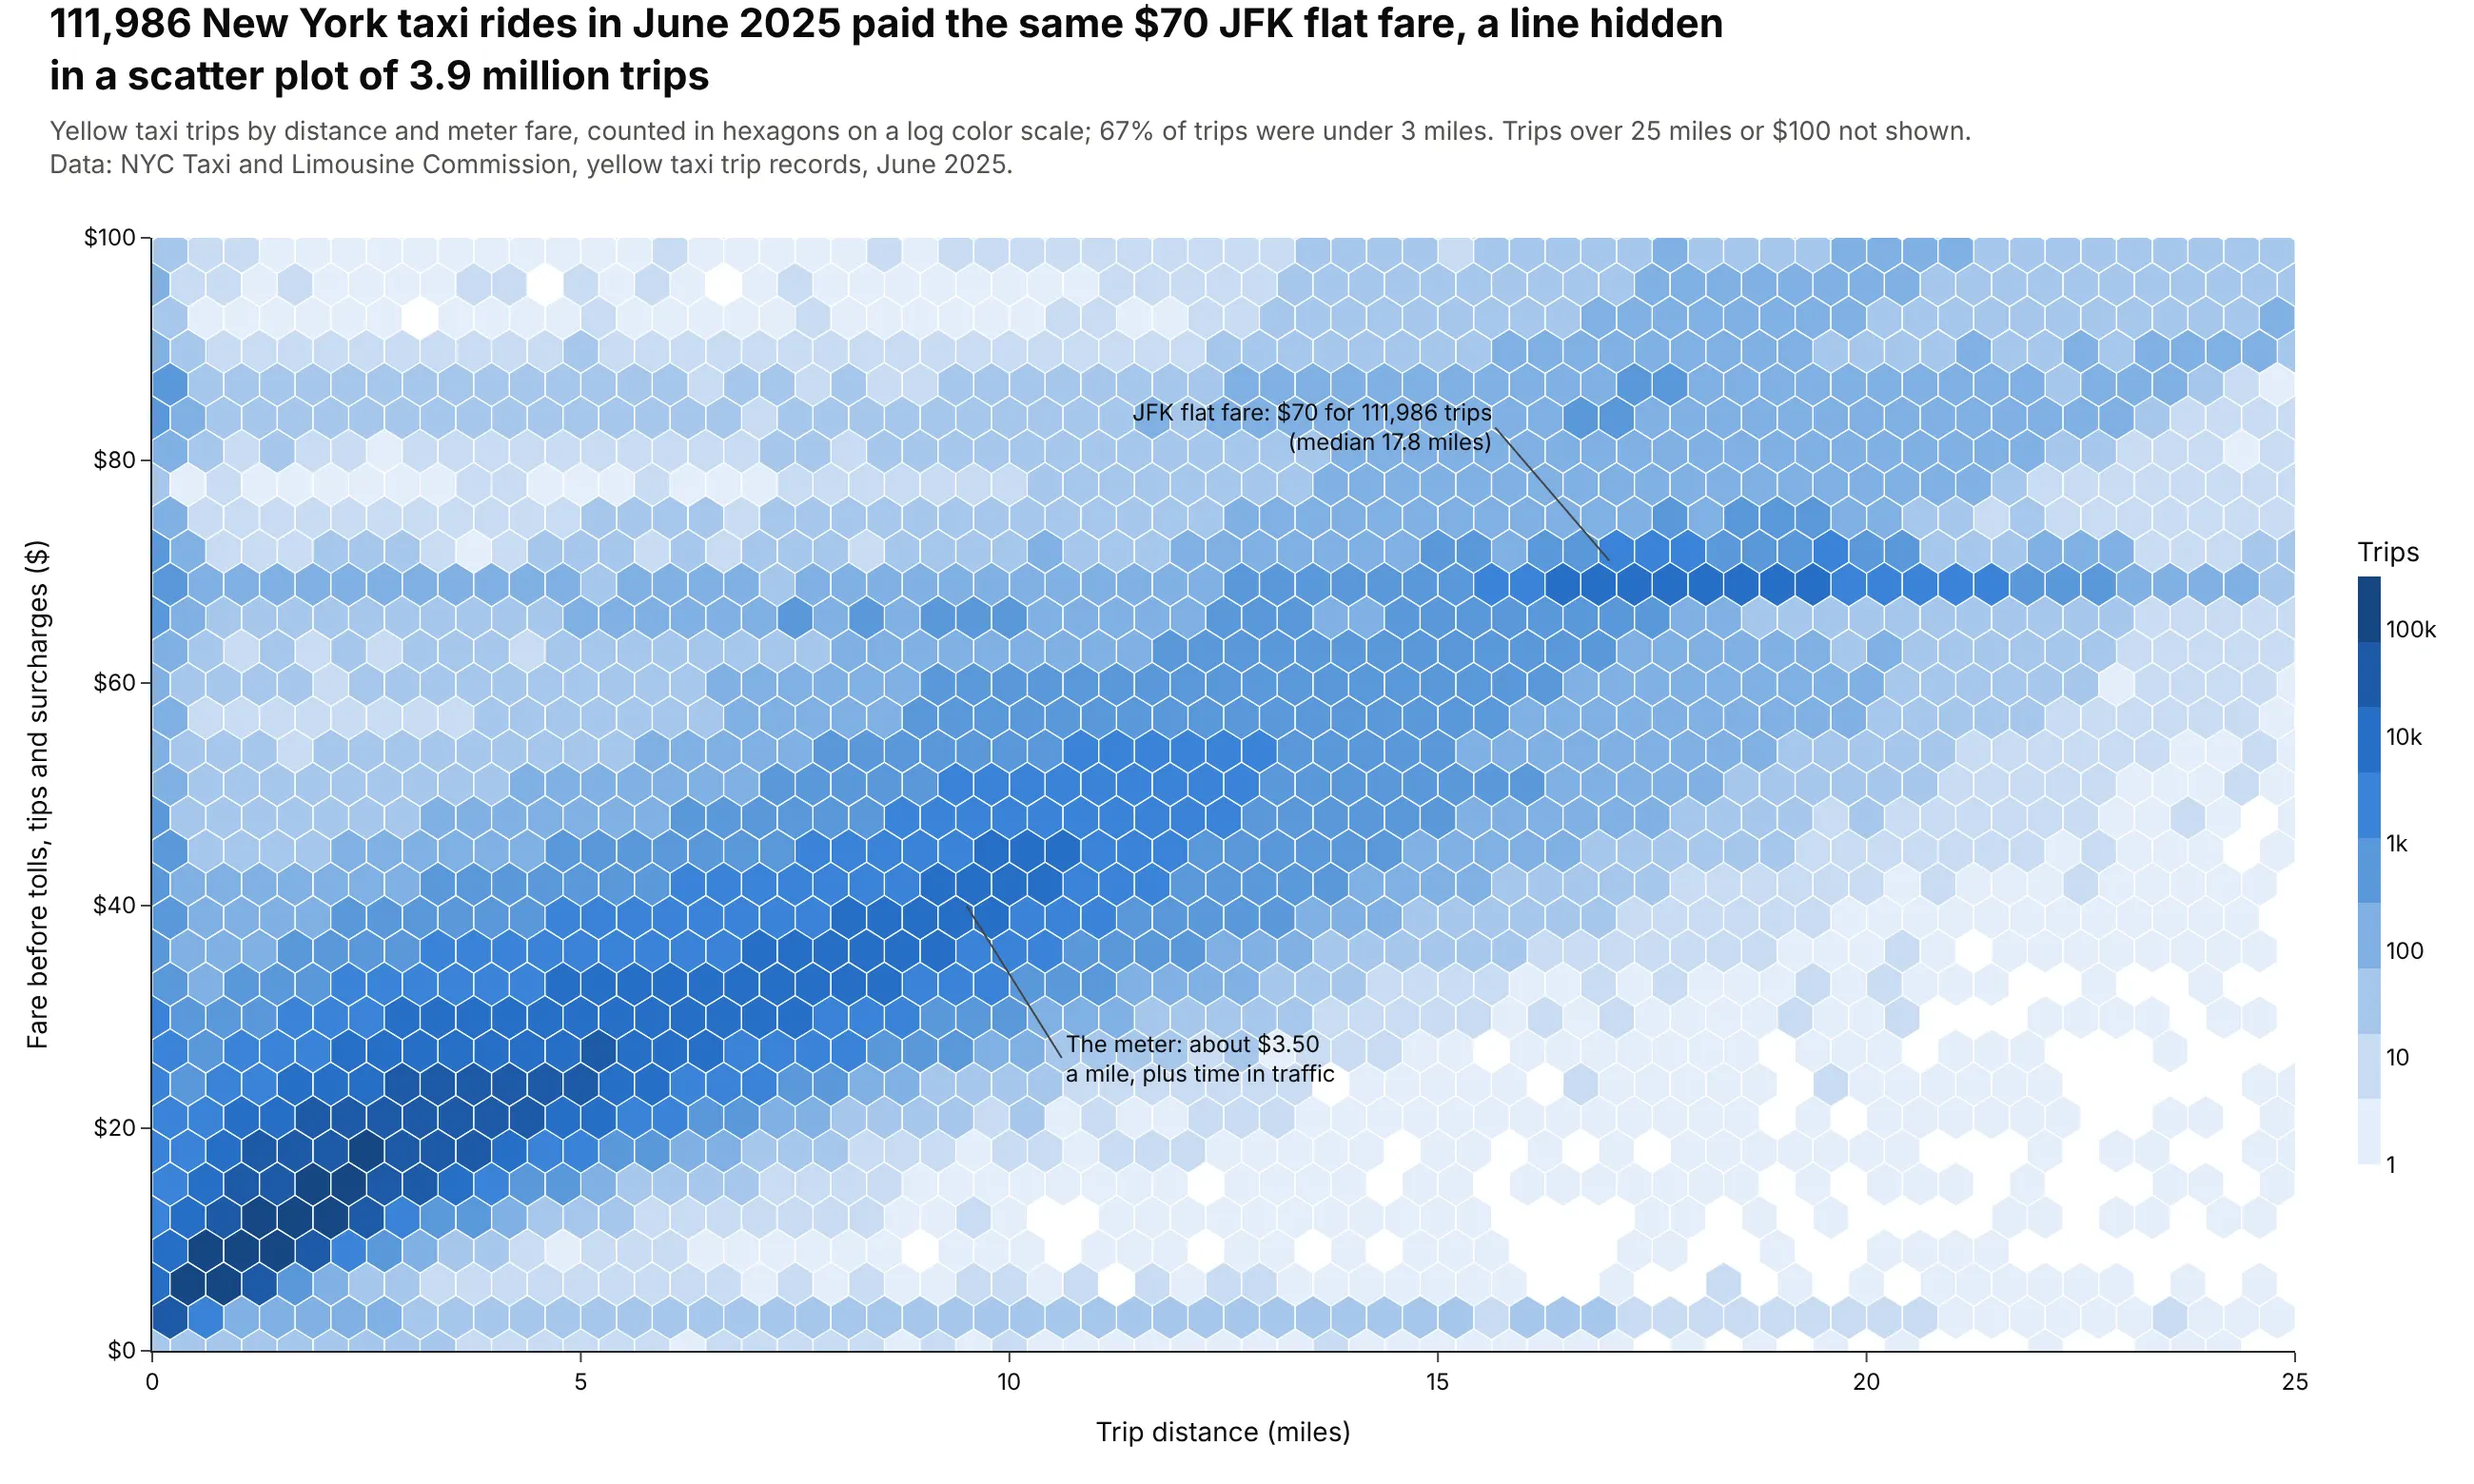
A hexbin plot splits the x-y plane into hexagons and colors each one by how many points fall inside it, so a scatter plot of millions of points becomes a readable map of where the data is dense. Use one when a scatter plot turns into a solid blob, from about 10,000 points up. Also known as hexagonal binning plots and hexagonal heatmaps.
Read the complete guide to hexbin plots
3D surface plot
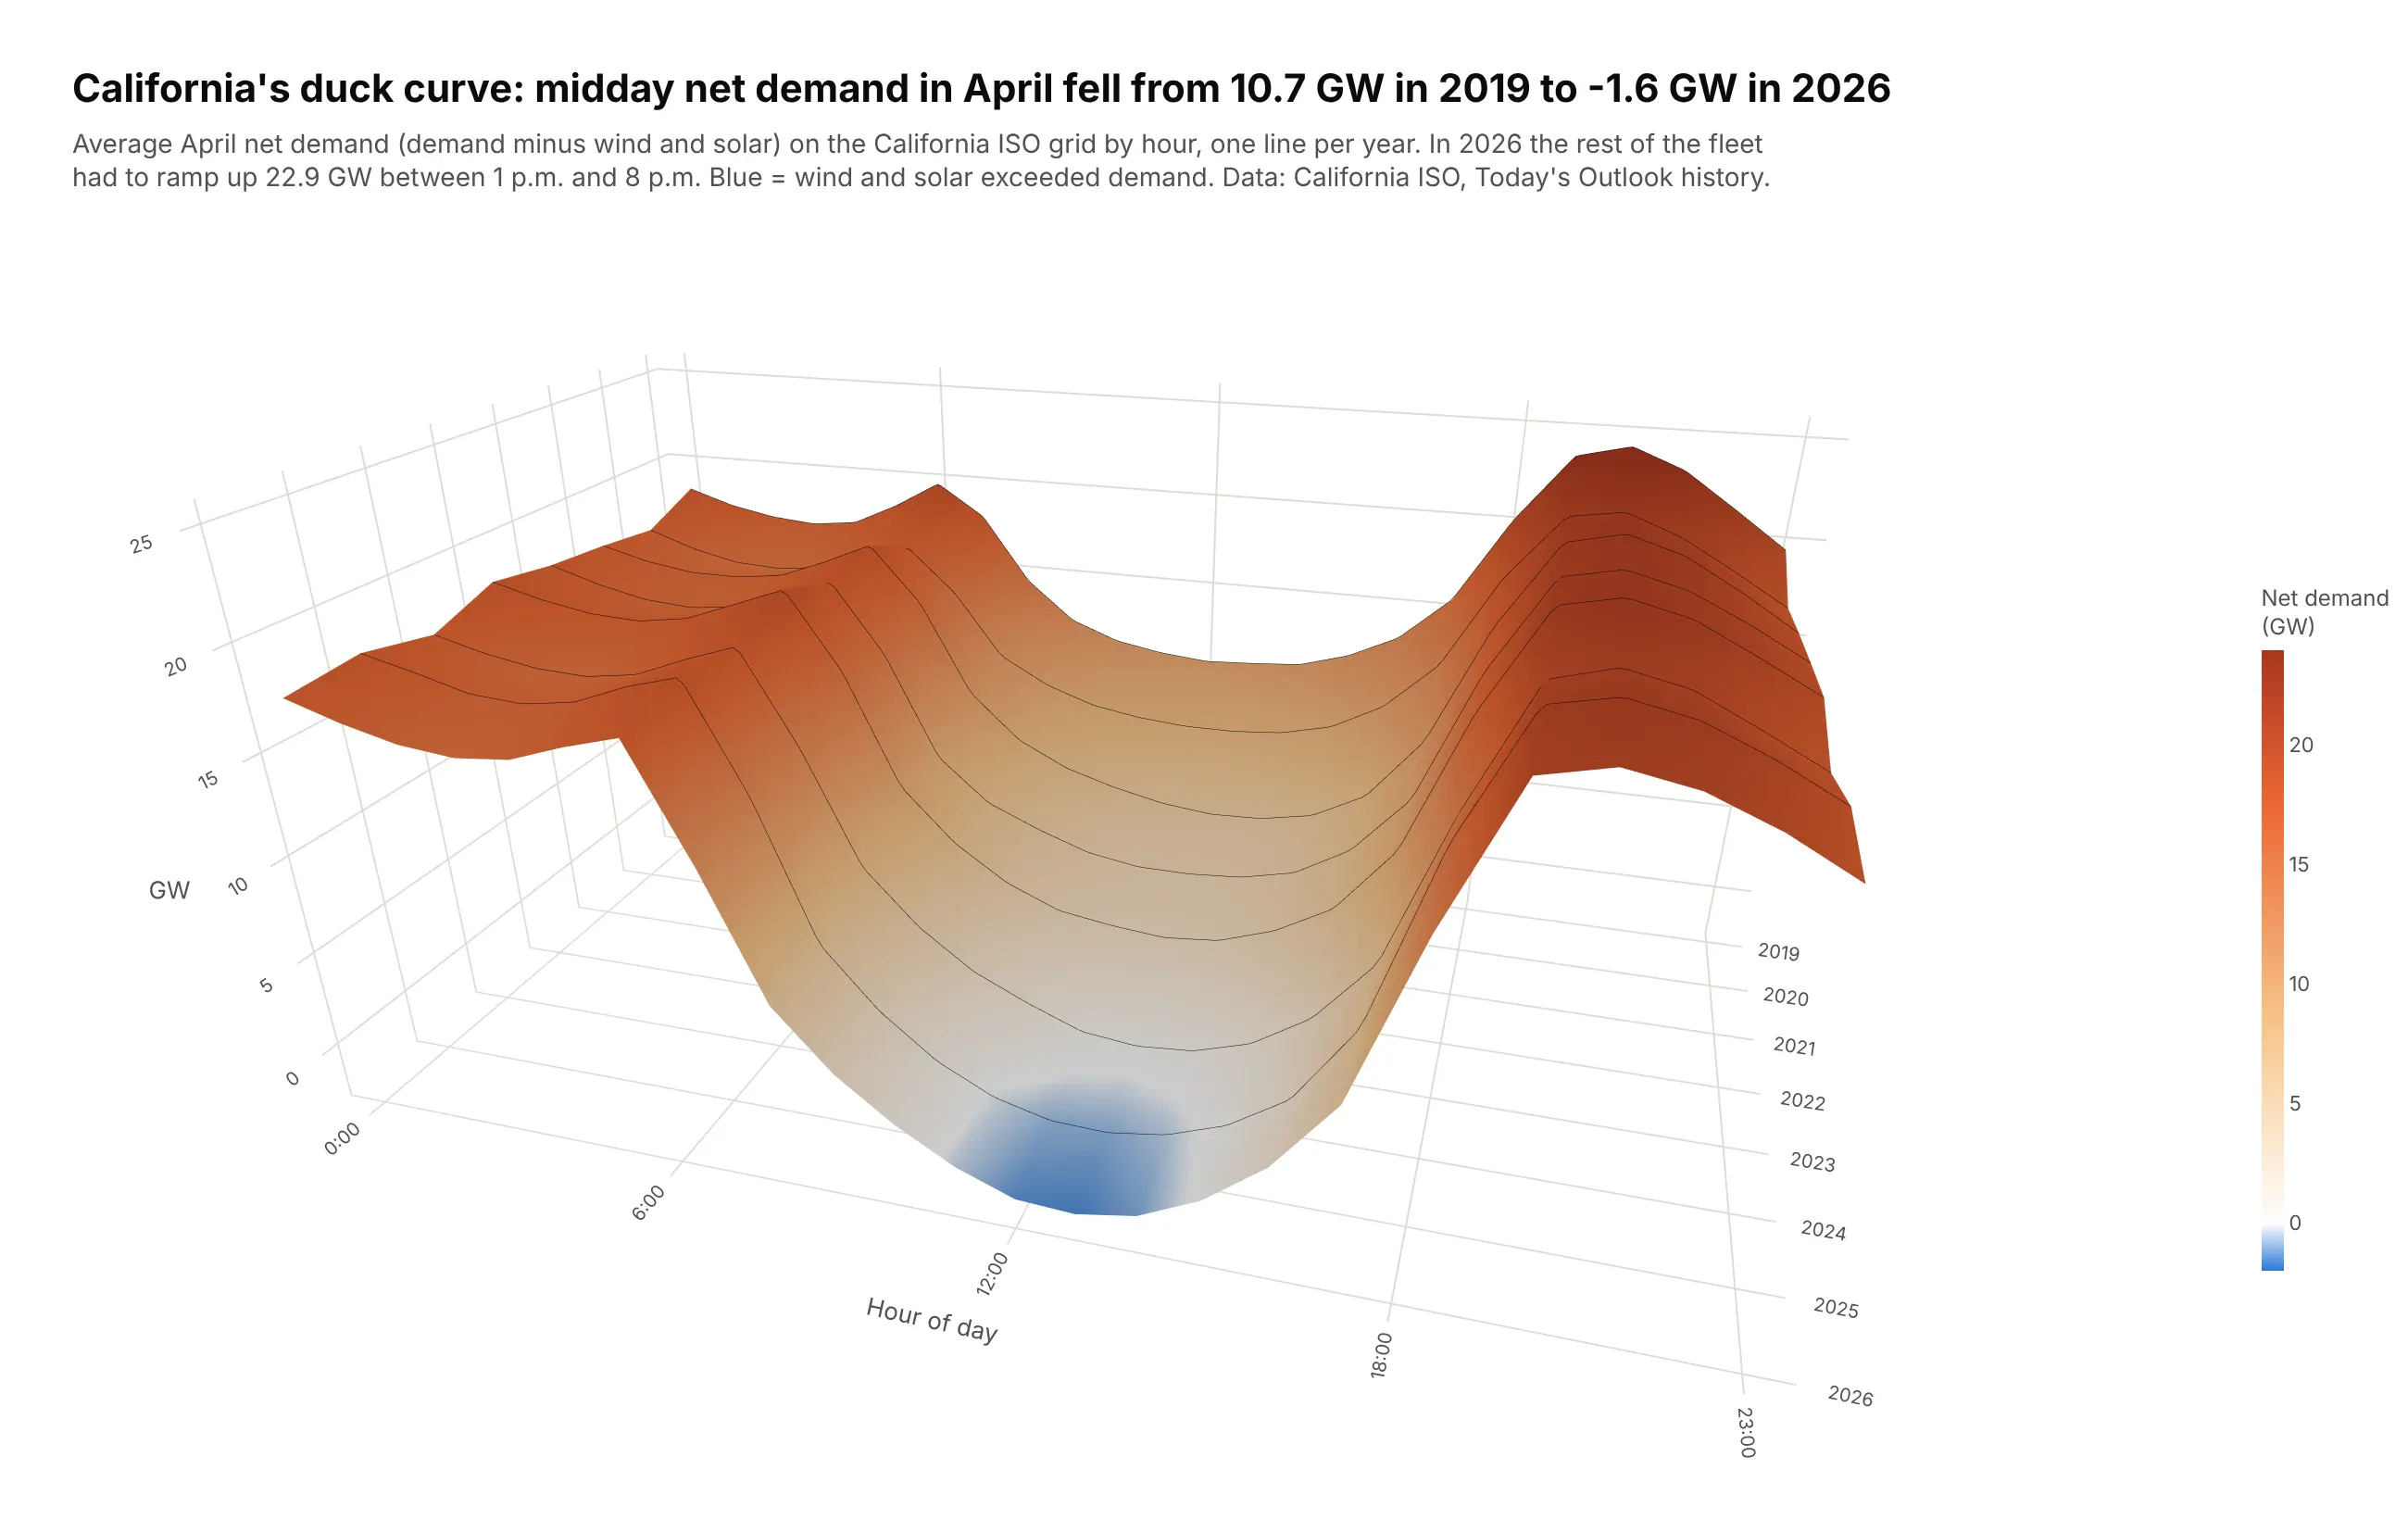
A 3D surface plot draws a value measured over a grid of two variables as a sheet, so ridges, valleys, slopes and cliffs are visible at once. Use one when the shape is the point, as with terrain, volatility surfaces, yield curves over time or power output by hour and day. Also known as surface plots, surface charts and 3-D surface charts.
Read the complete guide to 3D surface plots
Maps, terrain and direction
These charts put values on a map, on a grid of terrain or around a compass.
Choropleth map
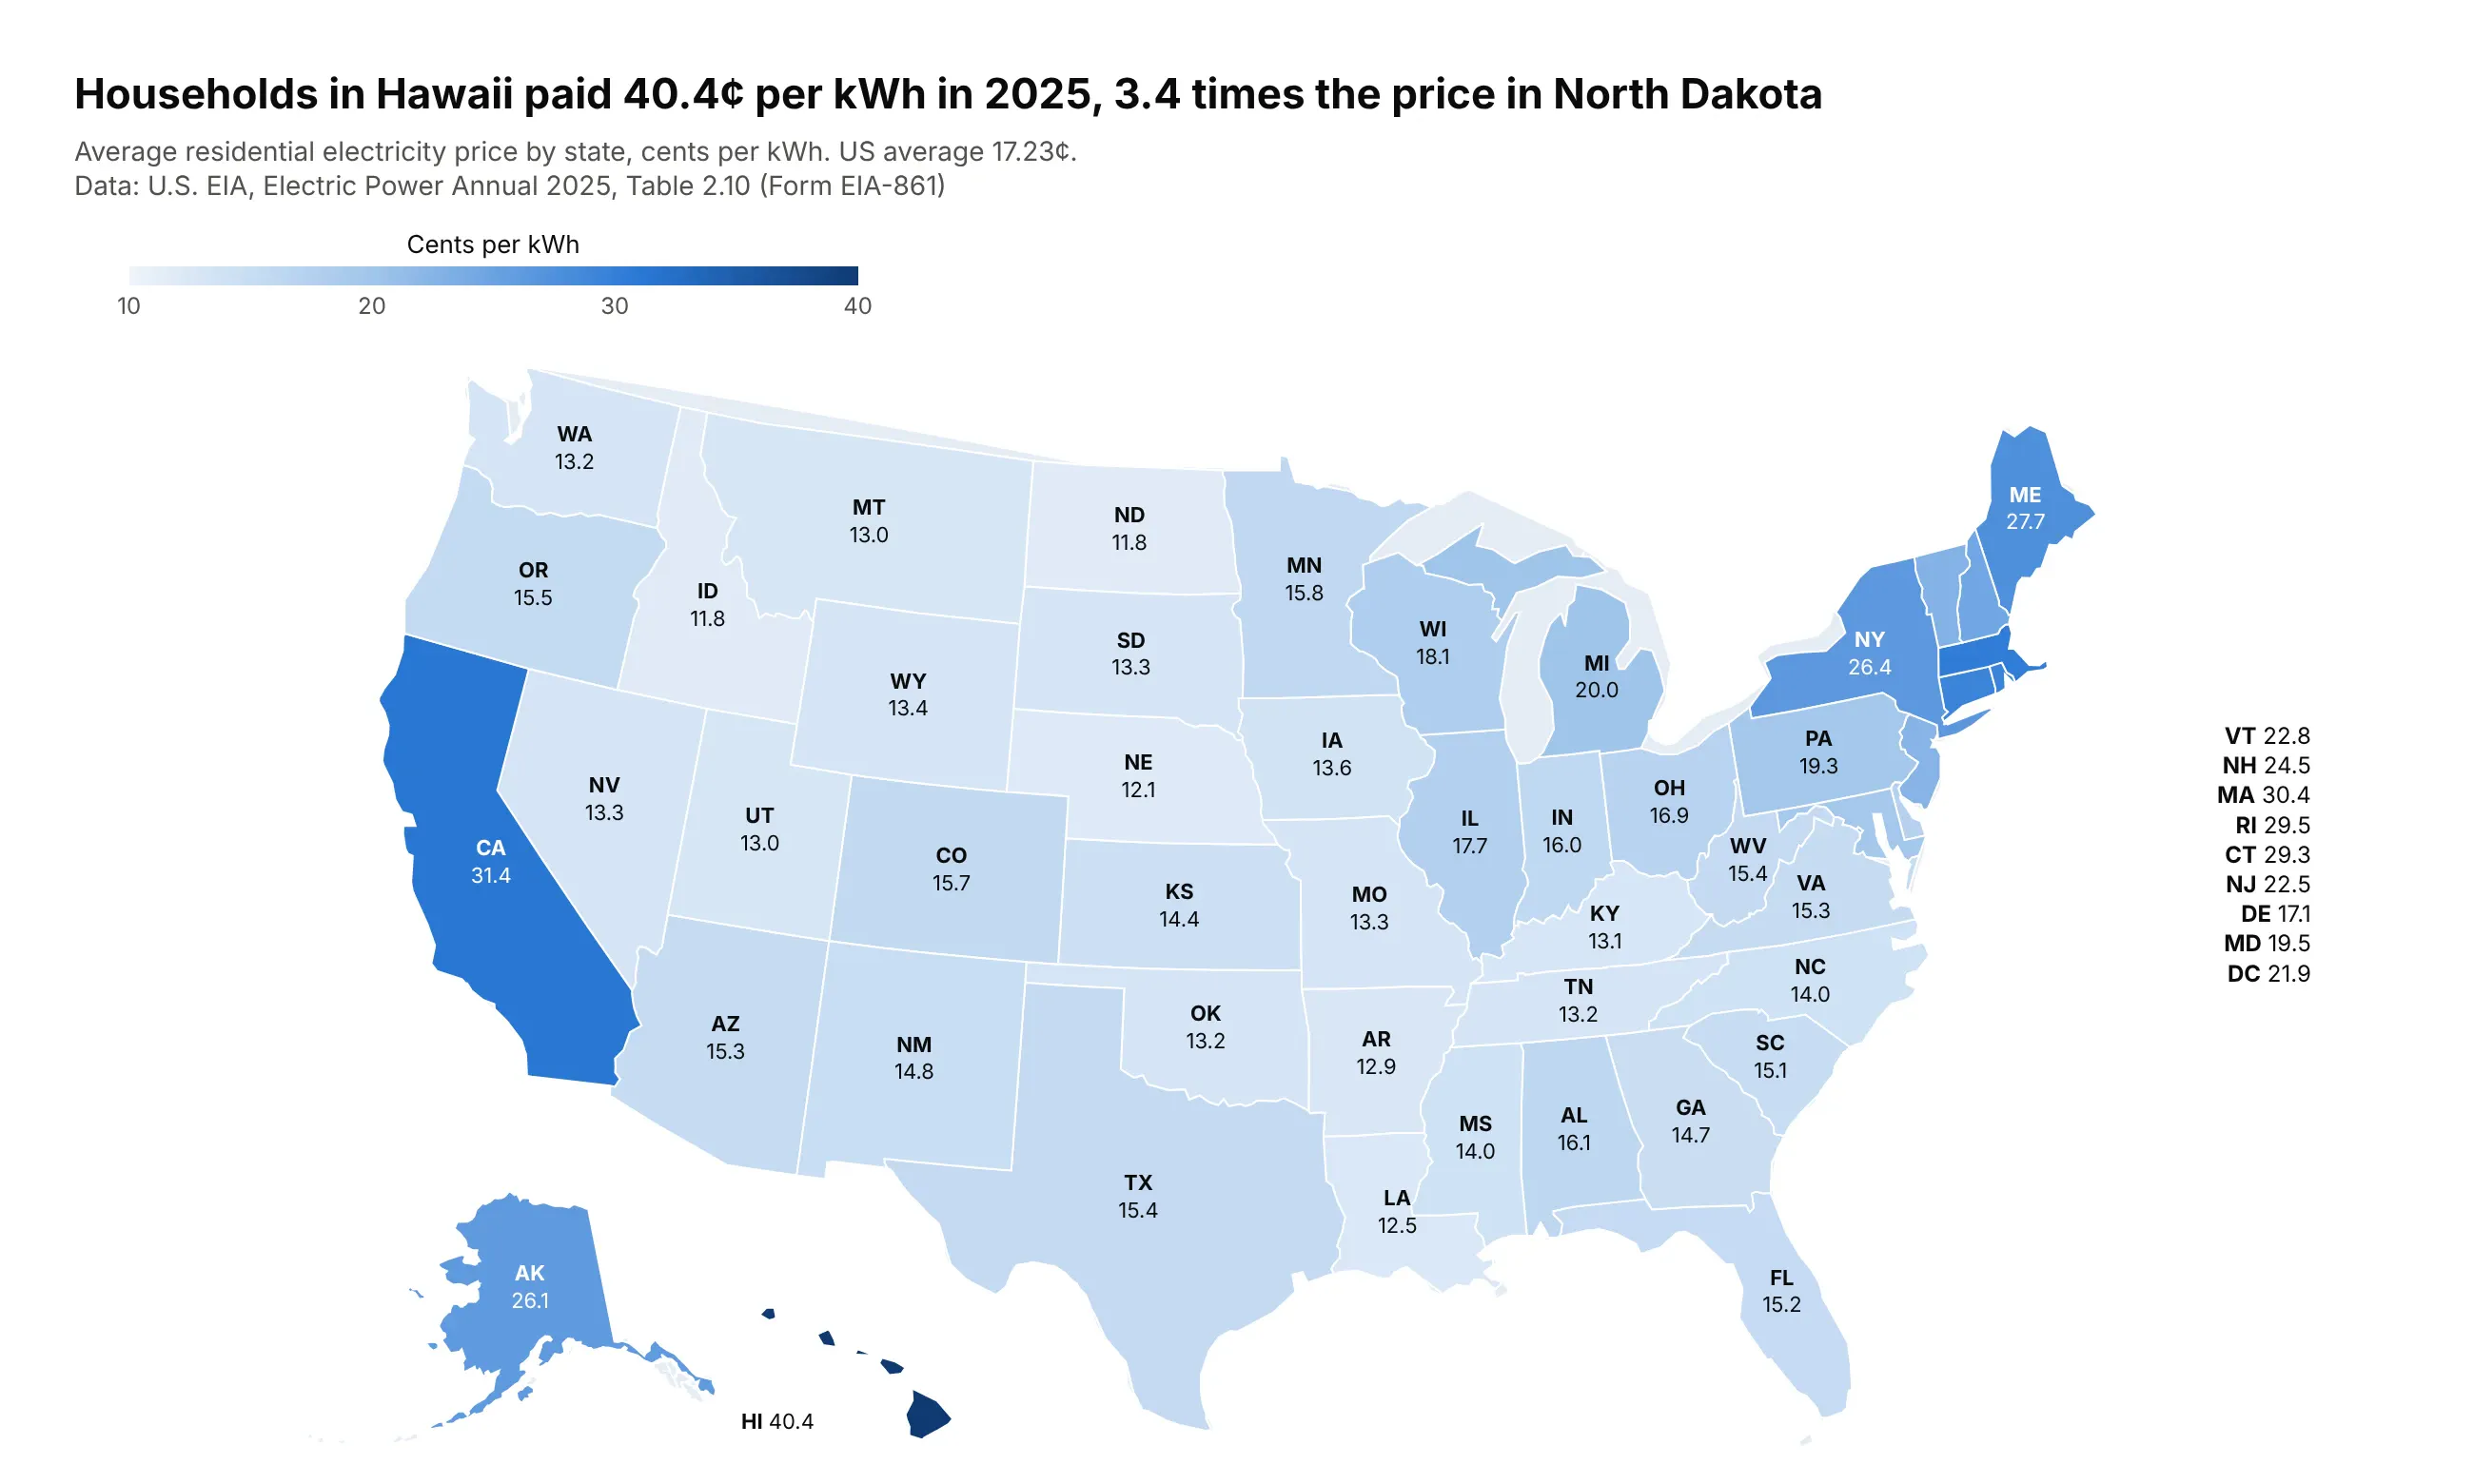
A choropleth map colors each region (a country, state, county or any shape you have) by a value for that region, so you can see where a rate is high and whether the high values cluster. Map rates, not counts, because a map of totals mostly shows where people live. Also known as filled maps.
Read the complete guide to choropleth maps
Contour plot
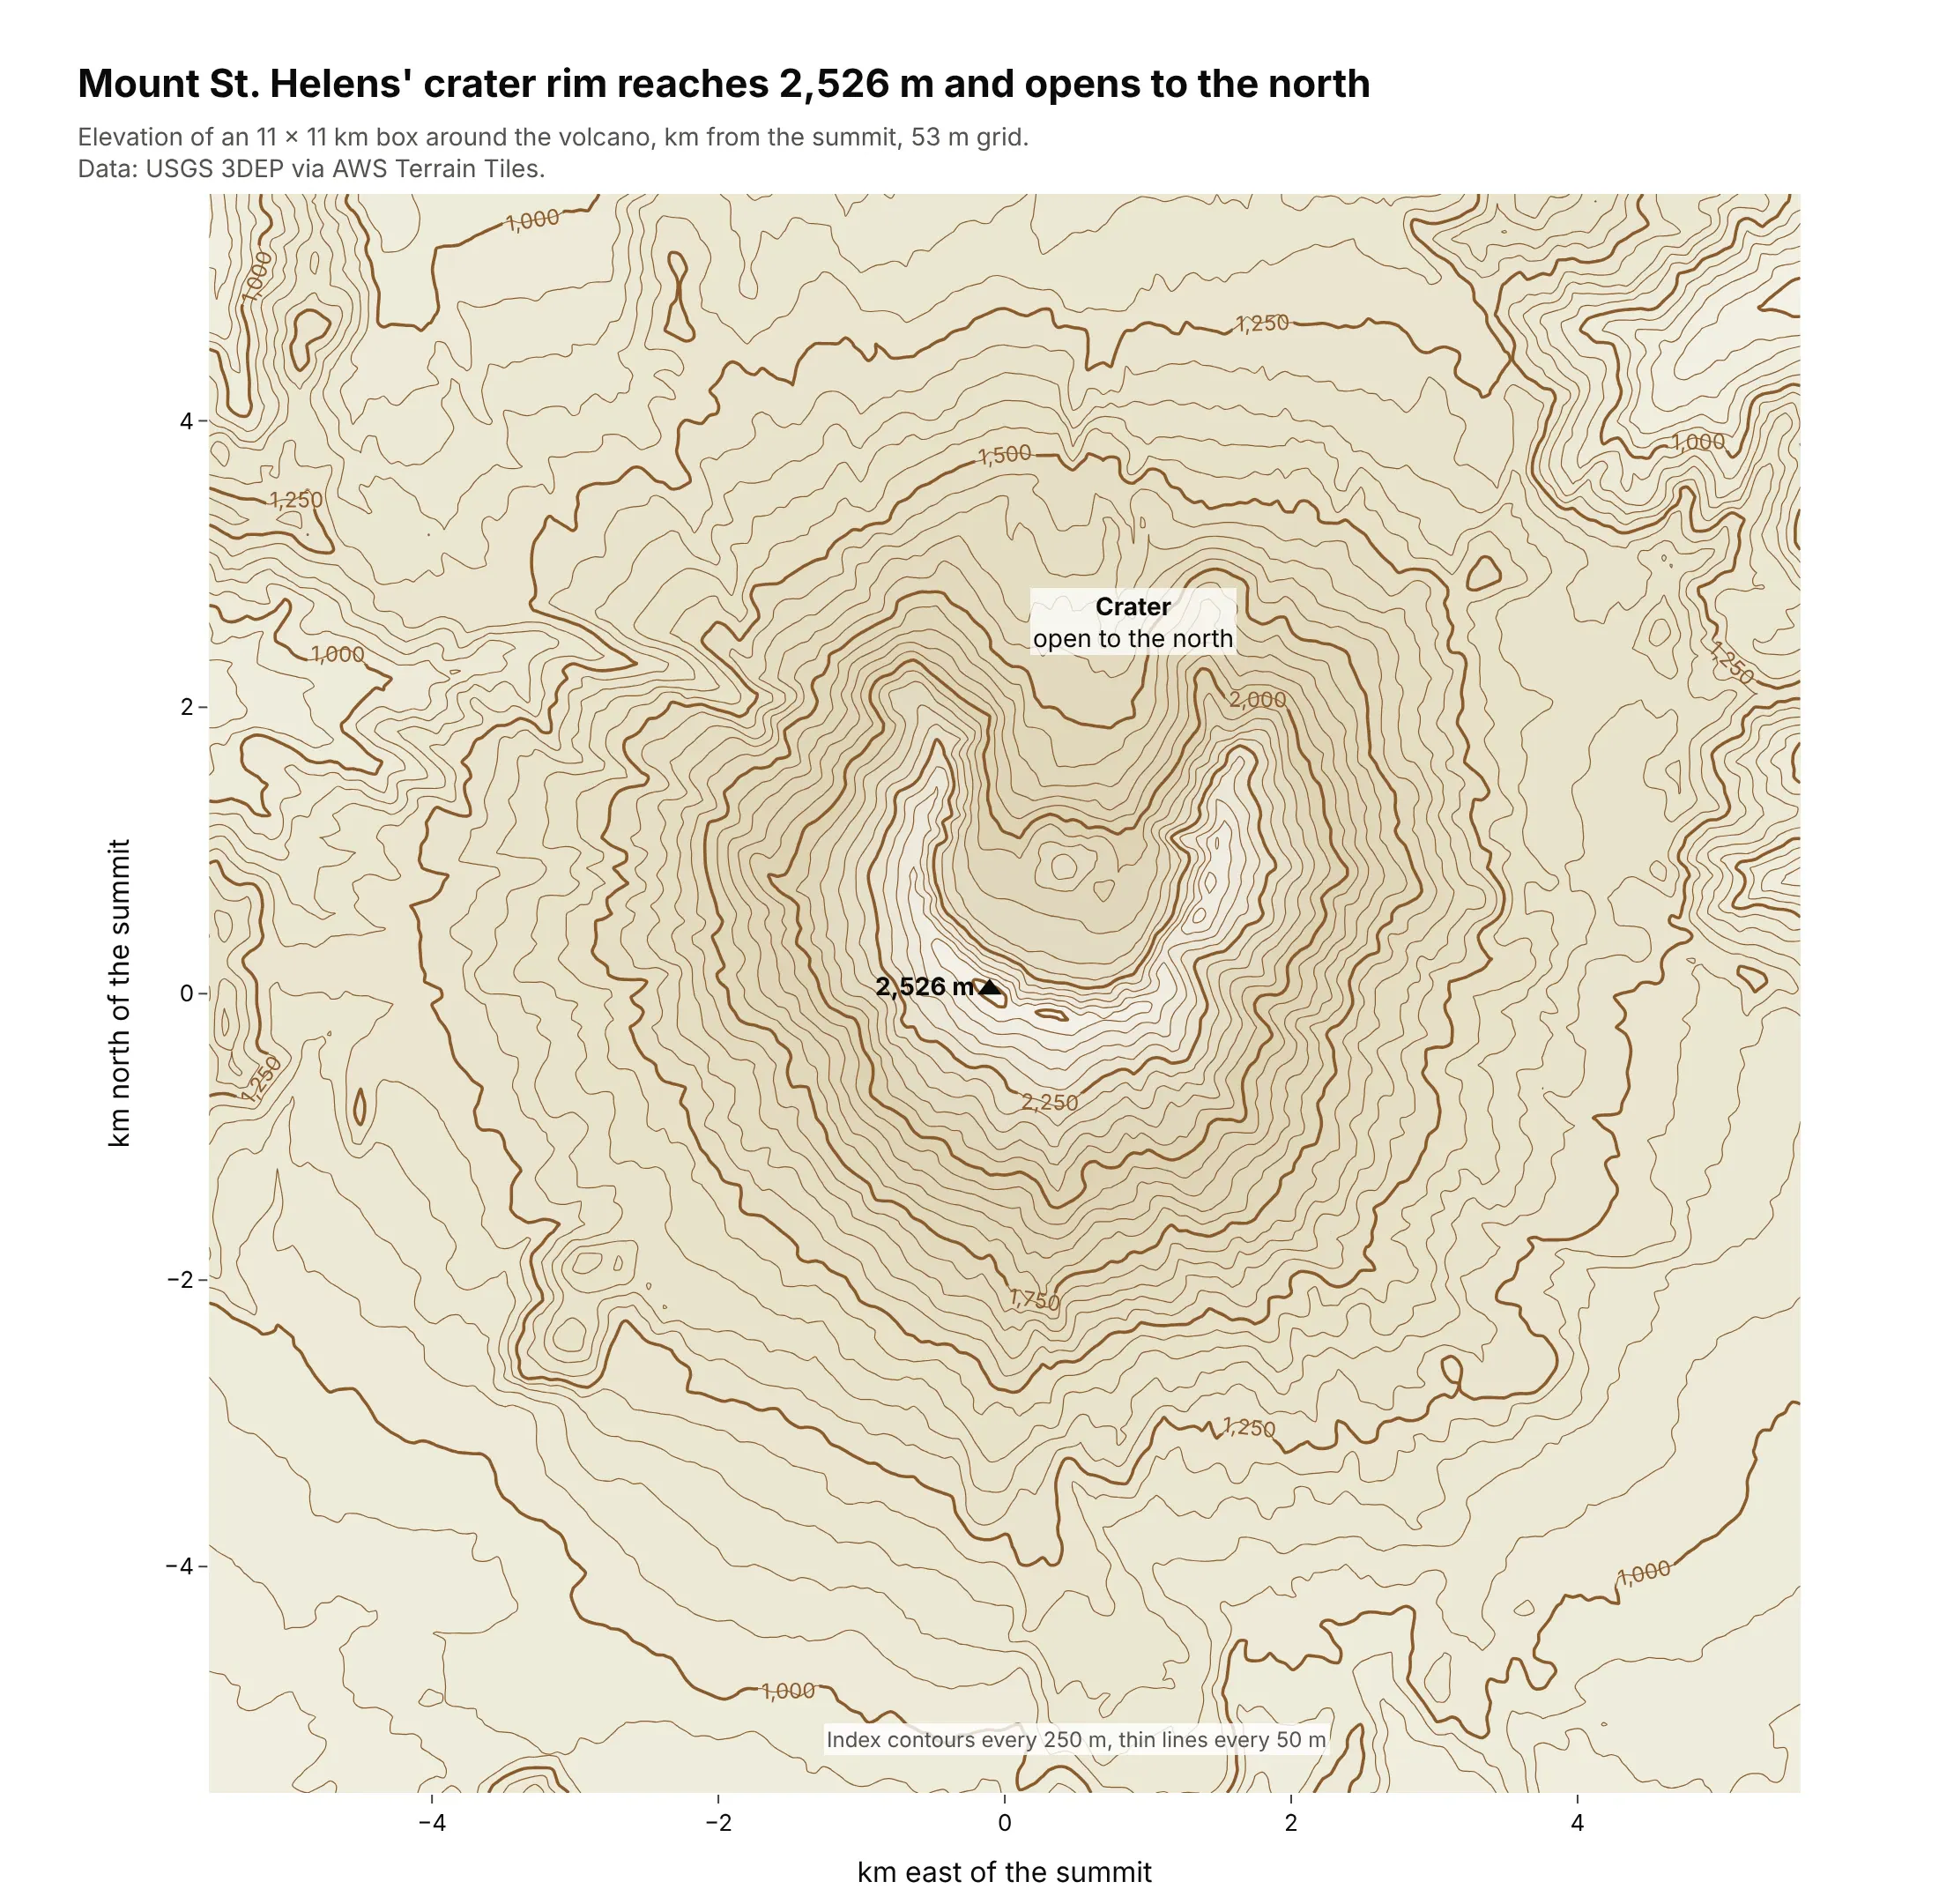
A contour plot draws lines of equal value across two dimensions, such as equal elevation on a topographic map or equal pressure on a weather map. Use one for a smooth quantity measured on a grid, or for the density of thousands of overlapping points. Also known as contour maps, contour charts and contour graphs.
Read the complete guide to contour plots
Wind rose
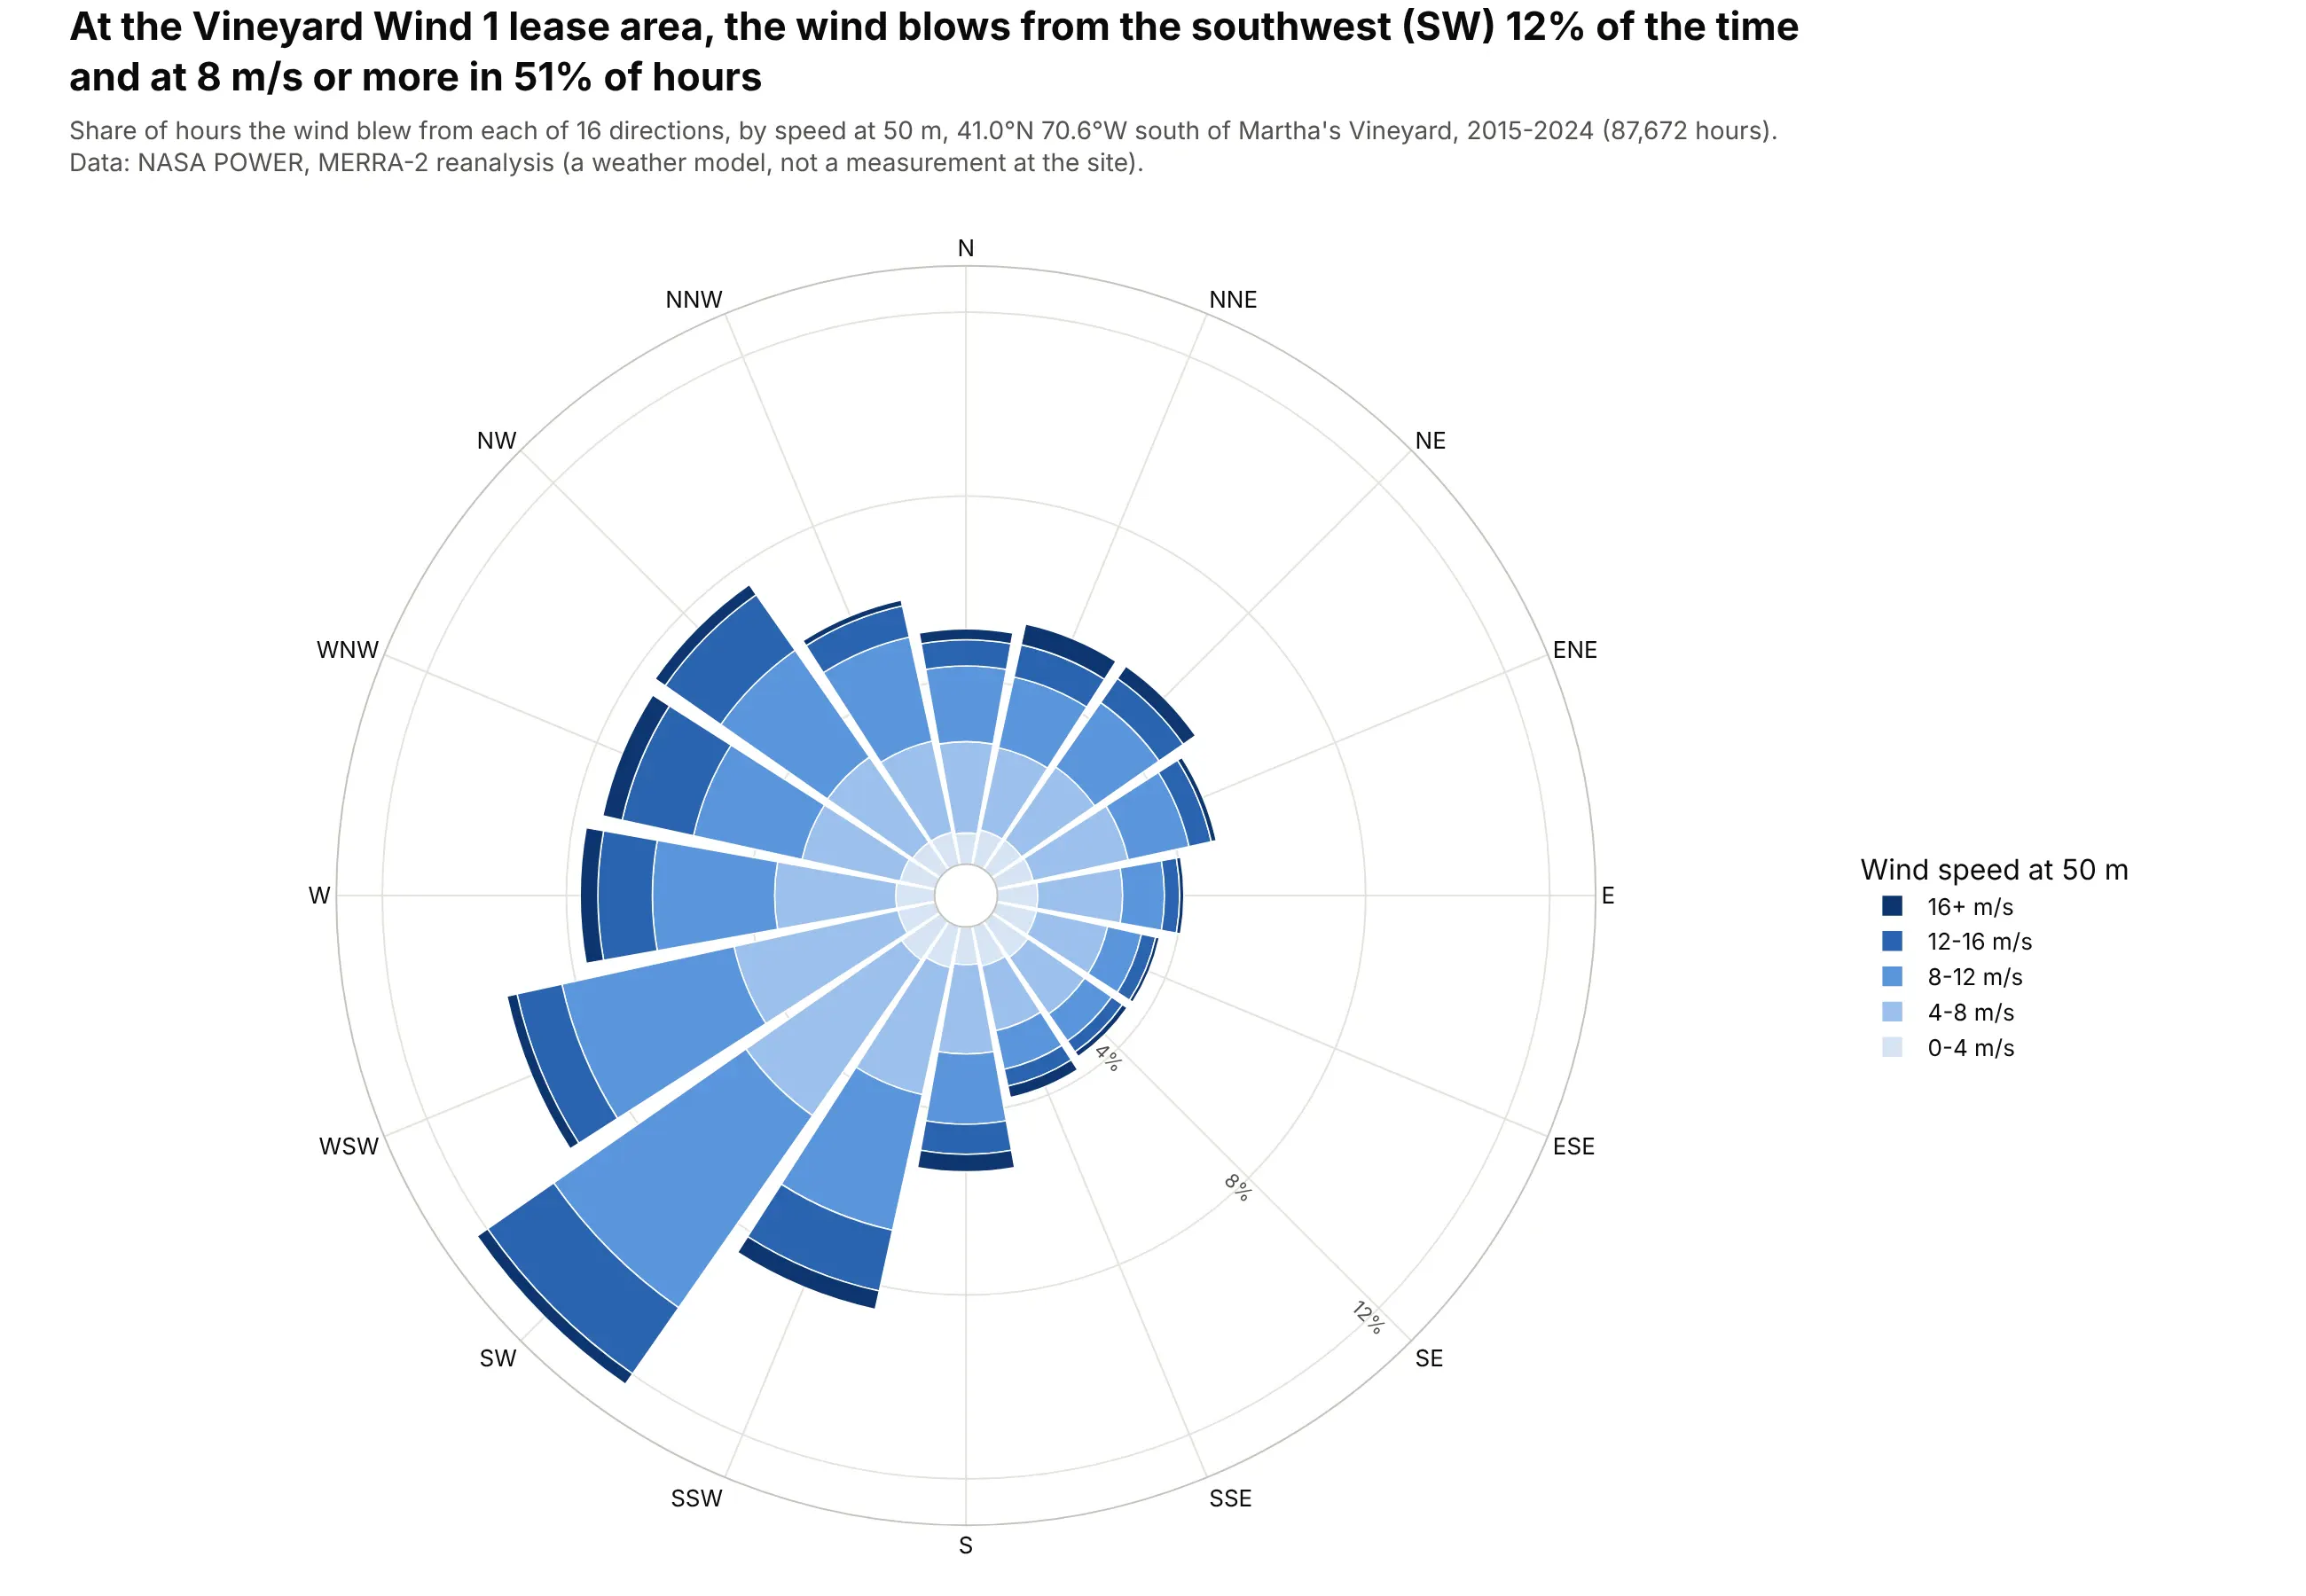
A wind rose is a polar bar chart of how often the wind blows from each direction, with each bar split into speed bands. Use one when direction is the question, such as siting a wind turbine or a runway, and for anything else with a direction or a cycle. Also known as wind rose charts and polar bar charts.
Read the complete guide to wind roses
Schedules and KPIs
These charts show when things happen and how a measure compares with its target.
Gantt chart
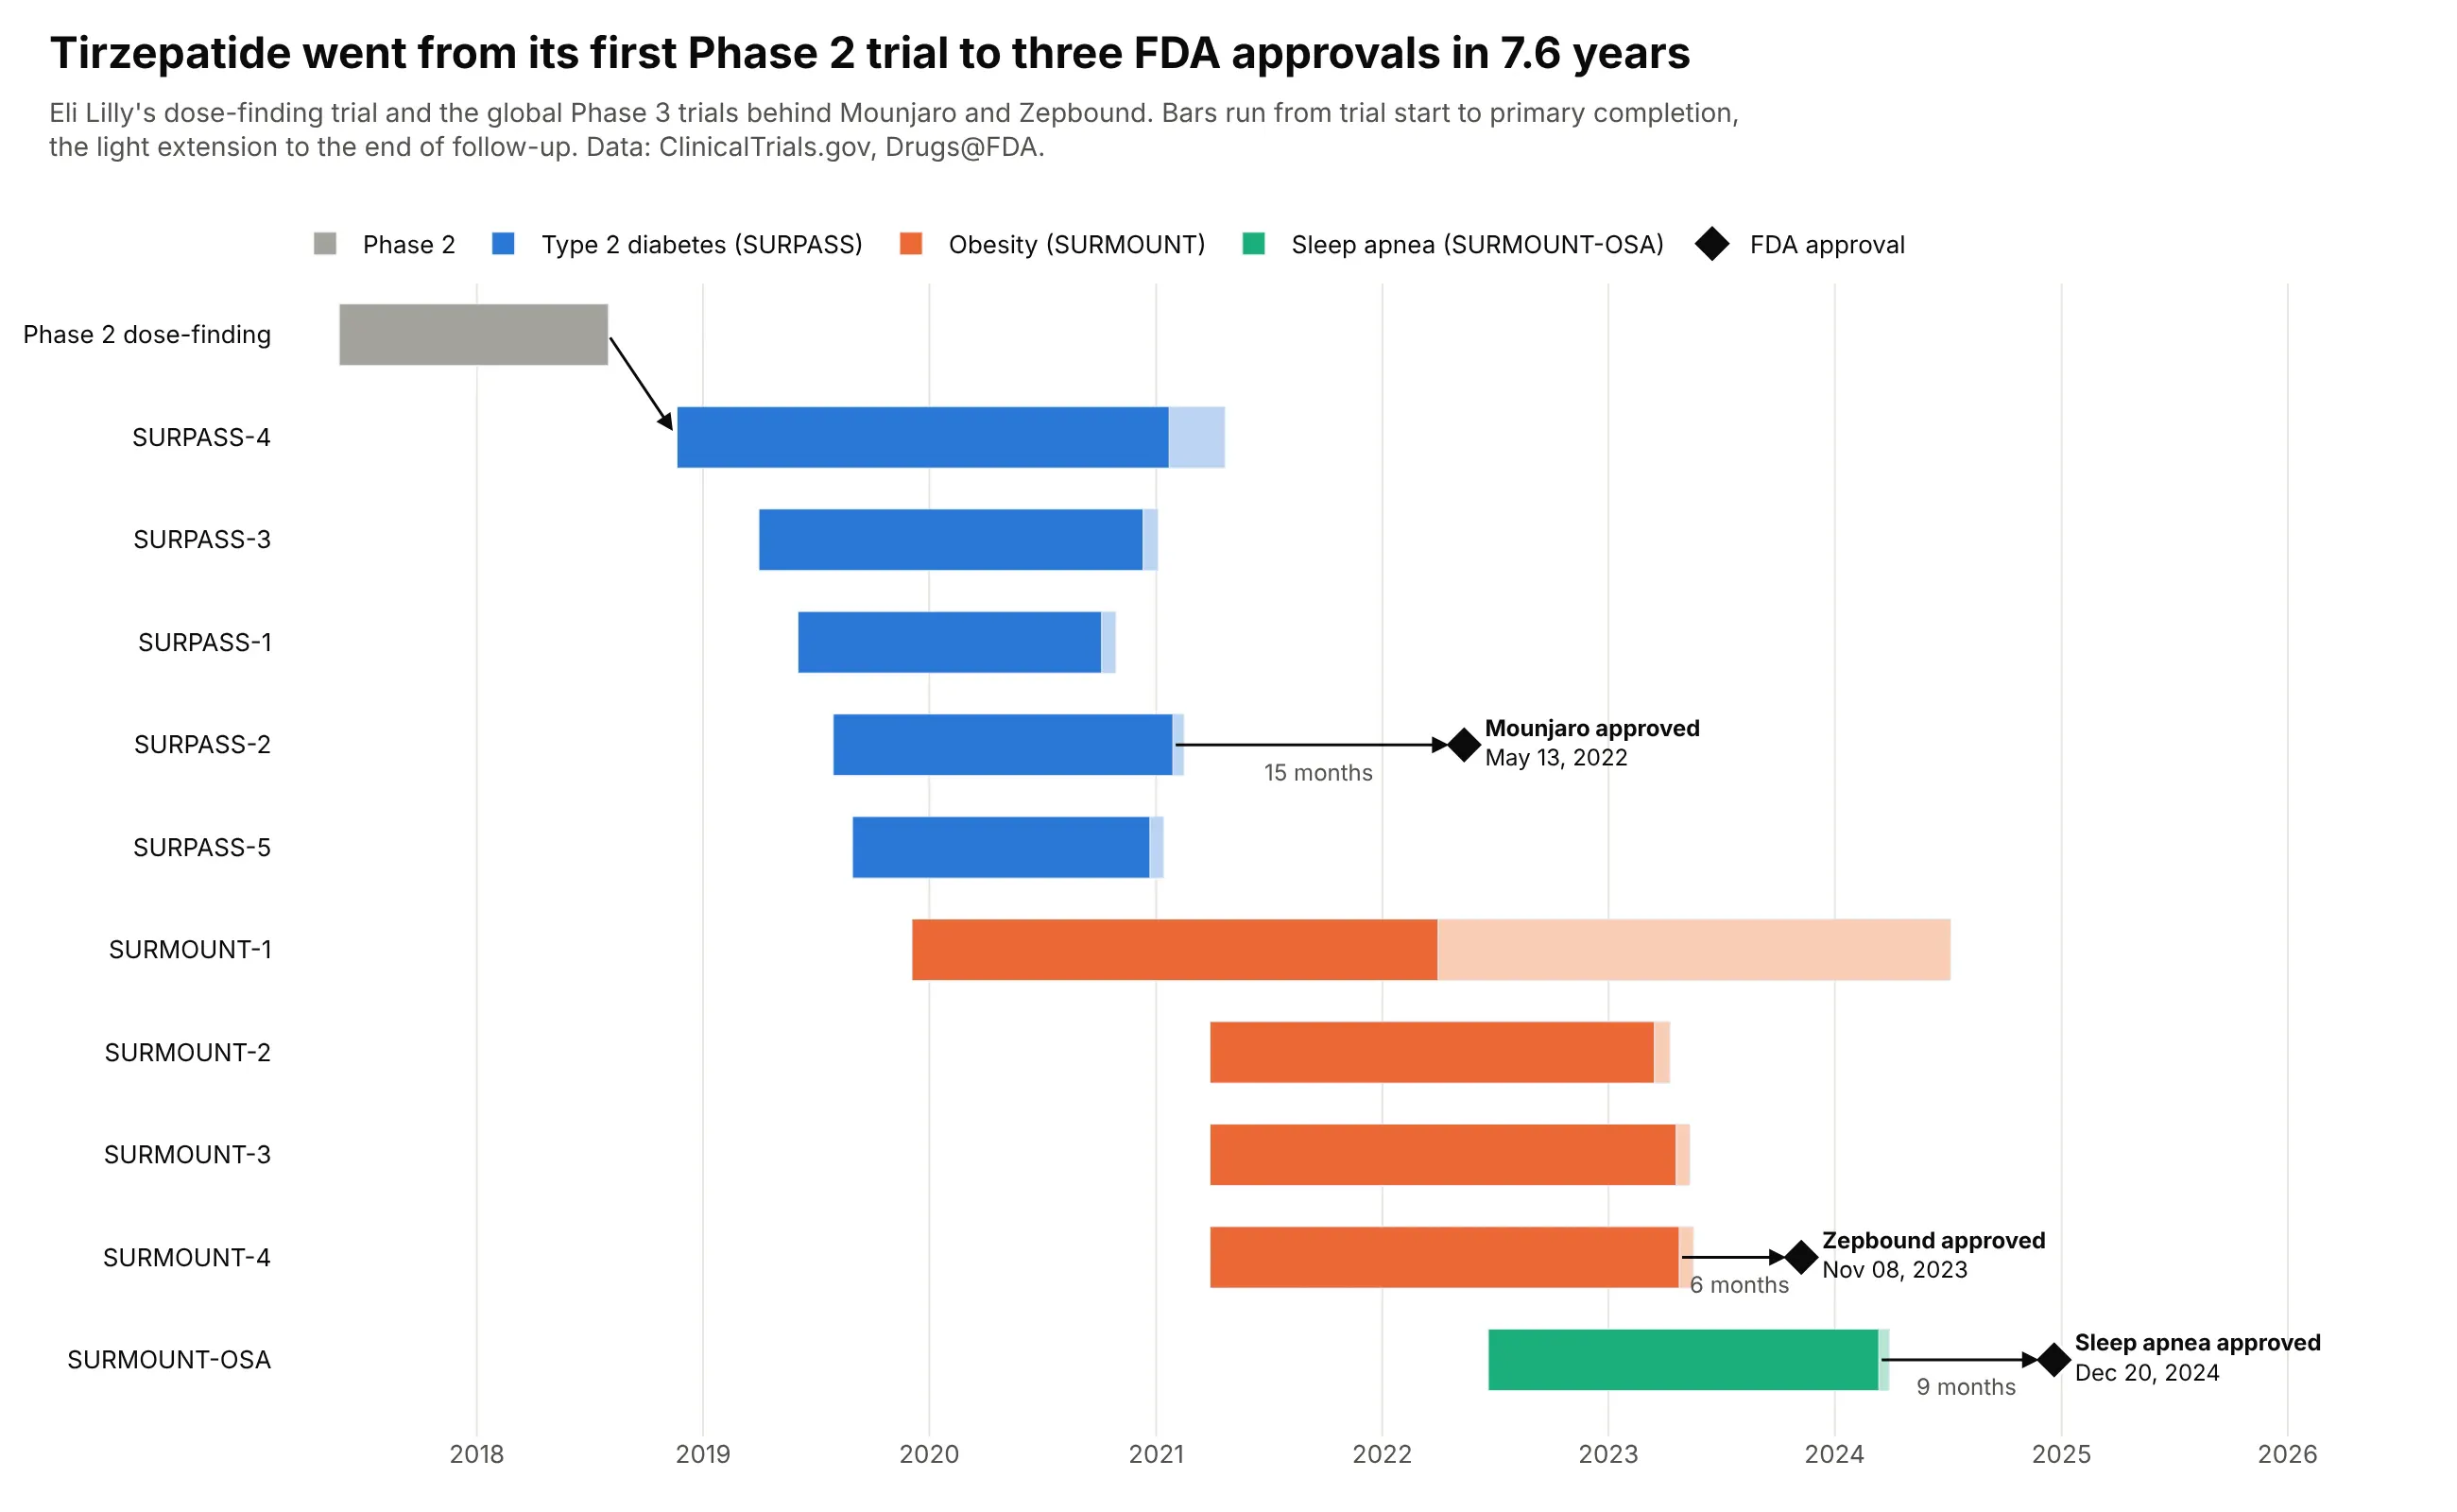
A Gantt chart draws each task, phase or event as a horizontal bar from its start date to its end date, one row per task, on a shared time axis. Use one for project plans, clinical trial programs, support windows and anything else where every item has a start and an end.
Read the complete guide to Gantt charts
Gauge chart
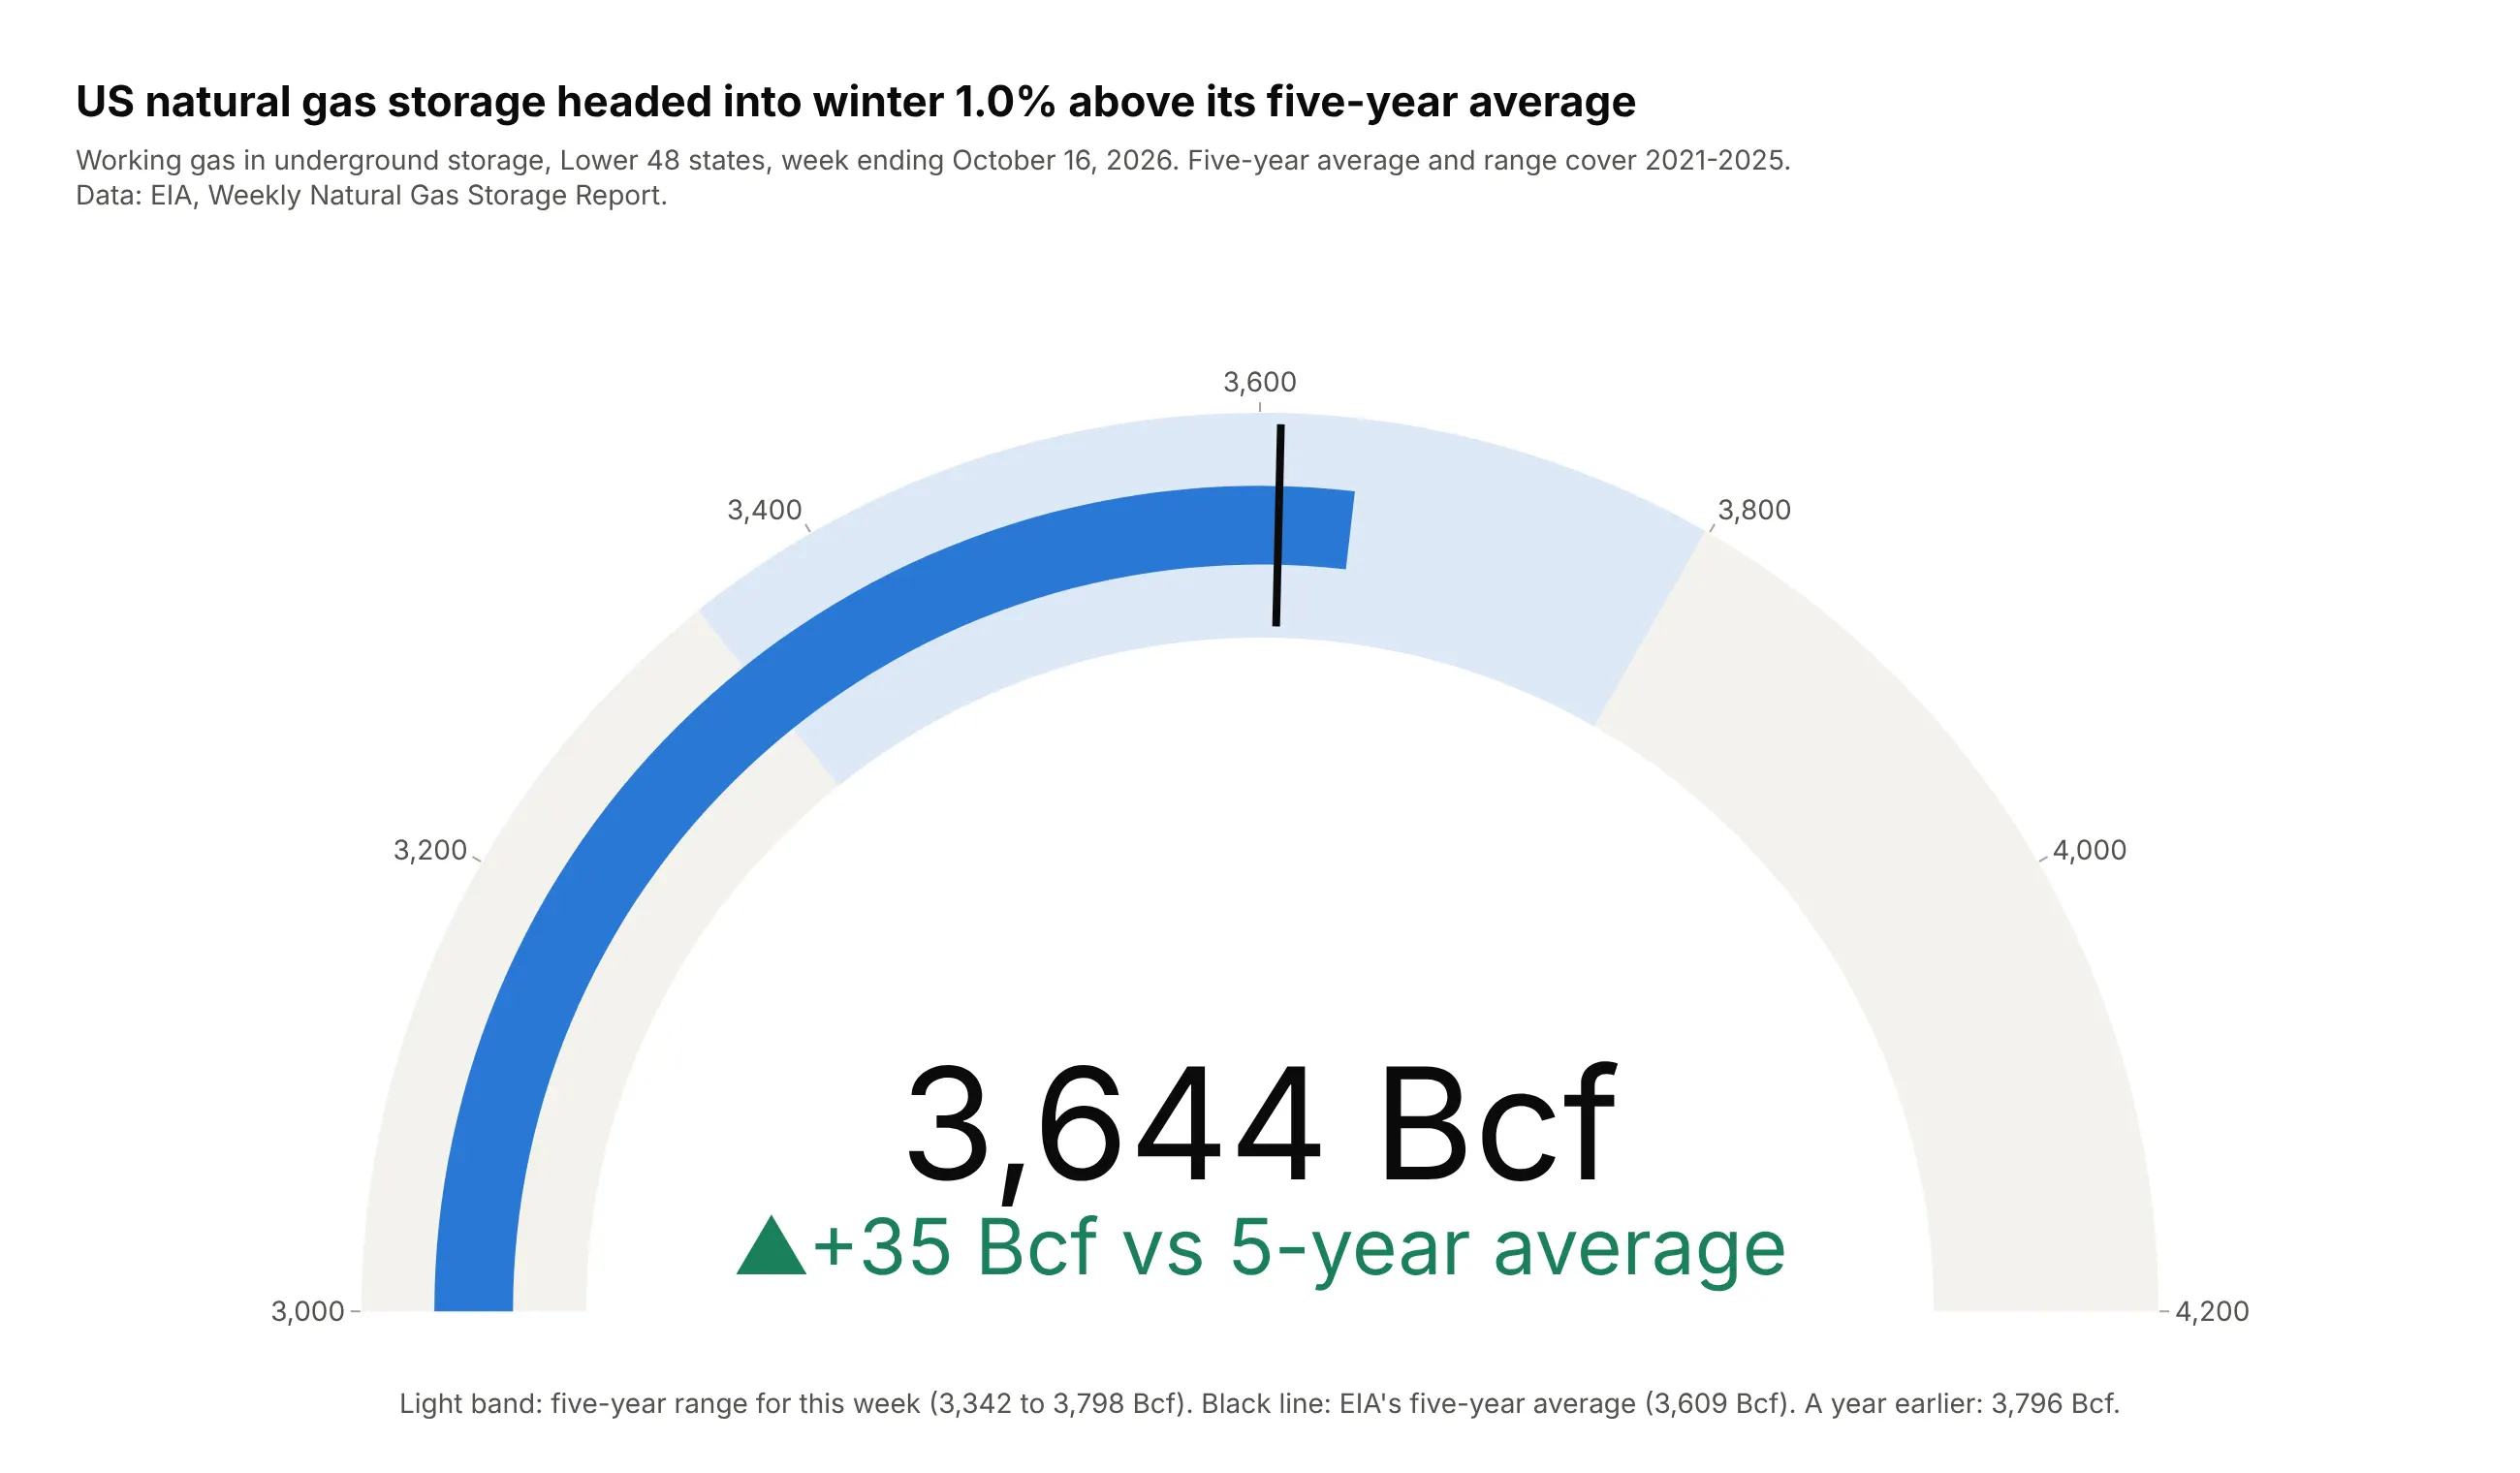
A gauge chart shows one value on a curved scale against a target, a limit or a set of bands. Use one when a single KPI against a known target is the whole message, and a bullet chart for a panel of KPIs. Also known as speedometer charts, dial charts and radial gauges.
Read the complete guide to gauge charts
Bullet chart
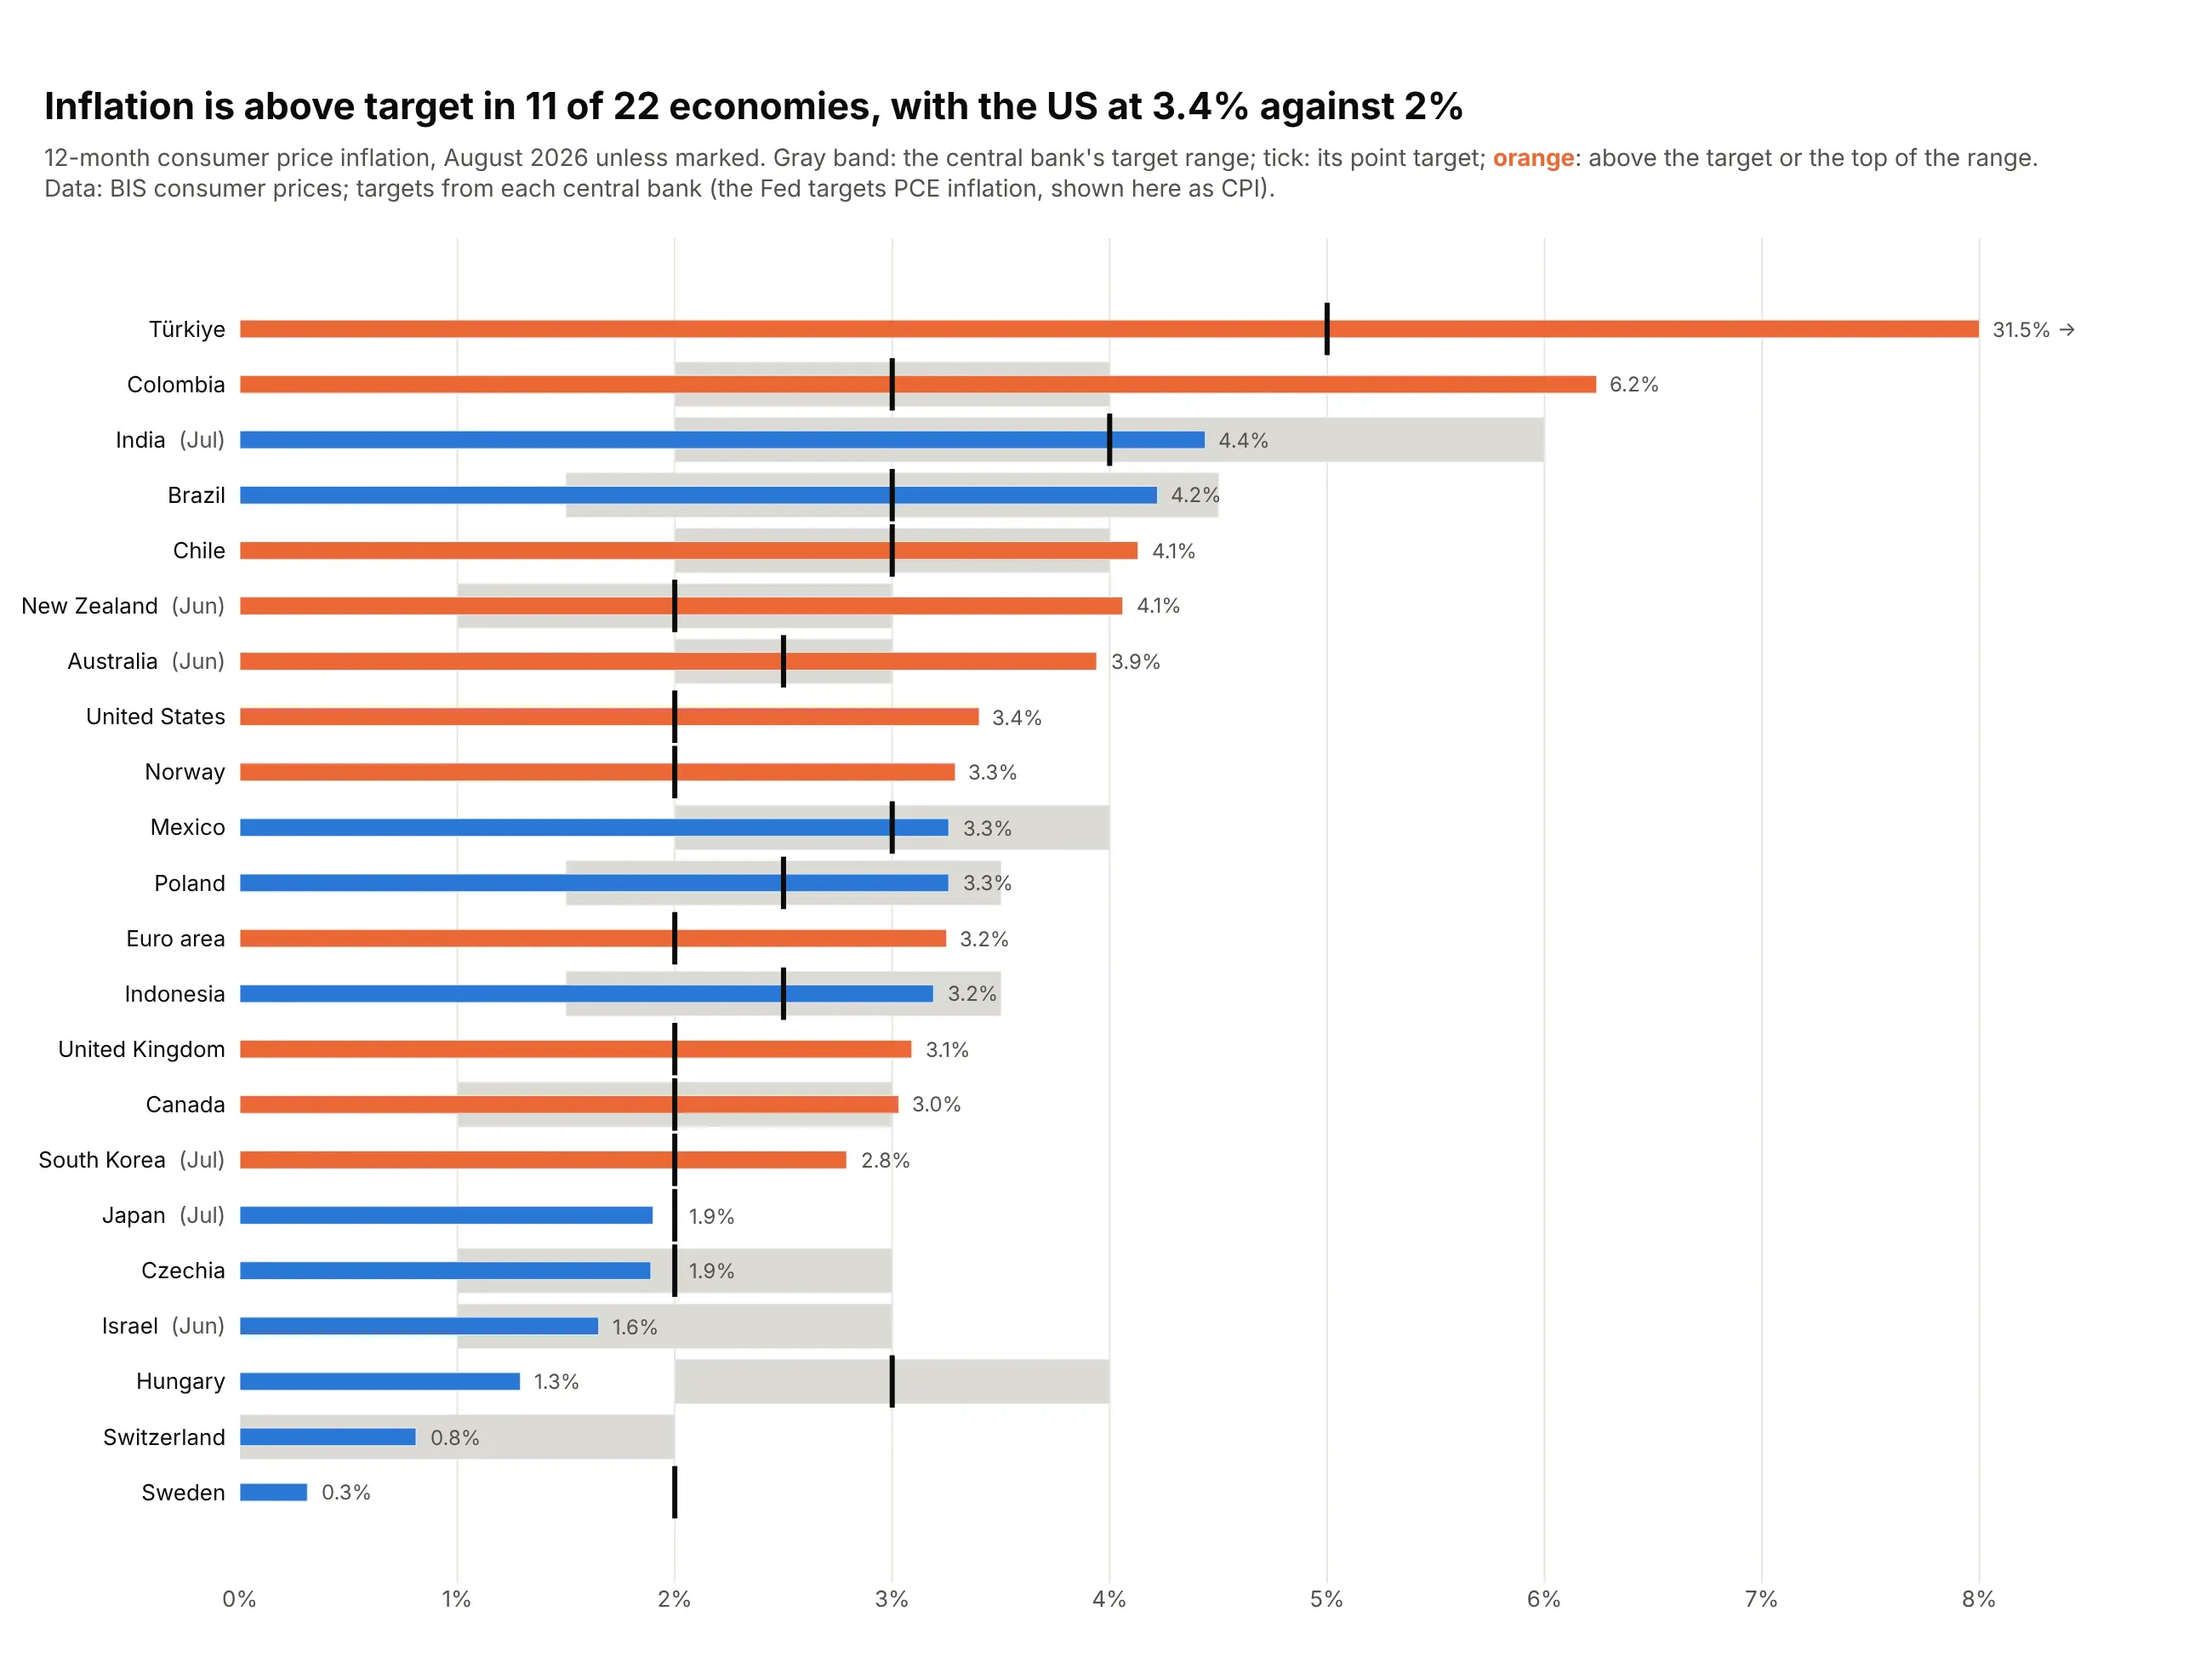
A bullet chart, or bullet graph, is a thin bar for a measured value, a short line for its target and gray bands behind them for poor, fair and good. Use one when every value has a target or a benchmark, such as KPIs against plan, because it fits dozens of rows in the space of a few gauges.
Read the complete guide to bullet charts
Statistics and clinical charts
These two charts are standard in medical research and work just as well for reliability, A/B tests and customer data.
Forest plot
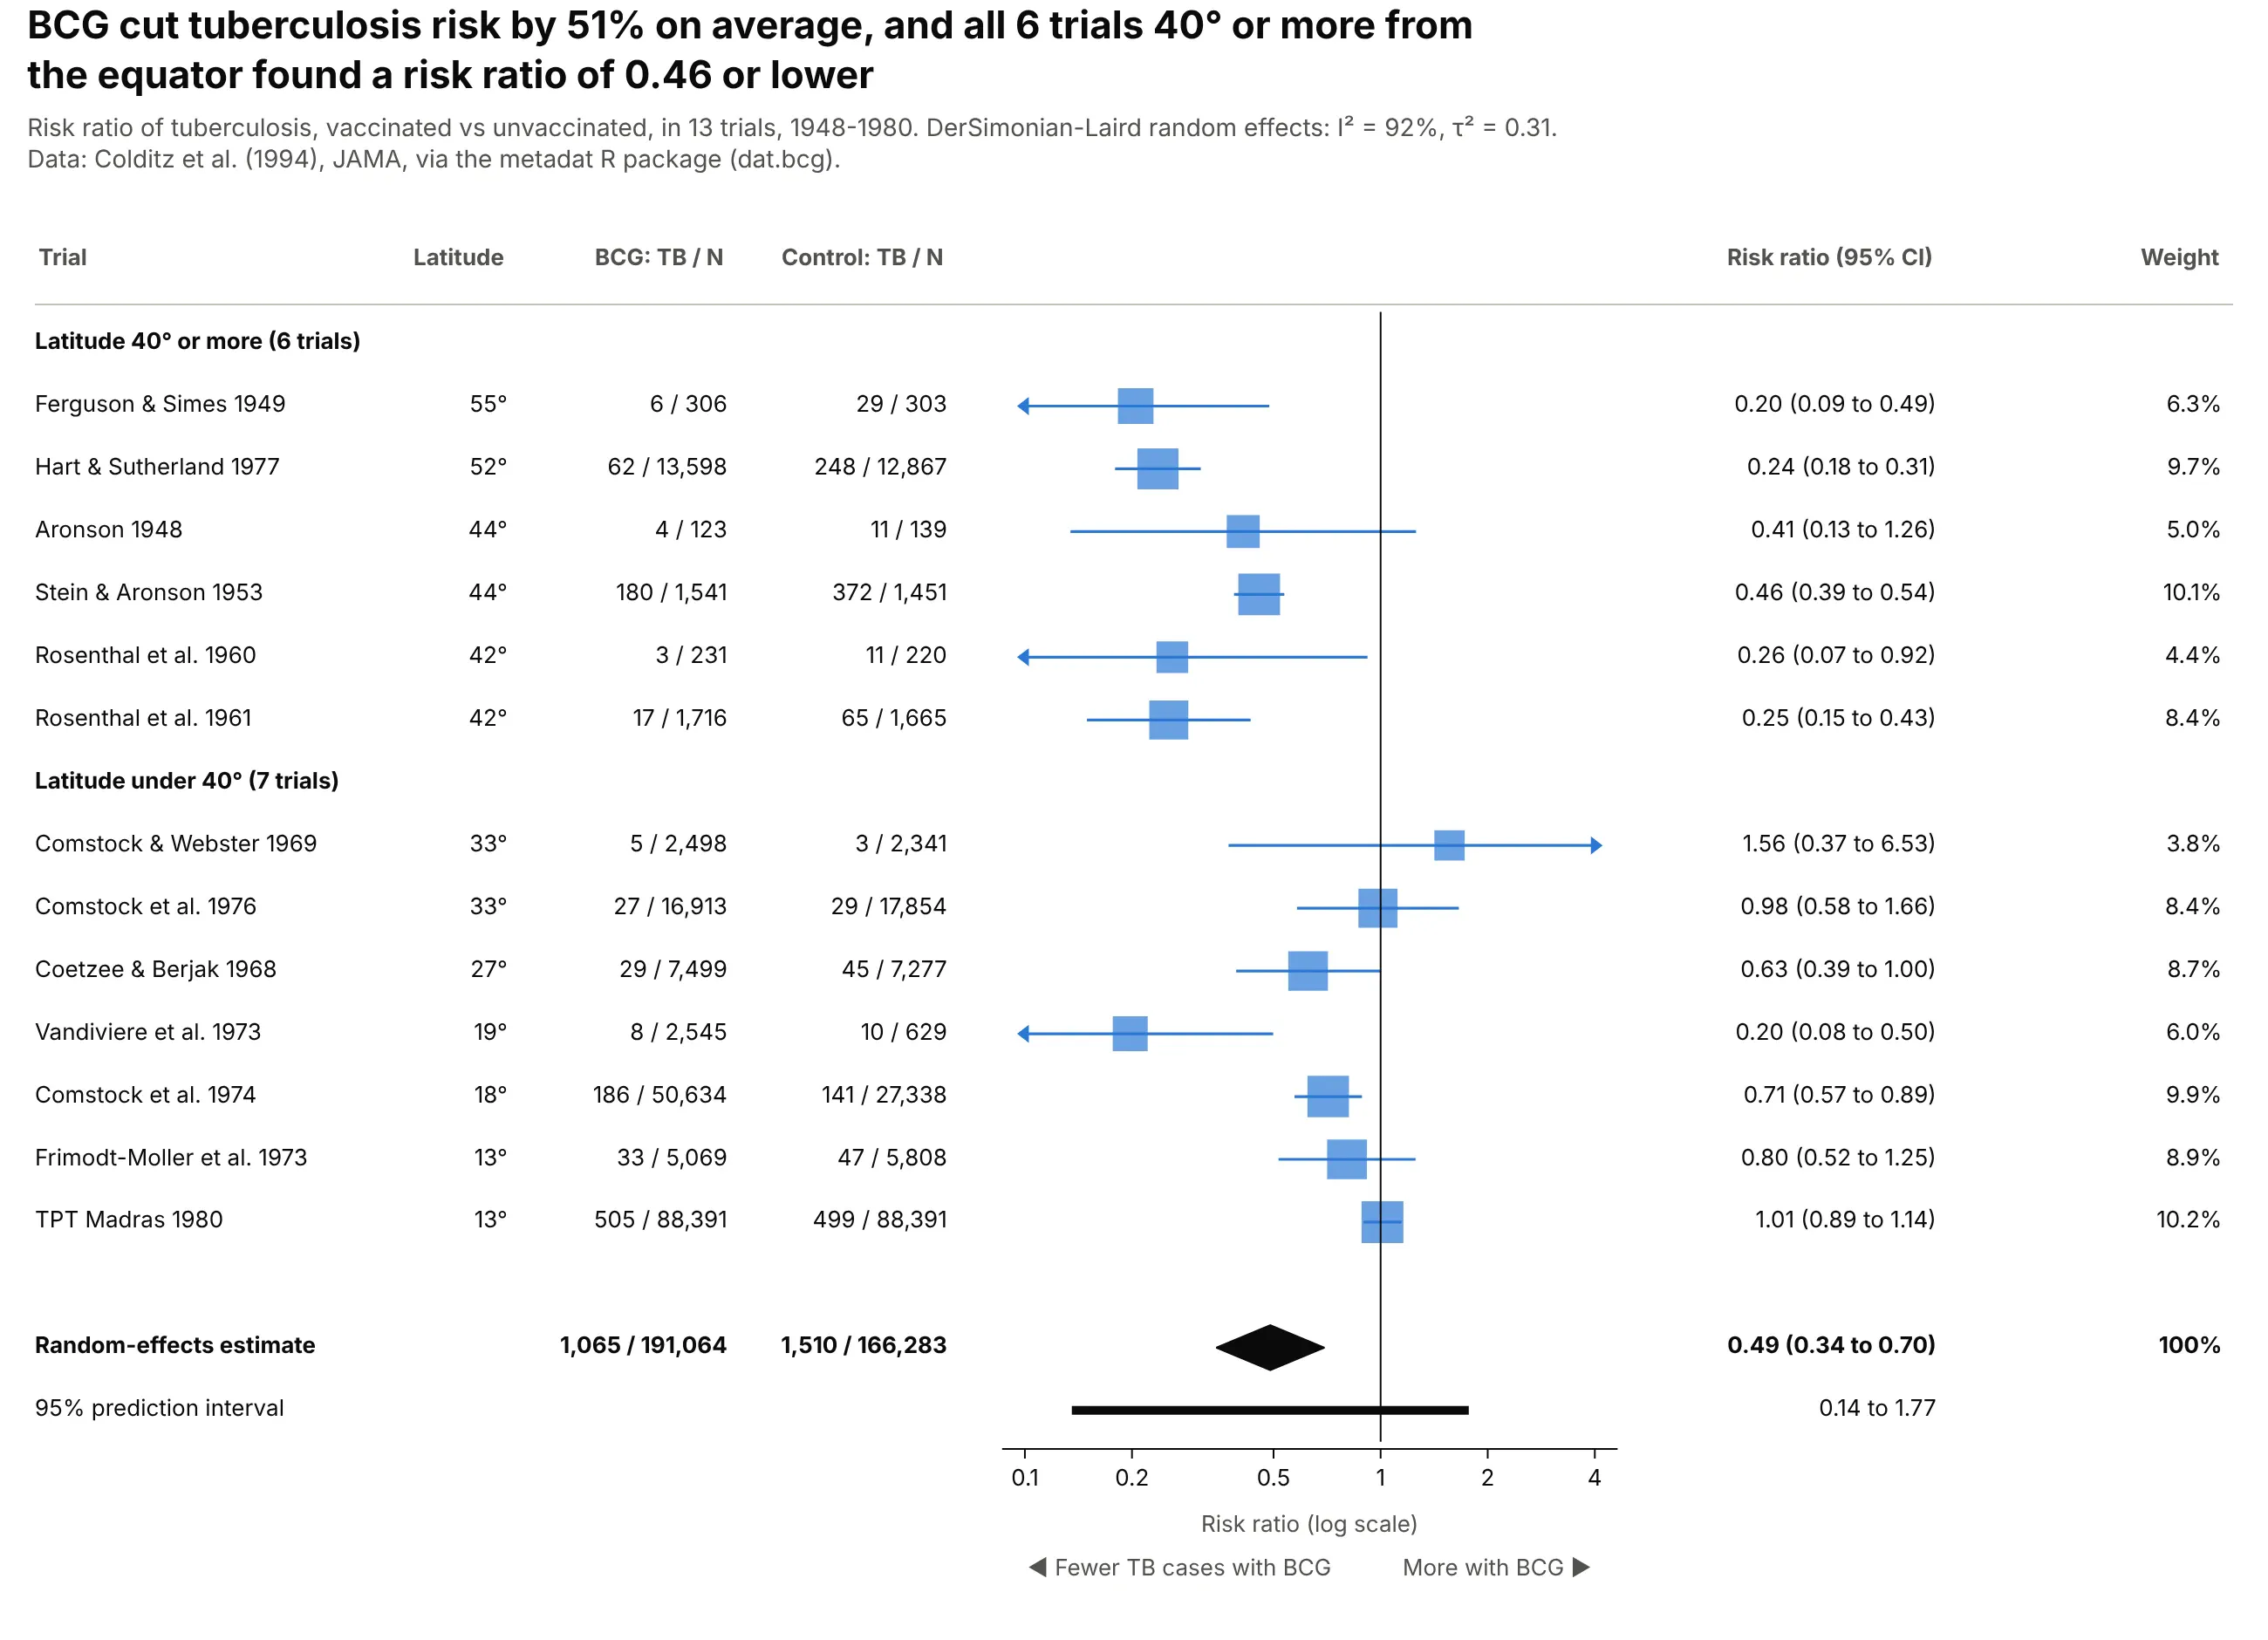
A forest plot puts one estimate per row (a trial, a subgroup, a regression coefficient) with its confidence interval on a shared axis, with a line at "no effect". It's the standard figure of meta-analysis and of subgroup results in clinical trials. Also known as blobbograms.
Read the complete guide to forest plots
Kaplan-Meier curve
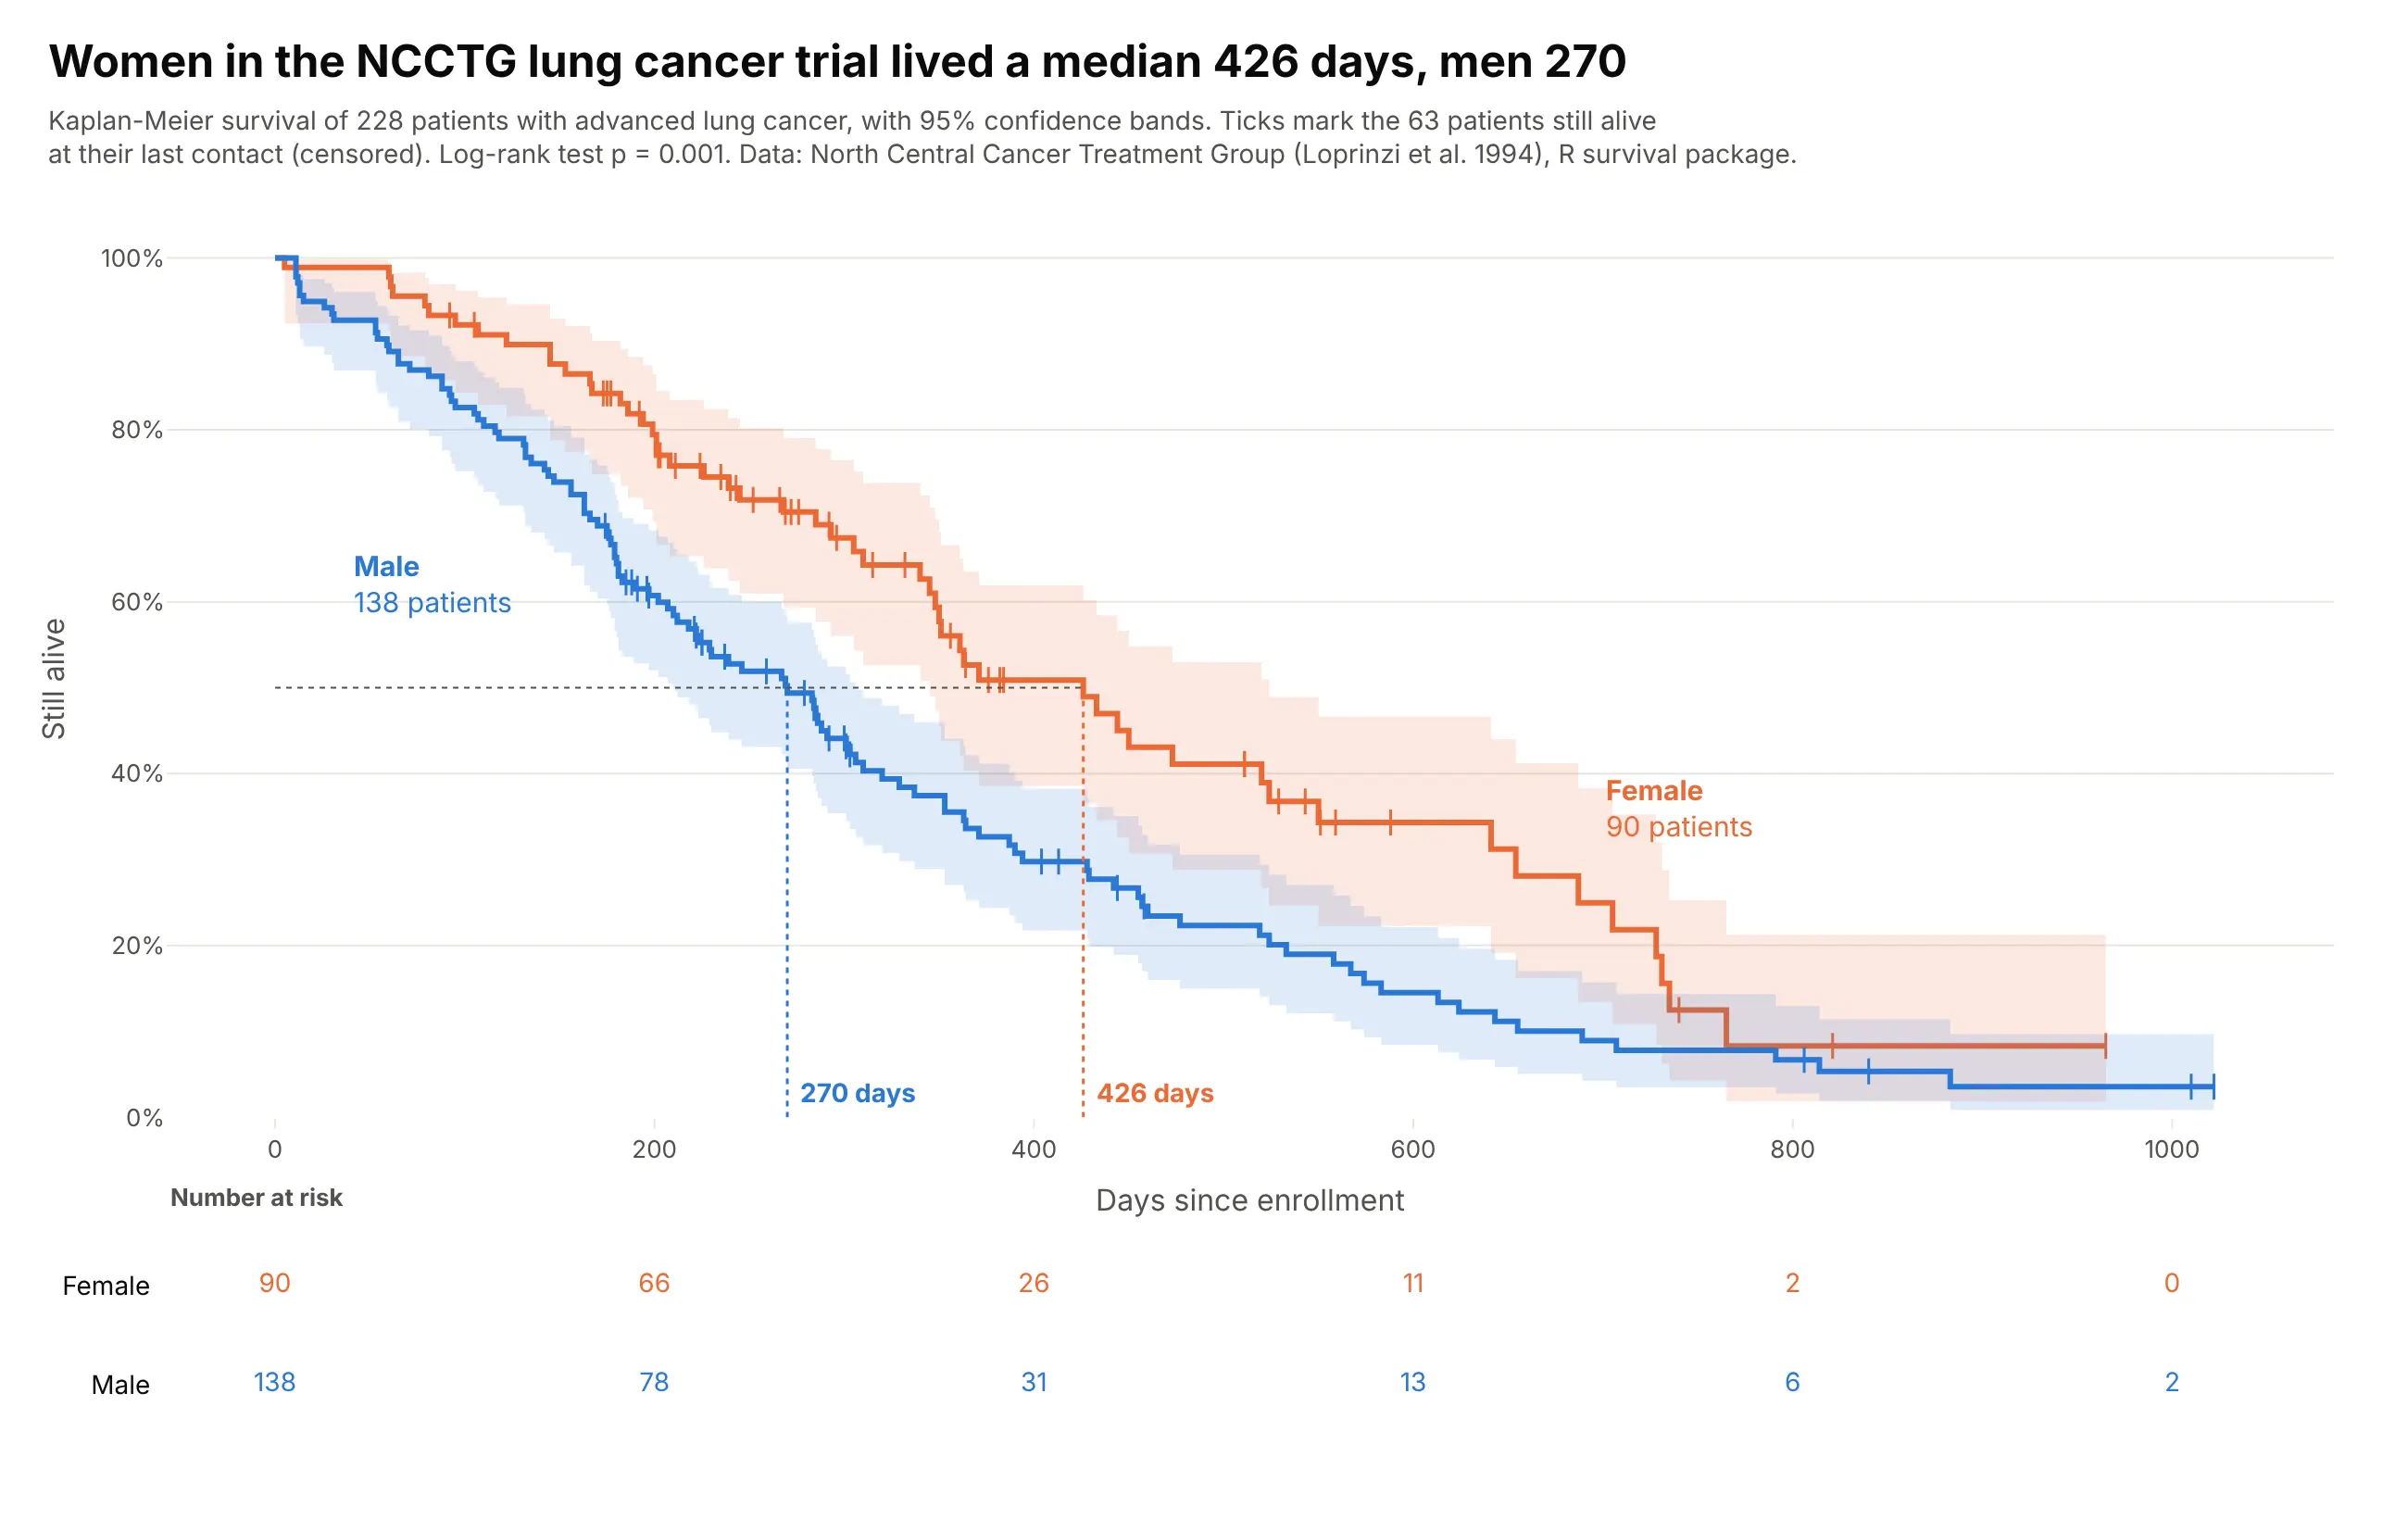
A Kaplan-Meier curve shows the share of a group that hasn't had an event yet (death, relapse, failure, closing a ticket) at each point in time, as a step line that drops at every event. It handles censoring, so people still event-free when you stopped watching count for as long as you watched them. Also known as Kaplan-Meier plots and survival curves.
Read the complete guide to Kaplan-Meier curves
How to make any of these charts
With AI
ChatGPT, Claude Code, GitHub Copilot, Cursor and other AI tools are excellent at writing Plotly code. Name Plotly and the chart type in the prompt, describe your columns, and list the checks you want, such as a title that states the takeaway and labels that don't overlap. Each complete guide above has a prompt for its chart that you can paste and adapt. They follow this pattern:
Make a plotly <chart type> from <file> (columns: ...).- What each axis, size and color means.- Sort order, and which items to highlight in color with the rest in gray.- A title that states the main takeaway and a subtitle with the data source.- Checks you want, such as "assert that every parent equals the sum of its children".- Save it as chart.html and as a PNG at 2x scale.
With Plotly Studio
Plotly Studio is a desktop app where you point an AI at a dataset and it builds charts and a Dash app around your questions. Ask for a chart the way you would ask a colleague, naming the chart type and what each column should mean in it.
In Python or JavaScript
This is the code AI tools write under the hood. Most of these charts are one call in Plotly Express, such as this treemap of world population:
import plotly.express as pxdf = px.data.gapminder().query("year == 2007")fig = px.treemap(df, path=[px.Constant("World"), "continent", "country"], values="pop")fig.show()
Plotly has dedicated traces for many of these charts, and you make the rest, such as dot plots, beeswarm plots, Likert charts and UpSet plots, from base traces like go.Scatter and go.Bar. Their guides show how, with a short helper function where one is needed. The same charts work in JavaScript with plotly.js, and in both libraries every graph is interactive in the browser, with hover and zoom.