
Chris Parmer
November 18, 2026
Funnel Area Charts - A Complete Guide
TL;DR
- A funnel area chart cuts a funnel-shaped polygon into horizontal slices, one per category, and gives each slice an area in proportion to its value. Because the slices add up to the whole funnel, it shows shares of one total, in an order you choose, such as the status of every gigawatt (GW) of power plant capacity in an interconnection queue.
- Funnel area charts are also known as funnel area plots, and they are similar to funnel charts, pie charts and waterfall charts. They behave like a pie chart: every item counts once, and the slices must not overlap.
- Use one for outcomes that don't overlap, such as where a mortgage application ended up. Don't feed it the stages of a funnel, where each stage contains the next, because the chart adds them up as if they were separate parts, and don't read slice height as value, because the narrower slices lower down are taller for the same value.
- Plotly makes funnel area charts with the funnelarea trace, in Python with go.Funnelarea or px.funnel_area, and in JavaScript with type: "funnelarea".
What is a funnel area chart?
This is a funnel area chart:
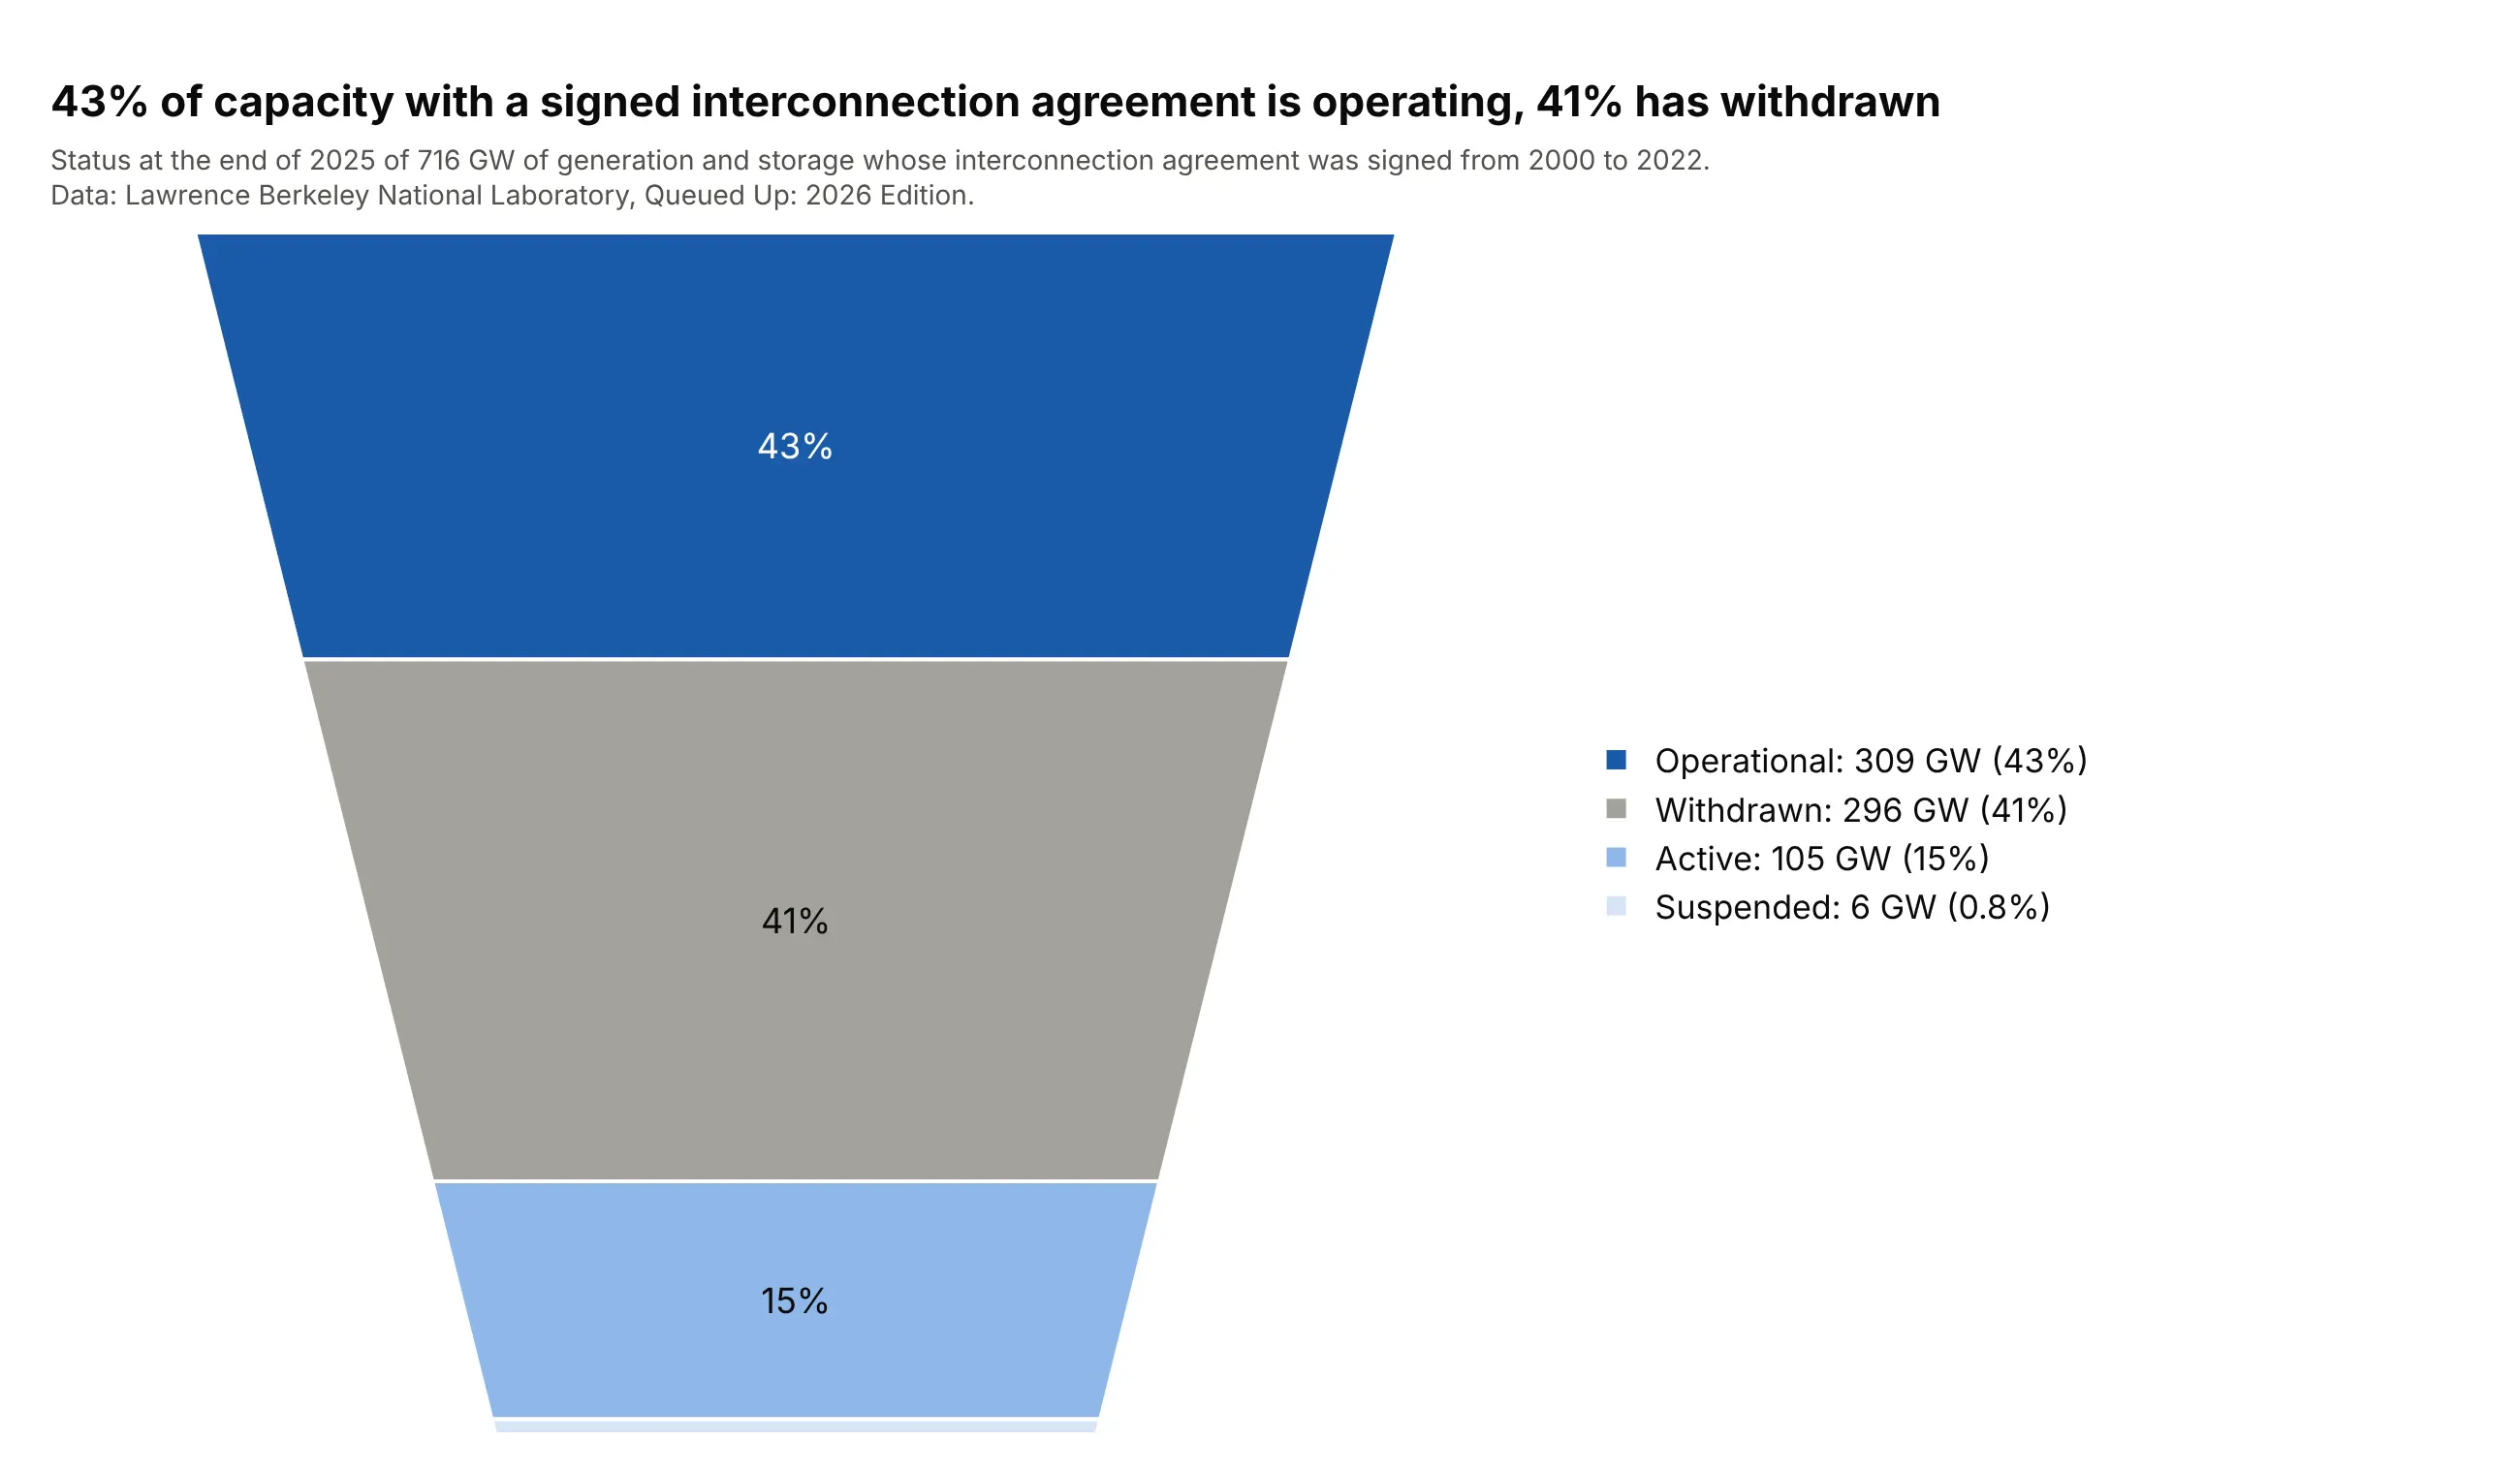
Data: Lawrence Berkeley National Laboratory (LBNL), Queued Up: 2026 Edition (Rand et al., June 2026), slide 38, from the interconnection queues of US grid operators.
How do you read a funnel area chart? In the example above, notice these things:
- Each slice is one status of power plant capacity that has signed an interconnection agreement with the grid operator, and its area is its share of the 716 GW total. The four slices add up to the whole funnel, so every gigawatt is in exactly one slice.
- The slices run in the order of the data, from the largest at the top here. Operational capacity is 309 GW (43%) and capacity that has withdrawn is 296 GW (41%).
- Read the numbers, not the heights. The withdrawn slice looks taller than the operational one even though it is smaller, because the funnel narrows as it goes down and a narrower slice needs more height to hold the same area.
- The 6 GW of suspended capacity (0.8%) is a thin sliver at the bottom, so the legend carries every value.
- The report's wider count agrees: of 3,501 GW requested from 2000 to 2020, 13% was operating at the end of 2025 and 75% had been withdrawn.
It's often used for charts like these:
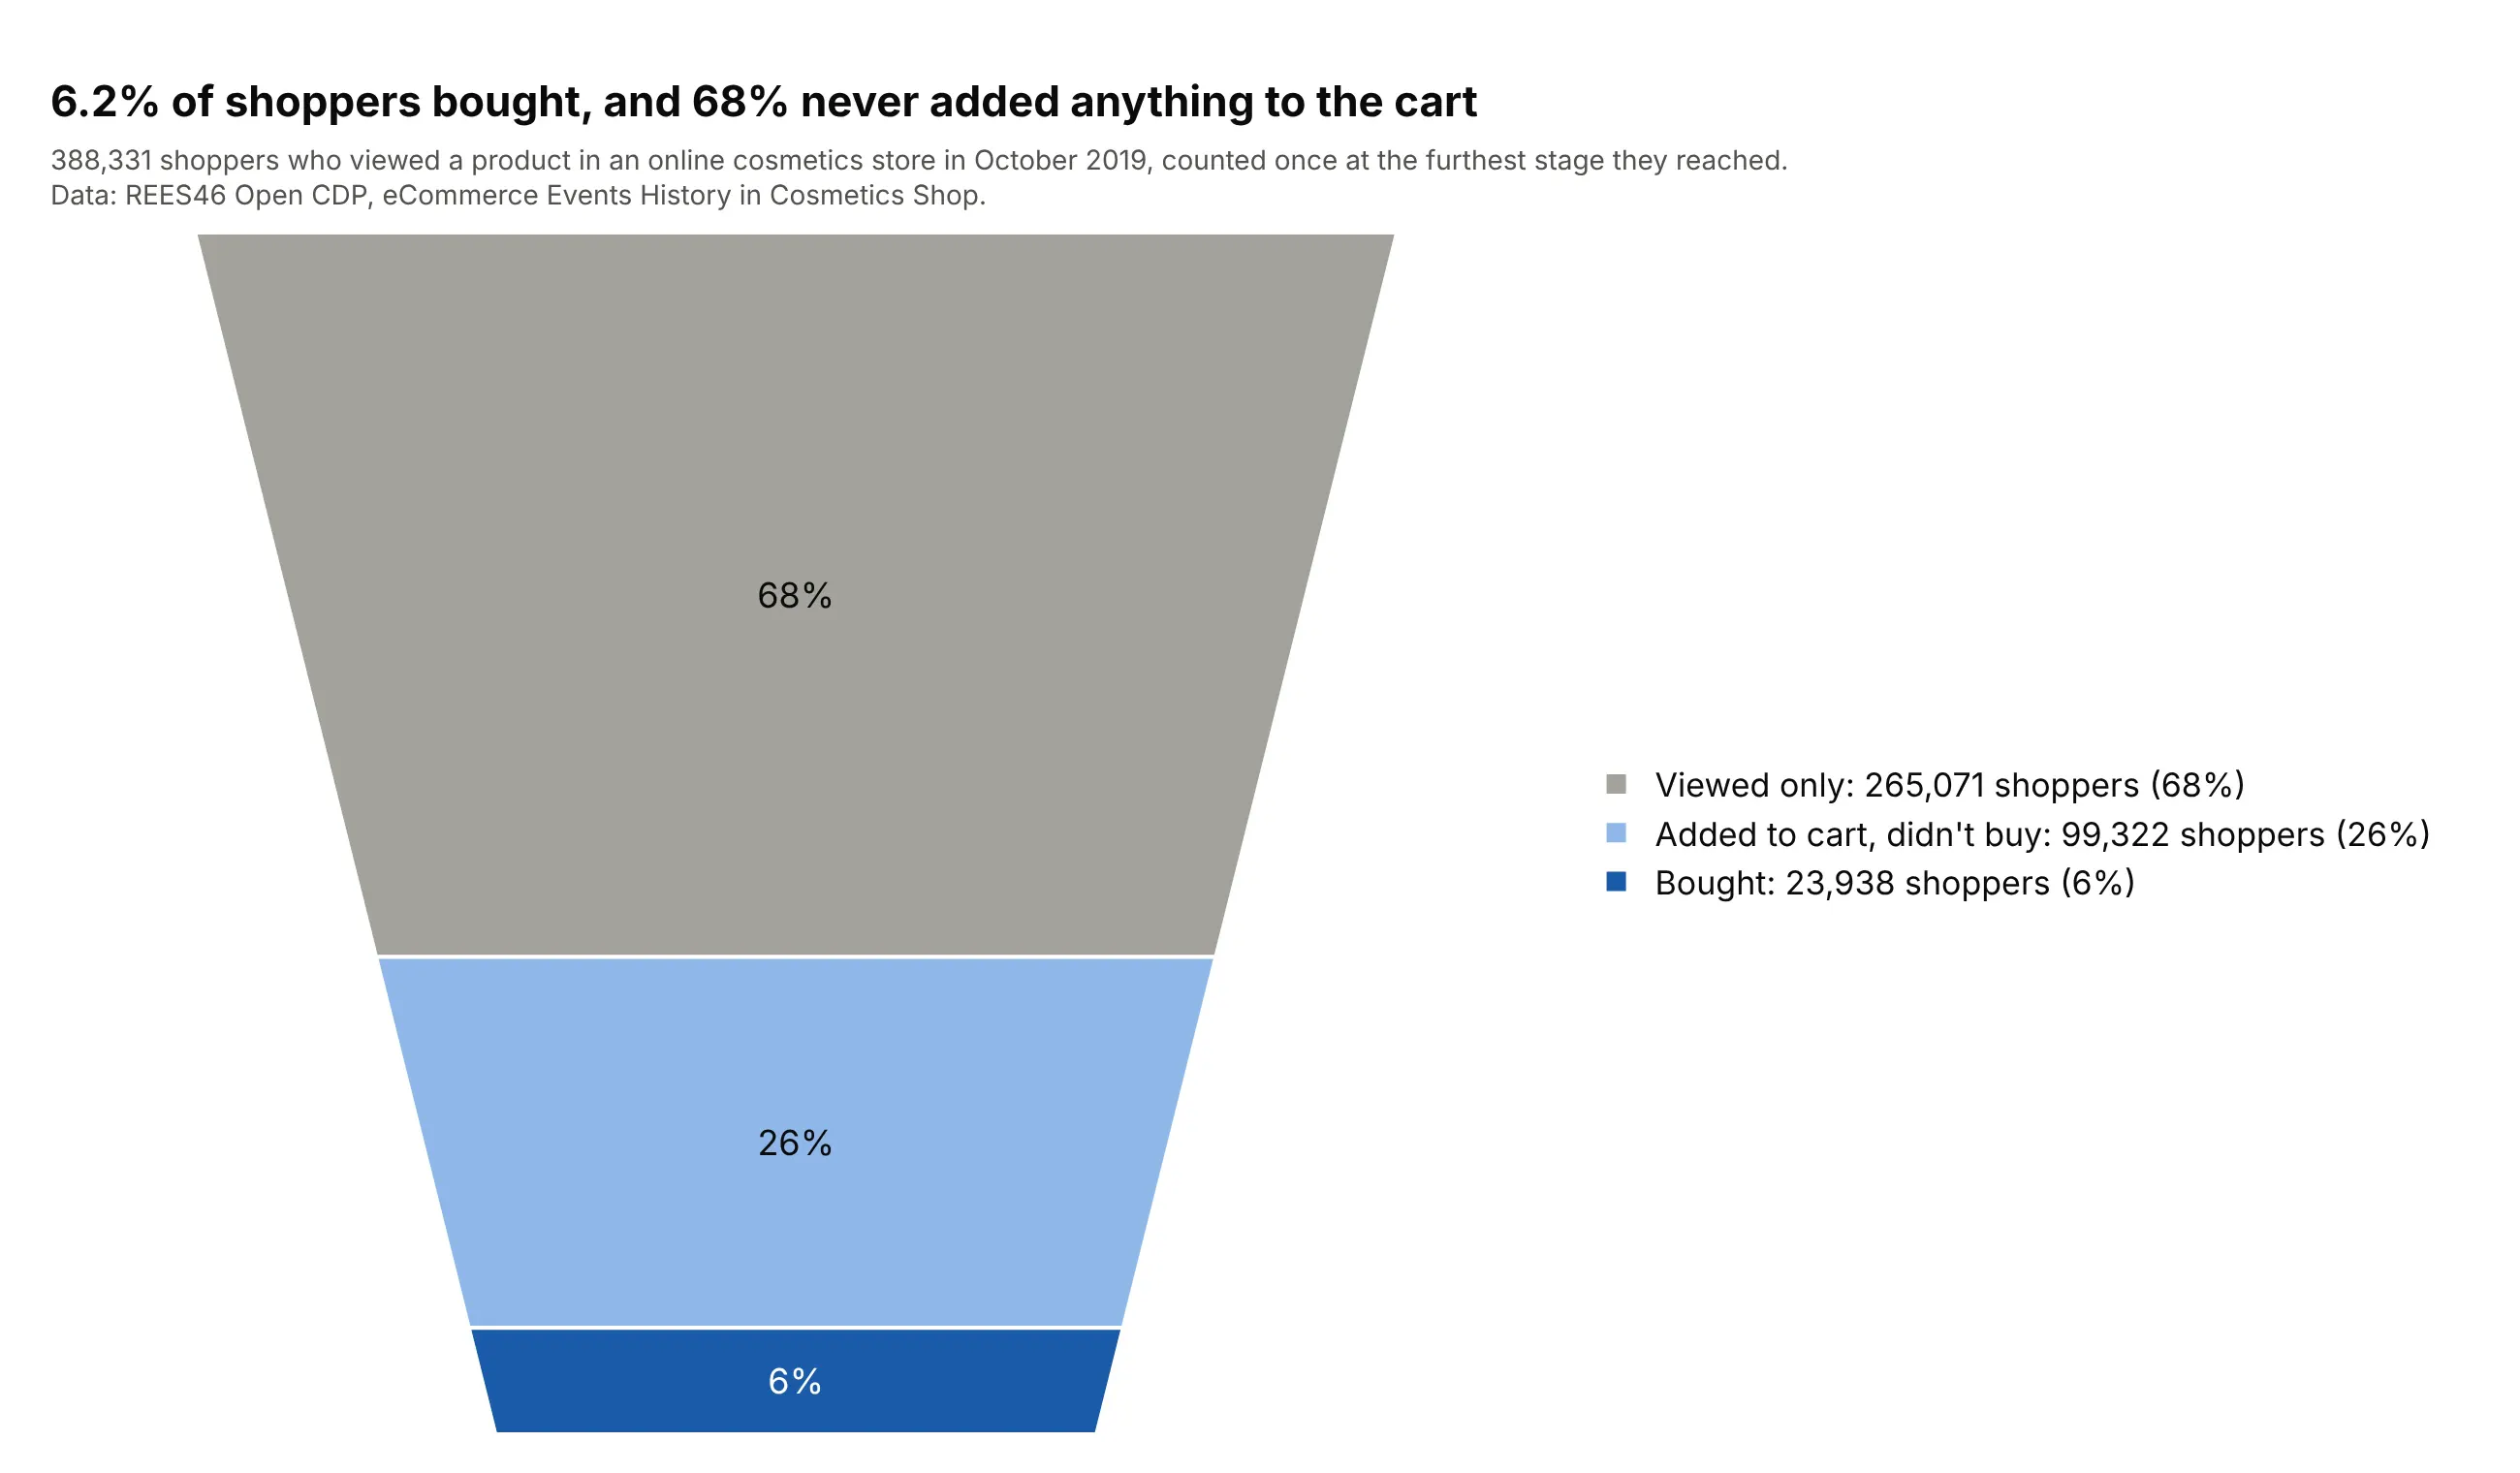
A sales or website funnel. This is the classic use. Counting each of 388,331 shoppers once, at the furthest stage reached, gives slices that add up to all shoppers, and 6.2% of them bought. Data: REES46 Open Customer Data Platform (CDP), eCommerce Events History in Cosmetics Shop, October 2019.
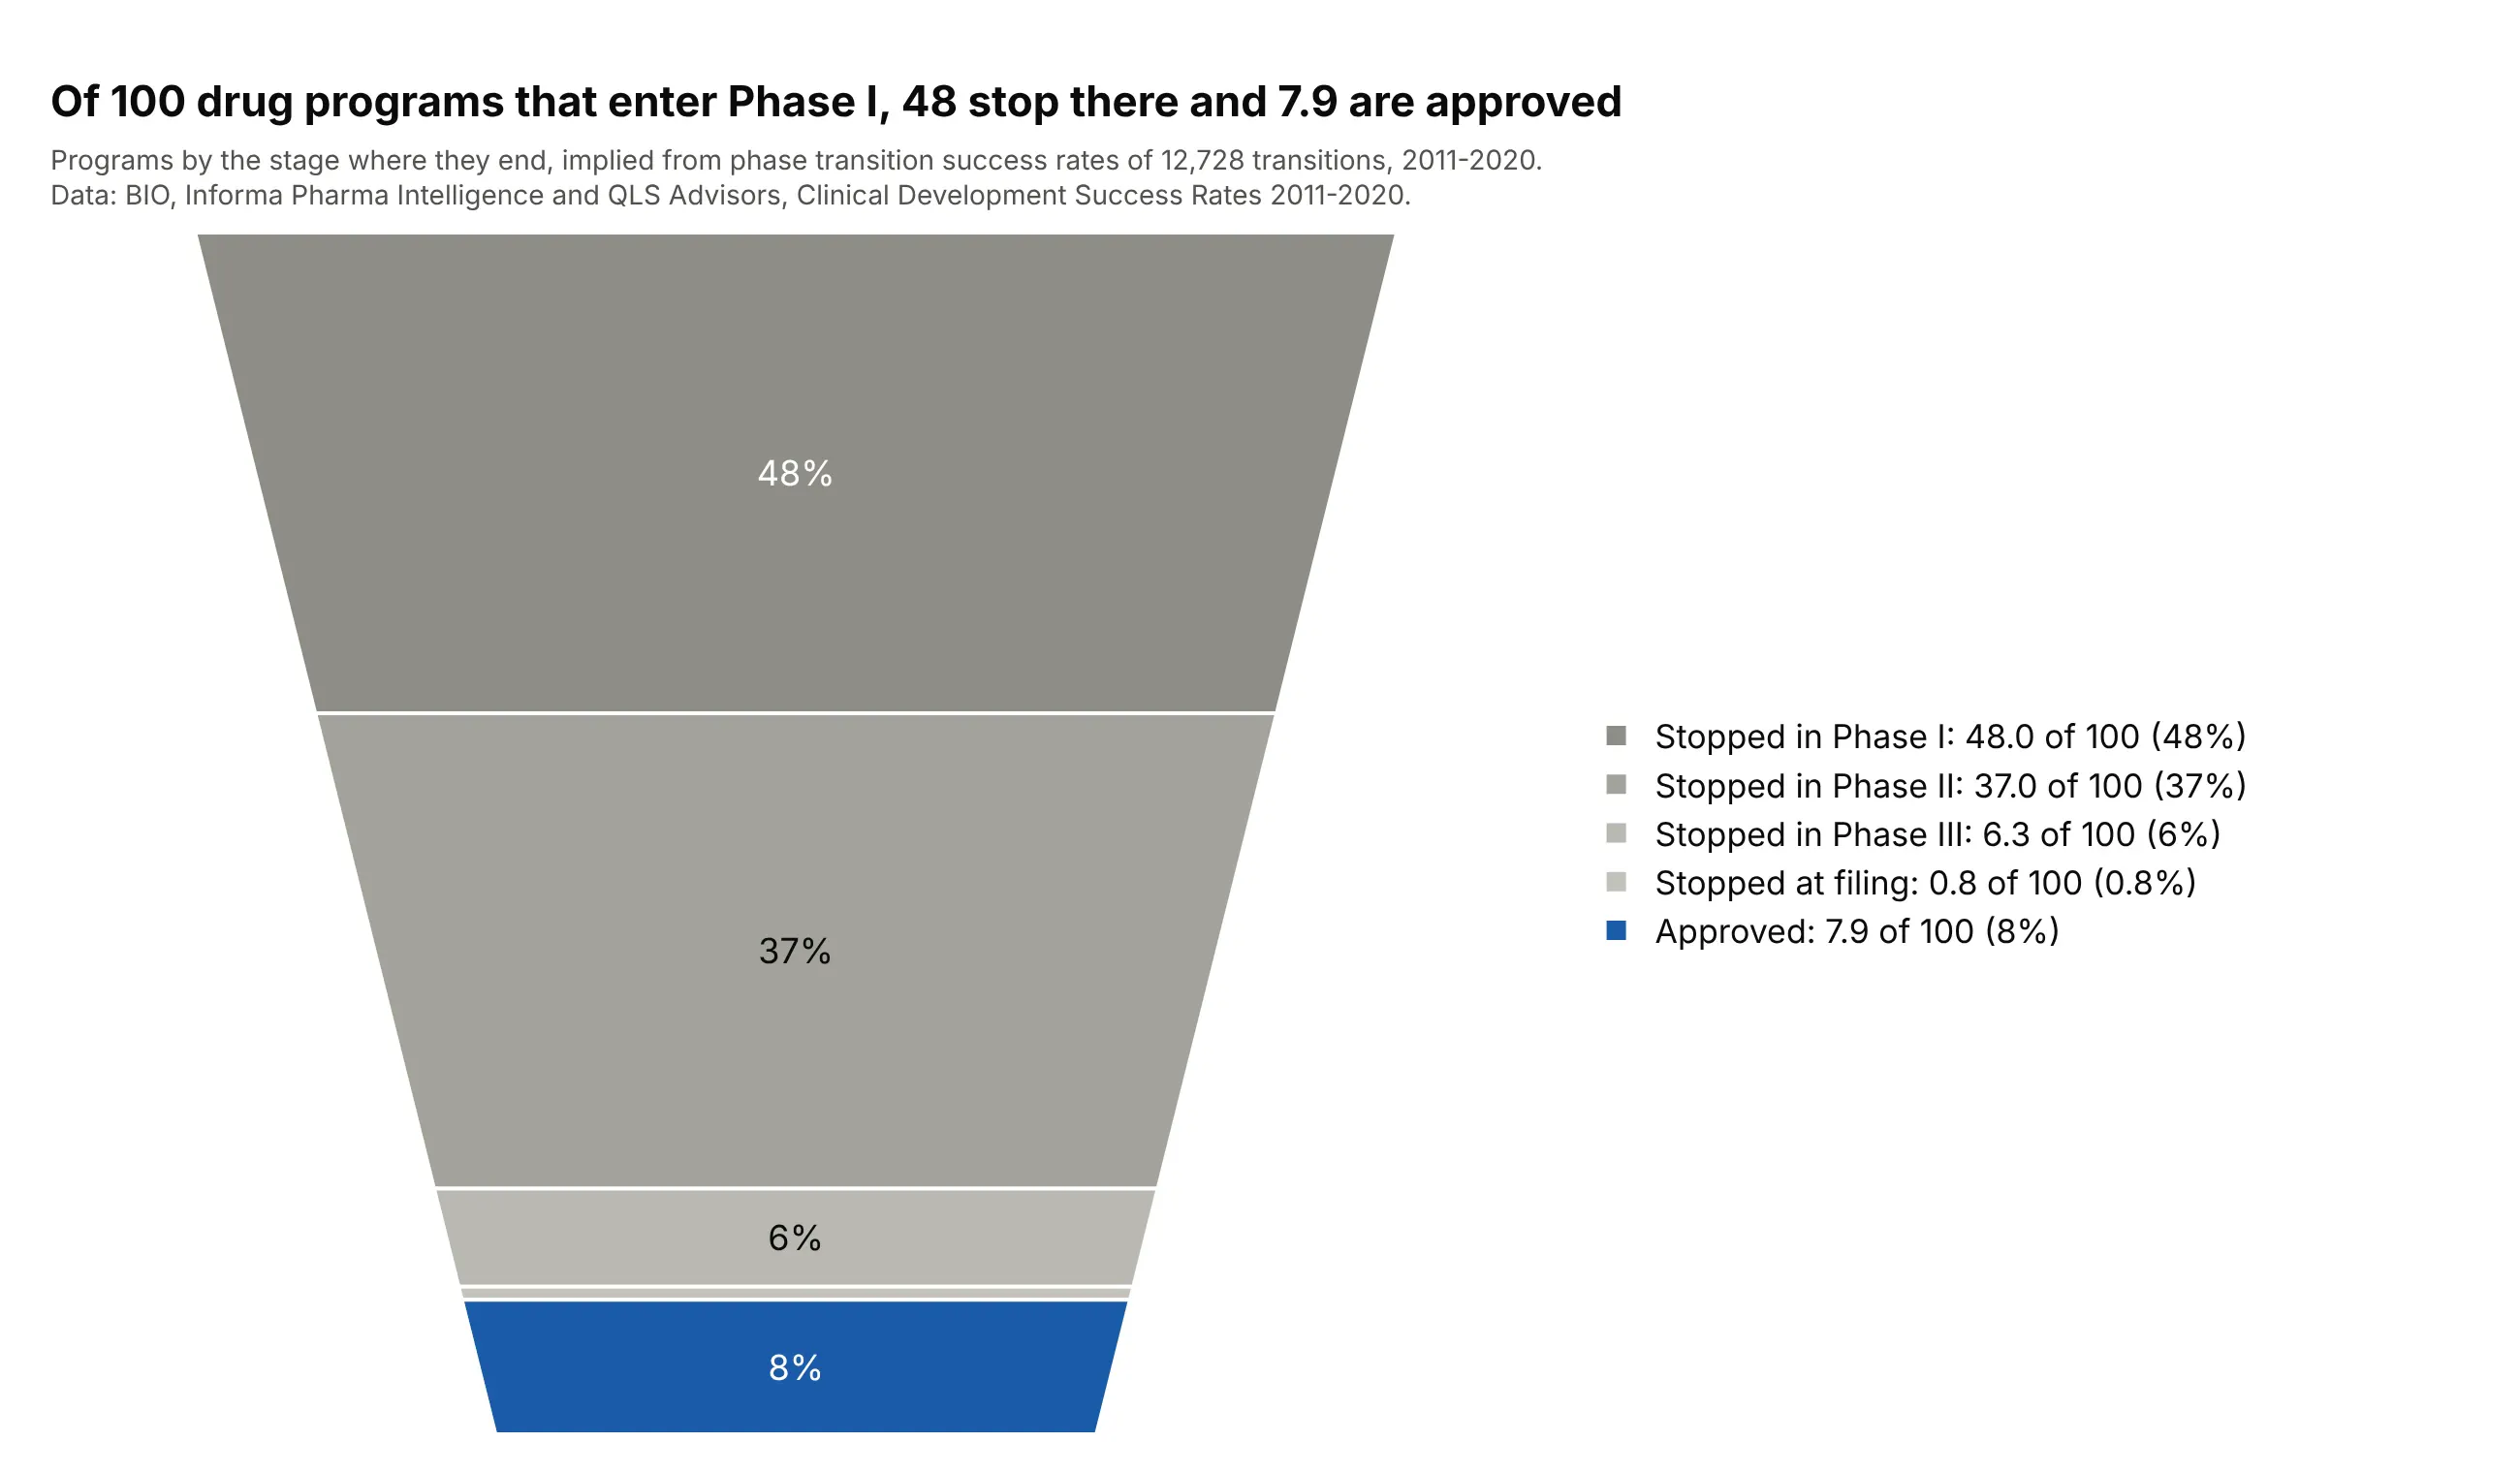
A drug development pipeline. Subtracting each stage's survivors from the stage before gives the programs that stop there: of 100 programs entering Phase I, 48 stop in Phase I and 7.9 are approved. Data: Biotechnology Innovation Organization (BIO), Informa Pharma Intelligence and QLS Advisors, Clinical Development Success Rates 2011-2020 (2021), Figure 2.
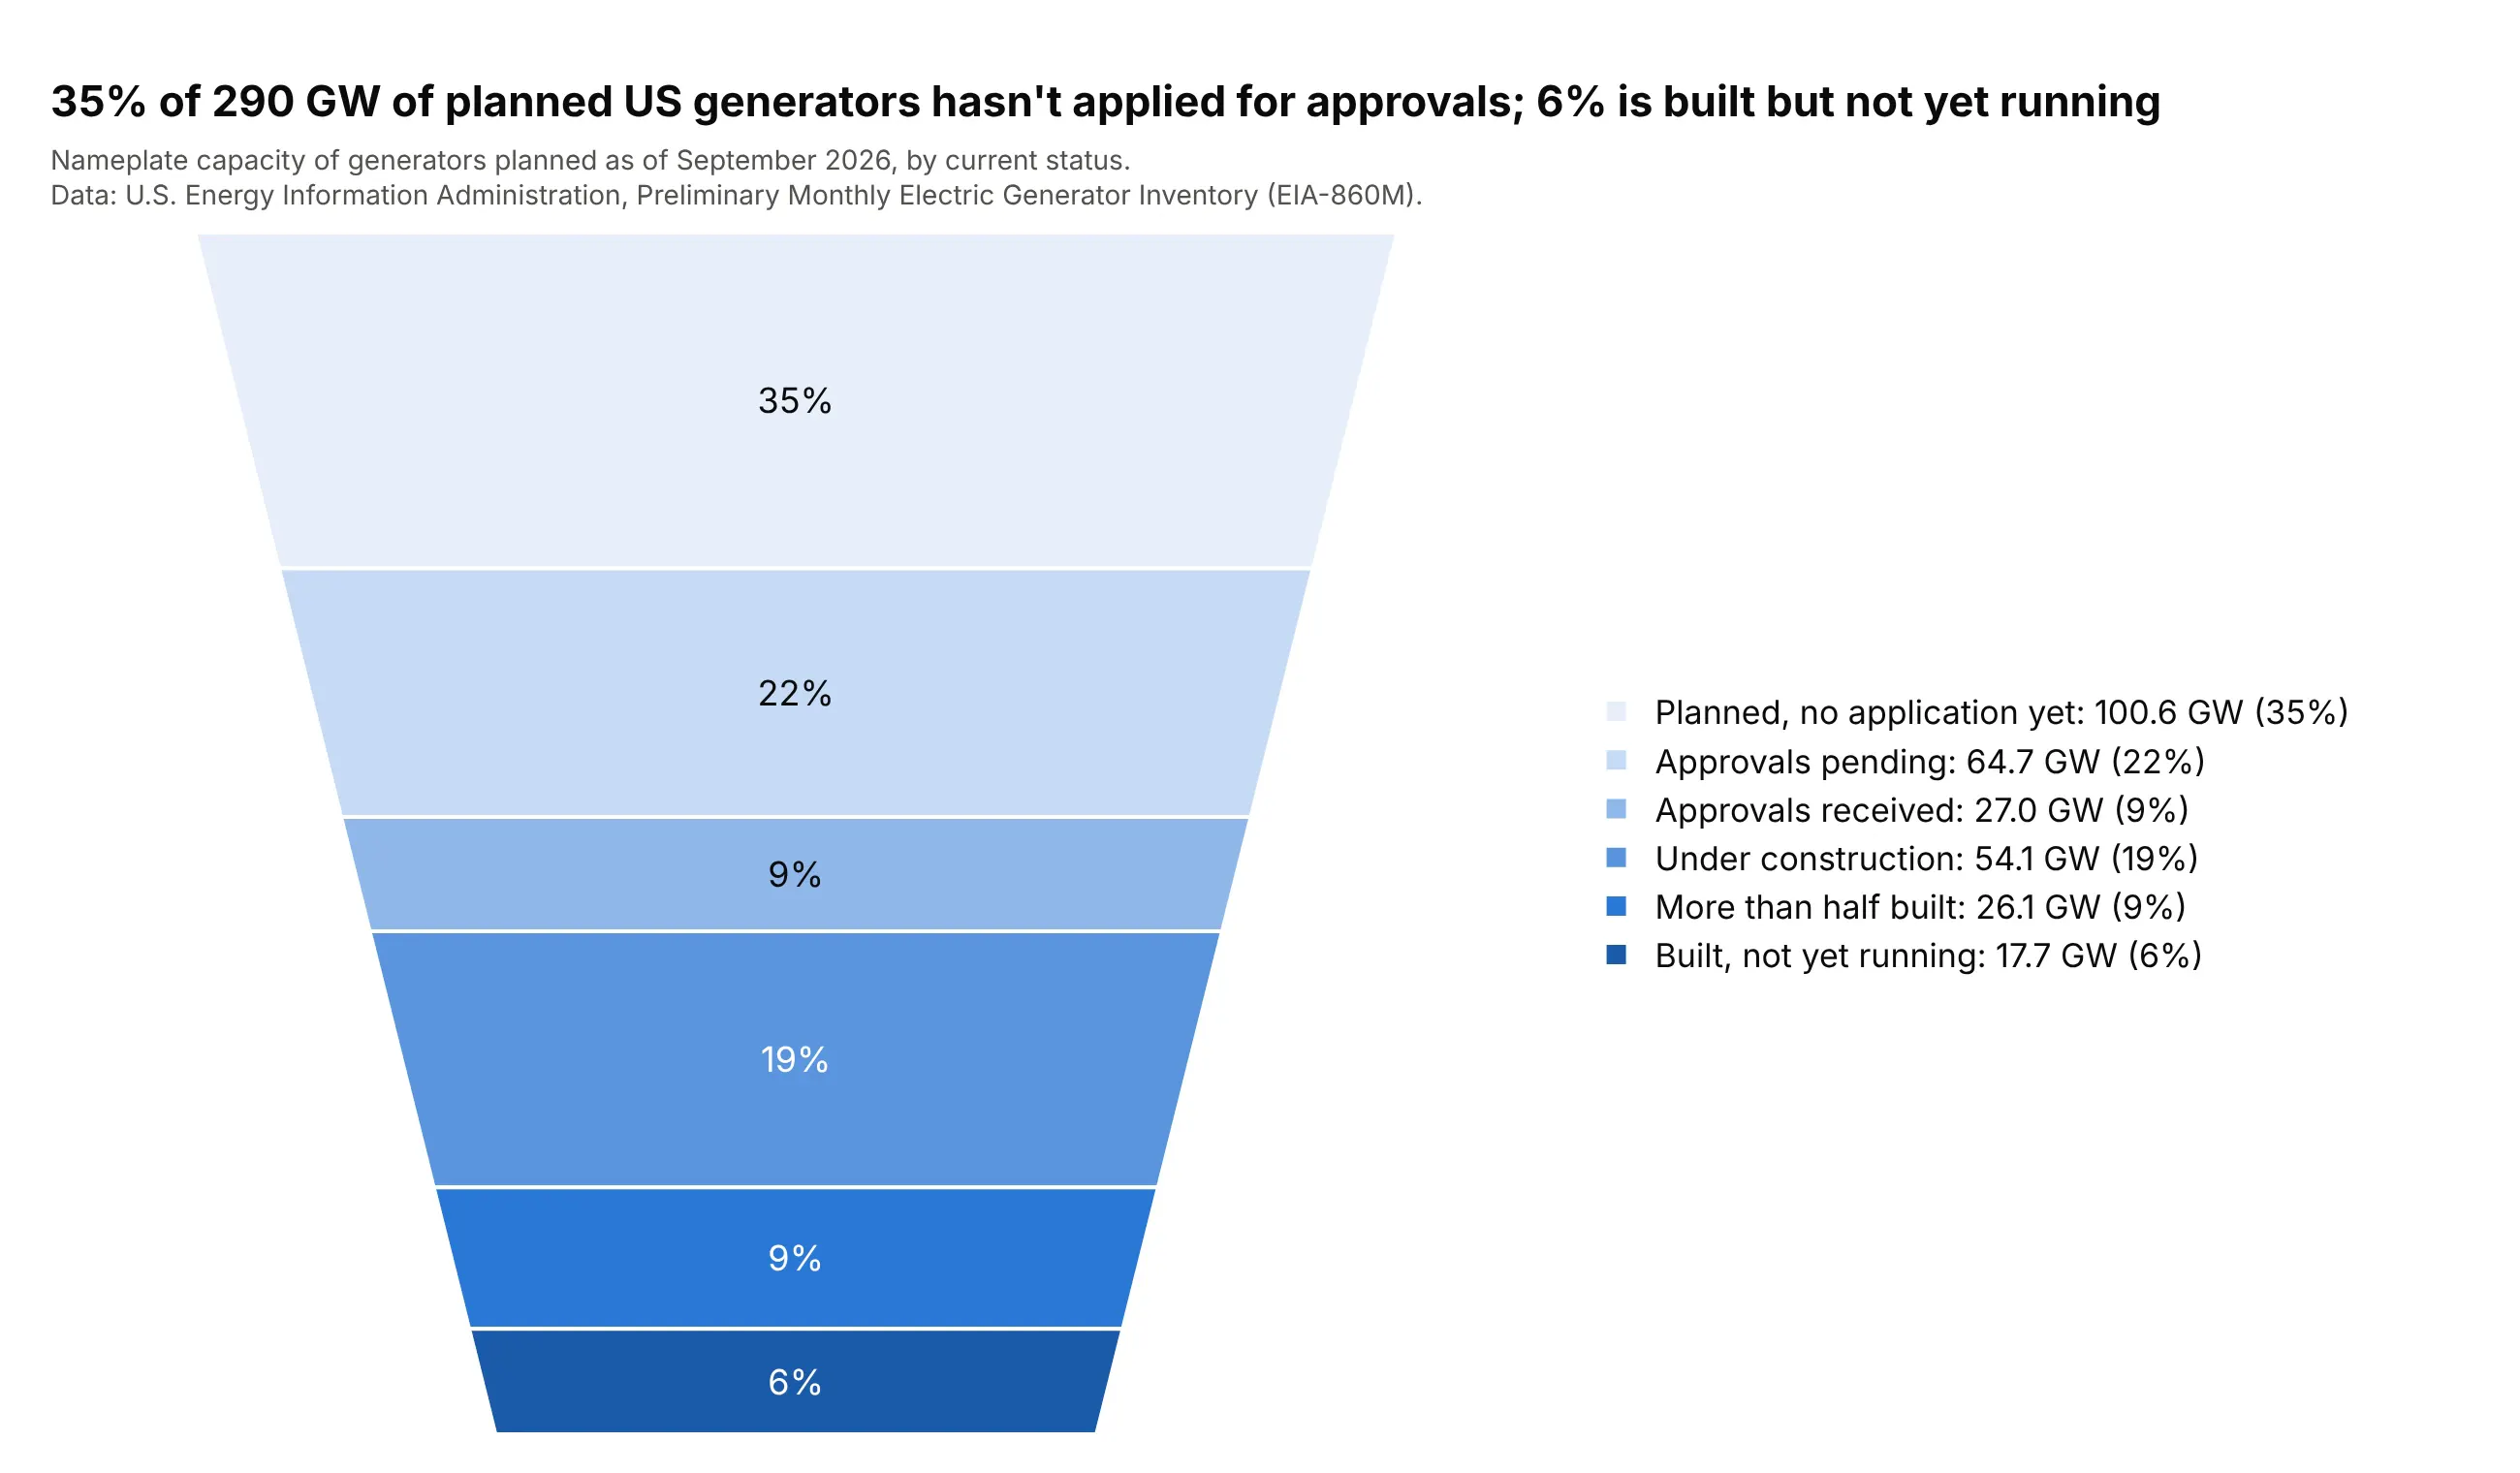
A development pipeline with one status per project. Every planned US generator has exactly one status, from "planned" to "built, not yet running", so the statuses form one whole of 290 GW and 35% of it hasn't applied for approvals. Data: U.S. Energy Information Administration (EIA), Preliminary Monthly Electric Generator Inventory (EIA-860M), September 2026.
Funnel area charts explained: shares of one whole, not stages
A funnel area chart is built like a pie chart, and most of the confusion about it comes from forgetting that. Plotly's funnelarea trace takes a list of values, adds them up, and cuts one funnel-shaped polygon into slices whose areas are each value's share of that sum. The funnel's shape is fixed, so the chart has no axis and no scale: it only shows how the total divides.
The stages of a funnel overlap, so they don't fit
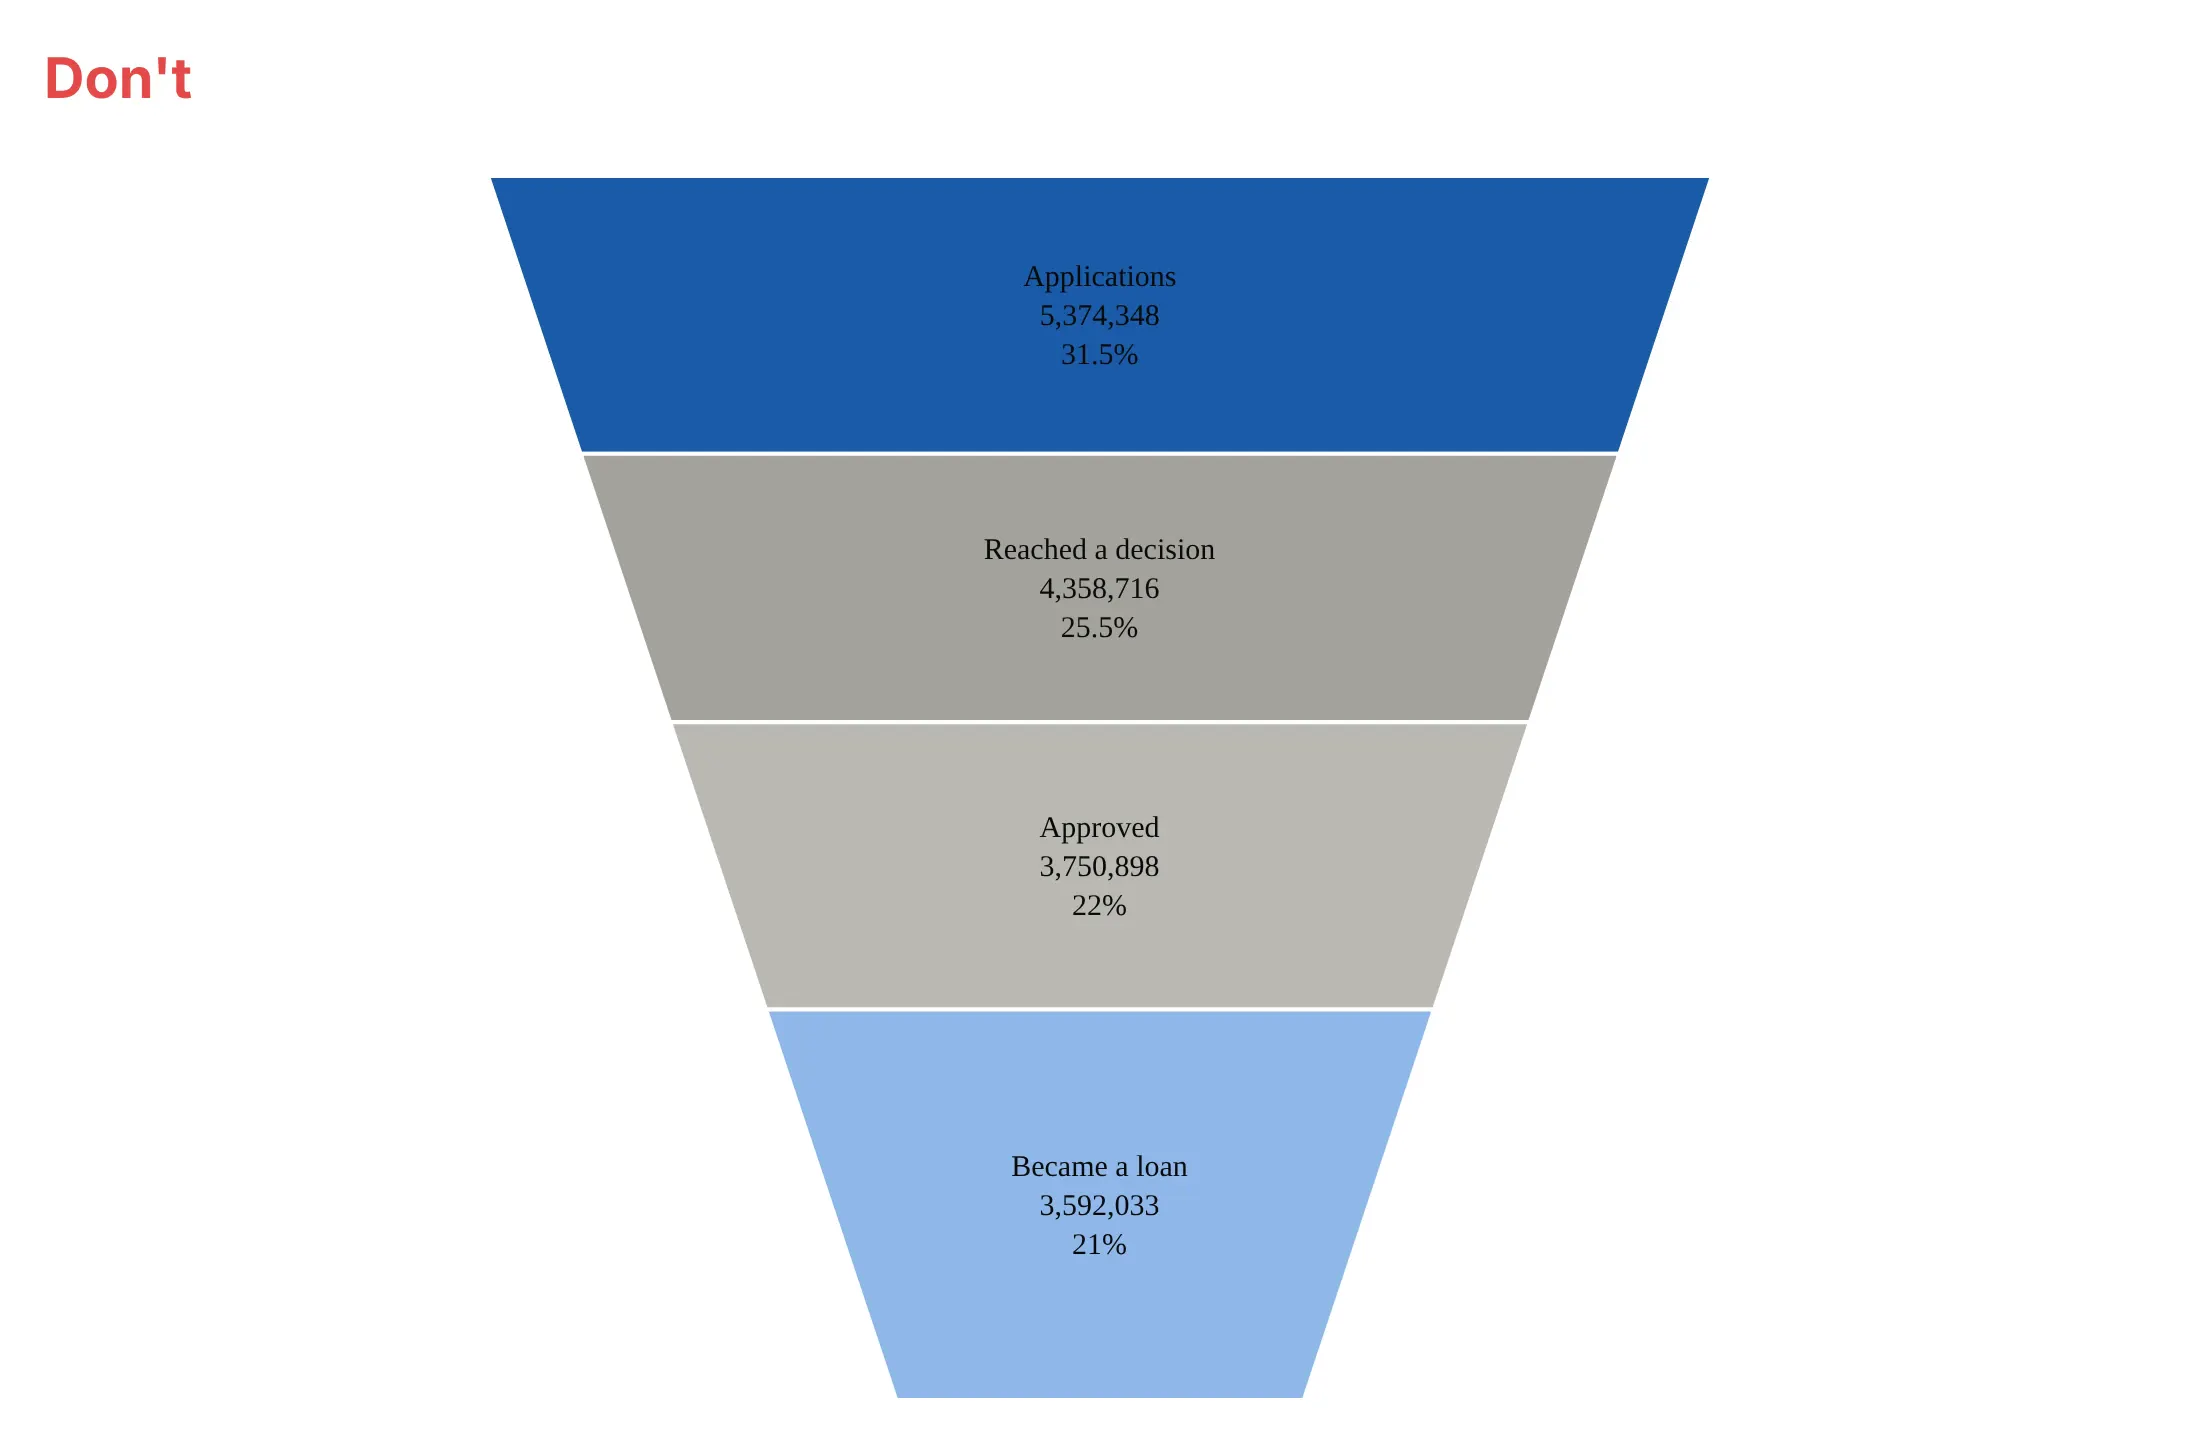
A funnel counts how many items reach each stage, and every item that reaches the last stage also reached all the earlier ones. The stages contain each other, so adding them up counts the same applications several times. The left chart feeds the four stages of 2025 US home purchase mortgage applications to a funnel area chart, and the right chart draws the same four numbers as a funnel:
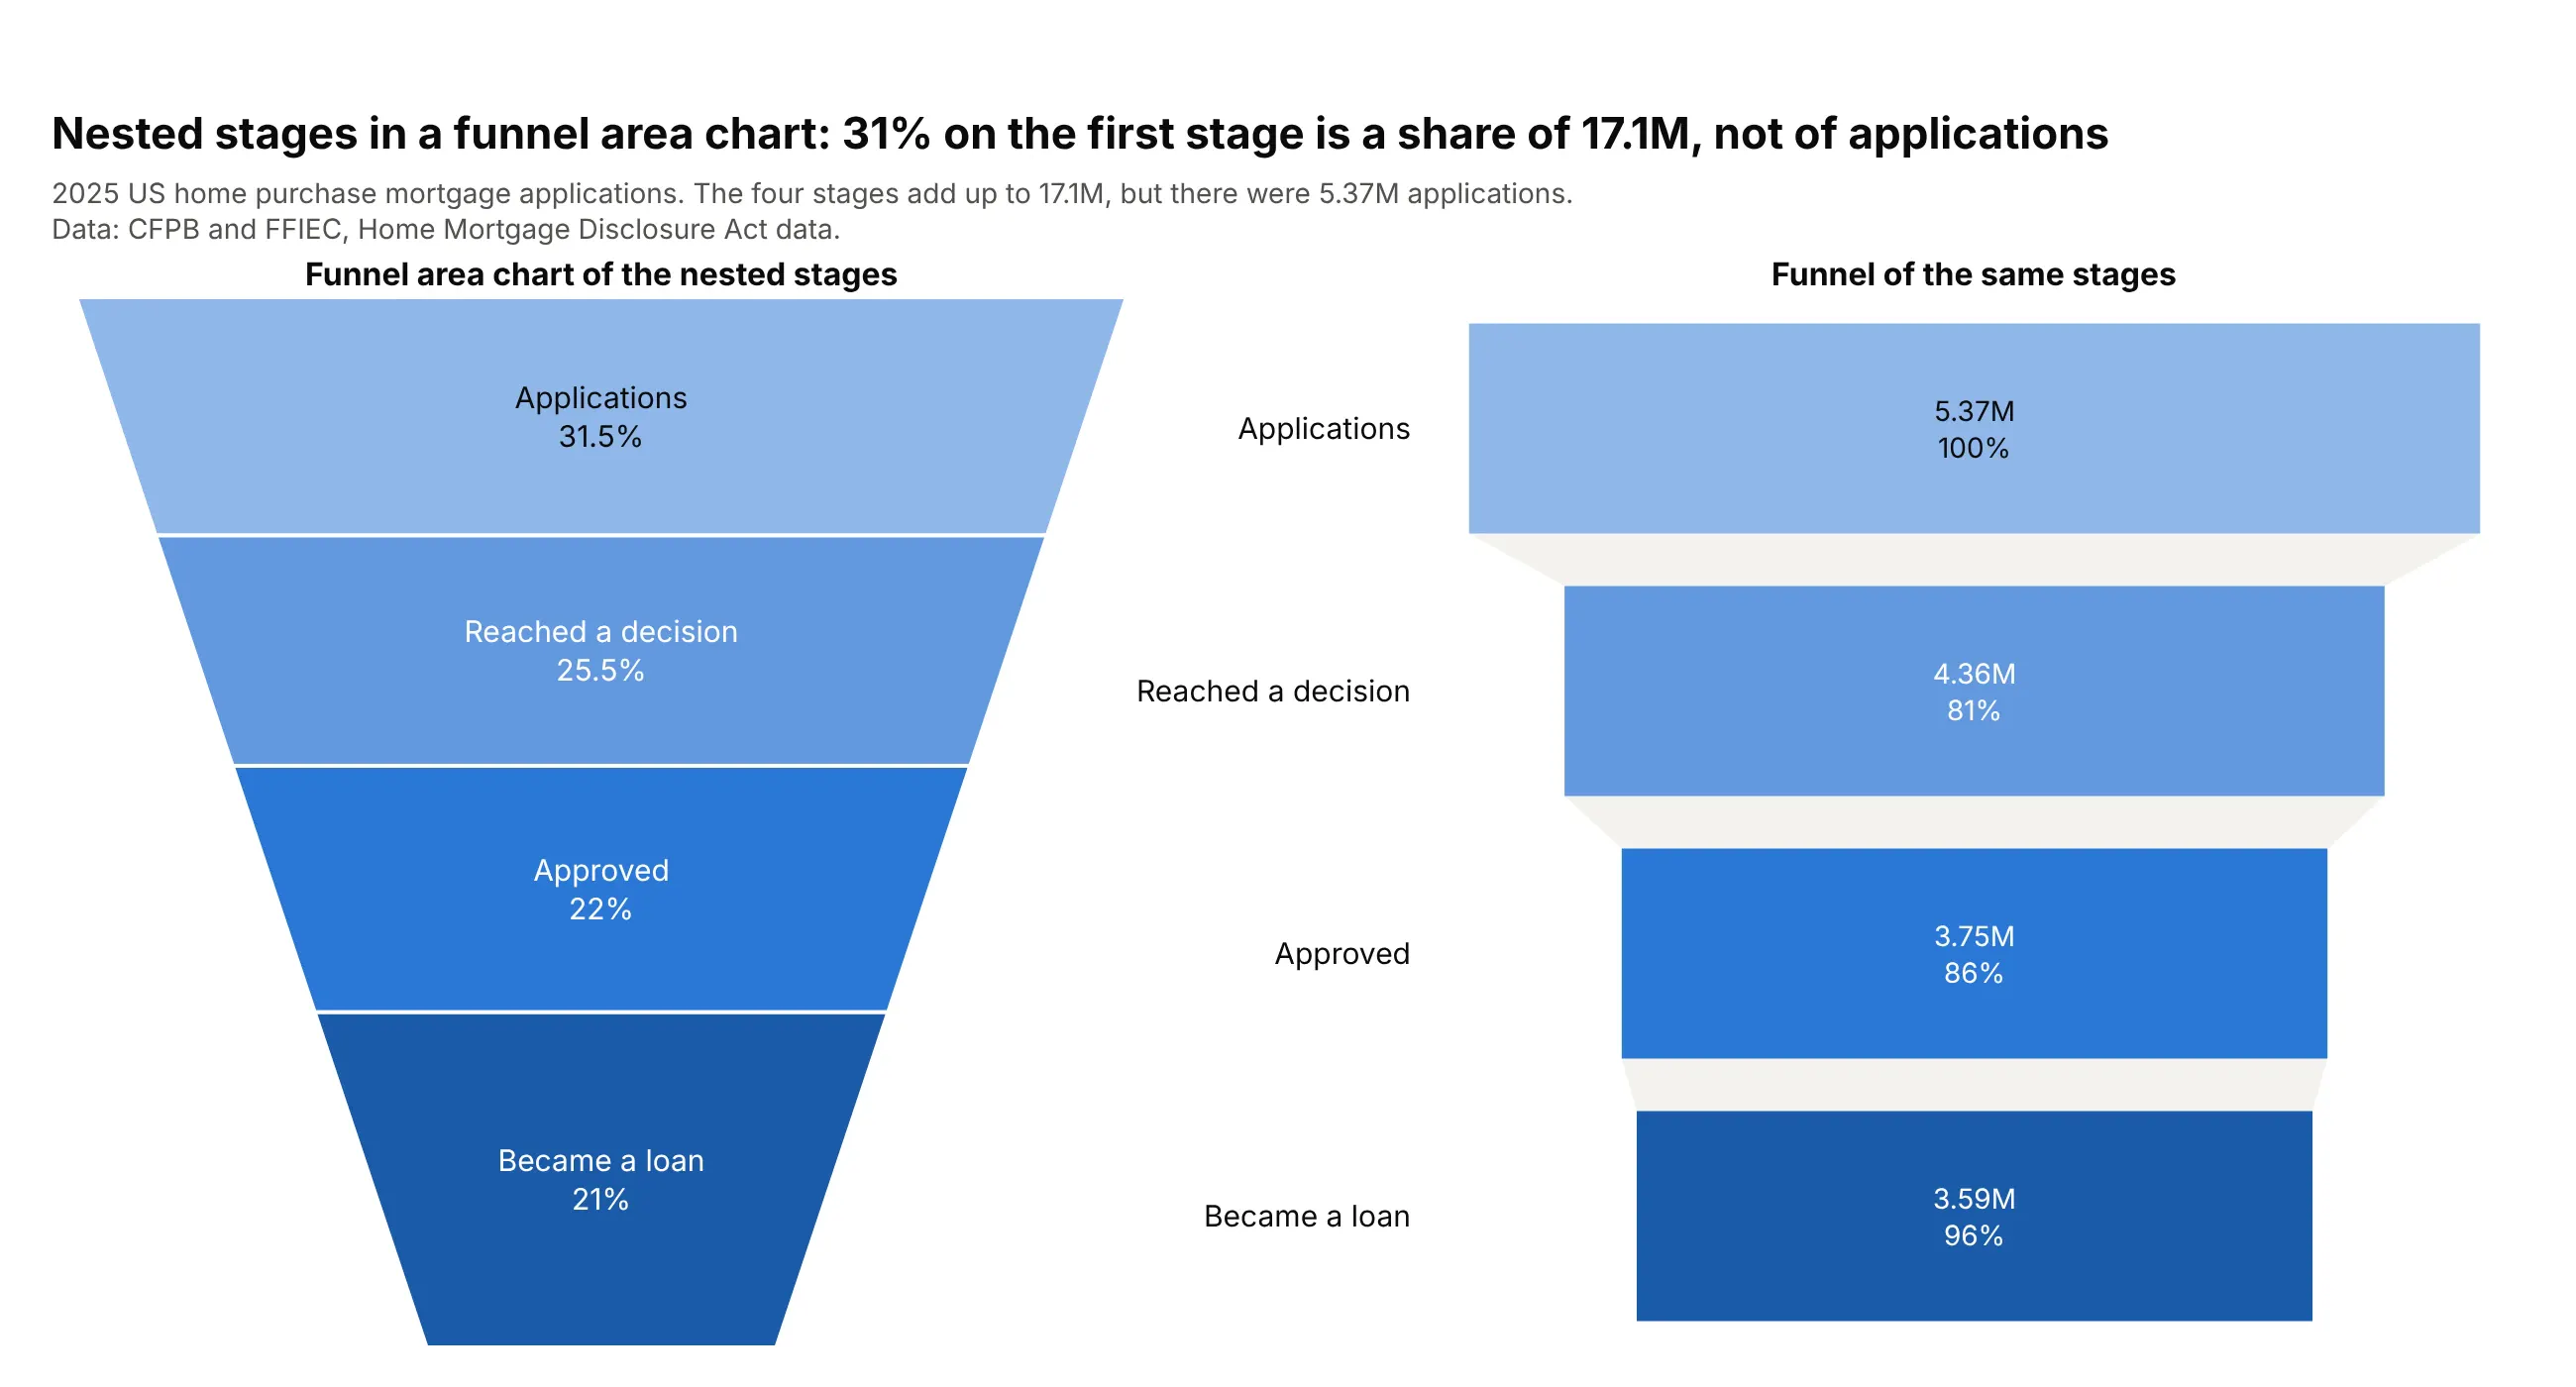
Data: Consumer Financial Protection Bureau (CFPB) and Federal Financial Institutions Examination Council (FFIEC), Home Mortgage Disclosure Act (HMDA) data, 2025, home purchase loans.
The four stages add up to 17.1 million, but there were 5.37 million applications, so the "31.5%" on the first slice is a share of 17.1 million that means nothing. The funnel shows what you wanted: each stage's count and the conversion from the stage before.
Fix it by counting each item once
If you want a funnel area chart anyway, count each item at the furthest stage it reached. That turns "reached stage 2" and "reached stage 3" into "stopped at stage 2" and "reached stage 3", and those groups don't overlap. For the drug pipeline, the funnel of programs that reach each stage is:
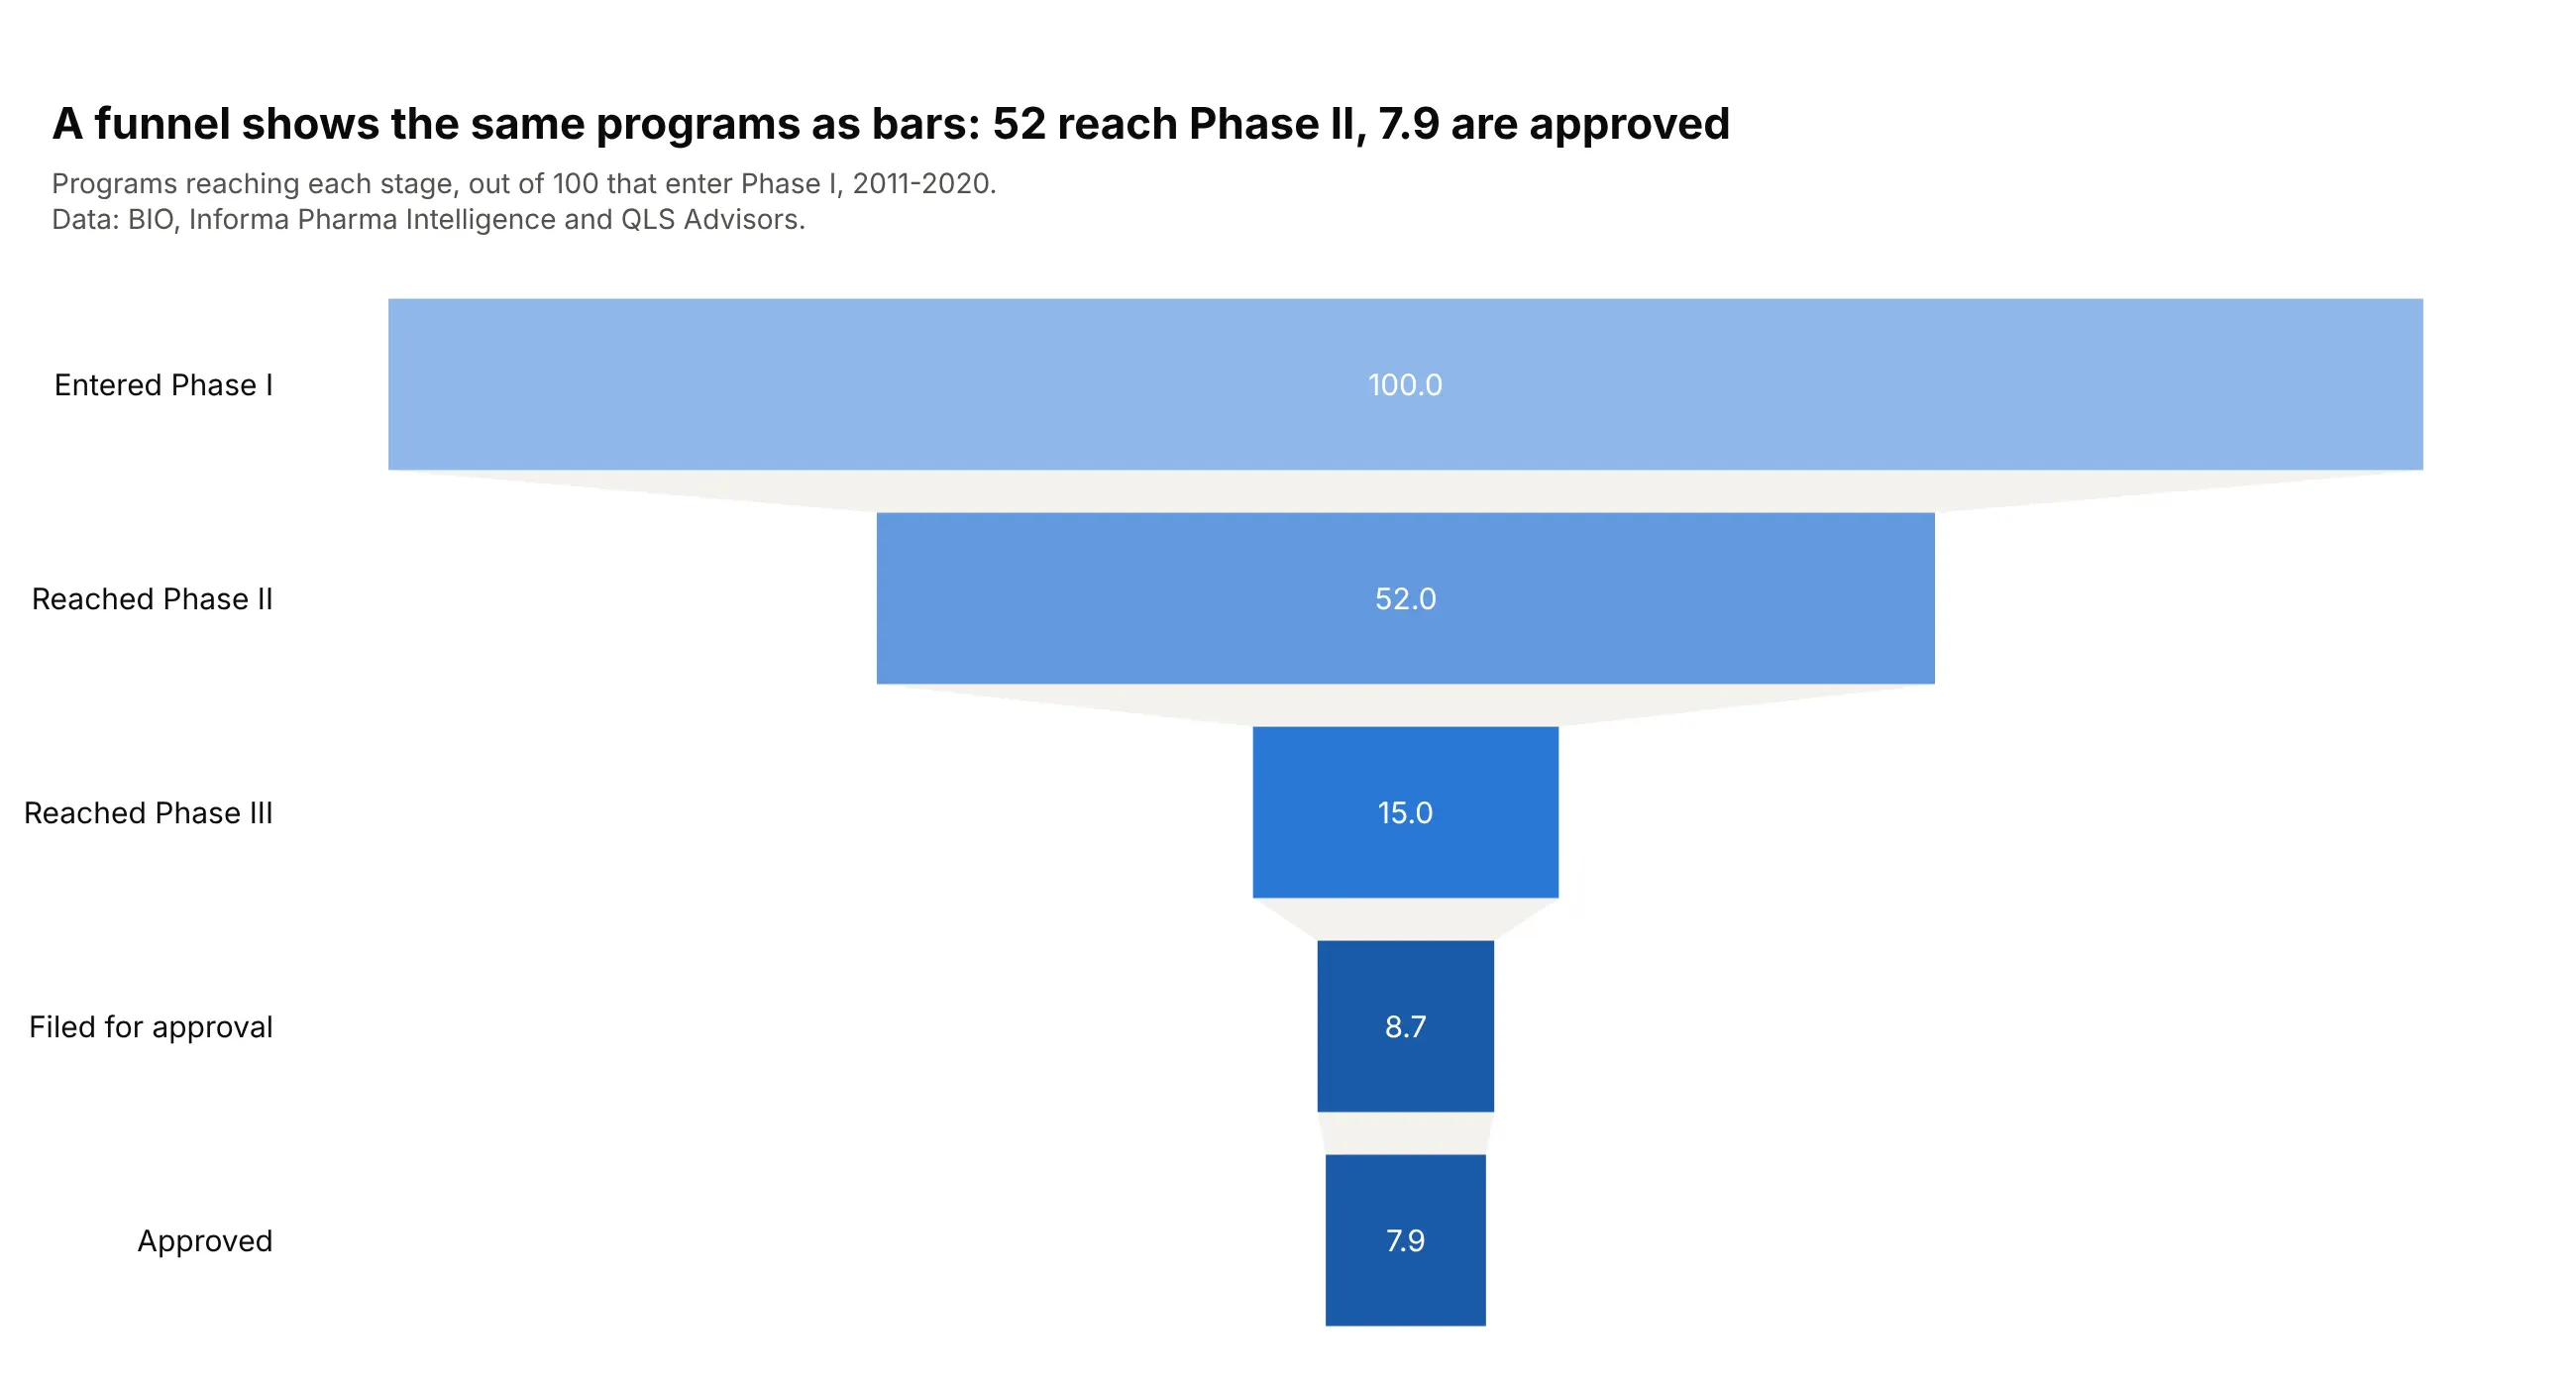
Data: BIO, Informa Pharma Intelligence and QLS Advisors, Clinical Development Success Rates 2011-2020, Figure 2.
Subtracting each bar from the one before gives 48.0, 37.0, 6.3 and 0.8 programs that stopped, plus the 7.9 approved, which add up to the 100 in the funnel area chart above. The funnel is still the better chart for the question "how many make it to each stage", and the funnel area chart answers a different one, "where does each program end".
Height is not value
A funnel area chart encodes value as area, and the eye reads it as height or width. The chart below draws four equal values:
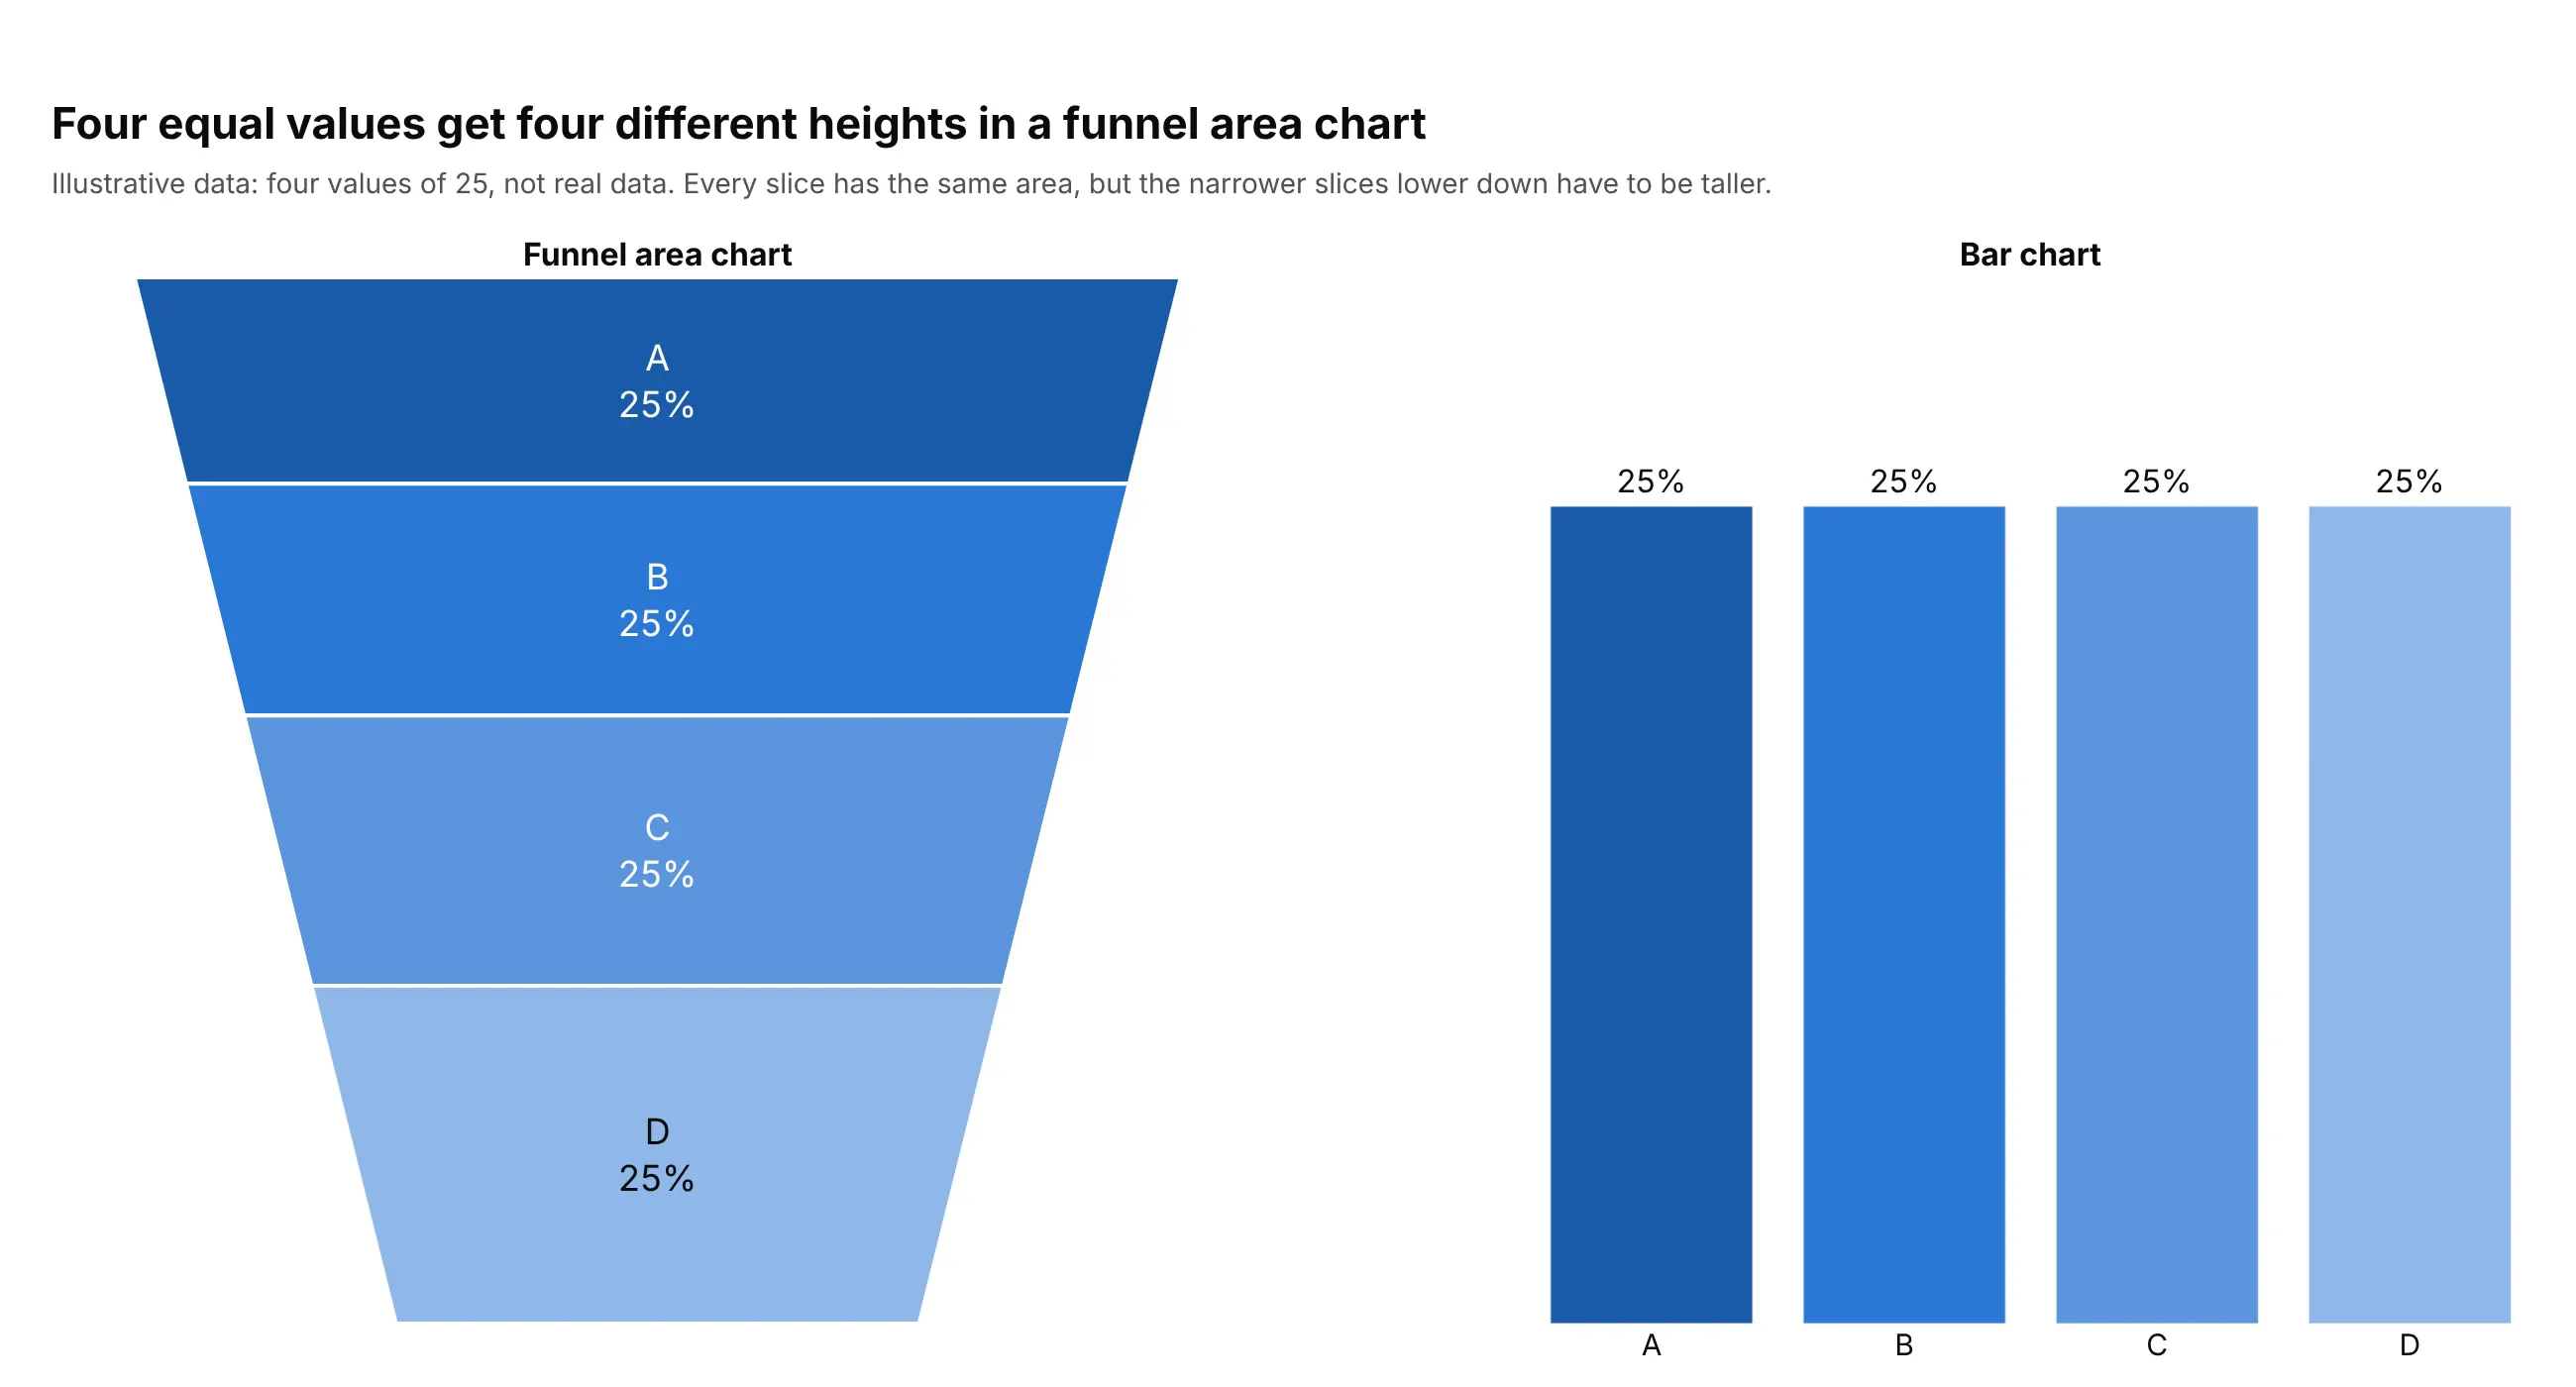
Data: illustrative values (four values of 25), not real data.
Each slice has the same area, but the funnel narrows towards the bottom, so the lower slices have to be taller to hold it. With the settings above, the bottom slice is about 1.6 times as tall as the top one for the same value. This is the effect behind the interconnection chart, where the 41% slice looks bigger than the 43% one. The bar chart on the right needs no label to show that the four values are equal.
The base ratio sets how much the shape distorts
The baseratio attribute sets the width of the funnel's bottom as a share of its top, from 0 to 1, with a default of 0.333. The chart below shows three values on the same outcomes of home purchase applications:
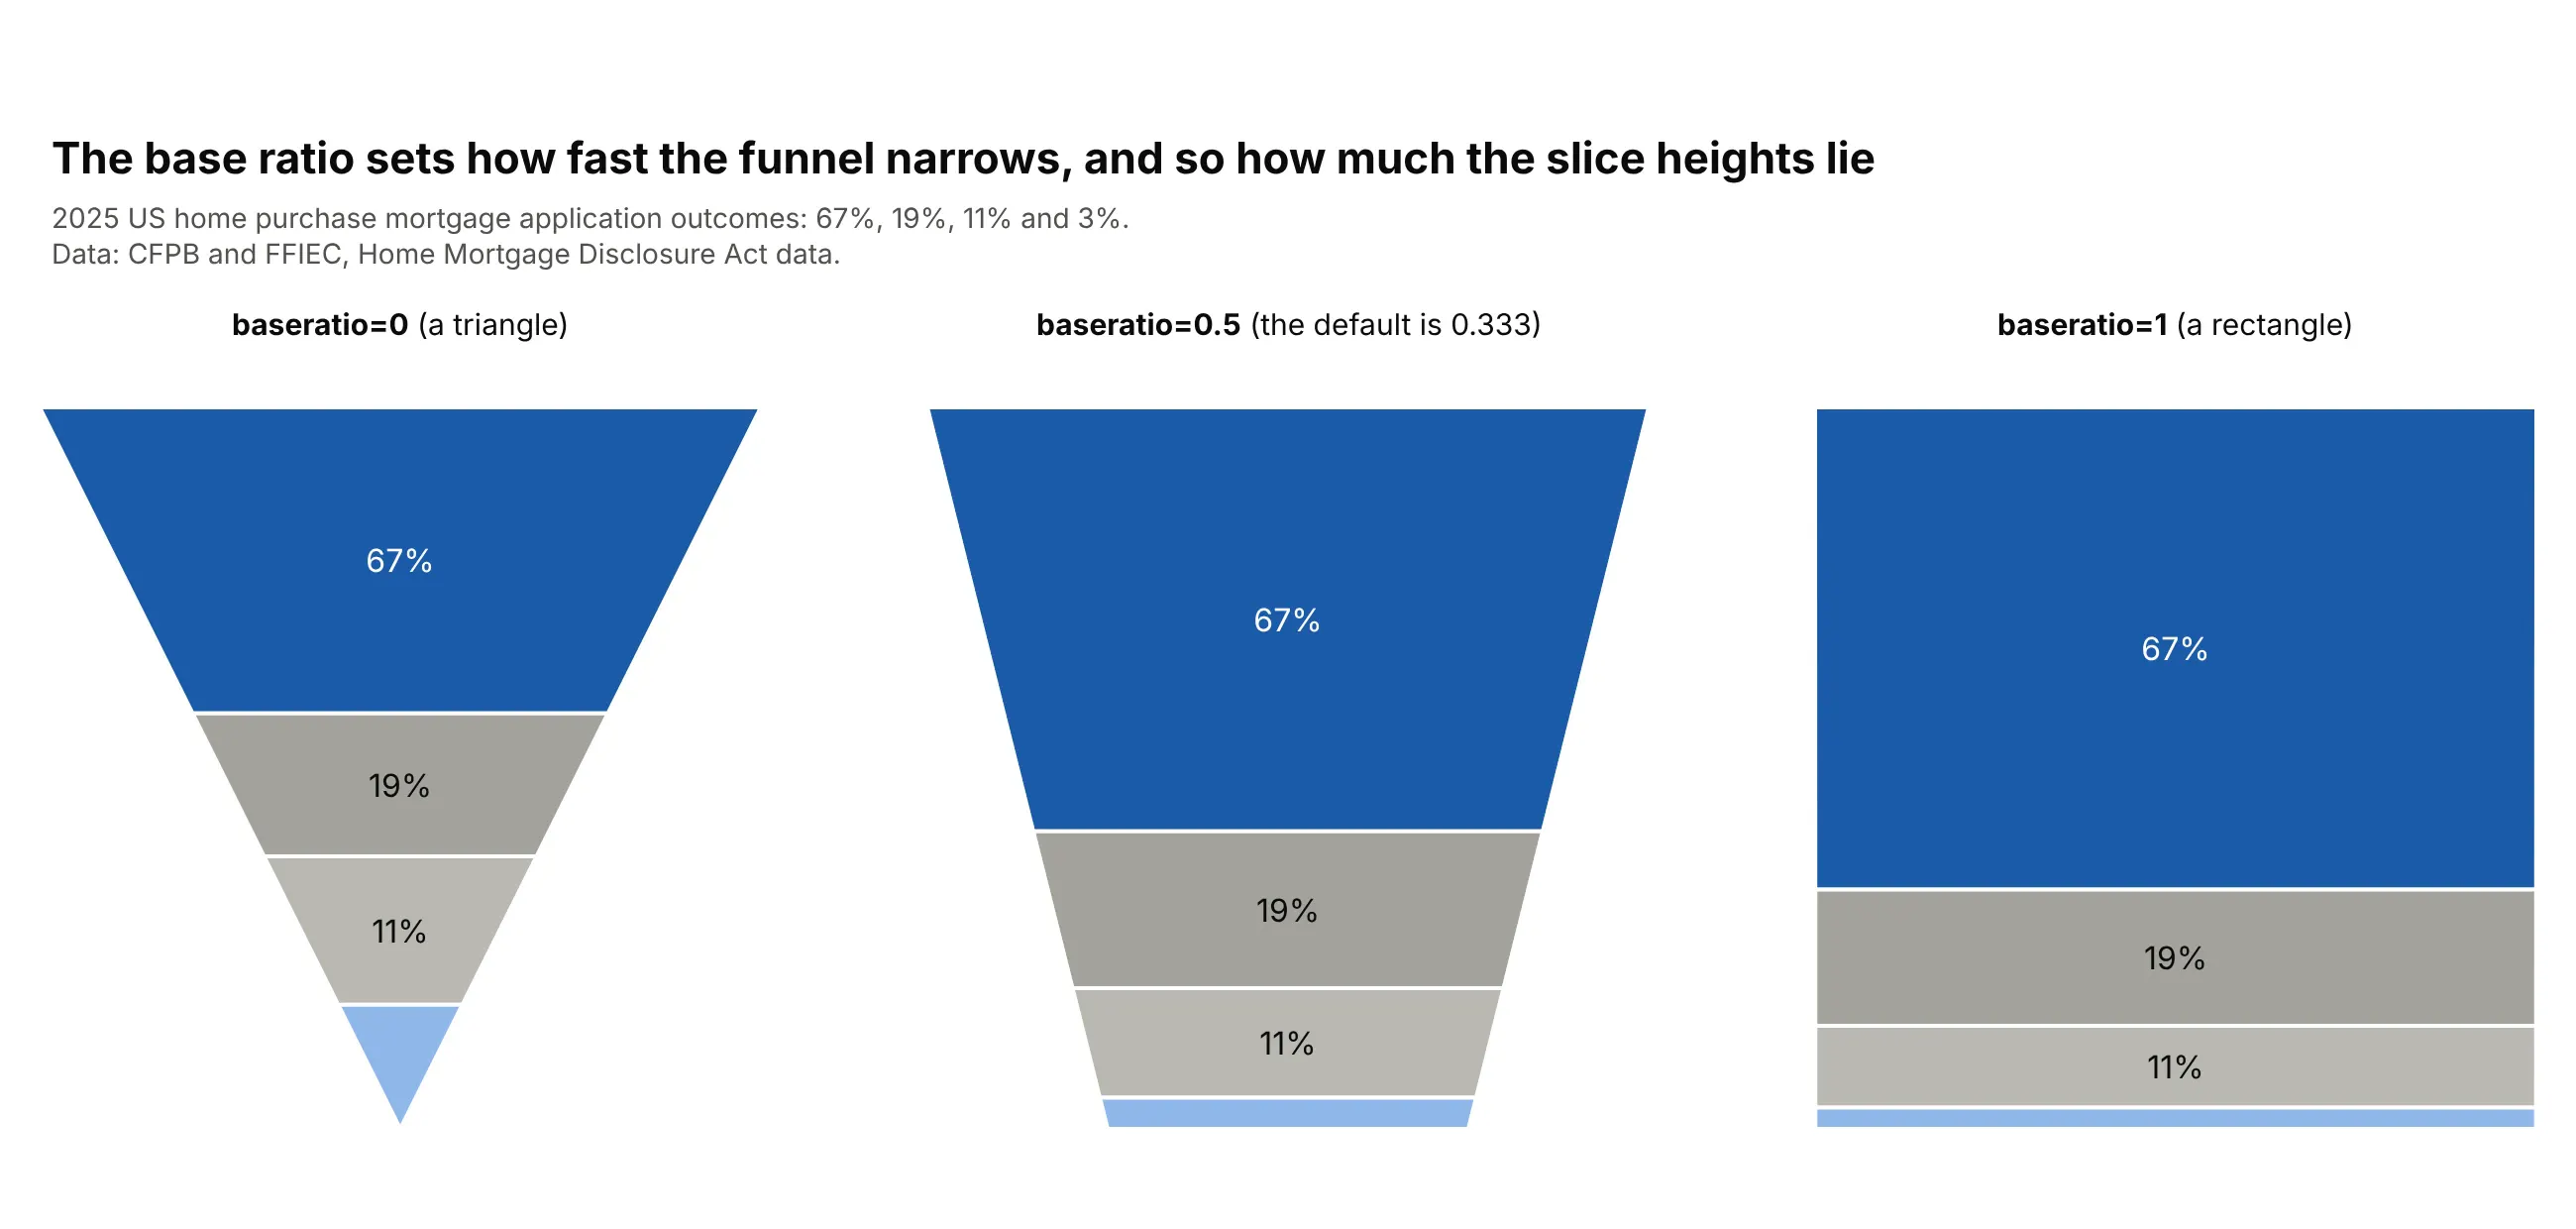
Data: CFPB and FFIEC, HMDA data, 2025, home purchase loans.
A baseratio of 0 makes a triangle, which is the pyramid-like shape people ask for, and it distorts the most: the last slice is a small triangle that needs a lot of height to hold even a few percent. A baseratio of 1 makes a rectangle, where height is exactly proportional to value, and the chart becomes a single stacked bar. If you care about reading values, a high base ratio is the honest choice, and at that point a stacked bar chart does the same job with a scale.
A short history
The funnel as a picture of selling goes back at least to 1924, when William W. Townsend wrote in Bond Salesmanship about "visualizing of the funnel" to lead a customer from attention to interest, according to Wikipedia's article on the purchase funnel. Funnel charts then became a standard way to draw sales pipelines, and Wikipedia's funnel chart article still describes them as showing stages in a sales process or website visitor trends. The area version is newer: plotly.js added both the funnel and funnelarea traces in version 1.48.0 on May 28, 2019, according to its changelog. Other charting tools describe the same idea, for example Deephaven's funnel area plot, which says funnel area plots "display the categories as mutually exclusive" and suggests a pie plot when the categories are unordered.
Alternatives to a funnel area chart
Here's the same 2025 US home purchase mortgage data drawn six ways. Some are better for the question, some worse, some just different:
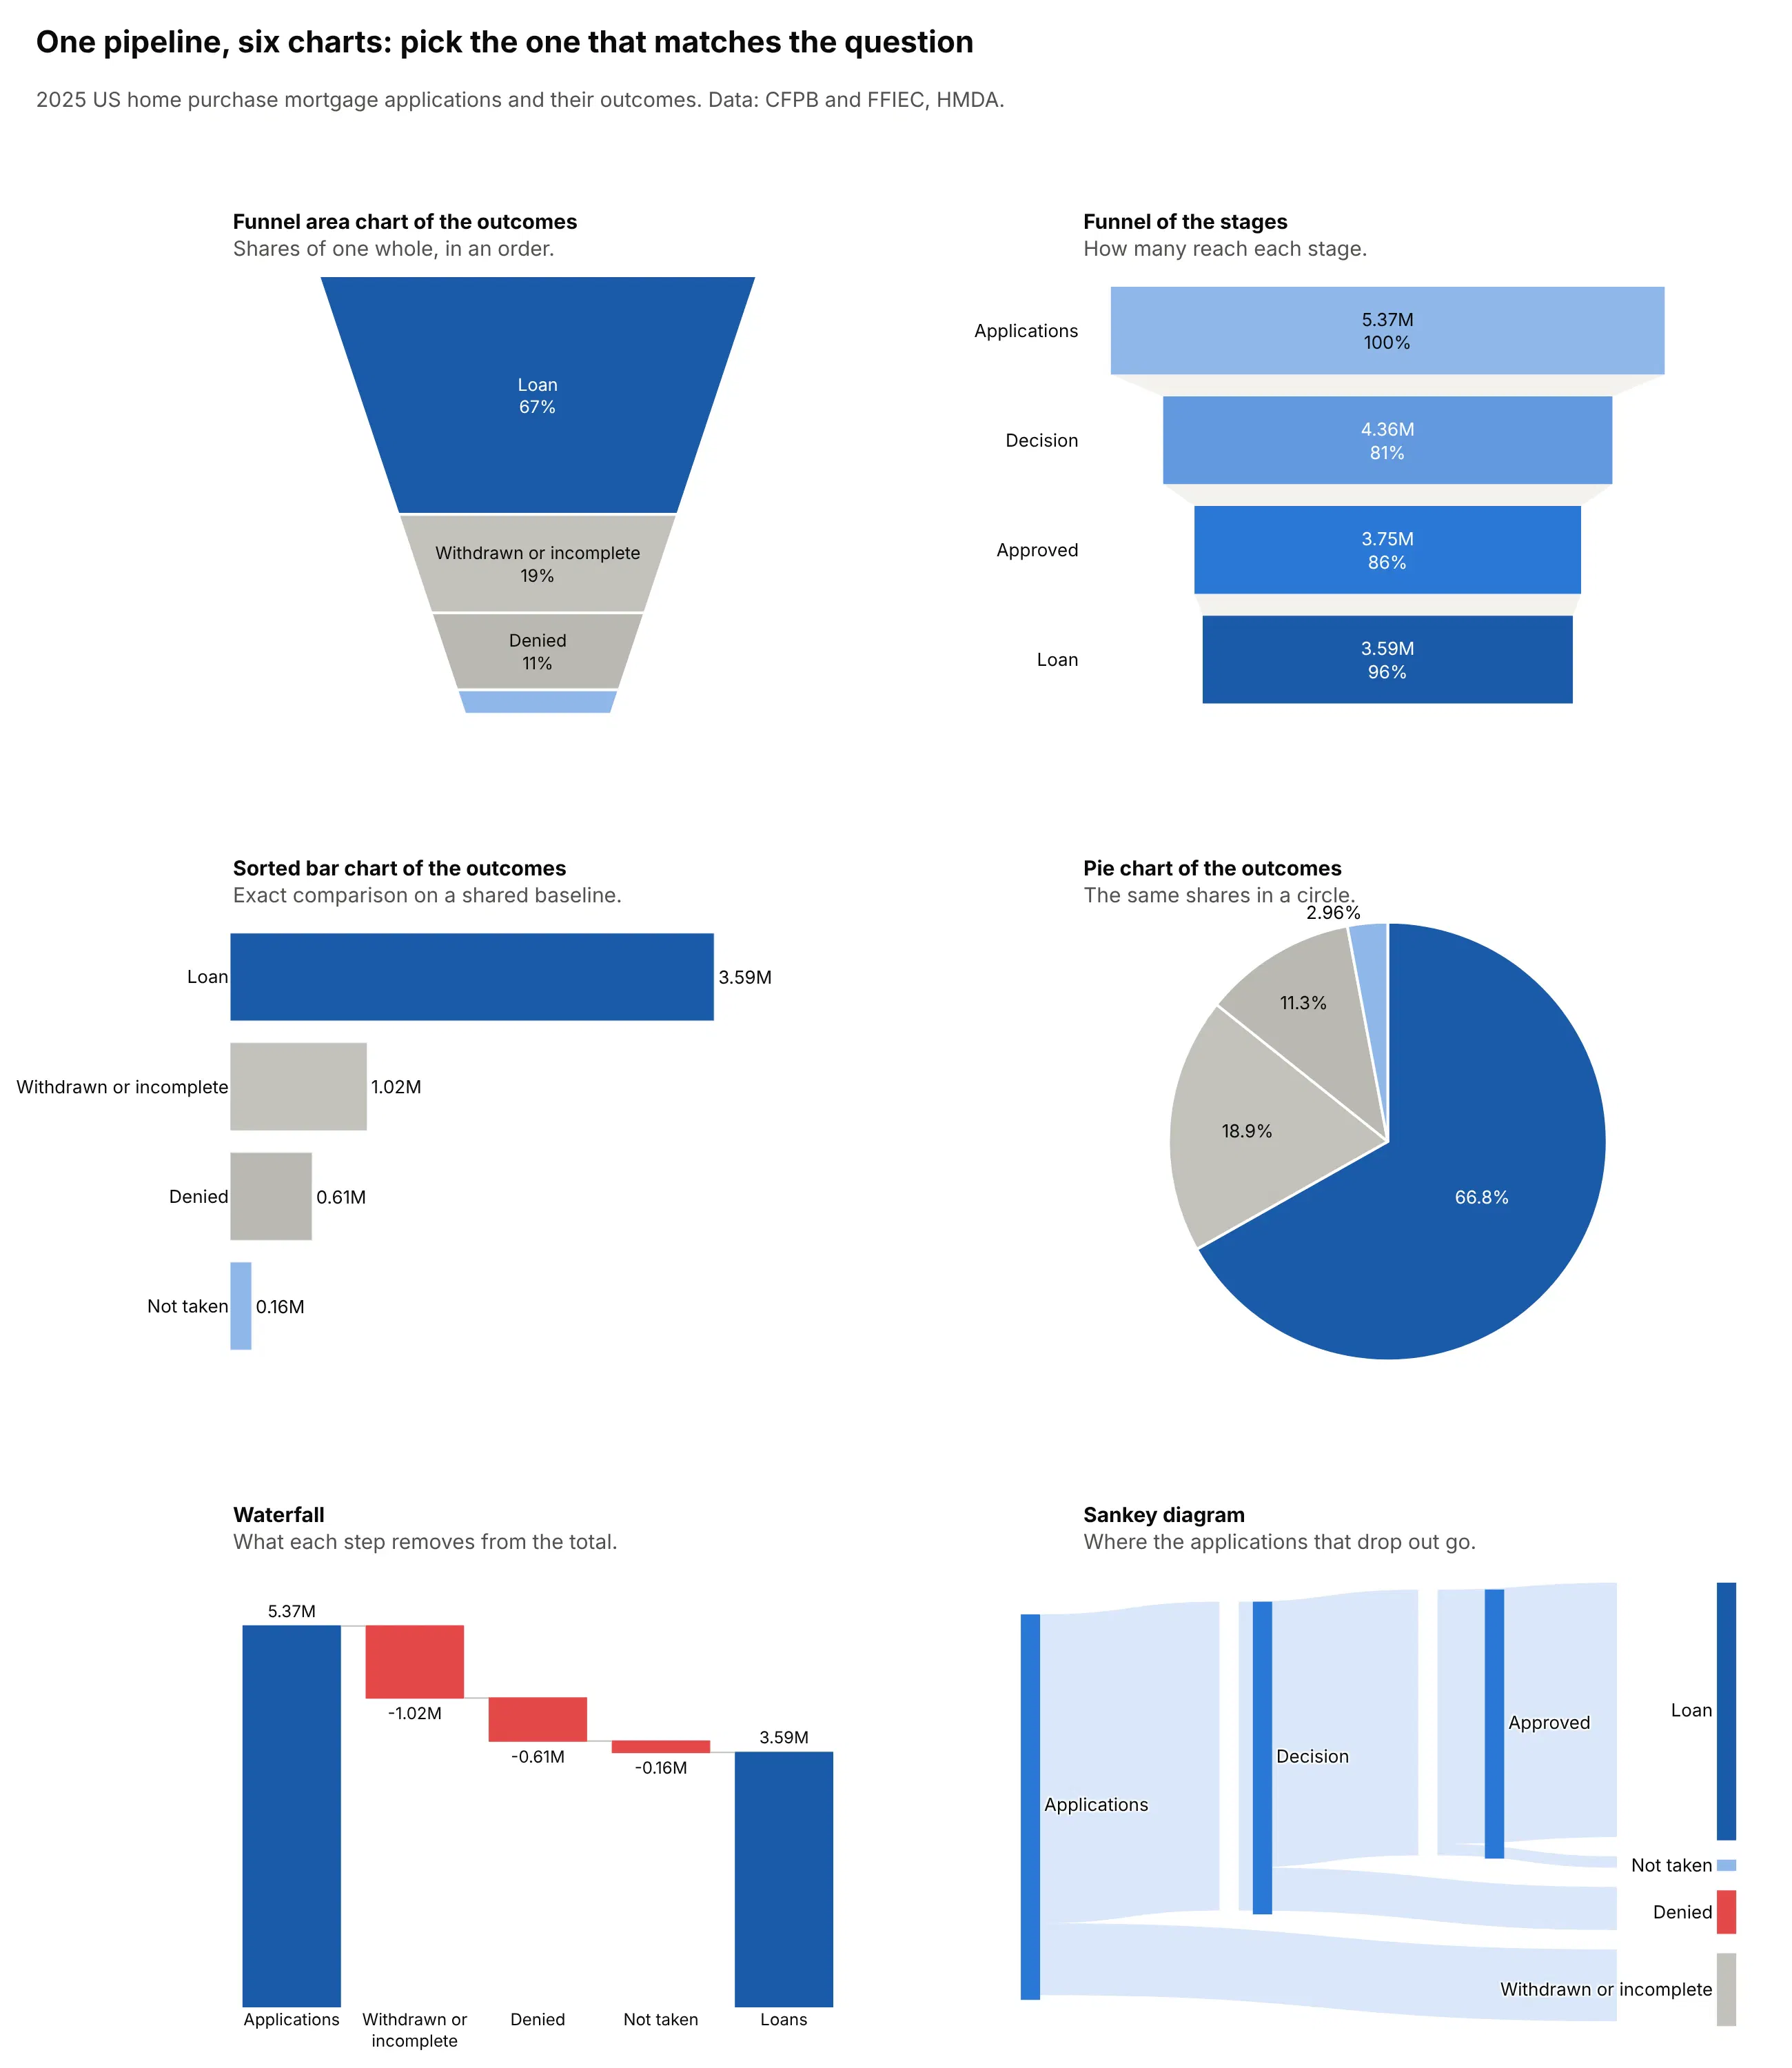
- Funnel chart (better for stages). One bar per stage, with length equal to the count, shows how many items reach each stage and the conversion between them. It handles nested stages, which a funnel area chart can't.
- Sorted bar chart (better for precise comparison). Bars share a baseline, so the 0.61M denied and 0.16M not taken applications compare exactly, which slice heights don't allow.
- Pie chart (works too, for one level). It shows the same shares as a circle and has no distortion from a narrowing shape, so it is the fairer choice when the order of the categories doesn't matter.
- Waterfall chart (better for losses). It shows how much each step removes, in the same units as the total, which a funnel area chart can't do.
- Sankey diagram (better when the process branches). It shows where each group of drop-outs went, so withdrawn, denied and not taken applications each get their own path.
- Funnel area chart (different). It works when the categories don't overlap, you want them in a process order, and exact values are in labels or a legend, as in the interconnection and mortgage outcomes above.
How to make a funnel area chart
With AI
ChatGPT, Claude Code, GitHub Copilot, Cursor and other AI tools are excellent at writing Plotly code. Name Plotly in the prompt, and say that every item must count in one slice, so the model doesn't pass in overlapping stage counts:
Make a plotly funnel area chart from interconnection.csv (columns: status, gigawatts). Each row is adifferent status, so the rows don't overlap and add up to the total.- Use px.funnel_area with names=status and values=gigawatts, rows in the order given (don't sort them).- Color the status I care about (Operational) in dark blue and the others in grays and a light blue.- Show only the percent on each slice, and put every value, with its unit, in the legend so thin slicesstay readable.- Title it with the takeaway, and put the data source in a muted subtitle.- Check: print the total and confirm the values sum to it, and tell me if any row is a subset of another.
With Plotly Studio
Plotly Studio is a product for creating data visualizations and Dash apps and for analyzing data with AI, available as a desktop app or embedded in Dash apps. Ask for a funnel area chart the same way:
Show where every interconnection request ended up as a funnel area chart of capacity by status, with the operational share in a call-out, and a bar chart of the same statuses next to it for exact values.
Make a funnel area chart in Python or JavaScript
This is the code AI tools write under the hood. In Python, px.funnel_area takes names and values, and go.Funnelarea takes the same data as labels and values with more control. This example draws the interconnection data from the chart above:
import plotly.express as px# Status at the end of 2025 of power plant capacity (GW) with a signed interconnection agreement, 2000-2022# (Lawrence Berkeley National Laboratory, Queued Up: 2026 Edition)status = ["Operational", "Withdrawn", "Active", "Suspended"]gigawatts = [309, 296, 105, 6]fig = px.funnel_area(names=status,values=gigawatts,color=status,color_discrete_sequence=["#1a5aa8", "#a3a29b", "#8fb7ea", "#d7e5f8"],title="43% of capacity with a signed interconnection agreement is operating",)fig.update_traces(textinfo="label+percent", texttemplate="%{label}<br>%{percent:.0%}", showlegend=False)fig.update_layout(width=700, height=700)fig.show()
The slices keep the order of the lists, because the funnelarea trace doesn't sort, so sort the data yourself when you want the largest at the top. Pass baseratio through update_traces(baseratio=0.5) to change how fast the funnel narrows.
In JavaScript, a funnelarea trace takes the same arrays:
<div id="chart"></div><script src="https://cdn.plot.ly/plotly-4.1.1.min.js"></script><script>// Status at the end of 2025 of power plant capacity (GW) with a signed interconnection agreement, 2000-2022// (Lawrence Berkeley National Laboratory, Queued Up: 2026 Edition)const status = ["Operational", "Withdrawn", "Active", "Suspended"];const gigawatts = [309, 296, 105, 6];Plotly.newPlot("chart", [{type: "funnelarea",labels: status,values: gigawatts,marker: {colors: ["#1a5aa8", "#a3a29b", "#8fb7ea", "#d7e5f8"], line: {color: "white", width: 2}},textinfo: "label+percent",texttemplate: "%{label}<br>%{percent:.0%}",showlegend: false}], {title: {text: "43% of capacity with a signed interconnection agreement is operating"},width: 700, height: 700});</script>
Share it
Every Plotly chart has a Share chart button (the cloud icon in its toolbar) that uploads it to Plotly Cloud and gives you a link. Only you can see it until you change its visibility.
For a live app, put the chart in a Dash app and publish it with the Plotly Cloud command-line interface (CLI). Coding agents can run these commands for you:
pip install "dash[cloud]"plotly user loginplotly app publish
If your data has to stay in your own cloud or data center, publish to Dash Enterprise instead.
Dos and don'ts
The two mistakes that matter most are feeding the chart overlapping stages and cluttering the slices with raw numbers. Here are the 2025 home purchase mortgage applications both ways, in the same colors.
Don't pass in the nested stages of a funnel, which the chart adds up to 17.1 million, print raw unformatted counts and a percent of that sum on every slice, put dark text on a dark slice, or use a default serif font:
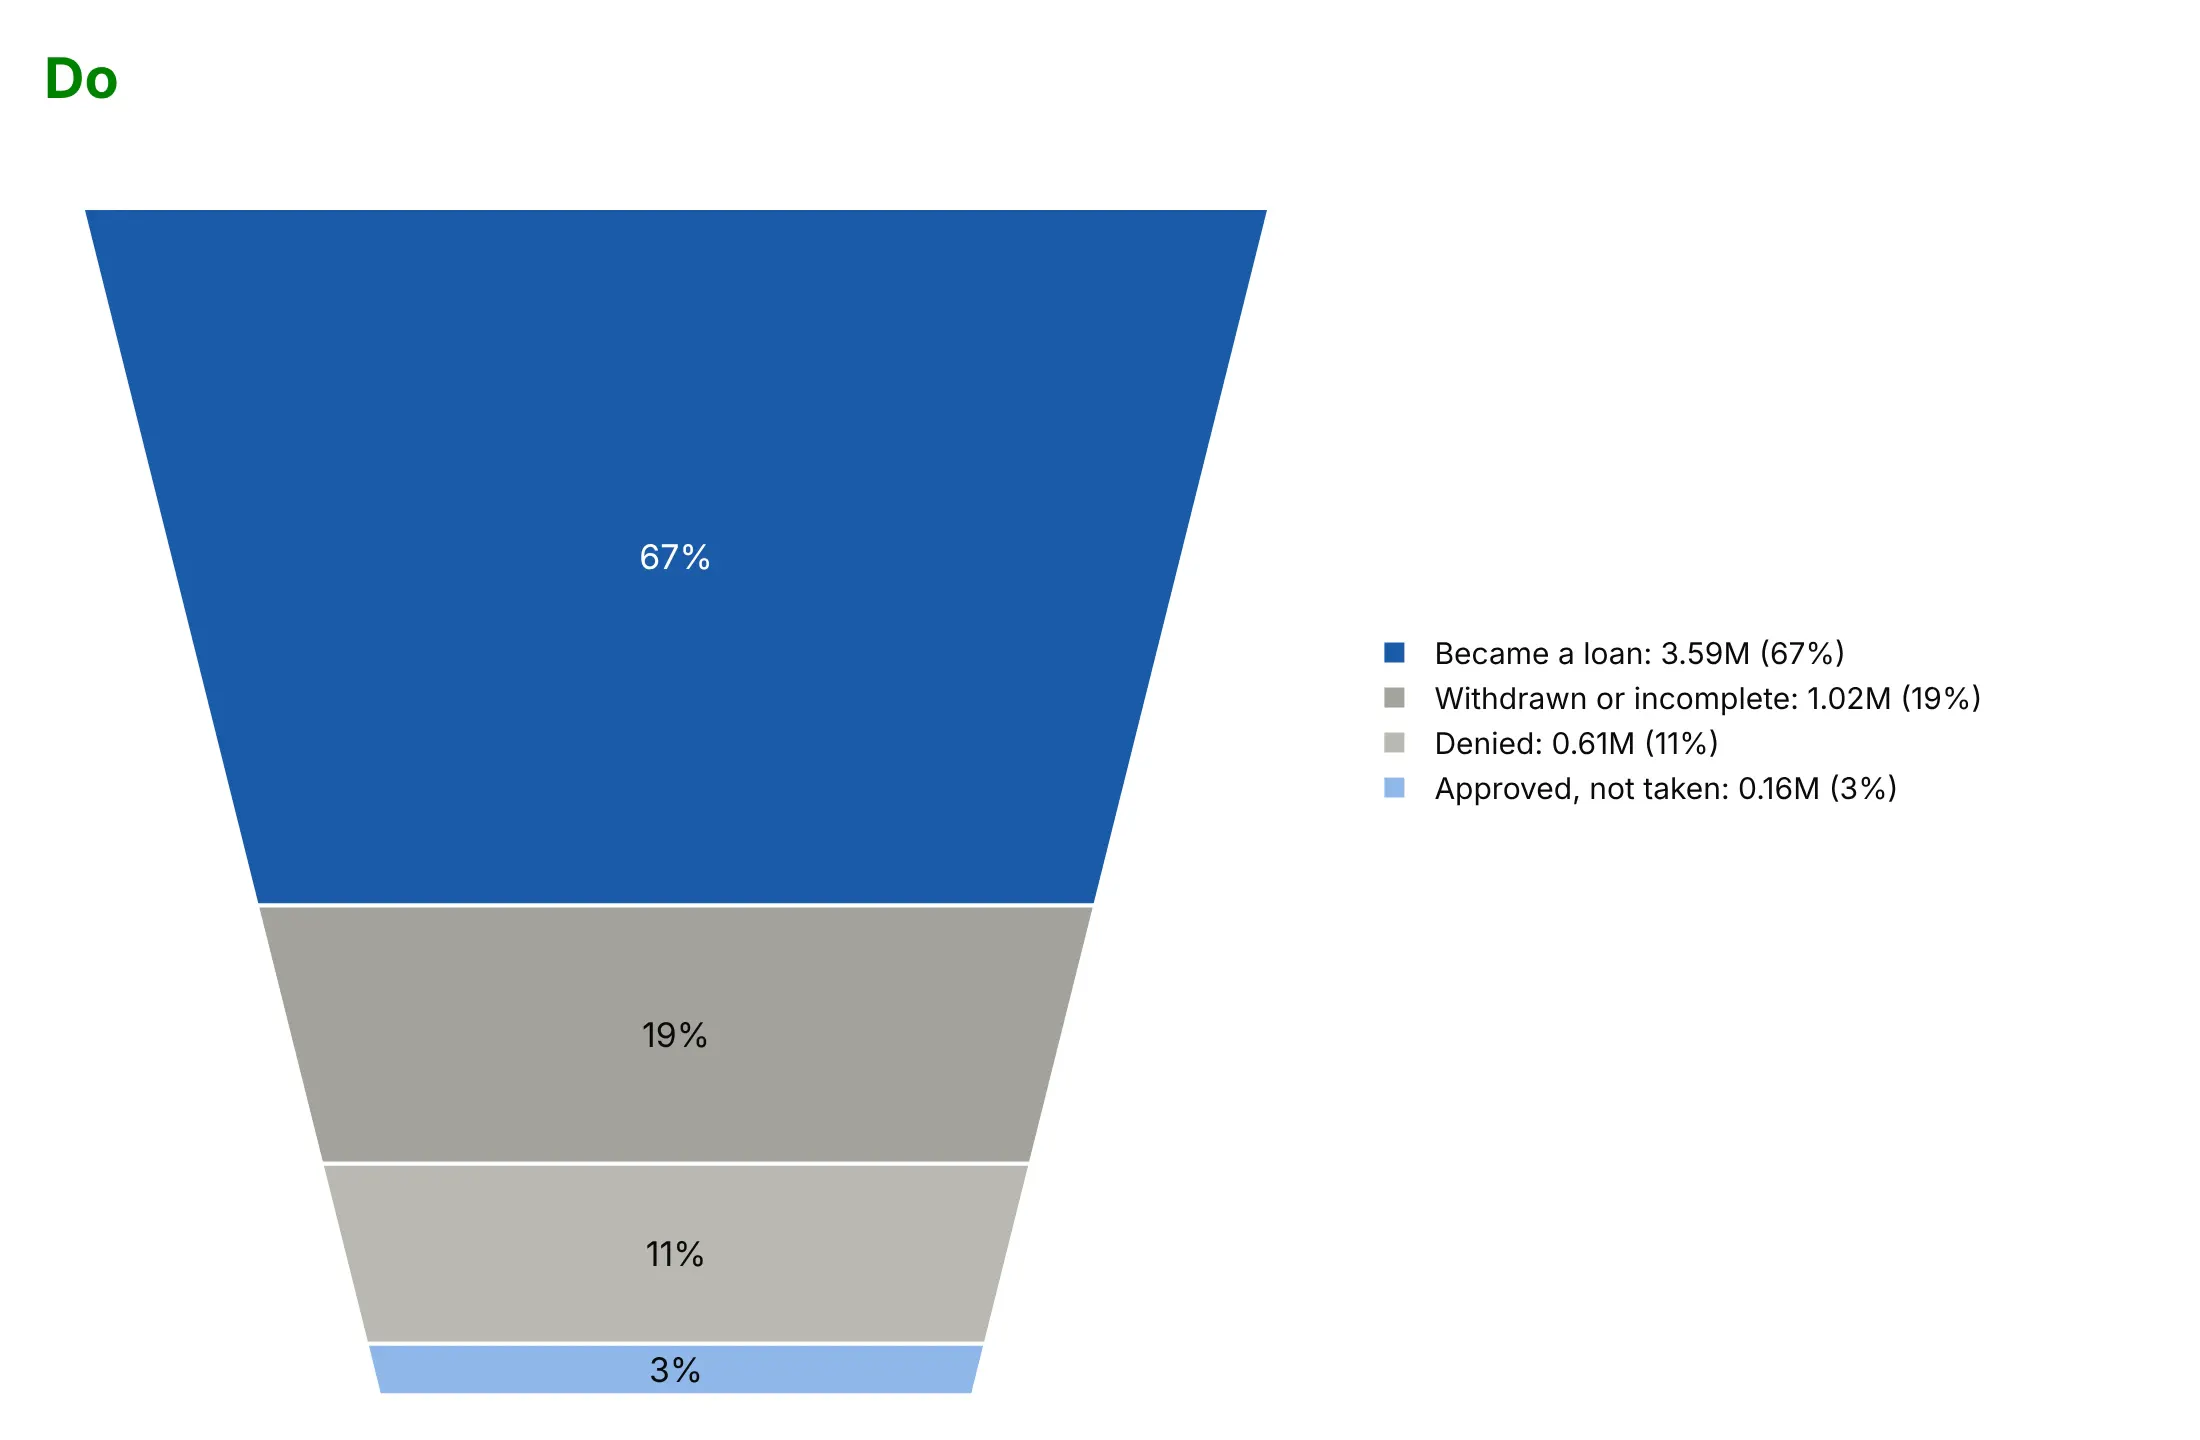
Do pass in outcomes that don't overlap and add up to the 5.37 million applications, show only a percent on each slice, put the values in short form in a legend, and use white text on the dark slice:
Checklist
Do
- Check that the values add up to a total that means something, and say what it is in the subtitle.
- Count each item once, at the furthest stage it reached, when you start from funnel stages.
- Put the values in the legend or labels, because area is hard to read.
- Keep the order of the slices meaningful, either by process stage or by size.
- Color the slice you want read in a strong color and the rest in grays or tints of one hue.
- Keep to about three to seven slices.
Don't
- Pass in overlapping stage counts; use a funnel chart.
- Let readers compare slices by height; the narrower slices lower down are taller for the same value.
- Use baseratio=0 to get a triangle when exact comparison matters.
- Put the label of a thin slice inside it; use the legend.
- Show several funnel areas side by side without scalegroup, which sizes them by their totals.
More funnel area chart examples
Seven more funnel area charts built from real public data, each with its source, a tip and a prompt to rebuild it.
1. Mortgage applications: where 5.37 million applications ended up
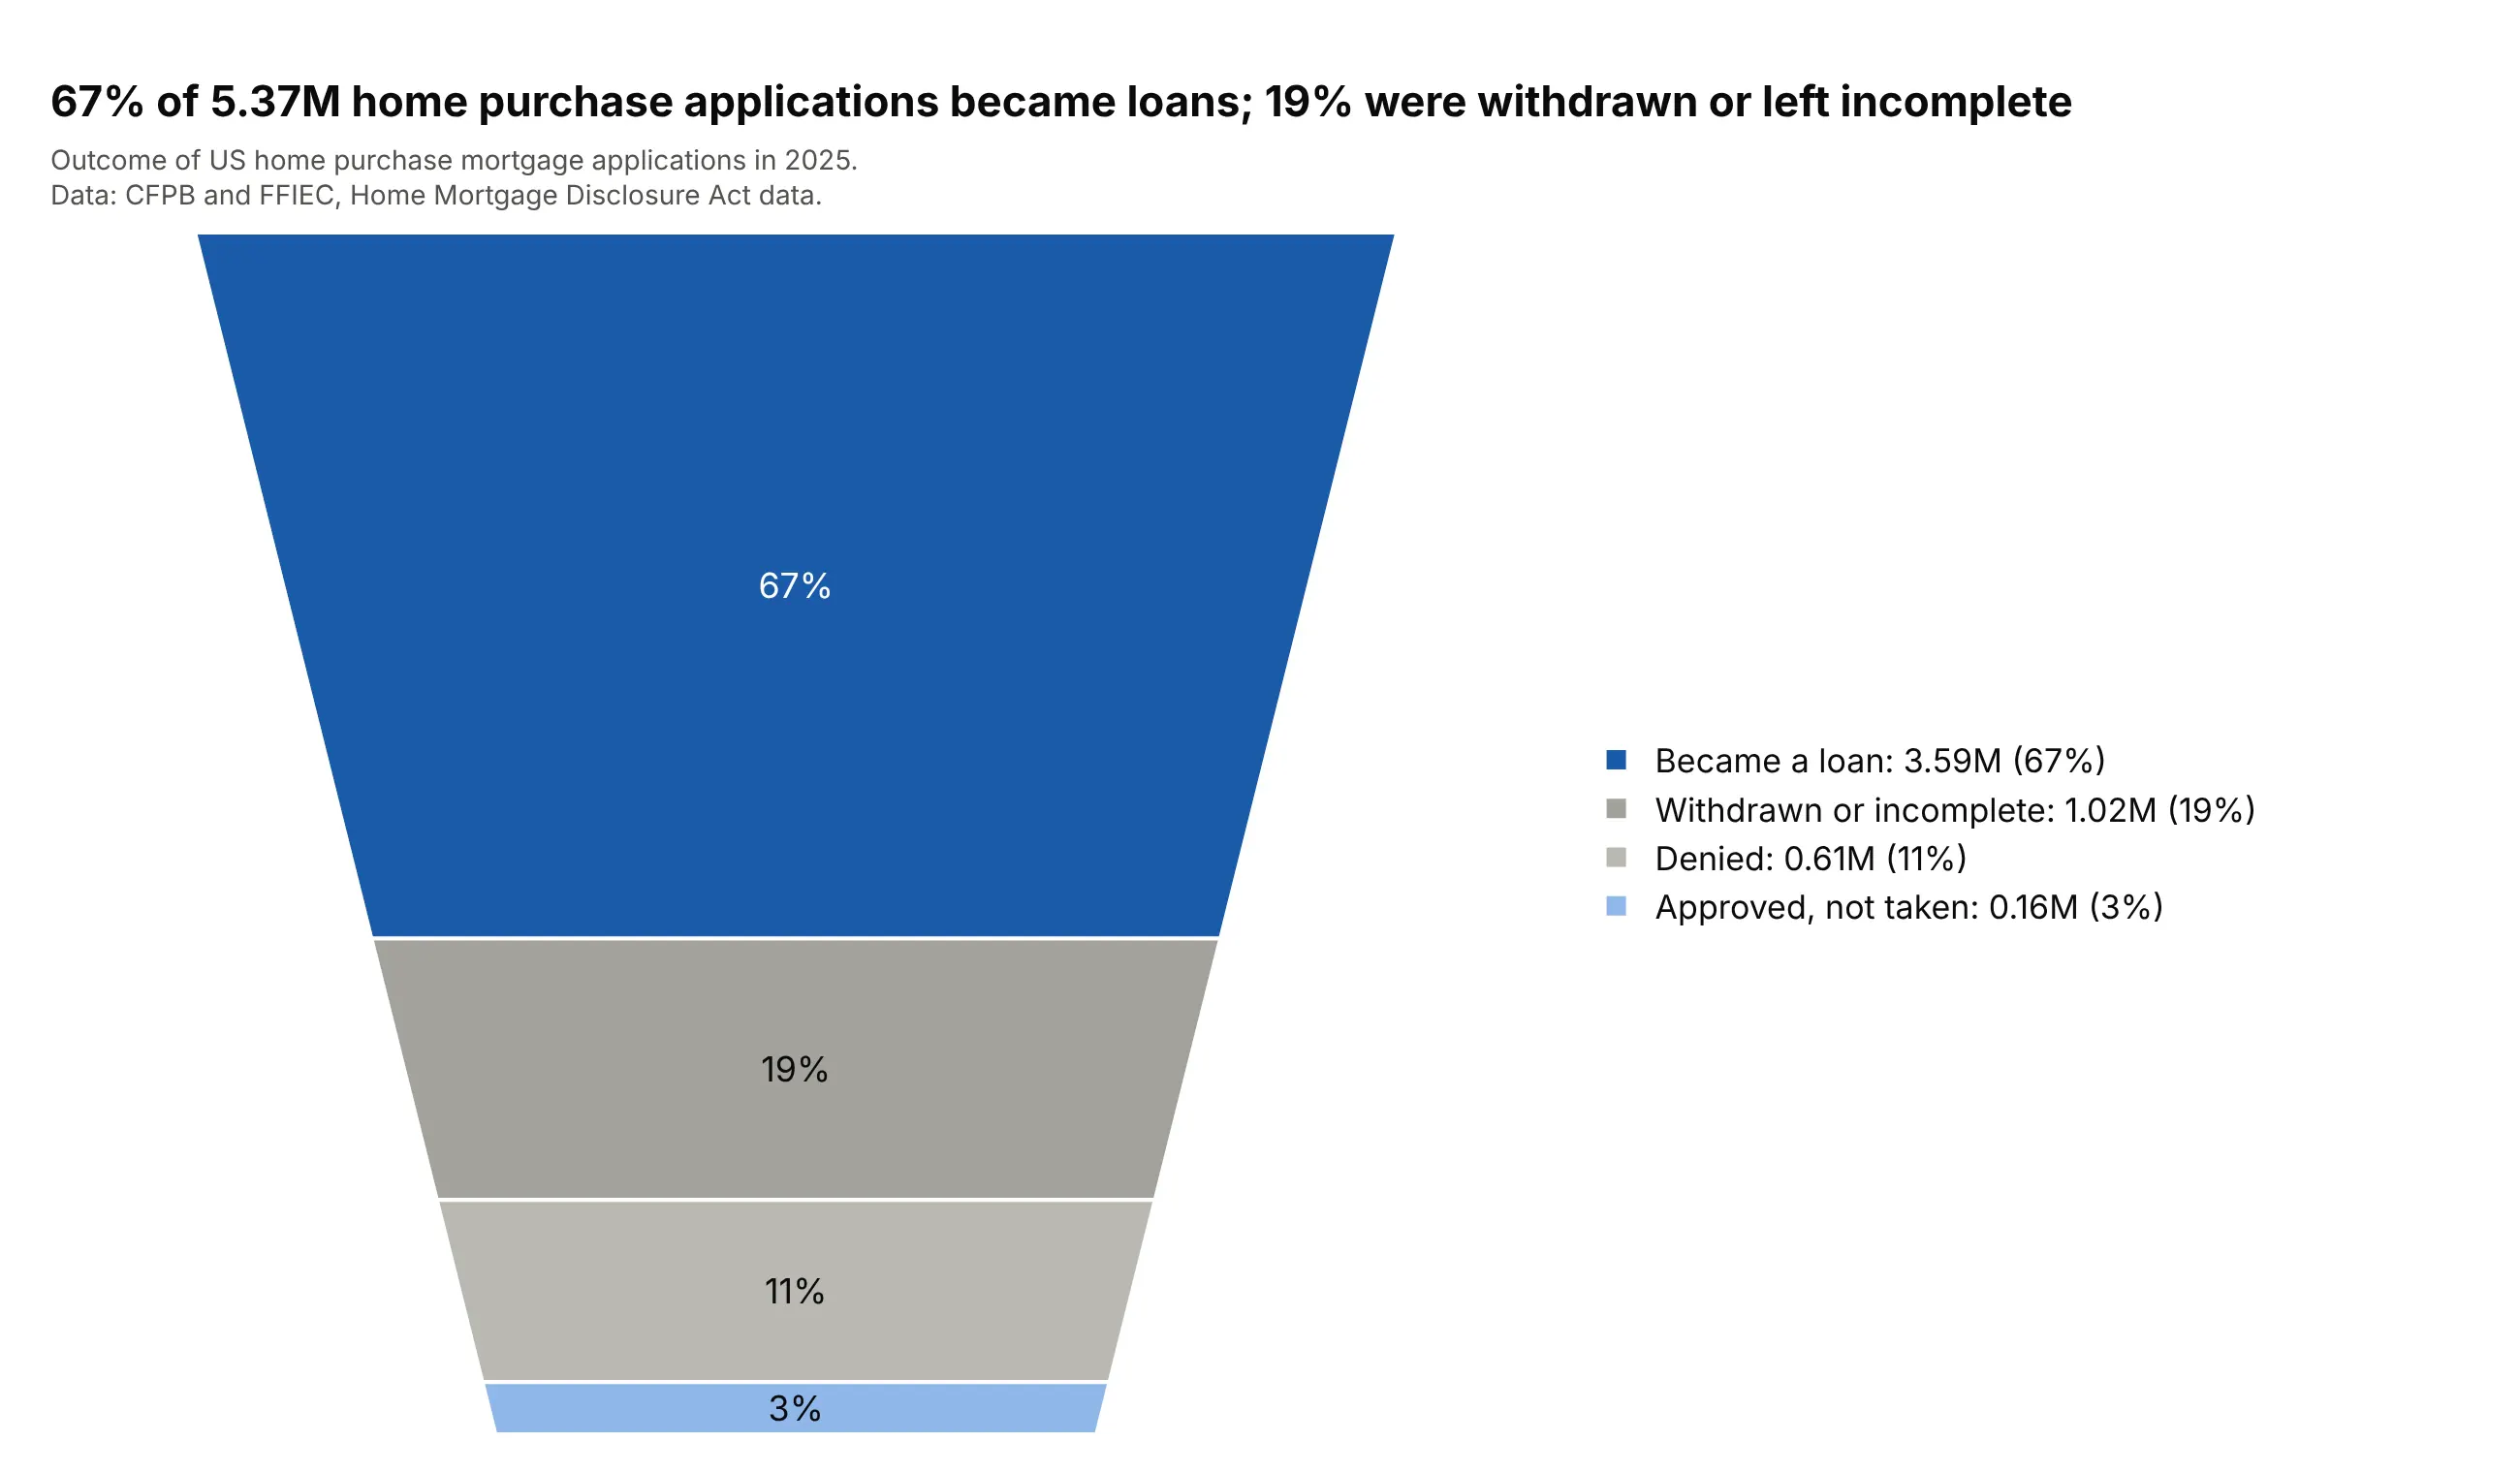
Of 5.37 million home purchase applications in 2025, 67% became loans, and withdrawn or incomplete applications (19%) outnumbered denials (11%). Each application has exactly one outcome, so the slices add up to the total. Data: CFPB and FFIEC, HMDA data, 2025.
Tip: the funnel of the nested stages in the figure above answers "how many reach each stage", so use this chart for "how do they end".
Get the data from the Home Mortgage Disclosure Act (HMDA) Data Browser API of the Consumer FinancialProtection Bureau and the Federal Financial Institutions Examination Council (nationwide aggregations for2025, loan purpose 1 = home purchase, by action_taken 1 to 5, column: count).Make a plotly px.funnel_area of the outcomes in this order: loan originated (1), withdrawn or closed asincomplete (4 and 5), denied (3), approved not accepted (2). Dark blue for loans, grays for the rest, thepercent on each slice and values in millions in the legend.
2. Natural gas: where 45.9 trillion cubic feet went
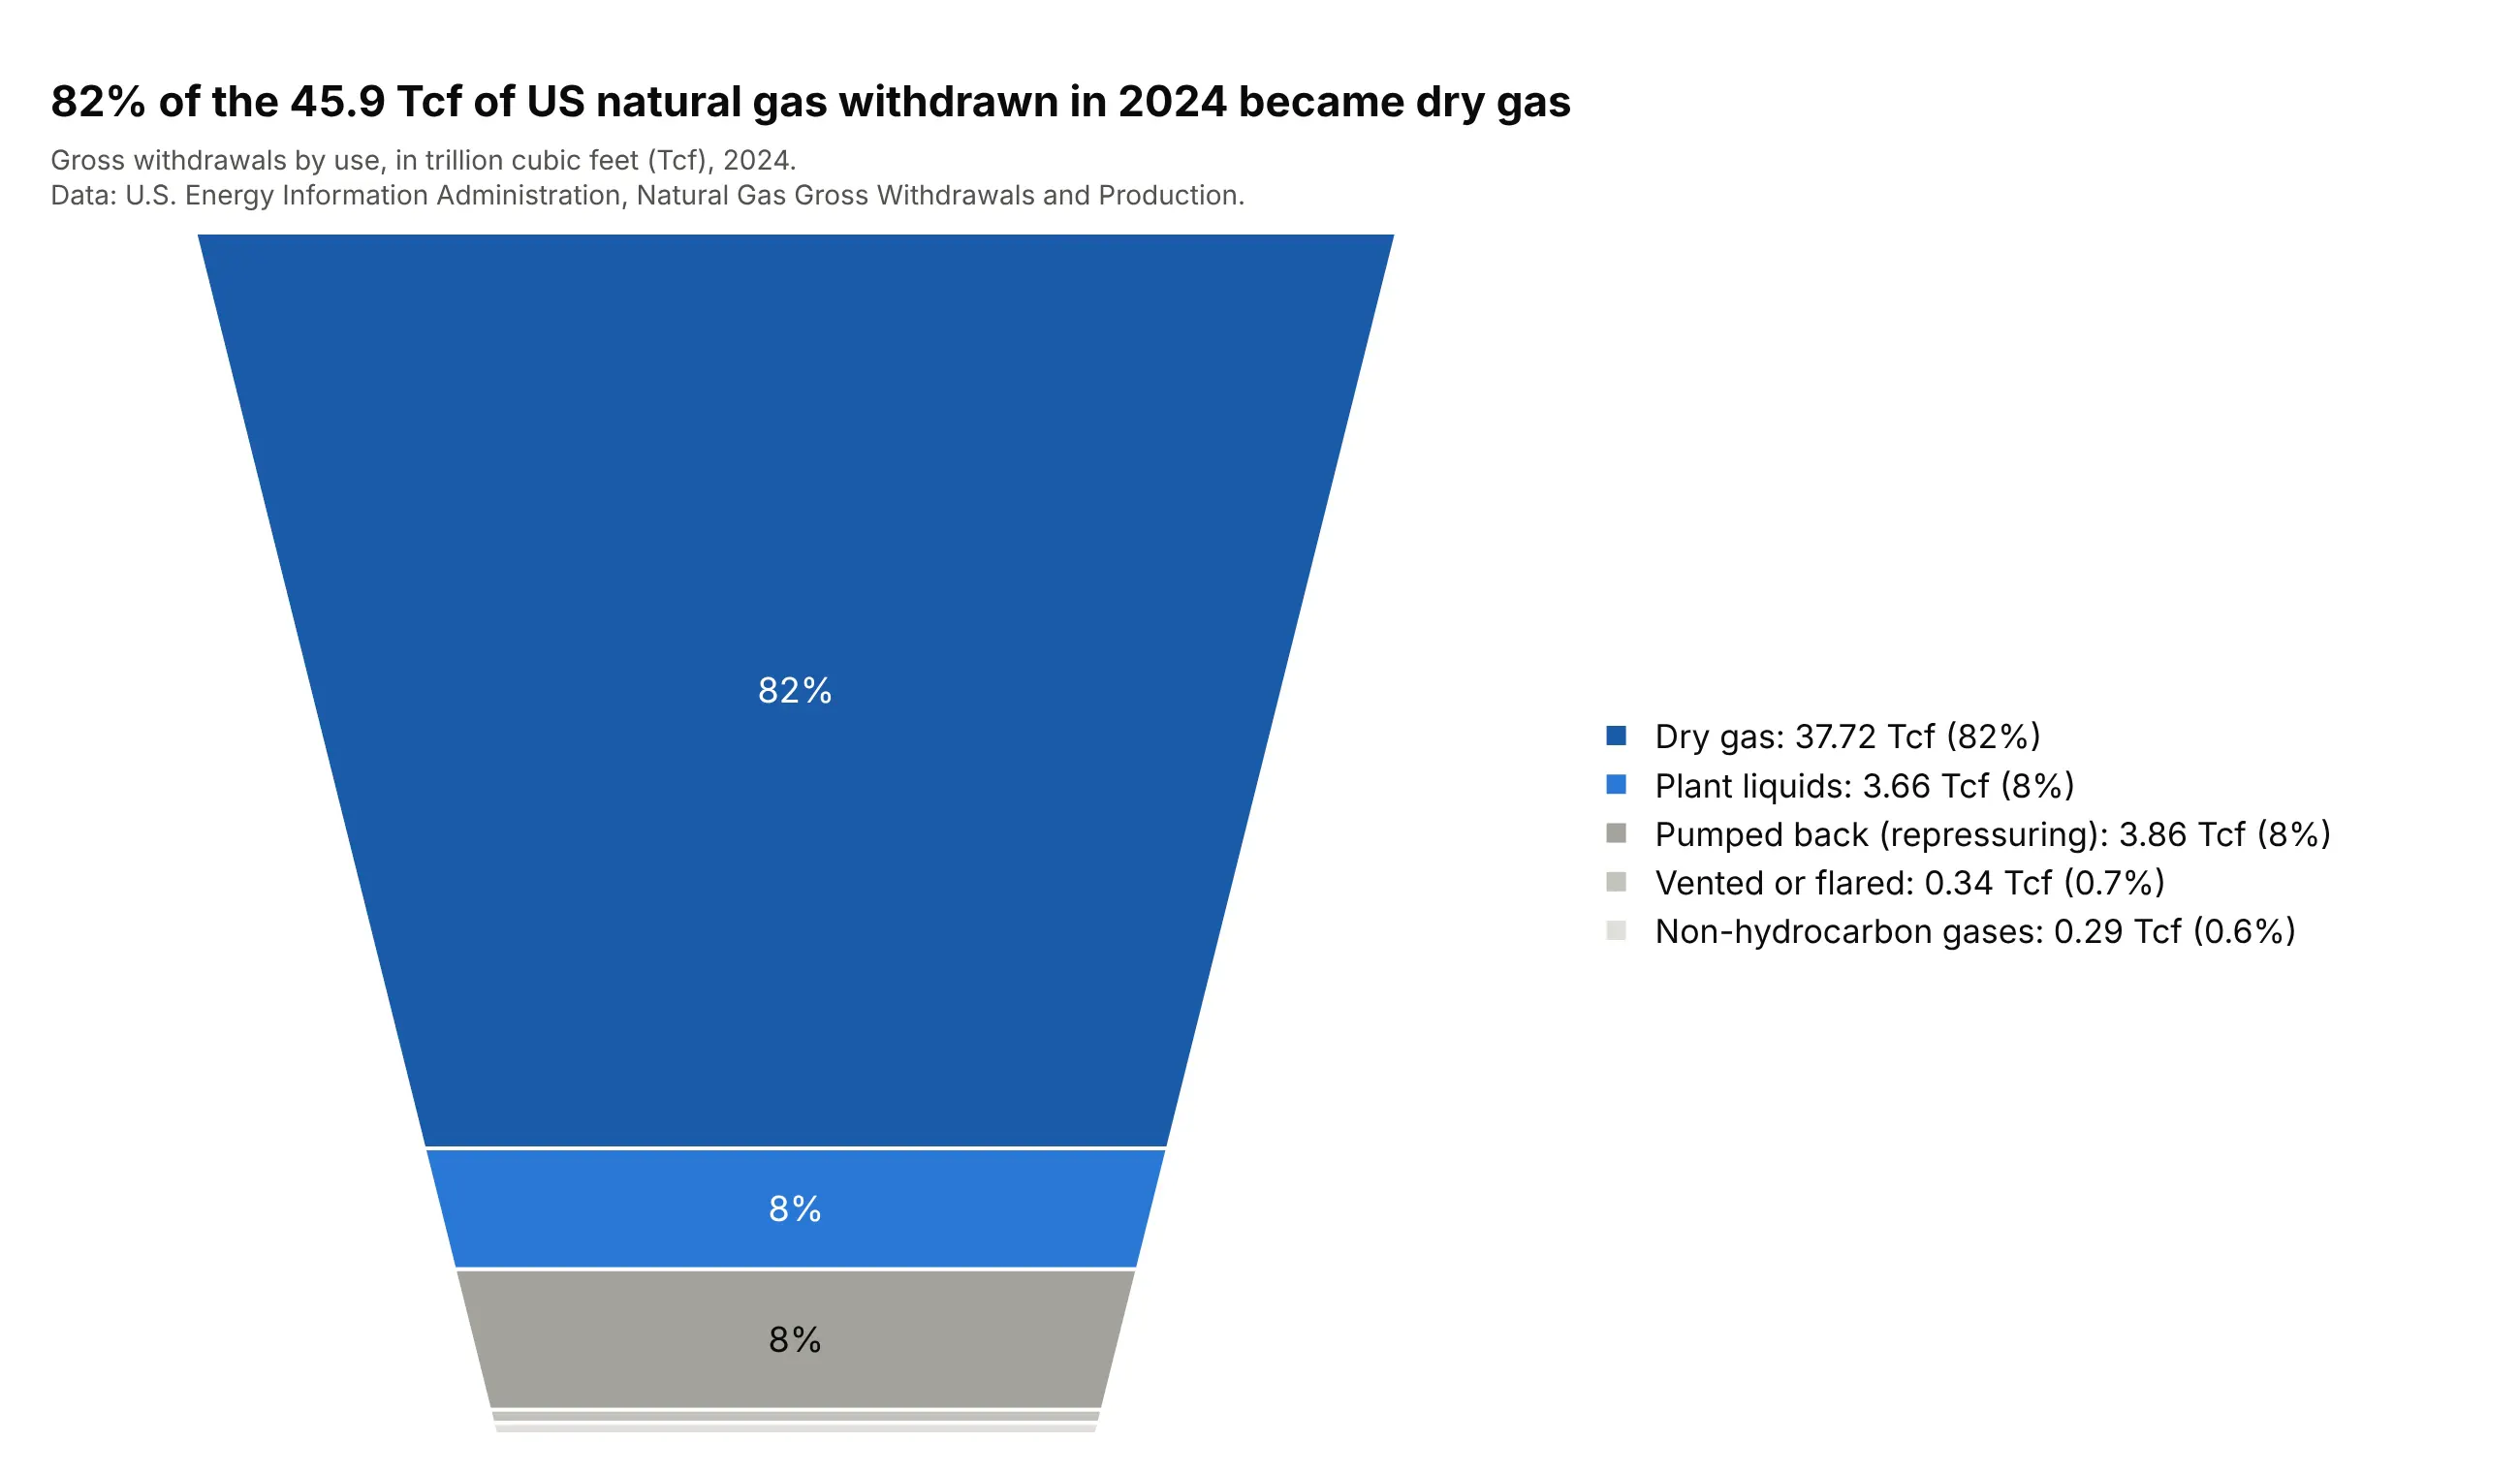
Of the 45.9 trillion cubic feet (Tcf) of natural gas withdrawn in the US in 2024, 82% became dry gas for consumers, 8% was natural gas plant liquids and another 8% was pumped back into reservoirs to keep pressure up. The five uses add up to the gross withdrawals to within rounding. Data: EIA, Natural Gas Gross Withdrawals and Production, 2024.
Tip: when one slice is 82%, the funnel's top is mostly that one slice, so put the story in the title and the thin slices in the legend.
Get the data from the US Energy Information Administration, Natural Gas Gross Withdrawals and Production,US annual, million cubic feet (columns: gross withdrawals, repressuring, vented and flared,nonhydrocarbon gases removed, marketed production, NGPL production, dry production).Make a plotly funnel area chart for 2024 of how gross withdrawals divide into dry gas, plant liquids,repressuring, venting and flaring, and nonhydrocarbon gases (in Tcf). Assert that the five parts add up togross withdrawals, dry gas in dark blue, the losses in grays, and values in the legend.
3. College admissions: 14 million applications
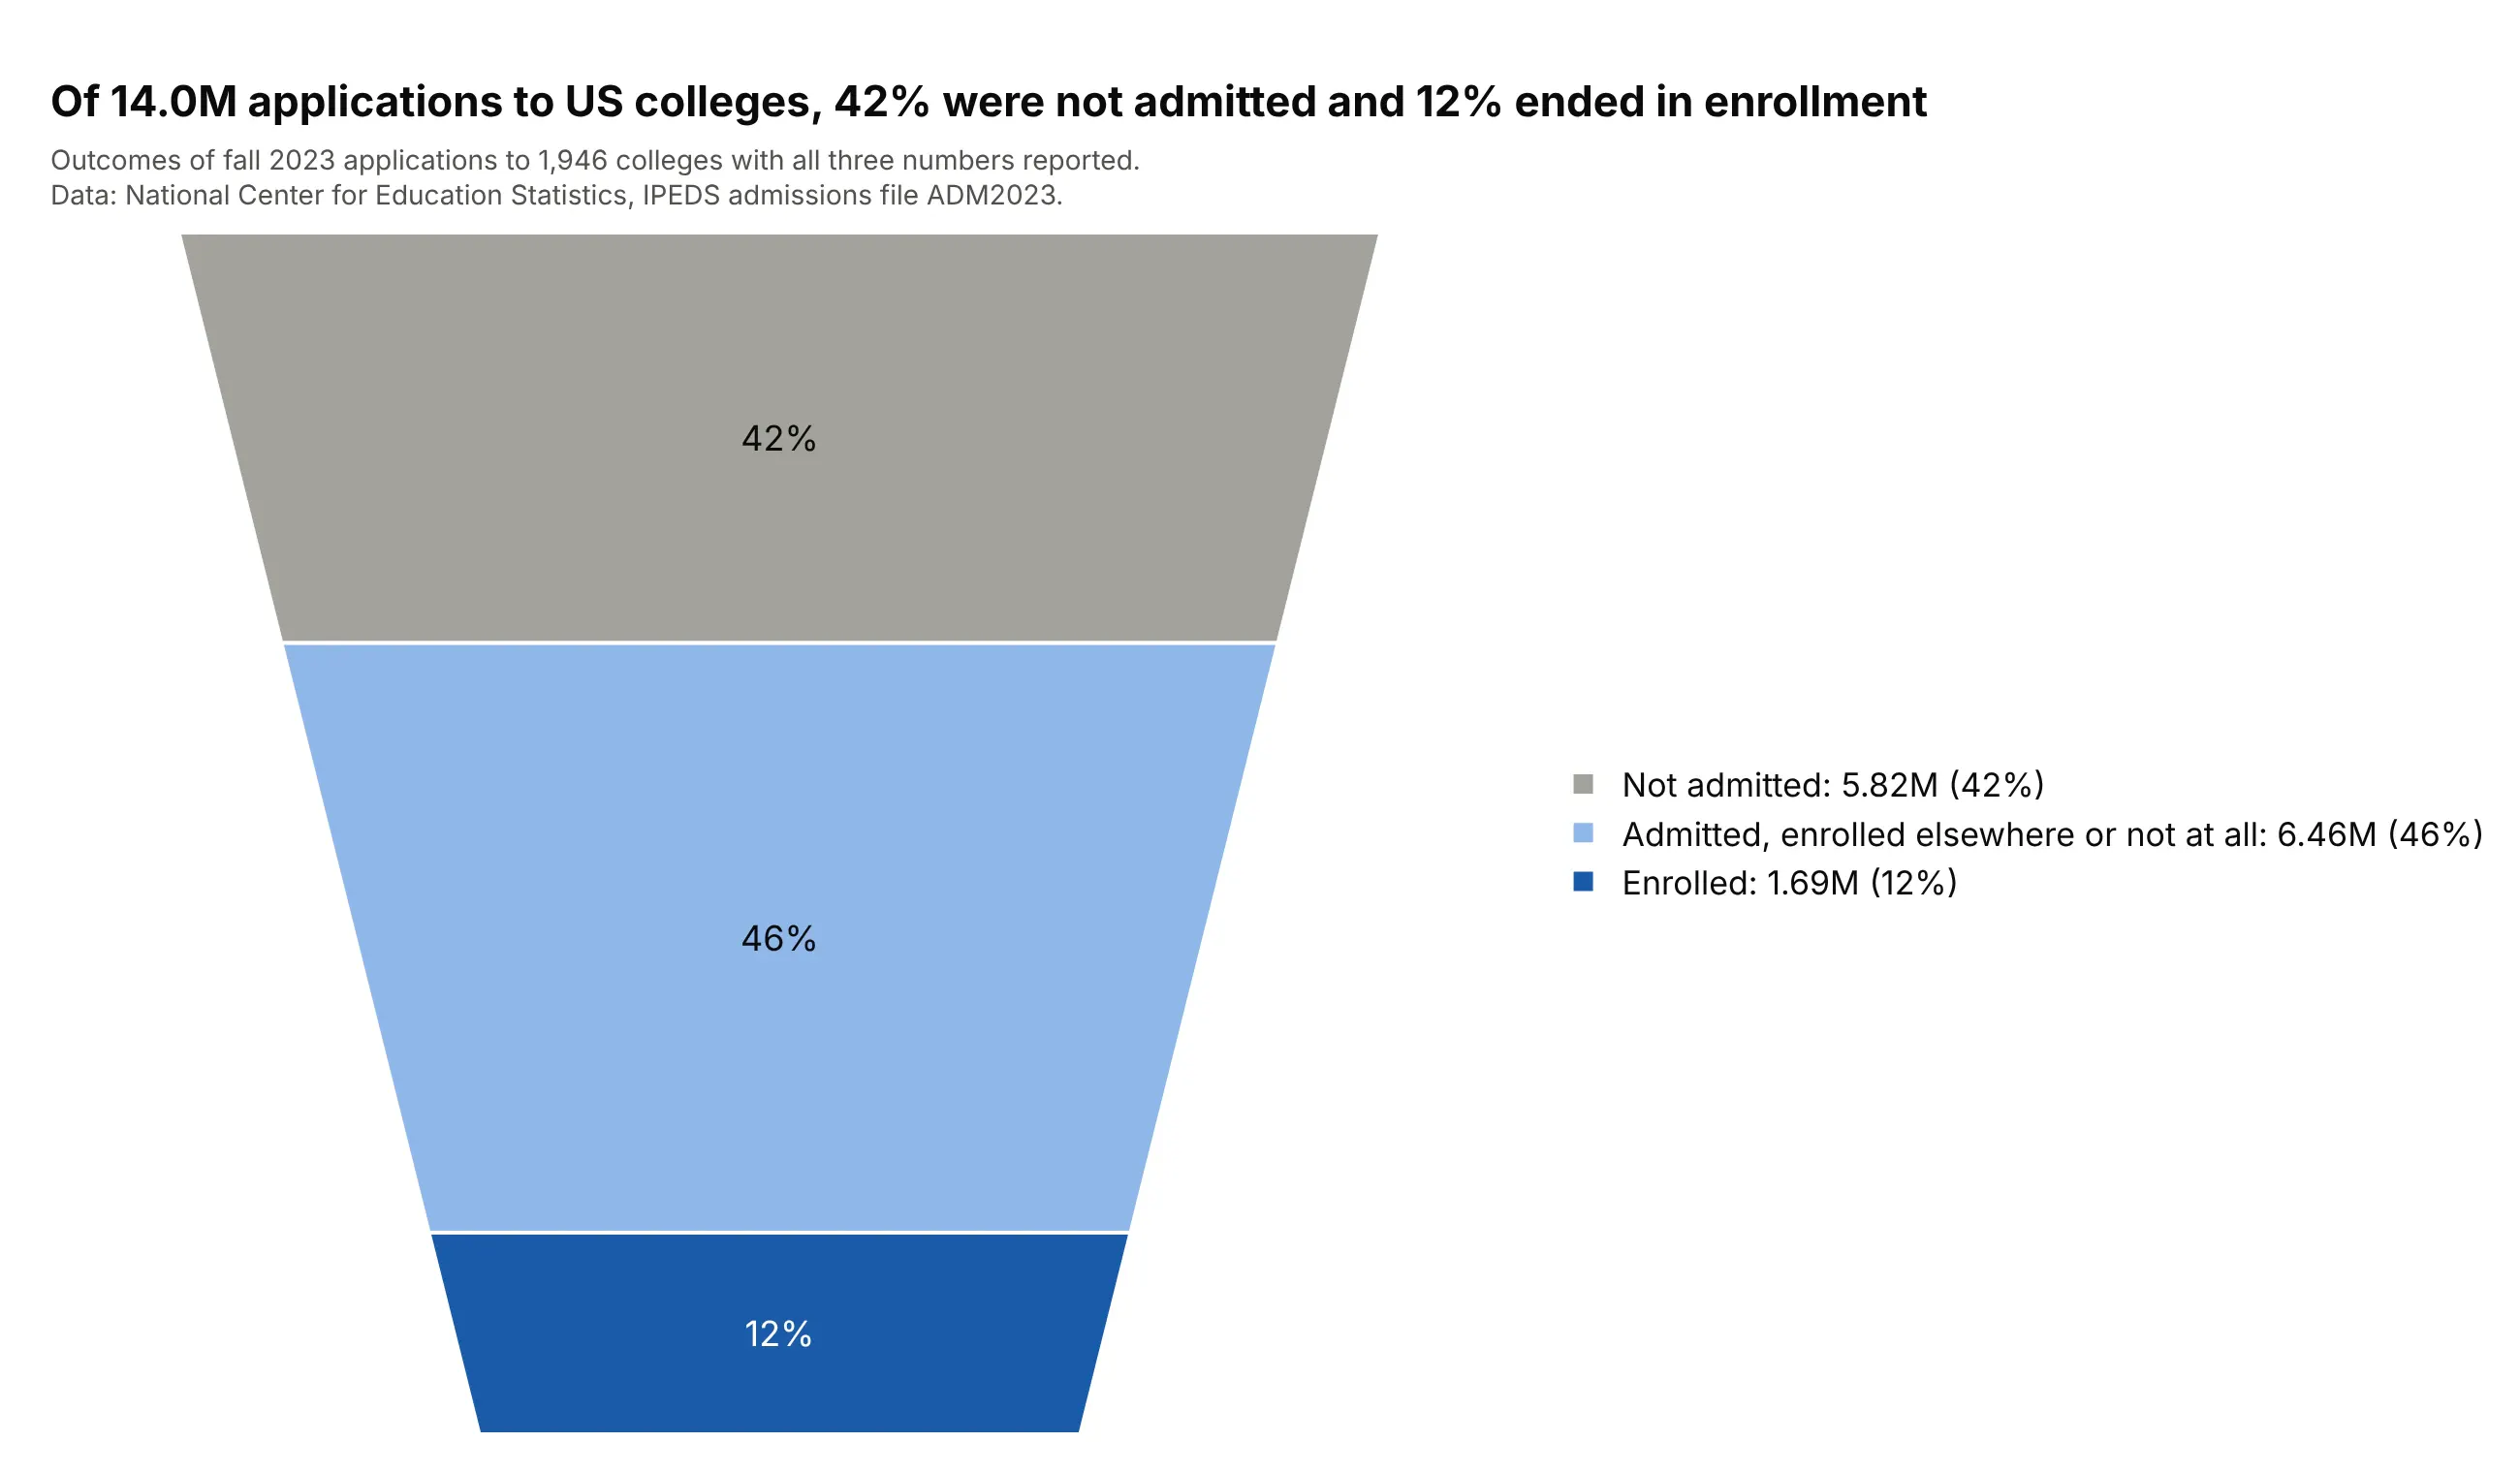
Across 1,946 US colleges in fall 2023, 42% of 14.0 million applications were not admitted, 46% were admitted to a student who enrolled elsewhere or not at all, and 12% ended in enrollment. Applications count each college a student applies to, so this is applications, not students. Data: National Center for Education Statistics, Integrated Postsecondary Education Data System (IPEDS) admissions file ADM2023.
Tip: name what the middle slice is. "Admitted, enrolled elsewhere or not at all" is longer than "Admitted", and it is the part readers would otherwise miss.
Get the data from the National Center for Education Statistics IPEDS complete data file ADM2023 (fall 2023admissions; columns: UNITID, APPLCN, ADMSSN, ENRLT).Make a plotly funnel area chart of all applications split into not admitted (APPLCN - ADMSSN), admitted butnot enrolled (ADMSSN - ENRLT) and enrolled (ENRLT), summed over institutions that report all three, withthe enrolled slice in dark blue and the totals in the subtitle.
4. Kepler: 34,032 signals, 2,675 confirmed planets
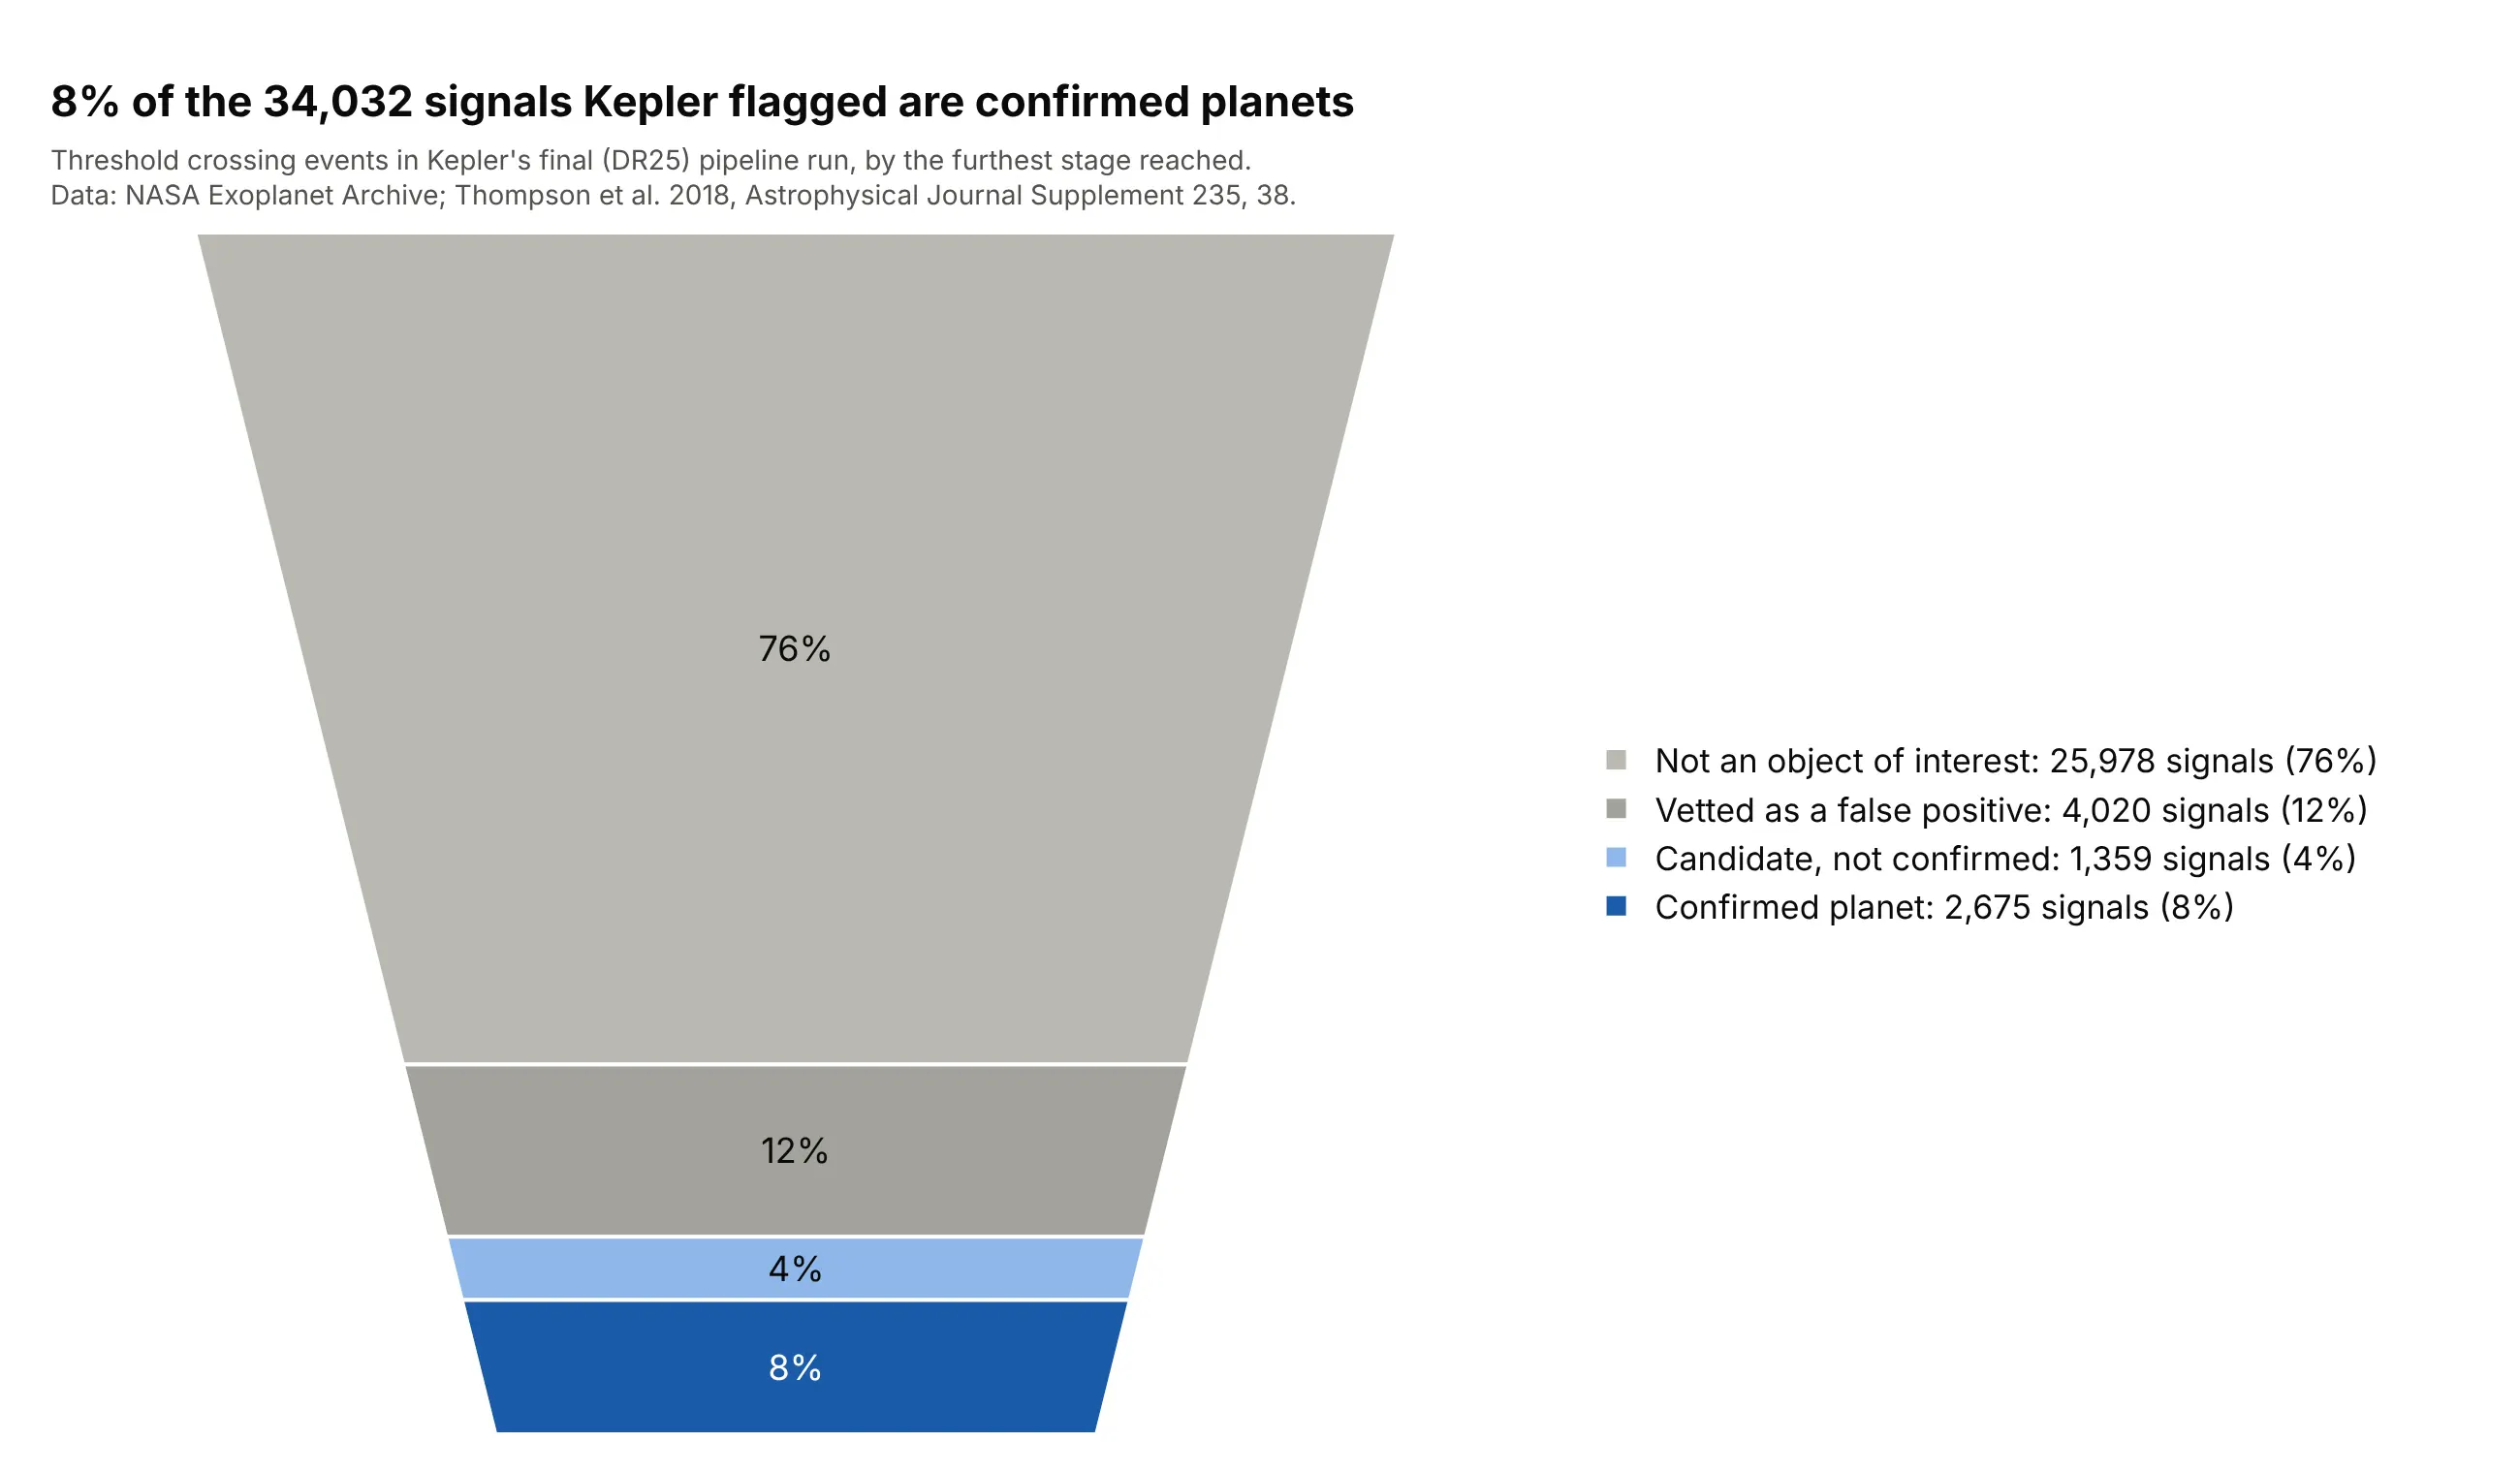
Kepler's final planet search flagged 34,032 signals, and 8% of them (2,675) are confirmed planets today, while 76% never became an object of interest. Counting each signal at the furthest stage it reached gives classes that don't overlap, and the 56 signals that the final vetting called false positives but that are confirmed planets today stay in the false-positive slice. Data: NASA Exoplanet Archive, DR25 threshold crossing events and Kepler objects of interest (Thompson et al. 2018, doi:10.3847/1538-4365/aab4f9).
Tip: when a stage was revised later, as here, say which classification the slices use so the numbers can be traced.
Get the data from the NASA Exoplanet Archive TAP service, tables q1_q17_dr25_tce (threshold crossingevents) and q1_q17_dr25_koi (columns: kepoi_name, koi_pdisposition, koi_disposition).Make a plotly funnel area chart of the TCEs by furthest stage reached: not a KOI, KOI vetted as a falsepositive, candidate not confirmed, confirmed planet (candidates whose current disposition is CONFIRMED).Confirmed in dark blue, the rest in grays and a light blue, with counts in the legend.
5. Proved oil reserves: 63% producing
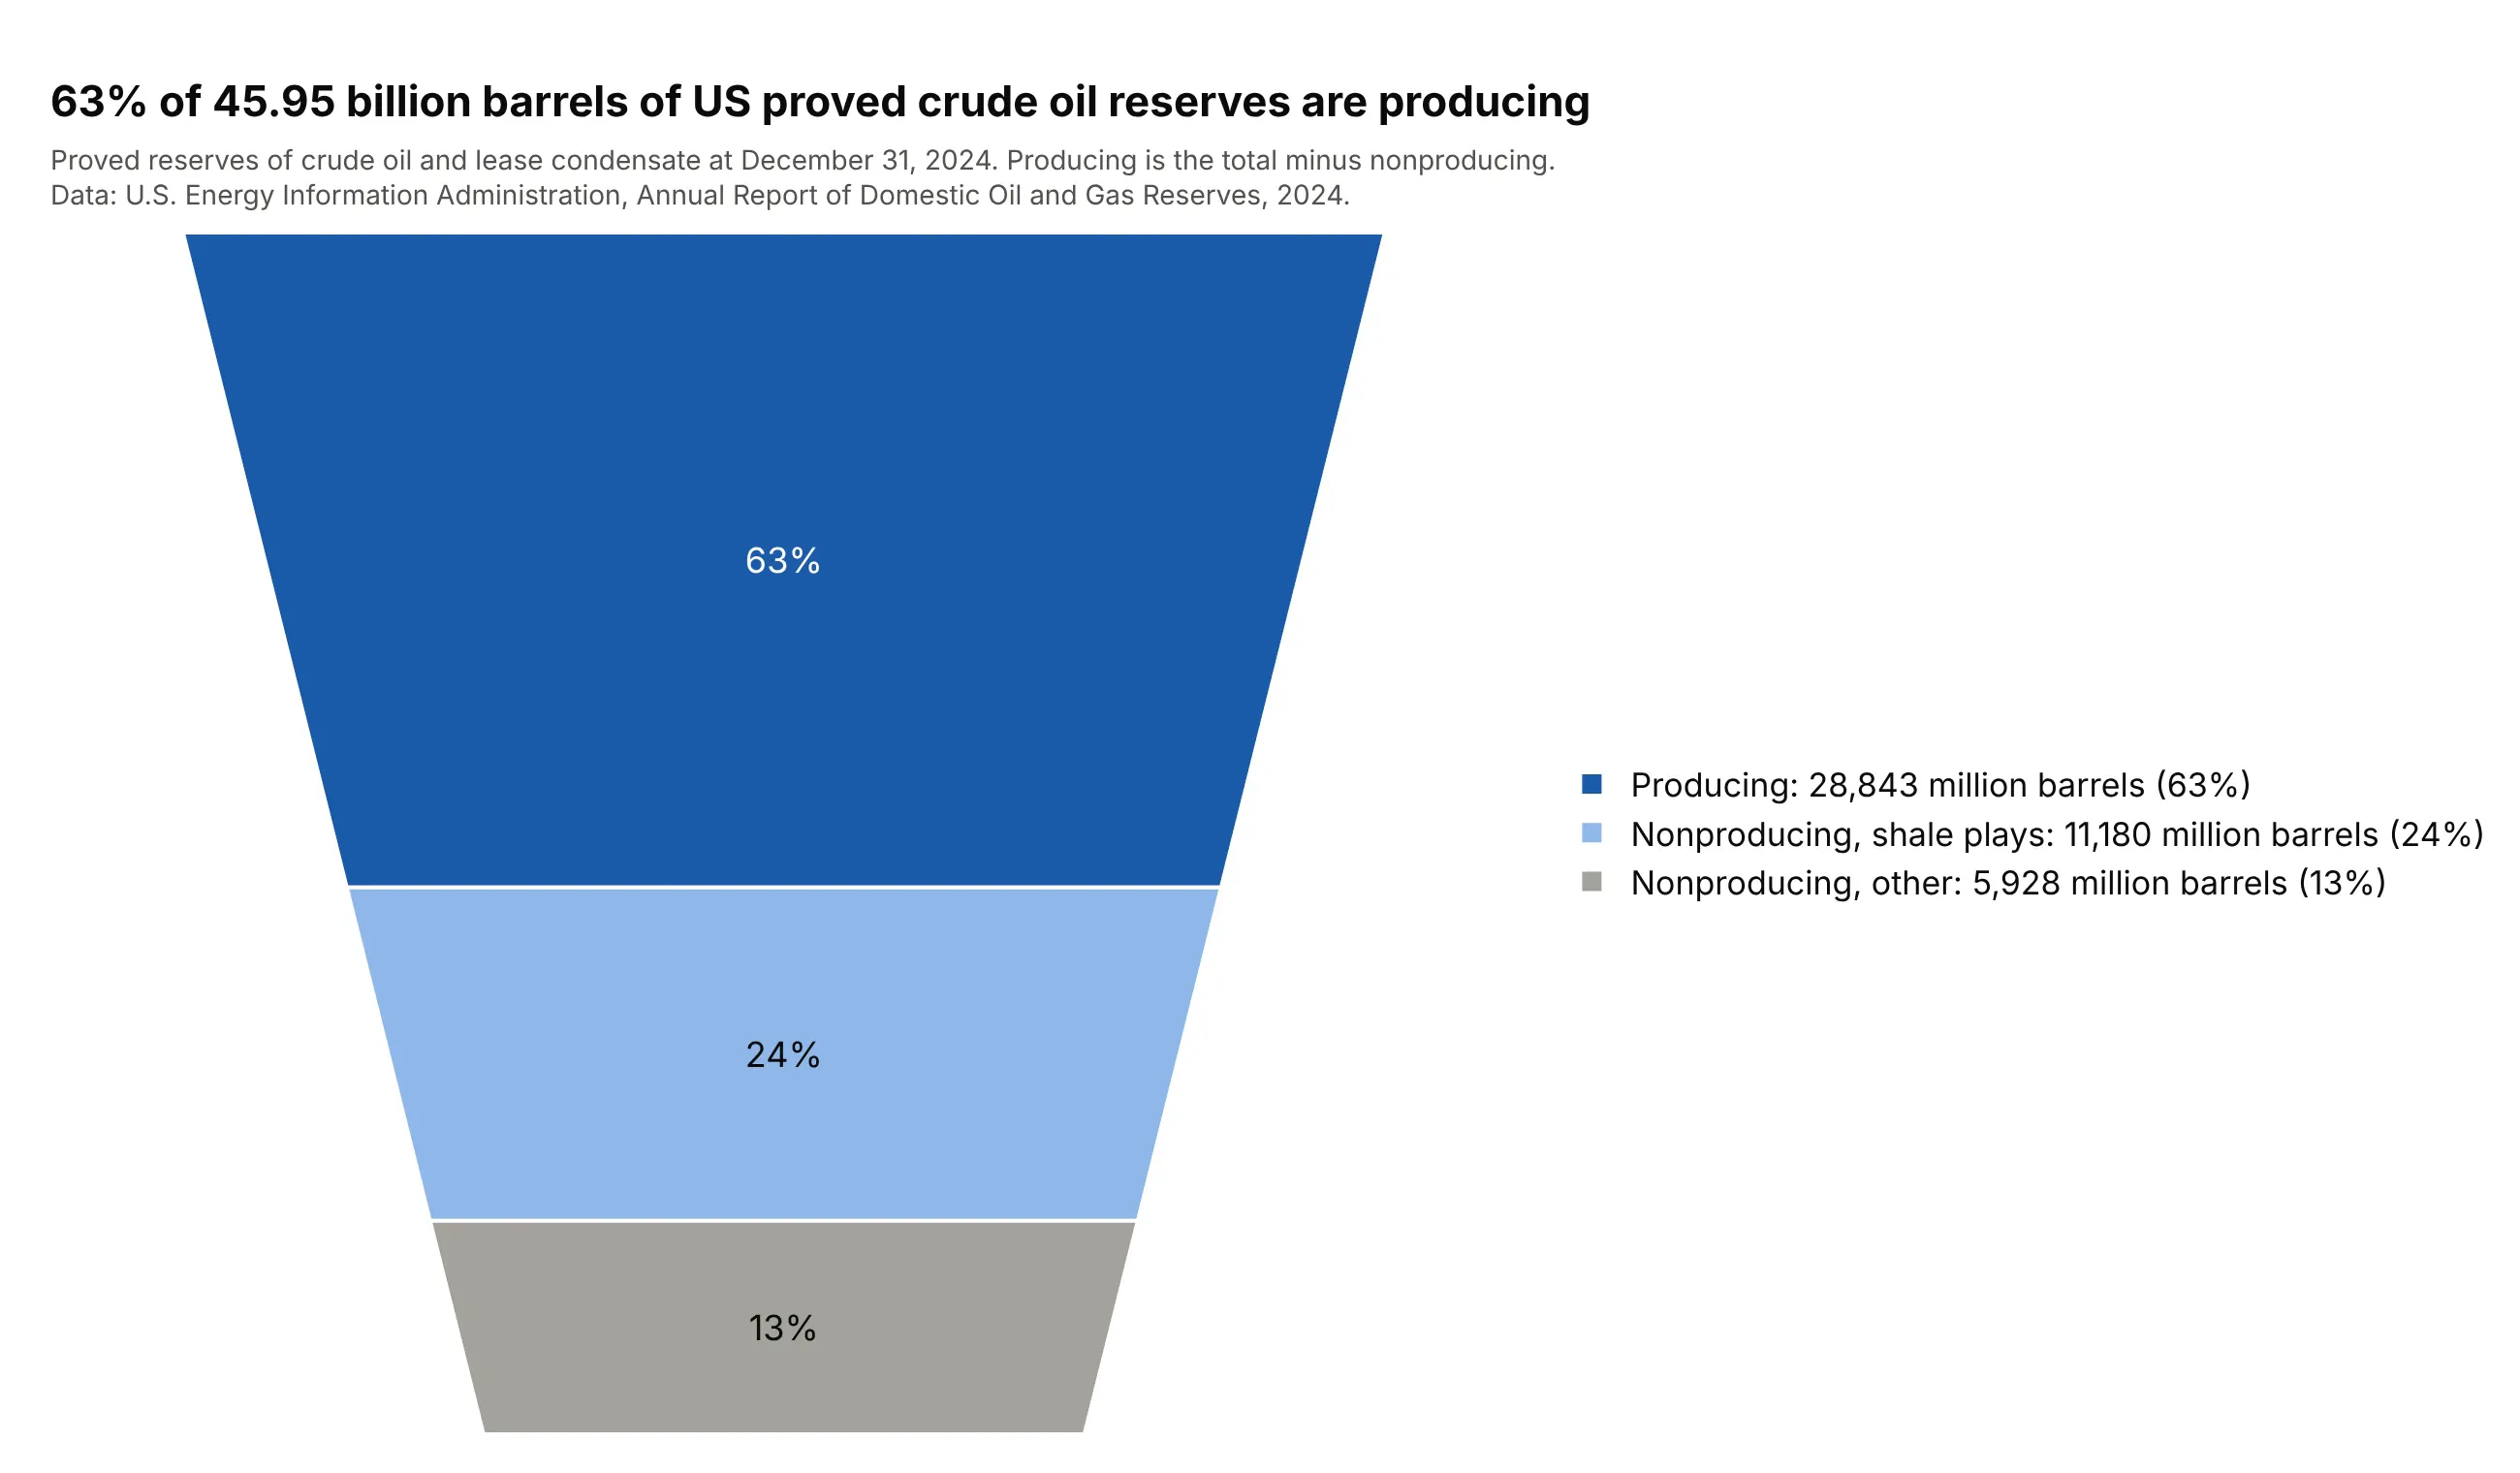
Of the 45.95 billion barrels of US proved crude oil and lease condensate reserves at the end of 2024, 17.1 billion (37%) are nonproducing, and 11.2 billion of those are in shale plays. EIA reports the nonproducing volume separately, and the producing slice here is the total minus that figure. Data: EIA, U.S. Crude Oil and Natural Gas Proved Reserves, Year-end 2024, Tables 5 and 12.
Tip: derive a slice from a total only when the source gives both numbers, and say so in the subtitle, as here.
Get the data from the US Energy Information Administration, U.S. Crude Oil and Natural Gas Proved Reserves,Year-end 2024 (ARR_2024_TABLES_ALL.xlsx): total crude oil and lease condensate proved reserves 2024 (Table5, million barrels), and proved nonproducing reserves with the subtotal in shale plays (Table 12).Make a plotly funnel area chart of producing (total minus nonproducing), nonproducing in shale plays andnonproducing elsewhere, with producing in dark blue, and a subtitle that says producing is derived.
6. NFL draft: how far 4,079 picks got
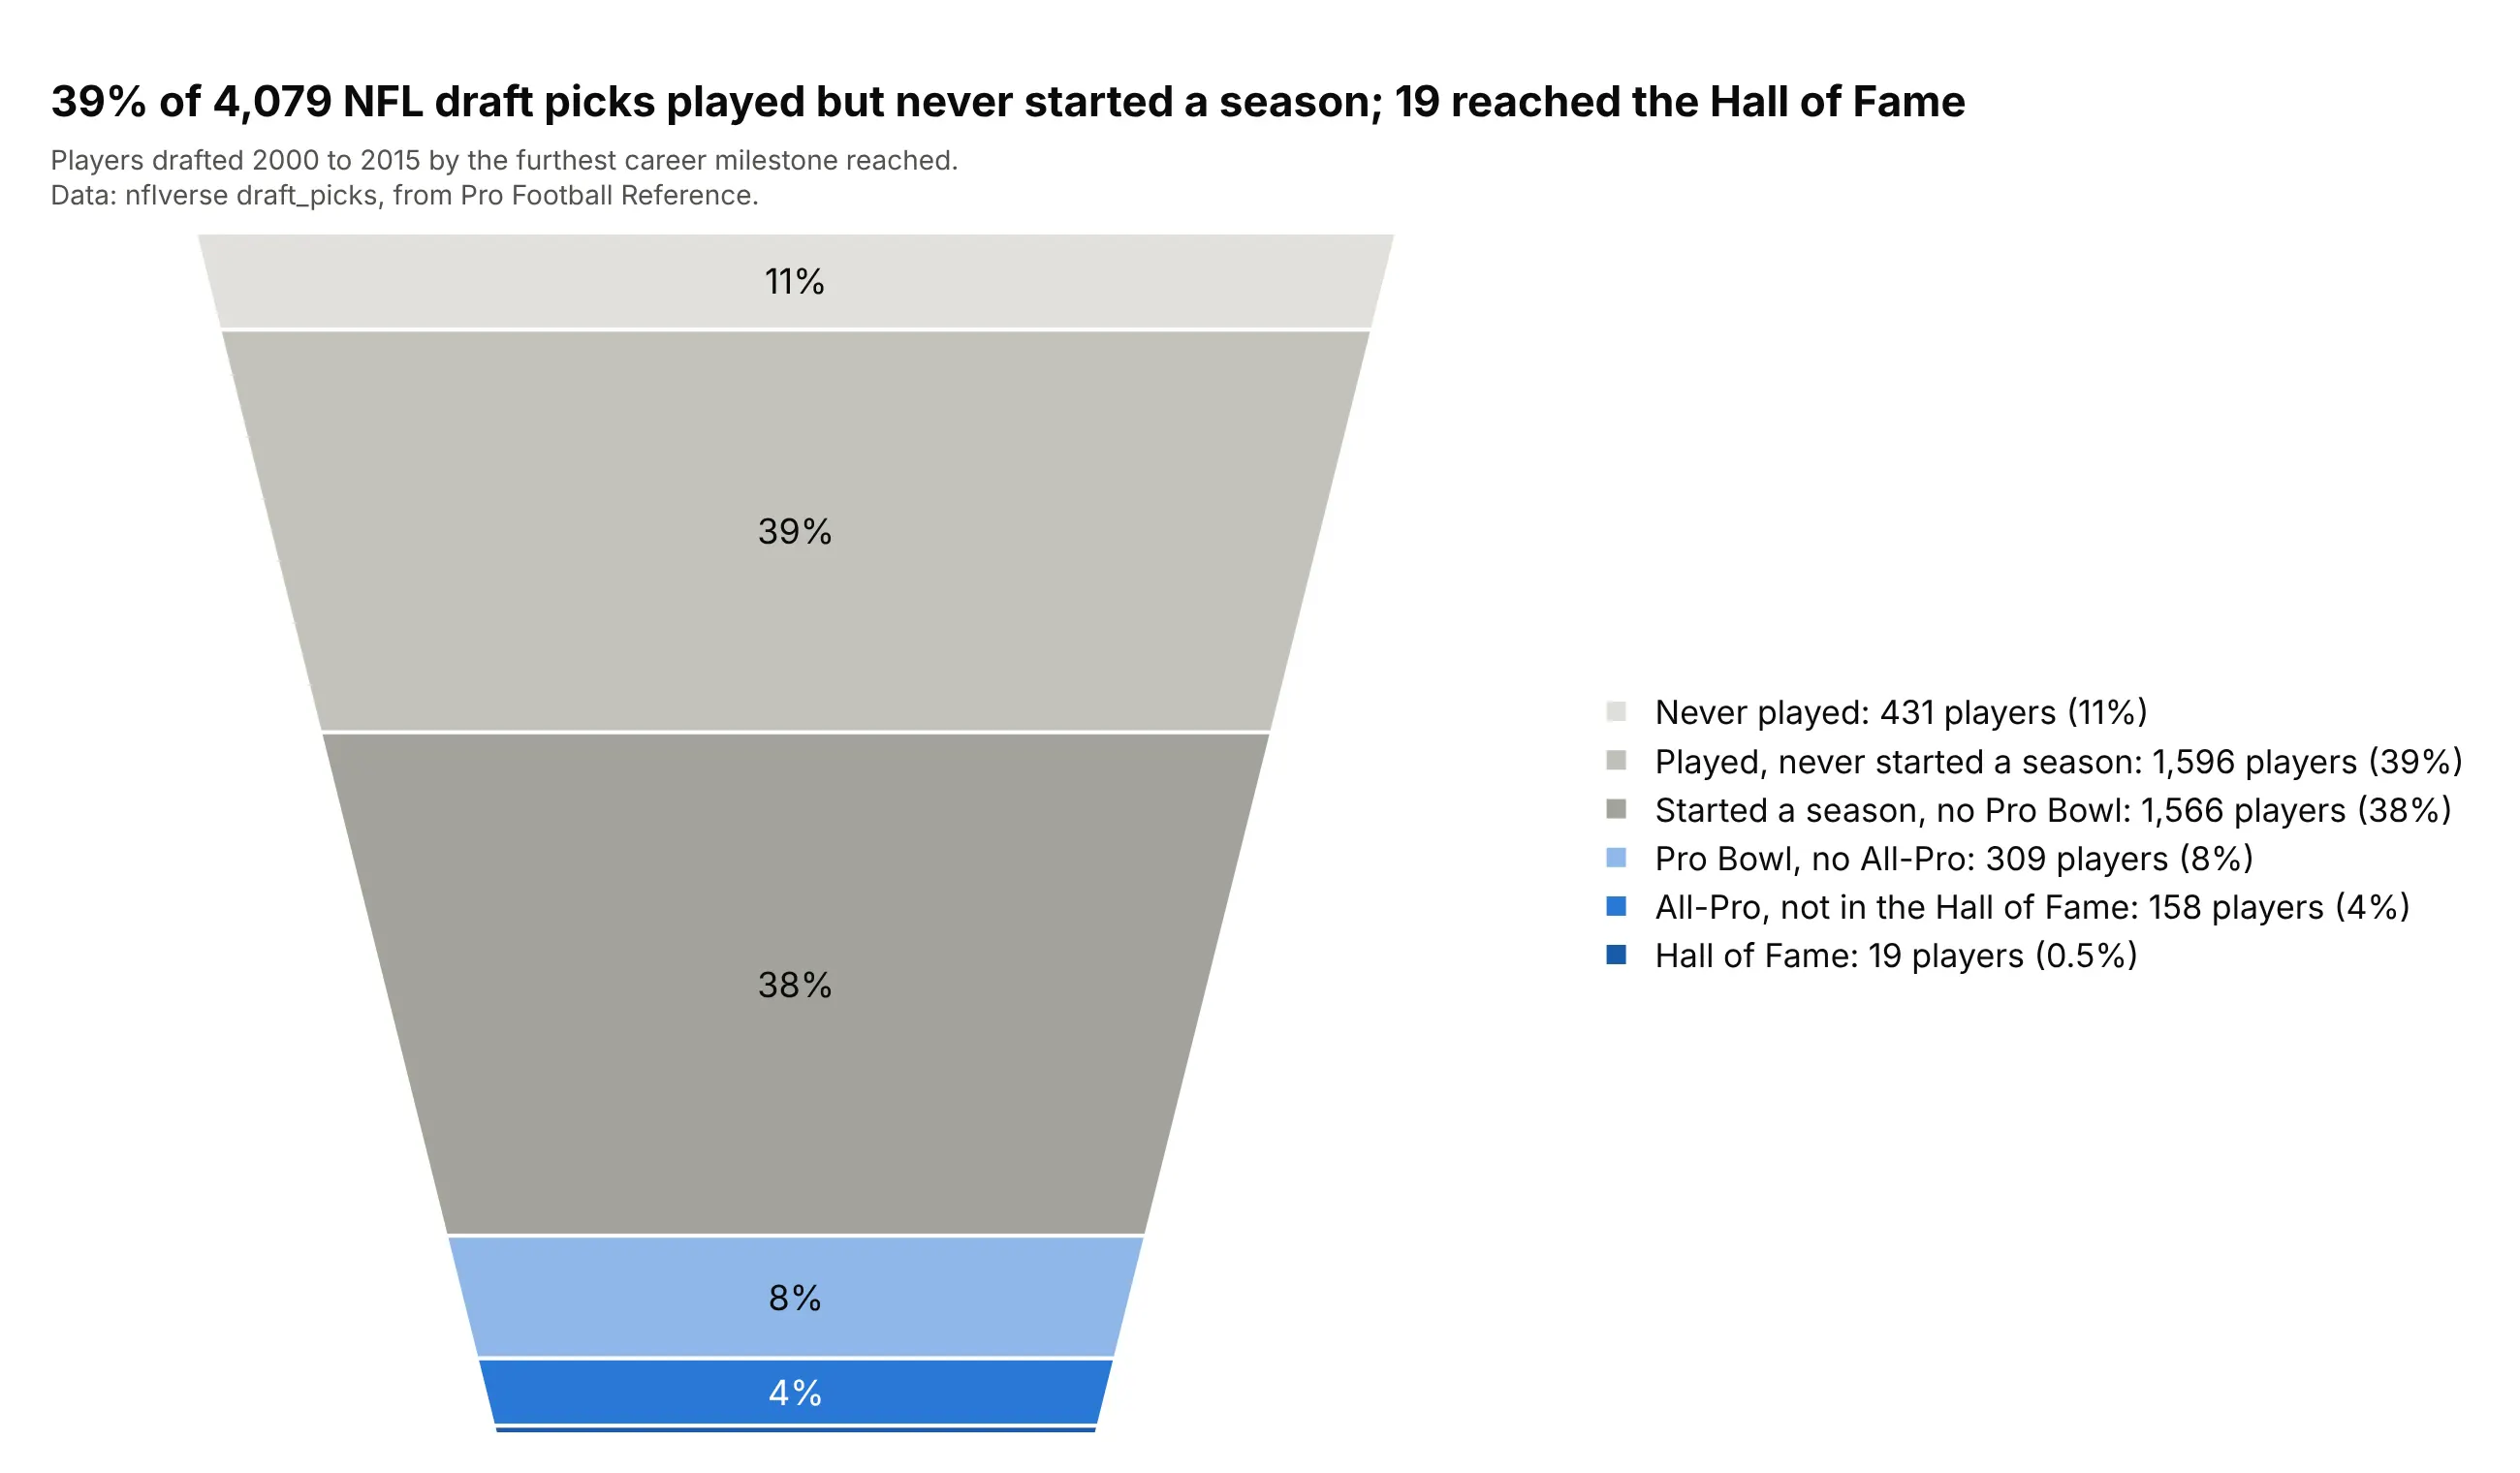
Of 4,079 players drafted from 2000 to 2015, 39% played but never started a season, and 19 (0.5%) are in the Hall of Fame. The top slice is a thin 11% (431 players) and looks much smaller than the 39% slice below it, which is the narrowing at work. Data: nflverse draft_picks, from Pro Football Reference.
Tip: with six or more slices, the bottom ones are too thin to label, so look at the same counts in a bar chart before you commit to the funnel.
Get the data from nflverse draft_picks (draft_picks.csv; columns: season, round, pick, player, games,seasons_started, probowls, allpro, hof), seasons 2000 to 2015.Make a plotly funnel area chart of players by furthest career milestone: never played (games = 0), playedbut never started a season, started but no Pro Bowl, Pro Bowl but no All-Pro, All-Pro but not Hall ofFame, Hall of Fame. Gray for the early slices, blue for the late ones, values in the legend.
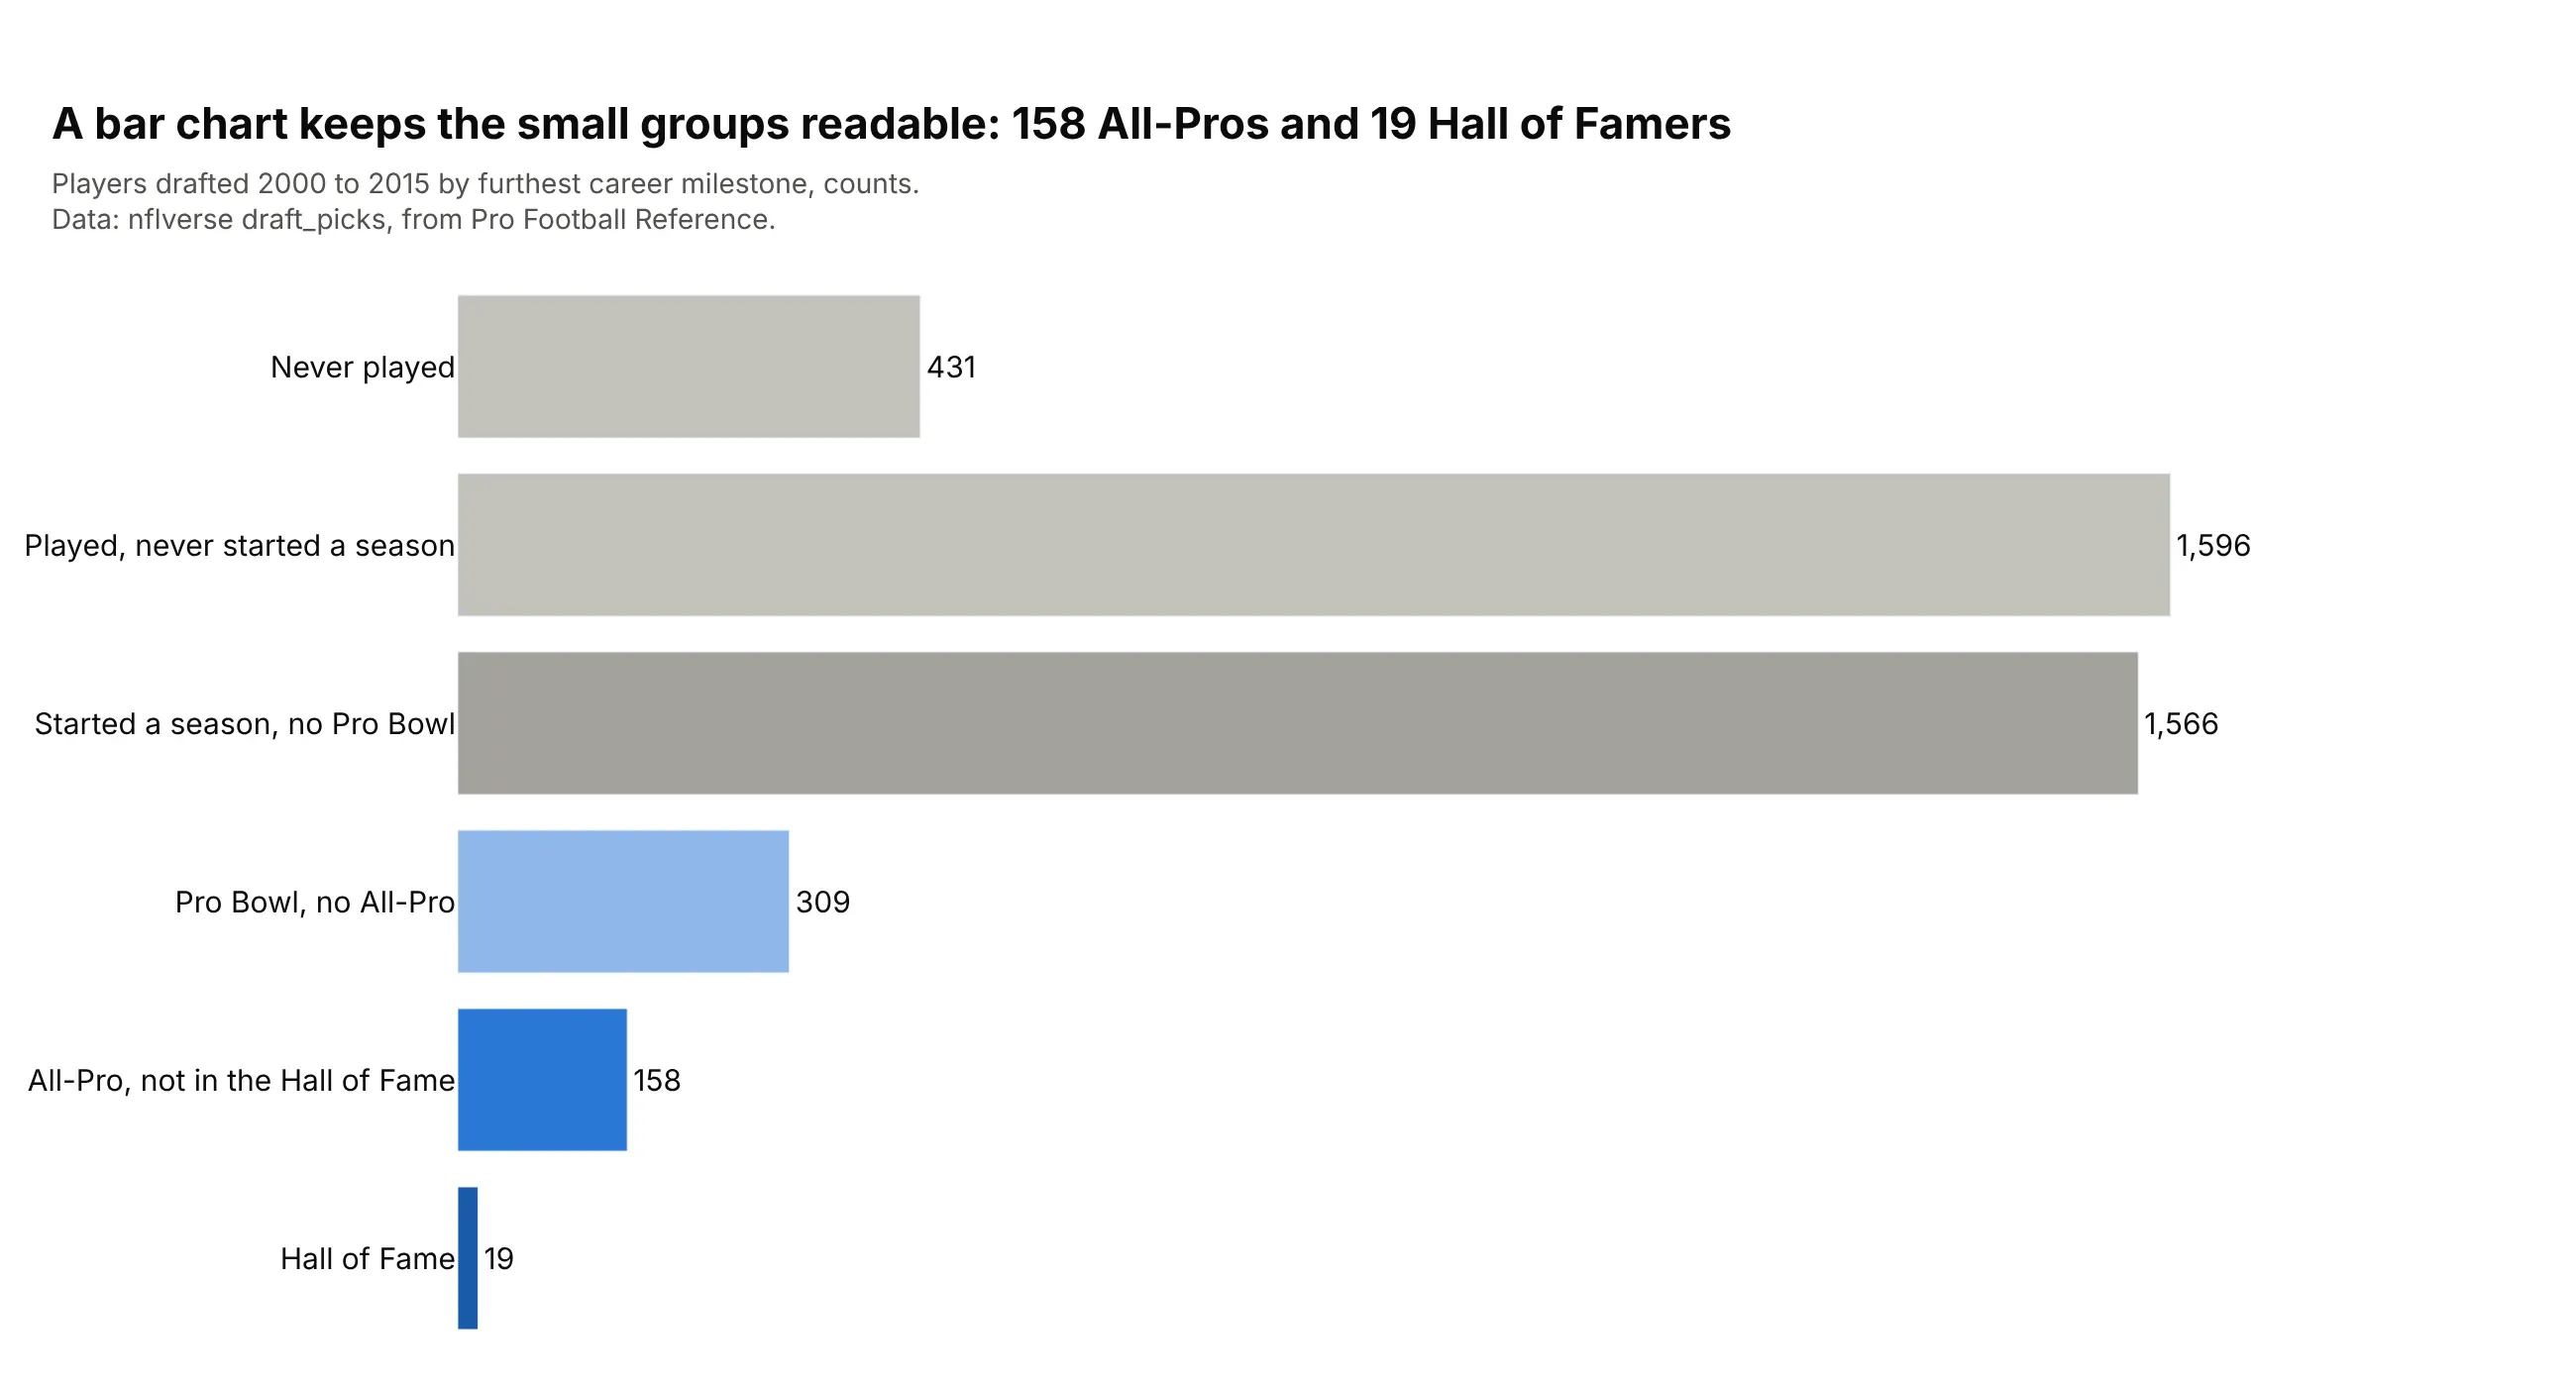
Another way to see it: a bar chart keeps the small groups readable, with 158 All-Pros and 19 Hall of Famers each getting a bar and a number.
7. Stack Overflow: the plotly tag
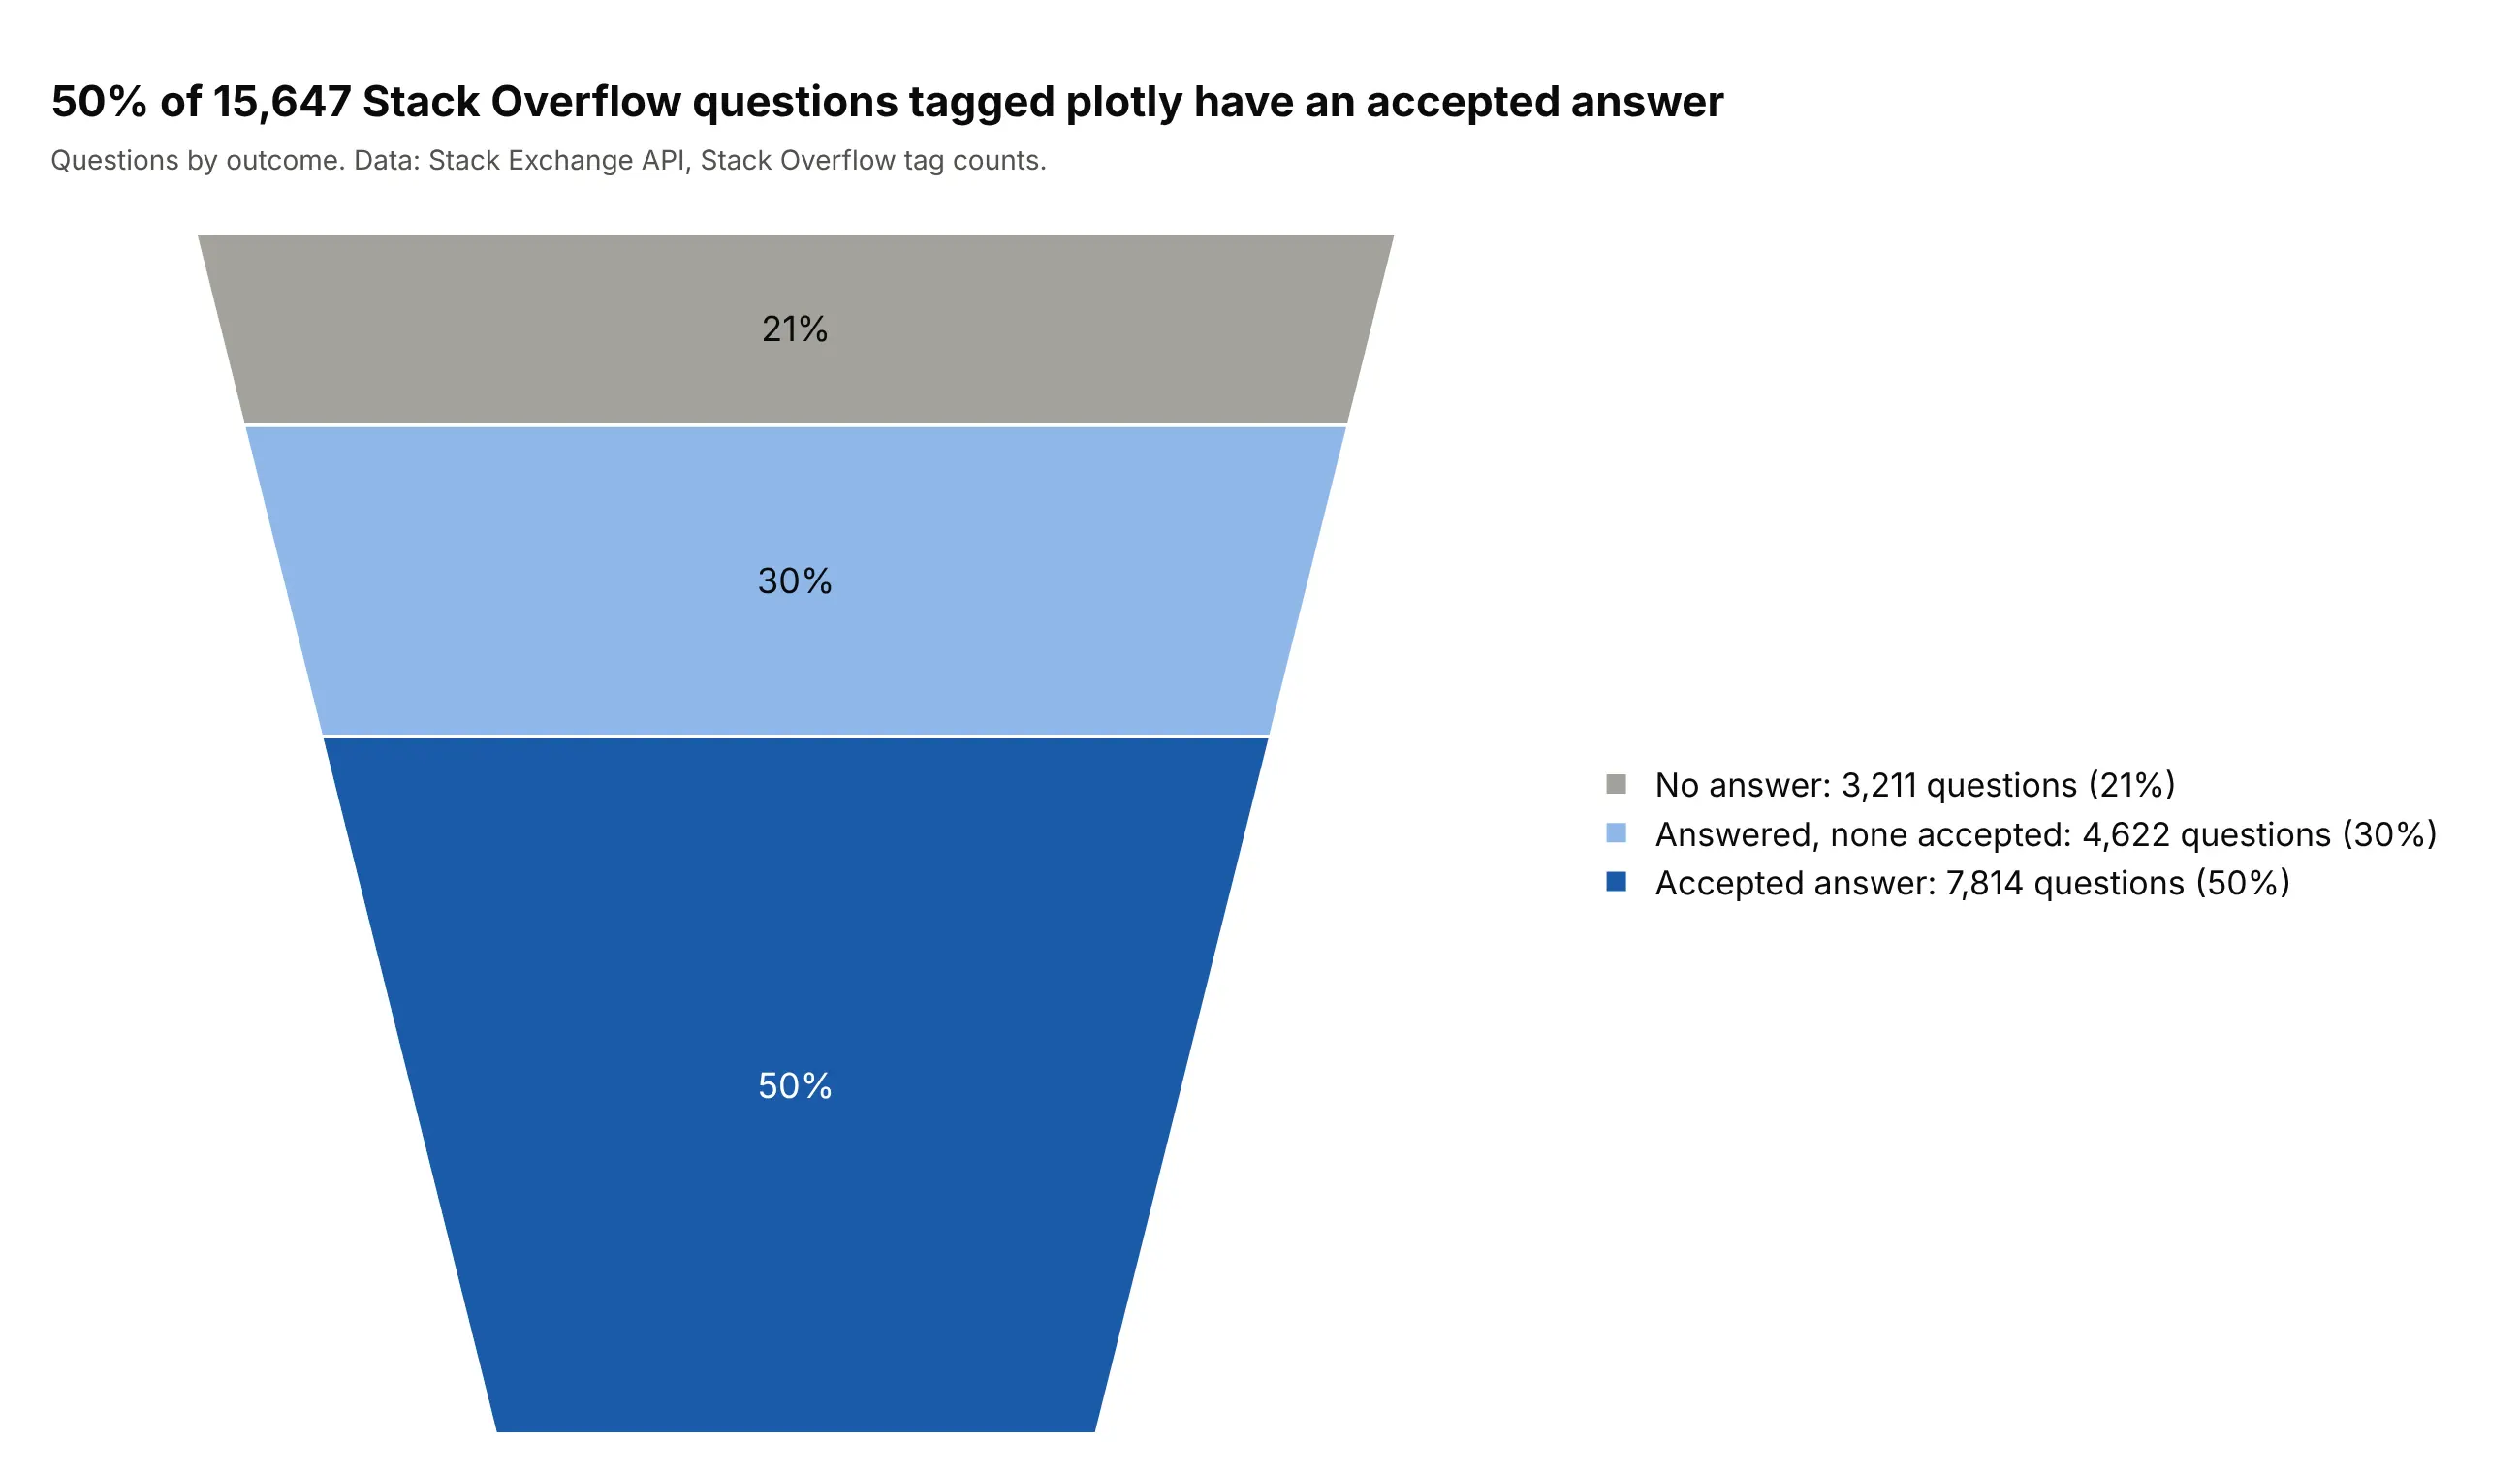
Of 15,647 questions on Stack Overflow with the plotly tag, 50% have an accepted answer, 30% have answers but none accepted and 21% have no answer. The three outcomes don't overlap, which makes this a straightforward use of the chart. Data: Stack Exchange API, /search/advanced on Stack Overflow, tag counts.
Tip: with three slices, a pie chart or a single stacked bar does the same job, so pick the funnel area chart only if the order of the outcomes matters to the story.
Get the data from the Stack Exchange API, /search/advanced on stackoverflow with filter=total and the tagplotly: total questions, questions with answers=1 and questions with accepted=True (columns: tag,questions, answered, accepted).Make a plotly funnel area chart of no answer, answered but none accepted, and accepted answer, which don'toverlap, with the accepted answer in dark blue and the counts and percentages in the legend.
FAQ
Options to customize
A funnel area chart in Plotly is a funnelarea trace, so these are the options that matter most. The full list is in the funnel area trace reference and the funnel chart documentation.
- values, labels (px.funnel_area: values, names): the numbers and the slice names, drawn in the order given, without sorting.
- baseratio: the width of the bottom as a share of the top, from 0 (a triangle) to 1 (a rectangle), 0.333 by default.
- aspectratio: the funnel's height divided by its width, 1 by default.
- marker.colors: one color per slice; marker.line.color and marker.line.width draw the outlines.
- layout.funnelareacolorway: the default colors for every funnel area trace in the figure.
- textinfo: which of label, text, value and percent print on a slice, joined with +; none removes them.
- texttemplate: a custom label such as %{label}<br>%{percent:.0%}; %{value} and %{percent} take d3 number formats.
- textfont: size, family and color of the slice text; a list gives each slice its own color, for white text on dark slices.
- layout.uniformtext: with mode="hide" and a minsize, it hides labels that don't fit instead of overflowing.
- hovertemplate: the hover text, for example %{label}: %{value:,} (%{percent}).
- scalegroup, domain: several funnel areas side by side, each sized by its total, in a grid you define.
- title: a title above the funnel; showlegend and legend control the legend that carries the values.
- marker.pattern.shape: hatching or dots for each slice, which keeps slices apart when the chart is printed in gray.