
Chris Parmer
October 27, 2026
Waffle Charts - A Complete Guide
TL;DR
- A waffle chart is a grid of squares, usually 10 x 10, where each square is 1% or one unit of a whole and the squares are colored by category.
- Waffle charts are also known as square pie charts and square charts, and are similar to pie charts, treemaps and icon arrays.
- Use one when the message is a count out of a whole ("44 of every 100 people"), for a handful of categories, and for medical risks, where icon arrays of 100 or 1,000 people are the format risk-communication research recommends.
- Use a sorted bar chart instead when values are close or there are more than about seven categories, and a stacked area chart for a trend.
- You can make a waffle chart with Plotly from a single go.Heatmap with a stepped colorscale, rounding the shares with the largest remainder method so the squares add up to exactly 100.
What is a waffle chart?
Waffle charts look like this:
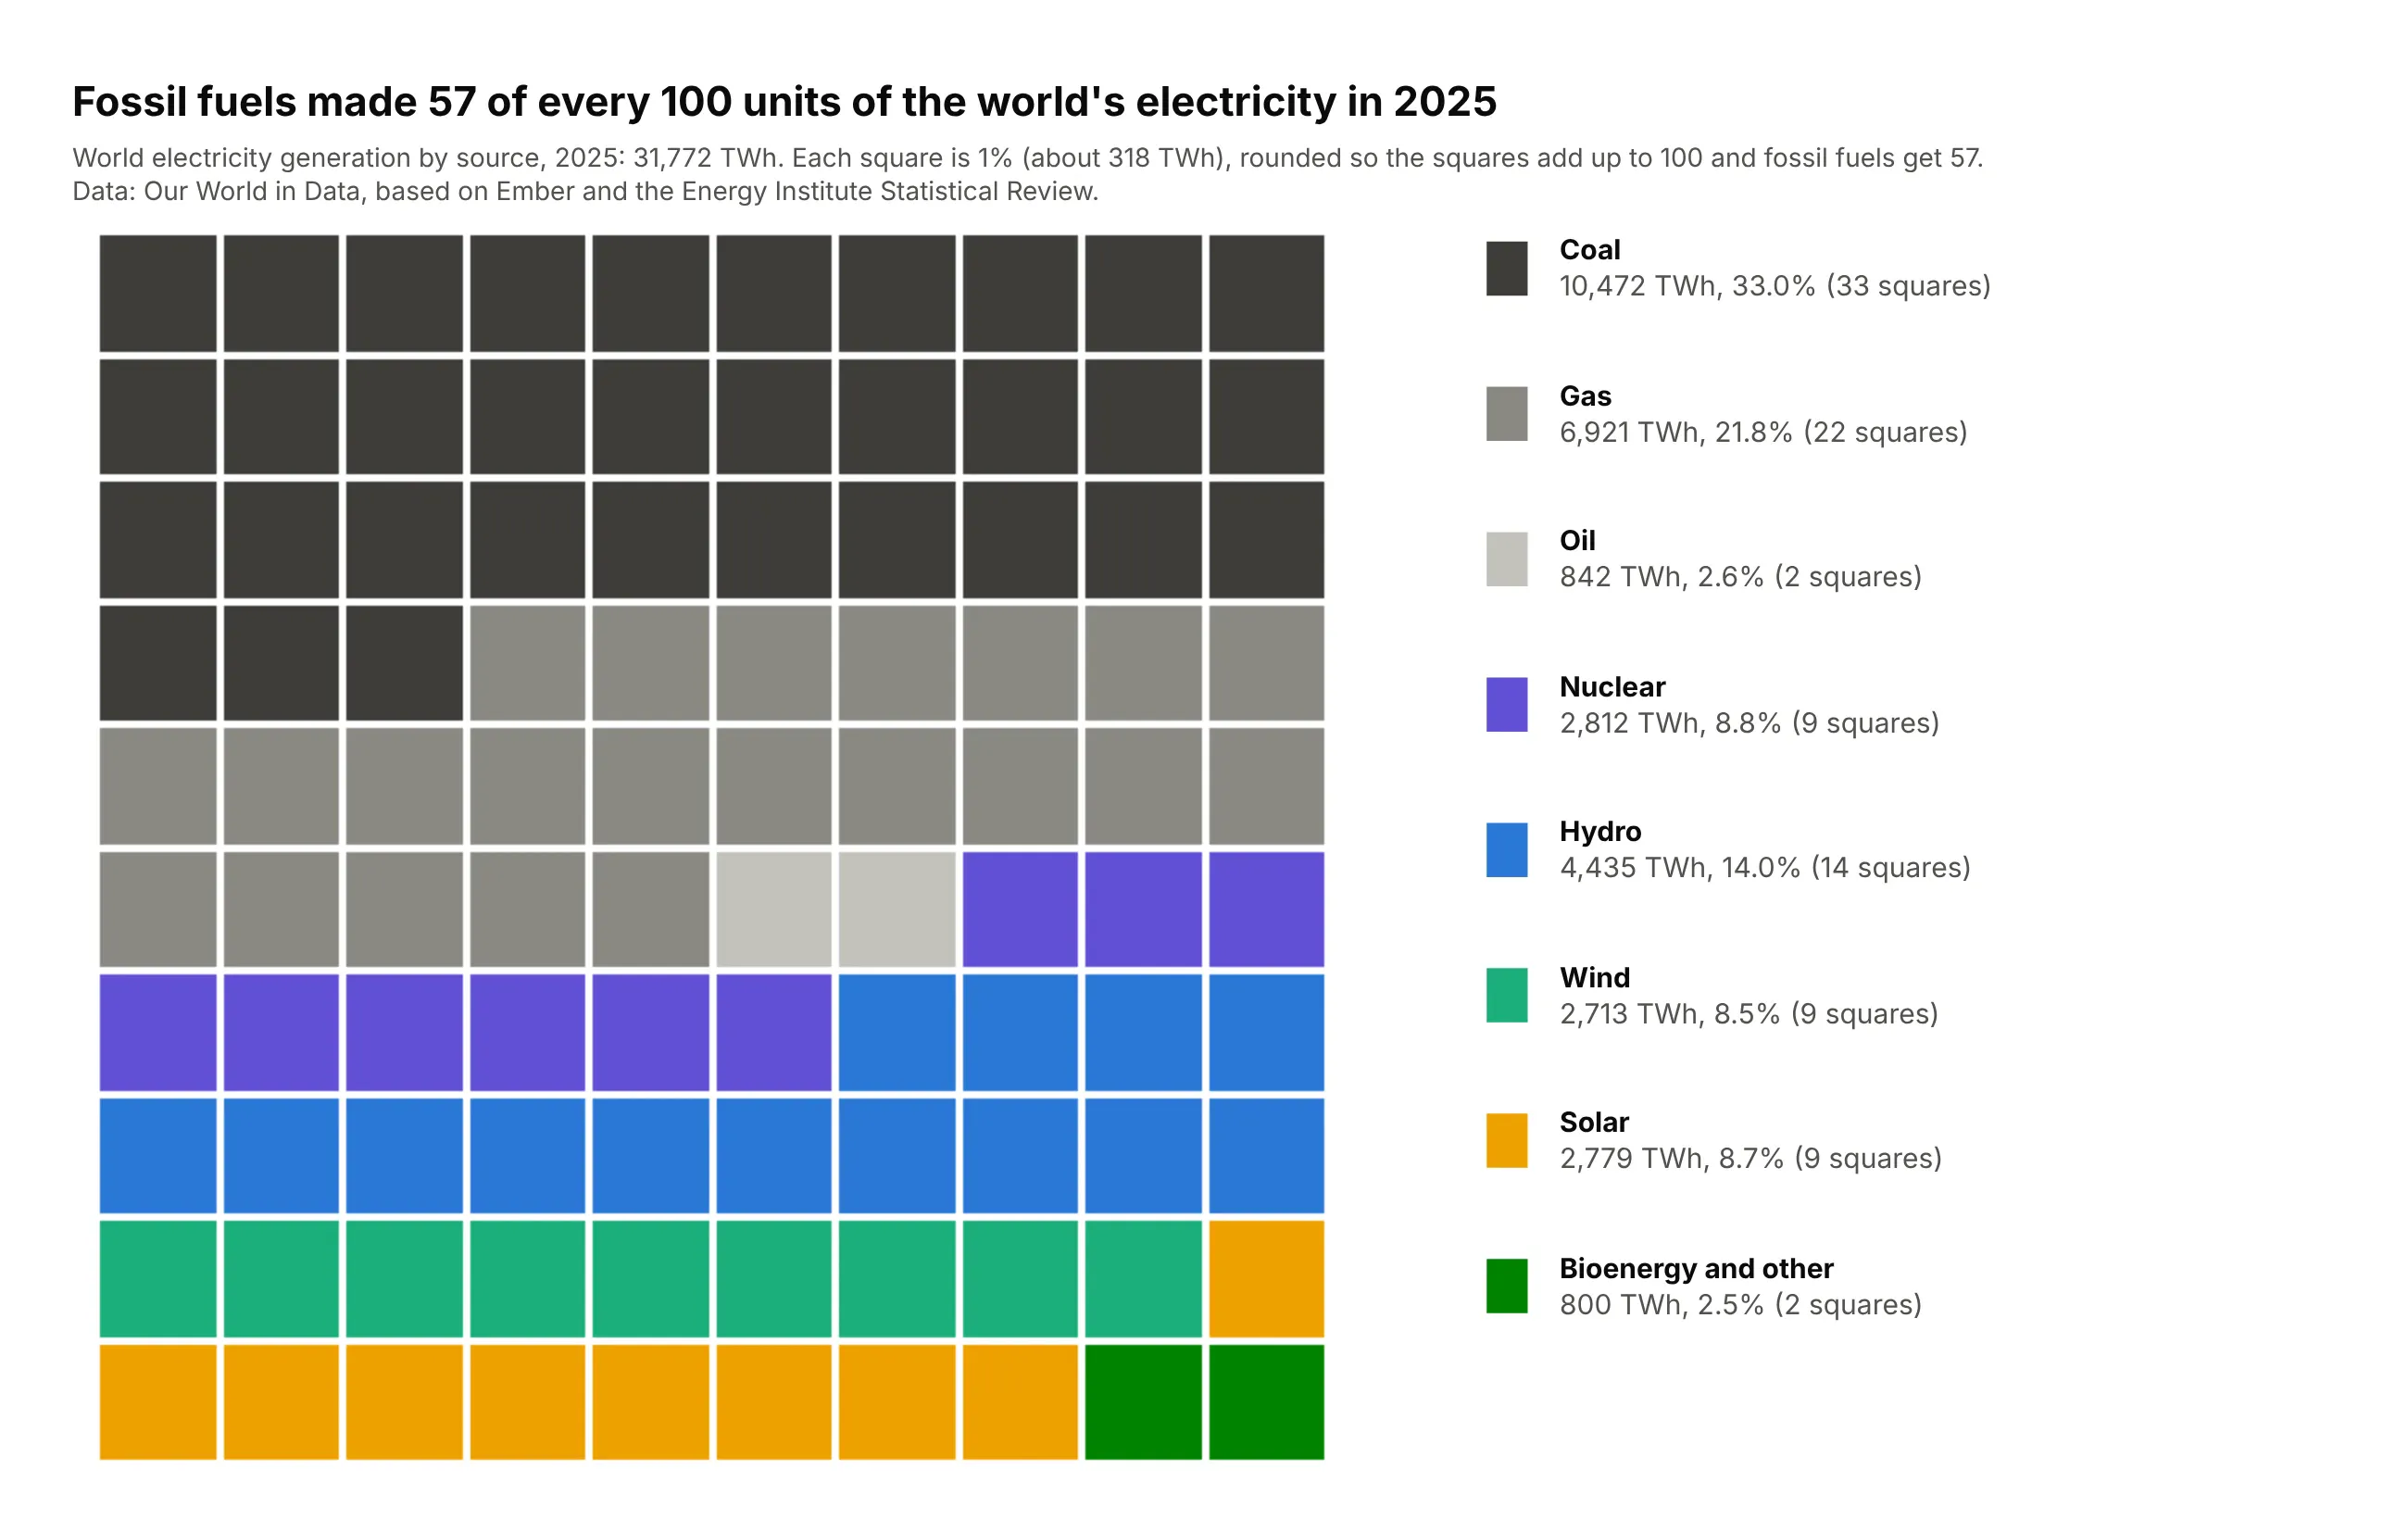
Data: Our World in Data, from Ember and the Energy Institute Statistical Review, 2025.
How do you read a waffle chart? In the example above, notice these things:
- Each square is 1% of all the electricity the world made in the year, colored by the source that made it.
- The squares fill row by row from the top left, one source after another, so you can count a source by its rows. Coal's dark squares fill just over the first three rows.
- The fossil fuels come first and are drawn in grays, which makes them read as one block across the top of the grid, 57 squares in all.
- The clean sources follow in color below the grays, so nuclear in purple, hydro in blue, wind in green and solar in amber can be compared with each other and with the fossil block.
- The squares are rounded to whole numbers, which hides small differences. Wind, solar and nuclear each get the same number of squares even though they differ by 0.3 points, so check the legend before you read two sources as equal.
It's often used for charts like these:
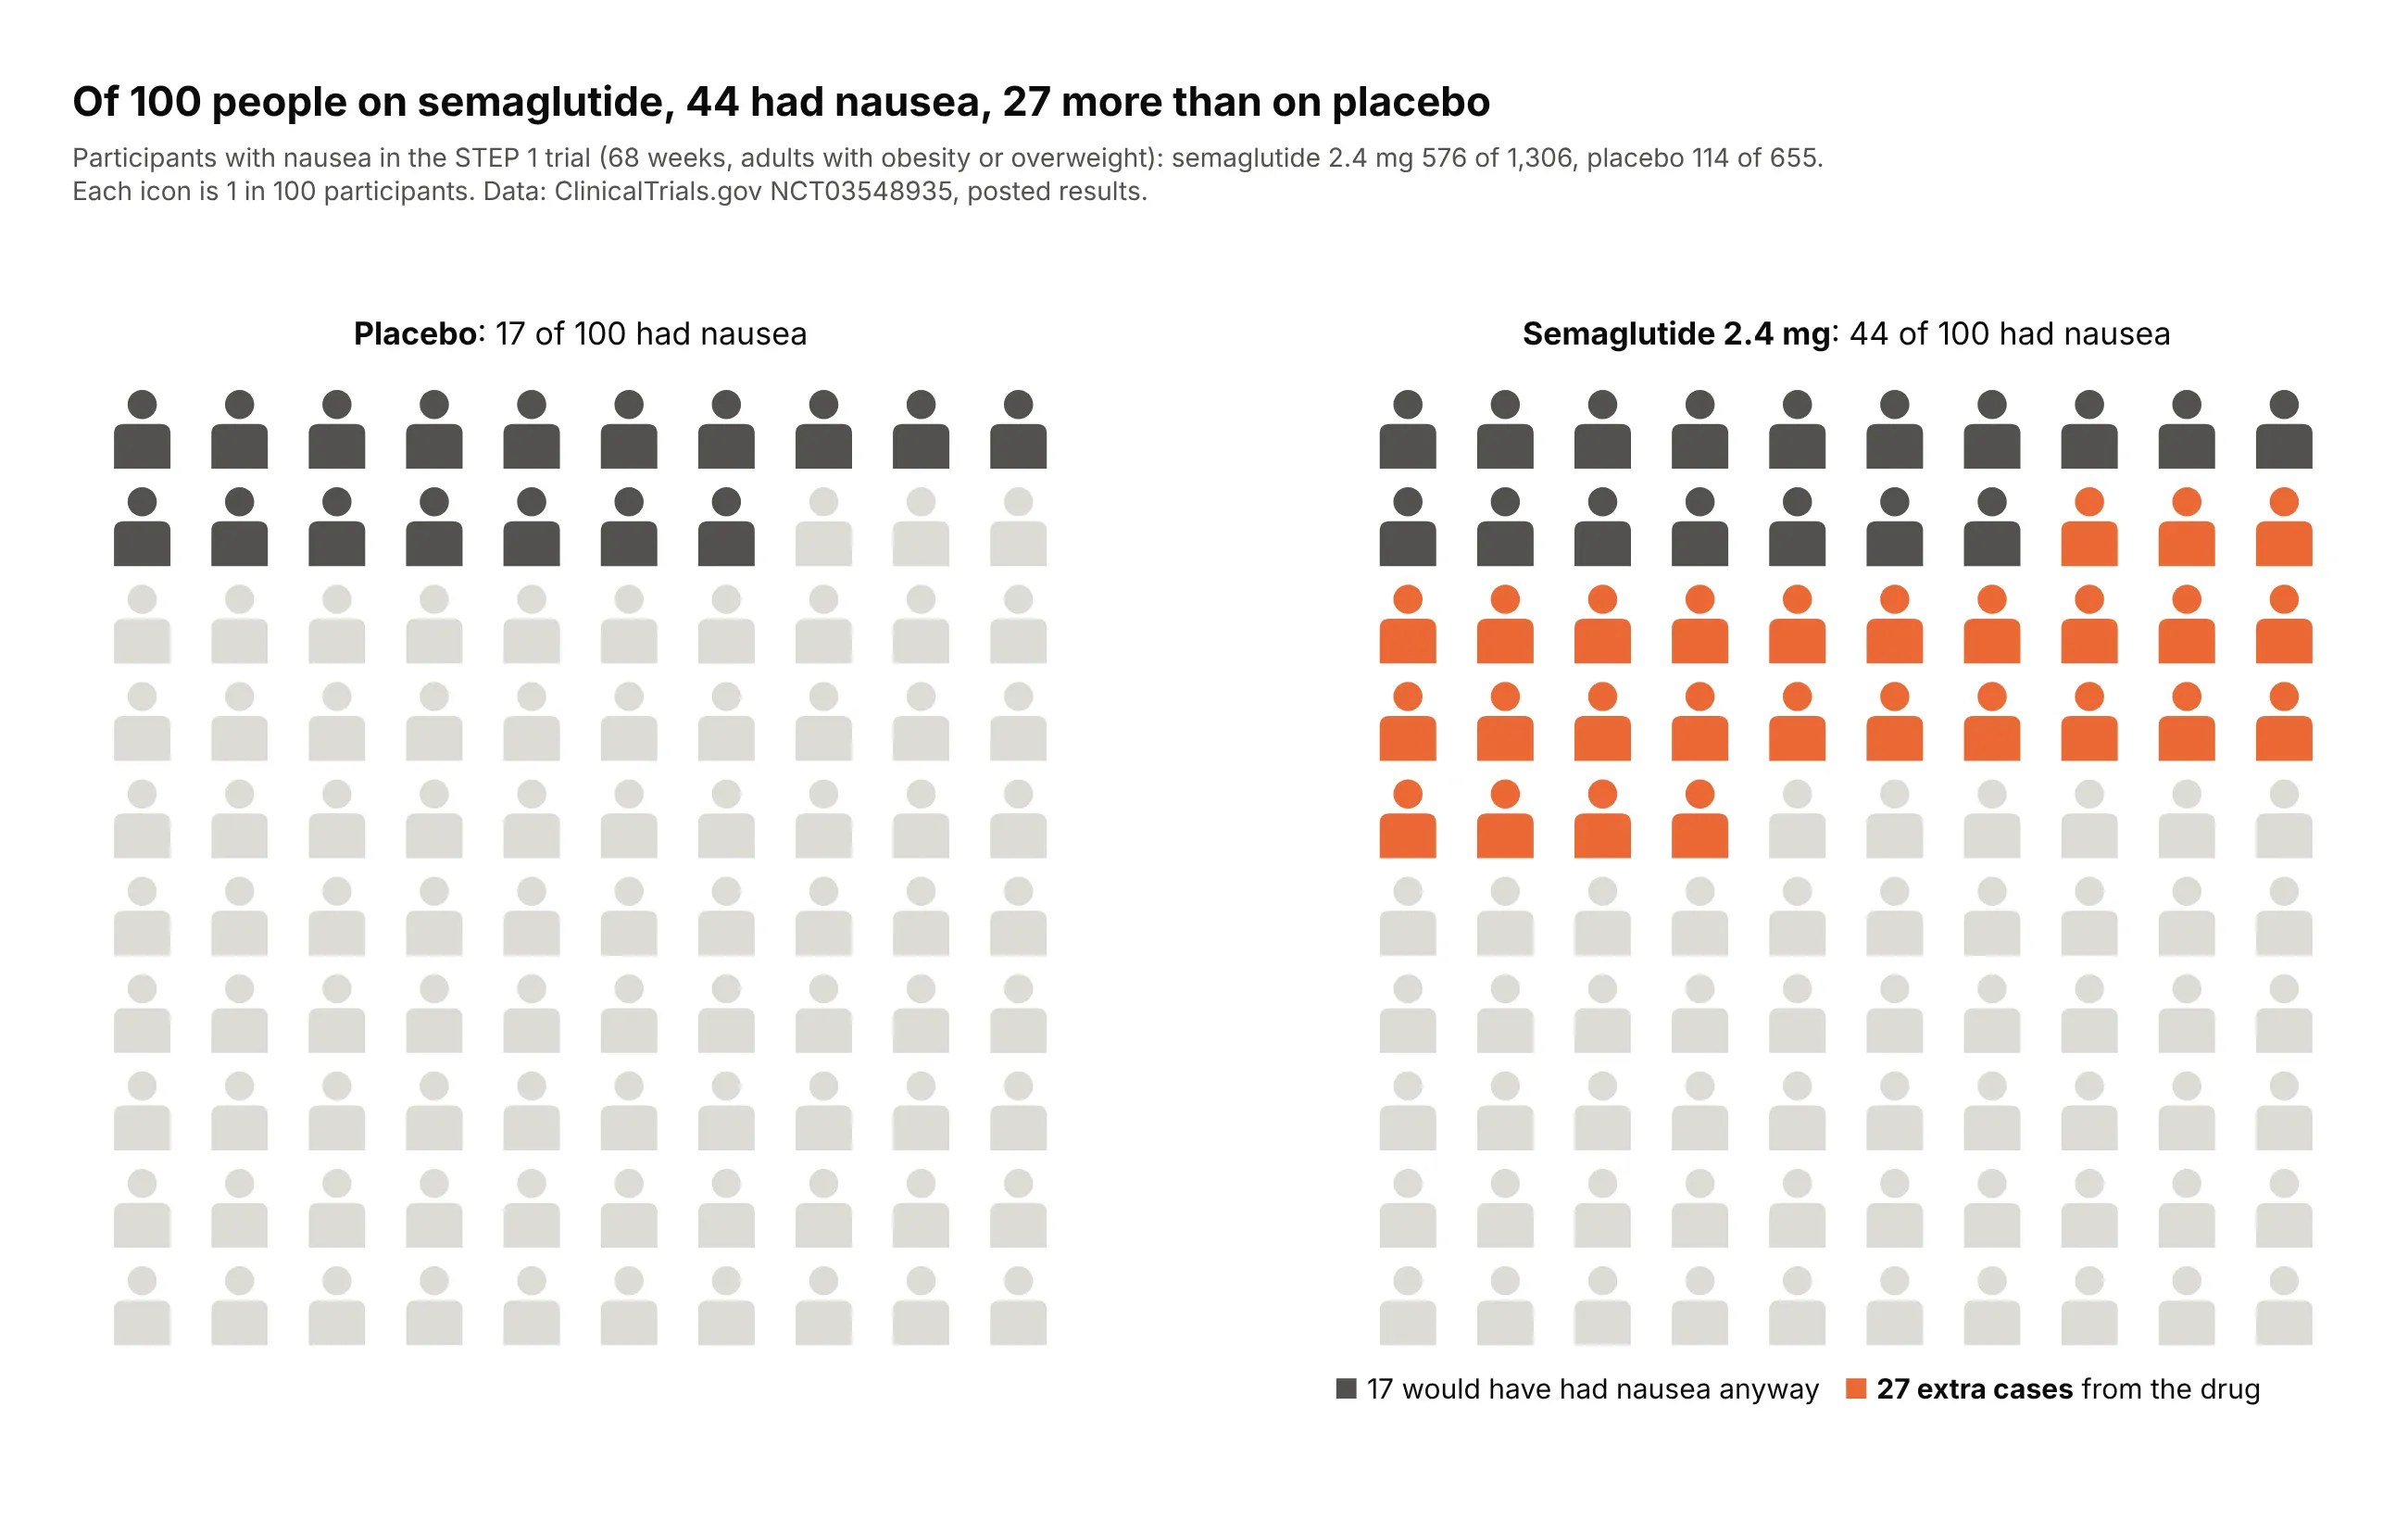
A risk in a clinical trial. In STEP 1, 44 of every 100 people on semaglutide 2.4 mg reported nausea against 17 on placebo, so the icon array shows 27 extra cases per 100. Data: ClinicalTrials.gov NCT03548935 (STEP 1, NEJM 2021, doi:10.1056/NEJMoa2032183), posted adverse events.
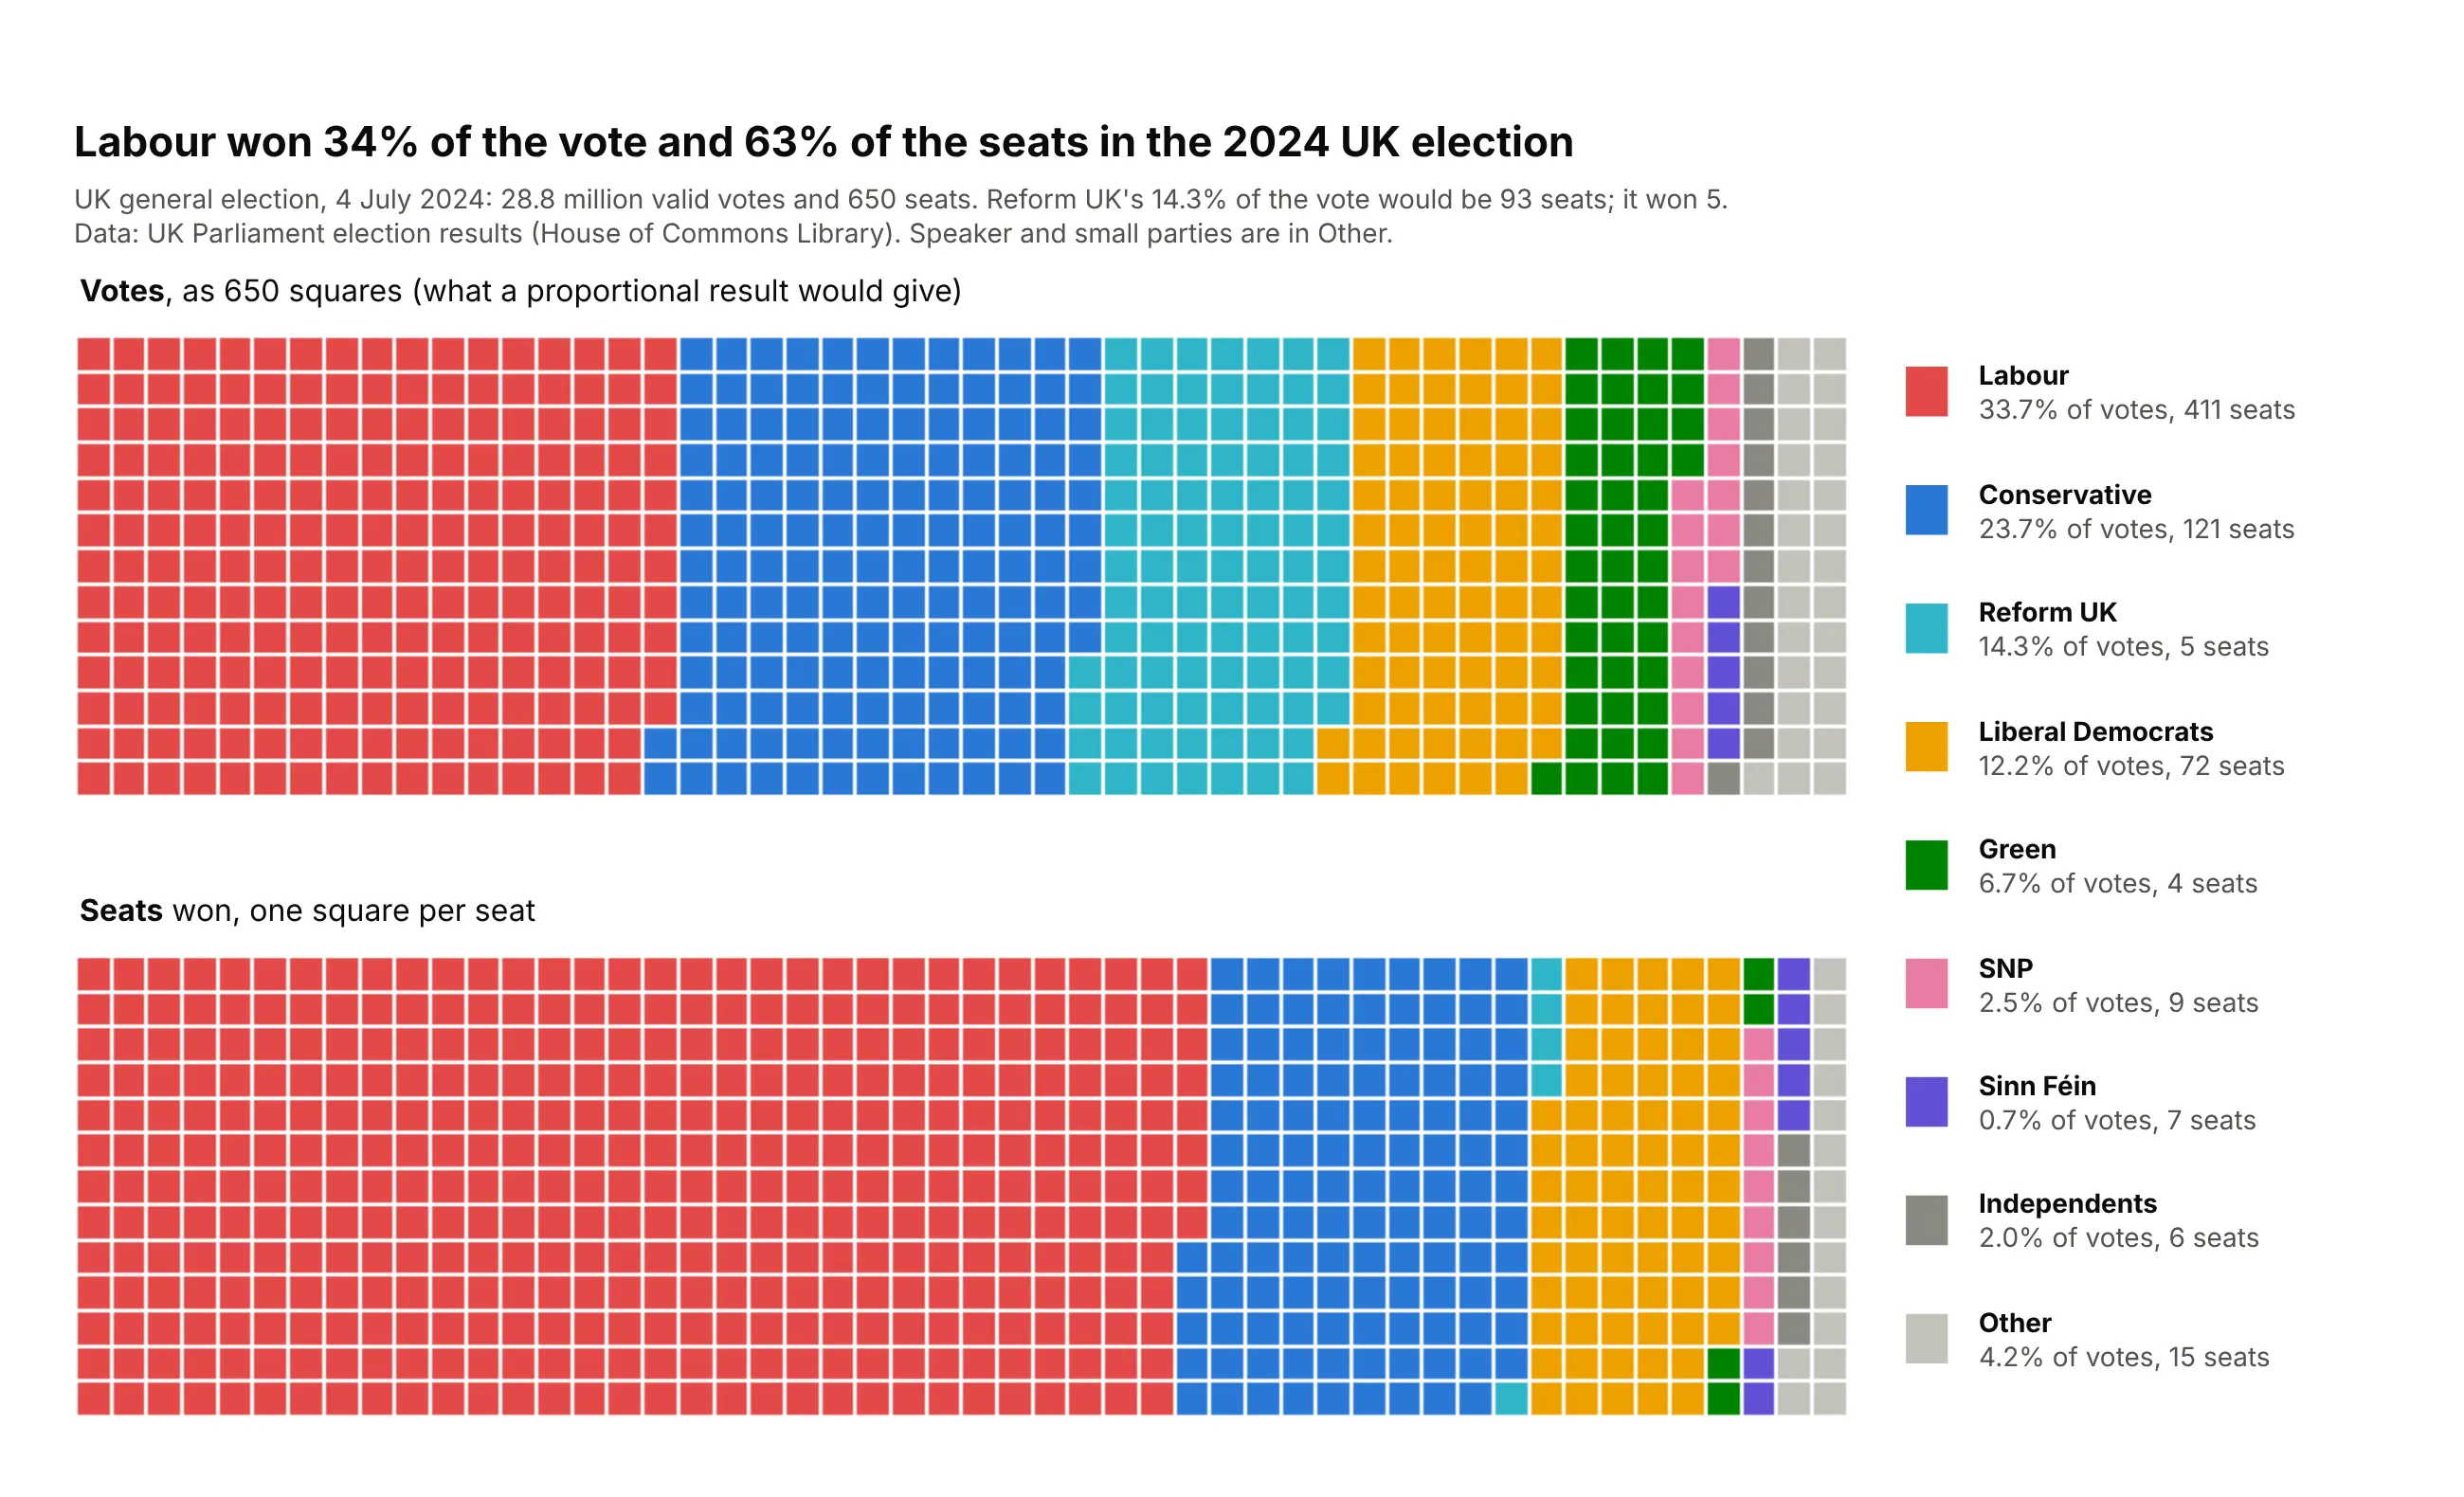
Whole units, like seats. Labour won 34% of the vote and 411 of the 650 seats (63%) in the 2024 UK election, while Reform UK's 14.3% of the vote would have been 93 seats and won 5. Data: UK Parliament election results (House of Commons Library), 4 July 2024.
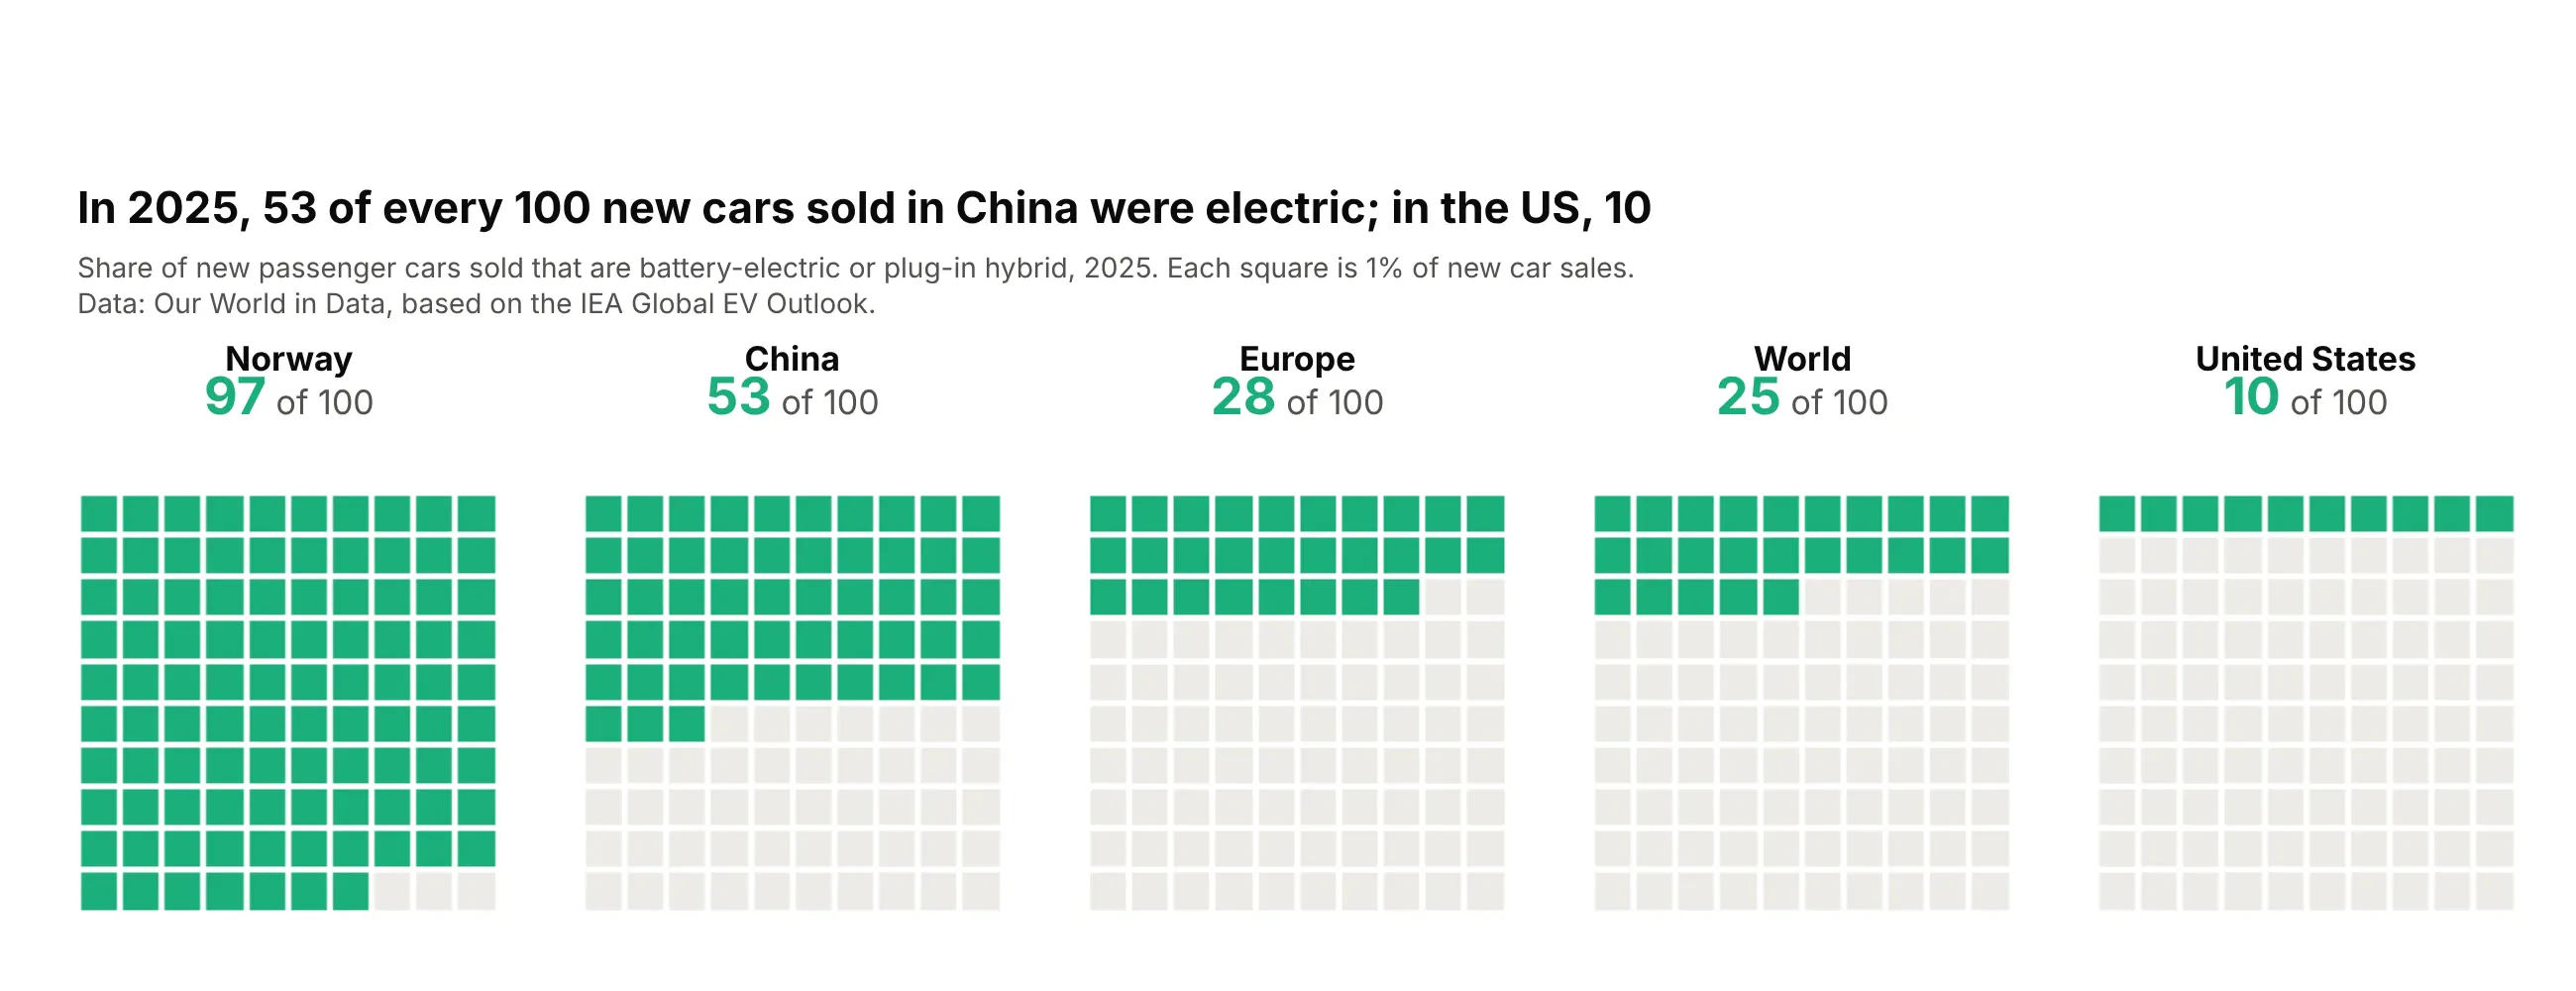
One share in several places. Electric cars were 53 of every 100 new cars sold in China in 2025 and 10 in the US, and five grids on the same scale compare them without an axis. Data: Our World in Data, from the IEA Global EV Outlook, 2025.
A short history
Counting pictures of units goes back to Otto Neurath's Isotype ("International System of Typographic Picture Education") of the 1920s and 1930s, where one icon stood for a fixed number of people or goods. In medicine it became the icon array: Galesic, Garcia-Retamero and Gigerenzer showed that arrays of 100 or 1,000 people help patients with low numeracy understand risk reductions (Health Psychology 2009, doi:10.1037/a0014474), and Spiegelhalter, Pearson and Short recommend them for communicating risk (Science 2011, doi:10.1126/science.1191181). The plain 10 x 10 grid of colored squares later spread through data journalism as the "square pie".
Alternatives to a waffle chart
Here's the same 2025 electricity mix drawn five ways. Some are better for the question, some worse, some just different:
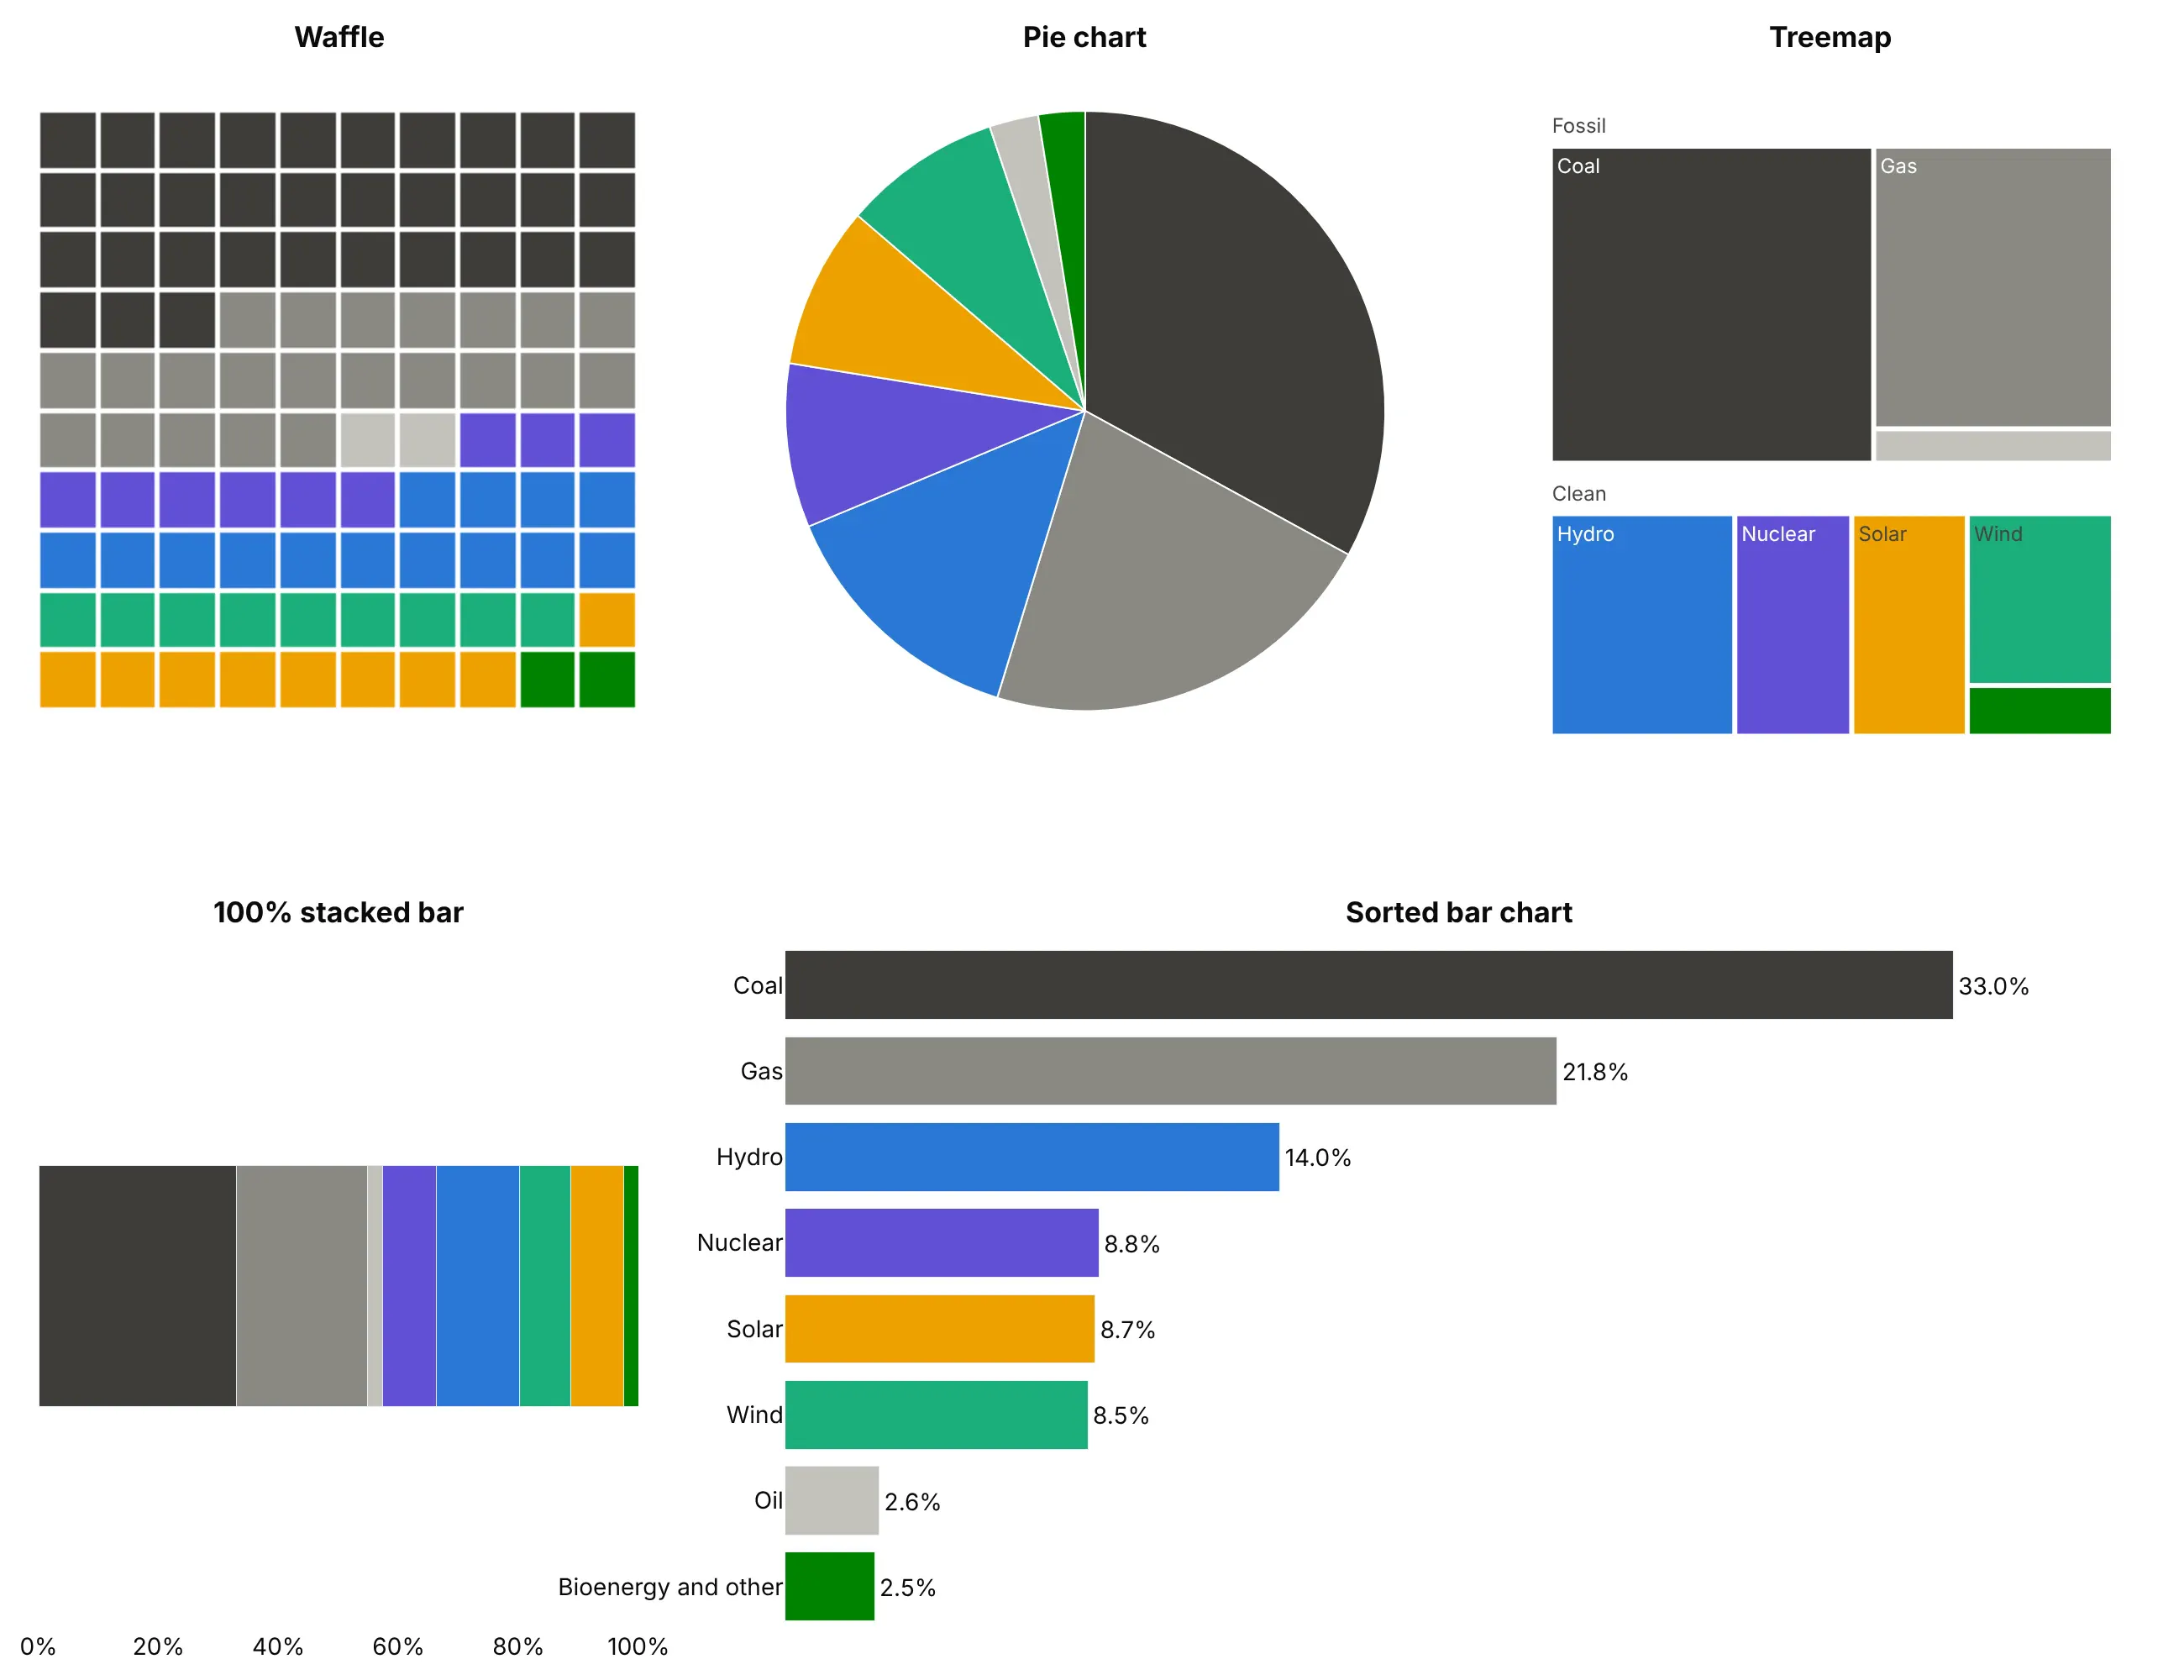
- Sorted bar chart (better for precise comparisons). People judge length on a shared baseline more accurately than area or angle, as Cleveland and McGill (1984) measured. Only the bars show that nuclear (8.8%), solar (8.7%) and wind (8.5%) differ, while the waffle gives each of them 9 squares.
- Pie chart (works too). It shows the part of the whole for a few categories, sorted largest first, but you can't count it, and small slices are hard to label.
- 100% stacked bar (different). The same parts in one line, which takes less space and stacks well when you compare several groups or years.
- Treemap (different). Rectangles sized by value, which also show a hierarchy (fossil and clean here) and fit hundreds of items. See our treemap guide.
- Icon array (different). A waffle of people instead of squares, for risks in medicine (the STEP 1 chart above).
How to make a waffle chart
With AI
ChatGPT, Claude Code, GitHub Copilot, Cursor and other AI tools are excellent at writing Plotly code. Name Plotly in the prompt, describe the grid and what one square means, and list the checks you want:
Make a plotly waffle chart from shares.csv (columns: category, value).- One go.Heatmap, 10 x 10. z = category index + 0.5 for each square, zmin=0, zmax=k,and a stepped colorscale with one flat color per category ([i/k, c], [(i+1)/k, c]).- Squares per category by the largest remainder method so they sum to exactly 100.Group categories under 1% into "Other" before rounding.- Fill row by row from the top left in the order of the CSV. xgap=ygap=3.- yaxis autorange reversed and scaleanchor="x" so the cells are square; axes hidden.- Hover shows the category, its value, its share and its number of squares.- A key on the right in fill order. A title that states the takeaway.- Print each category's value, share and squares, and assert the squares sum to 100.
With Plotly Studio
Plotly Studio is a desktop app where you point an AI at a dataset and it builds charts and a Dash app around your questions. Ask for a waffle chart the same way:
Show a 10 x 10 waffle chart of electricity generation by source in the latest year, one square per 1%, rounded so the squares add up to 100, fossil fuels in grays and clean sources in colors. Add a dropdown to pick the country.
Make a waffle chart in Python or JavaScript
This is the code AI tools write under the hood. In Python, a short helper rounds the shares and draws the squares as one heatmap:
import numpy as npimport pandas as pdimport plotly.graph_objects as godef largest_remainder(values, total=100):"""Whole squares per category that add up to exactly `total`."""quota = np.asarray(values, dtype=float) / np.sum(values) * totalsquares = np.floor(quota).astype(int)for i in np.argsort(-(quota - squares), kind="stable")[: total - squares.sum()]:squares[i] += 1return squaresdef make_waffle(labels, values, colors, total=100, rows=10, gap=3):counts = largest_remainder(values, total)cols = -(-total // rows)cat = np.full(rows * cols, np.nan)cat[:total] = np.repeat(np.arange(len(counts)), counts)k = len(colors)scale = [s for i, c in enumerate(colors) for s in ([i / k, c], [(i + 1) / k, c])]names = np.array(labels + [""], dtype=object)[np.nan_to_num(cat, nan=k).astype(int)]fig = go.Figure(go.Heatmap(z=(cat + 0.5).reshape(rows, cols), zmin=0, zmax=k, colorscale=scale, showscale=False,xgap=gap, ygap=gap, text=names.reshape(rows, cols), hovertemplate="%{text}<extra></extra>"))for lb, c, n in zip(labels, colors, counts): # legend entriesfig.add_scatter(x=[None], y=[None], mode="markers", name=f"{lb} ({n})",marker=dict(symbol="square", size=14, color=c))fig.update_xaxes(visible=False)fig.update_yaxes(visible=False, autorange="reversed", scaleanchor="x")fig.update_layout(plot_bgcolor="white", width=800, height=520)return figurl = "https://raw.githubusercontent.com/owid/energy-data/master/owid-energy-data.csv"df = pd.read_csv(url)mix = df[(df.country == "World") & (df.year == 2025)]sources = ["coal", "gas", "oil", "nuclear", "hydro", "wind", "solar"]make_waffle([s.title() for s in sources], [mix[f"{s}_electricity"].item() for s in sources],["#3d3c39", "#8a8983", "#c3c2bc", "#6250d6", "#2a78d6", "#1baf7a", "#eda100"]).show()
In JavaScript, plotly.js builds the same grid from a heatmap trace, with the squares already rounded:
<div id="chart"></div><script src="https://cdn.plot.ly/plotly-4.1.1.min.js"></script><script>const labels = ["Coal", "Gas", "Oil", "Nuclear", "Hydro", "Wind", "Solar", "Other"];const squares = [33, 22, 2, 9, 14, 9, 9, 2]; // already rounded to add up to 100const colors = ["#3d3c39", "#8a8983", "#c3c2bc", "#6250d6", "#2a78d6", "#1baf7a", "#eda100", "#008300"];const cat = squares.flatMap((n, i) => Array(n).fill(i)); // category of each square, in fill orderconst z = [], text = [];for (let r = 0; r < 10; r++) {z.push(cat.slice(r * 10, r * 10 + 10).map(i => i + 0.5));text.push(cat.slice(r * 10, r * 10 + 10).map(i => labels[i]));}const k = colors.length;const colorscale = colors.flatMap((c, i) => [[i / k, c], [(i + 1) / k, c]]);Plotly.newPlot("chart", [{type: "heatmap", z, text, zmin: 0, zmax: k, colorscale, showscale: false,xgap: 3, ygap: 3, hovertemplate: "%{text}<extra></extra>"}], {width: 520, height: 520, plot_bgcolor: "white",xaxis: {visible: false}, yaxis: {visible: false, autorange: "reversed", scaleanchor: "x"}});</script>
Adding 0.5 to each category index puts it in the middle of its color band, so every square gets exactly one color.
Share it
Every Plotly chart has a Share chart button (the cloud icon in its toolbar) that uploads it to Plotly Cloud and gives you a link. Only you can see it until you change its visibility.
For a live app, put the chart in a Dash app and publish it with the Plotly Cloud CLI. Coding agents can run these commands for you:
pip install "dash[cloud]"plotly user loginplotly app publish
If your data has to stay in your own cloud or data center, publish to Dash Enterprise instead.
Dos and don'ts
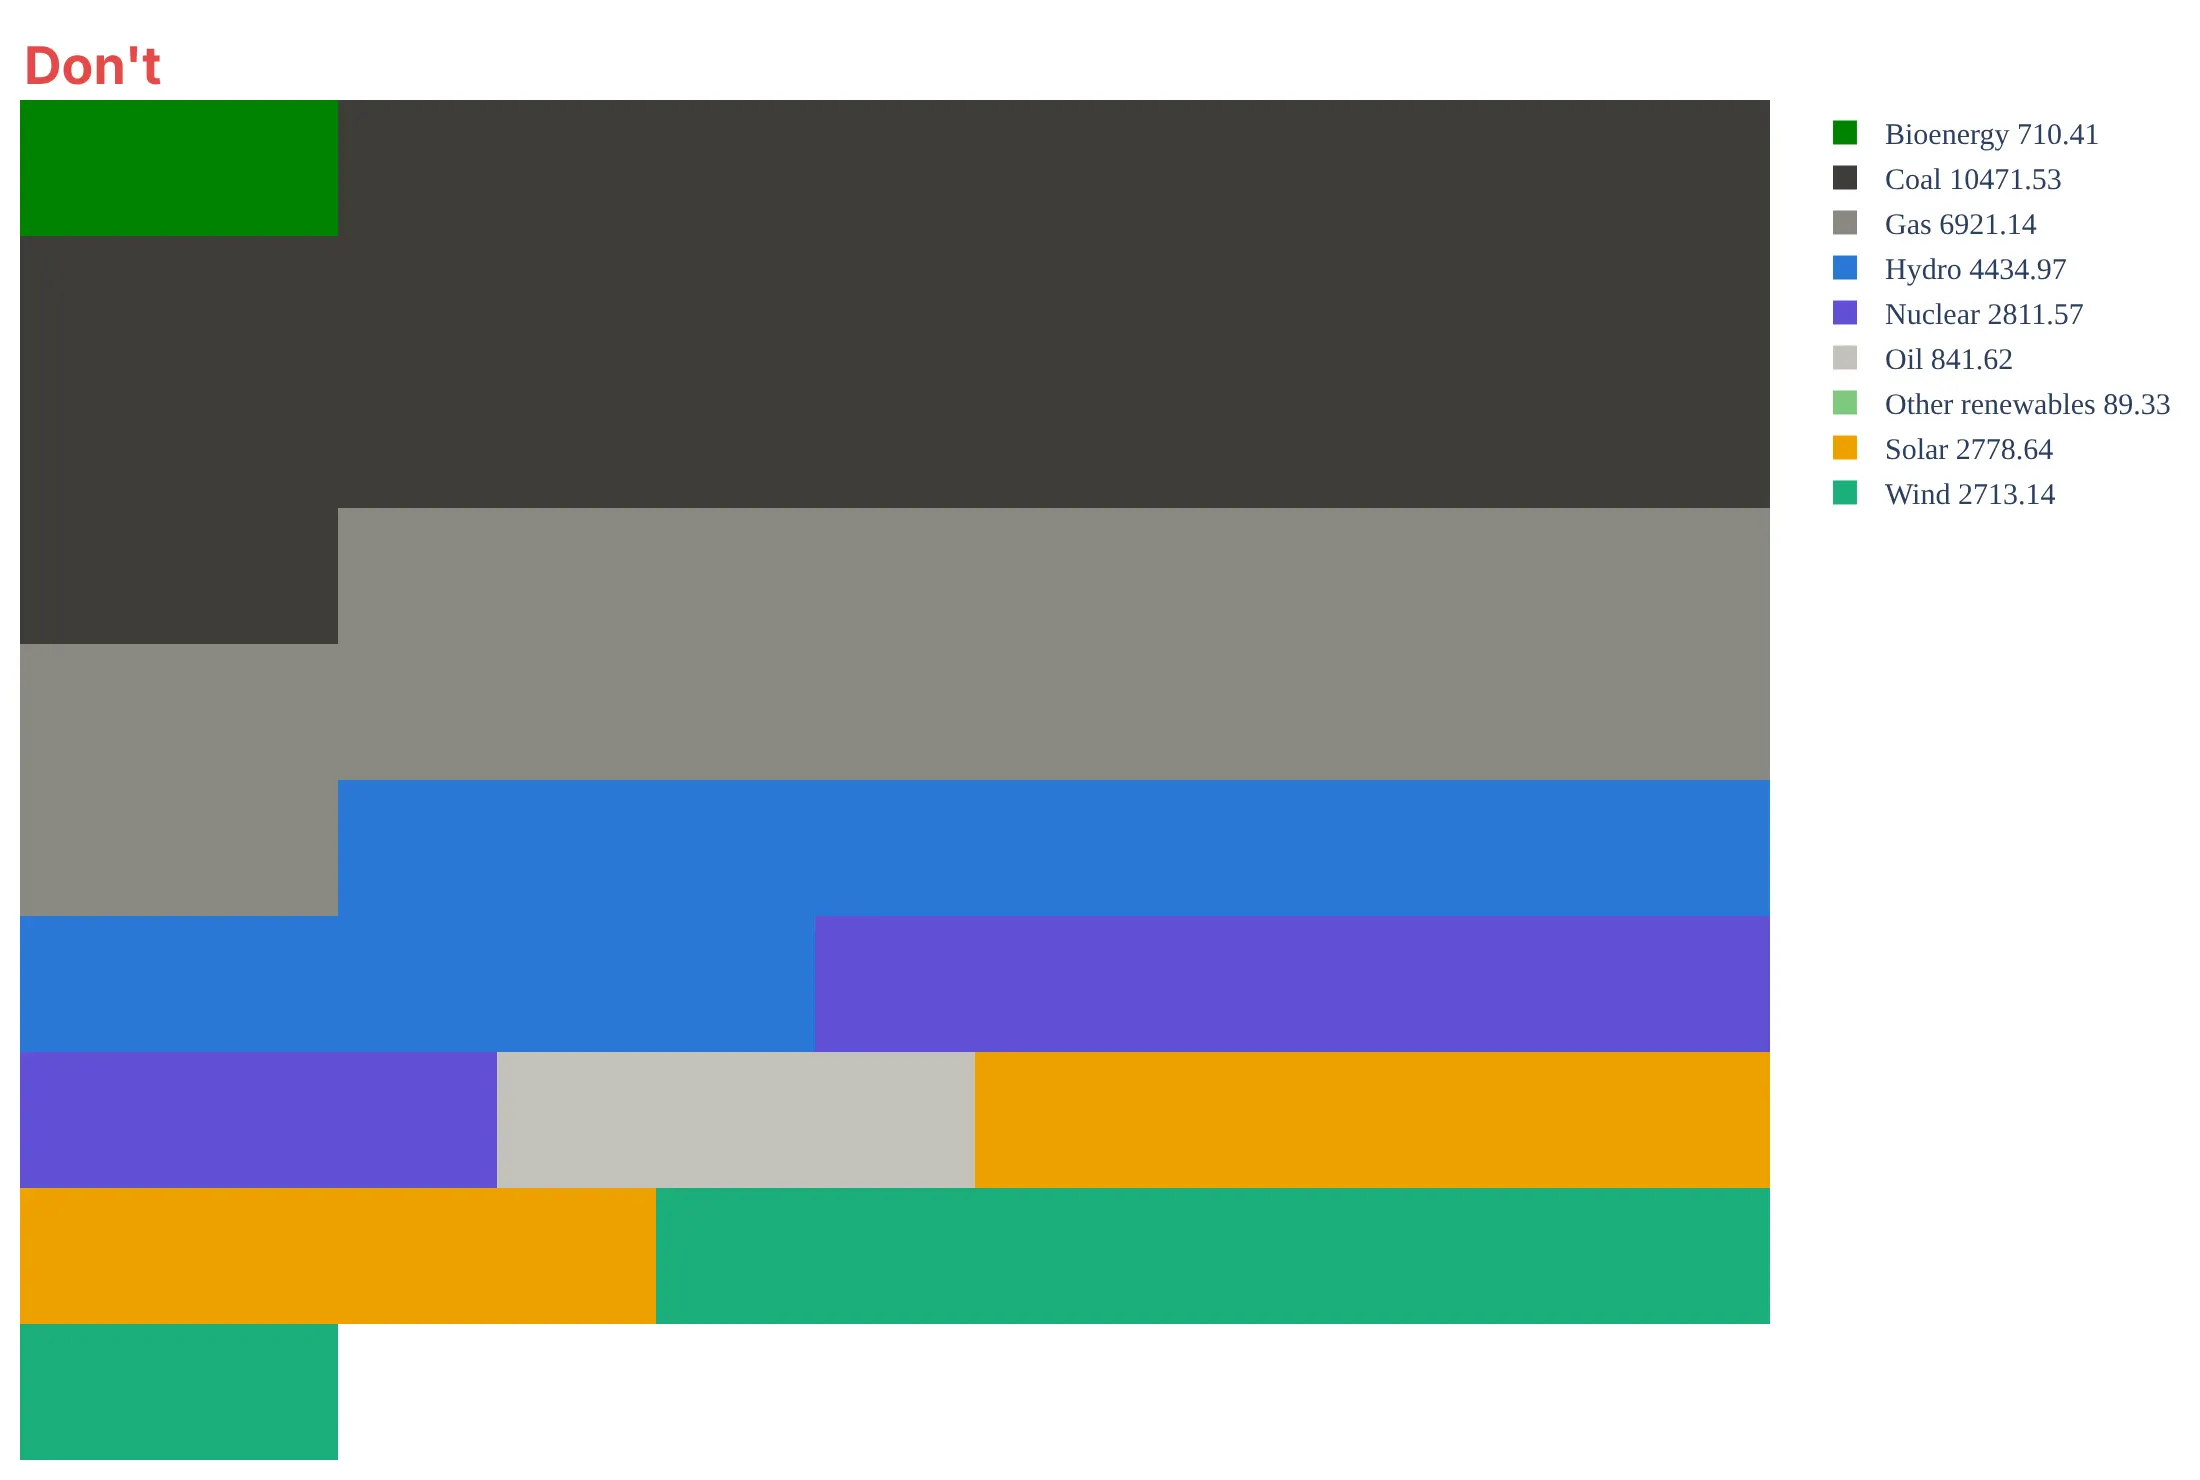
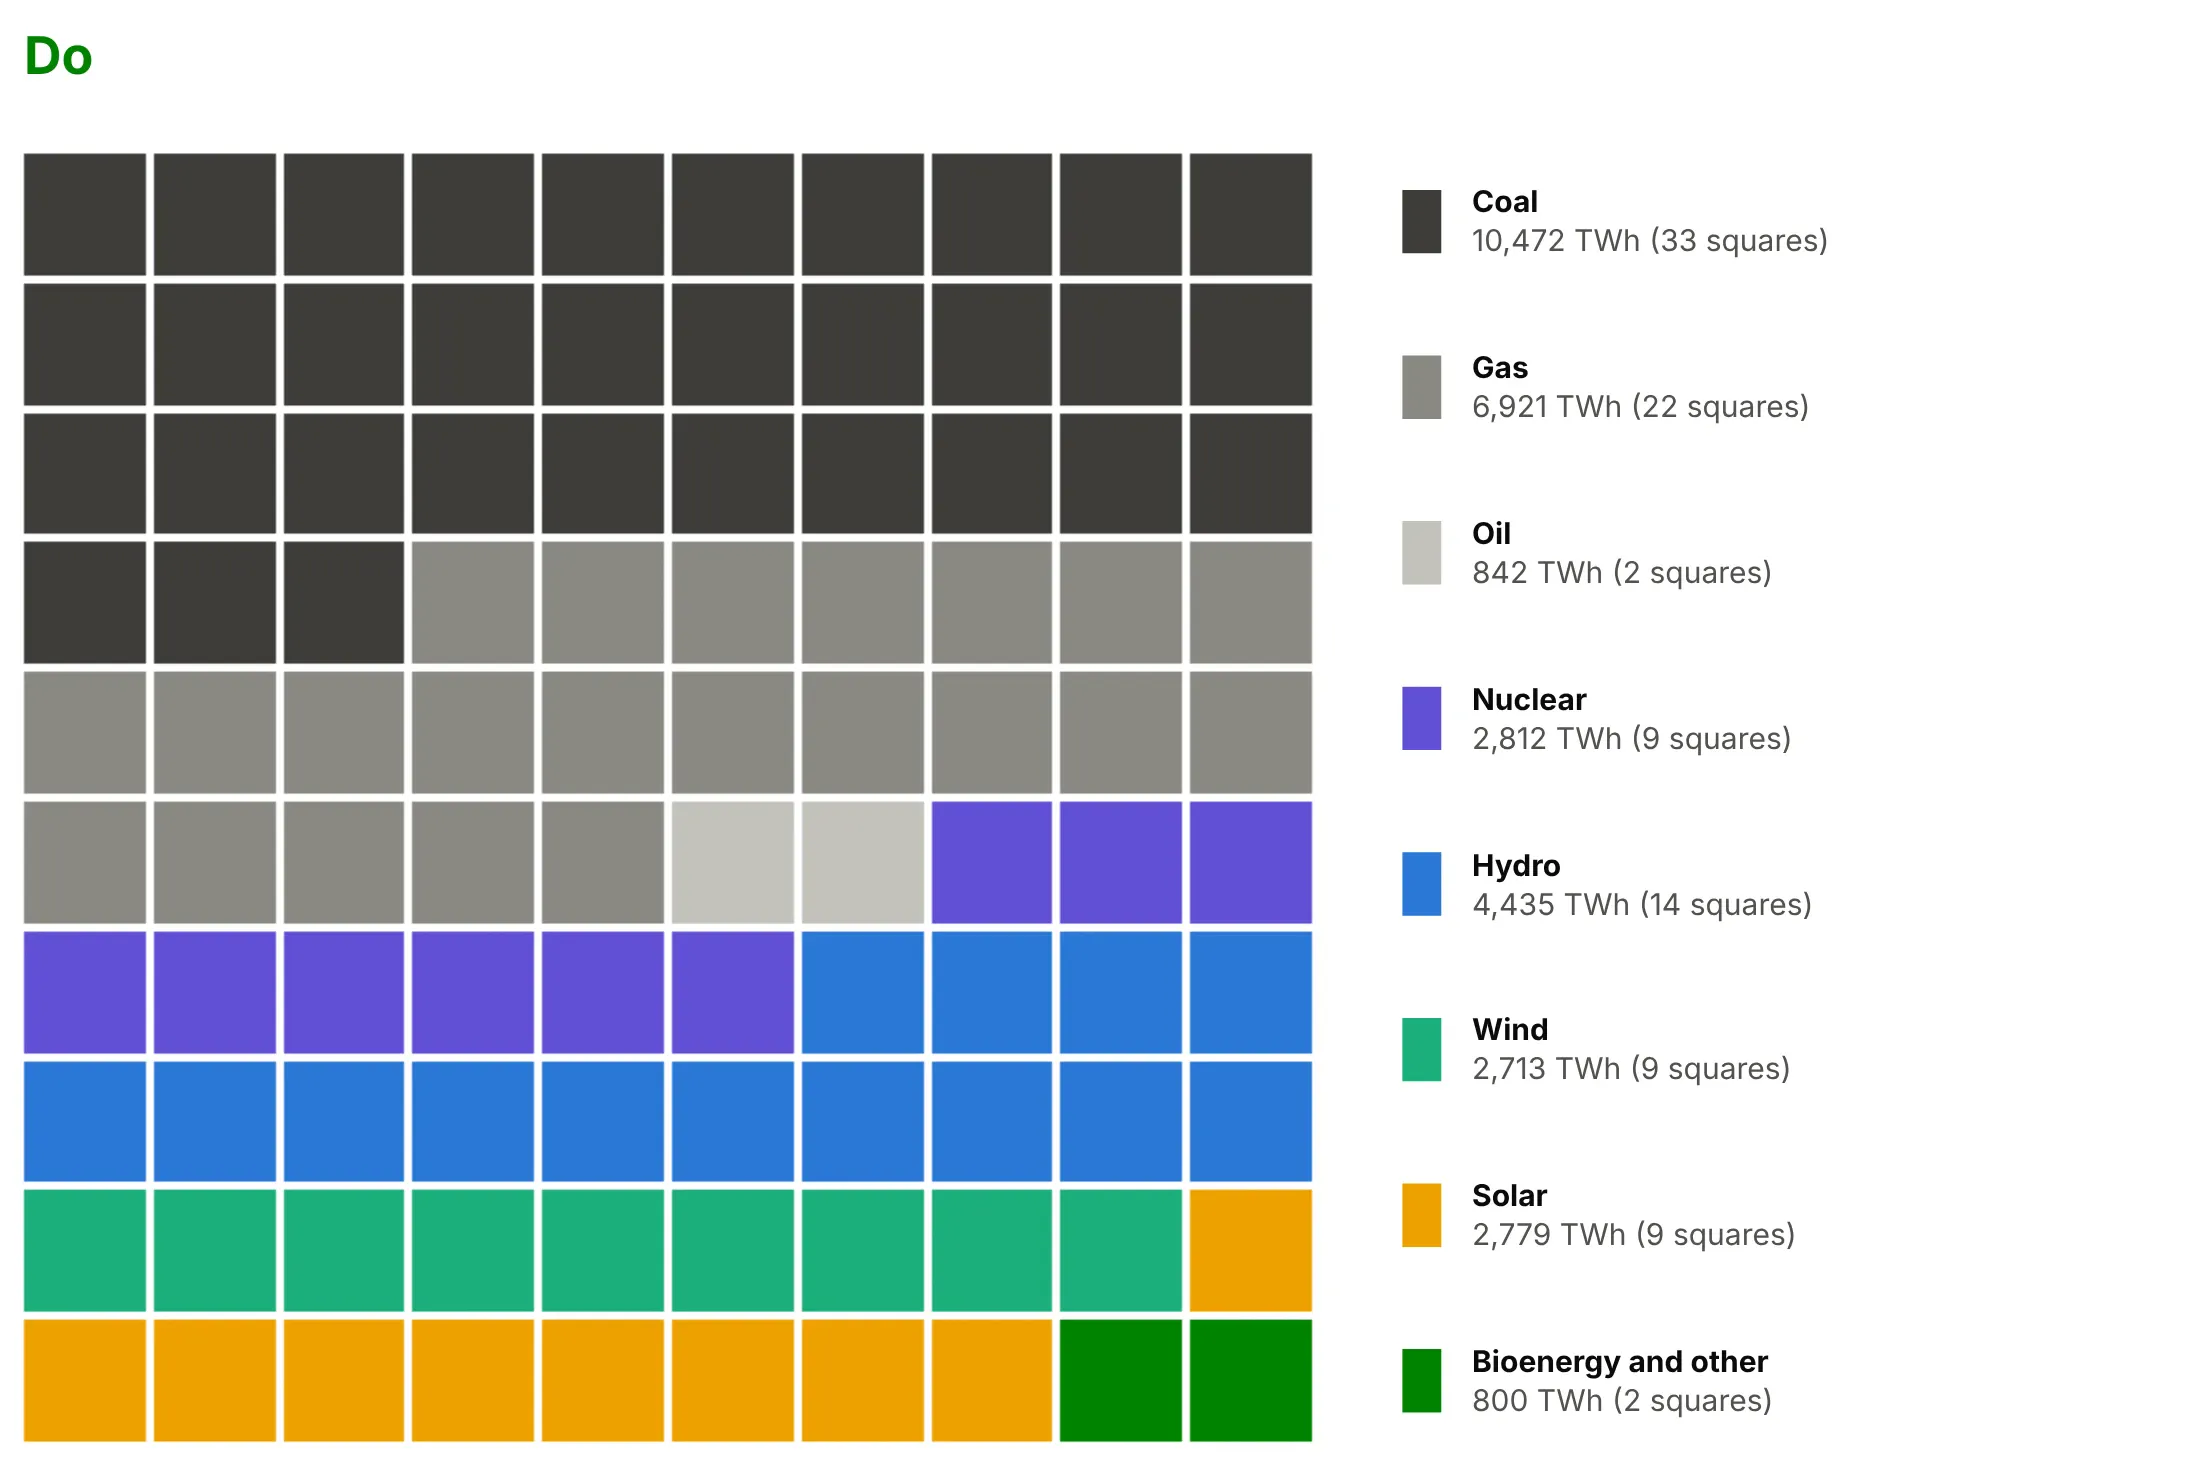
A waffle chart only works if the squares can be counted and add up. Here is the same 2025 electricity mix both ways, with the same colors.
Don't list the sources alphabetically, round each share on its own (here that gives 101 squares, so an extra square sticks out below the grid), drop the gaps, let the cells stretch into rectangles, or leave raw numbers in a default legend:
Do order the sources so fossil and clean are each one block, round the two groups first and the sources inside them second with the largest remainder method (exactly 100 squares, 57 fossil), fold the 0.3% of other renewables into bioenergy, keep square cells with gaps, and put a key in fill order with formatted values:
Fill order and color
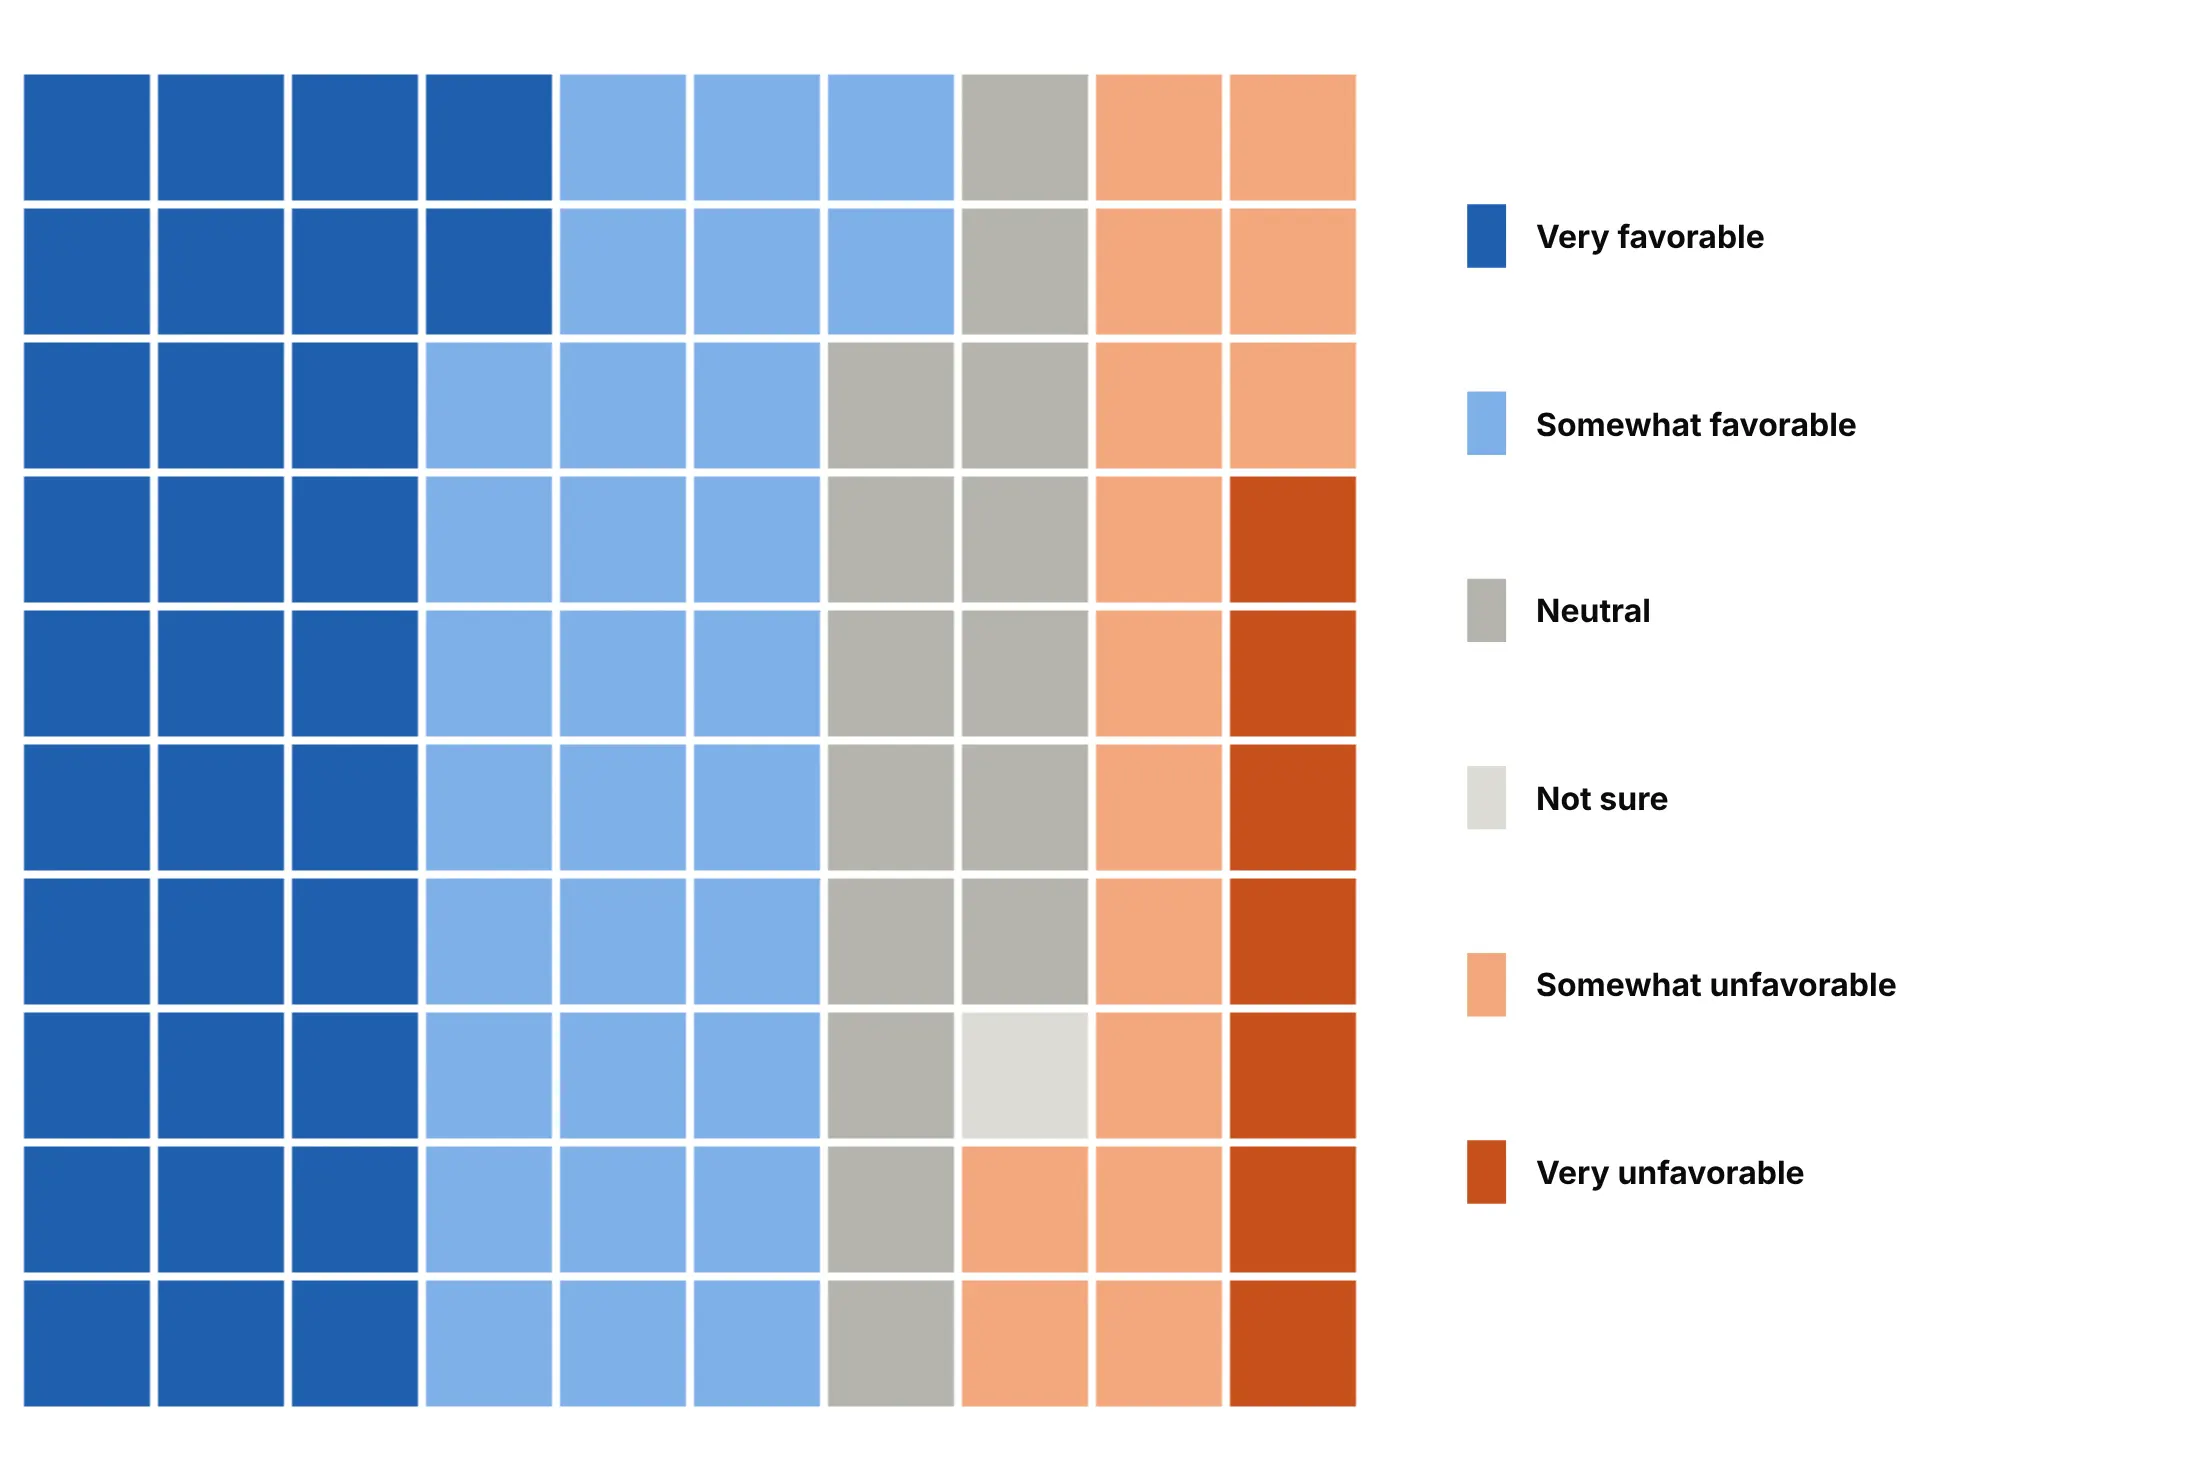
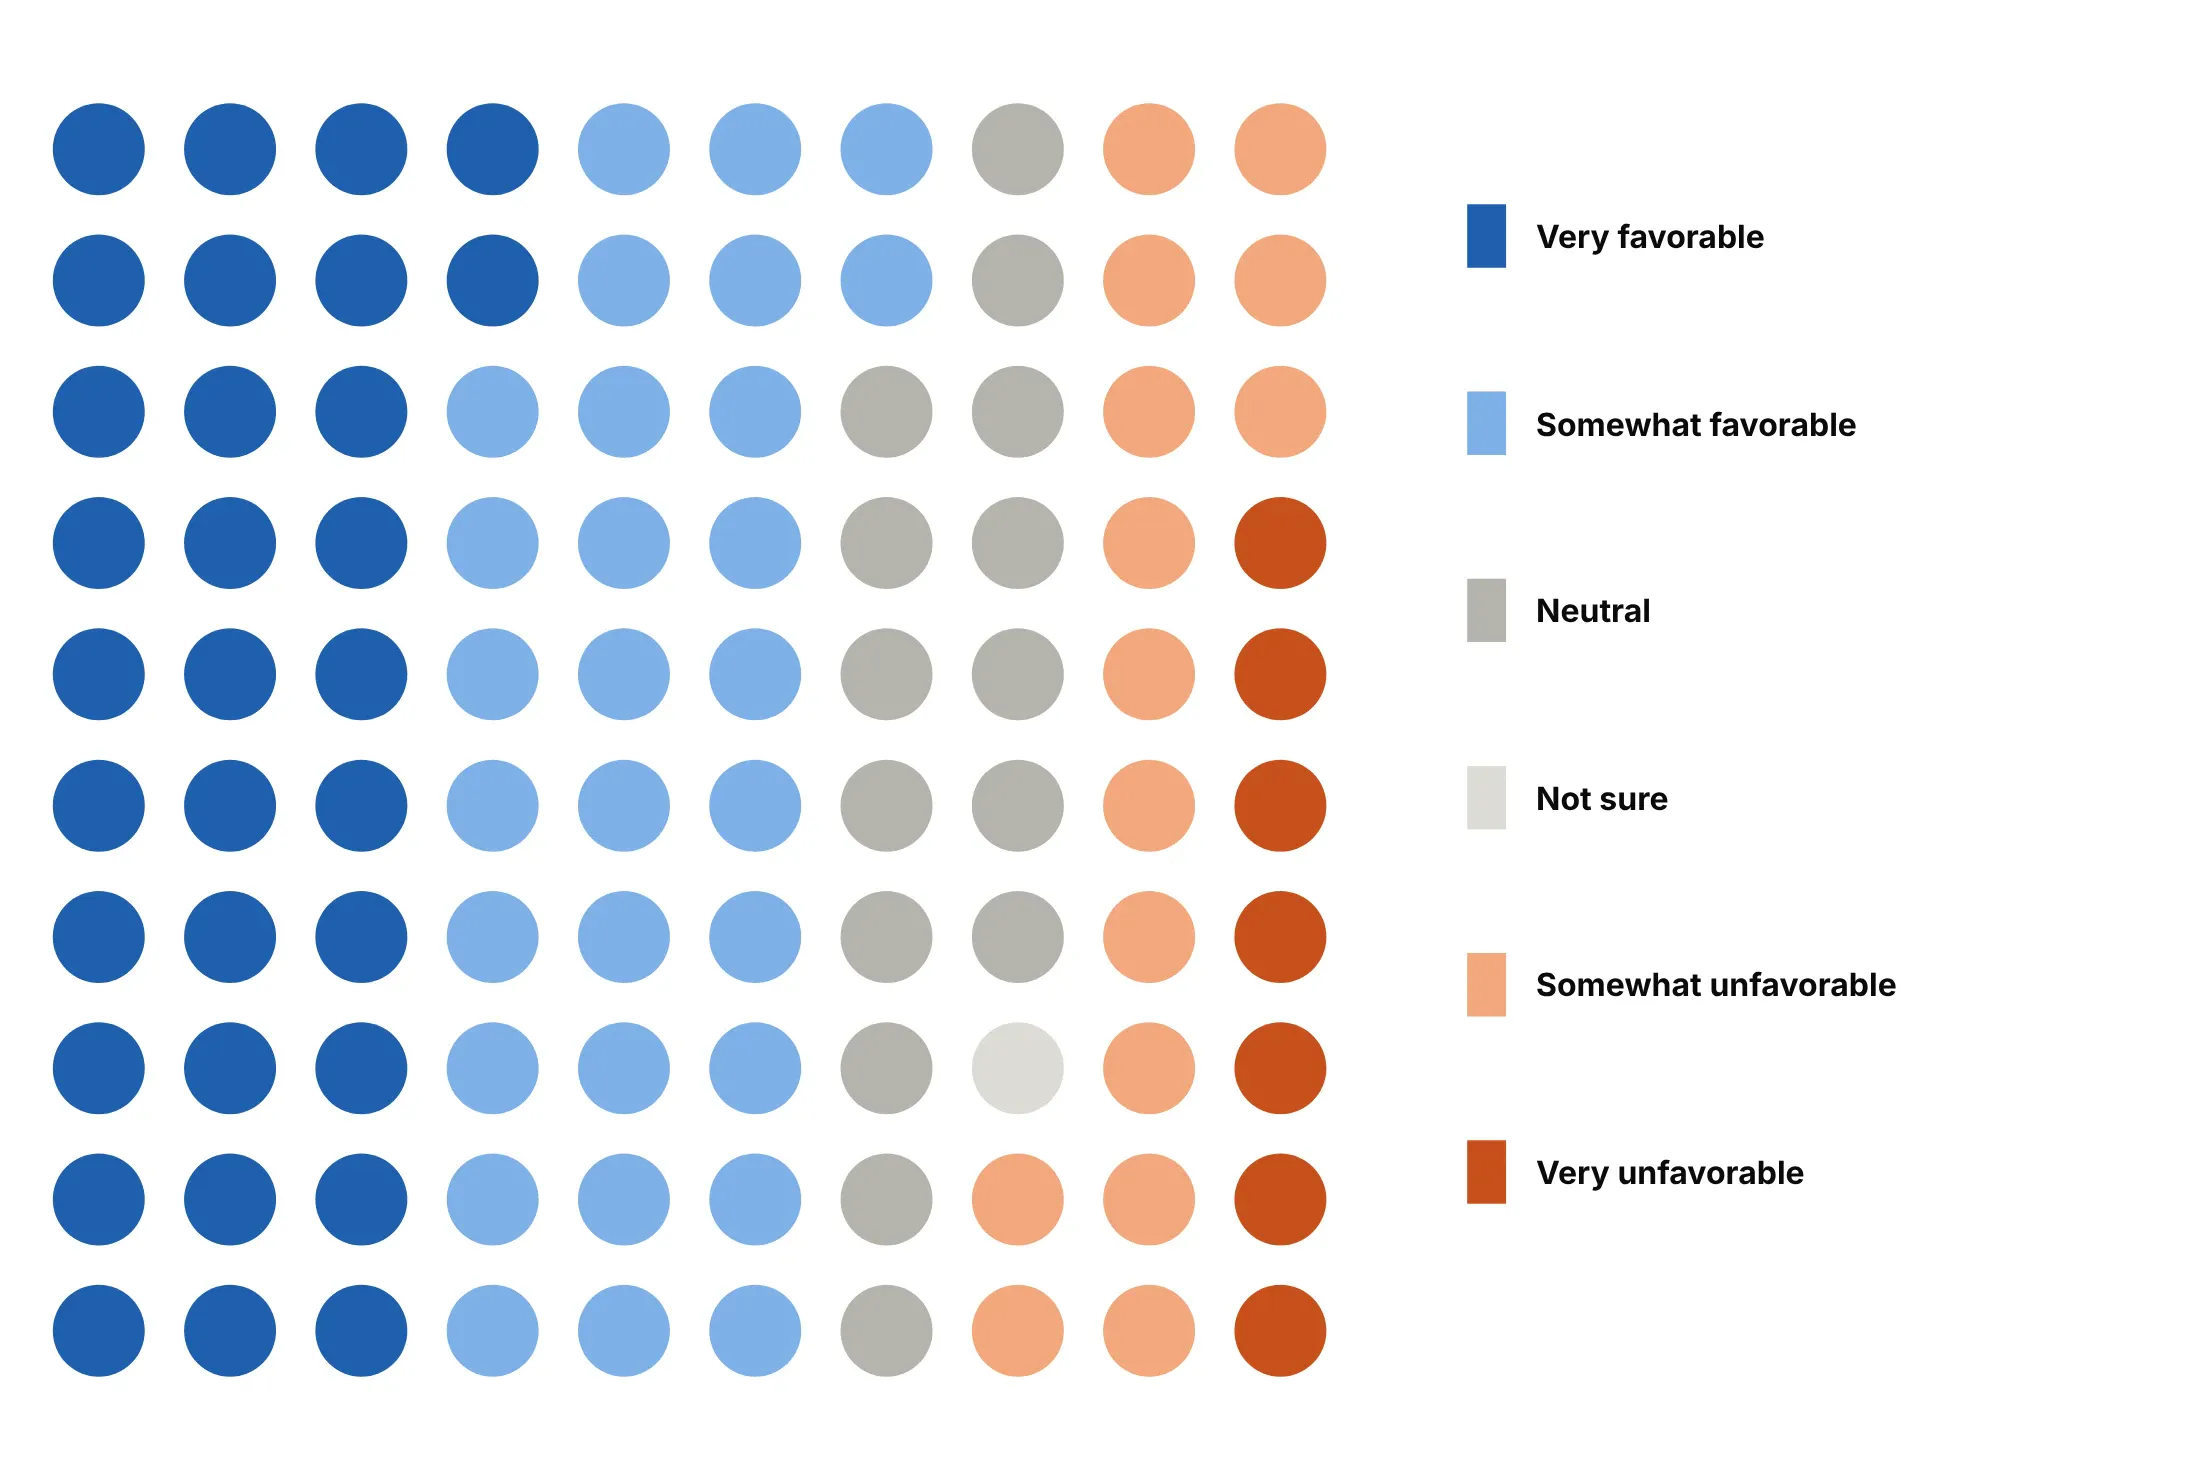
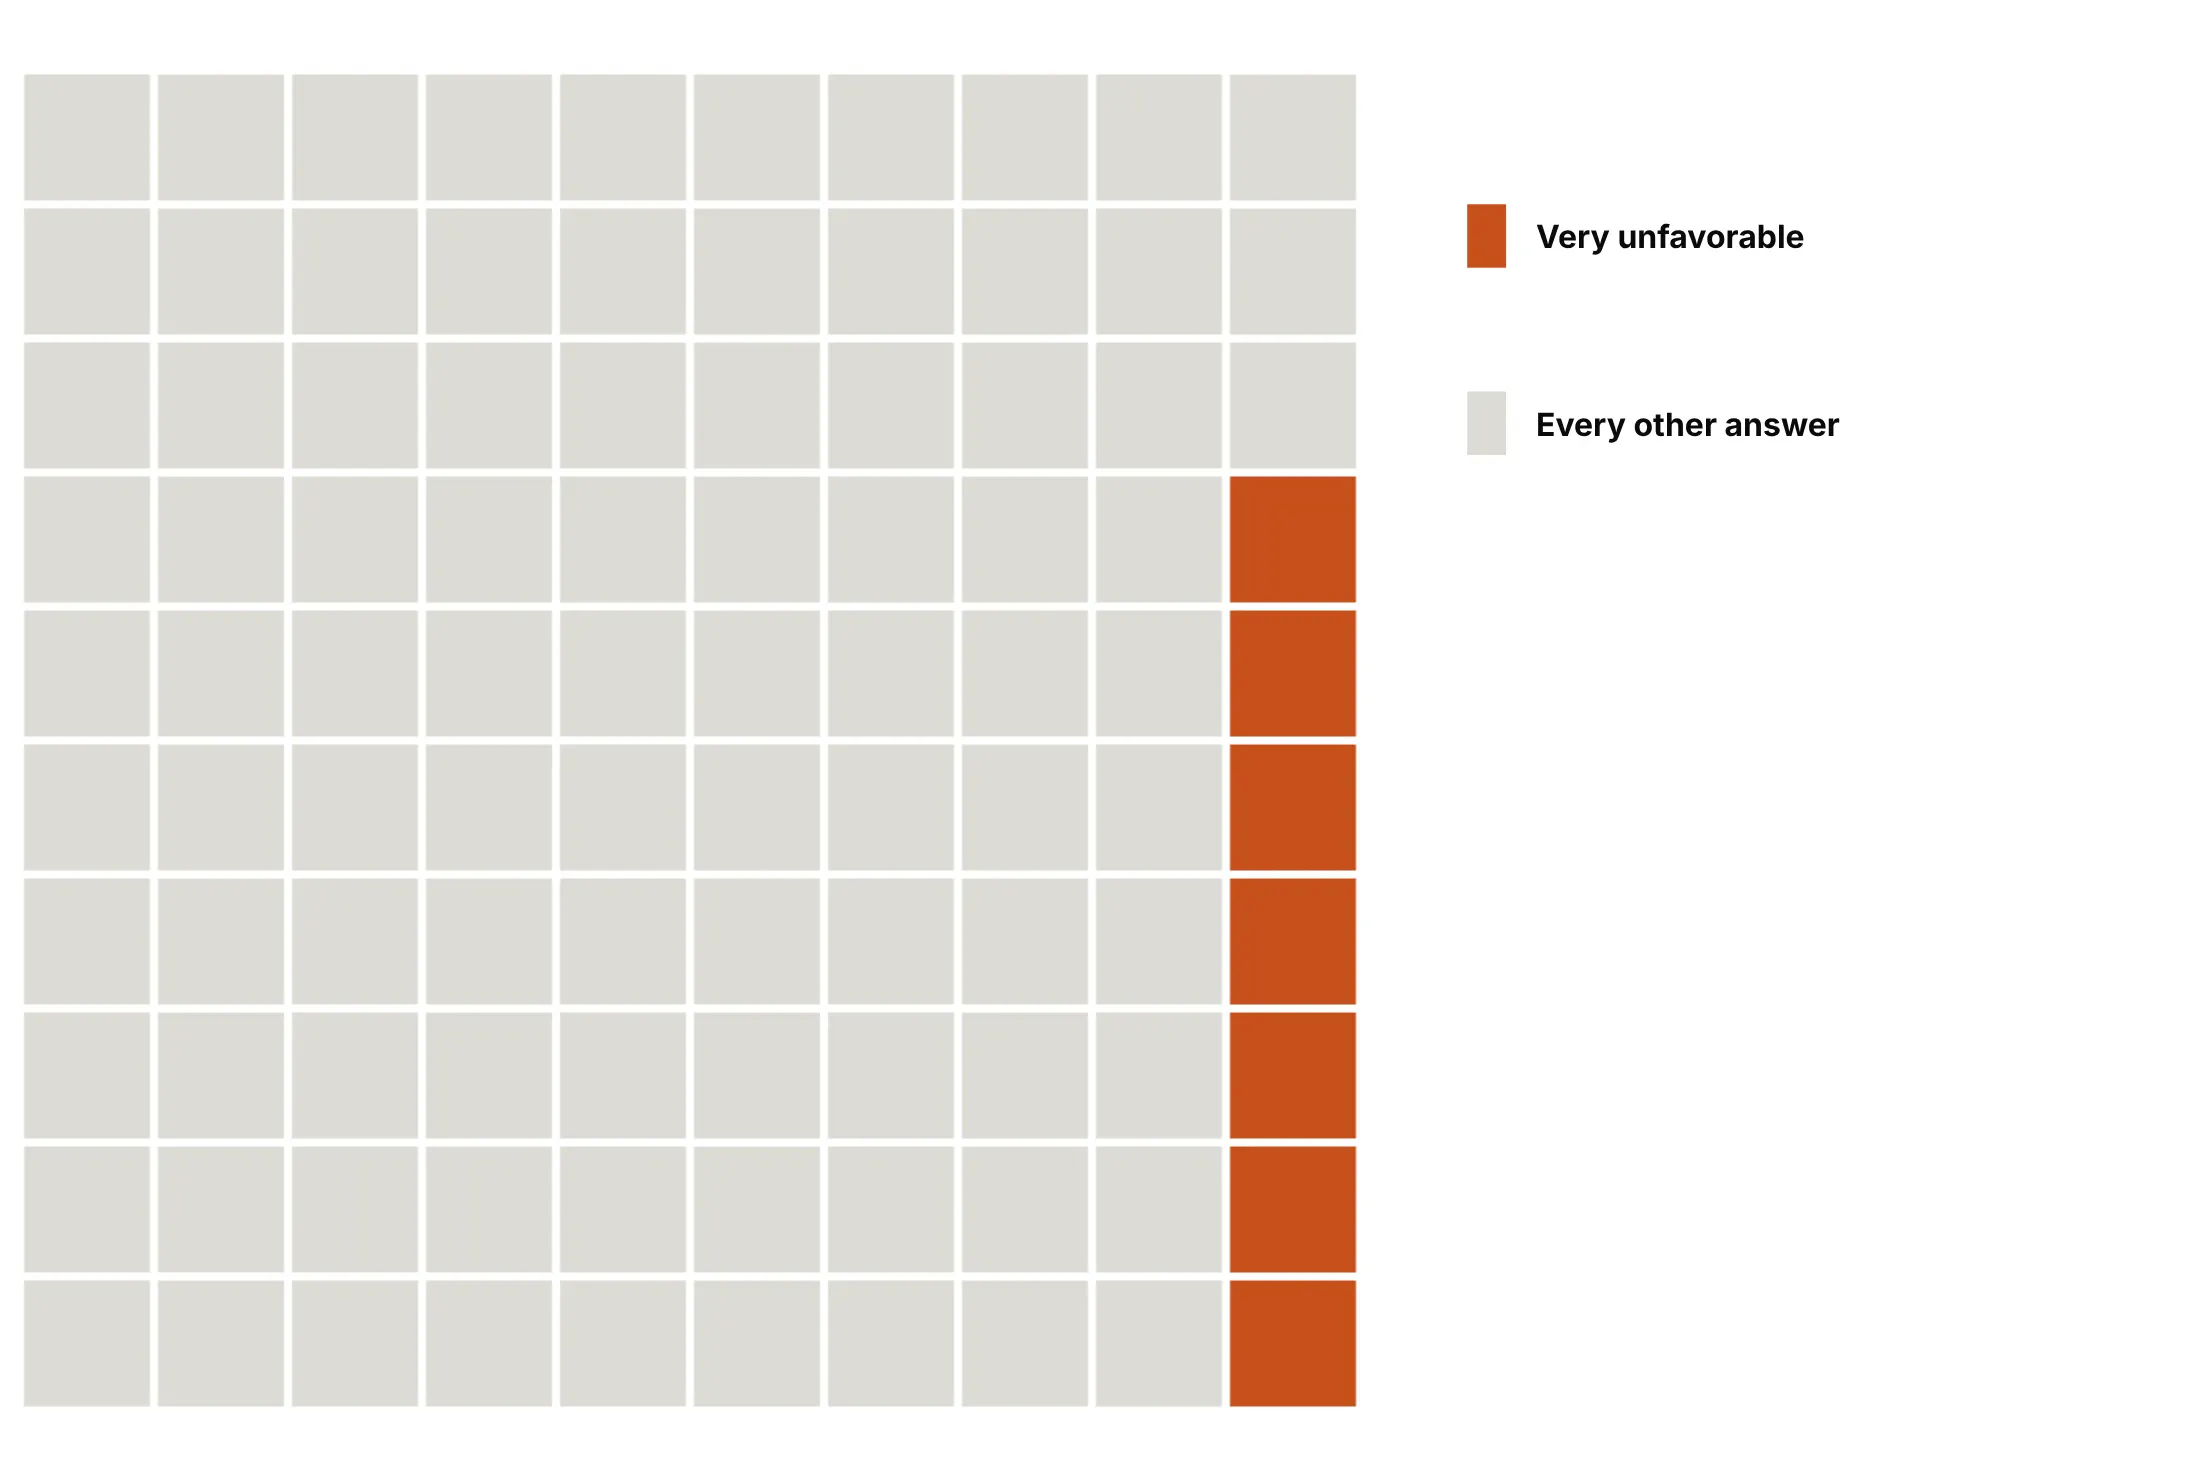
The fill order and the colors decide what the waffle says. Here are four options on the same 14,428 answers to the Stack Overflow 2026 survey question on AI tools.
Row by row (the default). Easy to build, but each answer wraps across rows, so the scale from favorable to unfavorable is harder to follow.
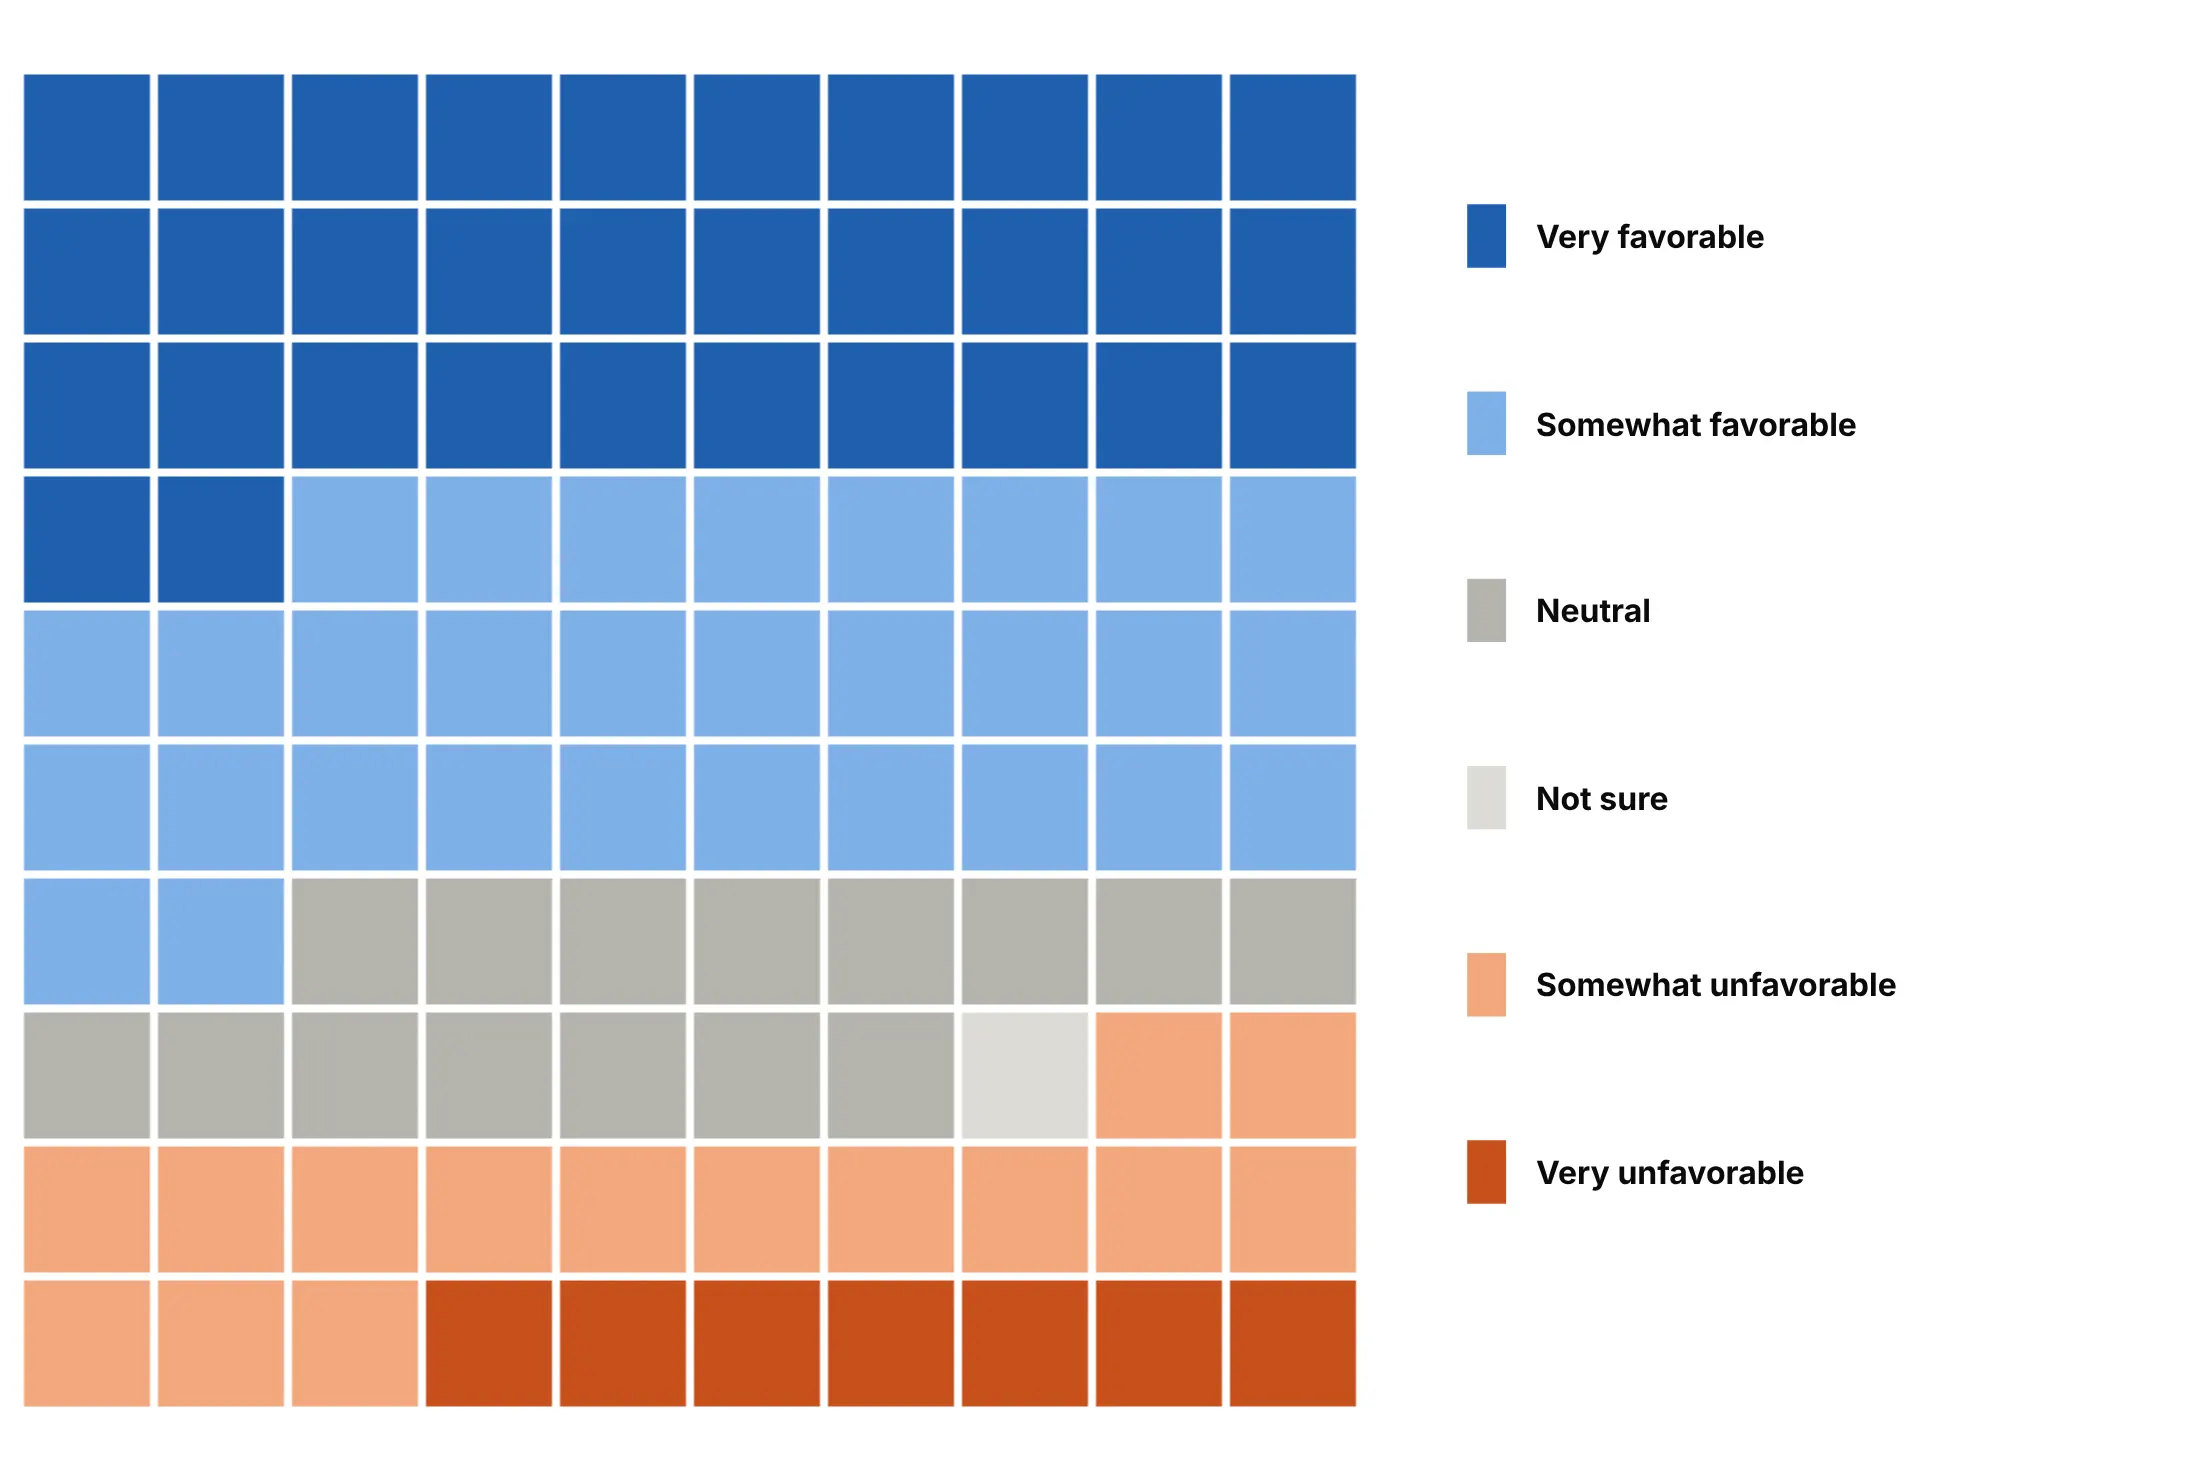
Column by column. Each answer becomes a vertical band, so the grid reads left to right like a diverging bar.
Dots instead of squares. Scatter markers give a softer, pictogram-like look with the same counts.
Highlight one answer. When the chart is about one number, give it the only color: 7 of every 100 developers are very unfavorable.
Checklist
Do
- Round with the largest remainder method so the squares add up to the grid, and round groups first when the title quotes a group total.
- Order the categories by size, by a natural order (a scale, time) or by group, and fill in that order.
- Fold small categories into "Other" before rounding.
- Keep square cells (scaleanchor="x") and gaps of 2-5 px.
- Say what one square is, and put values and squares in the key.
- Use the same grid and colors across small multiples.
Don't
- Round each share on its own; the total drifts to 99 or 101.
- Use more than about seven colors.
- Use a waffle for a precise comparison of close values.
- Draw one shape per square for big grids; one heatmap is much faster.
Options to customize
These are the go.Heatmap and layout options that matter most for building a waffle chart. The full list is in the Plotly heatmap reference.
- z: each square's category index plus 0.5, as a rows x columns array.
- colorscale, zmin, zmax: a stepped scale ([i/k, c], [(i+1)/k, c]) with zmin=0, zmax=k gives each category one flat color.
- showscale=False: hides the colorbar; use a key instead.
- xgap, ygap: the gap between squares in pixels, 1 px at 1,000+ squares and 3-5 px at 100.
- text, hovertemplate: the real value and share of each square in the hover.
- NaN in z, hoverongaps=False: leaves a square empty and silent when the grid isn't full.
- yaxis.autorange="reversed": puts row 0 at the top, so the fill starts at the top left.
- yaxis.scaleanchor="x", scaleratio=1: keeps the cells square.
- constrain="domain", visible=False: a tight grid without axes.
- make_subplots: small multiples, one grid per panel (the electric car and UK election charts).
- layout.shapes (type="path"): person icons for icon arrays, one combined path per color.
- go.Scatter(mode="markers") with marker.symbol: dots or squares as units, fine up to about 1,000.
- xaxis.tickvals, ticktext: labels when a square's position means something, like a year.
More waffle chart examples
Eight more waffle charts built from real public data, each with its source, the technique that makes it work and a prompt to rebuild it.
1. US household wealth
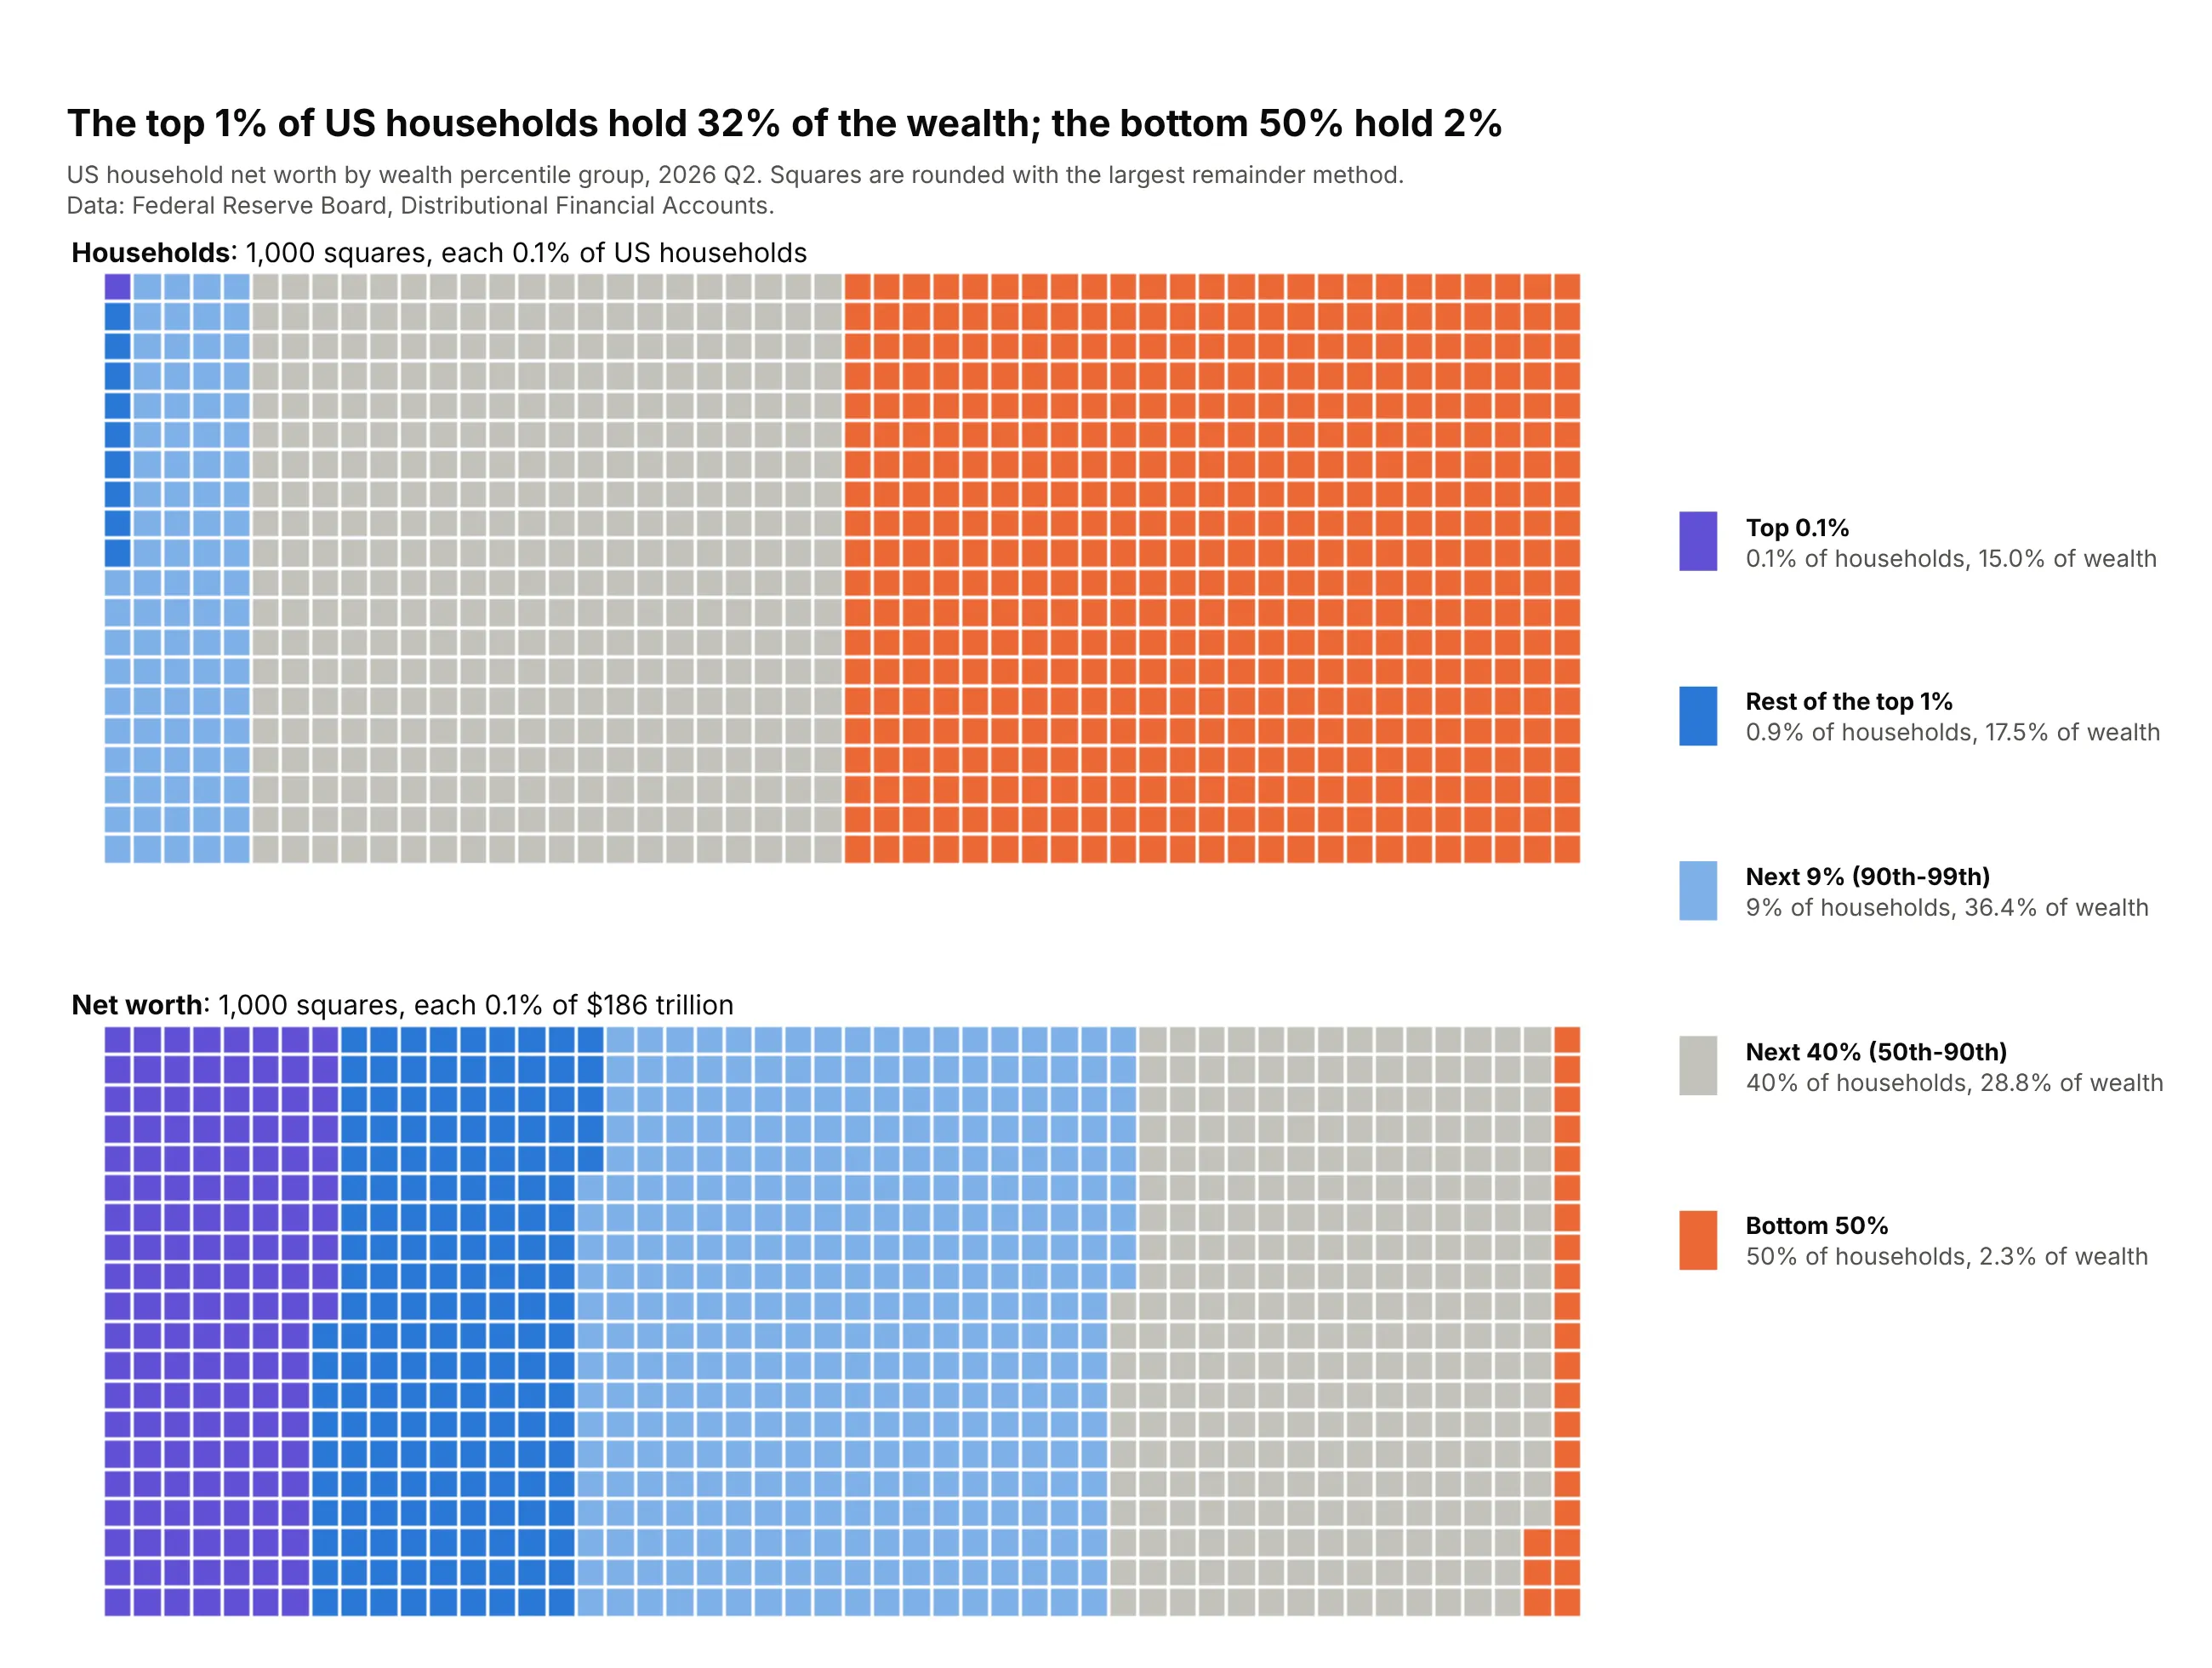
The top 1% of US households hold 32% of the $186 trillion in household net worth, and the bottom 50% hold 2%. Two grids of 1,000 squares, one for households and one for wealth, put both shares in the same unit. Data: Federal Reserve Board, Distributional Financial Accounts, Q2 2026.
Tip: use 1,000 squares so the top 0.1% of households gets one square, and give each group the same color in both grids.
Get the data from the Federal Reserve's Distributional Financial Accounts (federalreserve.gov,dfa.zip, dfa-networth-levels.csv) and shape it into a table (columns: date, group, pop_share_pct,net_worth_musd) for the top 0.1%, rest of the top 1%, next 9%, next 40% and bottom 50%.Build two plotly waffle charts stacked vertically for the latest quarter: 20 x 50 grids of 1,000squares, one of households and one of net worth, filled column by column, the same colors in both,rounded with the largest remainder method. Key with % of households and % of wealth.
2. US bank deposits
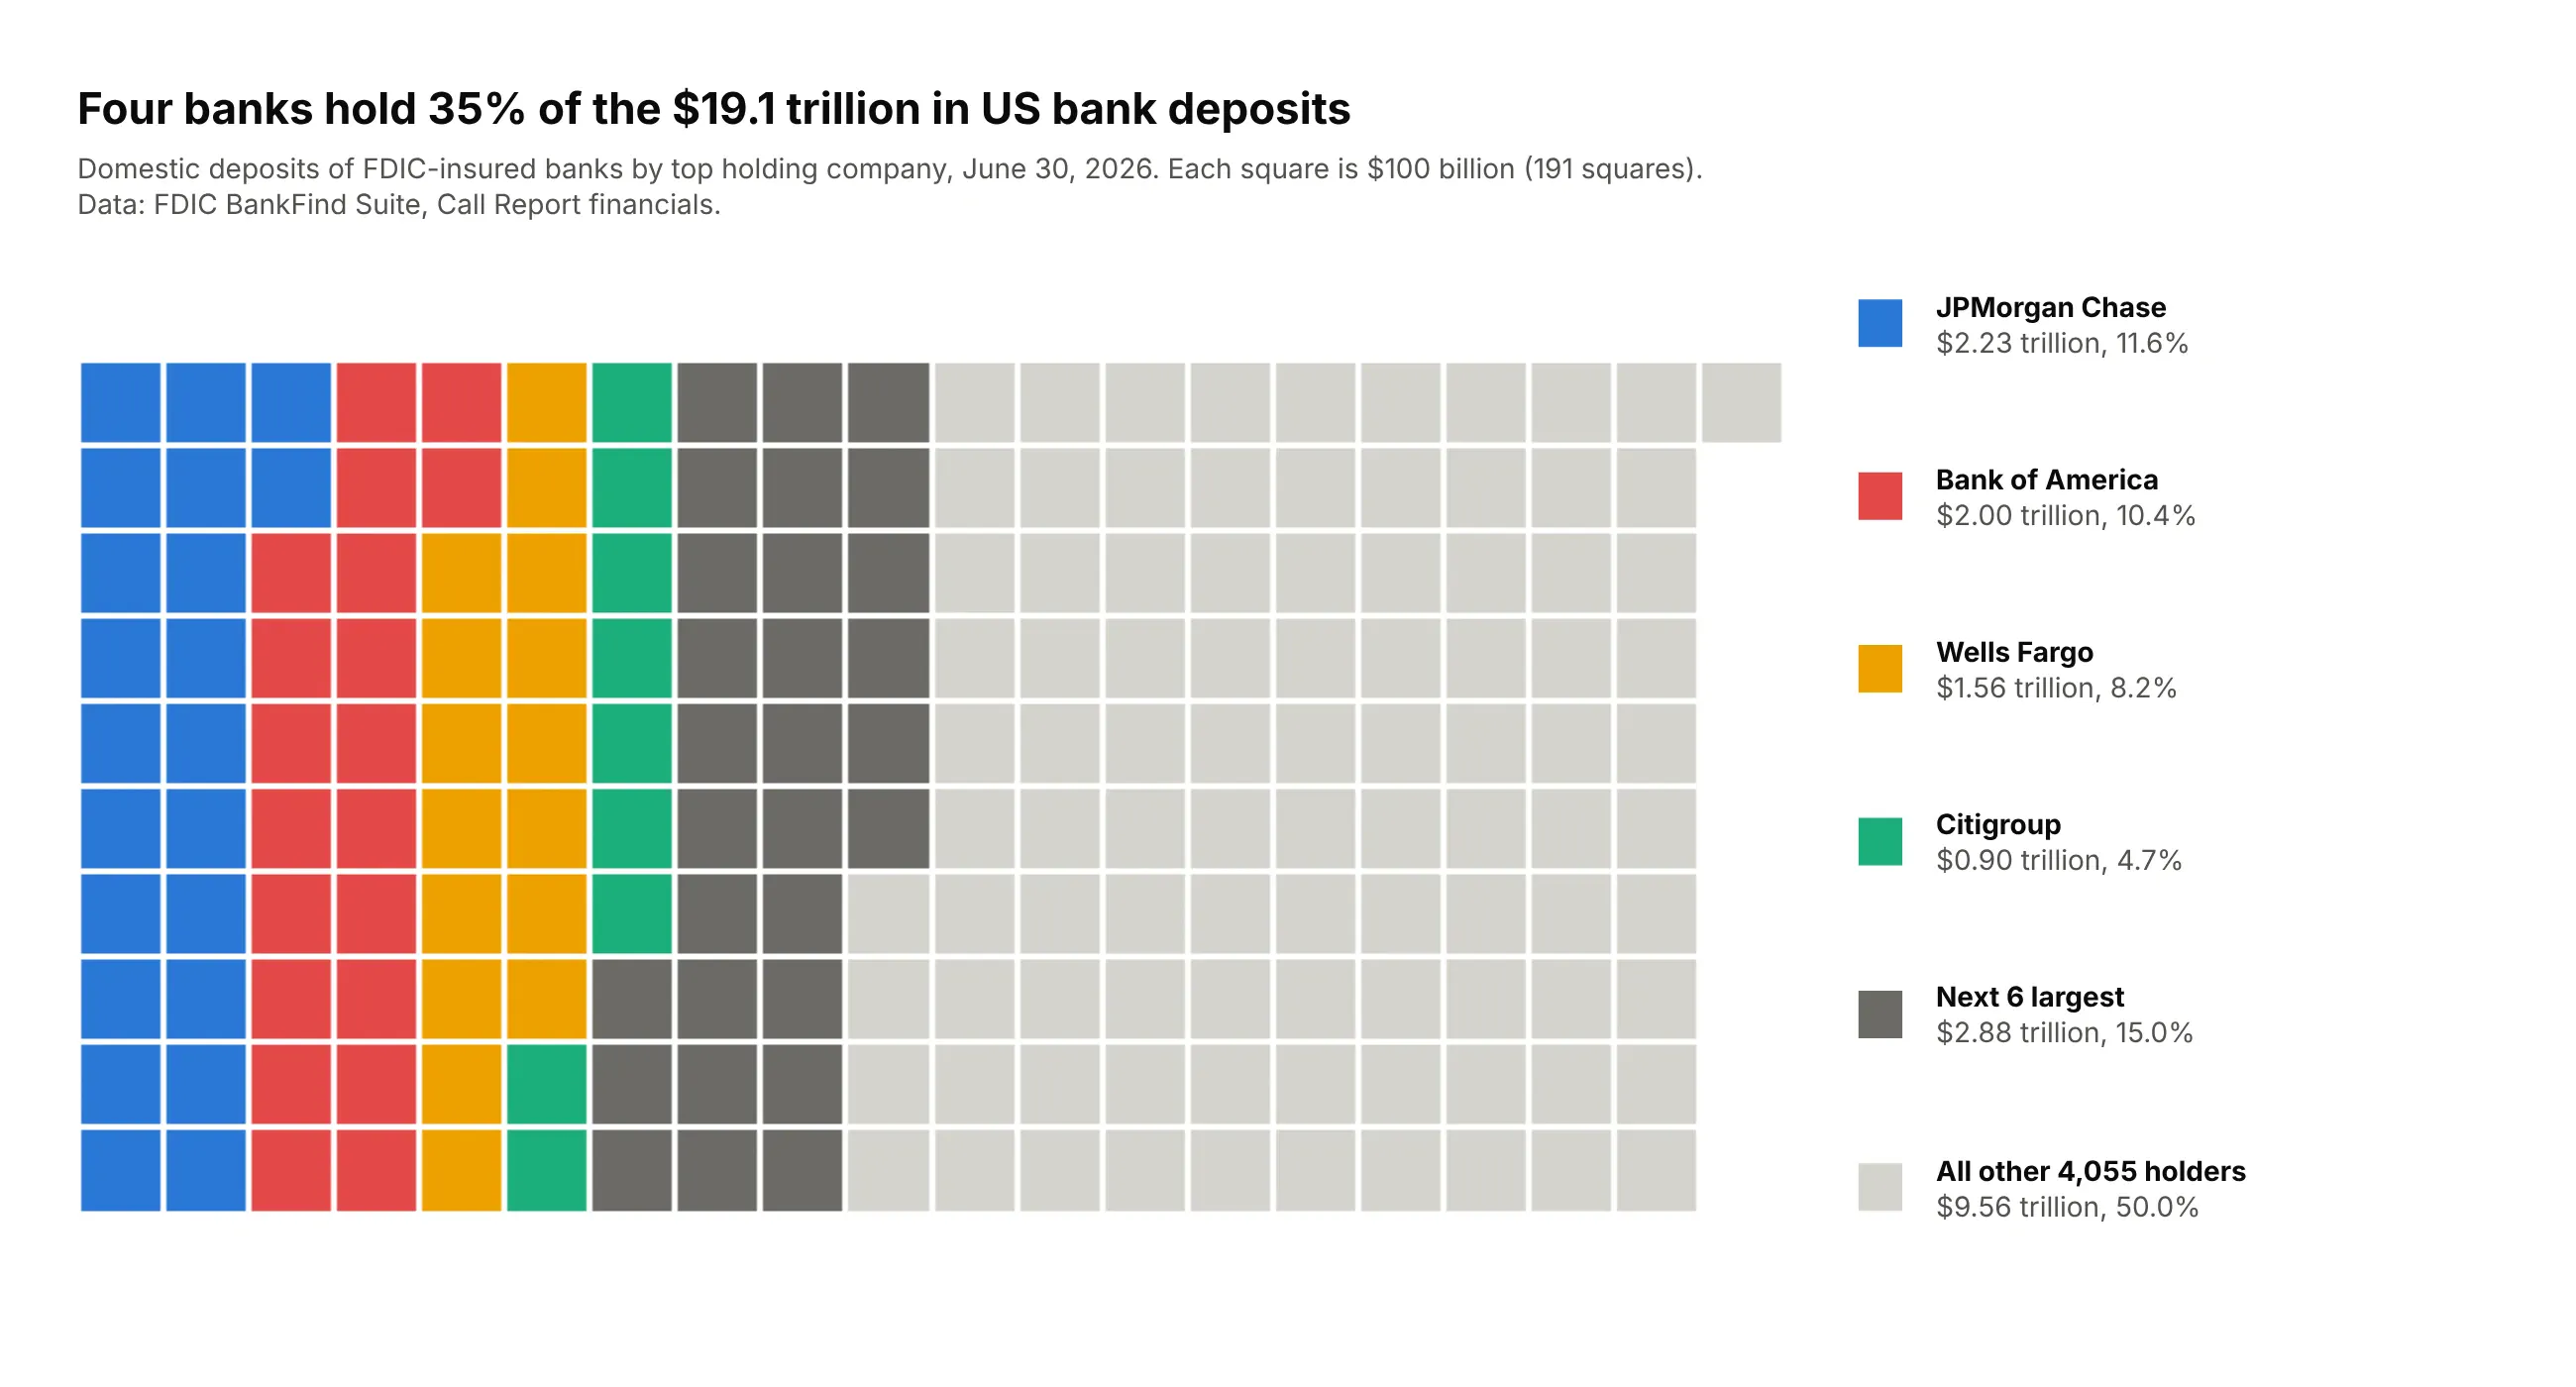
Four banks hold 35% of the $19.1 trillion in US domestic deposits. Each square is $100 billion, so the grid shows the total as well as the shares, and 4,055 other holding companies and banks fill about half of it. Data: FDIC BankFind Suite, Call Report financials, June 30, 2026.
Tip: when the total matters, make each square a fixed amount instead of 1%, and let the number of squares follow the total.
Get the data from the FDIC BankFind Suite API (api.fdic.gov/banks/financials, report date 2026-06-30)and shape it into a table (columns: holder, banks, deposits_busd) by adding up DEPDOM (domesticdeposits) of every insured bank by its top holding company (RSSDHCR).Build a plotly waffle chart with one square per $100 billion, 10 rows, filled column by column:the four largest holders in colors, the next six in dark gray, the rest in light gray.
3. Household budget
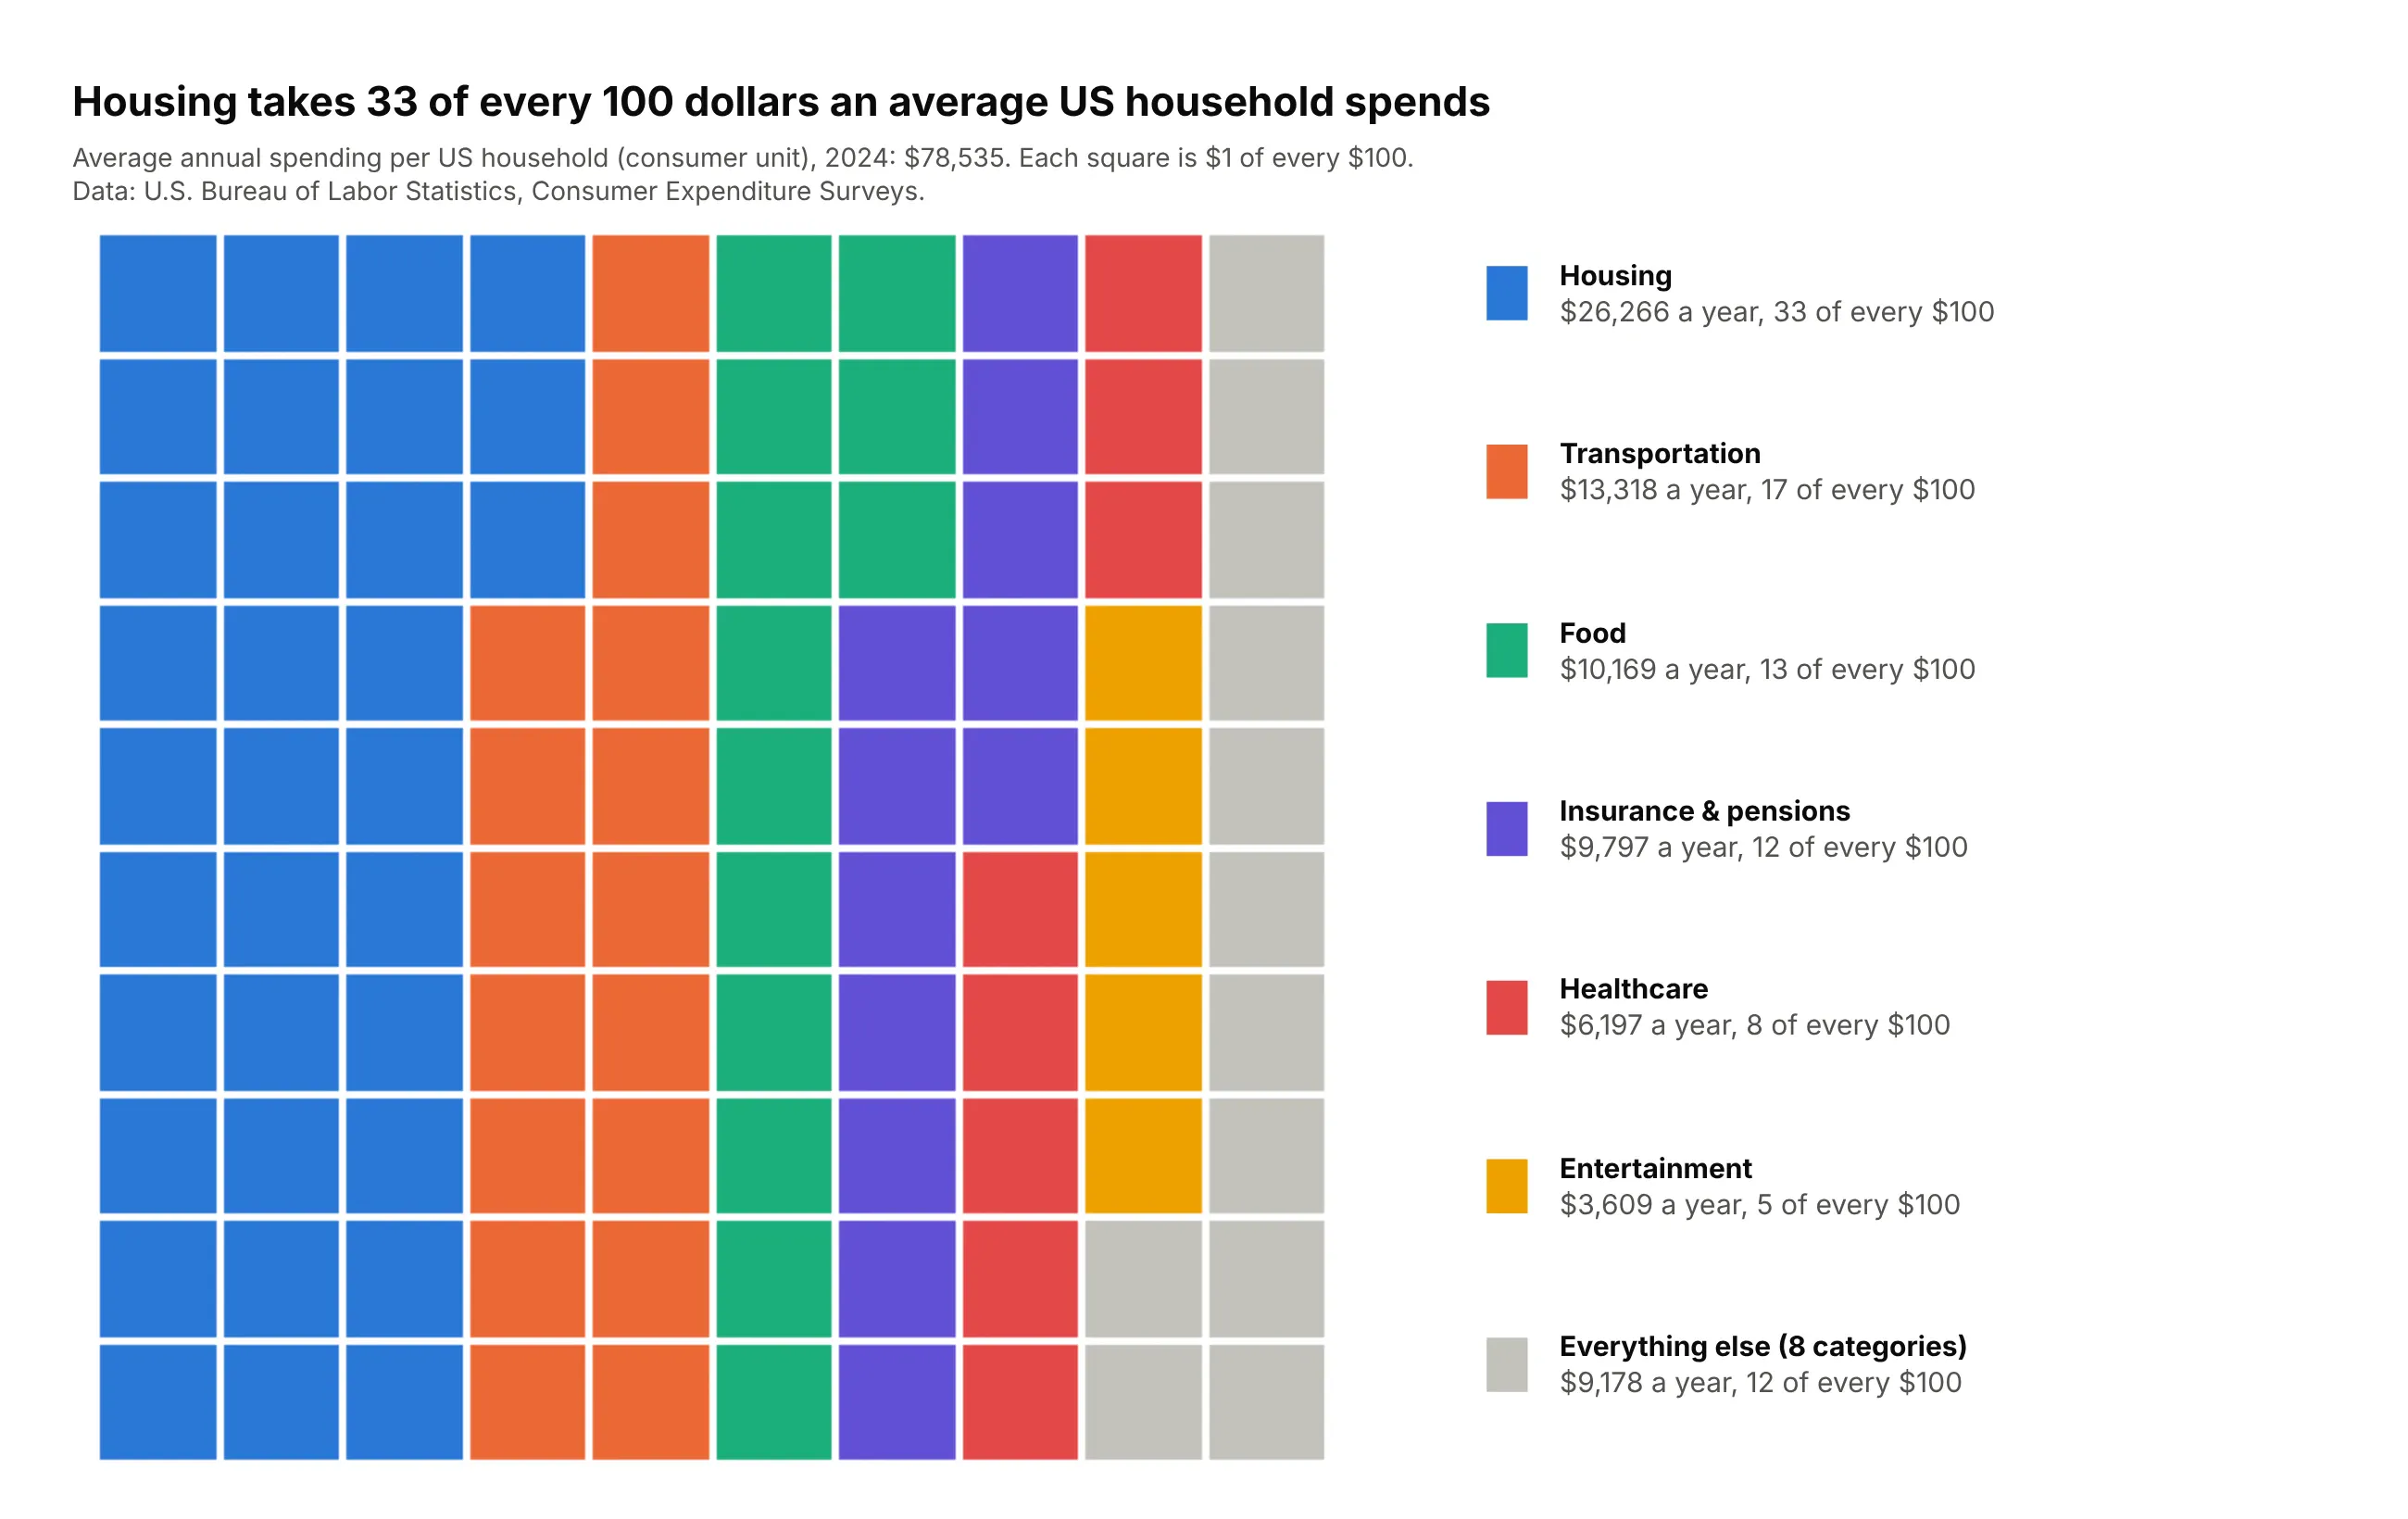
Housing takes 33 of every 100 dollars an average US household spends, out of $78,535 in 2024. Transportation and food add 30 more, so three categories fill 63 squares. Data: U.S. Bureau of Labor Statistics, Consumer Expenditure Surveys, 2024.
Tip: fold the eight smallest categories into "Everything else" before rounding and fill by column, so every category is one compact band.
Get the data from the BLS Consumer Expenditure Surveys (bls.gov/cex, series CXU<item>LB0101M for allconsumer units, 2024) and shape it into a table (columns: category, usd) with the 14 major spendingcategories and total expenditures.Build a plotly waffle chart: the six largest categories and "Everything else", 10 x 10, filledcolumn by column, rounded with the largest remainder method. Key with $ a year and "of every $100".
4. Paxlovid and hospitalization
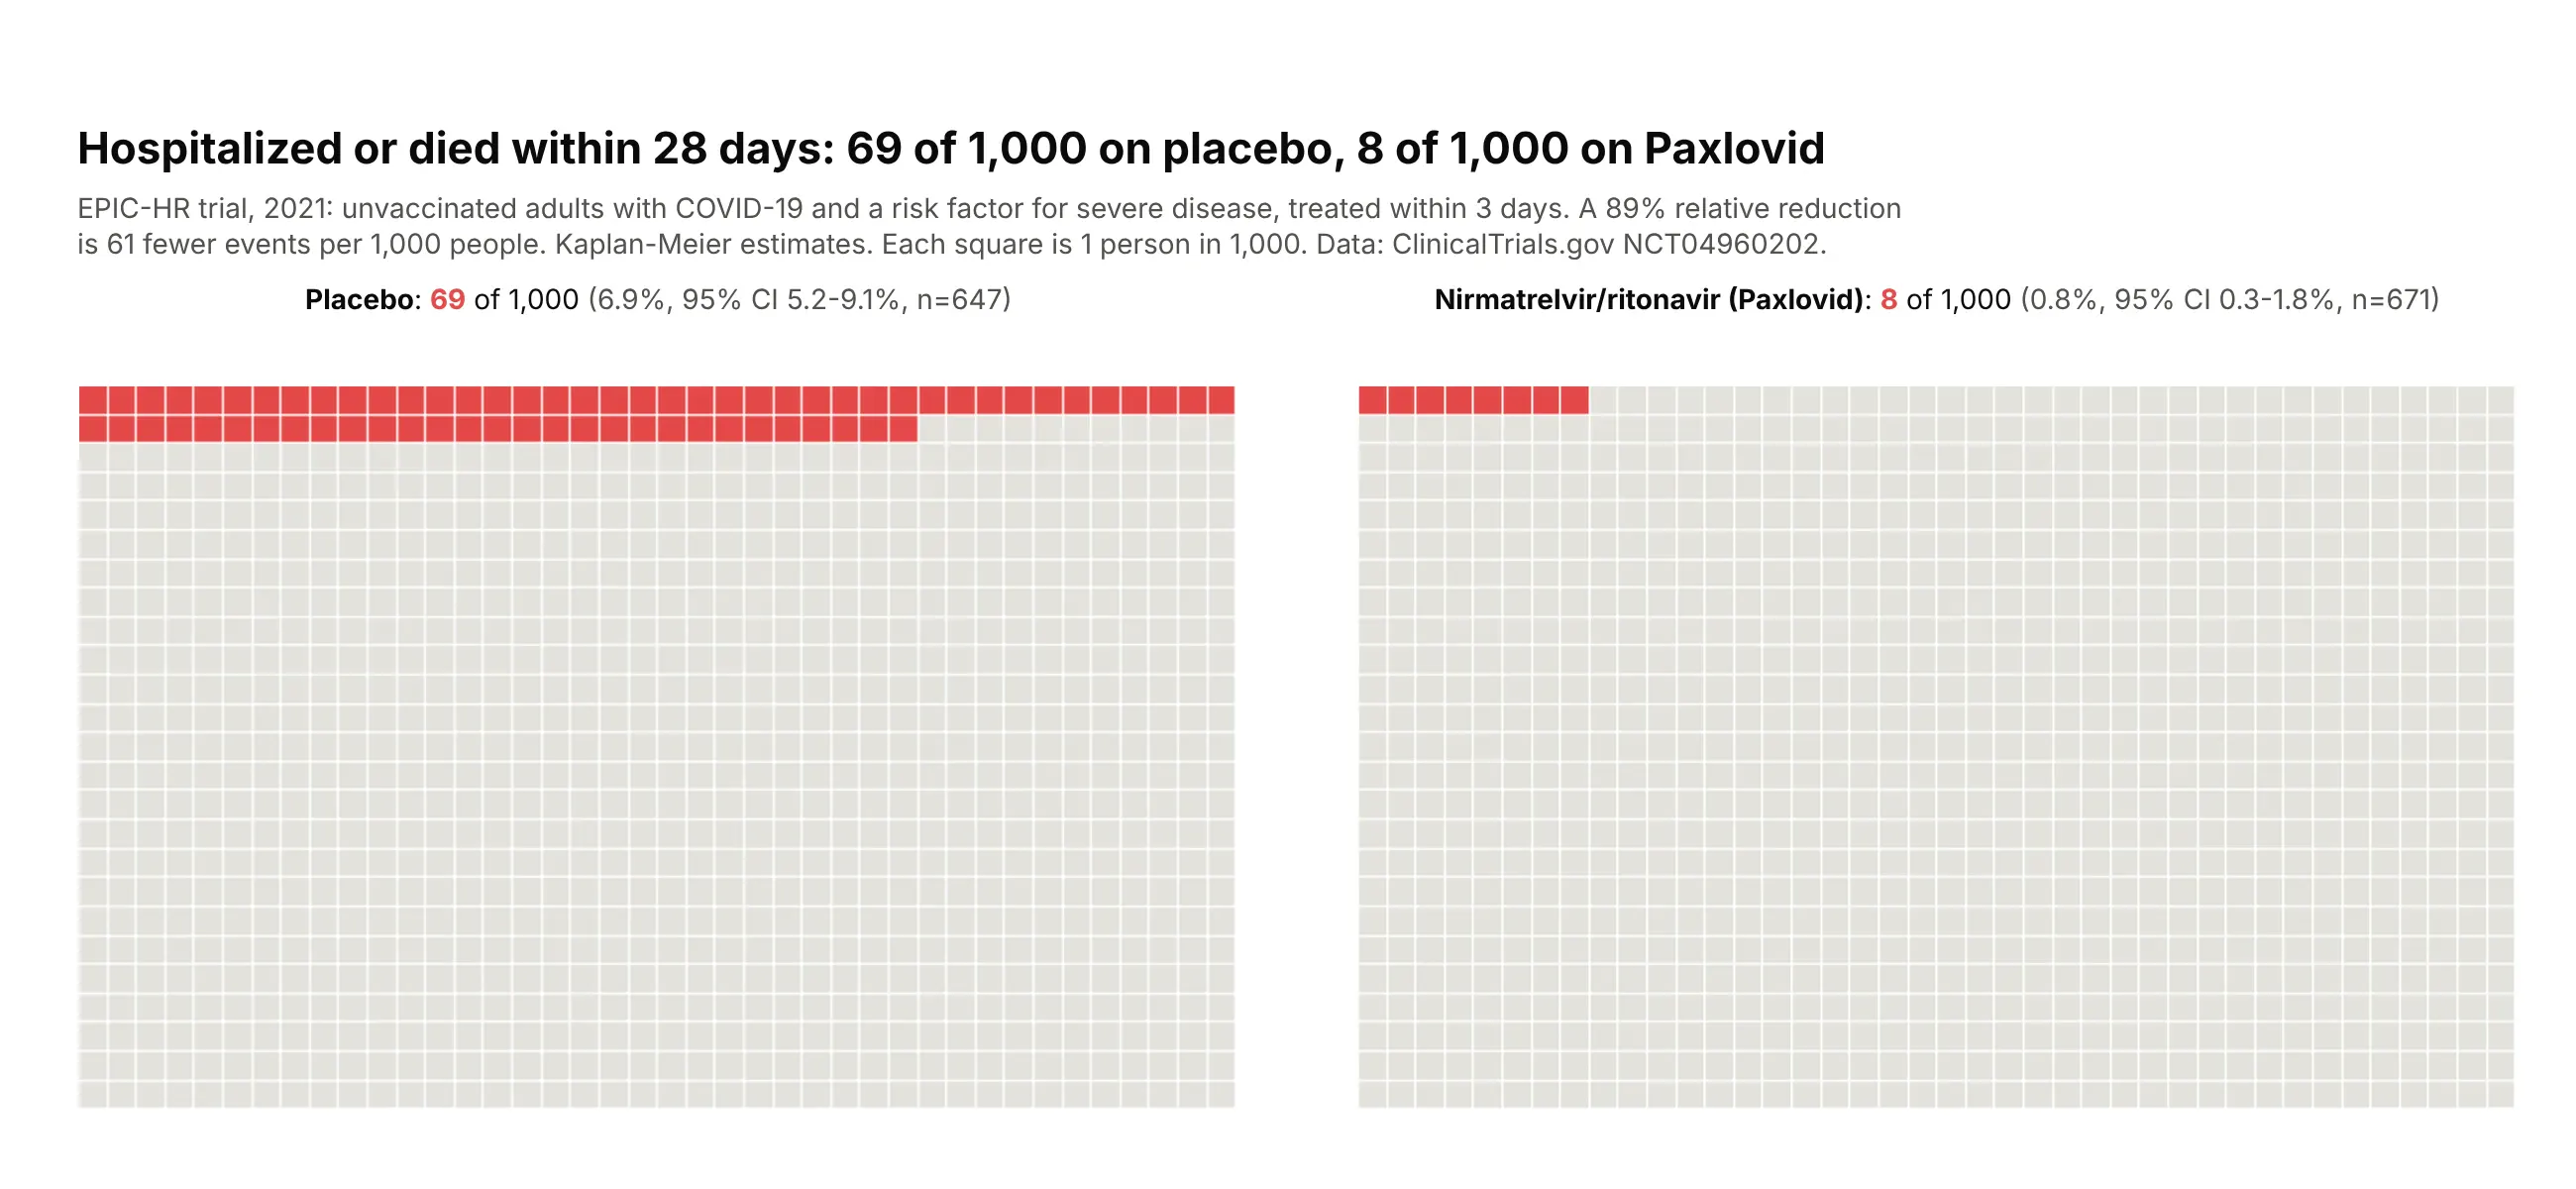
In EPIC-HR, 69 of every 1,000 unvaccinated high-risk adults on placebo were hospitalized or died within 28 days, against 8 of 1,000 on Paxlovid. The 89% relative reduction is 61 fewer events per 1,000 people. Data: ClinicalTrials.gov NCT04960202 (EPIC-HR, NEJM 2022, doi:10.1056/NEJMoa2118542), primary outcome, 2021.
Tip: for risks under 10%, use 1,000 squares per arm, which shows both the relative reduction and how small the absolute risk is.
Get the data from ClinicalTrials.gov study NCT04960202 (EPIC-HR, nirmatrelvir/ritonavir vs placebo,results API at clinicaltrials.gov/api/v2/studies/NCT04960202) and shape it into a table (columns:population, arm, n, pct, ci_low, ci_high) from the primary outcome (hospitalization or death through day 28).Build two plotly waffle charts side by side for the mITT population: 25 x 40 grids of 1,000 squares,events in red filled from the top left, the rest light gray. Label each with the count per 1,000,the percentage, the 95% CI and n.
5. US population by race and Hispanic origin
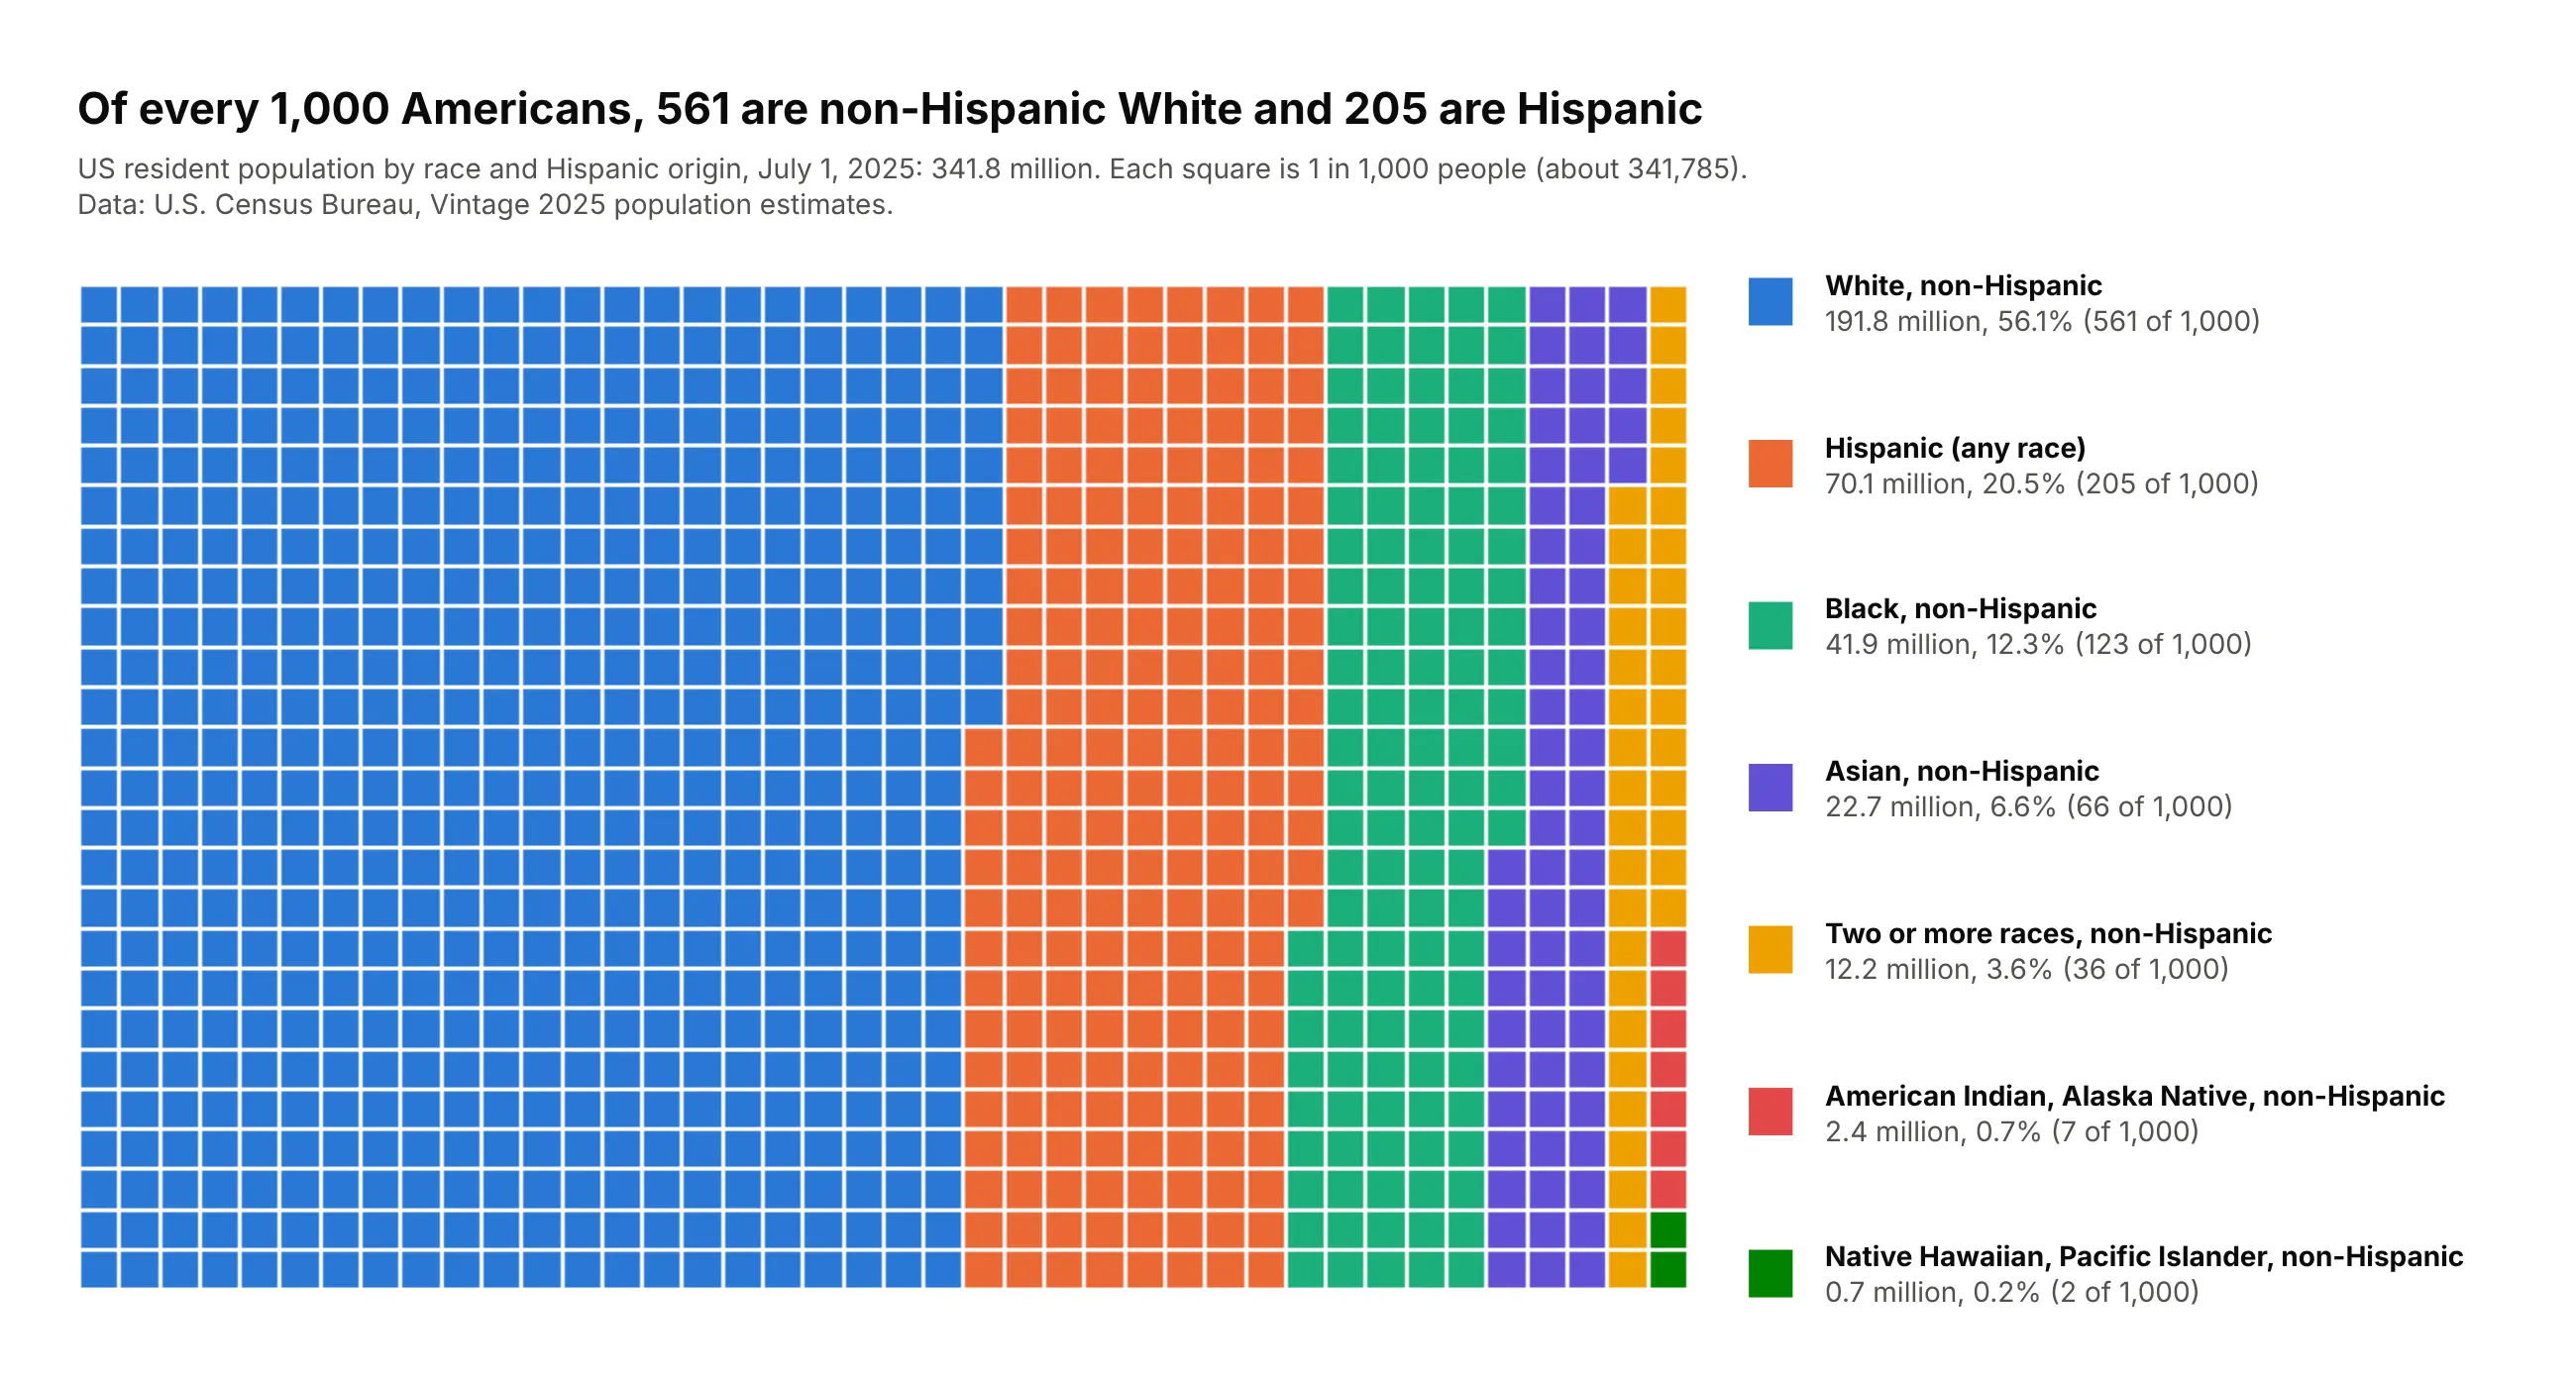
Of every 1,000 Americans in 2025, 561 are non-Hispanic White and 205 are Hispanic. With 1,000 squares, the 0.7 million Native Hawaiian and Pacific Islander Americans still get 2 squares. Data: U.S. Census Bureau, Vintage 2025 population estimates, July 1, 2025.
Tip: switch to 1,000 squares when a category is under 1%, and give the small groups strong colors of their own.
Get the data from the Census Bureau's Vintage 2025 national population estimates by age, sex, raceand Hispanic origin (www2.census.gov/programs-surveys/popest/datasets/2020-2025/national/asrh/,nc-est2025-alldata-r-file12.csv) and shape it into a table (columns: group, age_group, people).Build a plotly waffle chart of 1,000 squares (25 x 40) for all ages, filled column by column,largest group first, rounded with the largest remainder method. Key with millions, % and squares.
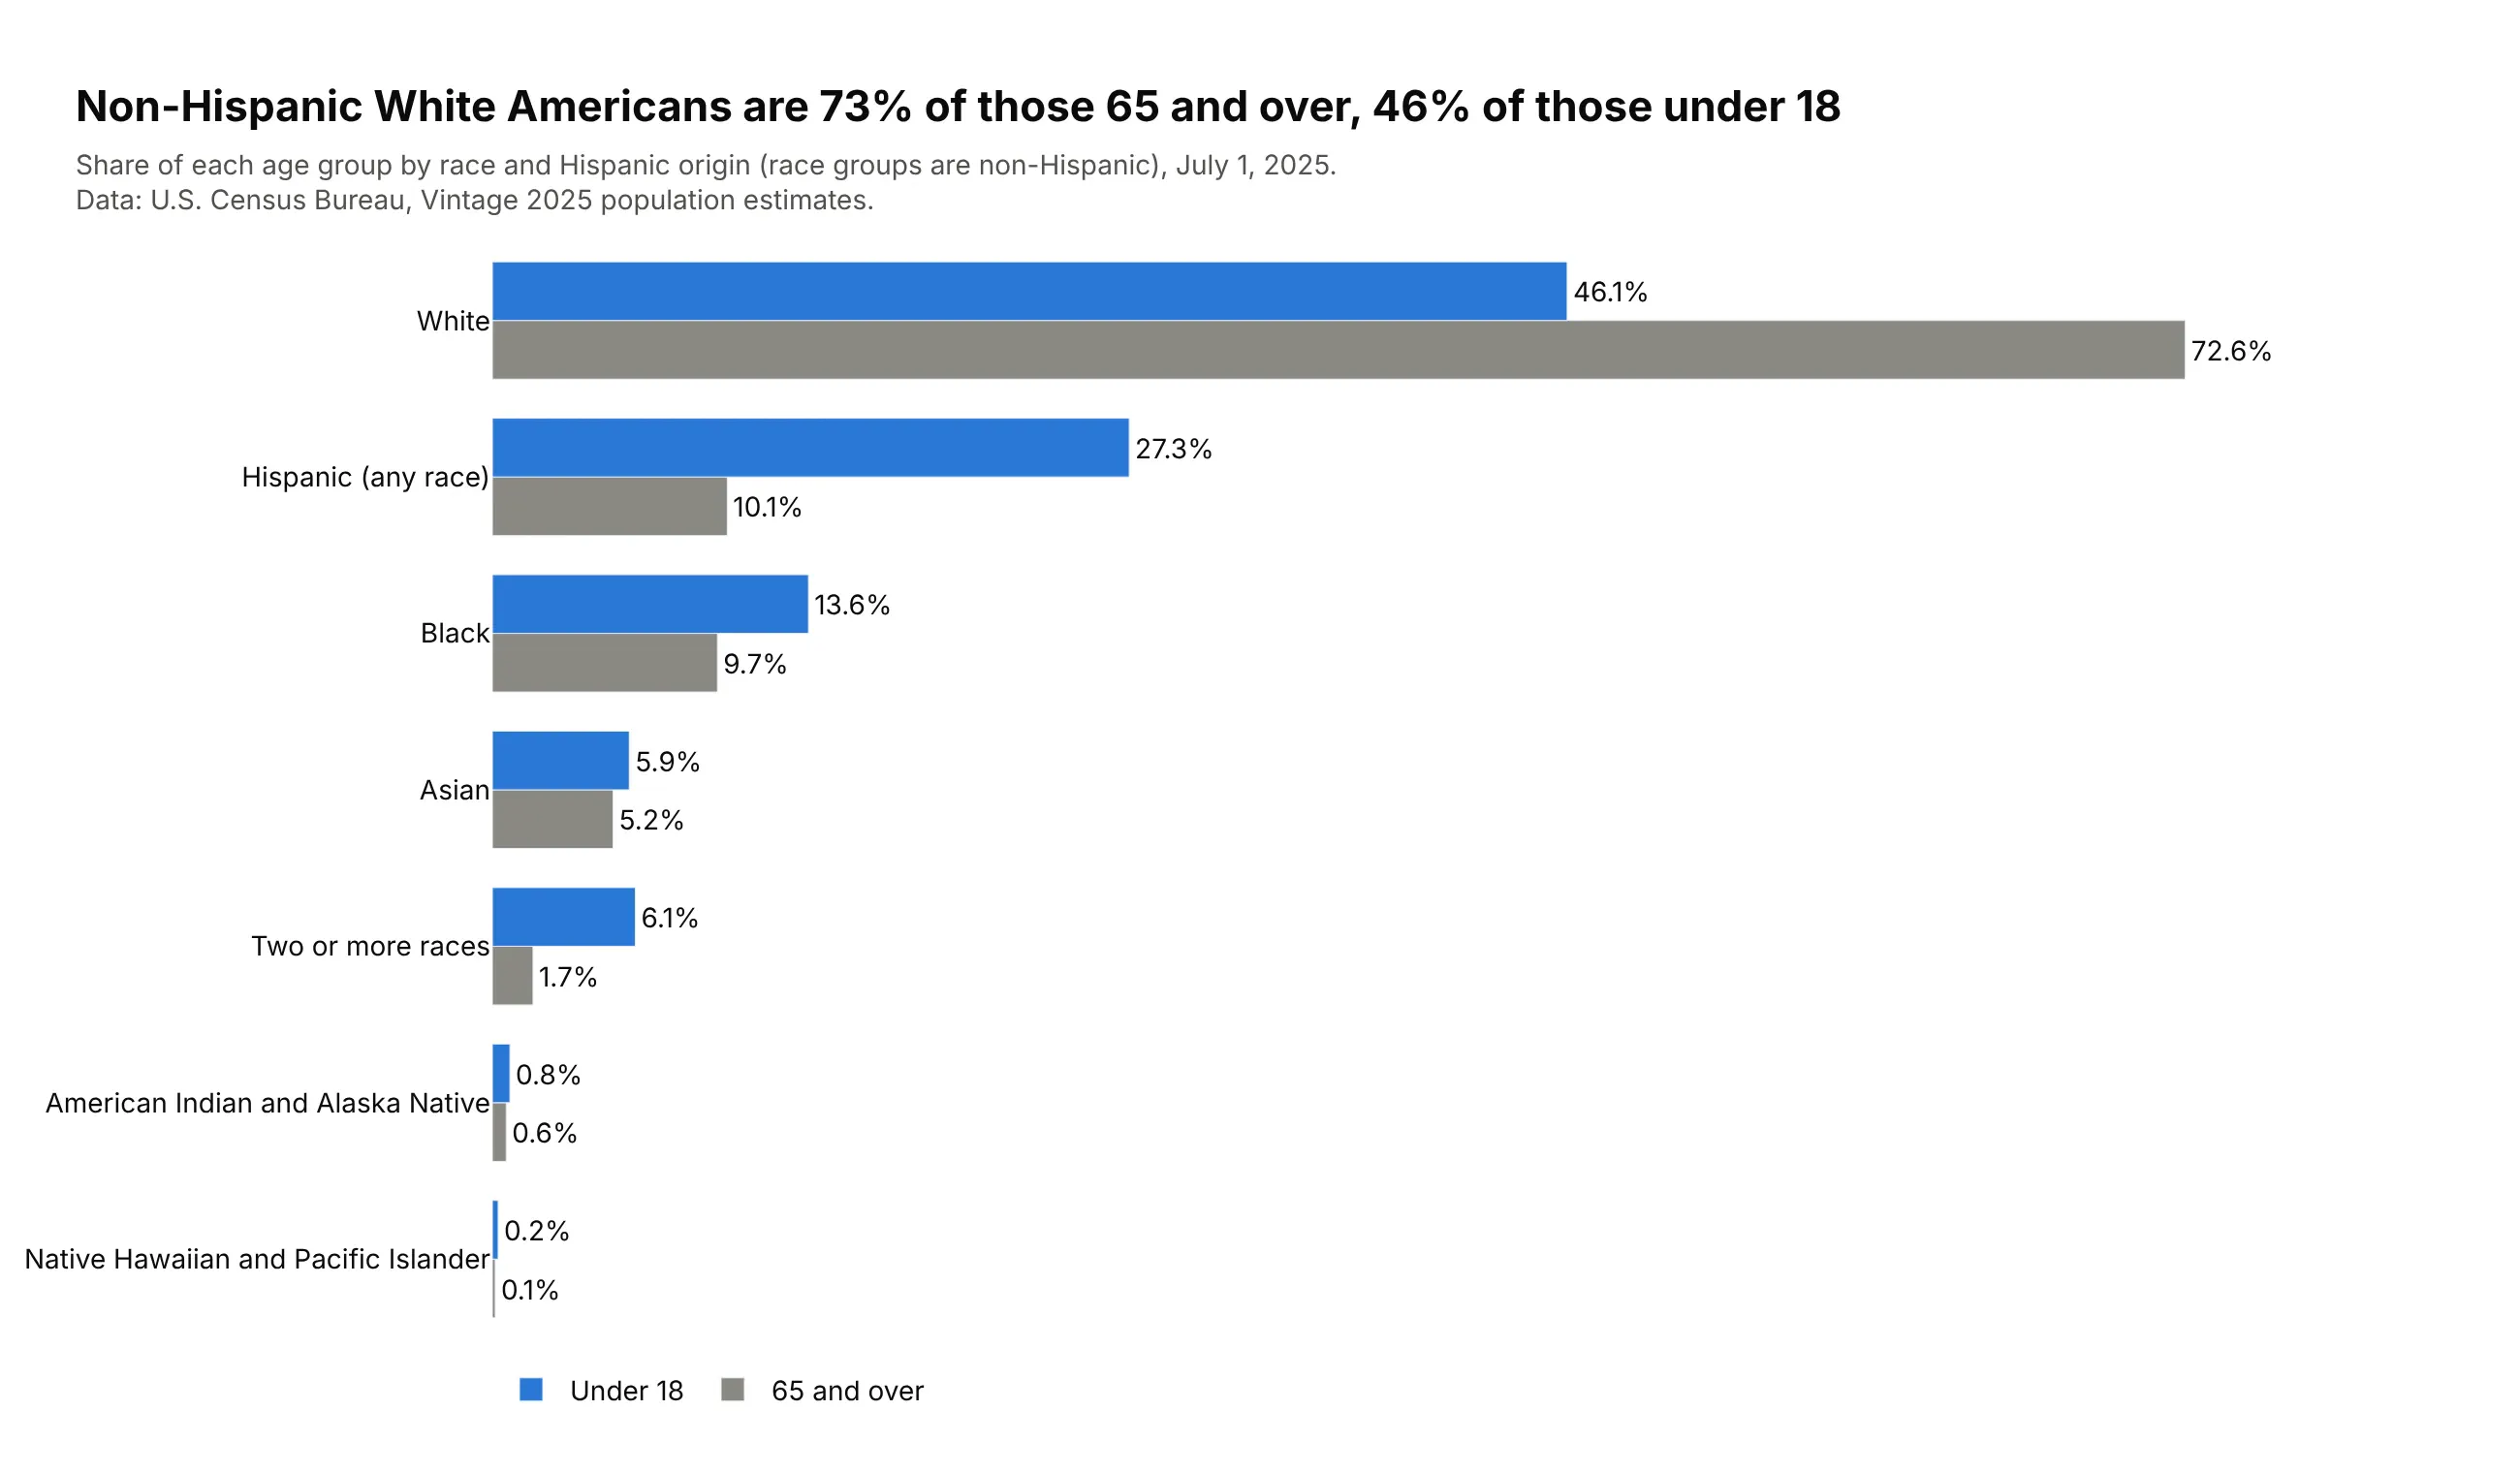
Another way to see it: grouped bars compare age groups better than two waffles: non-Hispanic White Americans are 73% of those 65 and over and 46% of those under 18.
6. Developers and AI tools
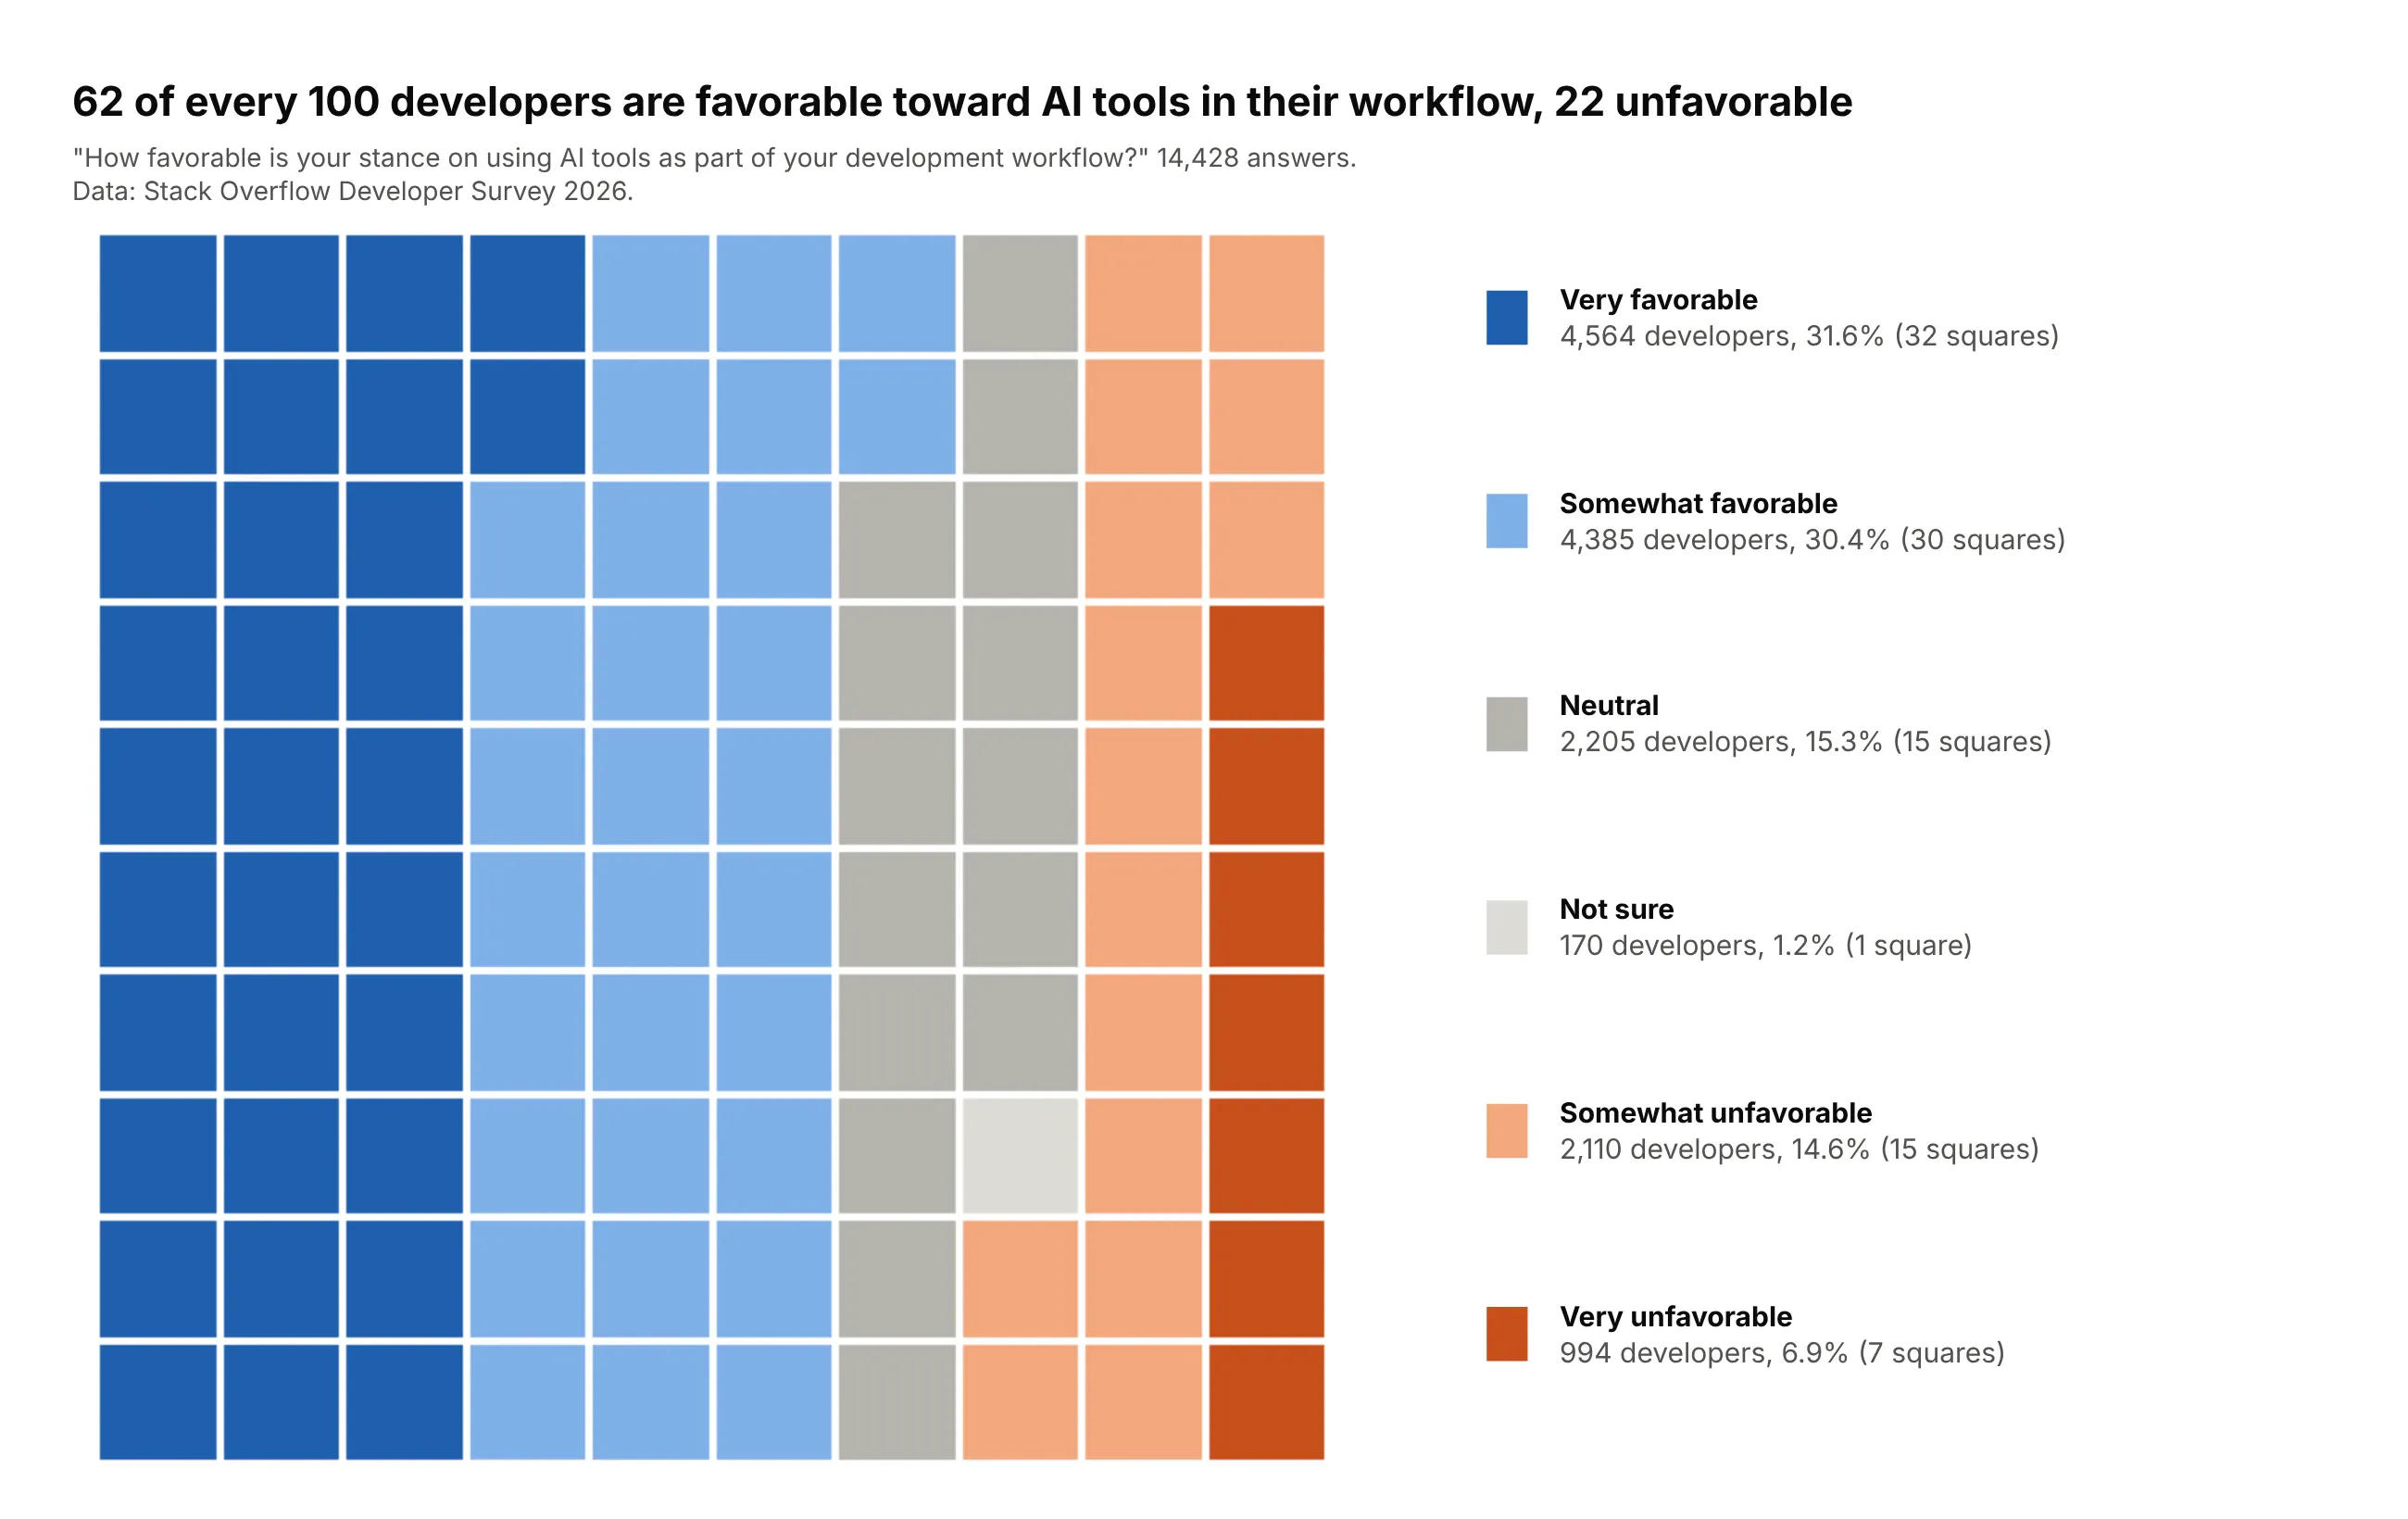
62 of every 100 developers are favorable toward AI tools in their workflow and 22 unfavorable, among 14,428 answers to the Stack Overflow 2026 survey. Filled column by column in scale order, the grid reads like a diverging bar. Data: Stack Overflow Developer Survey 2026.
Tip: order survey answers like the scale and fill by column; blues for favorable, oranges for unfavorable, grays in the middle.
Get the data from the Stack Overflow Developer Survey 2026 public responses (survey.stackoverflow.co,survey_results_public.csv) and shape it into a table (columns: answer, experience, respondents) fromthe AISentiment question, overall and by years of work experience.Build a plotly waffle chart of the overall answers: 10 x 10, in scale order from very favorable tovery unfavorable, filled column by column. Round favorable, neutral and unfavorable first, then the answers.
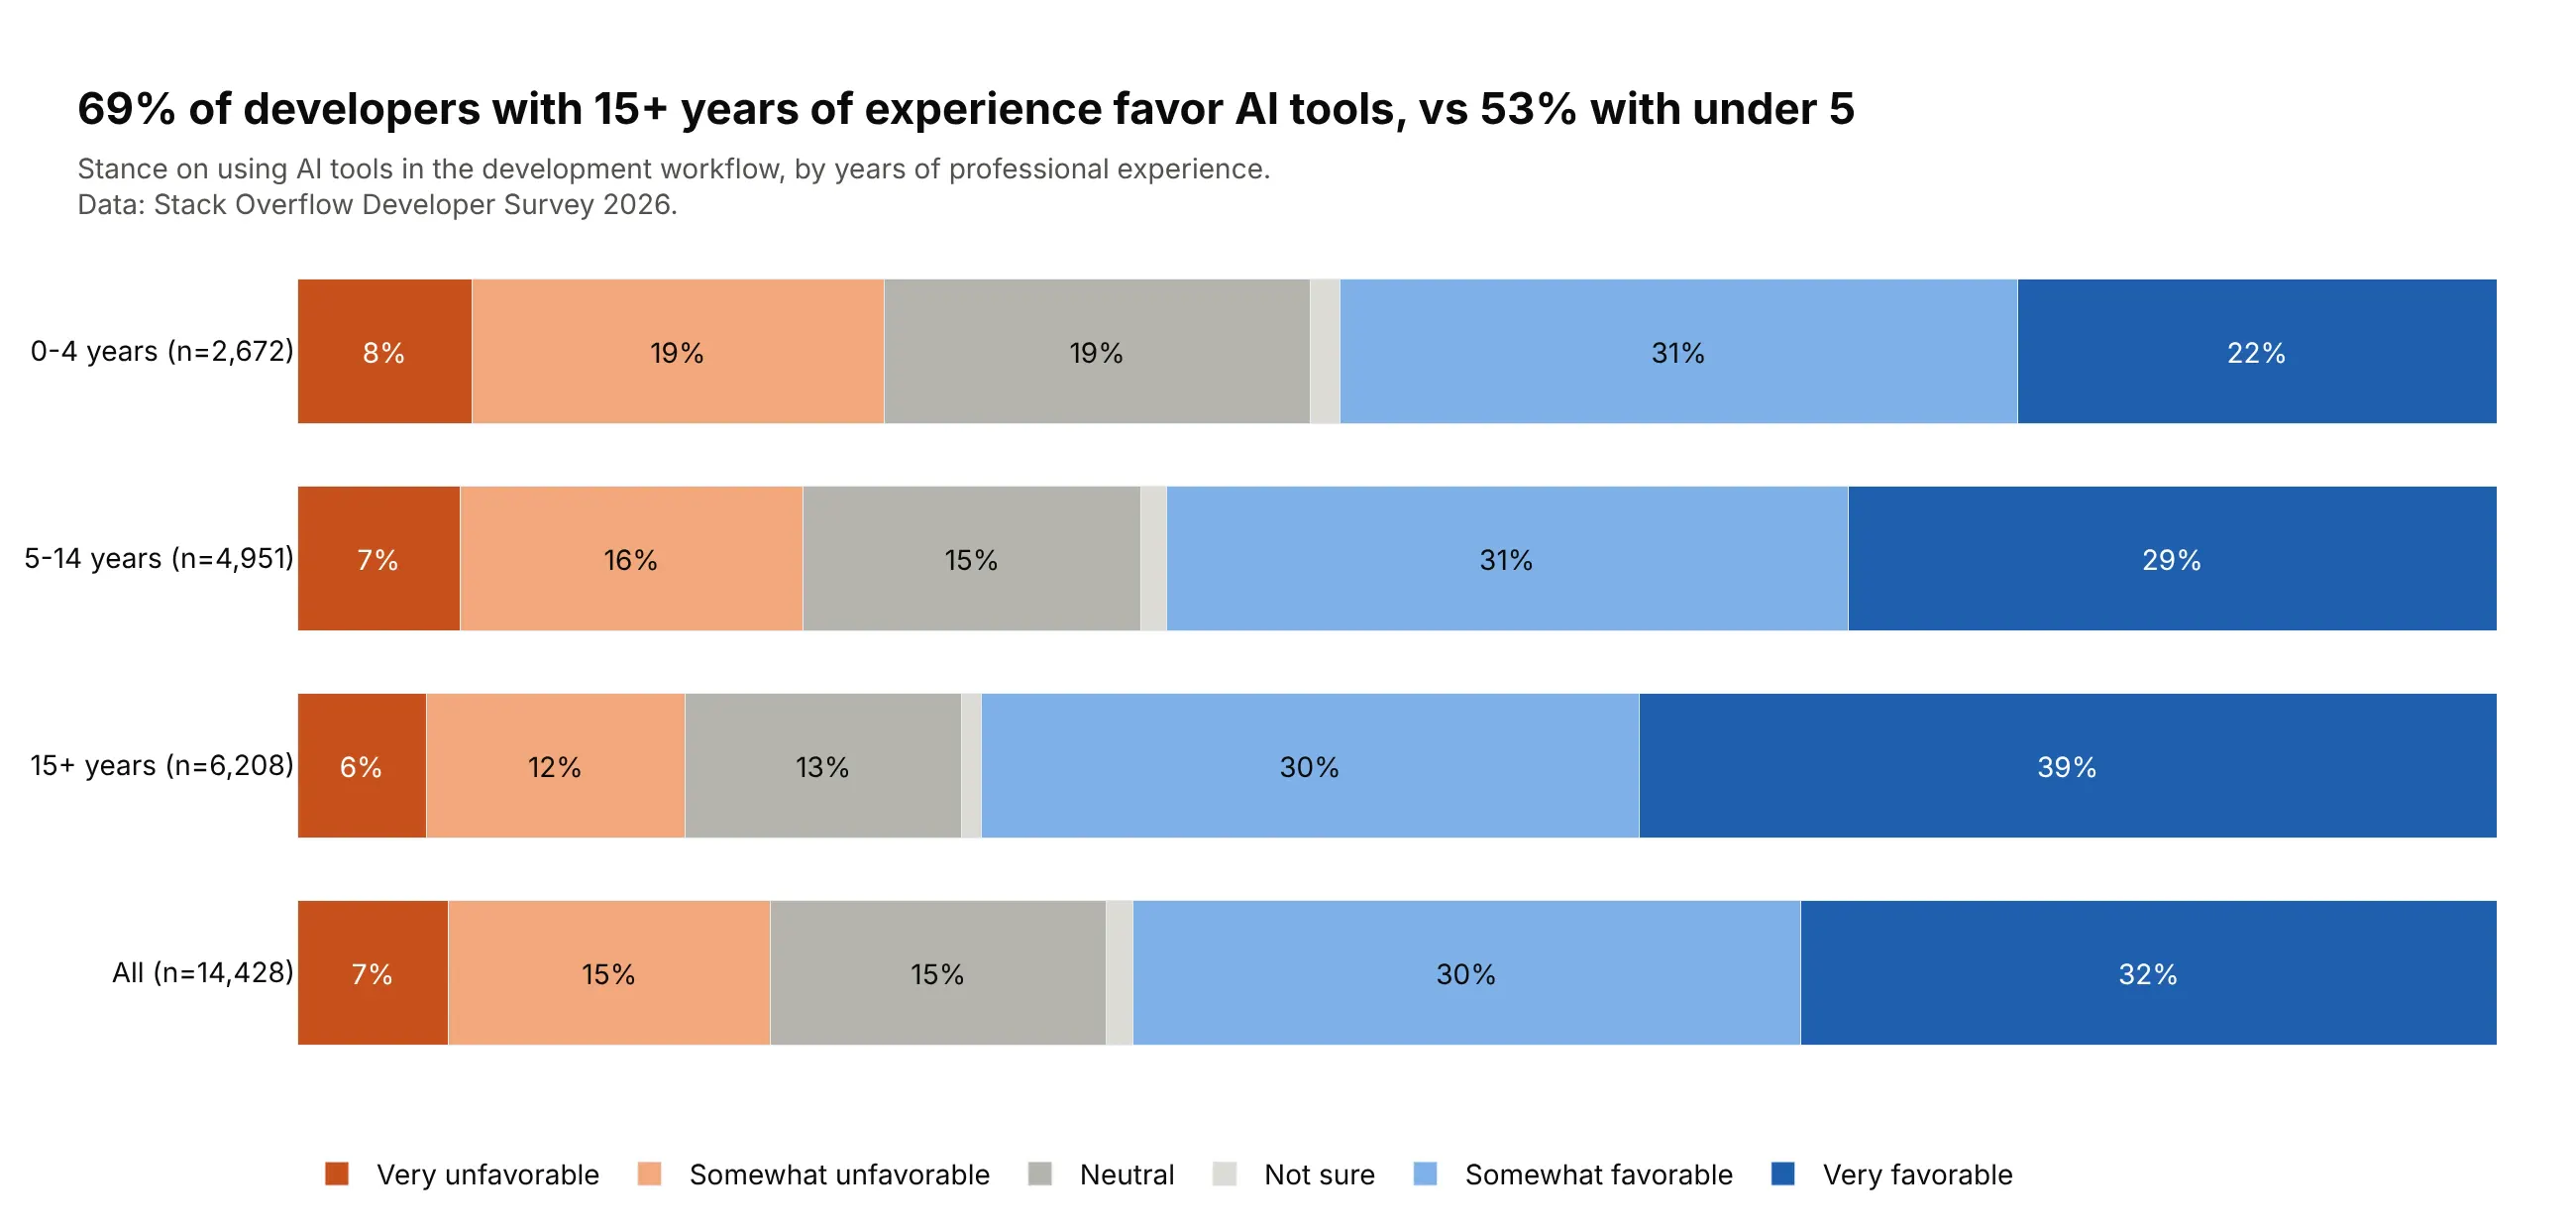
Another way to see it: stacked bars by experience compare groups on the same scale: 69% of developers with 15 or more years of experience are favorable, against 53% of those with under 5.
7. Search engine market share
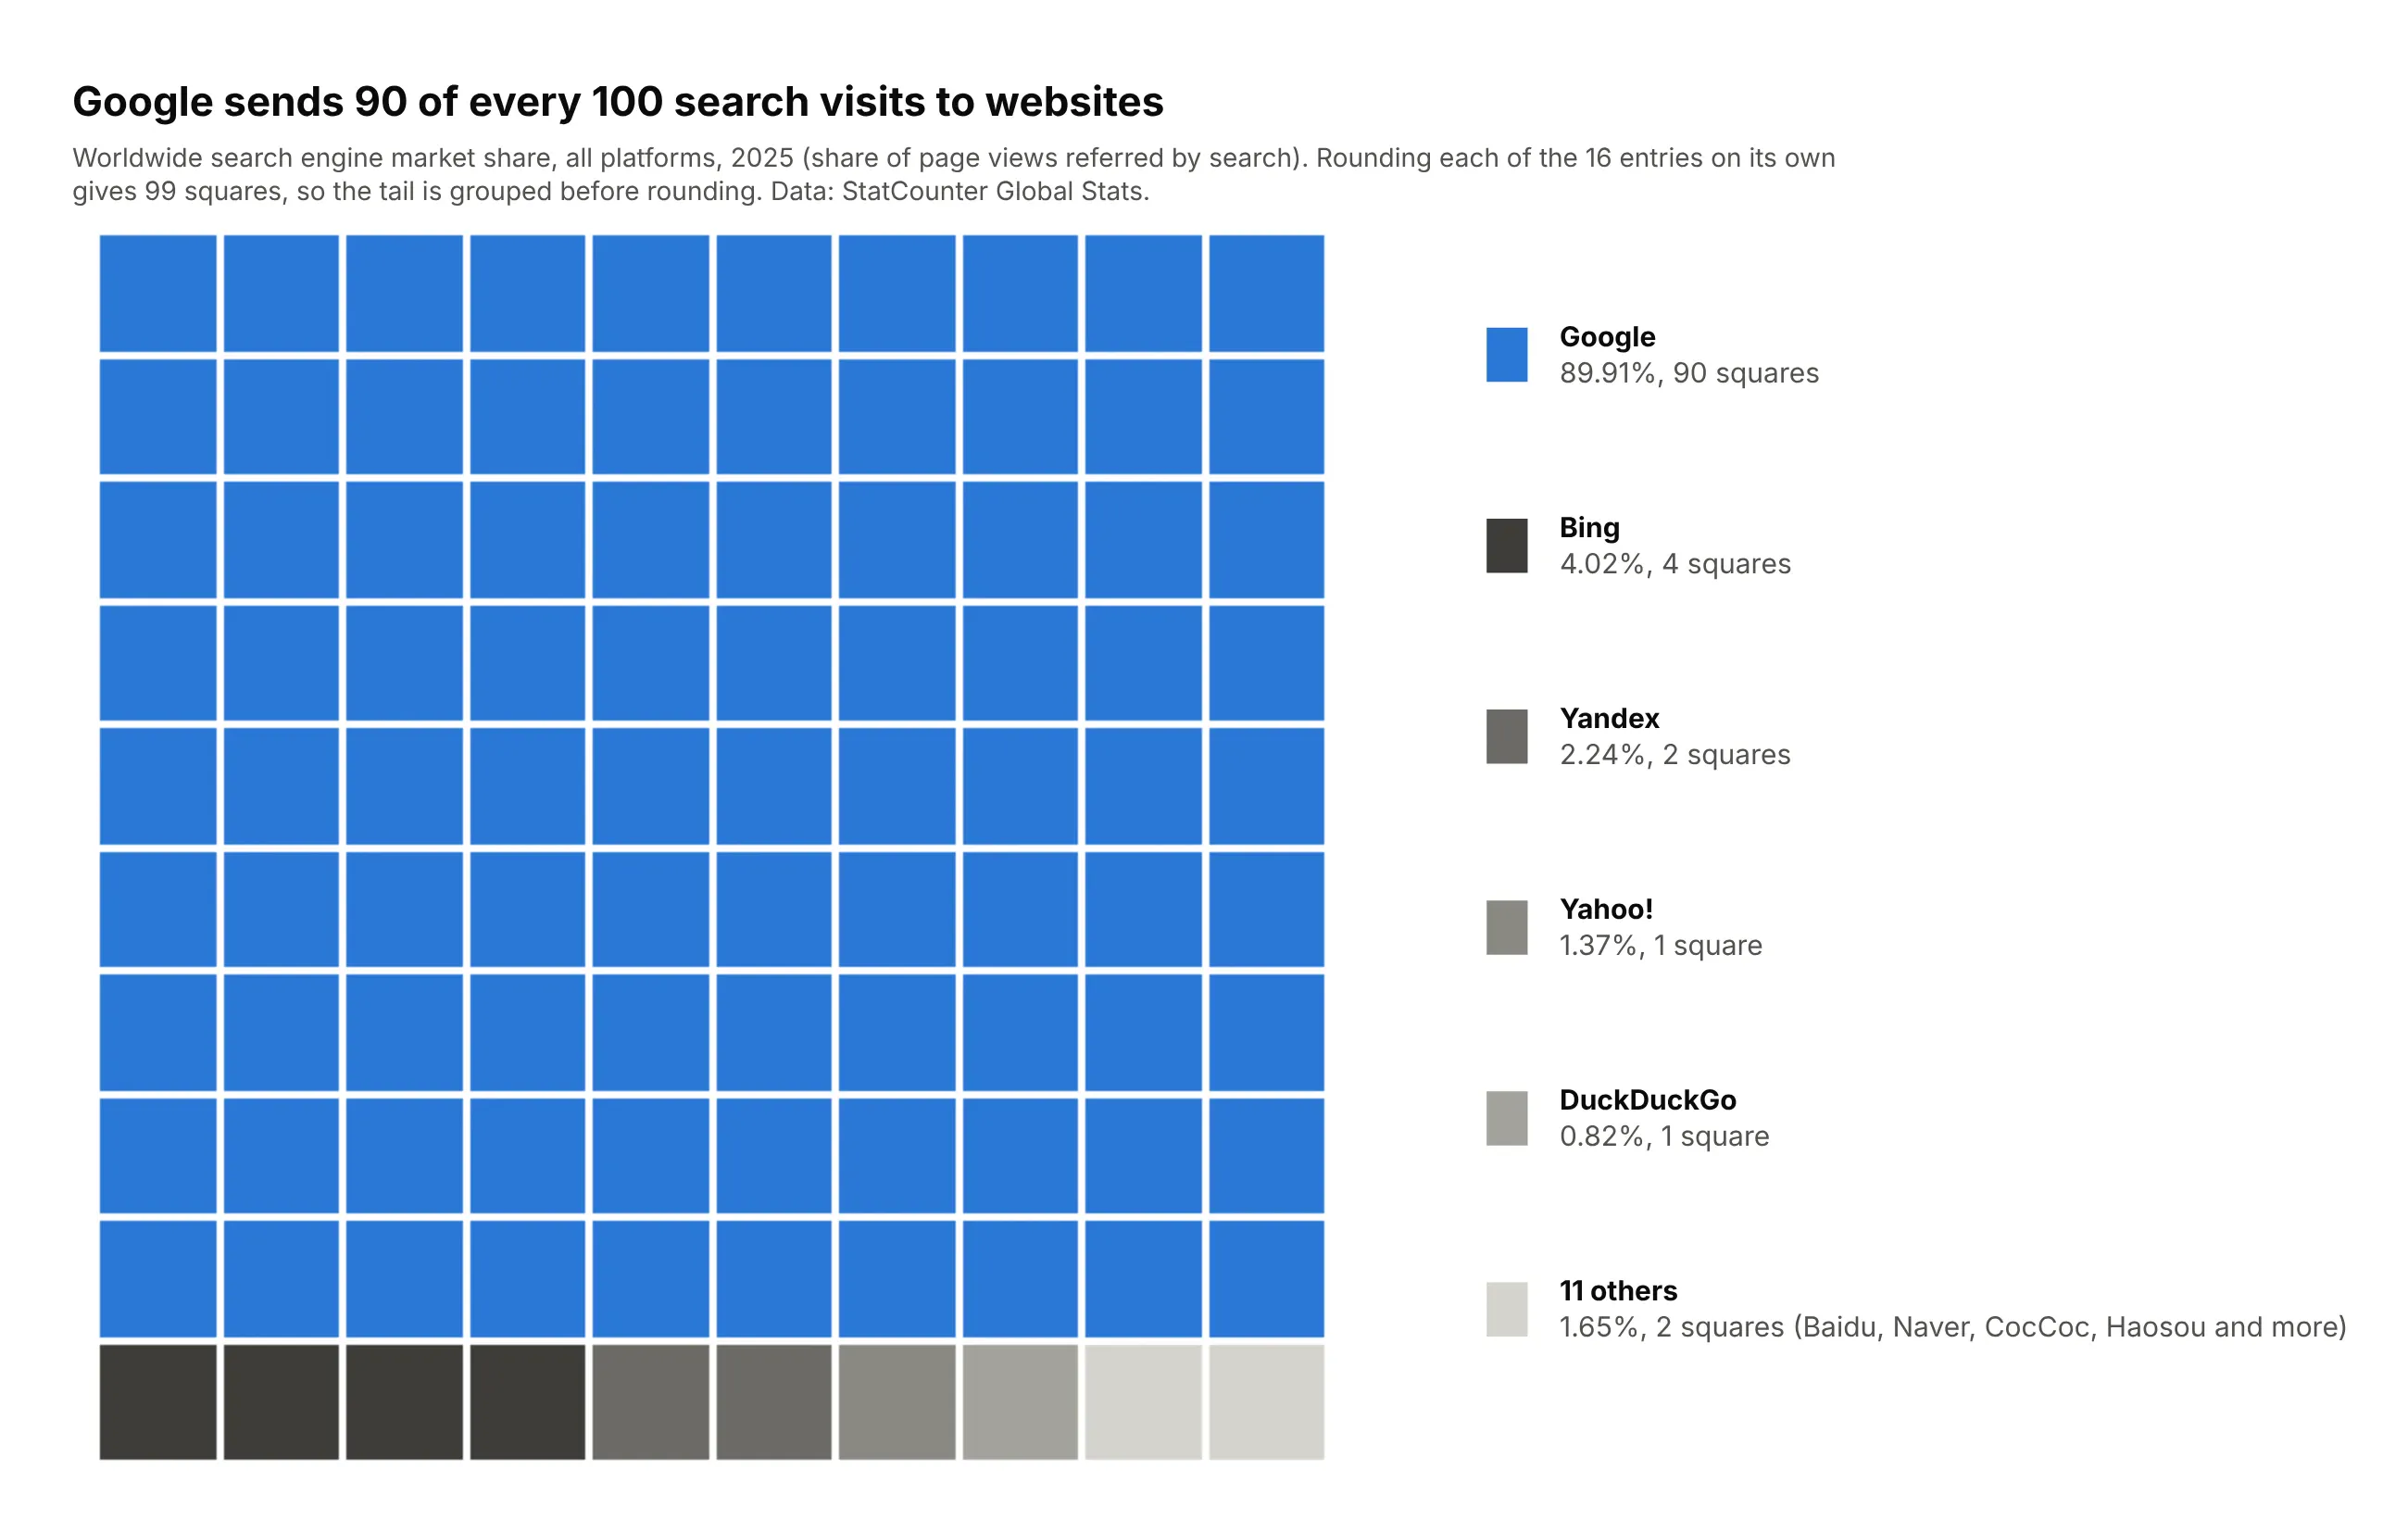
Google sent 90 of every 100 search visits to websites in 2025, and Bing, the next largest, sent 4. Grouping the 11 smallest entries before rounding gives them 2 squares; rounding all 16 one by one gives 99 squares in total. Data: StatCounter Global Stats, search engine market share, worldwide, 2025.
Tip: give the dominant category the only strong color and its rivals shades of gray.
Get the data from StatCounter Global Stats (gs.statcounter.com, search engine market share, allplatforms, worldwide, yearly CSV for 2025) and shape it into a table (columns: engine, share_pct).Build a plotly waffle chart, 10 x 10: Google, Bing, Yandex, Yahoo!, DuckDuckGo and the rest groupedbefore rounding with the largest remainder method. Google in blue, the others in grays.
8. Men's Grand Slam champions
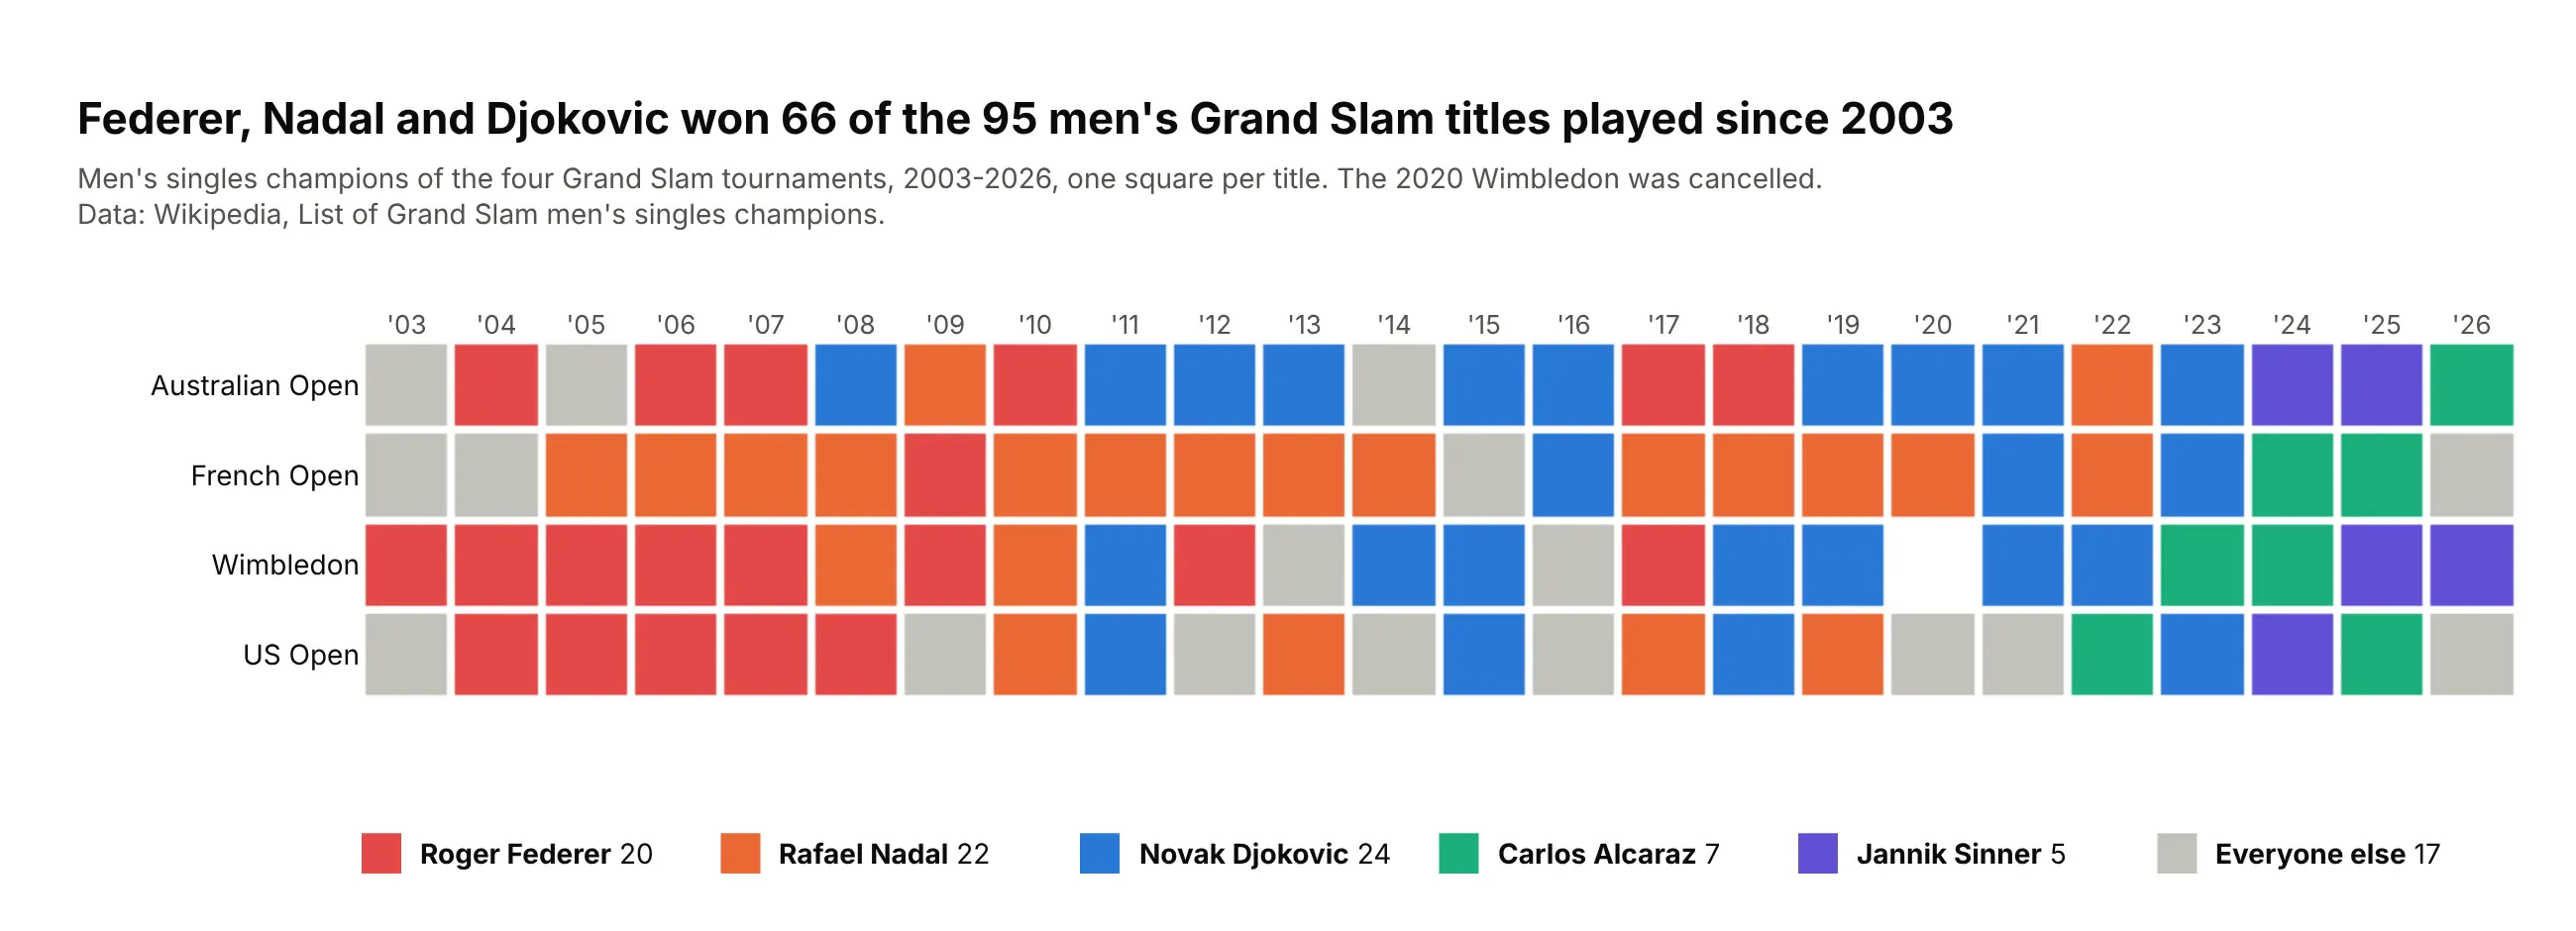
Federer, Nadal and Djokovic won 66 of the 95 men's Grand Slam titles played from 2003 to the 2026 US Open. With years as columns and tournaments as rows, the eras show as runs of color, like Nadal's French Open row. Data: Wikipedia, List of Grand Slam men's singles champions.
Tip: when each square is an event, let its position mean something (year and tournament) and keep the axis labels.
Get the data from Wikipedia's "List of Grand Slam men's singles champions" (the champions-by-yeartable) and shape it into a table (columns: year, tournament, champion) from 2003 to the latest tournament.Build a plotly heatmap grid: years as columns, the four tournaments as rows, one square per title,colored by champion (Federer, Nadal, Djokovic, Alcaraz, Sinner, everyone else in gray, thecancelled 2020 Wimbledon blank). Year labels on top, a key with each player's titles below.