
Chris Parmer
November 3, 2026
Strip Charts - A Complete Guide
TL;DR
- A strip chart draws every value as a dot along one axis, usually one strip per group, and spreads tied values sideways with a little jitter so none hide behind another.
- Strip charts are also known as strip plots, one-dimensional scatter plots, dot plots and jitter plots, and are similar to box plots, beeswarm plots and violin plots.
- Use one for tens to a few thousand values per group, when you want readers to see every observation, the group sizes and the ties. For tens of thousands of points, use a histogram, a violin or an ECDF.
- You can make a strip chart with Plotly in one line of code with px.strip, which draws each group as a box trace with the box hidden and the points jittered.
- "Strip chart" also names the paper trace of a chart recorder, such as a seismograph. That meaning has its own section below, with a scrolling real-time version in Dash.
What is a strip chart?
Strip charts look like this:
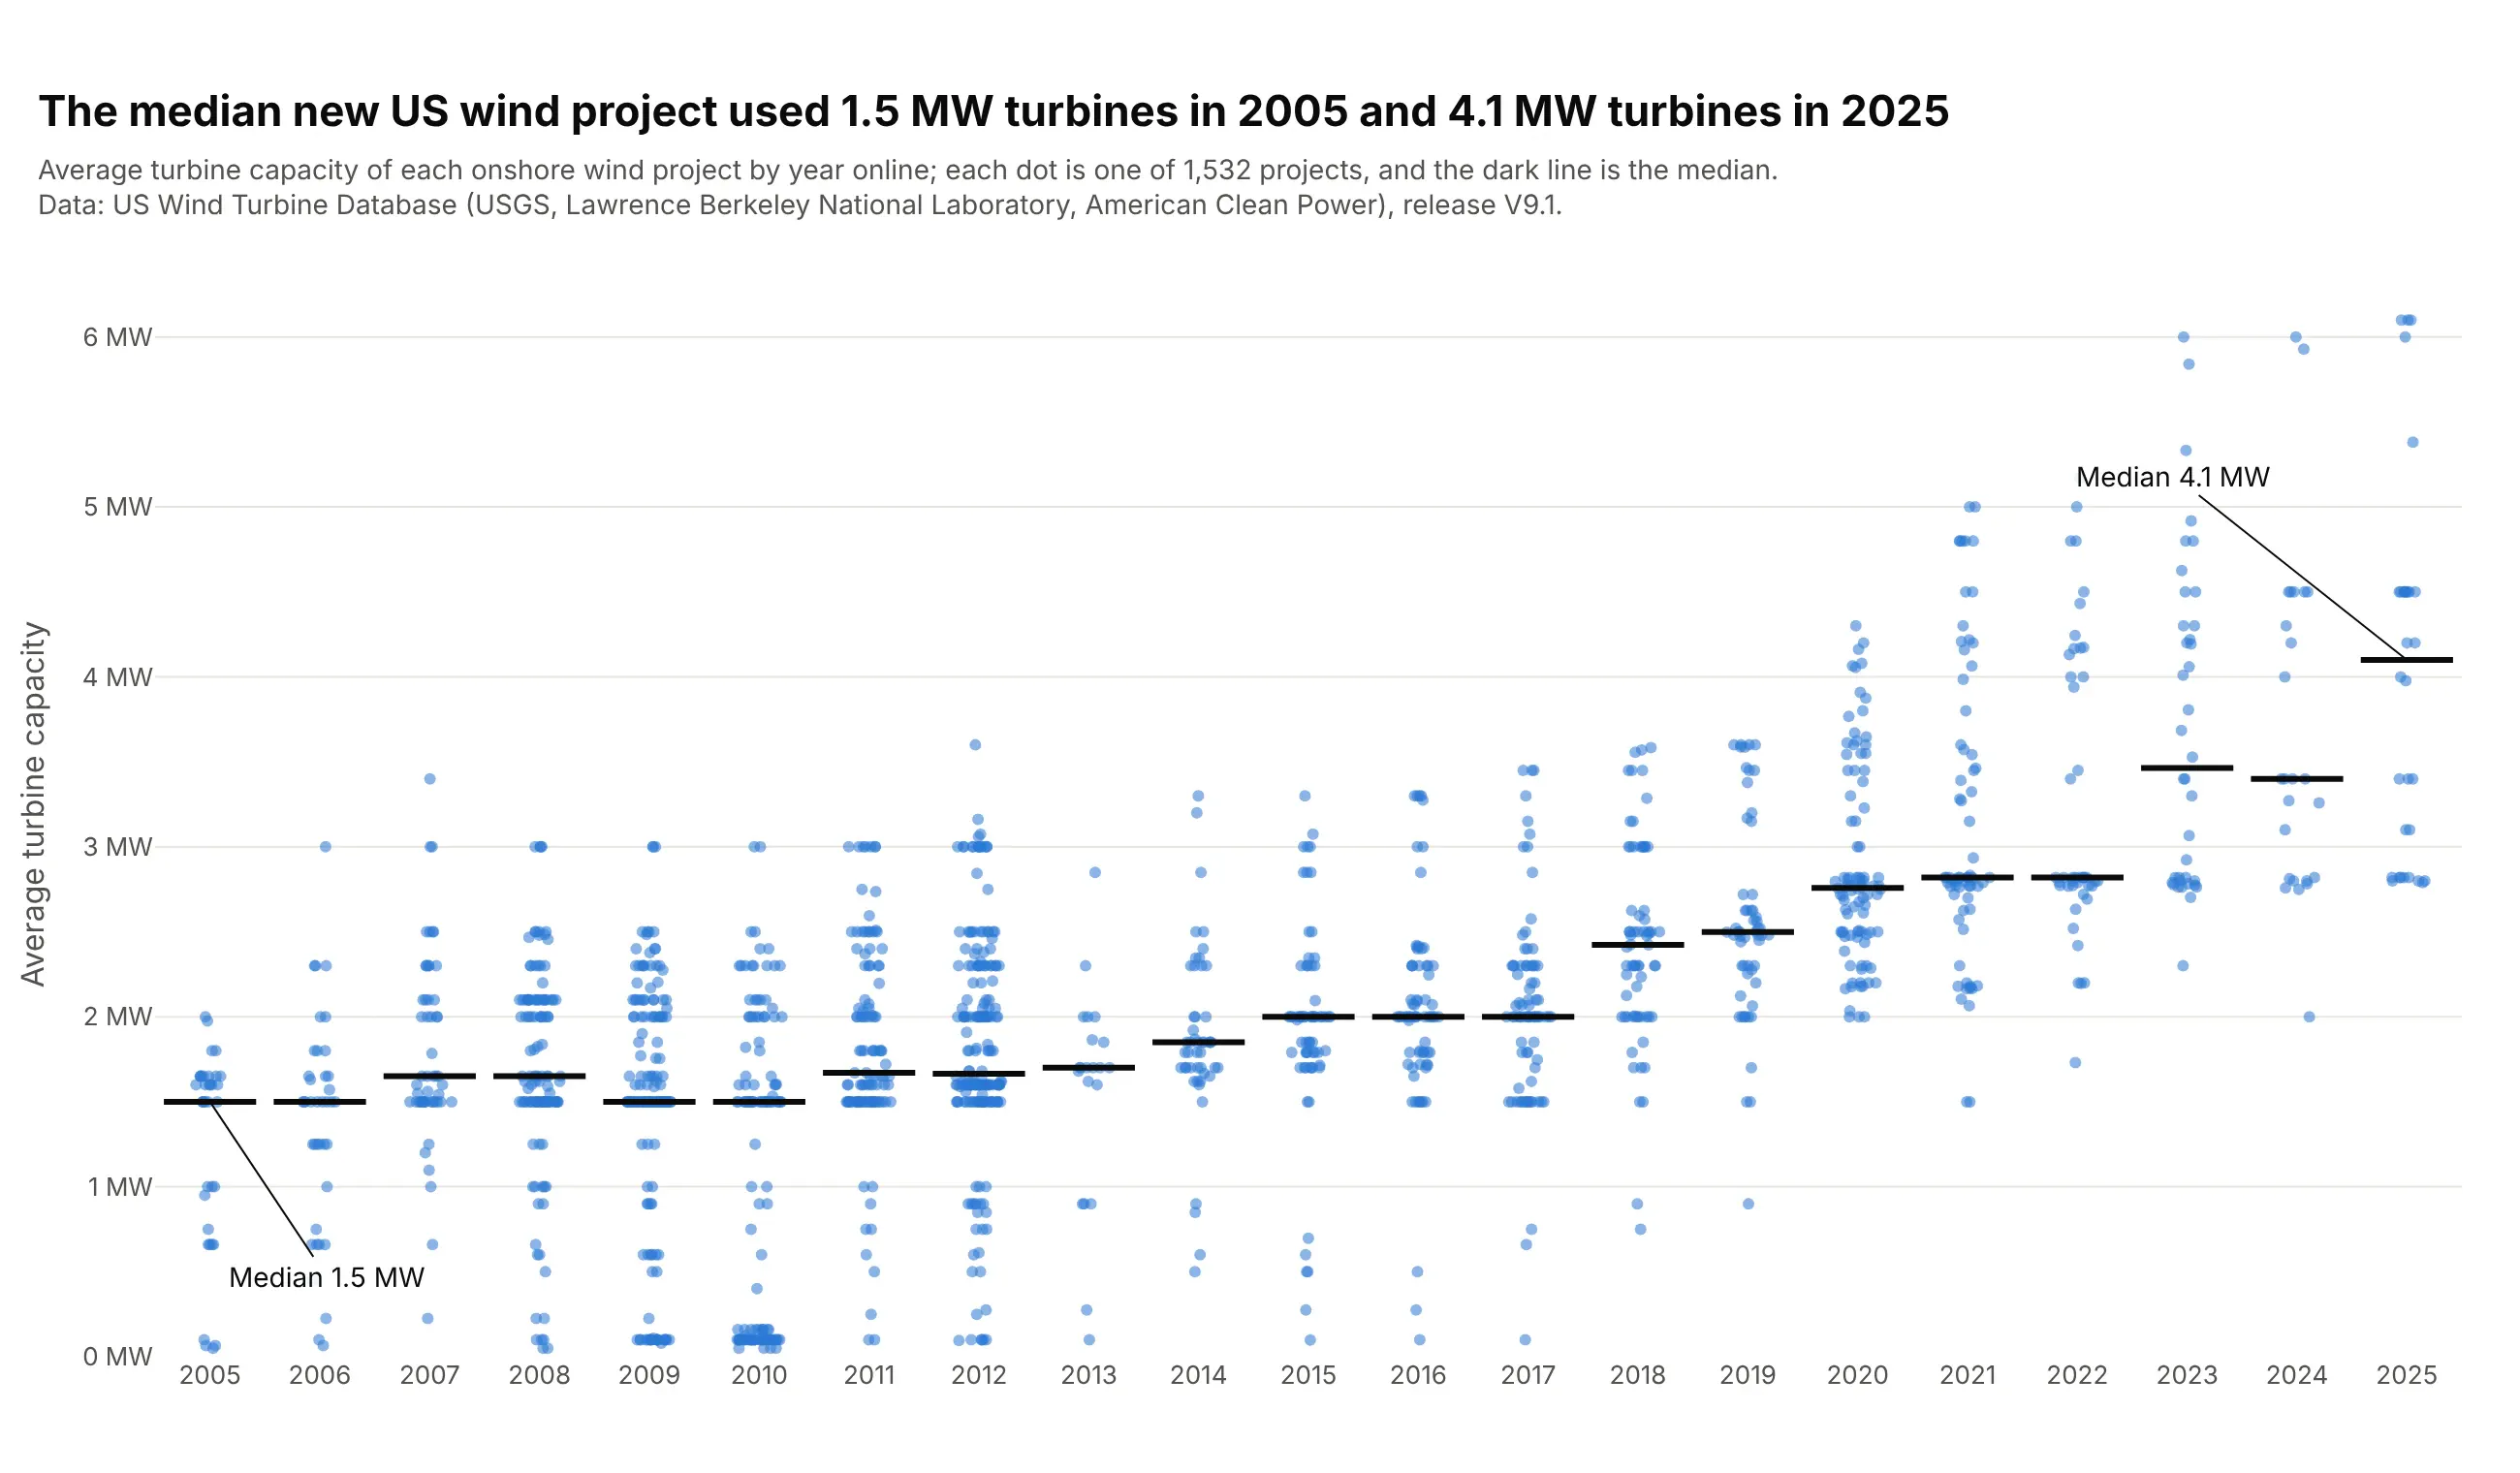
Data: U.S. Wind Turbine Database (USGS, Lawrence Berkeley National Laboratory, American Clean Power), release V9.1.
How do you read a strip chart? In the example above, notice these things:
- Each dot is one onshore US wind project, placed in the column for the year it came online and at the height of its turbines' average capacity.
- Only the height carries data. The sideways spread inside a column is jitter, which moves dots apart so projects with the same value don't sit on top of each other.
- Rows of dots at exactly the same height are projects that used the same turbine. 213 projects average exactly 1.5 MW, and 126 of them came online between 2009 and 2012.
- The dark line is each year's median: 1.5 MW in 2005, 2.0 MW from 2015 to 2017 and 4.1 MW in 2025.
- The number of dots is the number of projects, 192 in 2012 against 21 in 2013, which a box plot would hide. The cluster near zero in 2010 is 46 projects under 0.2 MW, mostly a single small turbine at a school, farm or wastewater plant.
It's often used for charts like these:
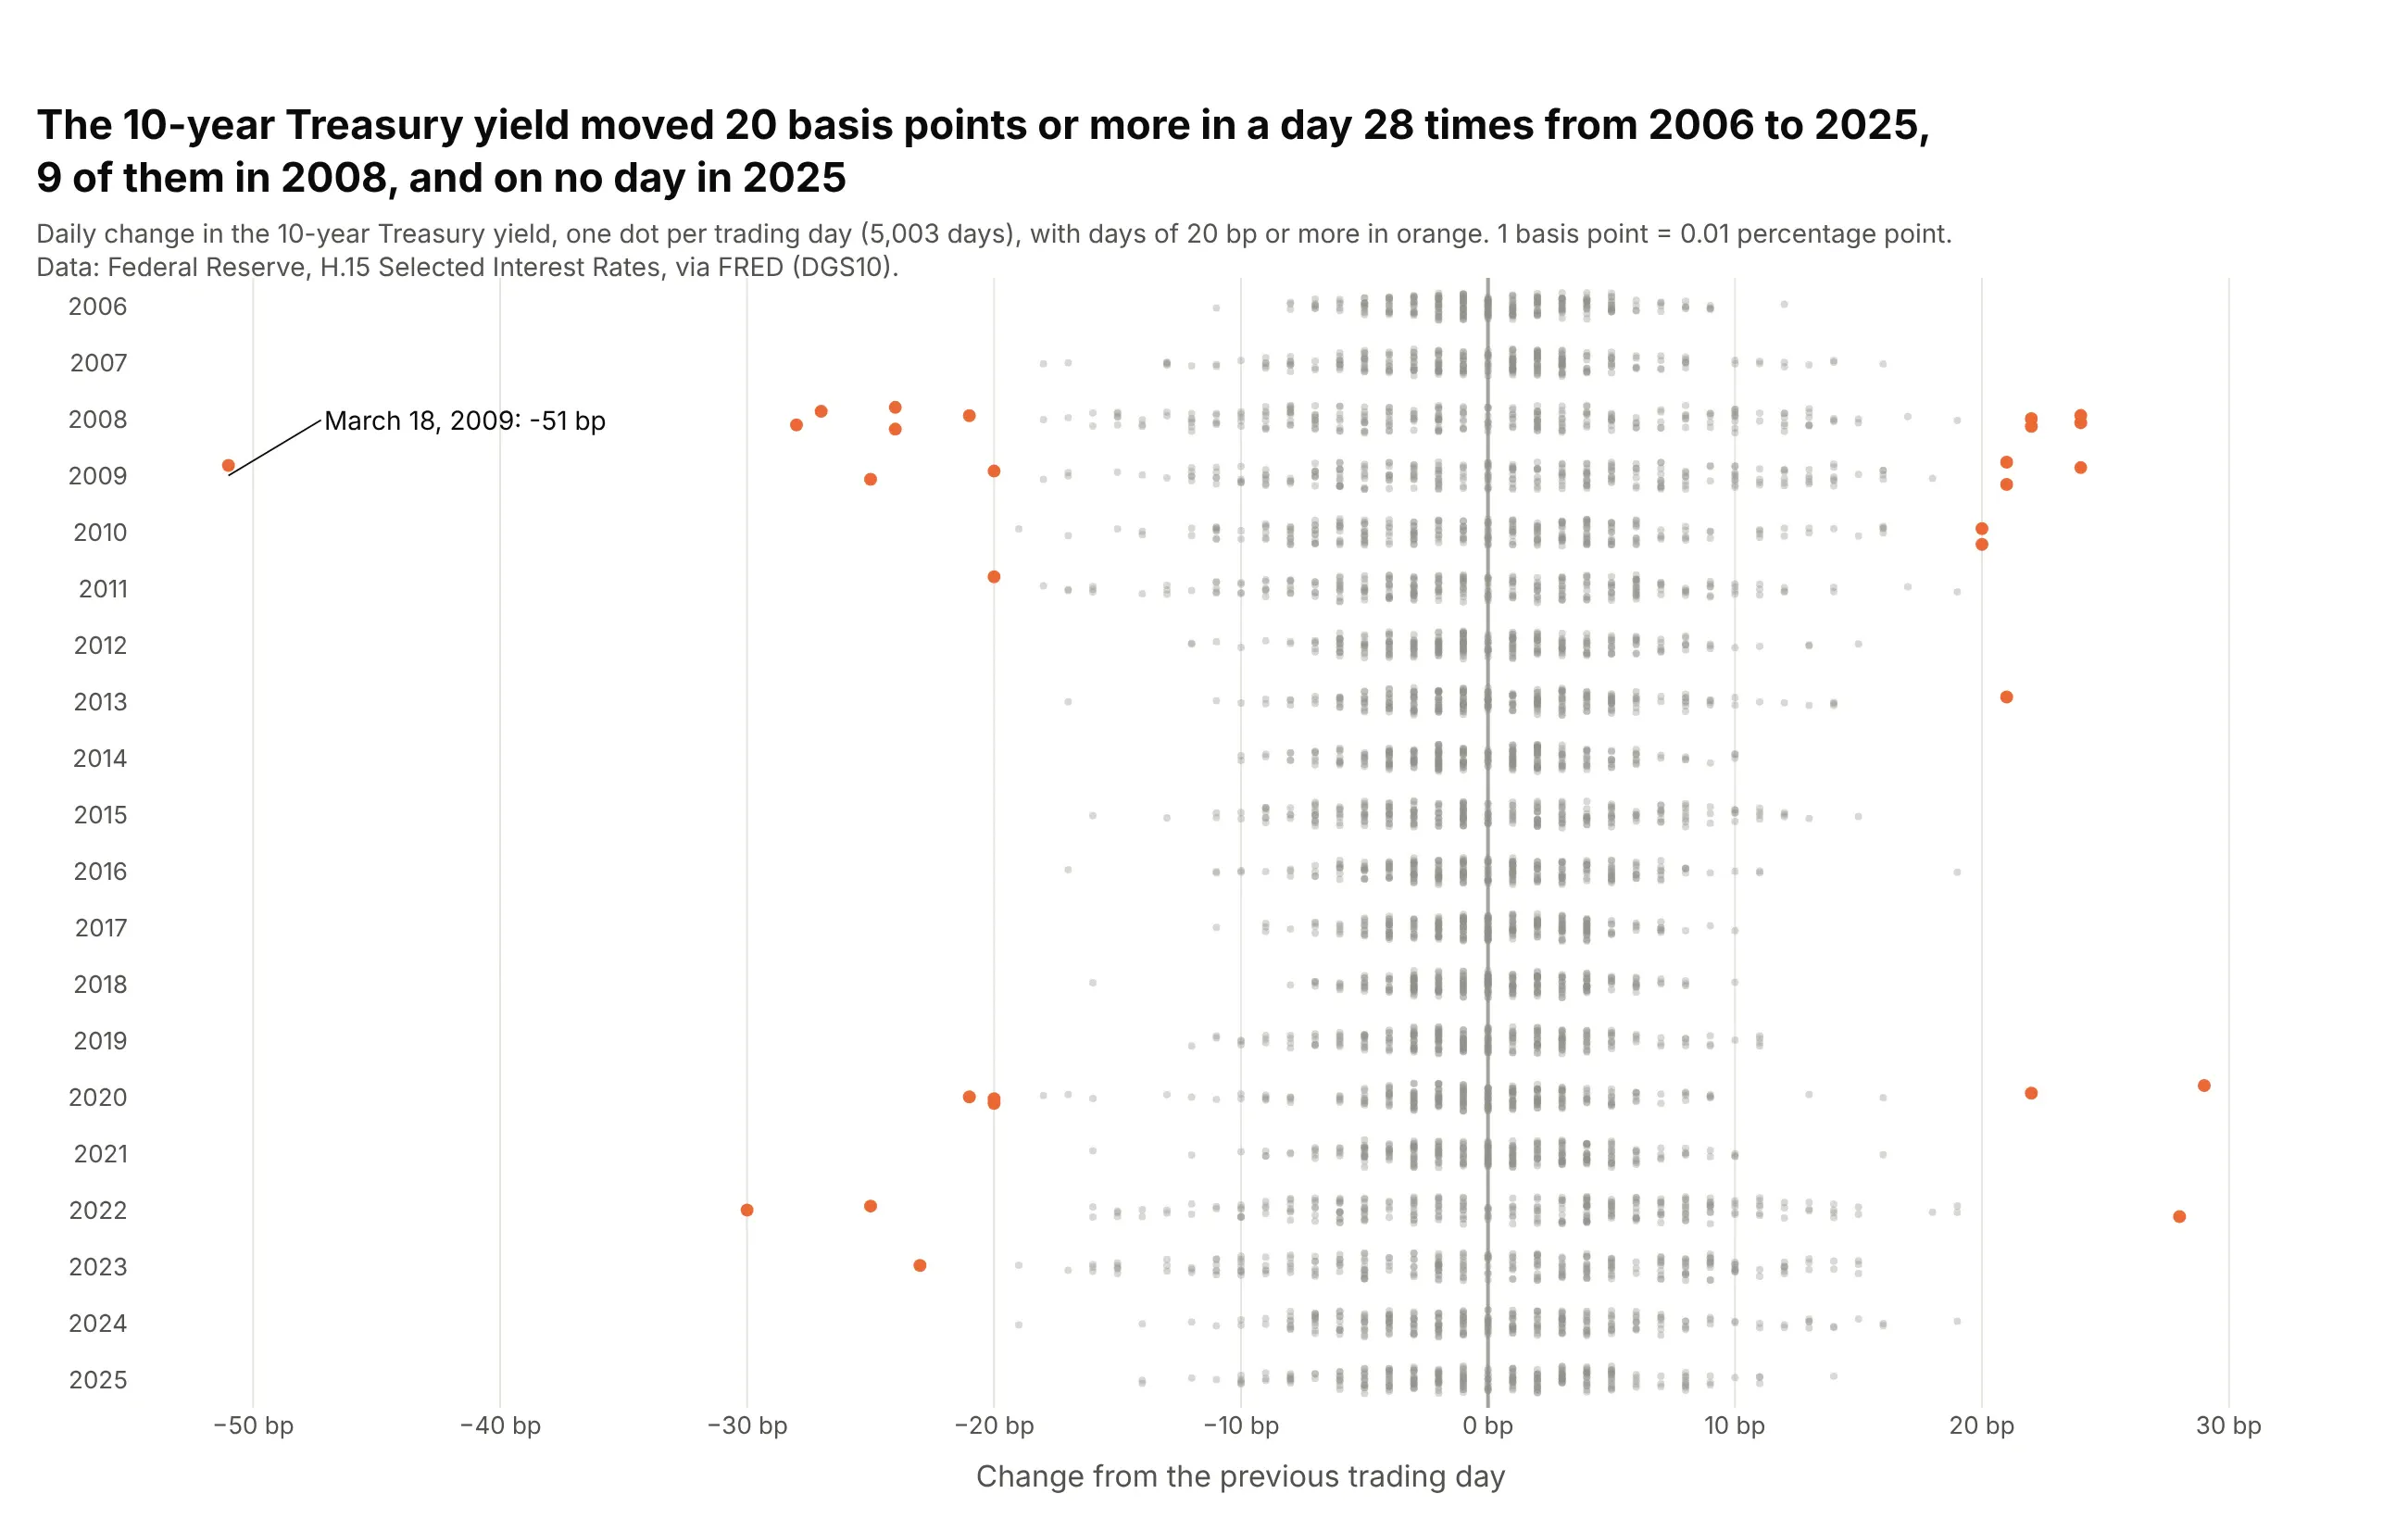
Volatility by year. The 10-year Treasury yield moved 20 basis points or more on 28 days from 2006 to 2025, 9 of them in 2008, and the width of each year's strip shows how calm or rough it was. Data: Federal Reserve H.15 via FRED (DGS10).
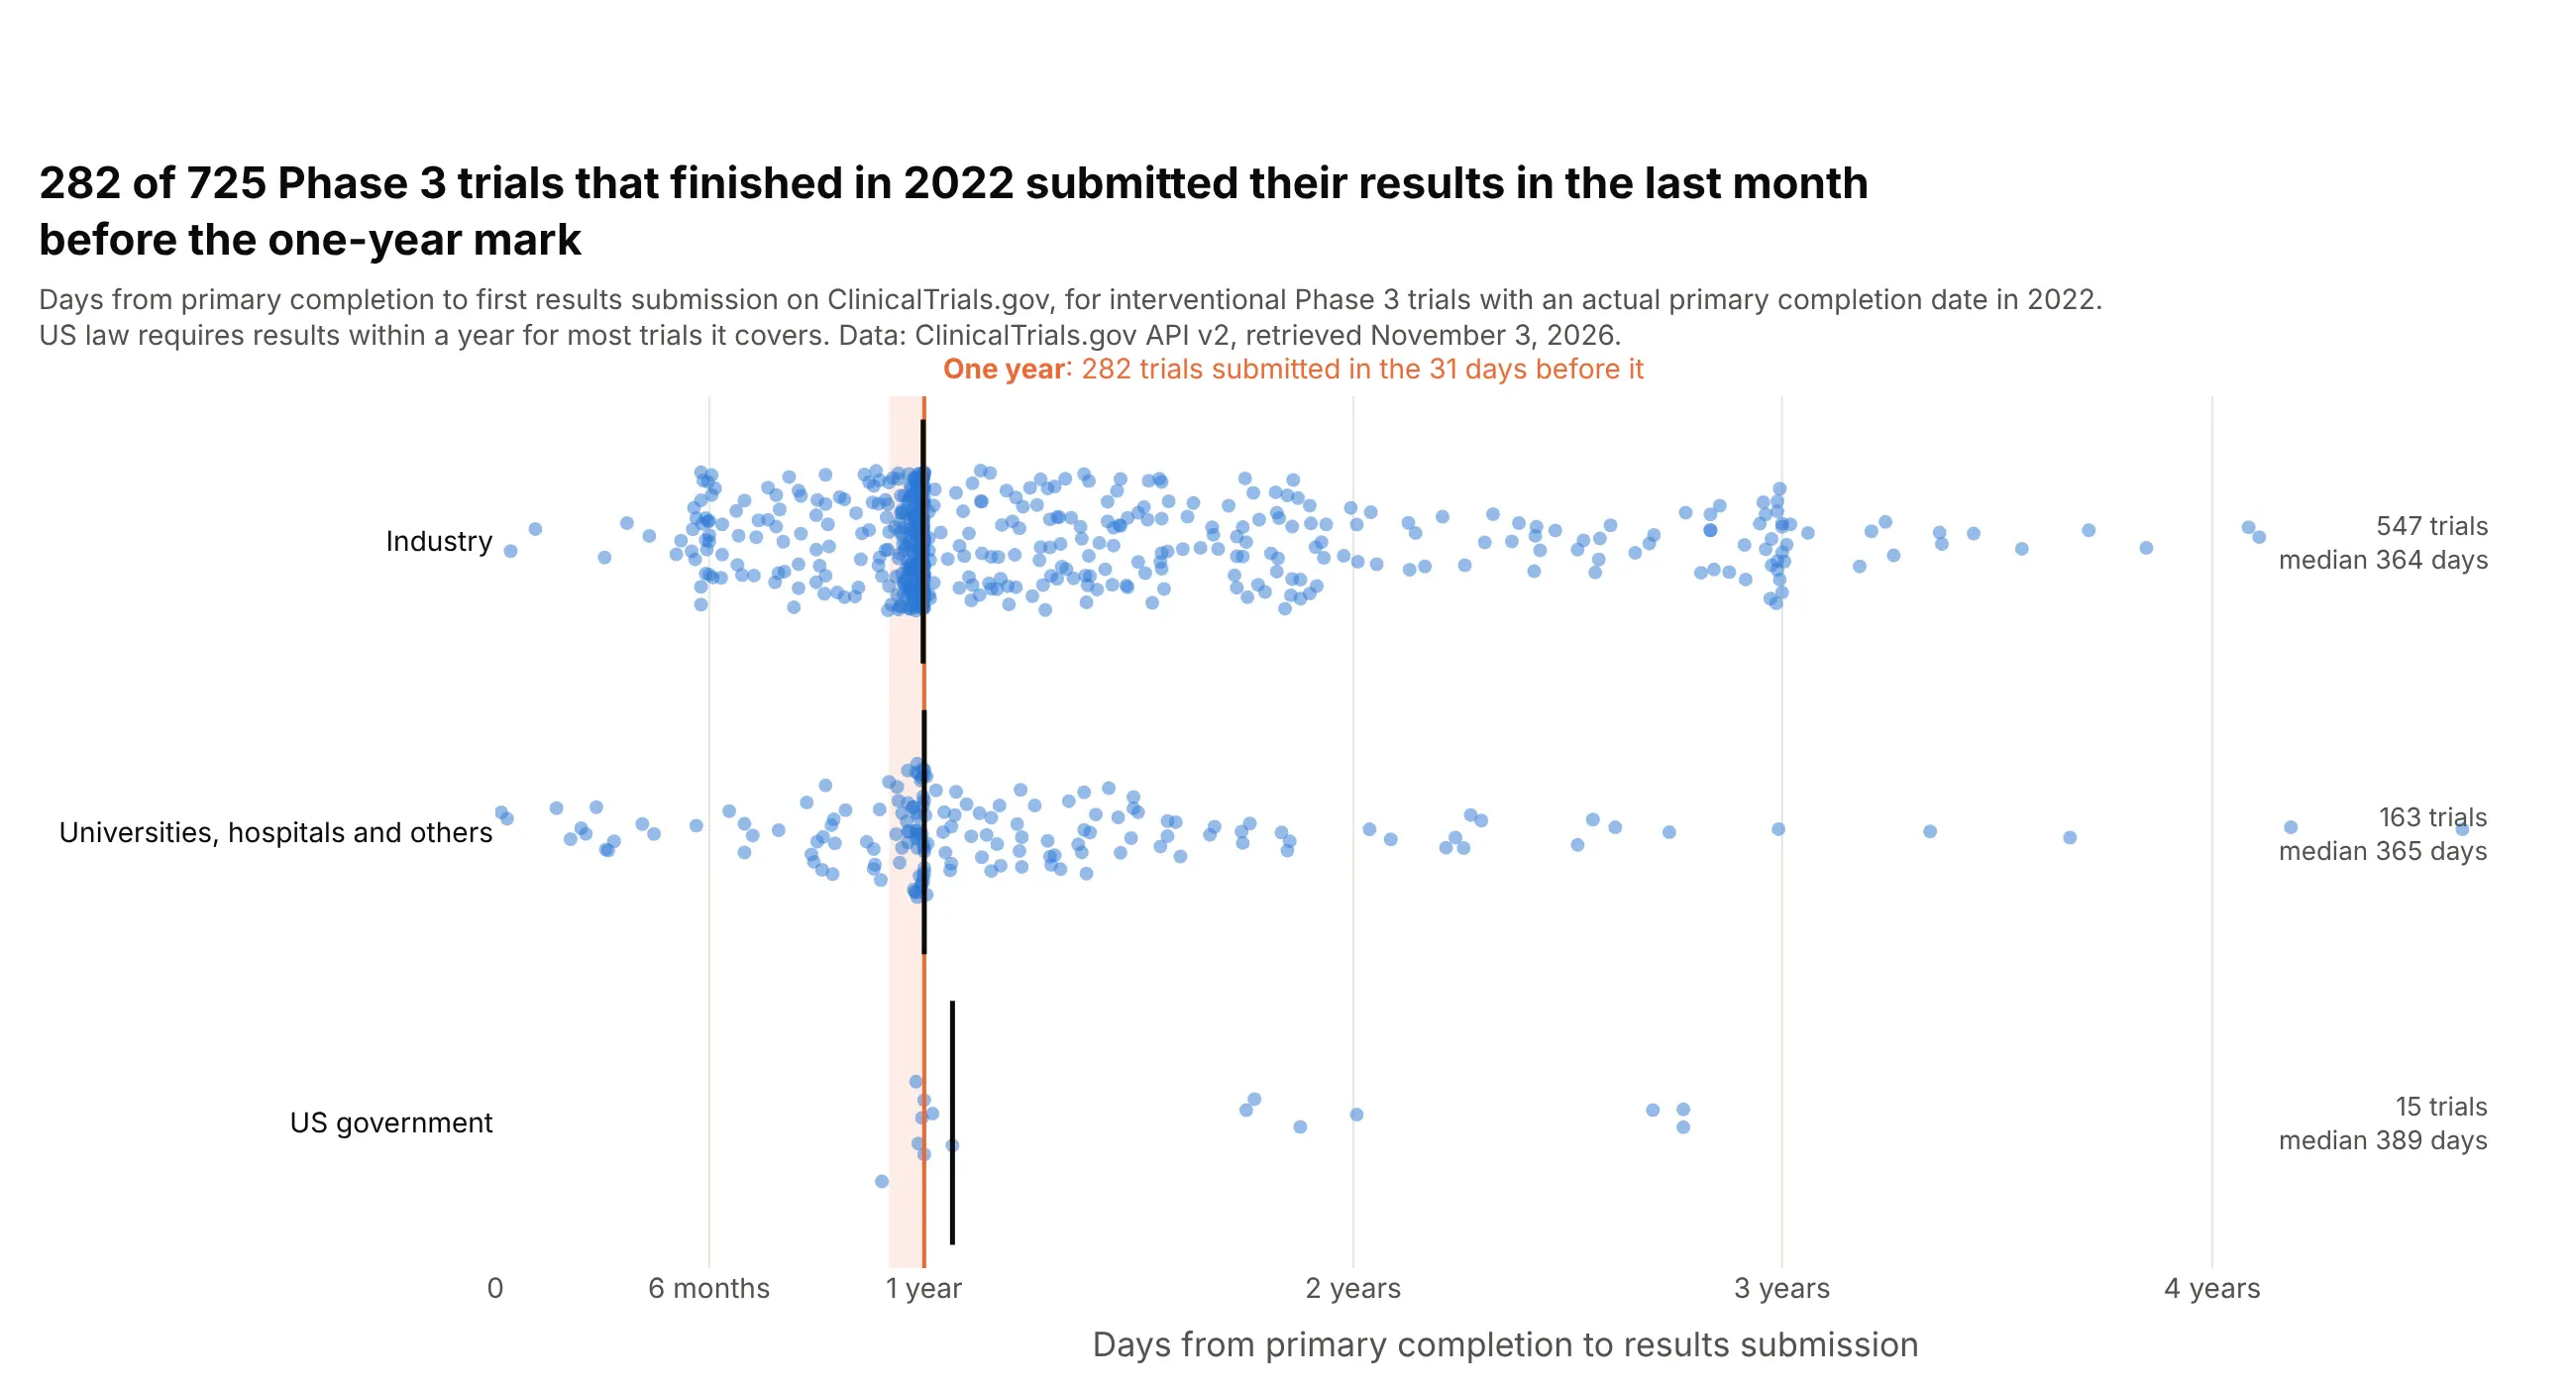
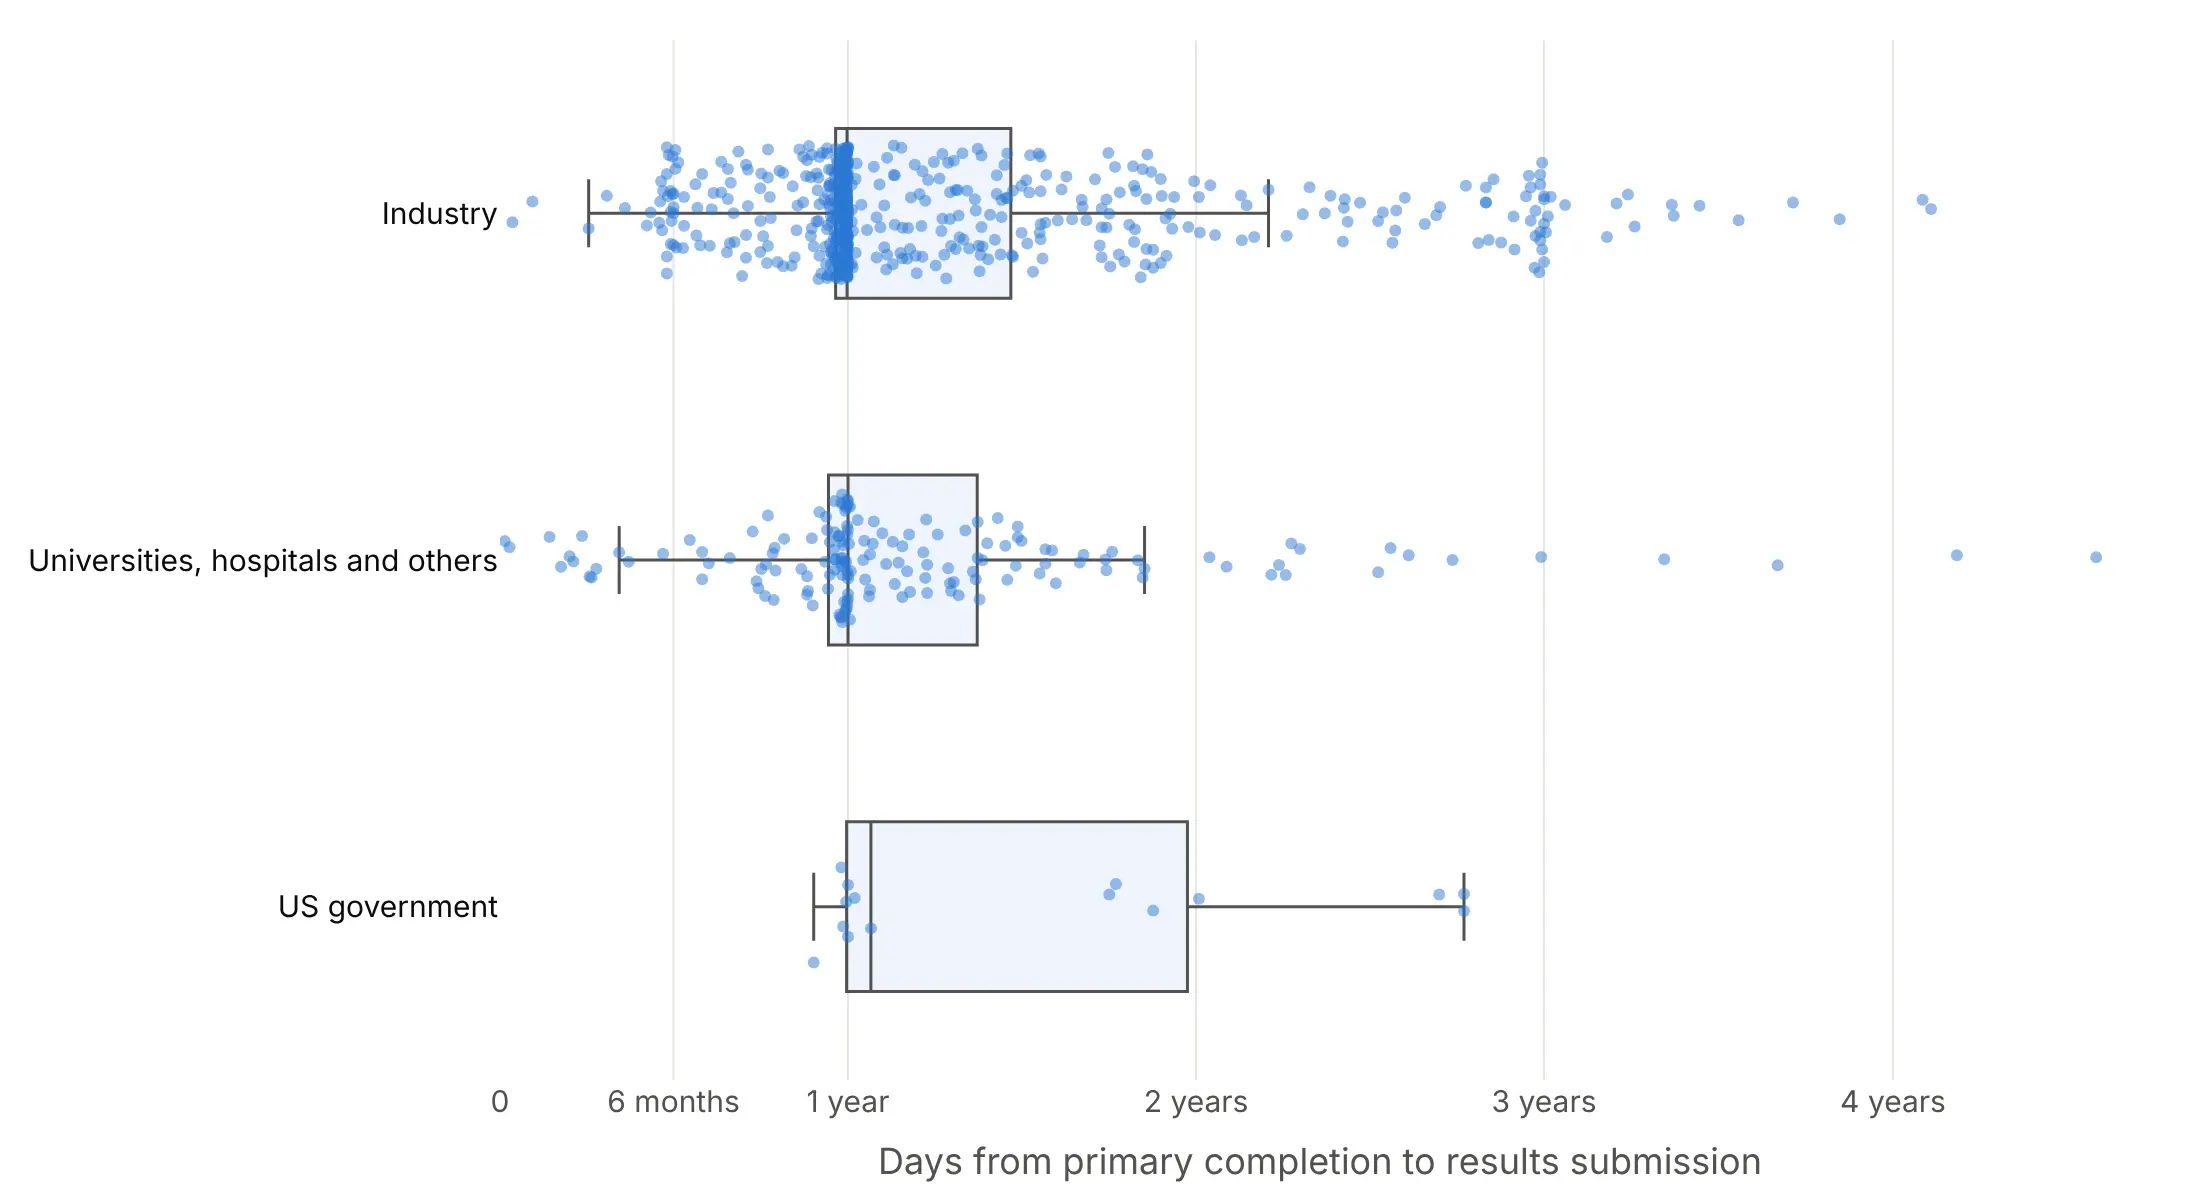
Deadlines in clinical data. 282 of 725 Phase 3 trials that finished in 2022 submitted their results to ClinicalTrials.gov in the 31 days before the one-year mark, which shows as a wall of dots. Data: ClinicalTrials.gov API v2.
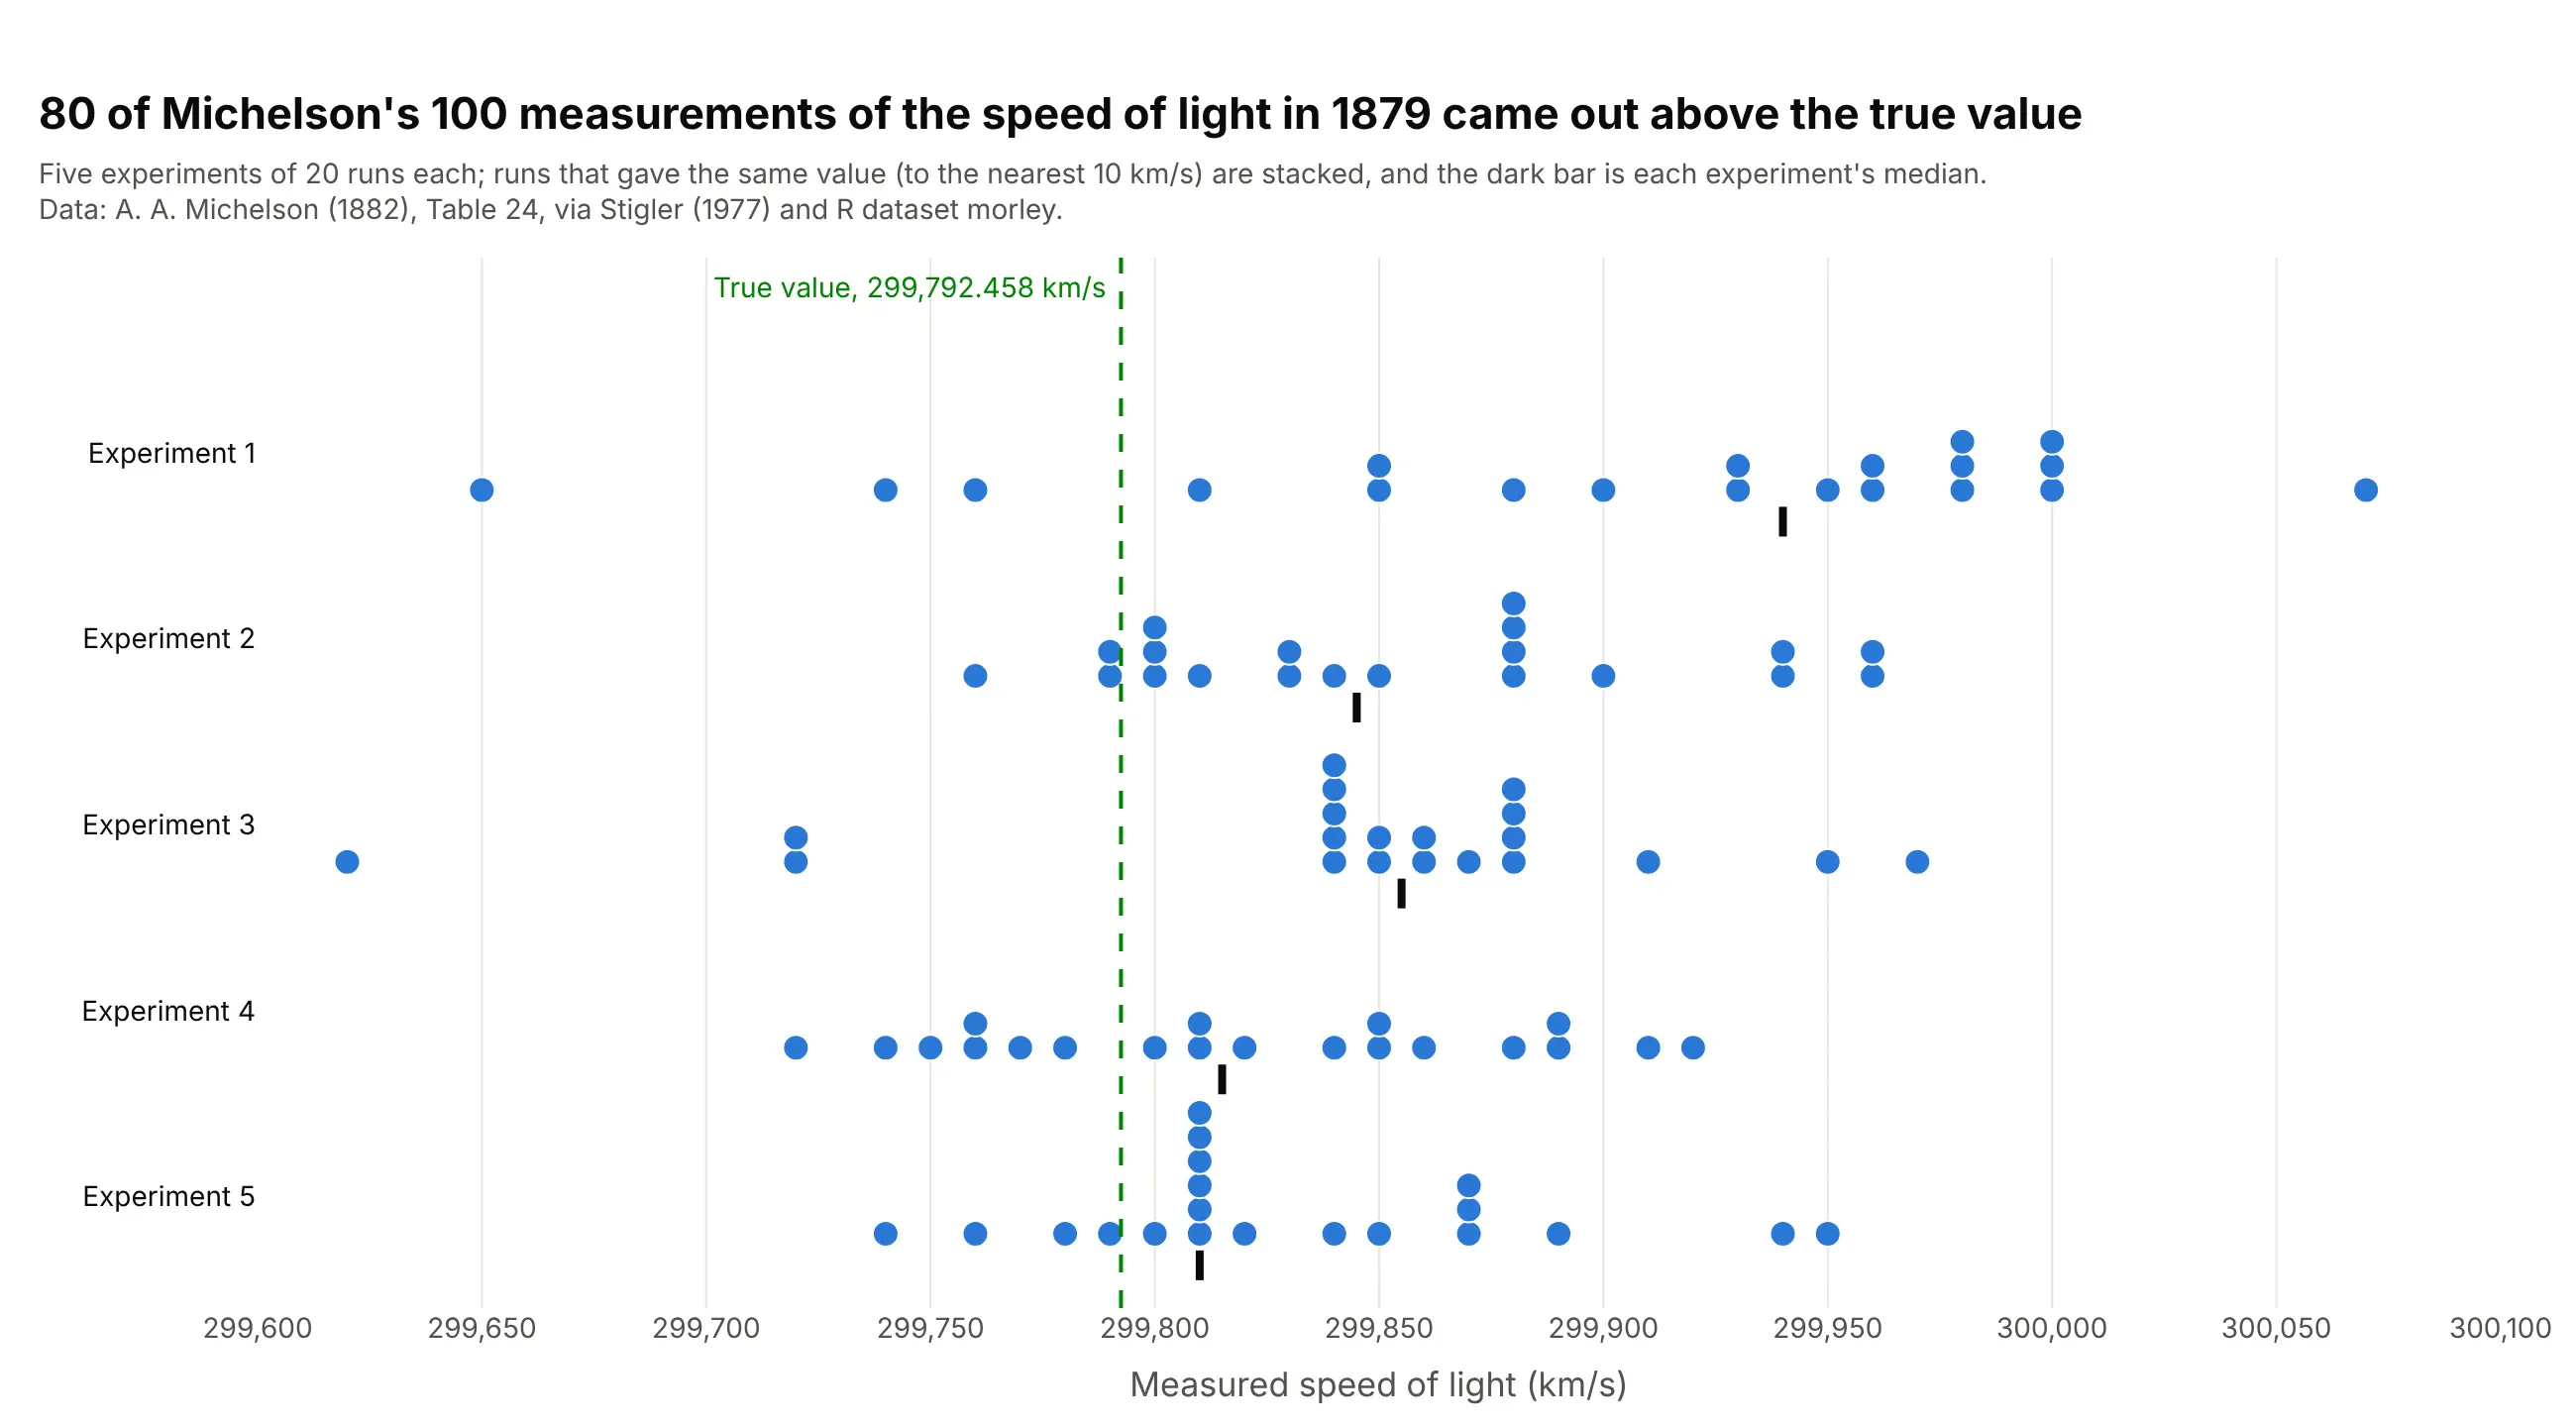
Repeated measurements. 80 of Michelson's 100 measurements of the speed of light in 1879 came out above the true value, a bias the dots show against a reference line. Data: Michelson (1882) via Stigler (1977), R dataset morley.
A short history
Plotting each measurement as a dot along a scale is one of the simplest statistical charts. R's graphics package has a stripchart() function that draws "one dimensional scatter plots (or dot plots)" and calls them "a good alternative to boxplots when sample sizes are small". Chambers, Cleveland, Kleiner and Tukey's 1983 book Graphical Methods for Data Analysis discussed jitter, the small offset that separates tied values (as cited by Wicklin), and Python's seaborn library added the same chart as stripplot (Waskom 2021). The chart reads well because it shows values as positions on a common scale, the most accurate encoding in Cleveland and McGill's experiments (1984).
Strip chart recorders and real-time strip charts
Some people who search for "strip chart" mean the paper chart of a strip chart recorder, a long strip of paper that moves under a pen at a steady speed so the pen draws a signal over time. Wikipedia's chart recorder article describes an early one that Charles Babbage built into a railway dynamometer car in 1838 or 1839, and seismographs and ECG machines are familiar modern examples. This is a seismogram of the July 29, 2025 Kamchatka earthquake, recorded in Albuquerque, New Mexico:
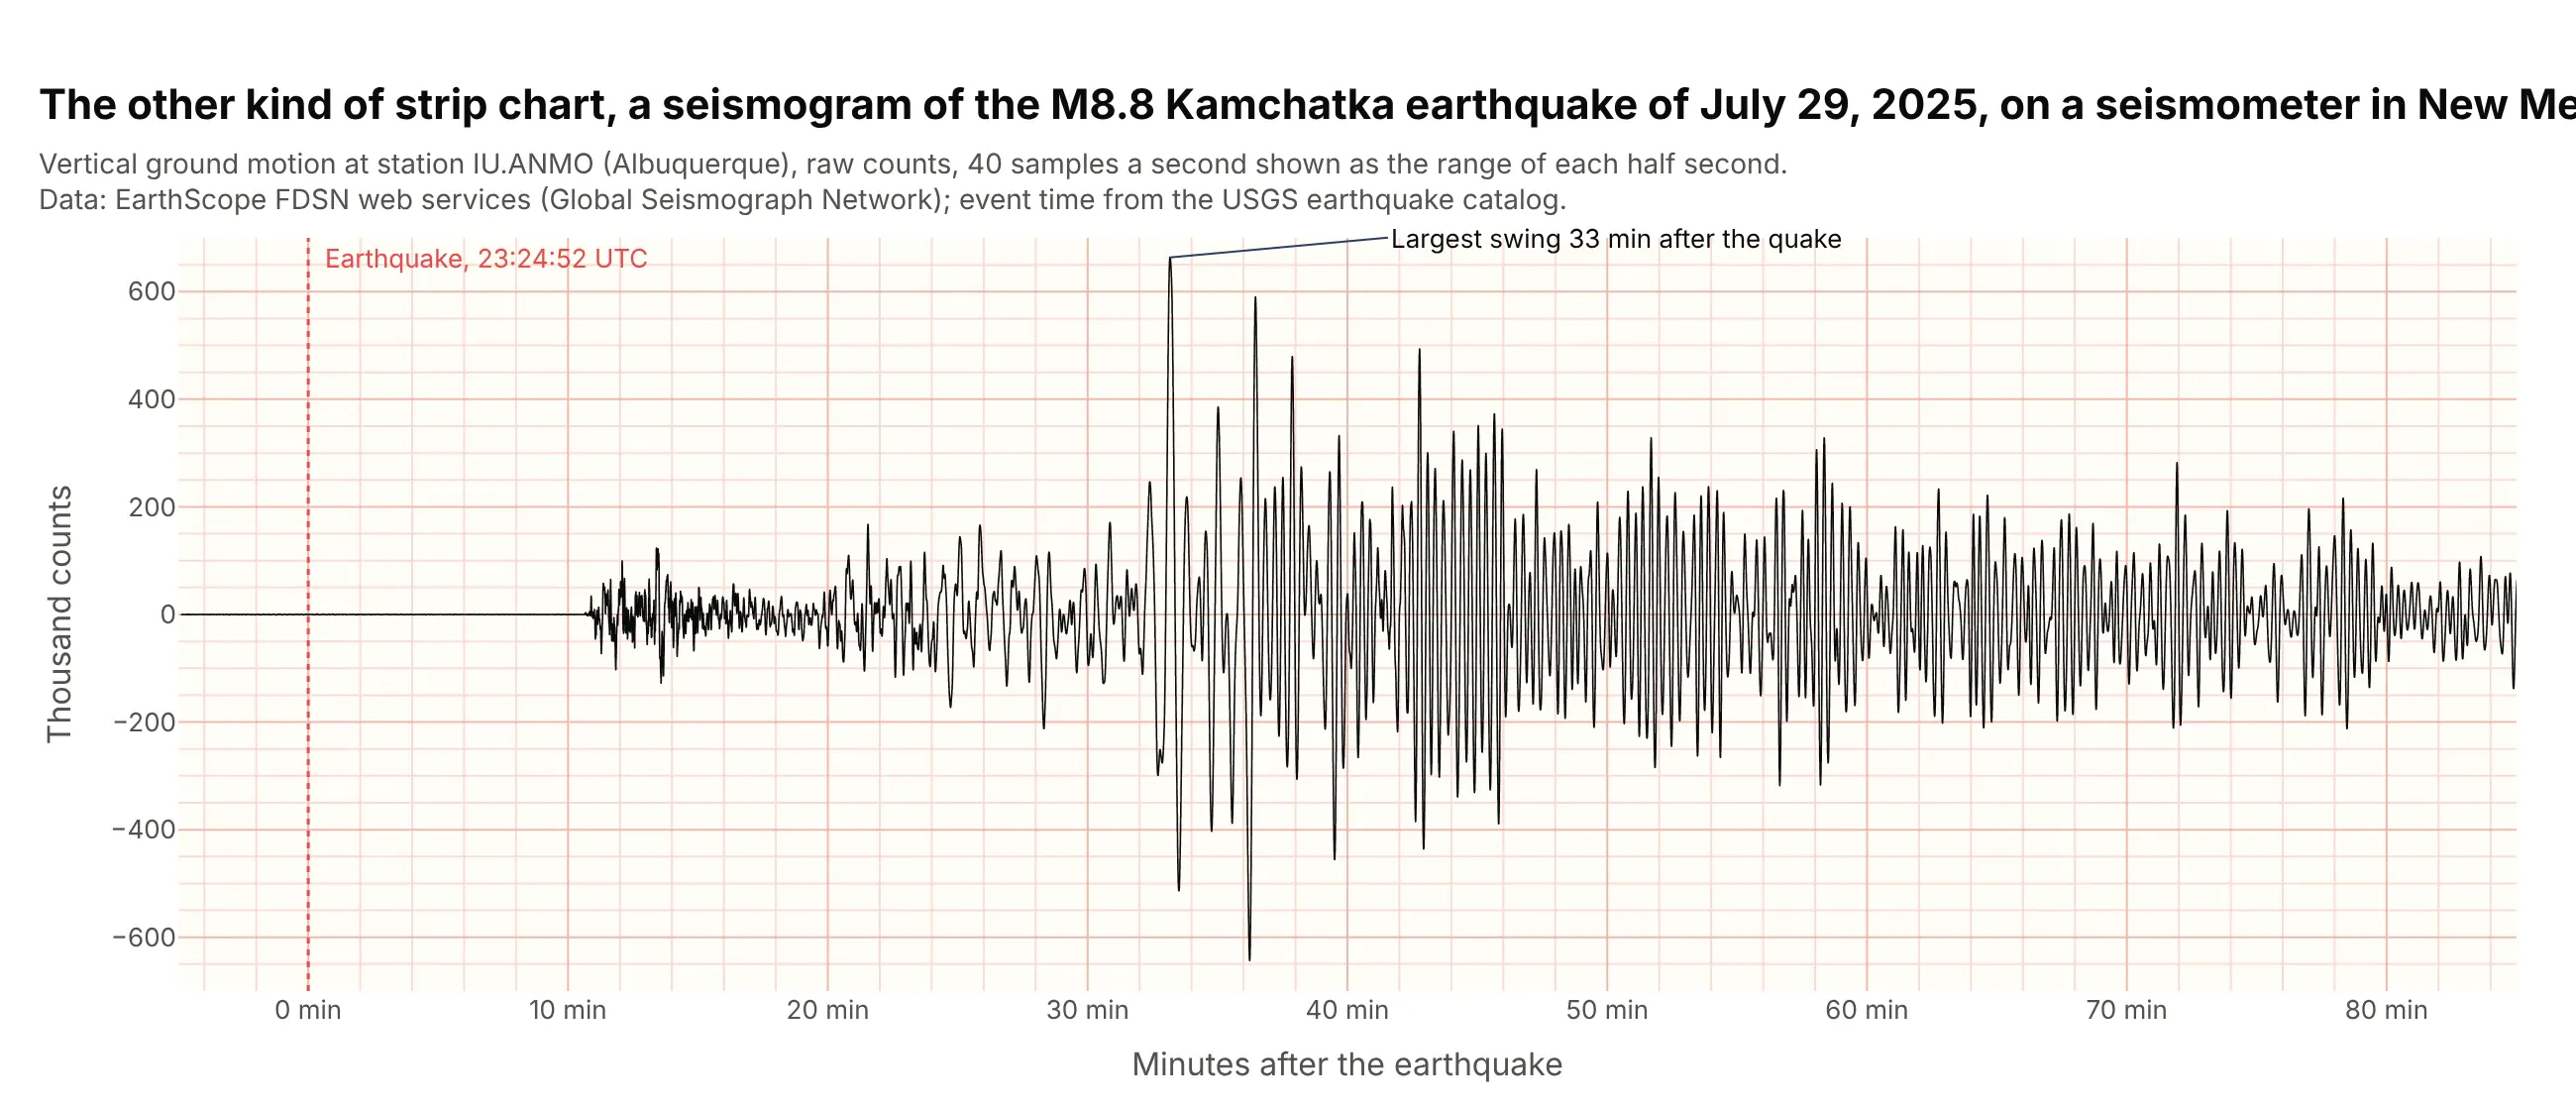
Data: EarthScope FDSN web services, Global Seismograph Network station IU.ANMO; event time from the USGS earthquake catalog.
On a screen, the same idea is a scrolling line chart that keeps the latest few thousand points. In Dash, a dcc.Interval fires a callback every few hundred milliseconds, and the callback returns new points to the graph's extendData property, whose third item caps how many points stay on screen:
import pandas as pdimport plotly.graph_objects as gofrom dash import Dash, Input, Output, dcc, htmldata = pd.read_csv("seismogram.csv") # minutes_after_origin, countsSTEP, WINDOW = 120, 3000fig = go.Figure(go.Scatter(x=[], y=[], mode="lines", line=dict(color="black", width=1)))fig.update_layout(template="simple_white", yaxis_range=[-700, 700])app = Dash()app.layout = html.Div([dcc.Graph(id="strip", figure=fig), dcc.Interval(id="tick", interval=200)])@app.callback(Output("strip", "extendData"), Input("tick", "n_intervals"))def add_samples(n):chunk = data.iloc[(n or 0) * STEP:((n or 0) + 1) * STEP]new = dict(x=[chunk.minutes_after_origin.tolist()], y=[(chunk.counts / 1000).tolist()])return new, [0], WINDOW # [updateData, traceIndices, maxPoints]app.run()
This replays the recorded quake. In your own app, replace the chunk = ... line with a read from your sensor, message queue or database. The rest of this guide is about the statistical strip chart.
Alternatives to a strip chart
Here's the same Phase 3 trial data drawn six ways. Some are better for the question, some worse, some just different:
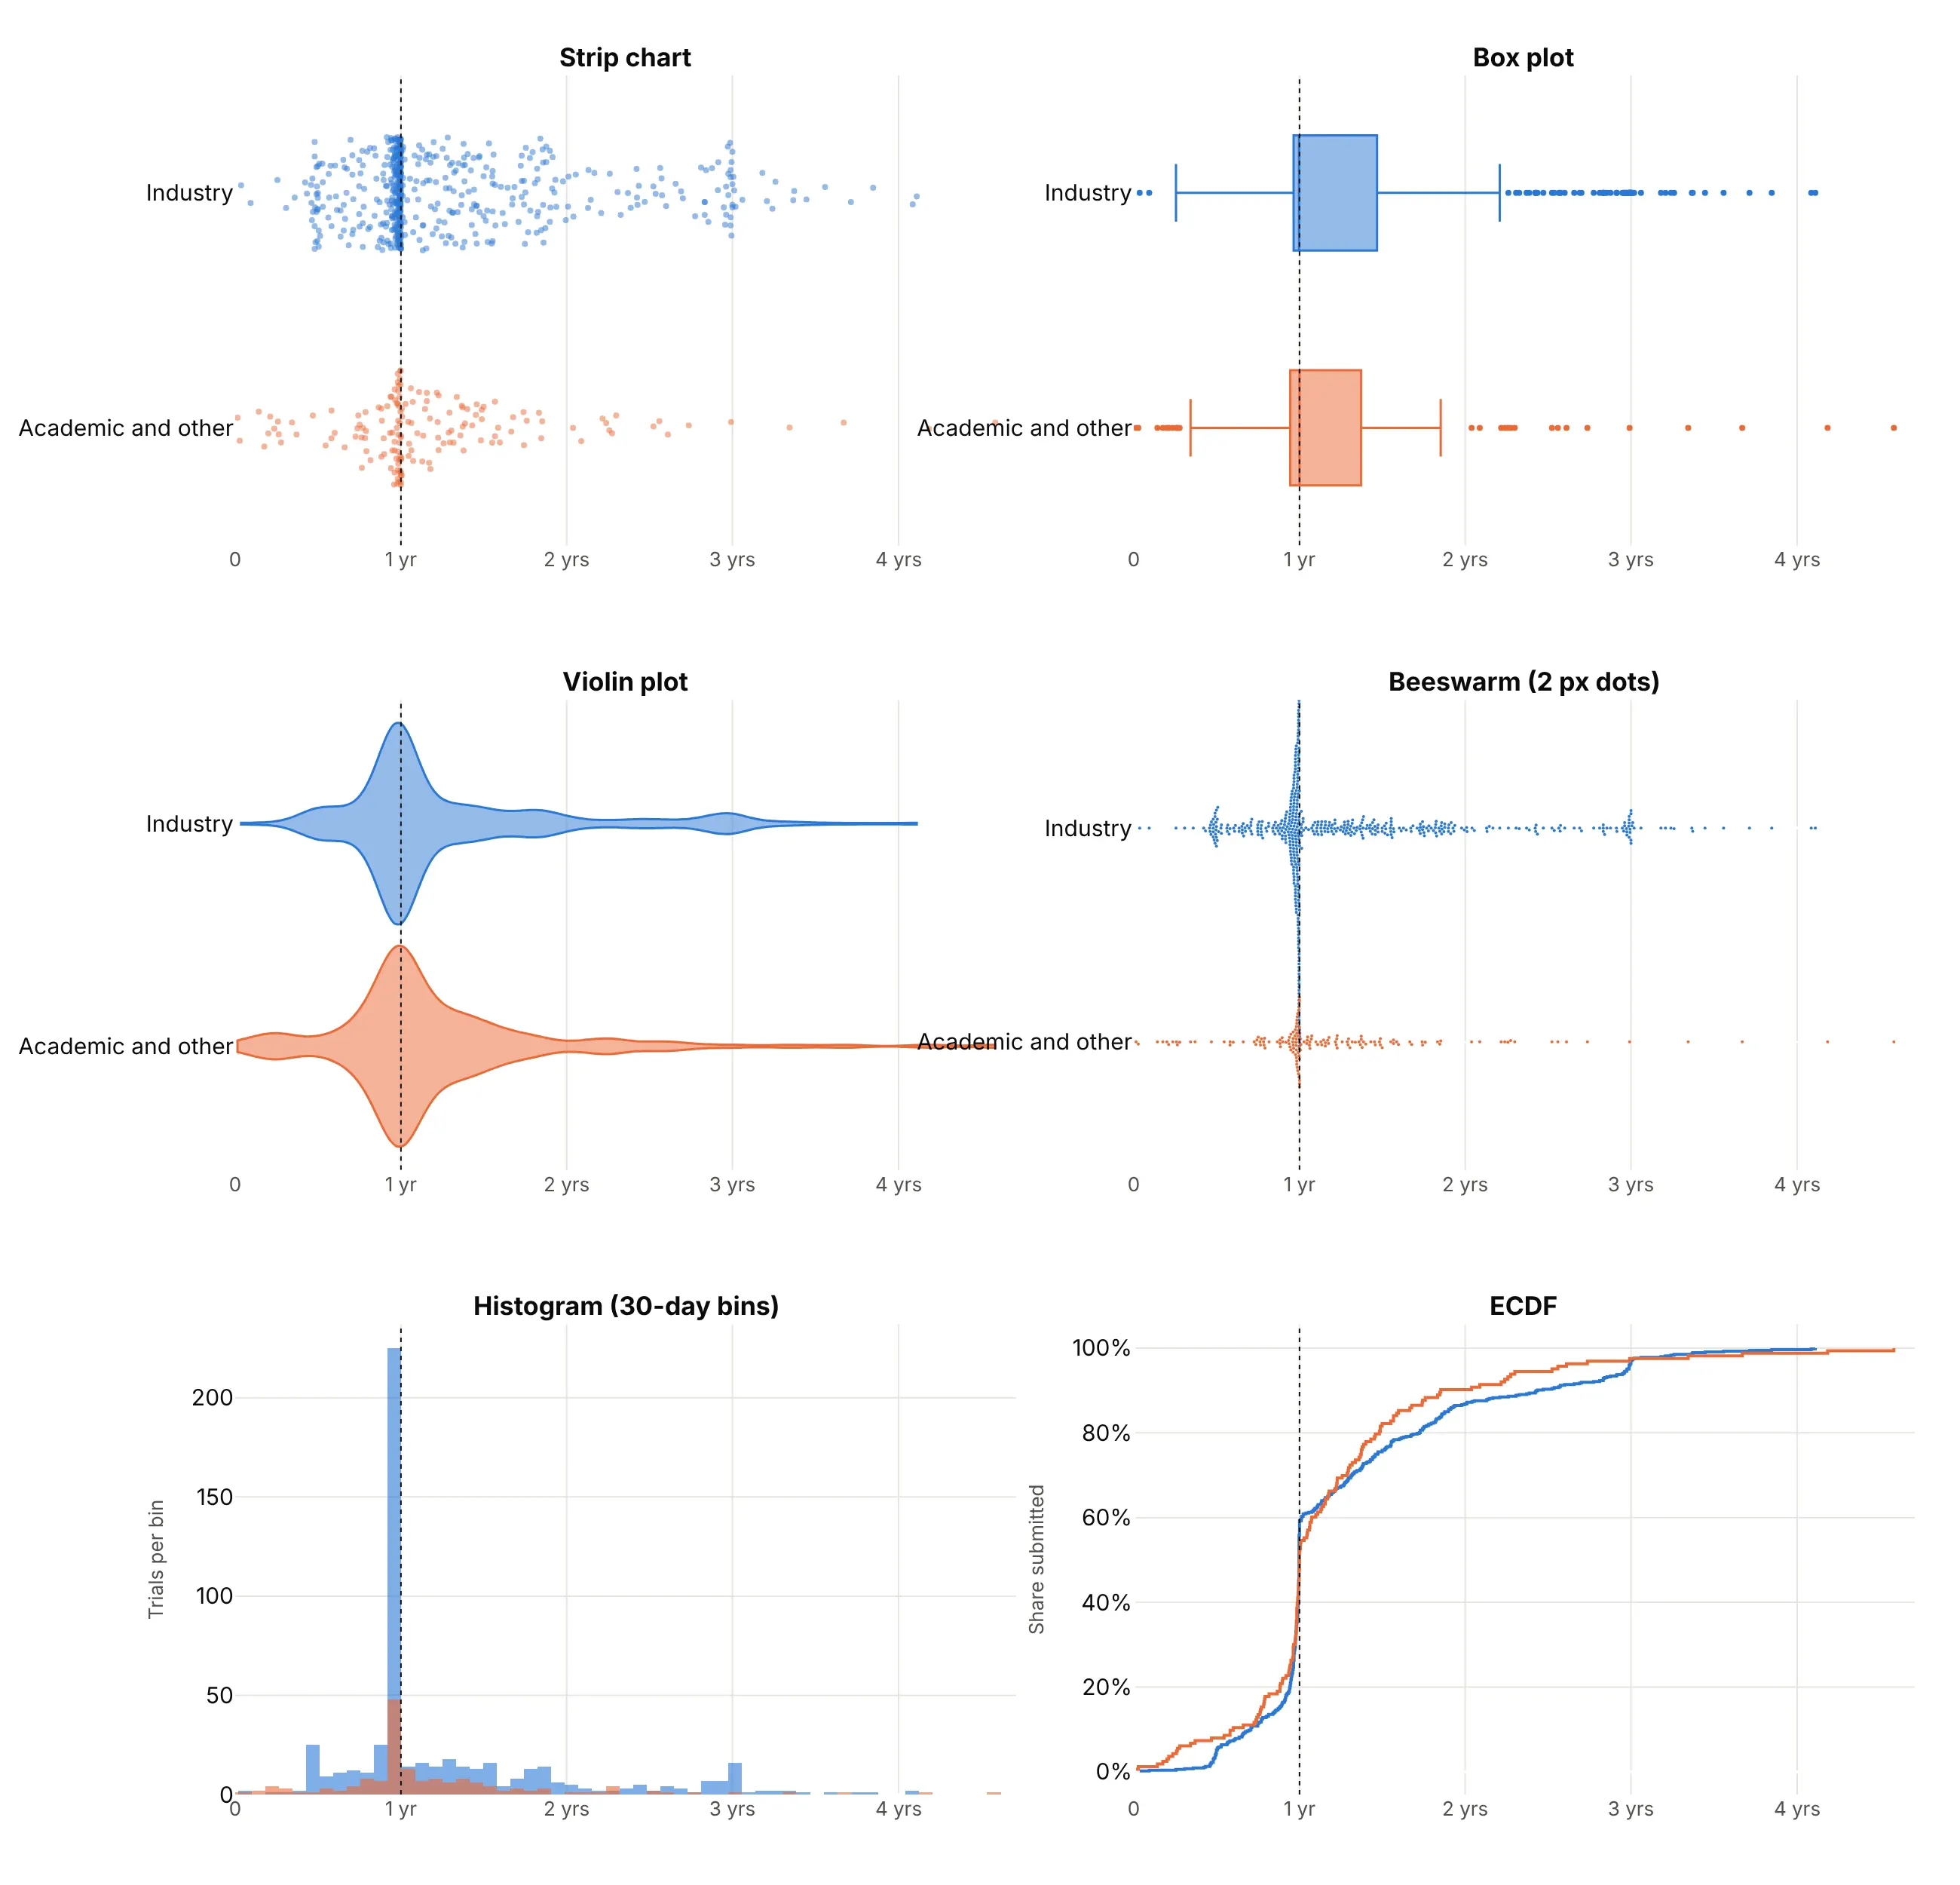
- Box plot (better for many groups). Five numbers per group compare well side by side, but the wall of submissions just before one year disappears inside the box, and so does the fact that industry has more than three times as many trials.
- Violin plot (better for big n). The smoothed outline shows the peak at one year and scales to any number of points, but it smears the sharp edge into a gentle bump and you can't hover a single trial.
- Beeswarm plot (worse here). It places every dot without overlap, which is better than jitter for a few hundred points, but the trials that submitted in the last weeks before the deadline pile into a column taller than the row.
- Histogram (better for exact counts). With 30-day bins the bar just before one year shows the pile-up as a count you can read off the axis, though the names and the exact days are gone.
- ECDF (better for "what share by when"). The near-vertical jump at one year is the deadline, and you can read that 58% of trials had submitted by then, but the curve takes practice to read.
How to make a strip chart
With AI
ChatGPT, Claude Code, GitHub Copilot, Cursor and other AI tools are excellent at writing Plotly code. Name Plotly in the prompt, and say what should happen to tied values and what reference lines you want:
Make a plotly strip chart from wind_projects.csv (columns: project, state, year, turbines, turbine_mw).- Use px.strip with x = year (as categories, in order) and y = turbine_mw, one strip per year.- Jitter 0.85, 6 px markers at 0.55 opacity, project and state in the hover text.- A short dark line at each year's median, and the first and last medians labeled.- Fixed width and height, the y axis in MW from 0, and a title that states the takeaway.- Check: print the median per year and the number of projects per year.
With Plotly Studio
Plotly Studio is a desktop app where you point an AI at a dataset and it builds charts and a Dash app around your questions. Ask for a strip chart the same way:
Show a strip chart of days from primary completion to results submission for each Phase 3 trial, one row per sponsor type, every trial as a jittered dot with its NCT ID on hover, a vertical line at 365 days and the median of each row marked.
Make a strip chart in Python or JavaScript
This is the code AI tools write under the hood. In Python, px.strip makes the chart in one line of code, and the Plotly strip chart documentation covers color and faceting:
import pandas as pdimport plotly.express as pxdf = pd.read_csv("wind_projects.csv").sort_values("year") # project, state, year, turbine_mwfig = px.strip(df, x="year", y="turbine_mw", hover_name="project",labels={"year": "", "turbine_mw": "Average turbine size (MW)"})fig.update_traces(jitter=0.85, marker=dict(size=6, opacity=0.55))fig.update_xaxes(type="category") # one strip per year# a short line at each year's medianfor i, (year, median) in enumerate(df.groupby("year").turbine_mw.median().items()):fig.add_shape(type="line", x0=i - 0.4, x1=i + 0.4, y0=median, y1=median, line=dict(color="black", width=3))fig.show()
px.strip returns a figure with one box trace per color, with boxpoints="all" and the box made invisible. Plotly's jitter is repeatable, so the same data gives the same picture every time, and it spreads points further where values are dense. To show the box as well, use go.Box(..., boxpoints="all") with a visible line.
In JavaScript, plotly.js draws the same thing from a box trace:
<div id="chart"></div><script src="https://cdn.plot.ly/plotly-4.1.1.min.js"></script><script>// Michelson's 1879 speed-of-light runs, experiments 4 and 5 (km/s minus 299,000; R dataset morley)const expt4 = [890, 810, 810, 820, 800, 770, 760, 740, 750, 760, 910, 920, 890, 860, 880, 720, 840, 850, 850, 780];const expt5 = [890, 840, 780, 810, 760, 810, 790, 810, 820, 850, 870, 870, 810, 740, 810, 940, 950, 800, 810, 870];const strip = (values, name) => ({type: "box", x: values.map(v => v + 299000), name: name, orientation: "h",boxpoints: "all", jitter: 0.6, pointpos: 0, // every point, spread sideways, centeredfillcolor: "rgba(0,0,0,0)", line: {width: 0}, hoveron: "points", // hide the box itselfmarker: {size: 10, color: "#2a78d6", opacity: 0.7}});Plotly.newPlot("chart", [strip(expt4, "Experiment 4"), strip(expt5, "Experiment 5")], {width: 800, height: 320, showlegend: false, margin: {l: 110, r: 20, t: 20, b: 50},xaxis: {title: {text: "Speed of light (km/s)"}, tickformat: ","},shapes: [{type: "line", x0: 299792.458, x1: 299792.458, yref: "paper", y0: 0, y1: 1,line: {color: "#008300", dash: "dash"}}] // the true value});</script>
Share it
Every Plotly chart has a Share chart button (the cloud icon in its toolbar) that uploads it to Plotly Cloud and gives you a link. Only you can see it until you change its visibility.
For a live app, put the chart in a Dash app and publish it with the Plotly Cloud CLI. Coding agents can run these commands for you:
pip install "dash[cloud]"plotly user loginplotly app publish
If your data has to stay in your own cloud or data center, publish to Dash Enterprise instead.
Dos and don'ts
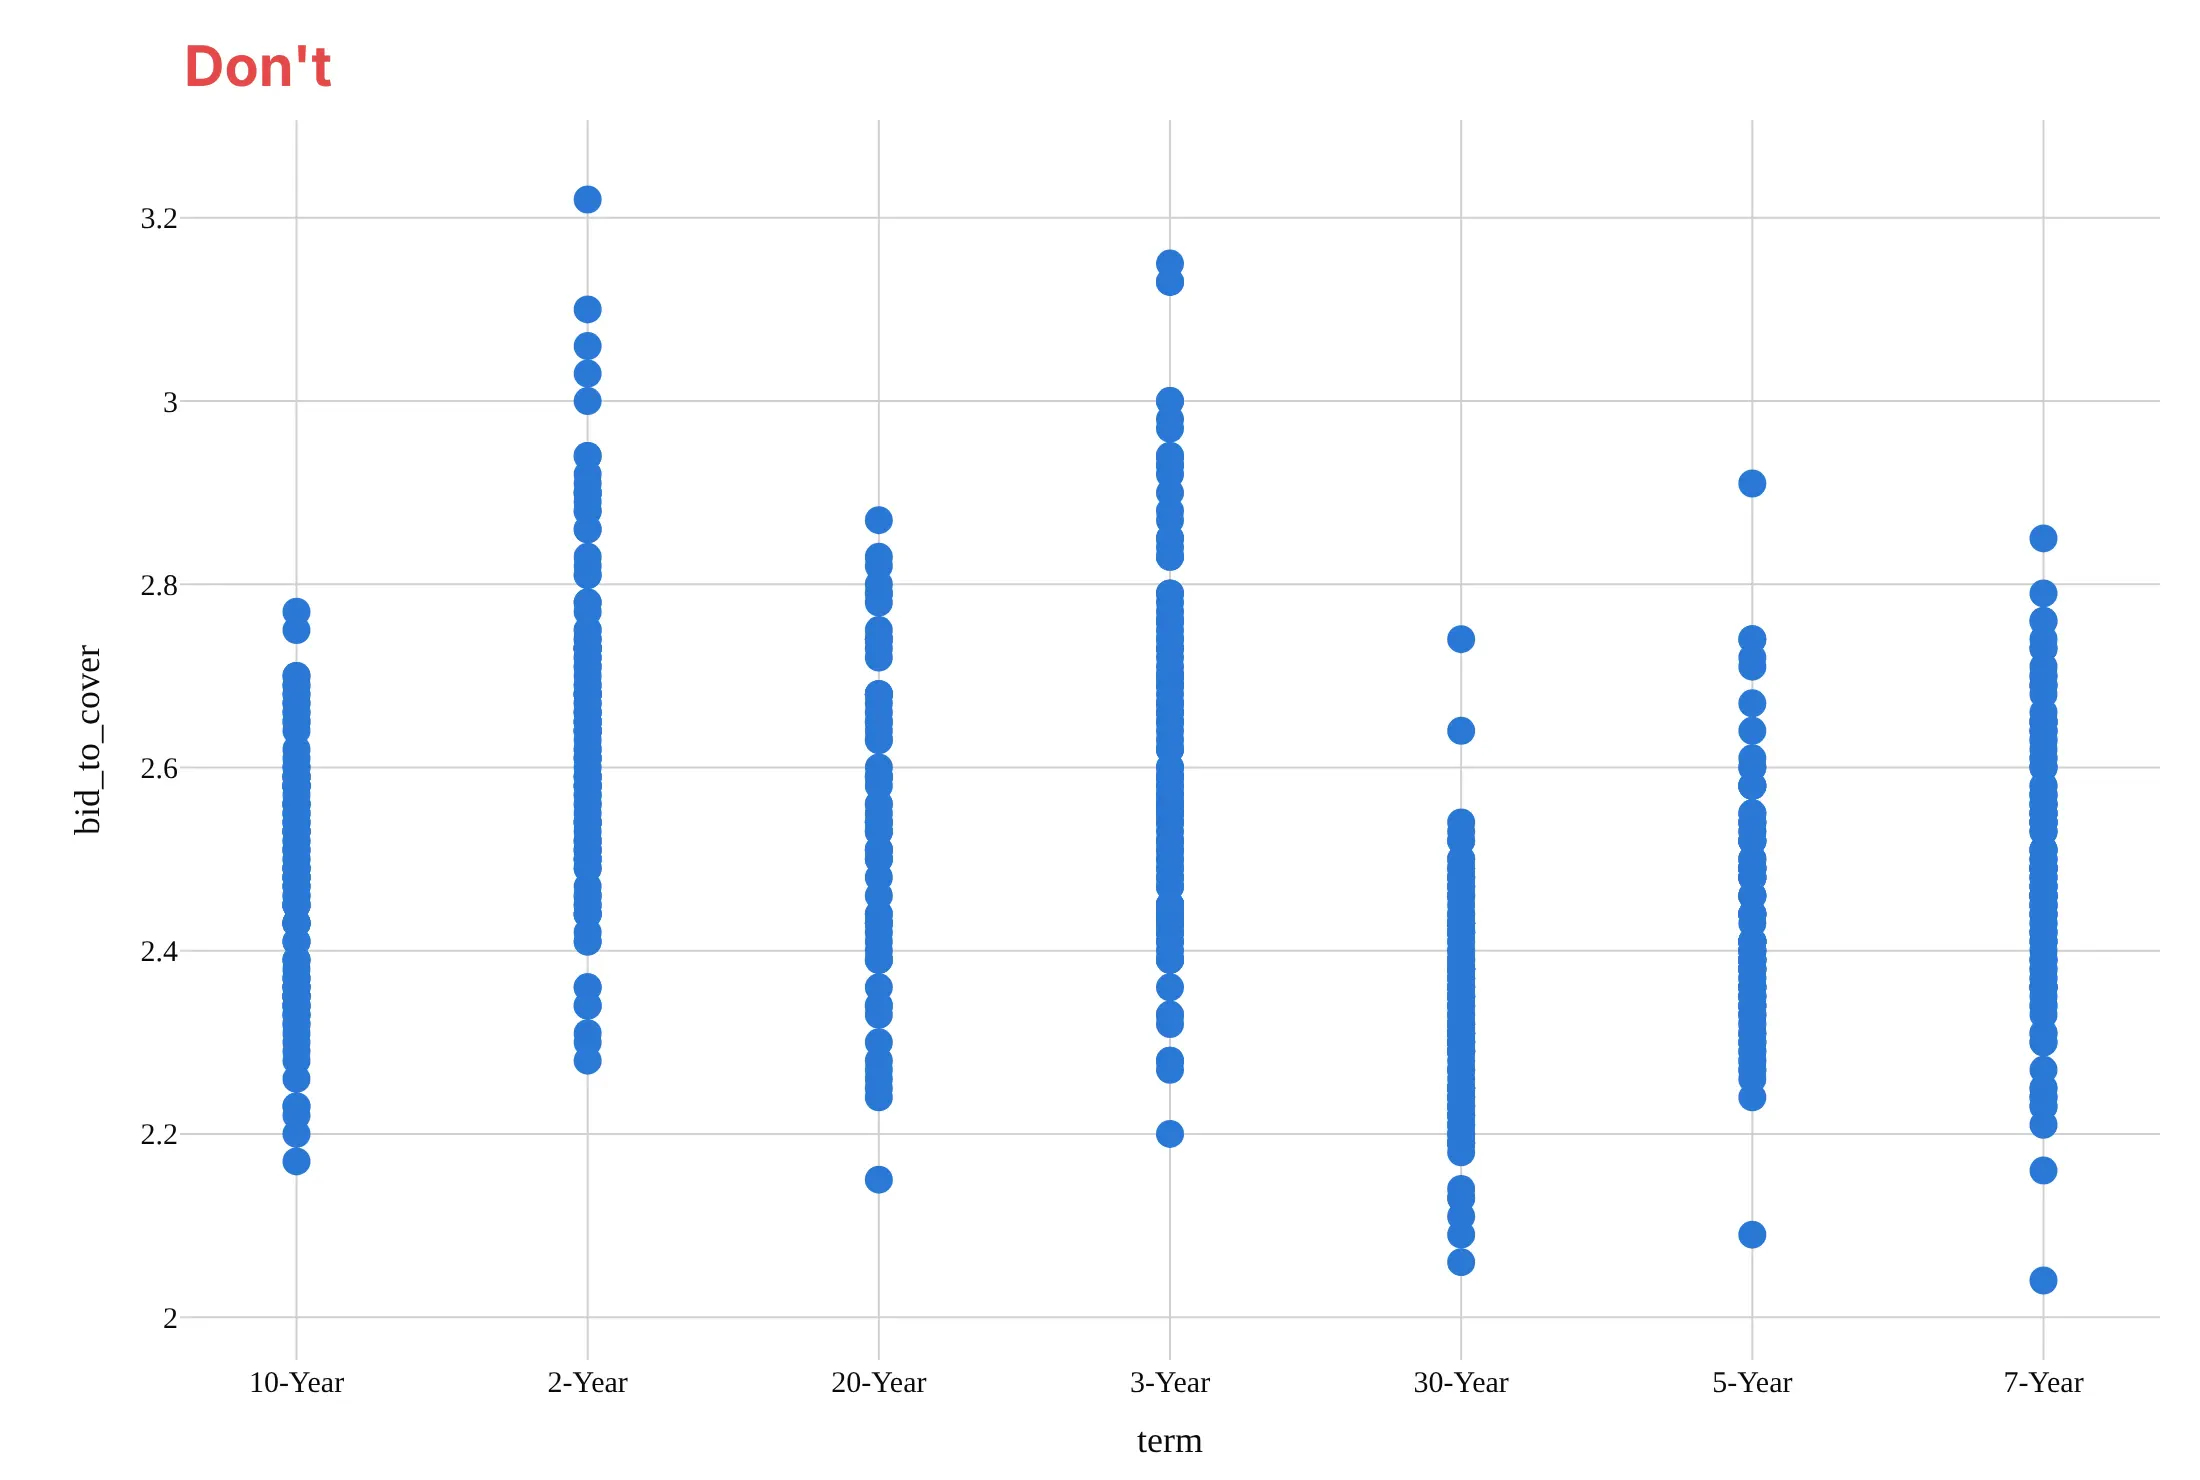
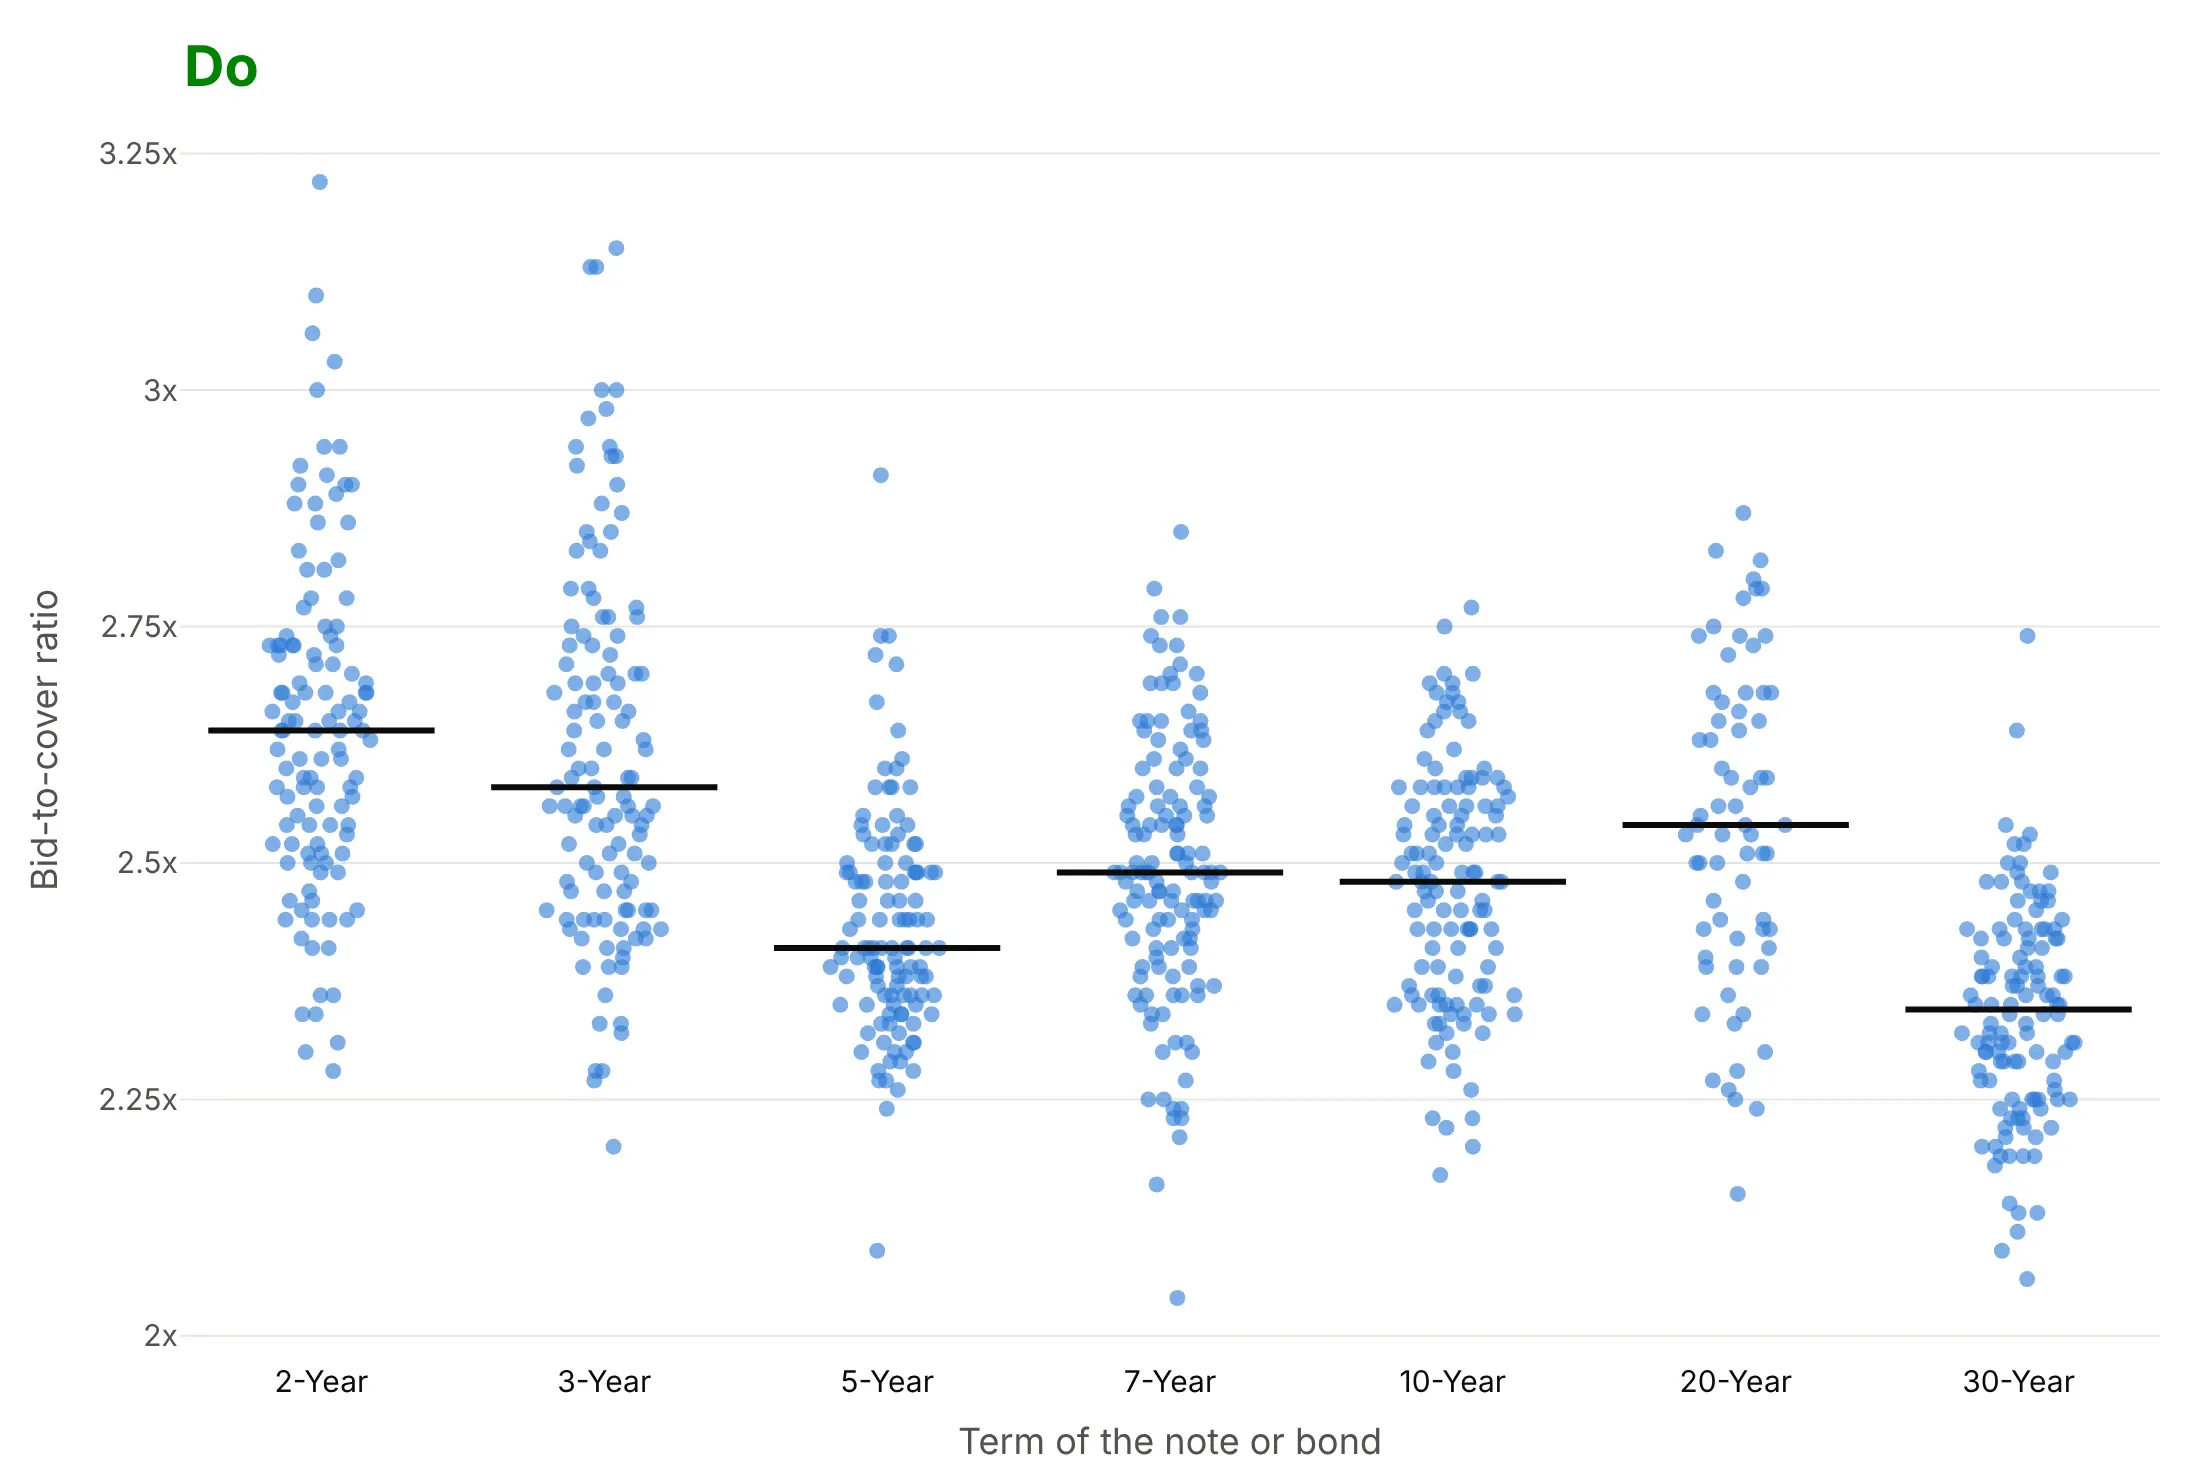
Most of the work in a published strip chart is handling ties, ordering the groups and marking a reference. Here are 788 Treasury auctions both ways, in the same color.
Don't draw the dots without jitter so auctions with the same ratio hide behind each other, use big opaque markers, leave the terms in alphabetical order (10-Year before 2-Year), or use a default serif font and raw column names as axis titles:
Do jitter the dots, make them small and partly transparent so dense areas look darker, order the terms by maturity, mark each median and format the axis:
Choose how to handle ties
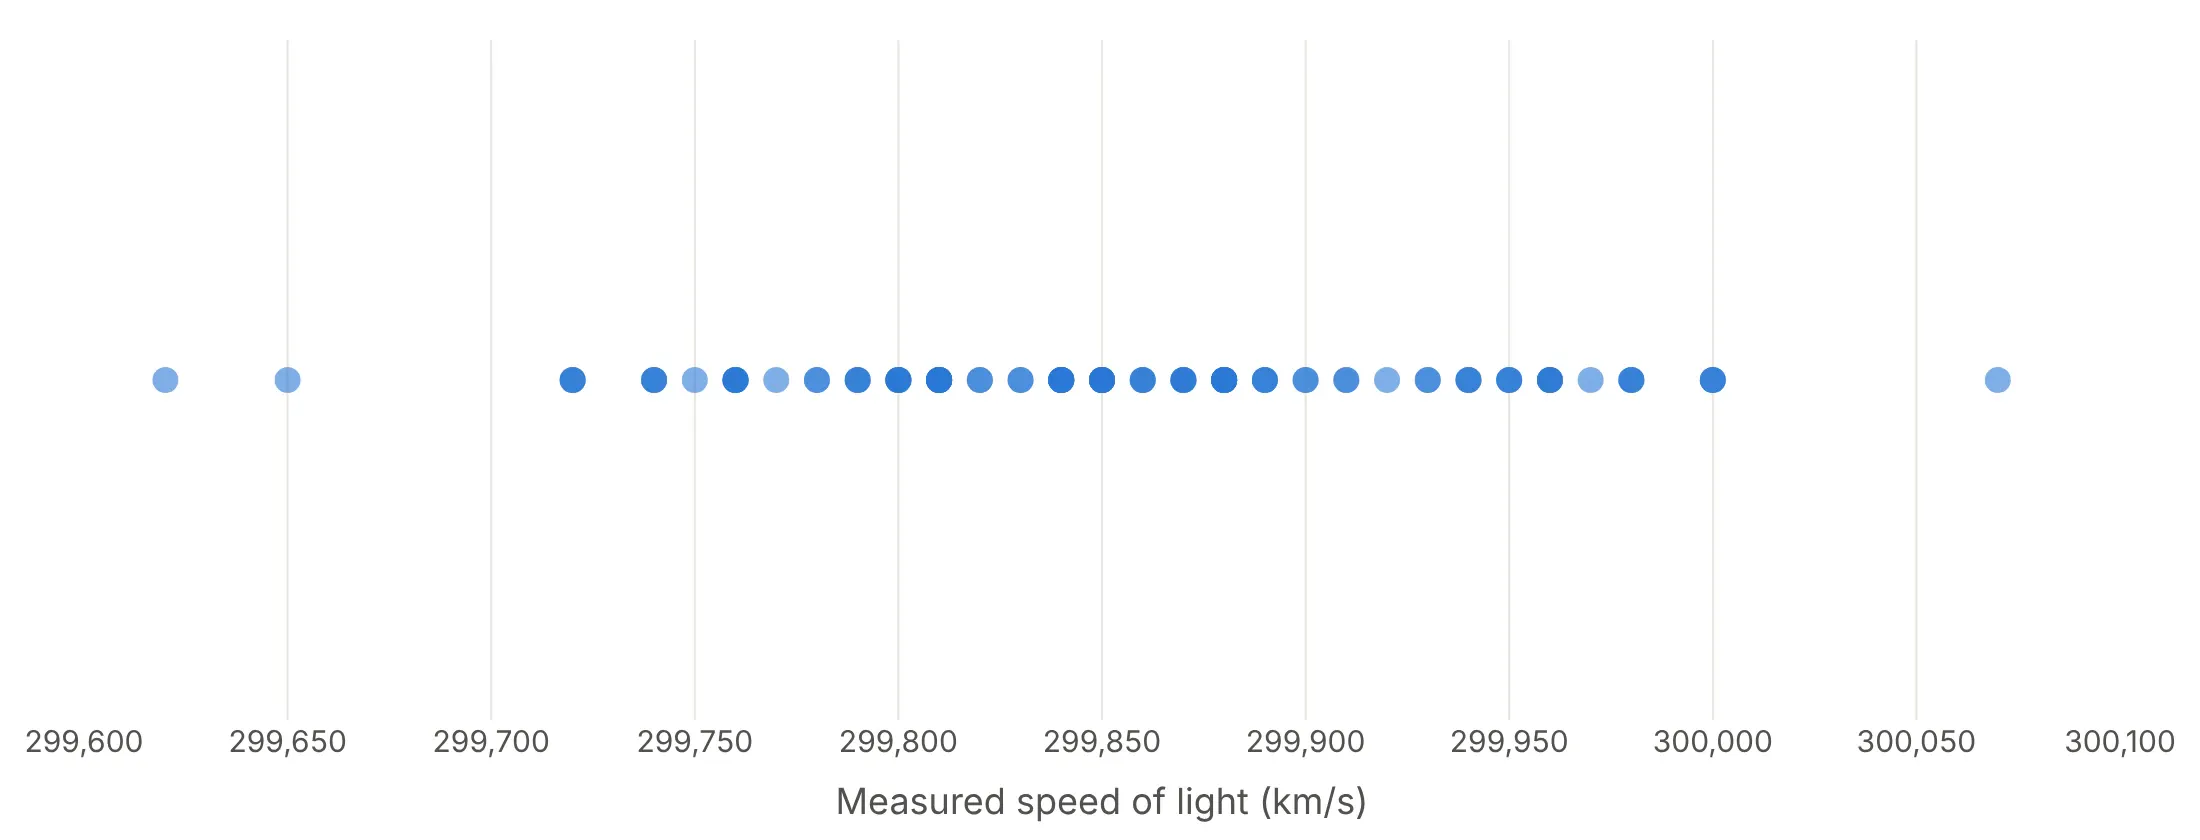
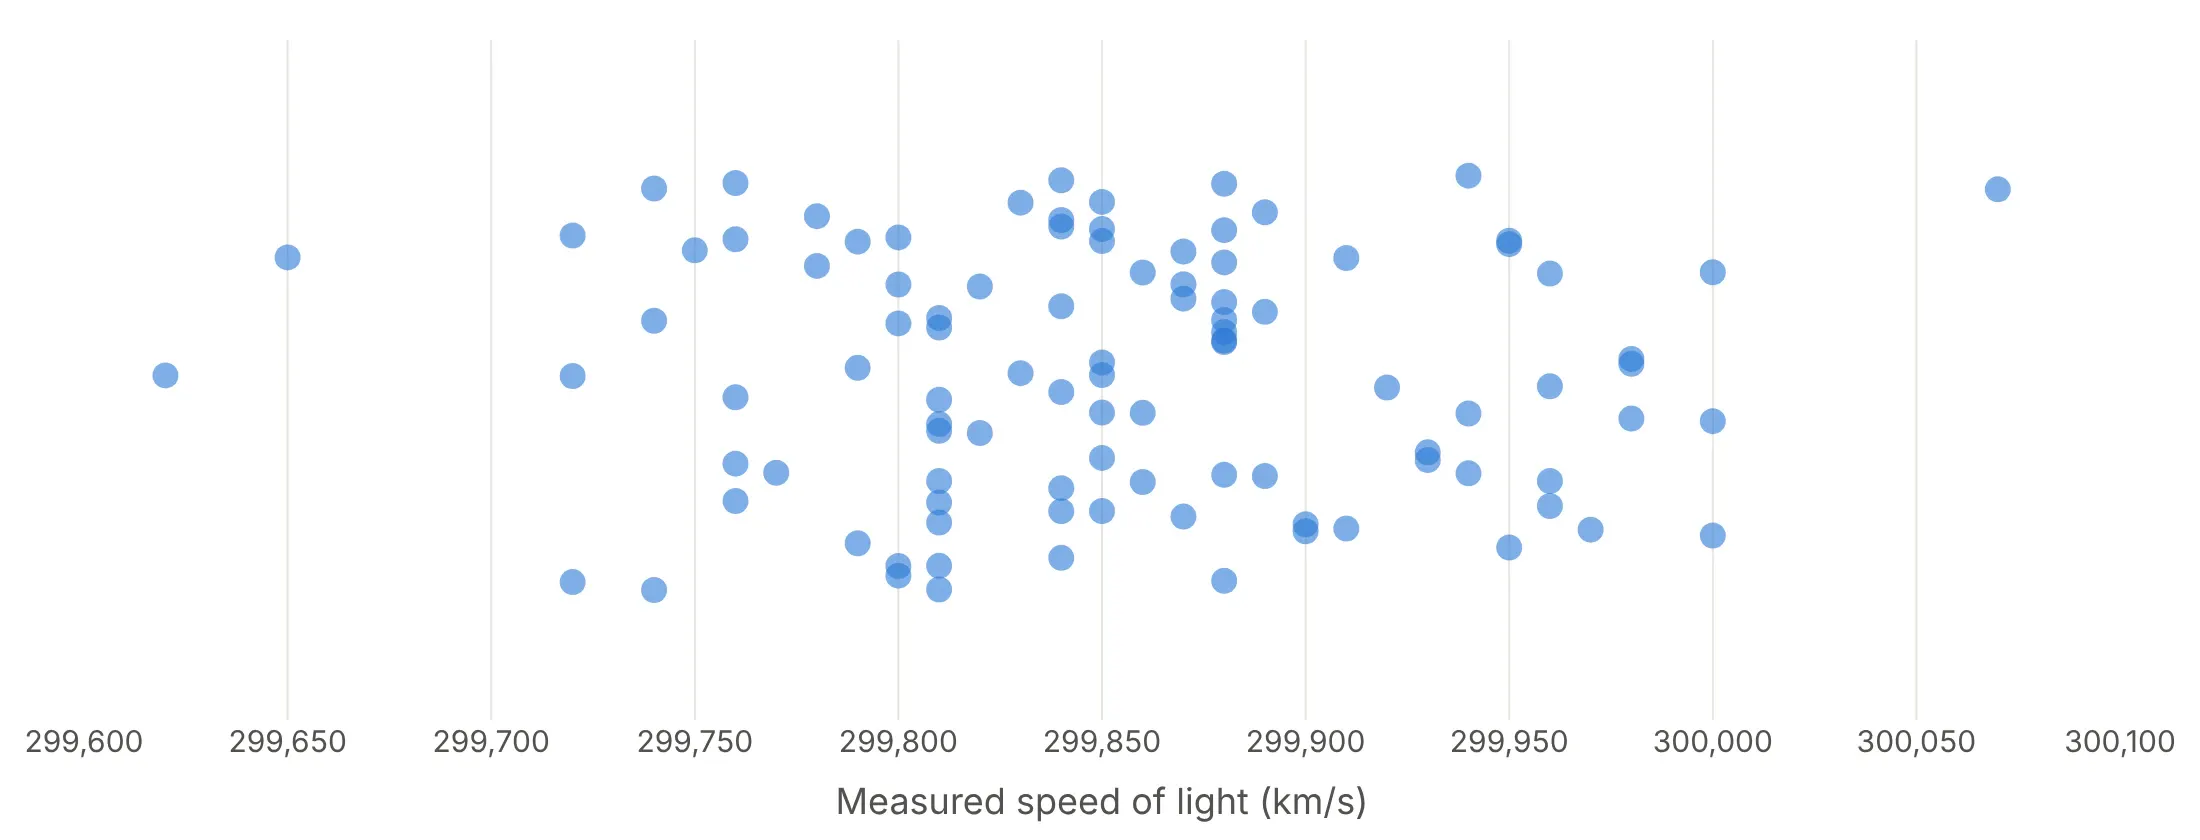
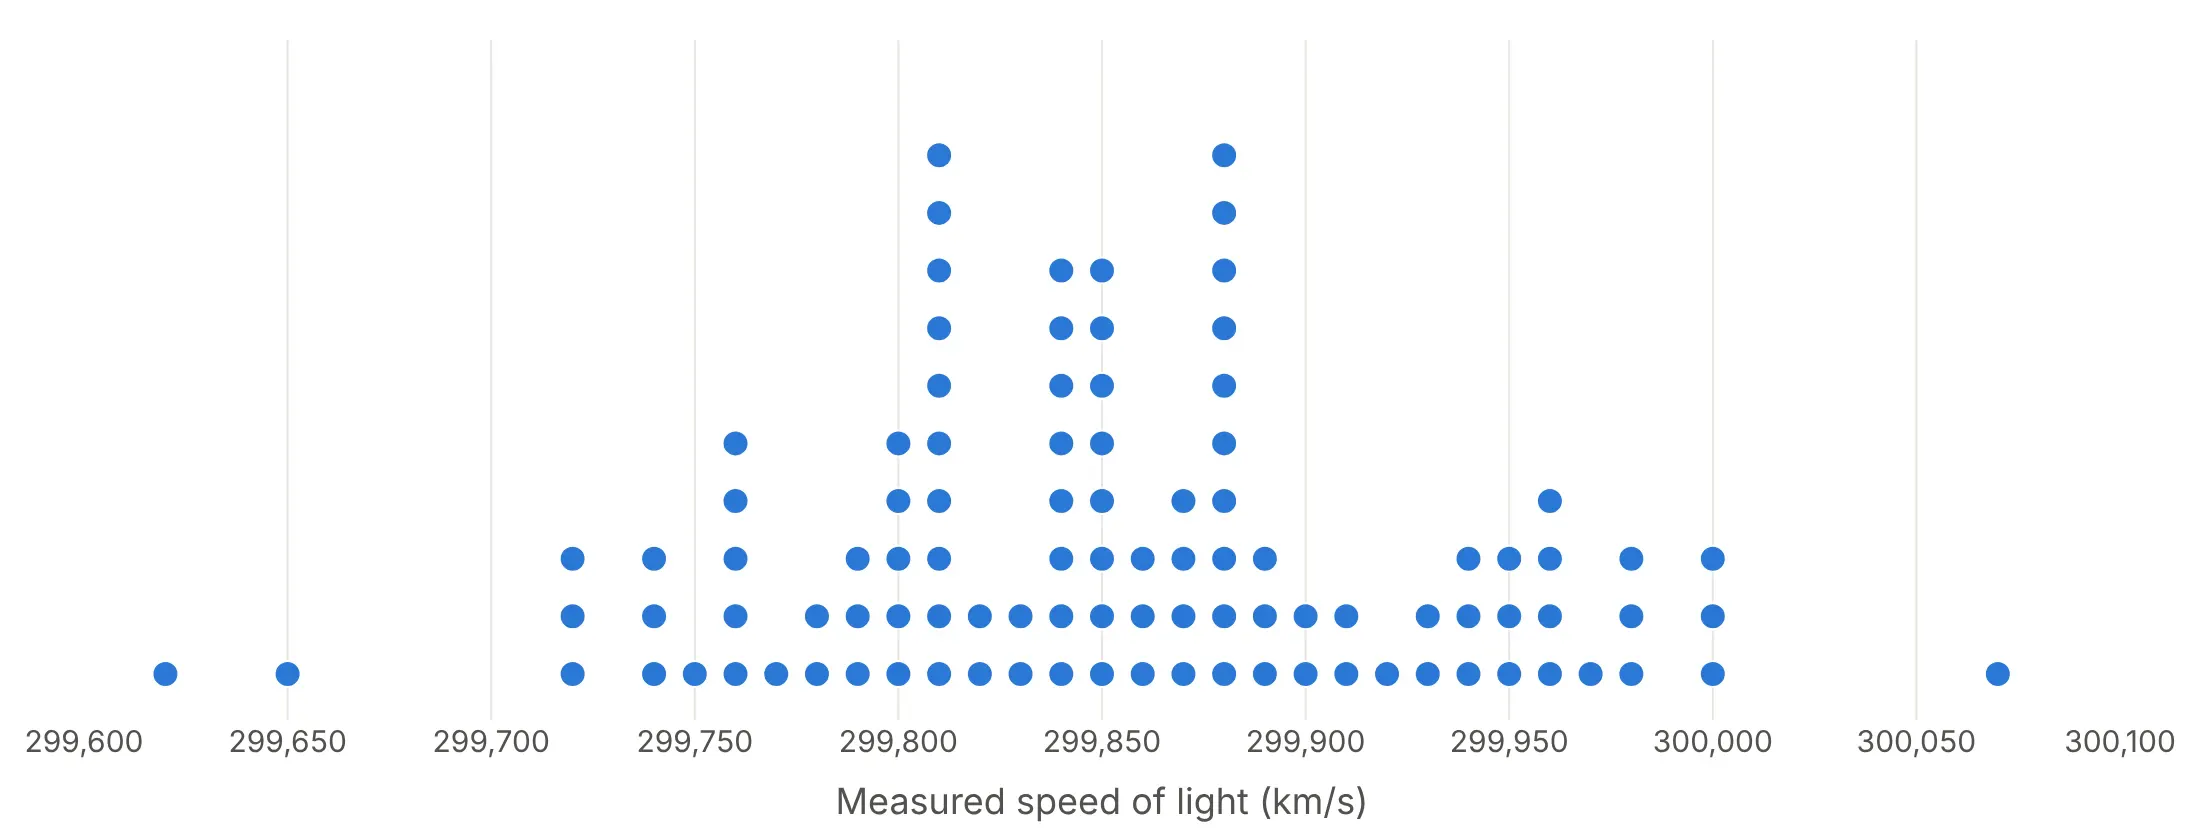
R's stripchart() offers three methods for values that repeat, and they show Michelson's 100 runs, which have only 30 distinct values, very differently.
Overplot. Every run at the same value lands on the same spot, so 100 measurements look like 30 dots.
Jitter. Random vertical offsets separate the ties. It works for any data, and px.strip jitters by default.
Stack. Ties pile up in columns, which turns the strip into a dot histogram. Use it for rounded data like this, where the stacks are exact counts.
Add a box behind the dots
A light box plot behind the dots adds the quartiles without hiding a single trial. In Plotly this is one go.Box trace with boxpoints="all" and a visible line:
Checklist
Do
- Jitter or stack tied values, so every observation is visible.
- Use small, partly transparent markers above a few hundred points per group.
- Order groups by something meaningful (time, maturity, median), not alphabetically.
- Mark each group's median or mean with a short line, and add reference lines (a deadline, a true value, zero).
- Put each point's name in the hover text, and label the few points the story needs.
- Write a title that states the takeaway.
Don't
- Use a strip chart for tens of thousands of points per group; switch to a histogram, violin or ECDF.
- Read meaning into the jitter direction; it carries no data.
- Use so much jitter that neighboring groups' dots run into each other.
Options to customize
A strip chart in Plotly is px.strip or a go.Box trace with its points shown, so these are the options that matter most. The full lists are in the px.strip reference and the box trace reference.
- px.strip(x=..., y=...): the value column on one axis and the group column on the other; swap them for horizontal strips.
- color, stripmode="group": a second grouping drawn side by side within each group, as in the guinea pig example below.
- facet_col, facet_row: small multiples of strip charts.
- jitter: the width of the sideways spread, from 0 (none) to 1 (the full width of the group).
- pointpos: where the points sit relative to the group center; 0 centers them.
- boxpoints="all" (go.Box): shows every point; with line_width=0 and a transparent fillcolor it hides the box.
- marker.size, marker.opacity: 10-12 px and opaque for small groups, 3-6 px and 0.3-0.6 opacity for thousands of points.
- hover_name, hover_data, hovertemplate: the item's name and details on hover.
- category_orders or xaxis.categoryarray: the order of the groups.
- add_shape, add_vline, add_hline, add_vrect: median lines, deadlines, true values and shaded windows.
- xaxis.type="log": a log value axis for data that spans orders of magnitude; shapes take data values, annotations take log10 of them.
- go.Scattergl: WebGL markers with jitter you compute yourself, for more than about 50,000 points.
More strip chart examples
Eight more strip charts built from real public data, each with its source, the technique that makes it work and a prompt to rebuild it. Several use the small textbook experiments that strip charts are best known for, from R's built-in datasets.
1. The 1905 sleep trial behind Student's t-test
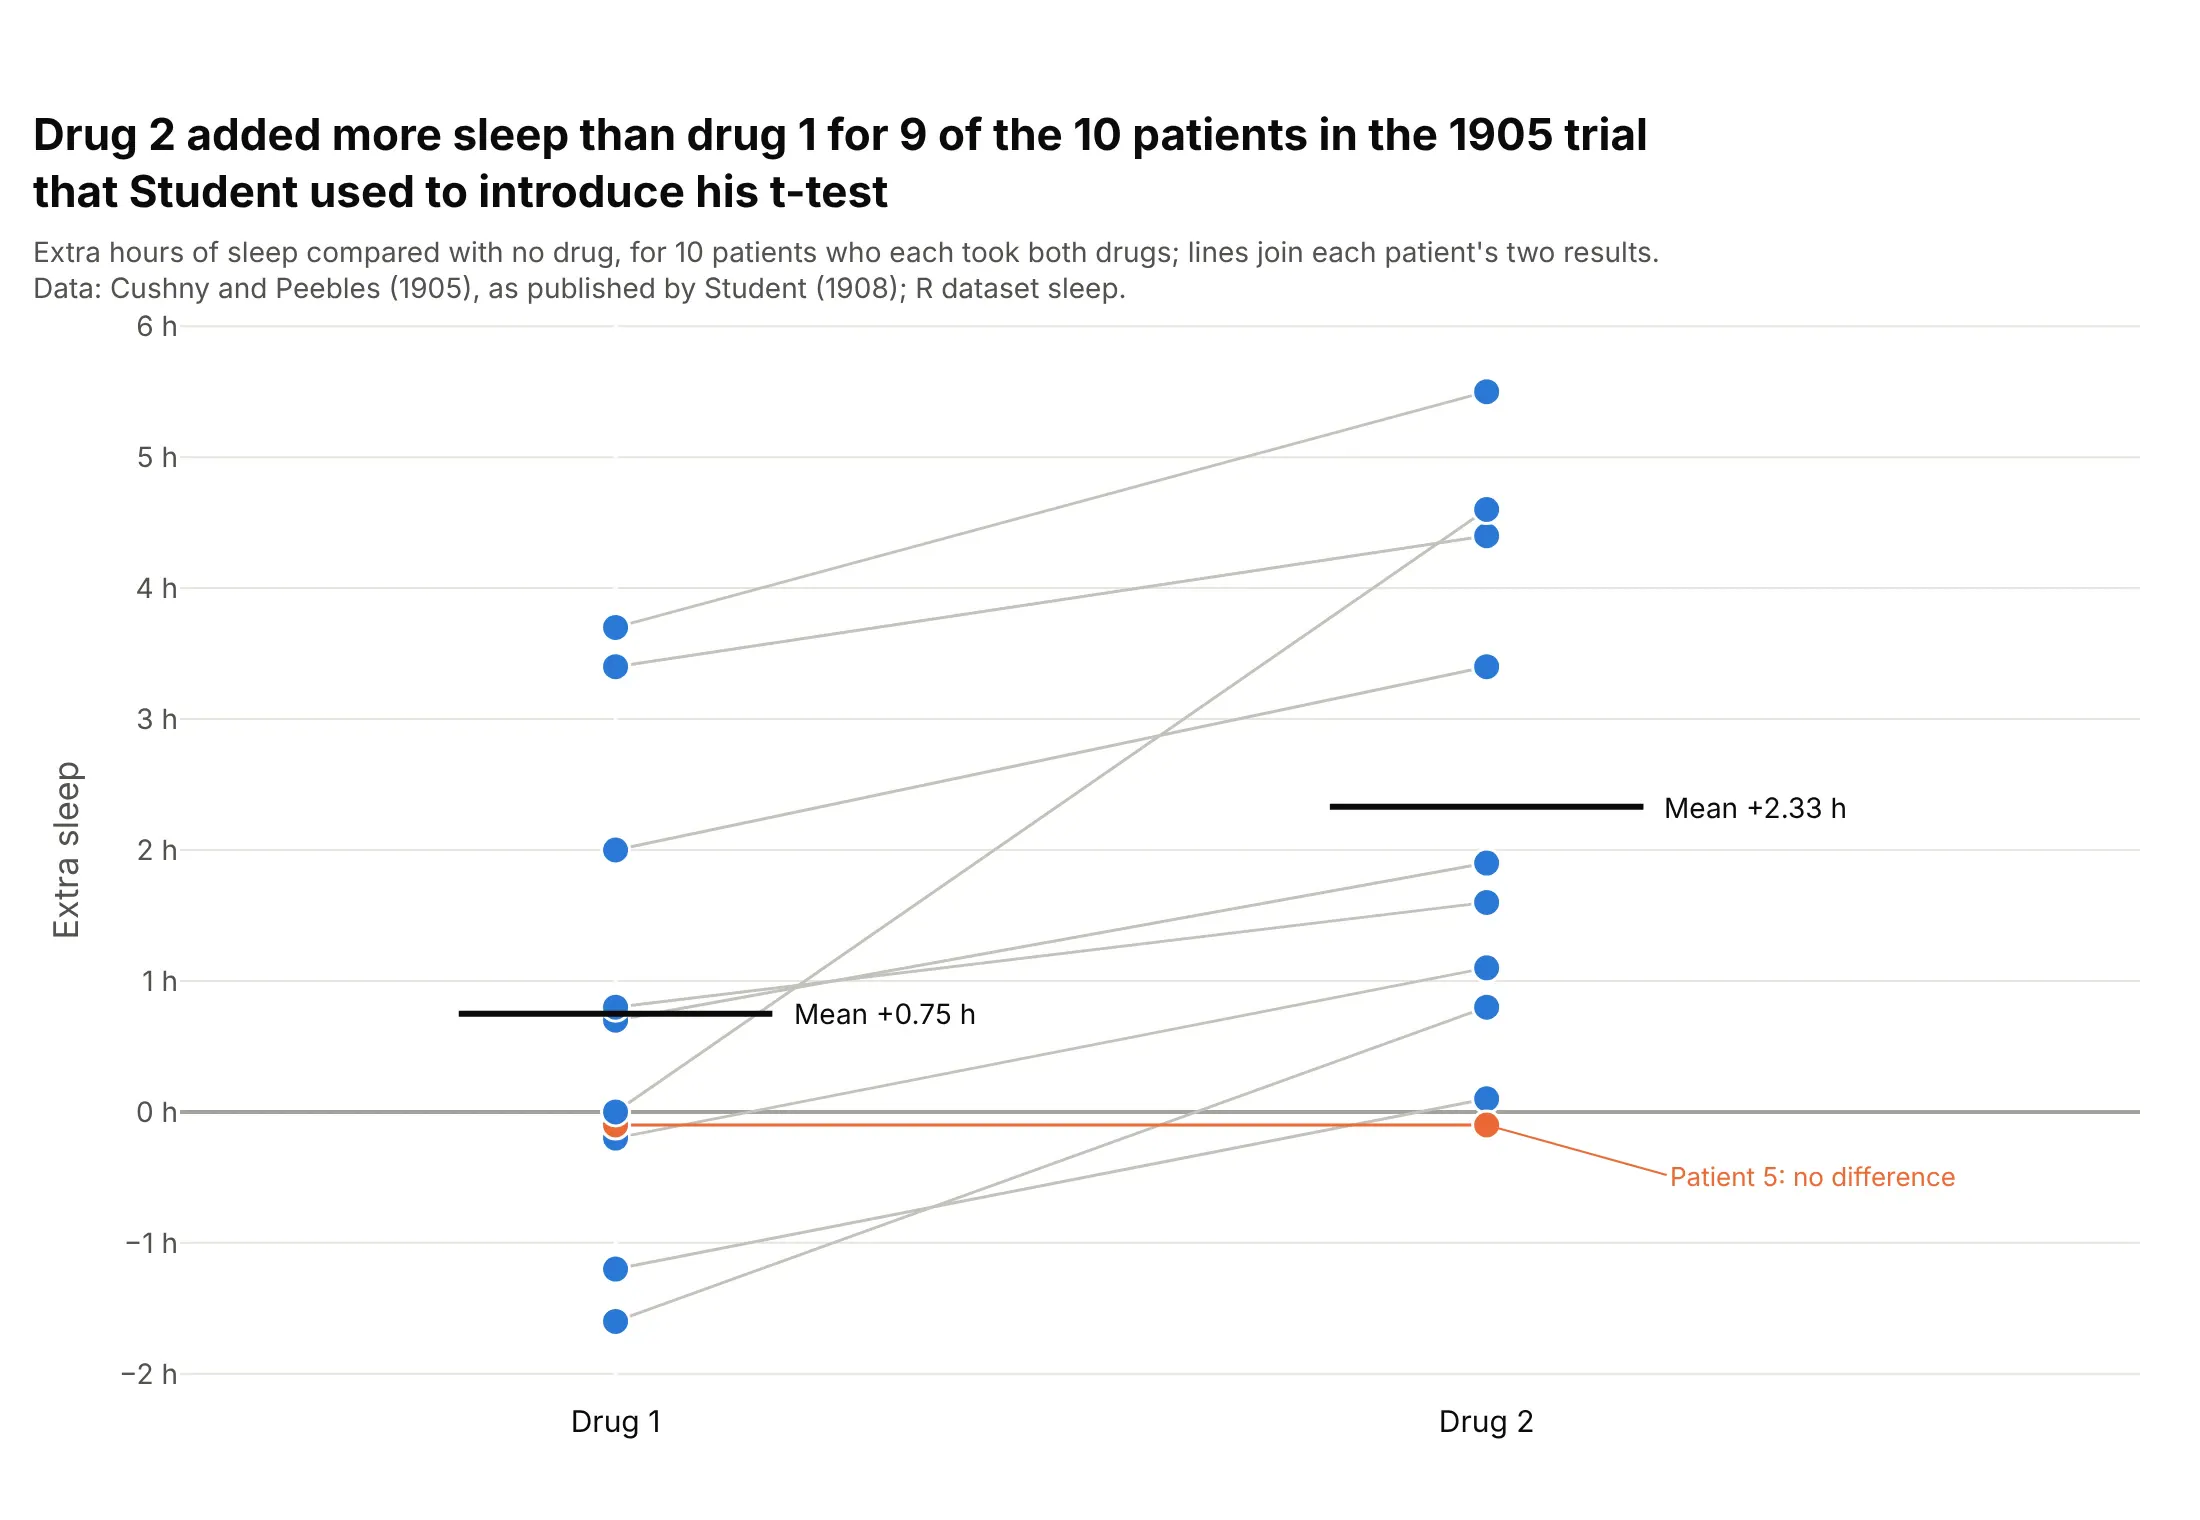
Drug 2 added more sleep than drug 1 for 9 of 10 patients, and the mean difference was 1.58 hours. Student used these data in the 1908 paper that introduced his t-test. Data: Cushny and Peebles (1905) via Student (1908), R dataset sleep.
Tip: when each subject is measured twice, join the two dots with a light line so the pairing shows.
Get the data from R's built-in sleep dataset (Cushny and Peebles 1905, as used by Student 1908) andshape it into a table (columns: patient, drug, extra_hours).Build a plotly strip chart: one column per drug, 14 px dots, a gray line joining each patient's twovalues, a short dark bar at each drug's mean, and the patient with no difference in orange.
2. Demand at US Treasury auctions
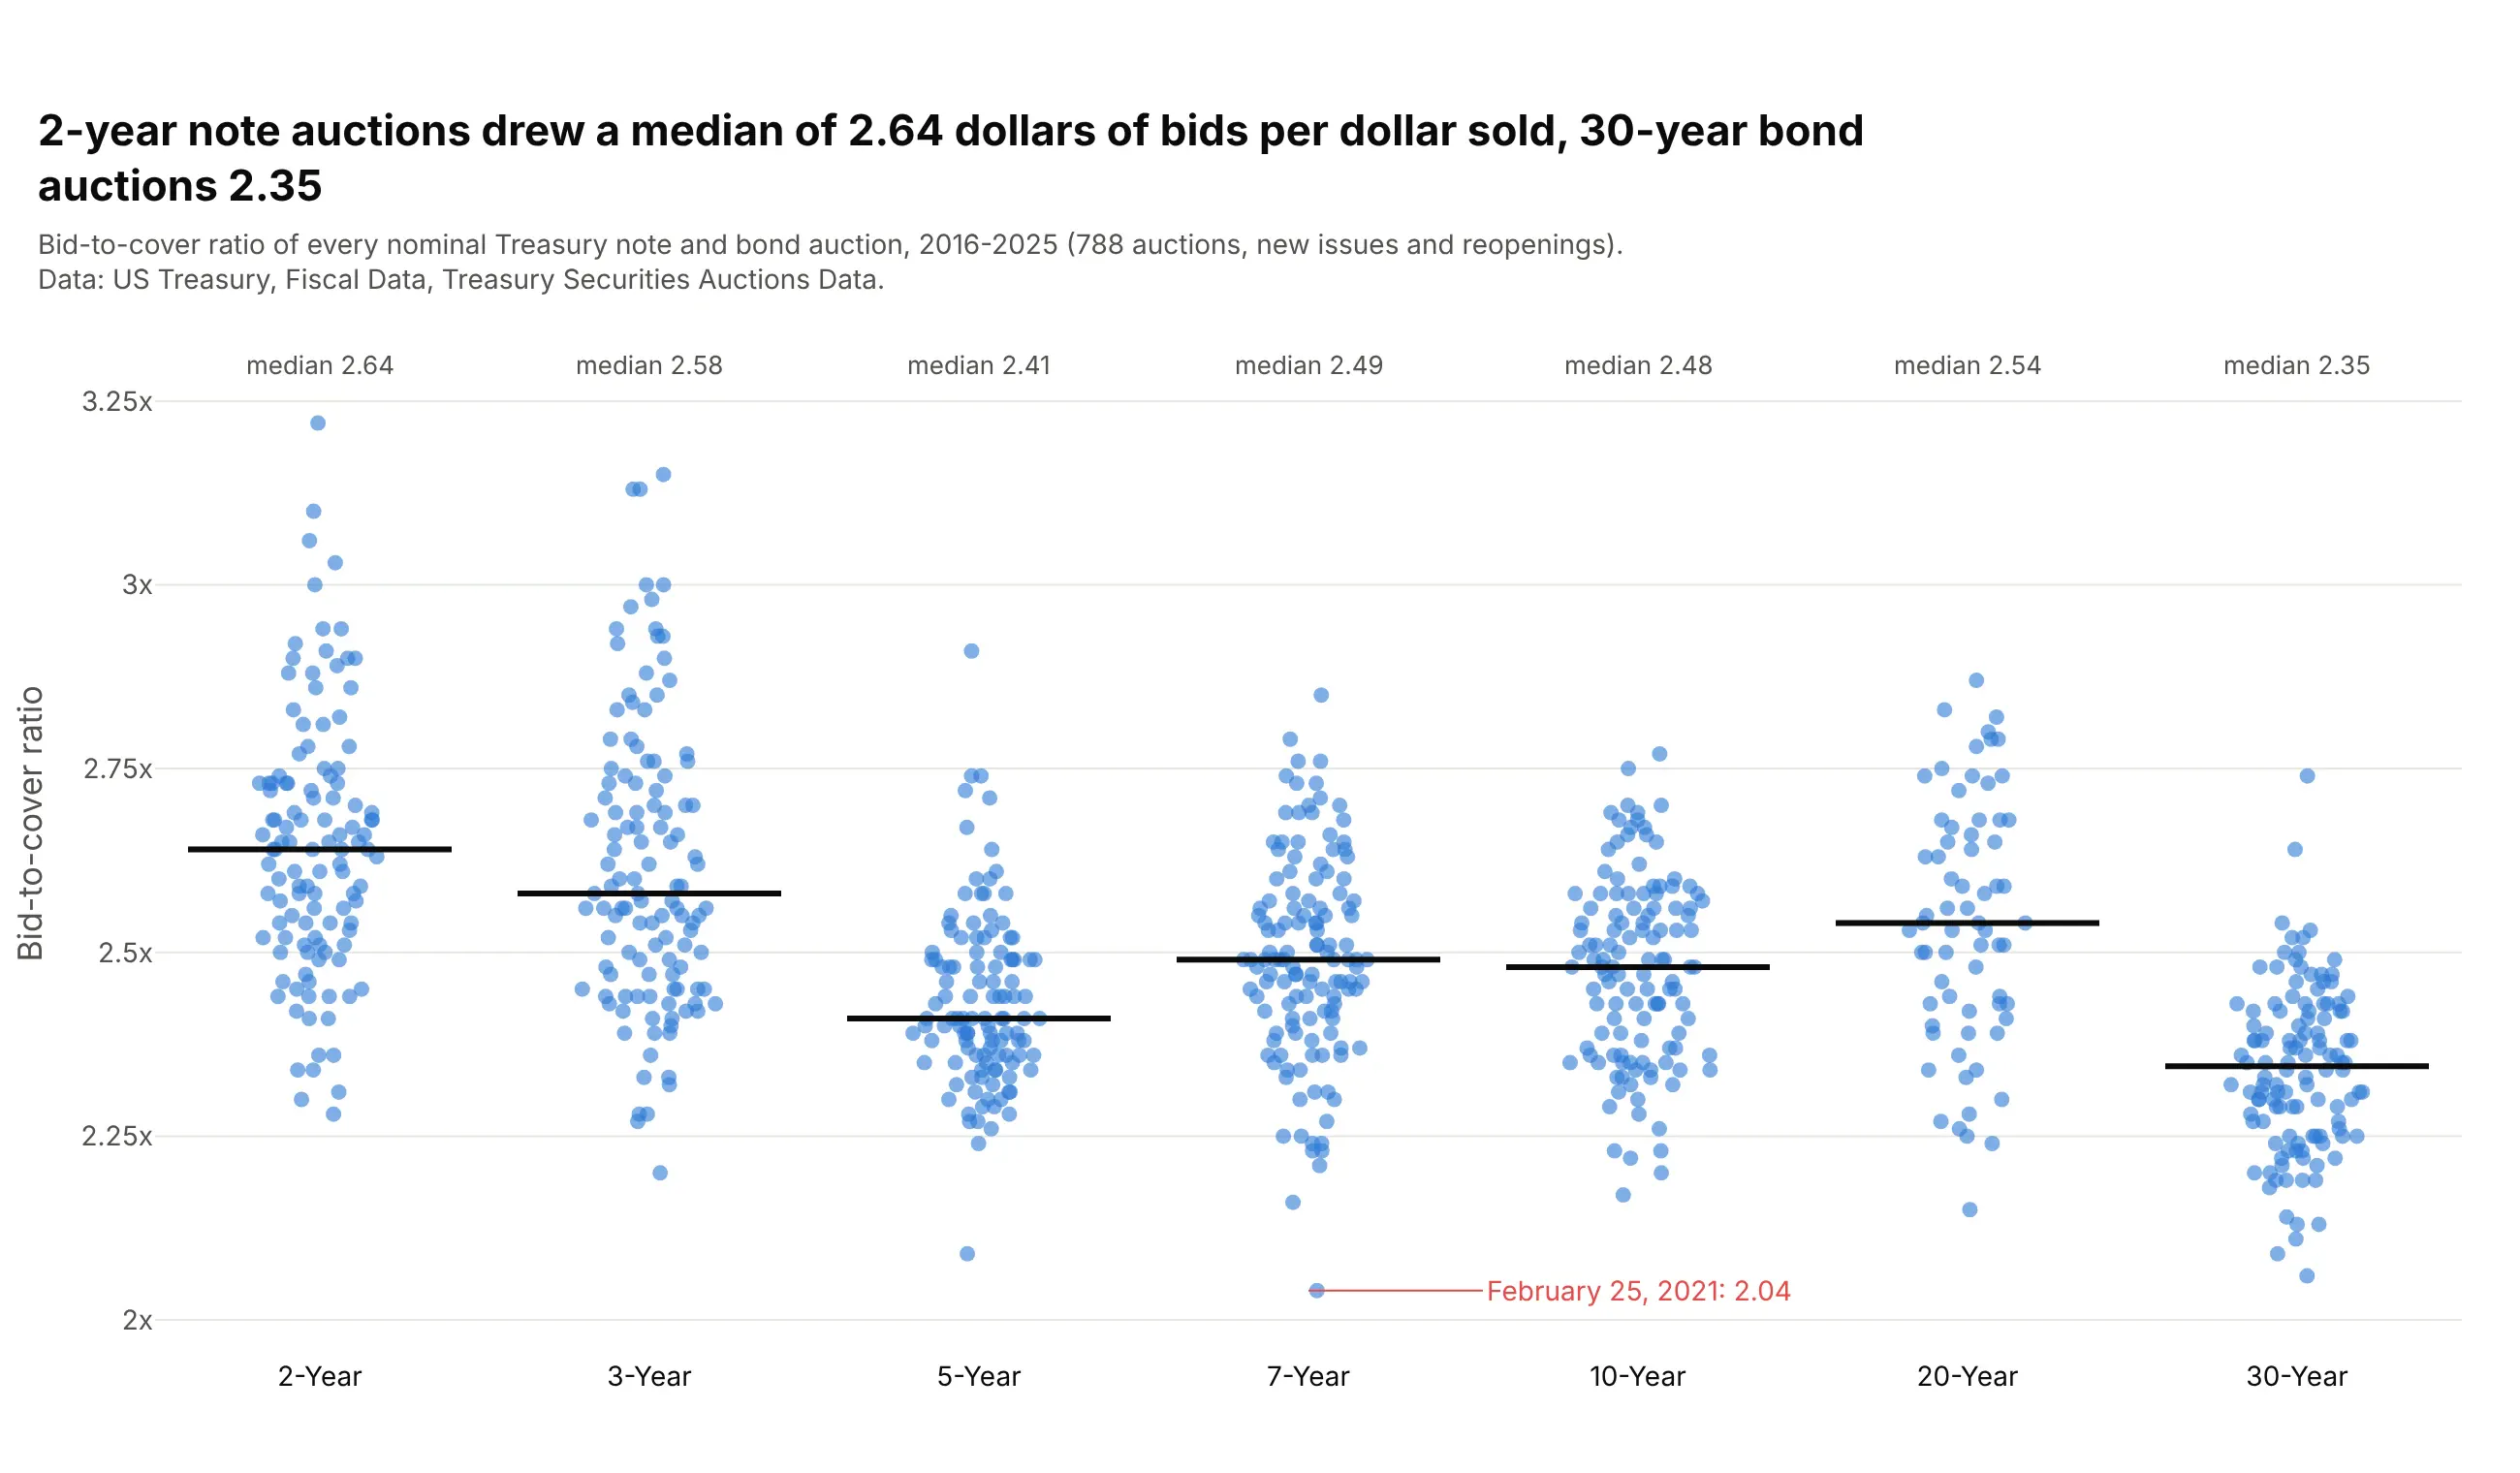
2-year note auctions drew a median of 2.64 dollars of bids per dollar sold from 2016 to 2025, and 30-year bonds 2.35. The weakest of 788 auctions was a 7-year note on February 25, 2021, at 2.04. Data: US Treasury, Fiscal Data, Treasury Securities Auctions Data.
Tip: with about 120 points per group, a strip shows the single weak auctions that a box plot would fold into a whisker.
Get the data from the US Treasury's Fiscal Data API (Treasury Securities Auctions Data, auctions_query),nominal notes and bonds auctioned 2016-2025, and shape it into a table (columns: auction_date, term,years, offering_bn, bid_to_cover).Build a plotly strip chart: one column per term in order of maturity, jitter 0.9, 8 px dots at 0.6 opacity,a median line and label per term, and the lowest auction labeled with its date.
3. Electricity per person in 195 countries
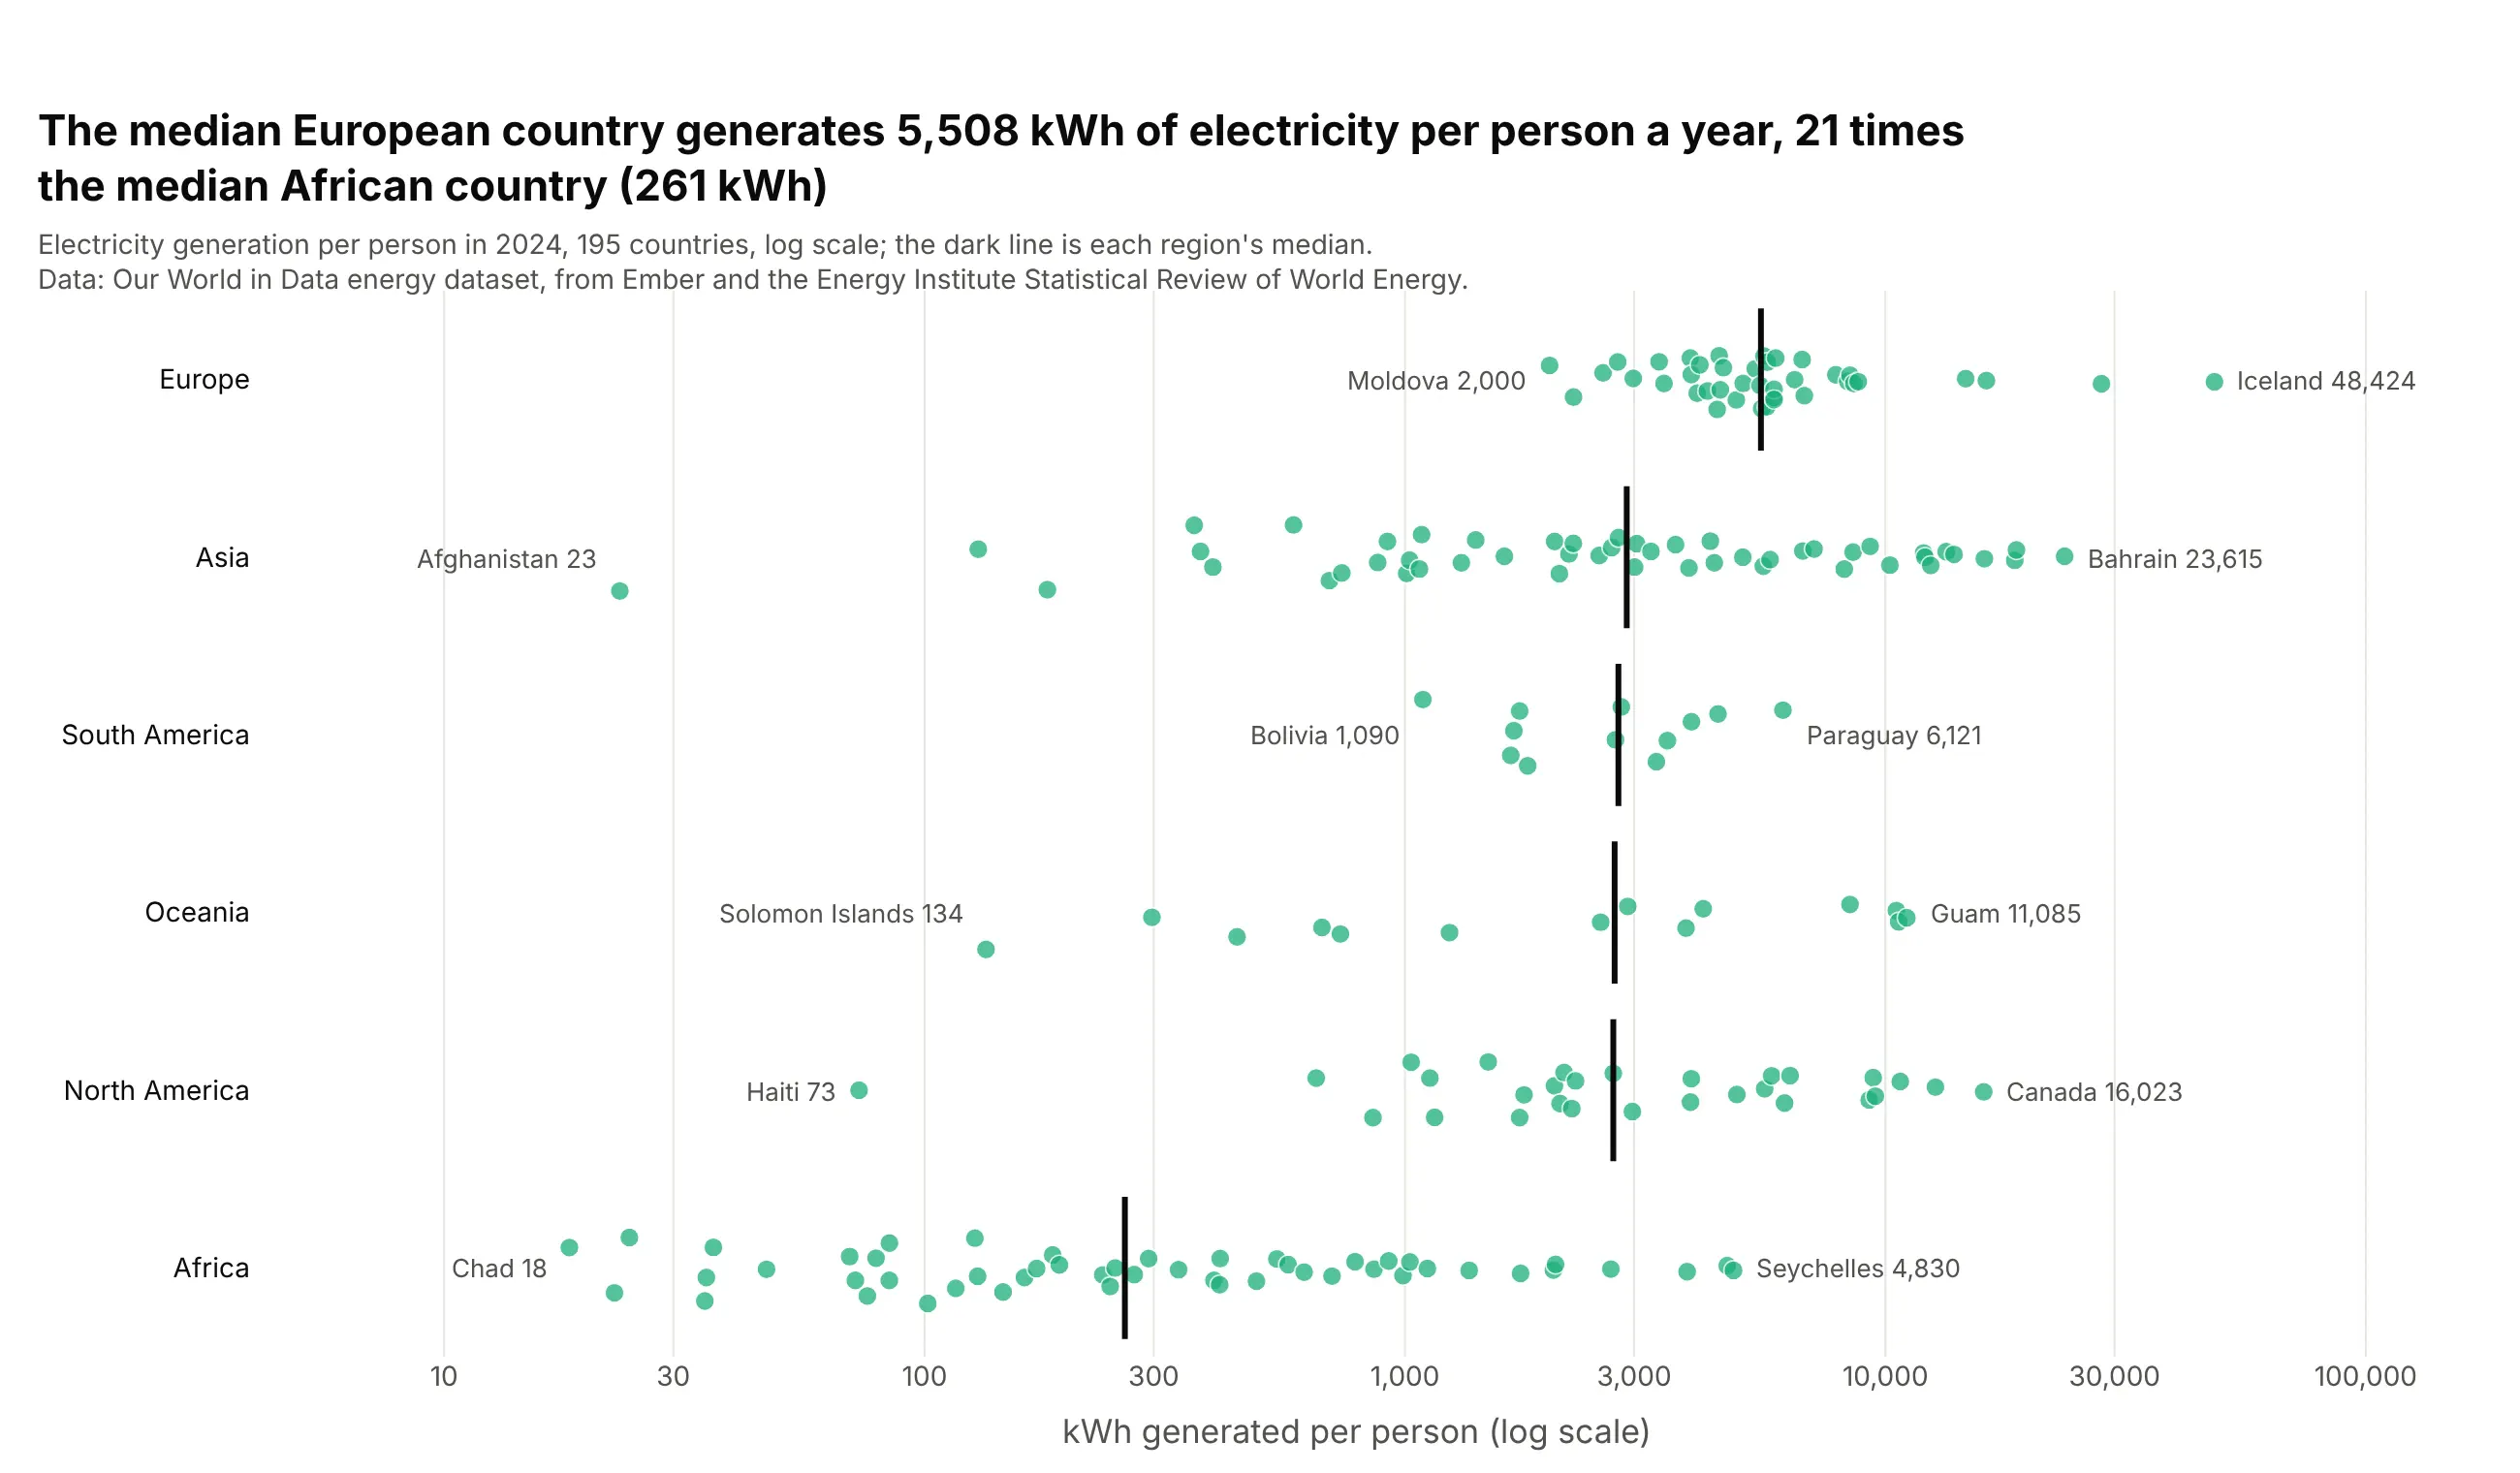
The median European country generated 5,508 kWh of electricity per person in 2024, 21 times the median African country (261 kWh). Iceland, at 48,424 kWh, generates about 2,700 times as much per person as Chad (18 kWh). Data: Our World in Data, from Ember and the Energy Institute.
Tip: use a log axis when values span orders of magnitude, and label only each row's lowest and highest country.
Get the data from Our World in Data's energy dataset (github.com/owid/energy-data, from Ember and theEnergy Institute), year 2024, countries only, with OWID's world regions, and shape it into a table(columns: country, region, kwh_per_person).Build a plotly strip chart: one row per region sorted by median, x = kwh_per_person on a log axis,a median tick per row, and the lowest and highest country in each region labeled.
4. Ten years of WTI crude oil prices
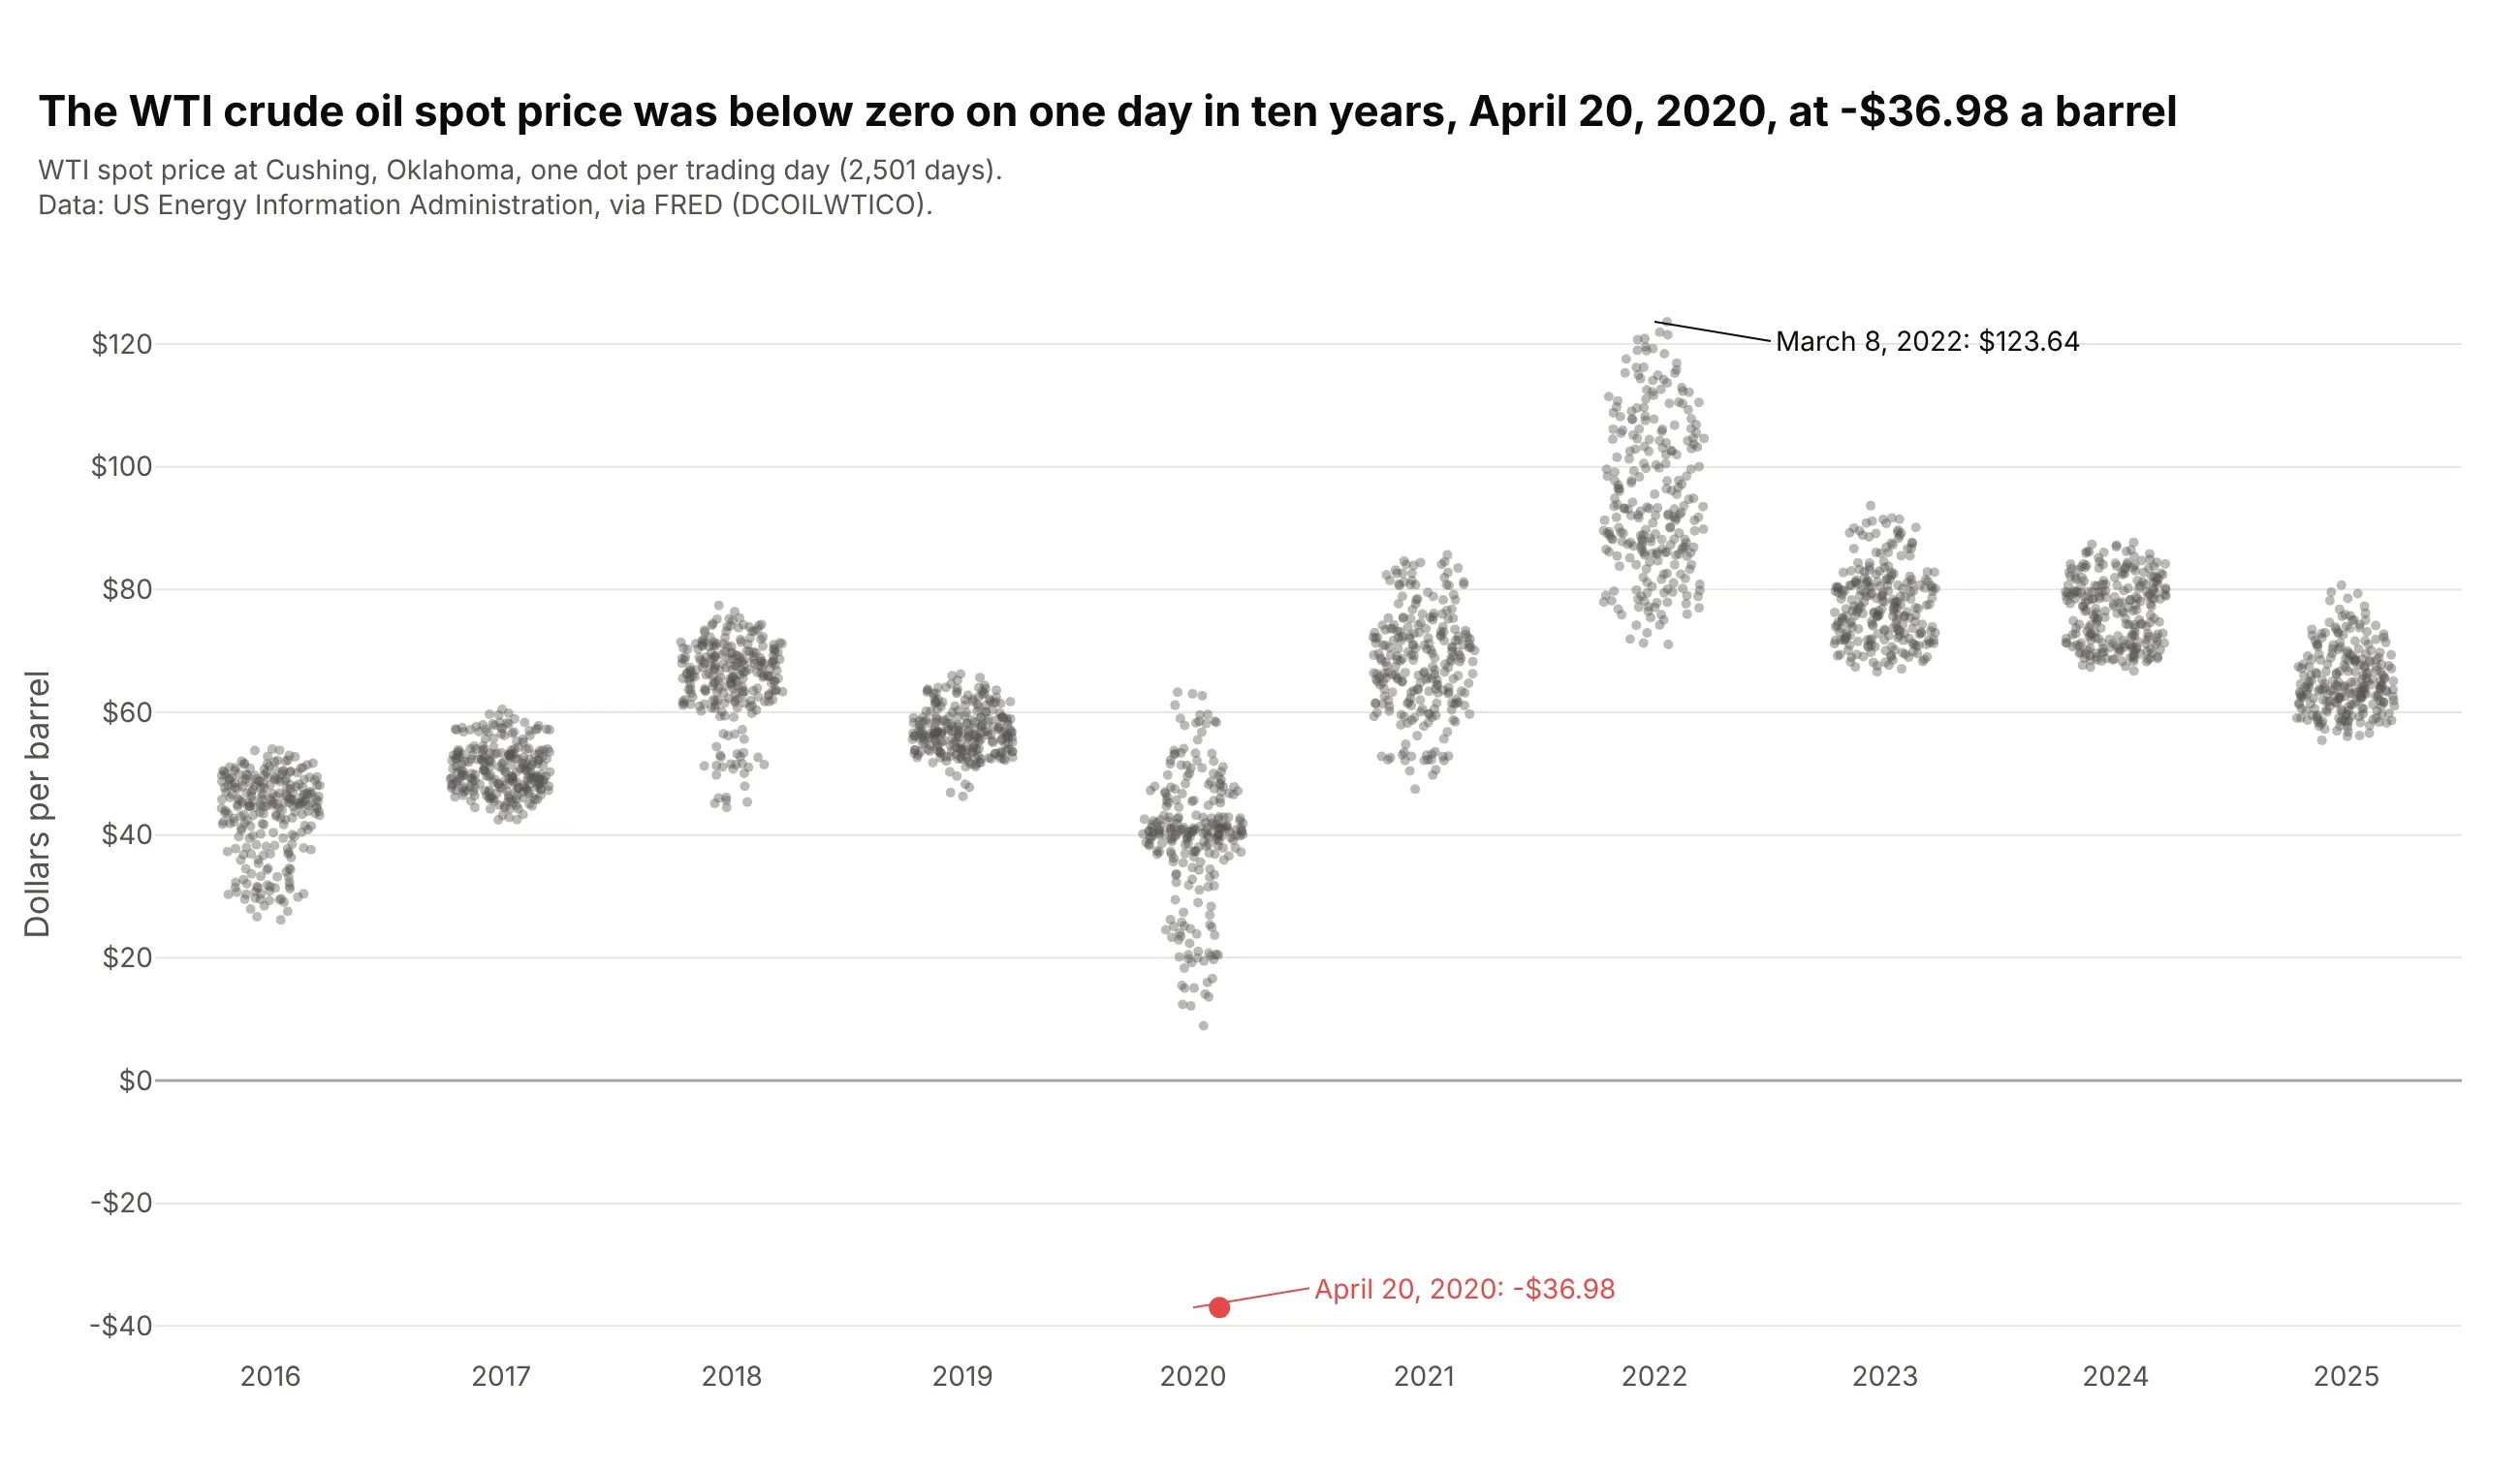
The WTI spot price was below zero on one day in ten years, April 20, 2020, at -$36.98 a barrel. One strip per year shows each year's range and leaves that day on its own. Data: US EIA via FRED (DCOILWTICO).
Tip: draw the outlier as its own trace in a strong color, after the gray crowd, so it sits on top.
Get the data from the US EIA's daily WTI spot price at Cushing, Oklahoma (FRED series DCOILWTICO),2016-2025, and shape it into a table (columns: date, year, price).Build a plotly strip chart: one column per year, 5 px gray dots at 0.4 opacity, the one negative dayas a separate red trace with a label, the highest price labeled, and a line at $0.
5. How old Nobel laureates are when they win
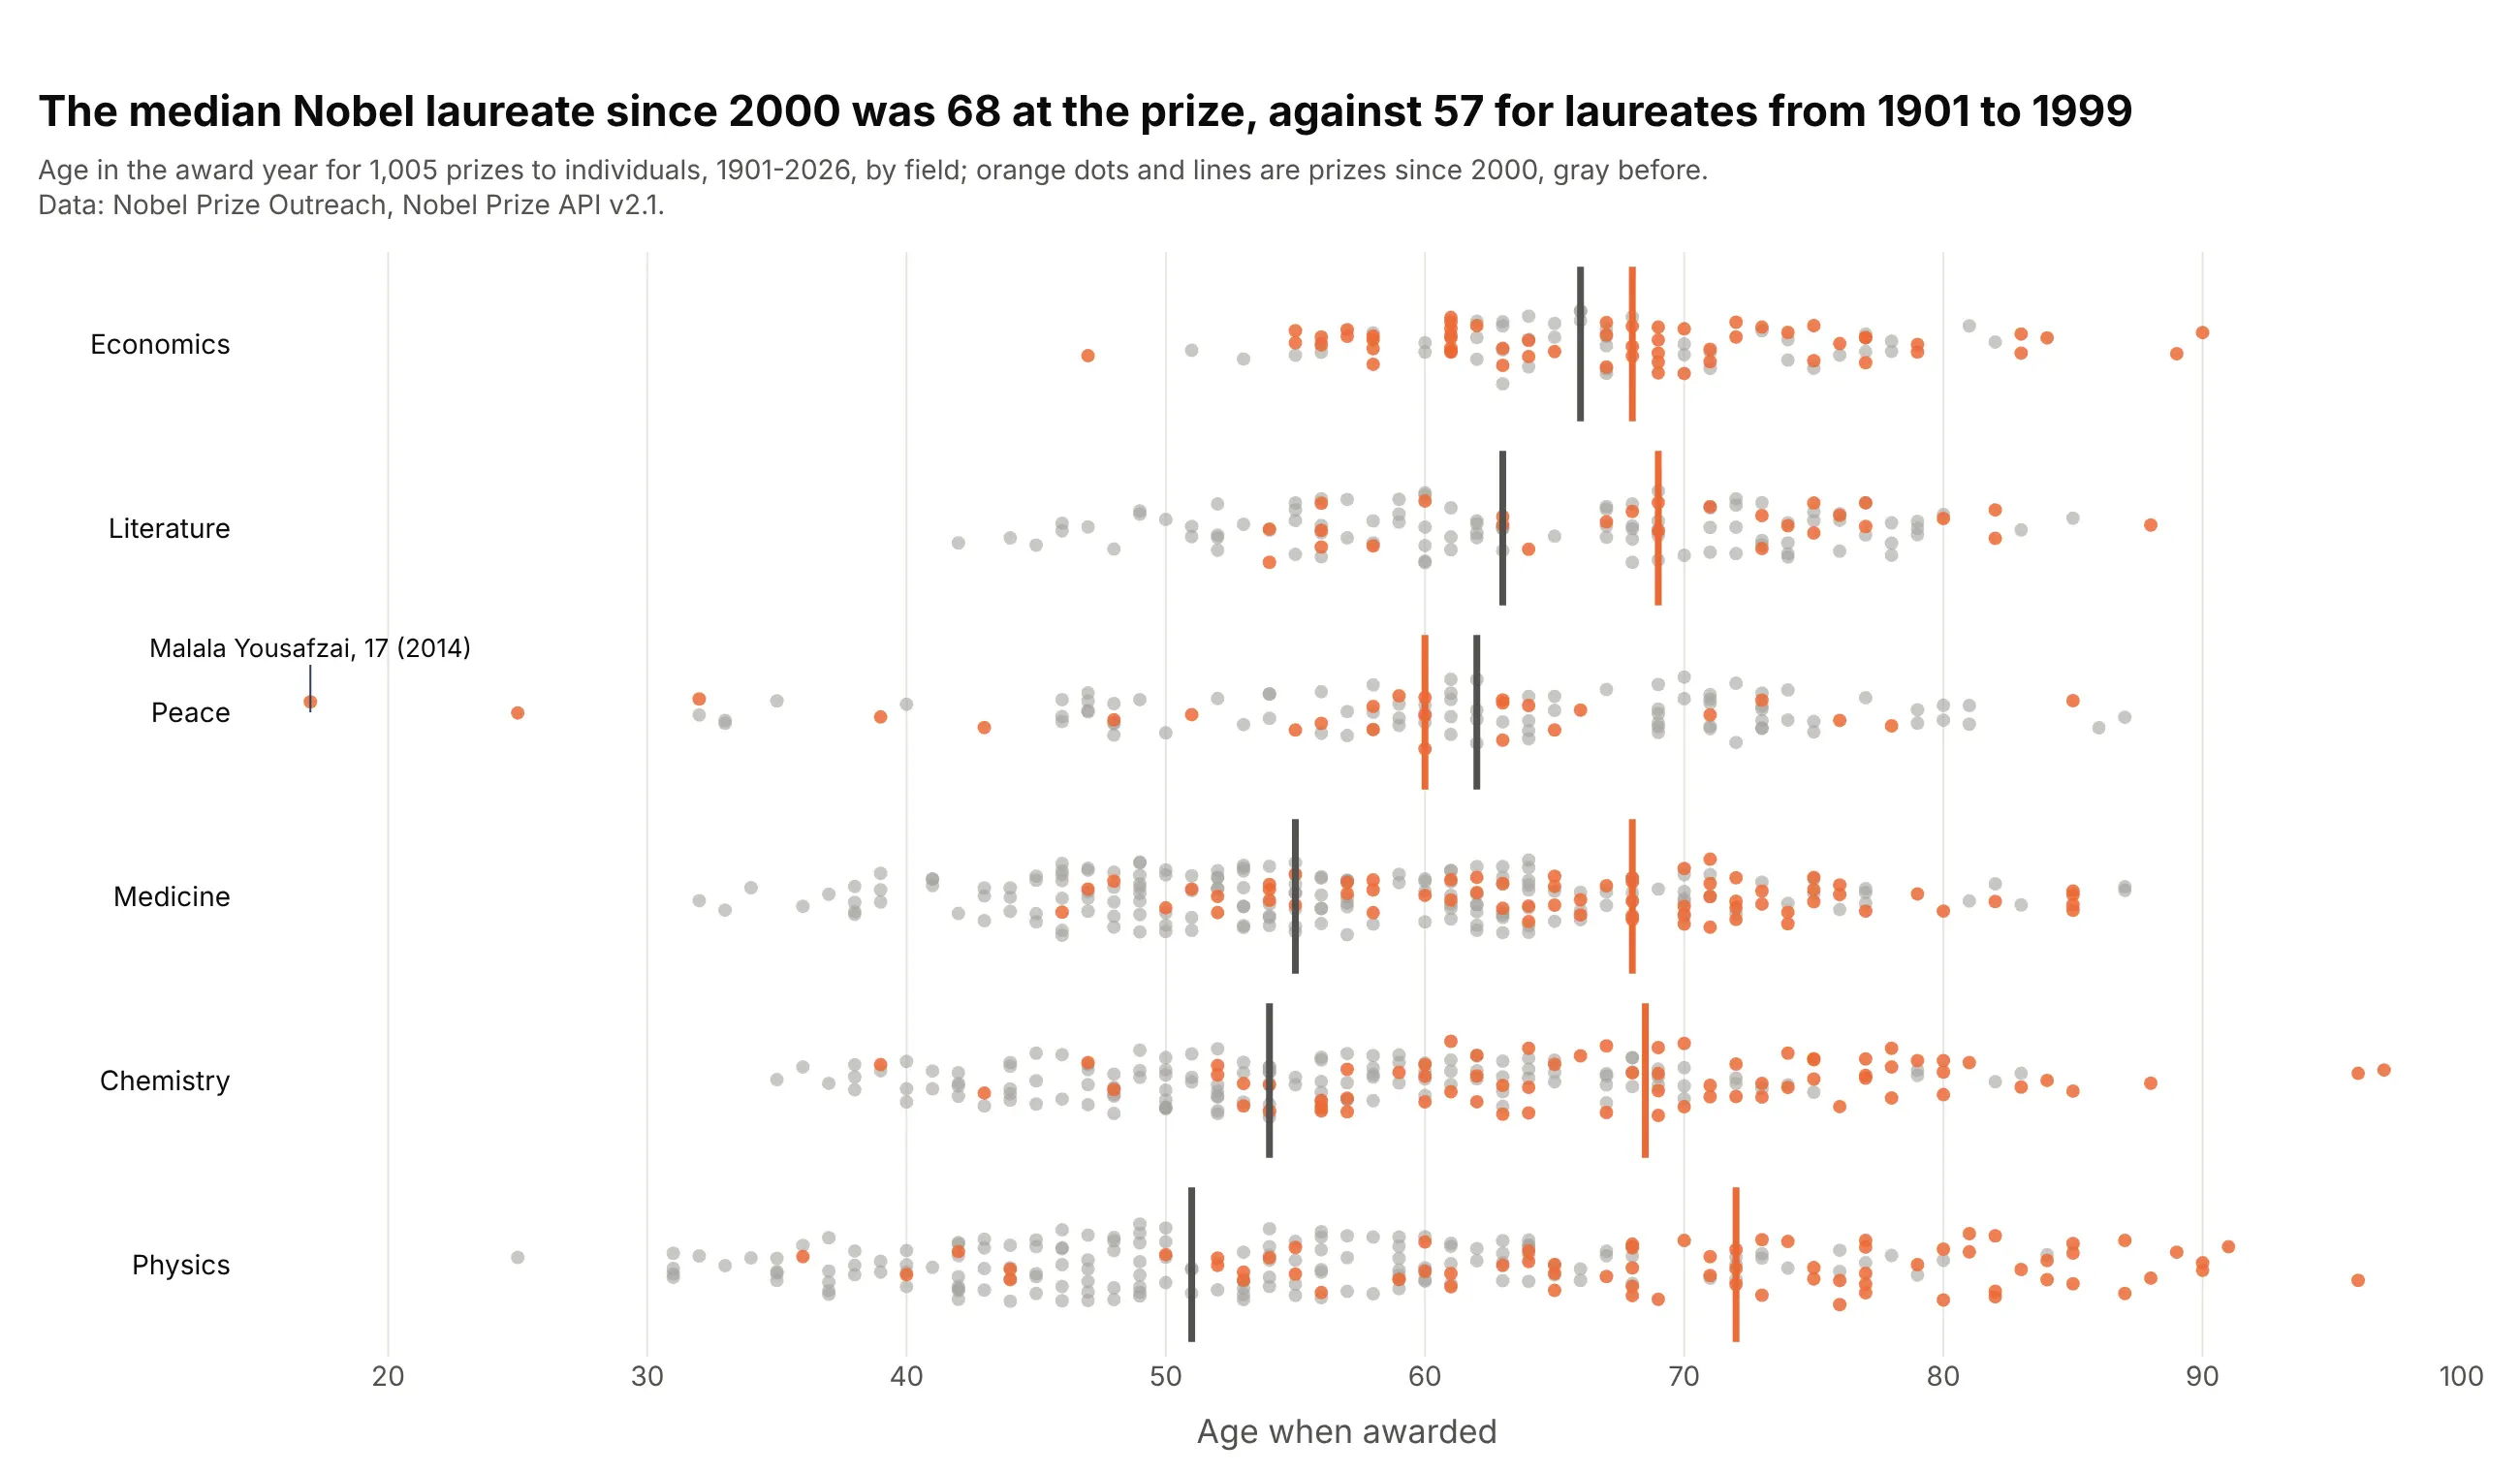
The median Nobel laureate since 2000 was 68 when the prize was awarded, against 57 from 1901 to 1999. In physics the median went from 51 to 72. Data: Nobel Prize API v2.1.
Tip: color an era instead of a category, and draw a median line per era, so one chart answers "has this changed?".
Get the data from the Nobel Prize API v2.1 (api.nobelprize.org/2.1/laureates, people only) and shapeit into a table with one row per prize (columns: name, category, year, birth_year, age).Build a plotly strip chart: one row per category sorted by median age, prizes since 2000 in orange ontop of earlier ones in gray, a median line for each era, and the youngest laureate labeled.
6. Thirty years of Central Park daily highs
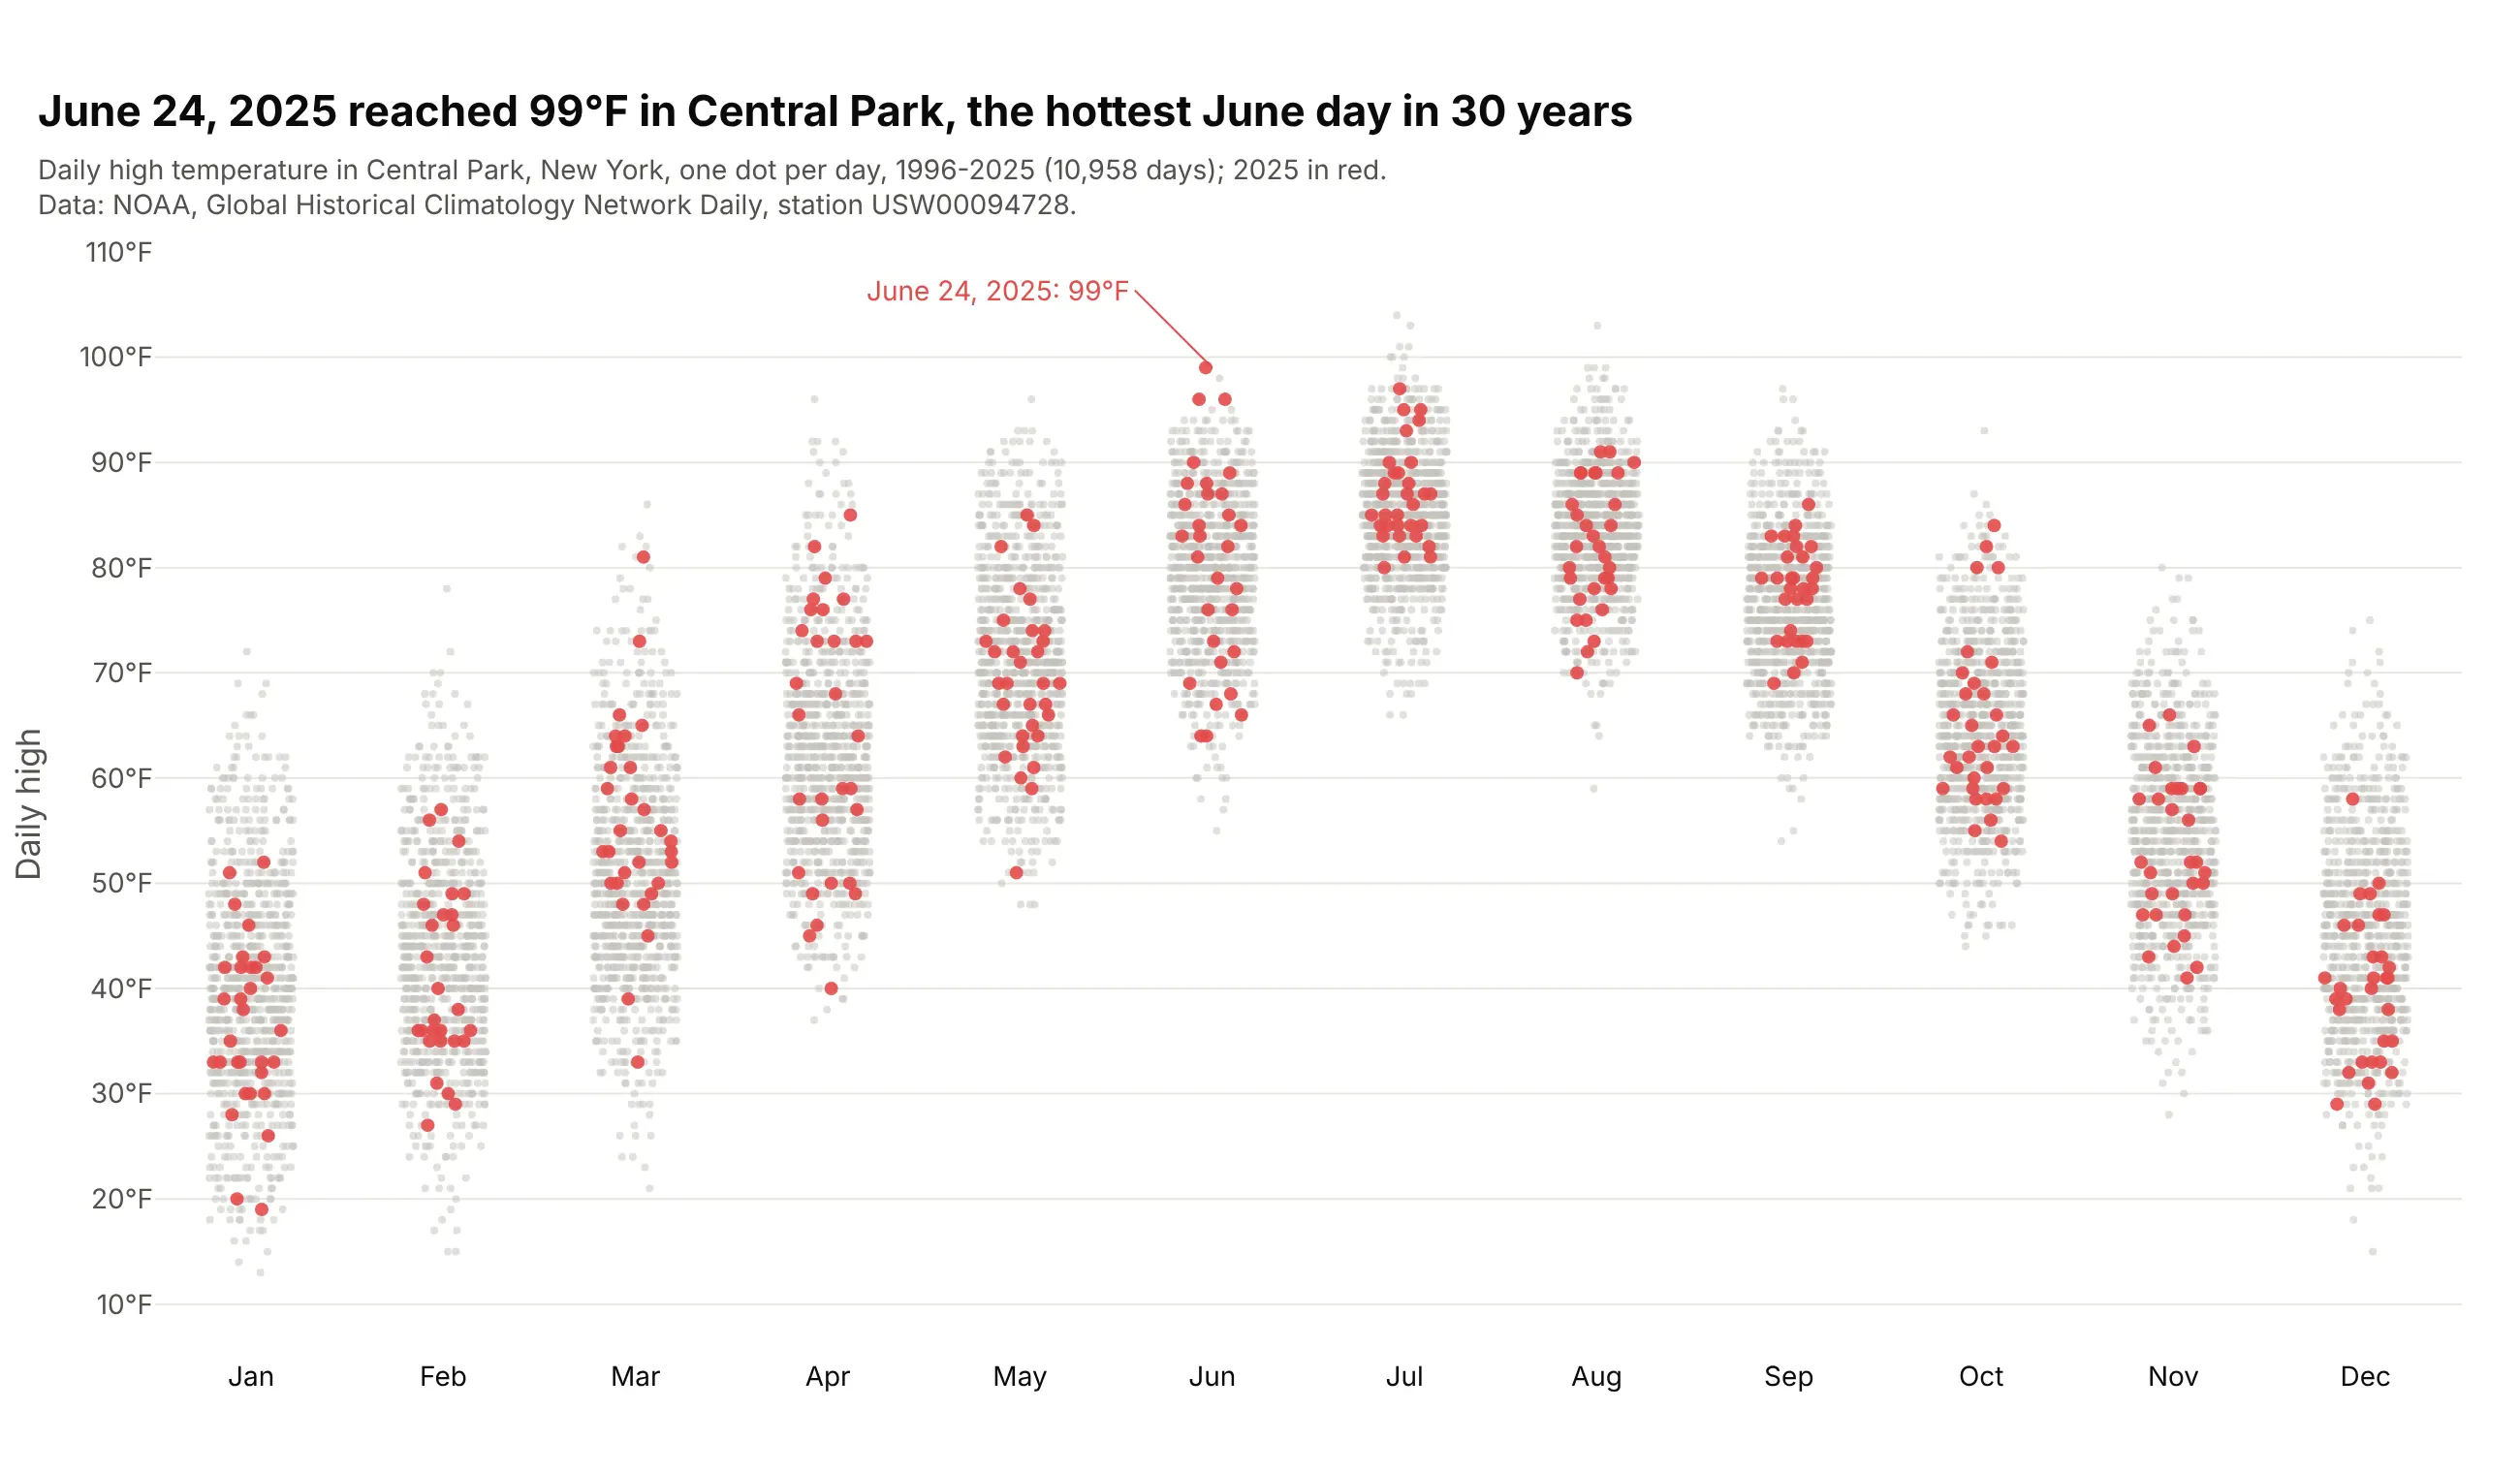
June 24, 2025 reached 99°F in Central Park, the hottest June day from 1996 to 2025. Drawing one year on top of the other 29 shows where each day falls against history. Data: NOAA GHCN-Daily, station USW00094728.
Tip: with about 900 dots per month, use 4 px light gray markers for the history and bigger colored ones for the year in question.
Get the data from NOAA's Global Historical Climatology Network Daily file for station USW00094728(Central Park, New York), daily TMAX 1996-2025, and shape it into a table (columns: date, year, month,tmax_f).Build a plotly strip chart: one column per month, 1996-2024 as 4 px gray dots, 2025 as 7 px red dotson top, and the 2025 day that set a 30-year monthly record labeled.
7. Vitamin C dose response in guinea pigs
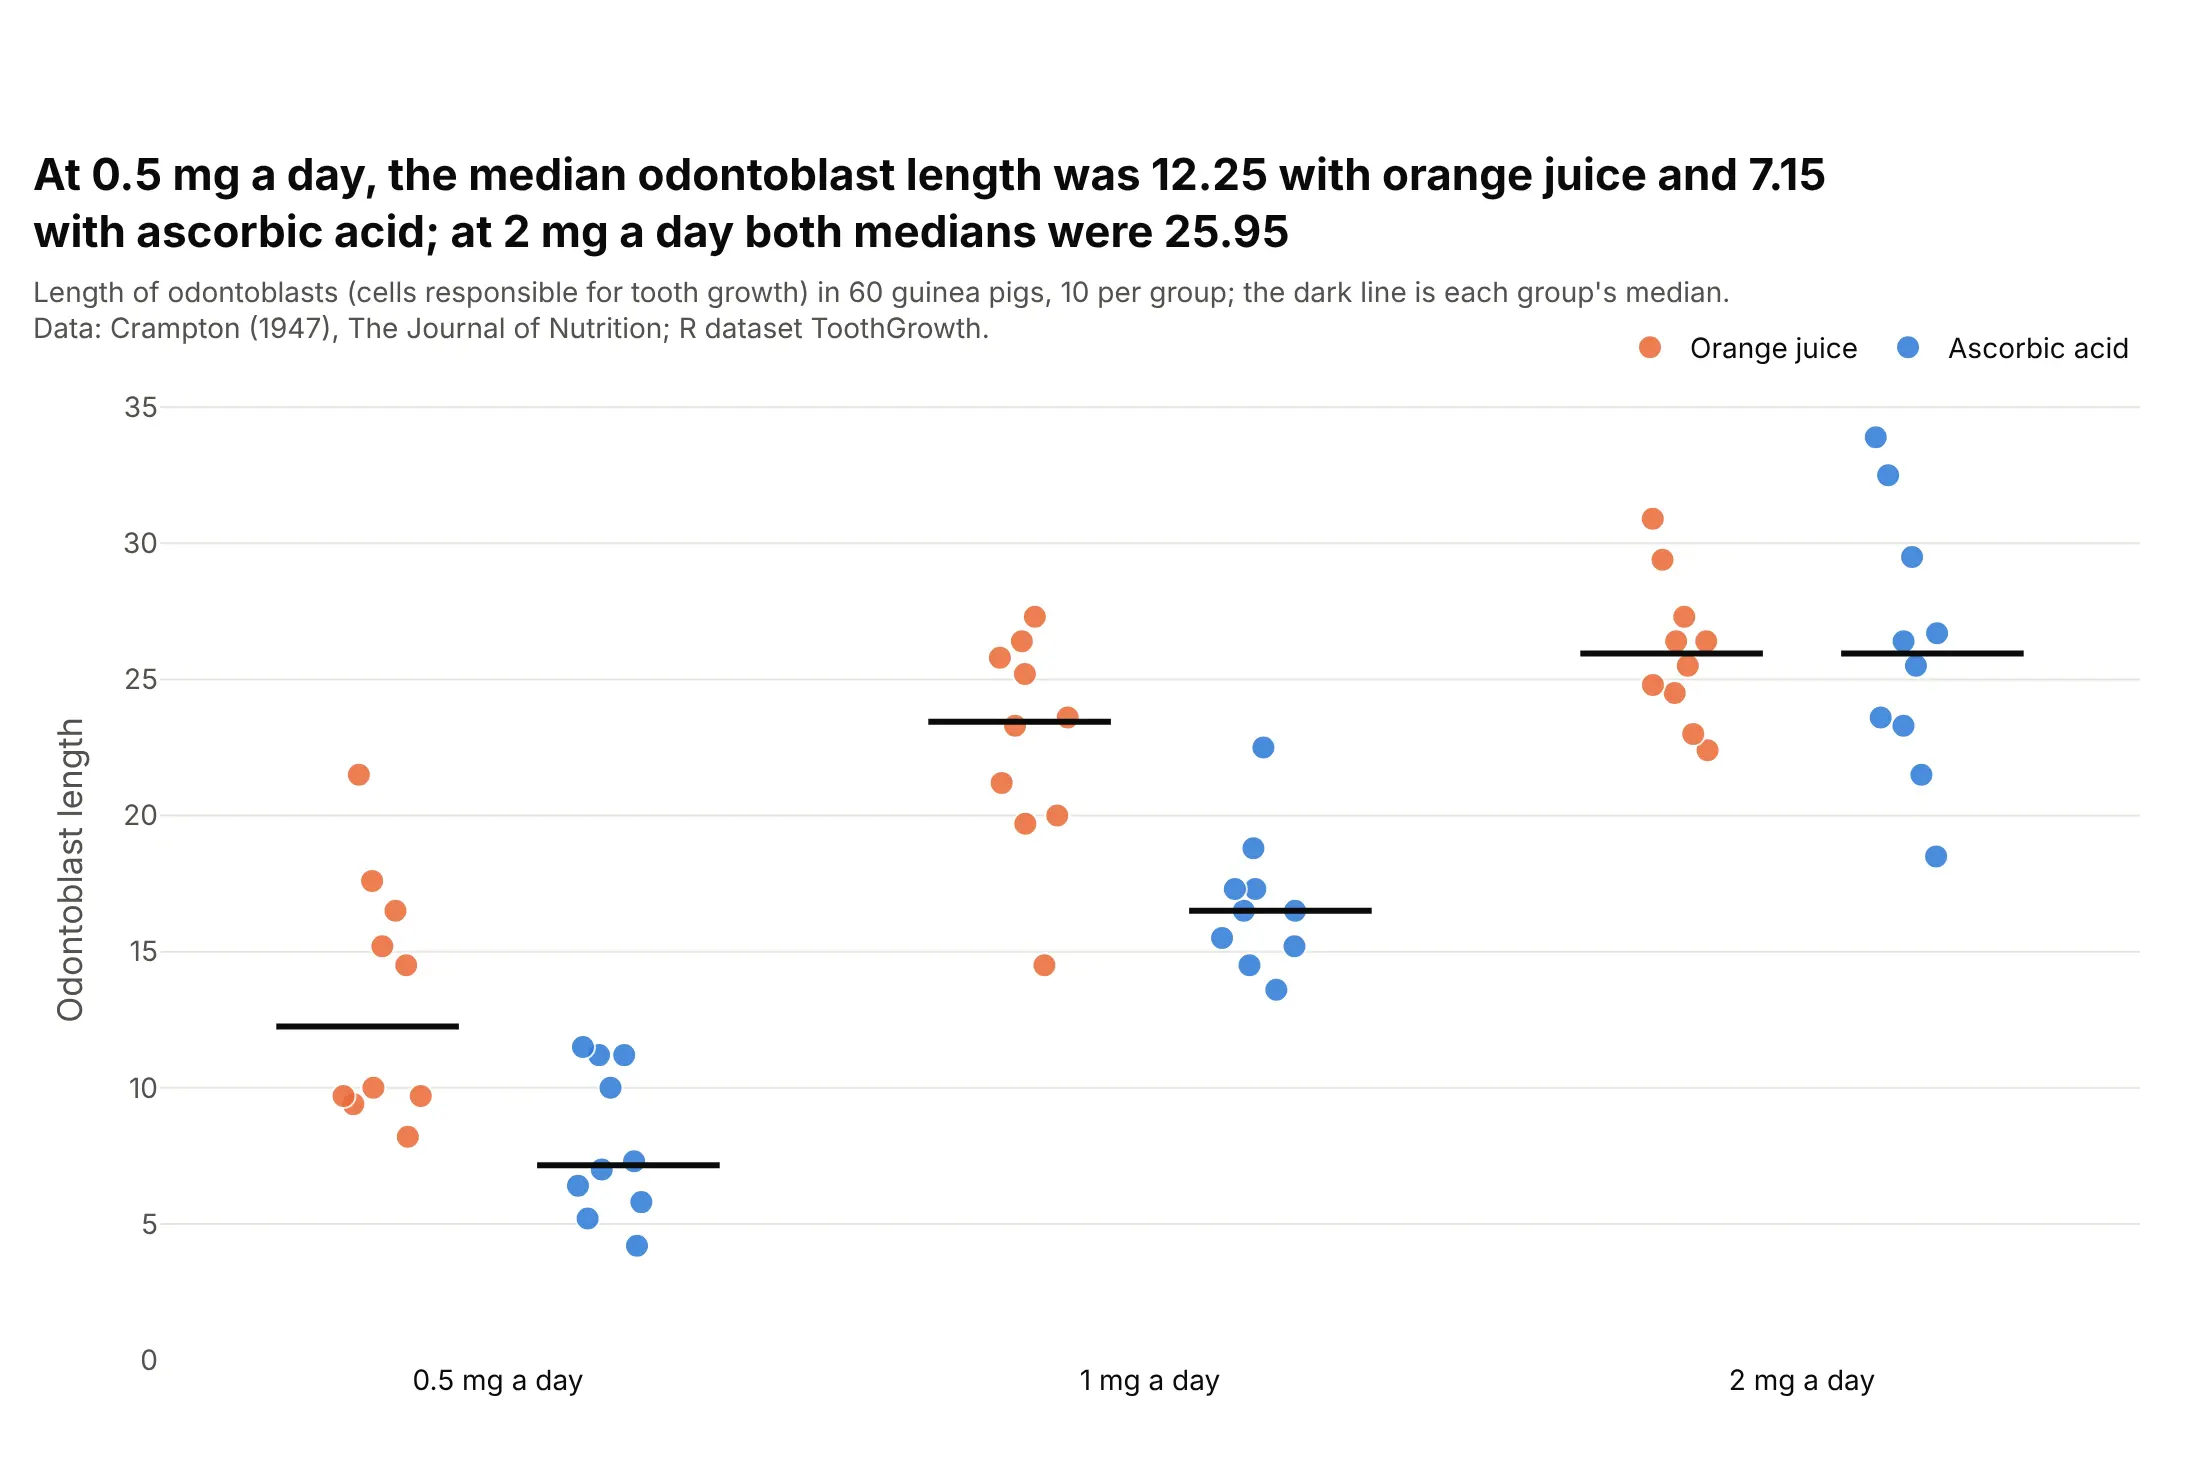
At 0.5 mg of vitamin C a day, the median odontoblast length was 12.25 with orange juice and 7.15 with ascorbic acid, and at 2 mg a day both were 25.95. With 10 animals per group, every one is visible. Data: Crampton (1947), R dataset ToothGrowth.
Tip: px.strip(..., color="supplement", stripmode="group") puts the two delivery methods side by side within each dose.
Get the data from R's built-in ToothGrowth dataset (Crampton 1947, The Journal of Nutrition) andshape it into a table (columns: length, supplement, dose_mg).Build a plotly strip chart with px.strip: x = dose, y = length, color = supplement withstripmode="group", 12 px dots, and a short dark median line for each of the six groups.
8. R's own example: a honeybee repellent experiment
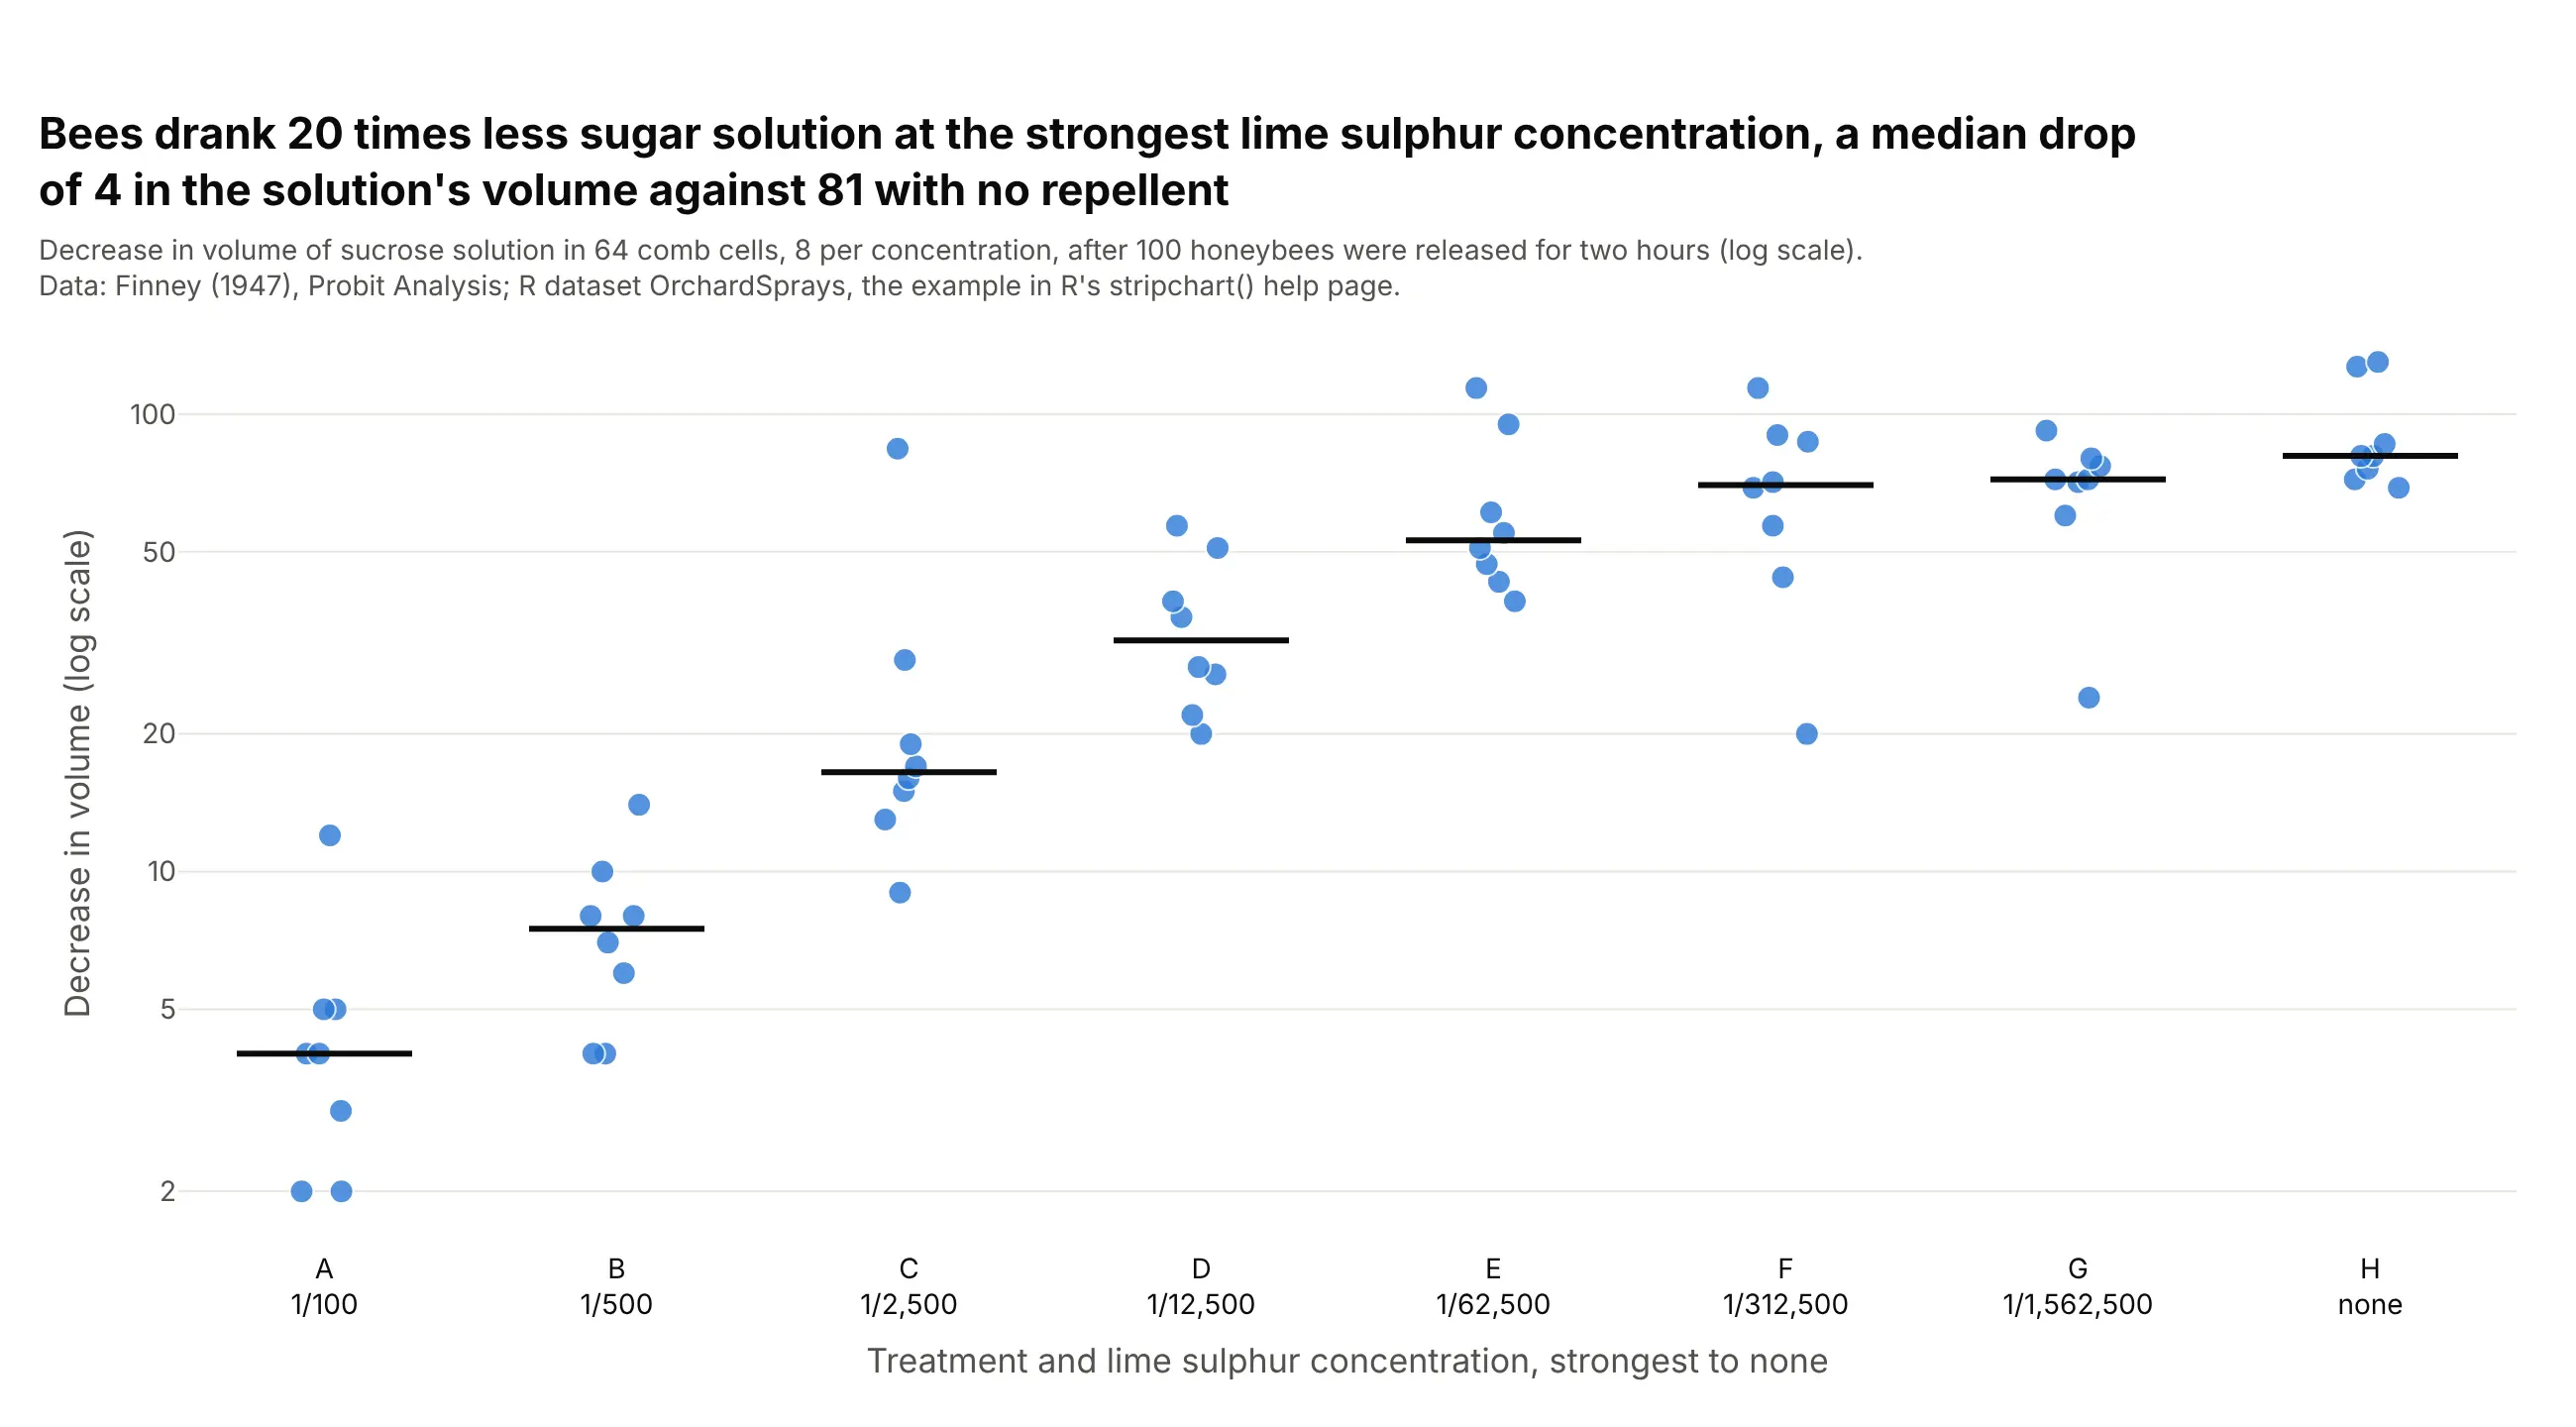
Bees drank 20 times less sugar solution at the strongest lime sulphur concentration, a median drop in volume of 4 against 81 with no repellent. This is the dataset R's stripchart() help page draws, vertical and on a log scale. Data: Finney (1947), Probit Analysis, R dataset OrchardSprays.
Tip: with 8 values per group, use big markers and light jitter, and a log axis when the groups differ by a factor of 20.
Get the data from R's built-in OrchardSprays dataset (Finney 1947, a Latin square experiment withhoneybees) and shape it into a table (columns: treatment, concentration, decrease).Build a plotly strip chart: one vertical strip per treatment from A (1/100) to H (none), y = decreaseon a log axis, 12 px dots with light jitter, and a short dark median line per treatment.