
Chris Parmer
October 27, 2026
Population Pyramids - A Complete Guide
TL;DR
- A population pyramid is two horizontal bar charts back to back, men on the left and women on the right, with one row per age and the youngest at the bottom.
- Population pyramids are also known as age pyramids, age-sex pyramids and age structure diagrams, and are similar to butterfly charts and histograms.
- Its shape tells the story: a wide base means many children, bulges are baby booms, dents are wars or birth-control policies, and a longer side means more men or more women at that age.
- The same construction, called a butterfly chart, works for any two quantities in one unit, such as exports and imports.
- You can make a population pyramid with Plotly from two go.Bar traces, one side negated, with barmode="relative".
What is a population pyramid?
Population pyramids look like this:
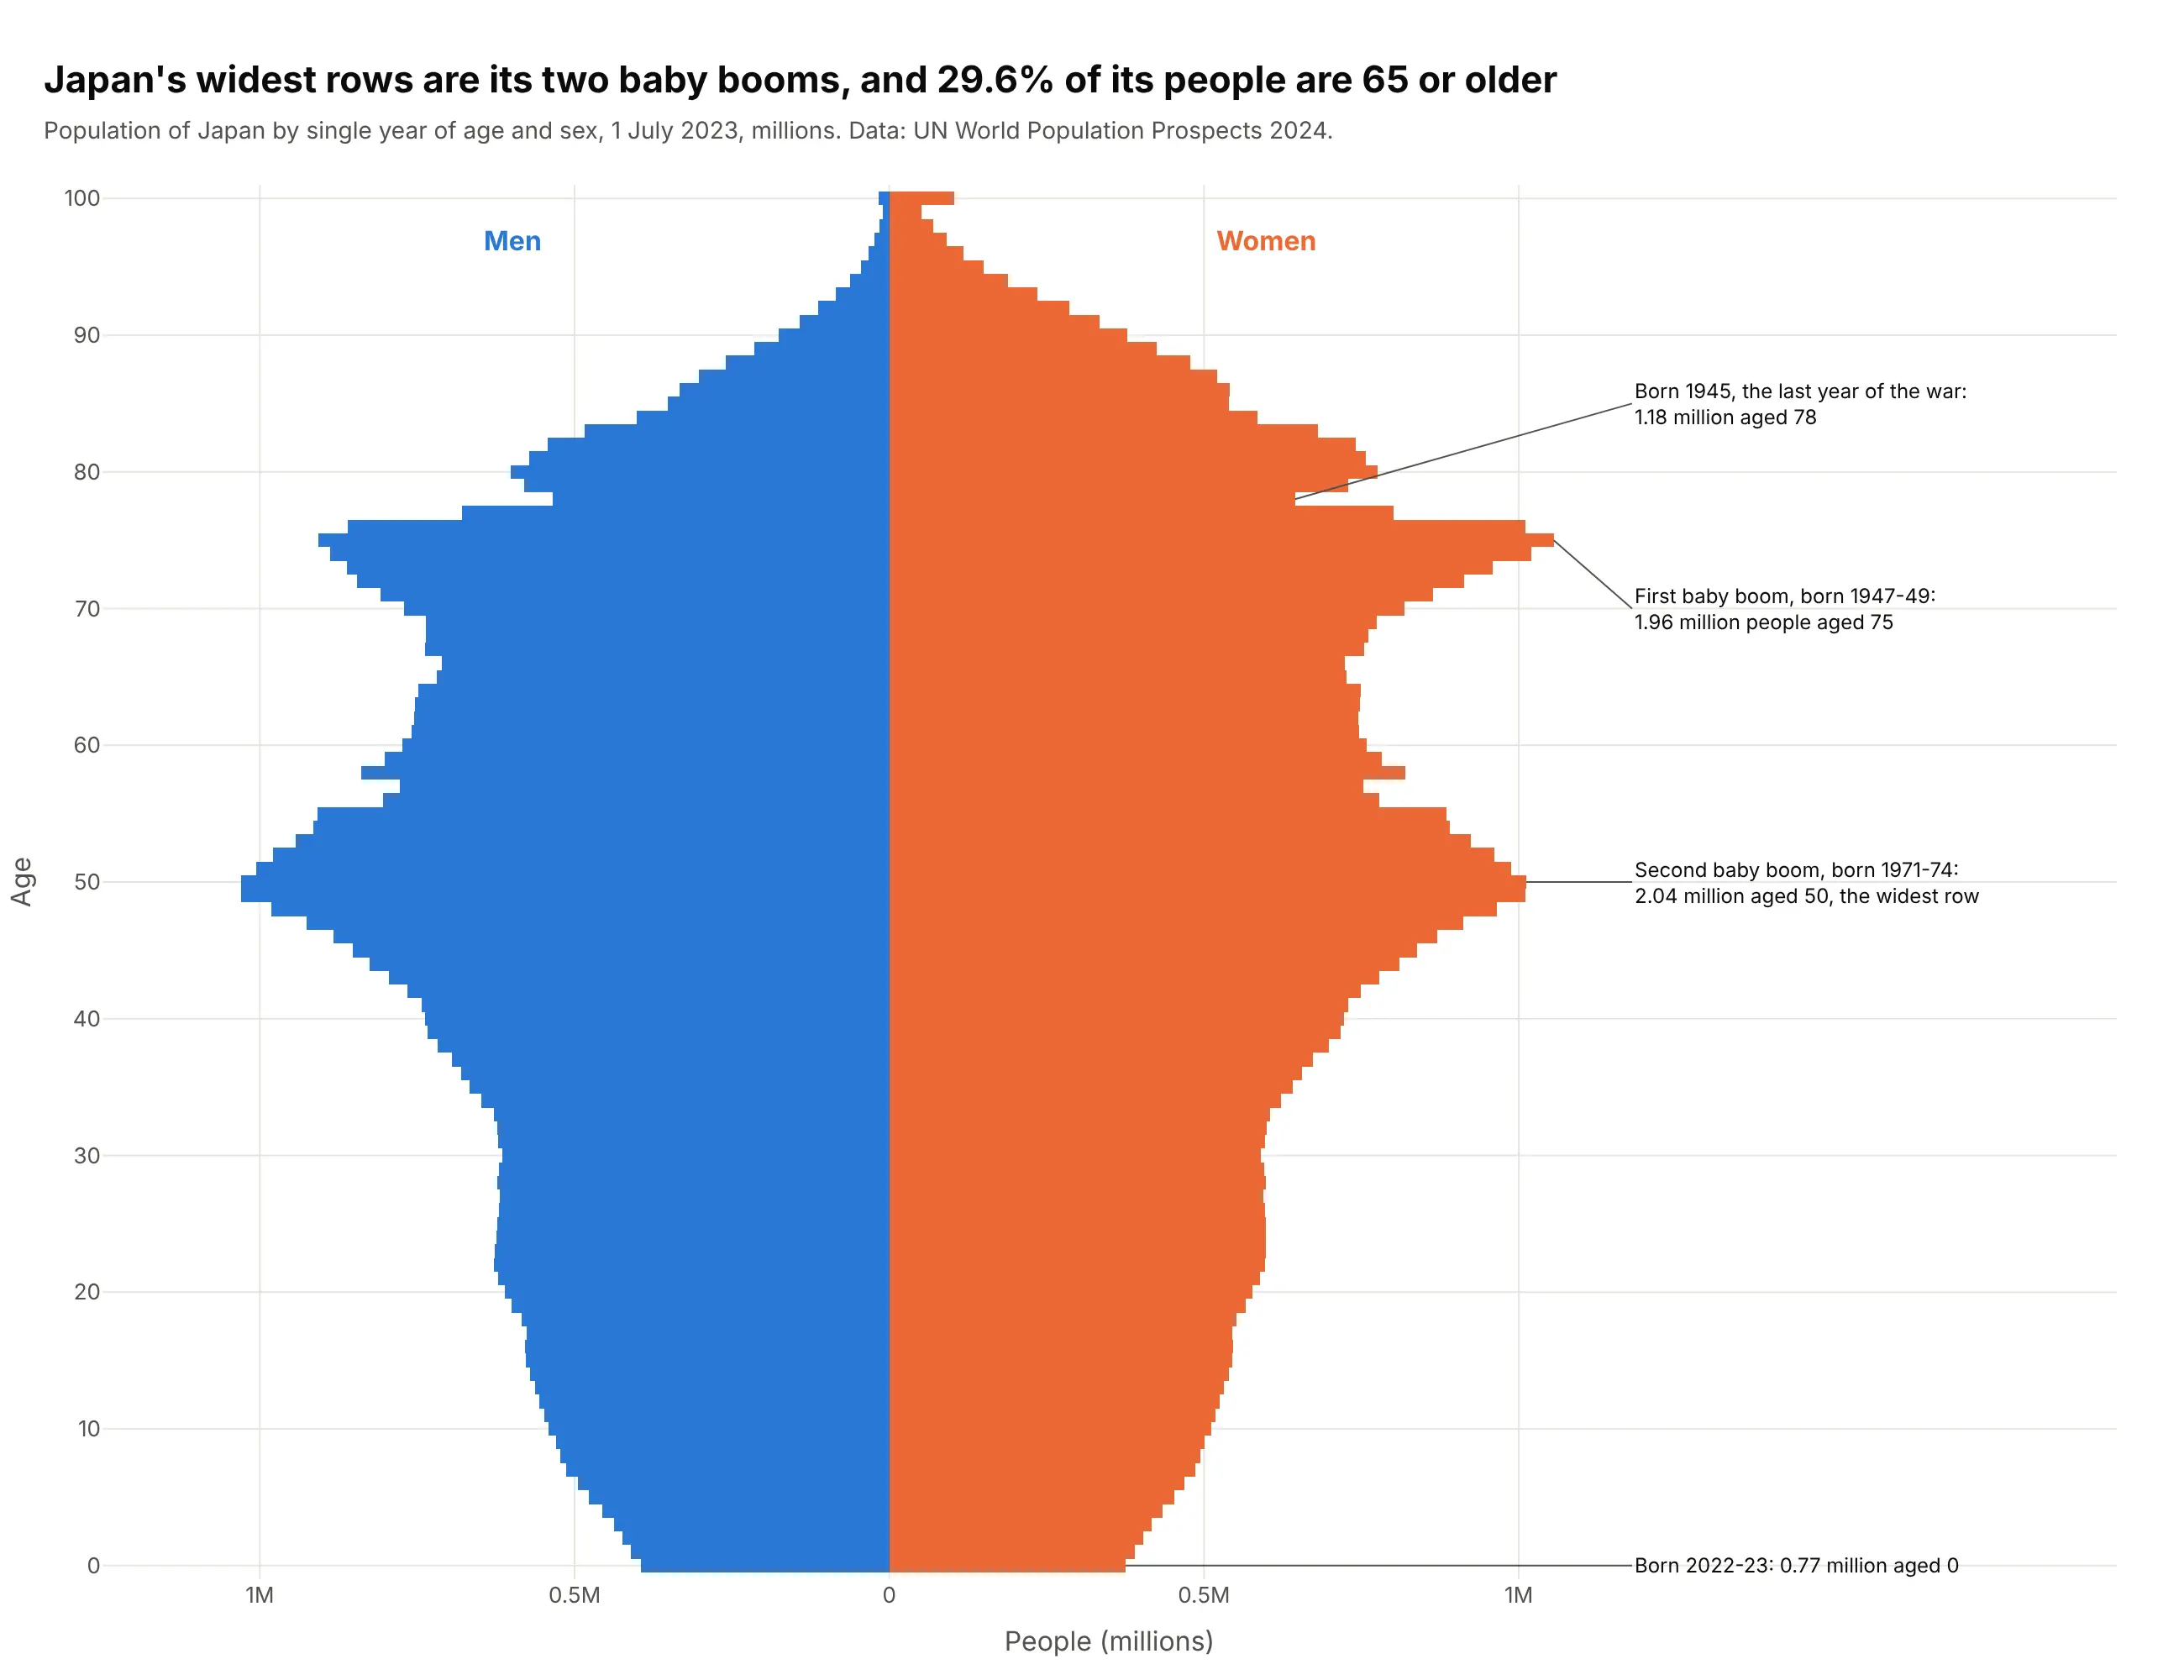
Data: UN World Population Prospects 2024.
How do you read a population pyramid? In the example above, notice these things:
- Each row is one year of age in Japan, with the youngest at the bottom and the oldest at the top. The blue bar to the left of the center line is the number of men of that age, and the orange bar to the right is the number of women.
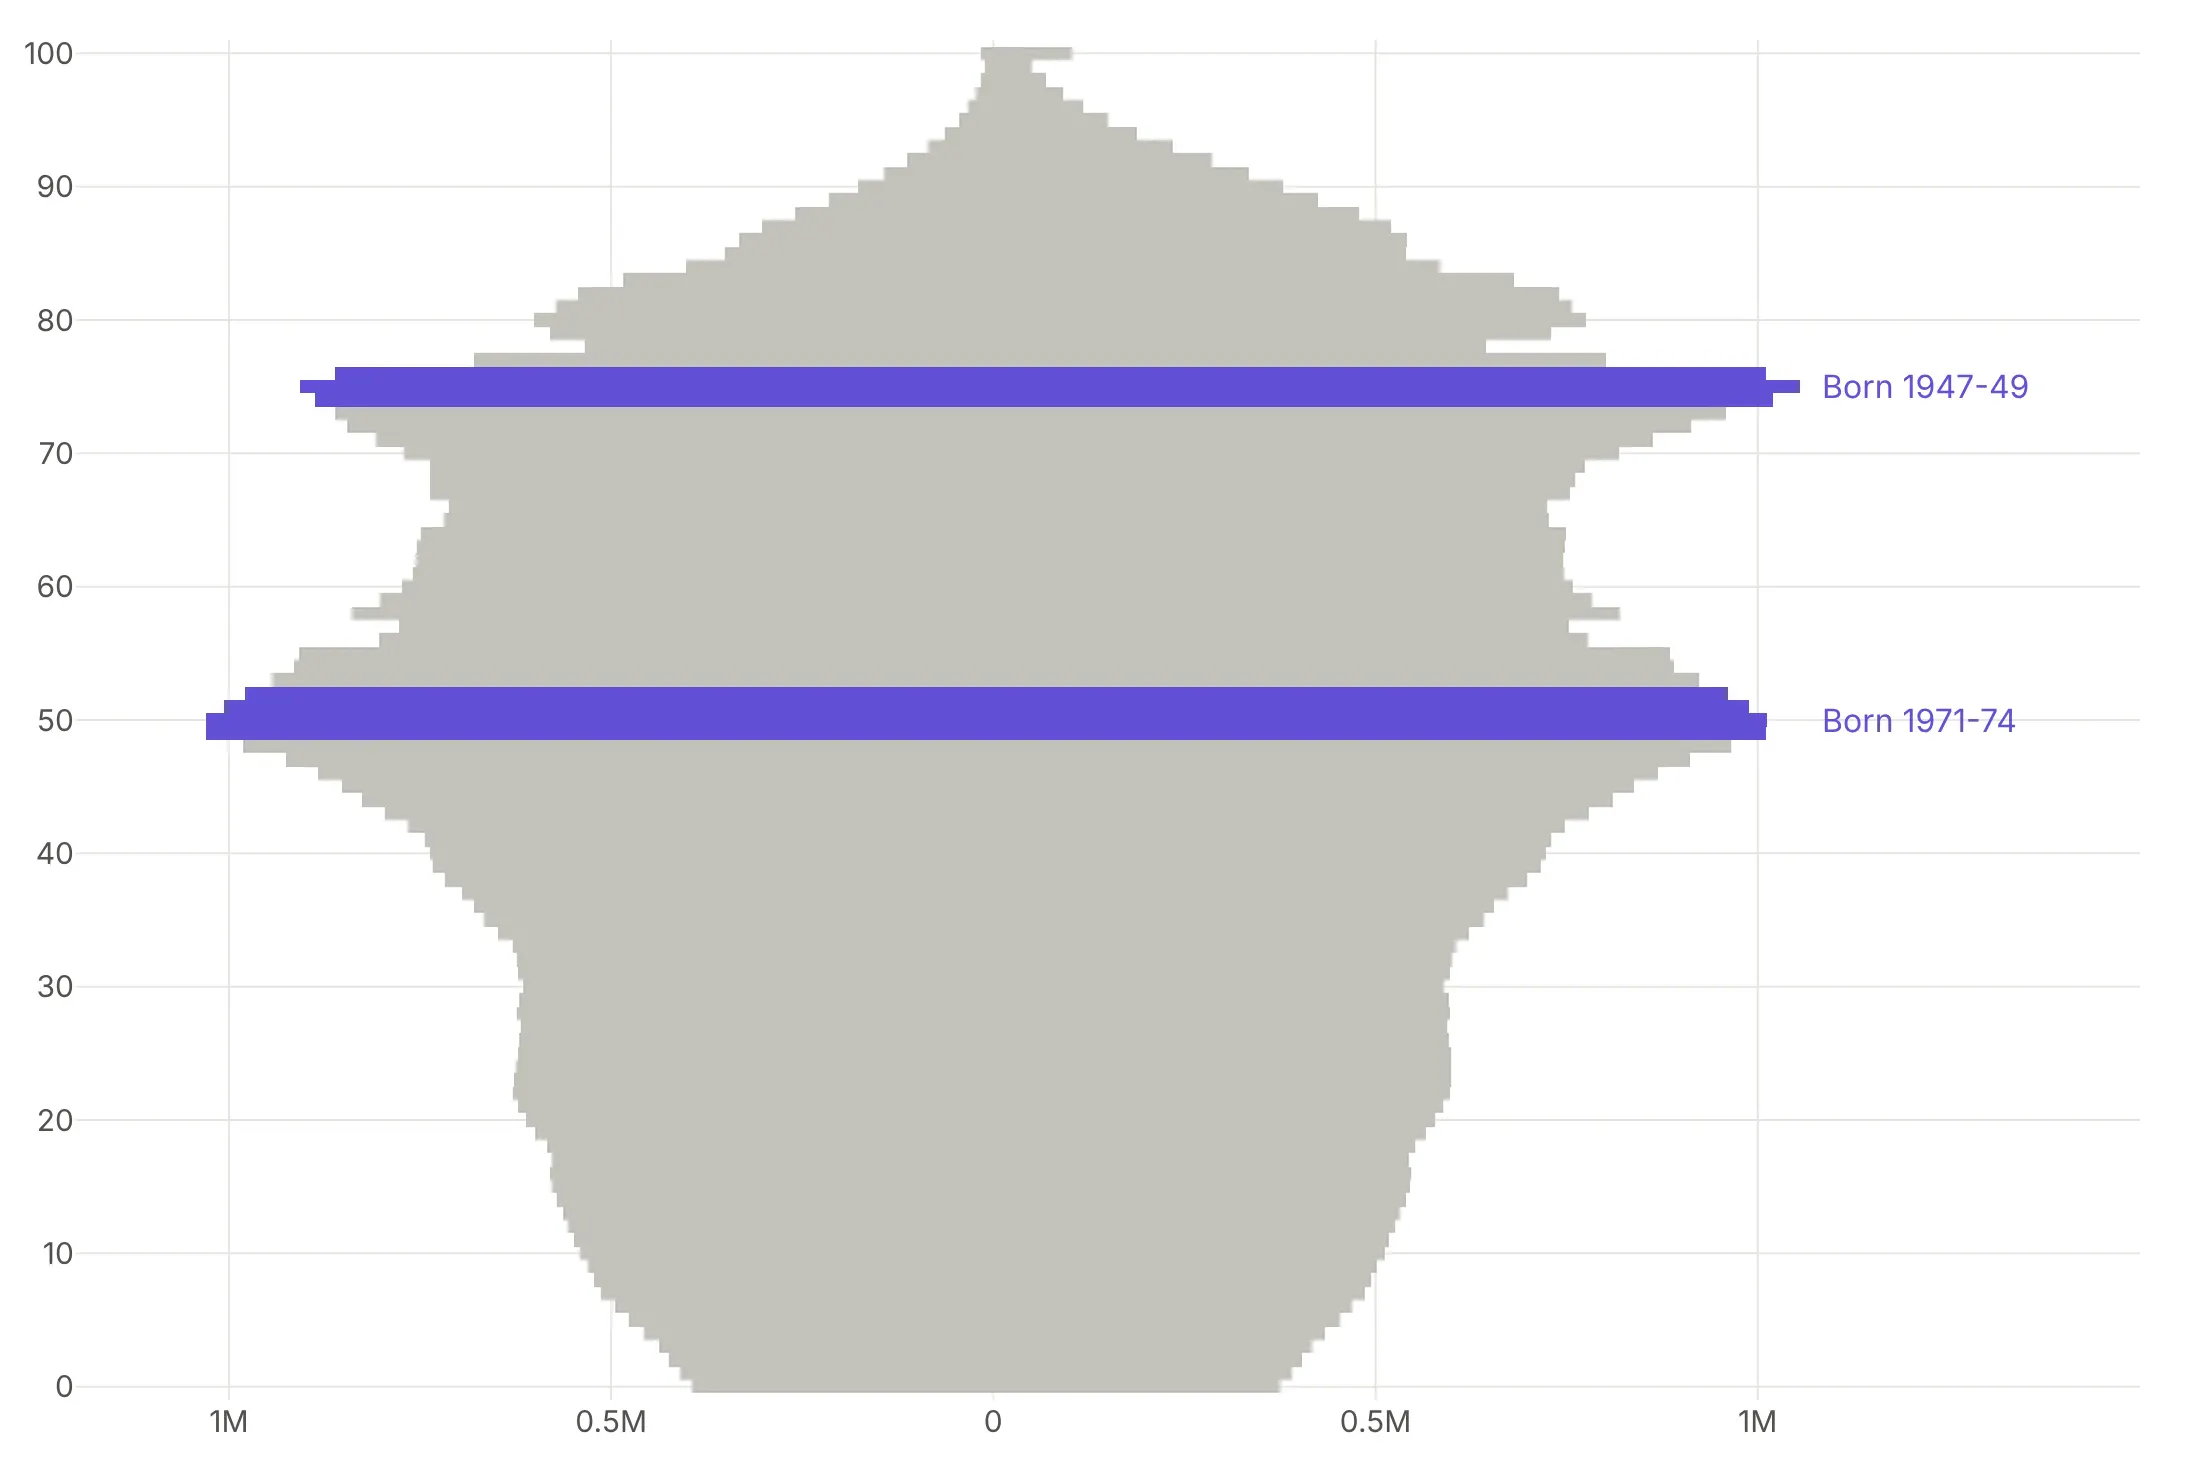
- The width of a row is how many people of that age live in Japan, and everyone in a row was born in about the same year, so you can read history down the chart. The two bulges are Japan's baby booms, and the widest rows are the second boom, born in 1971-74.
- The dents line up with events in the country's history. The notch just above the first boom, on both the men's and the women's side, is the small cohort born in 1945, the last year of the war.
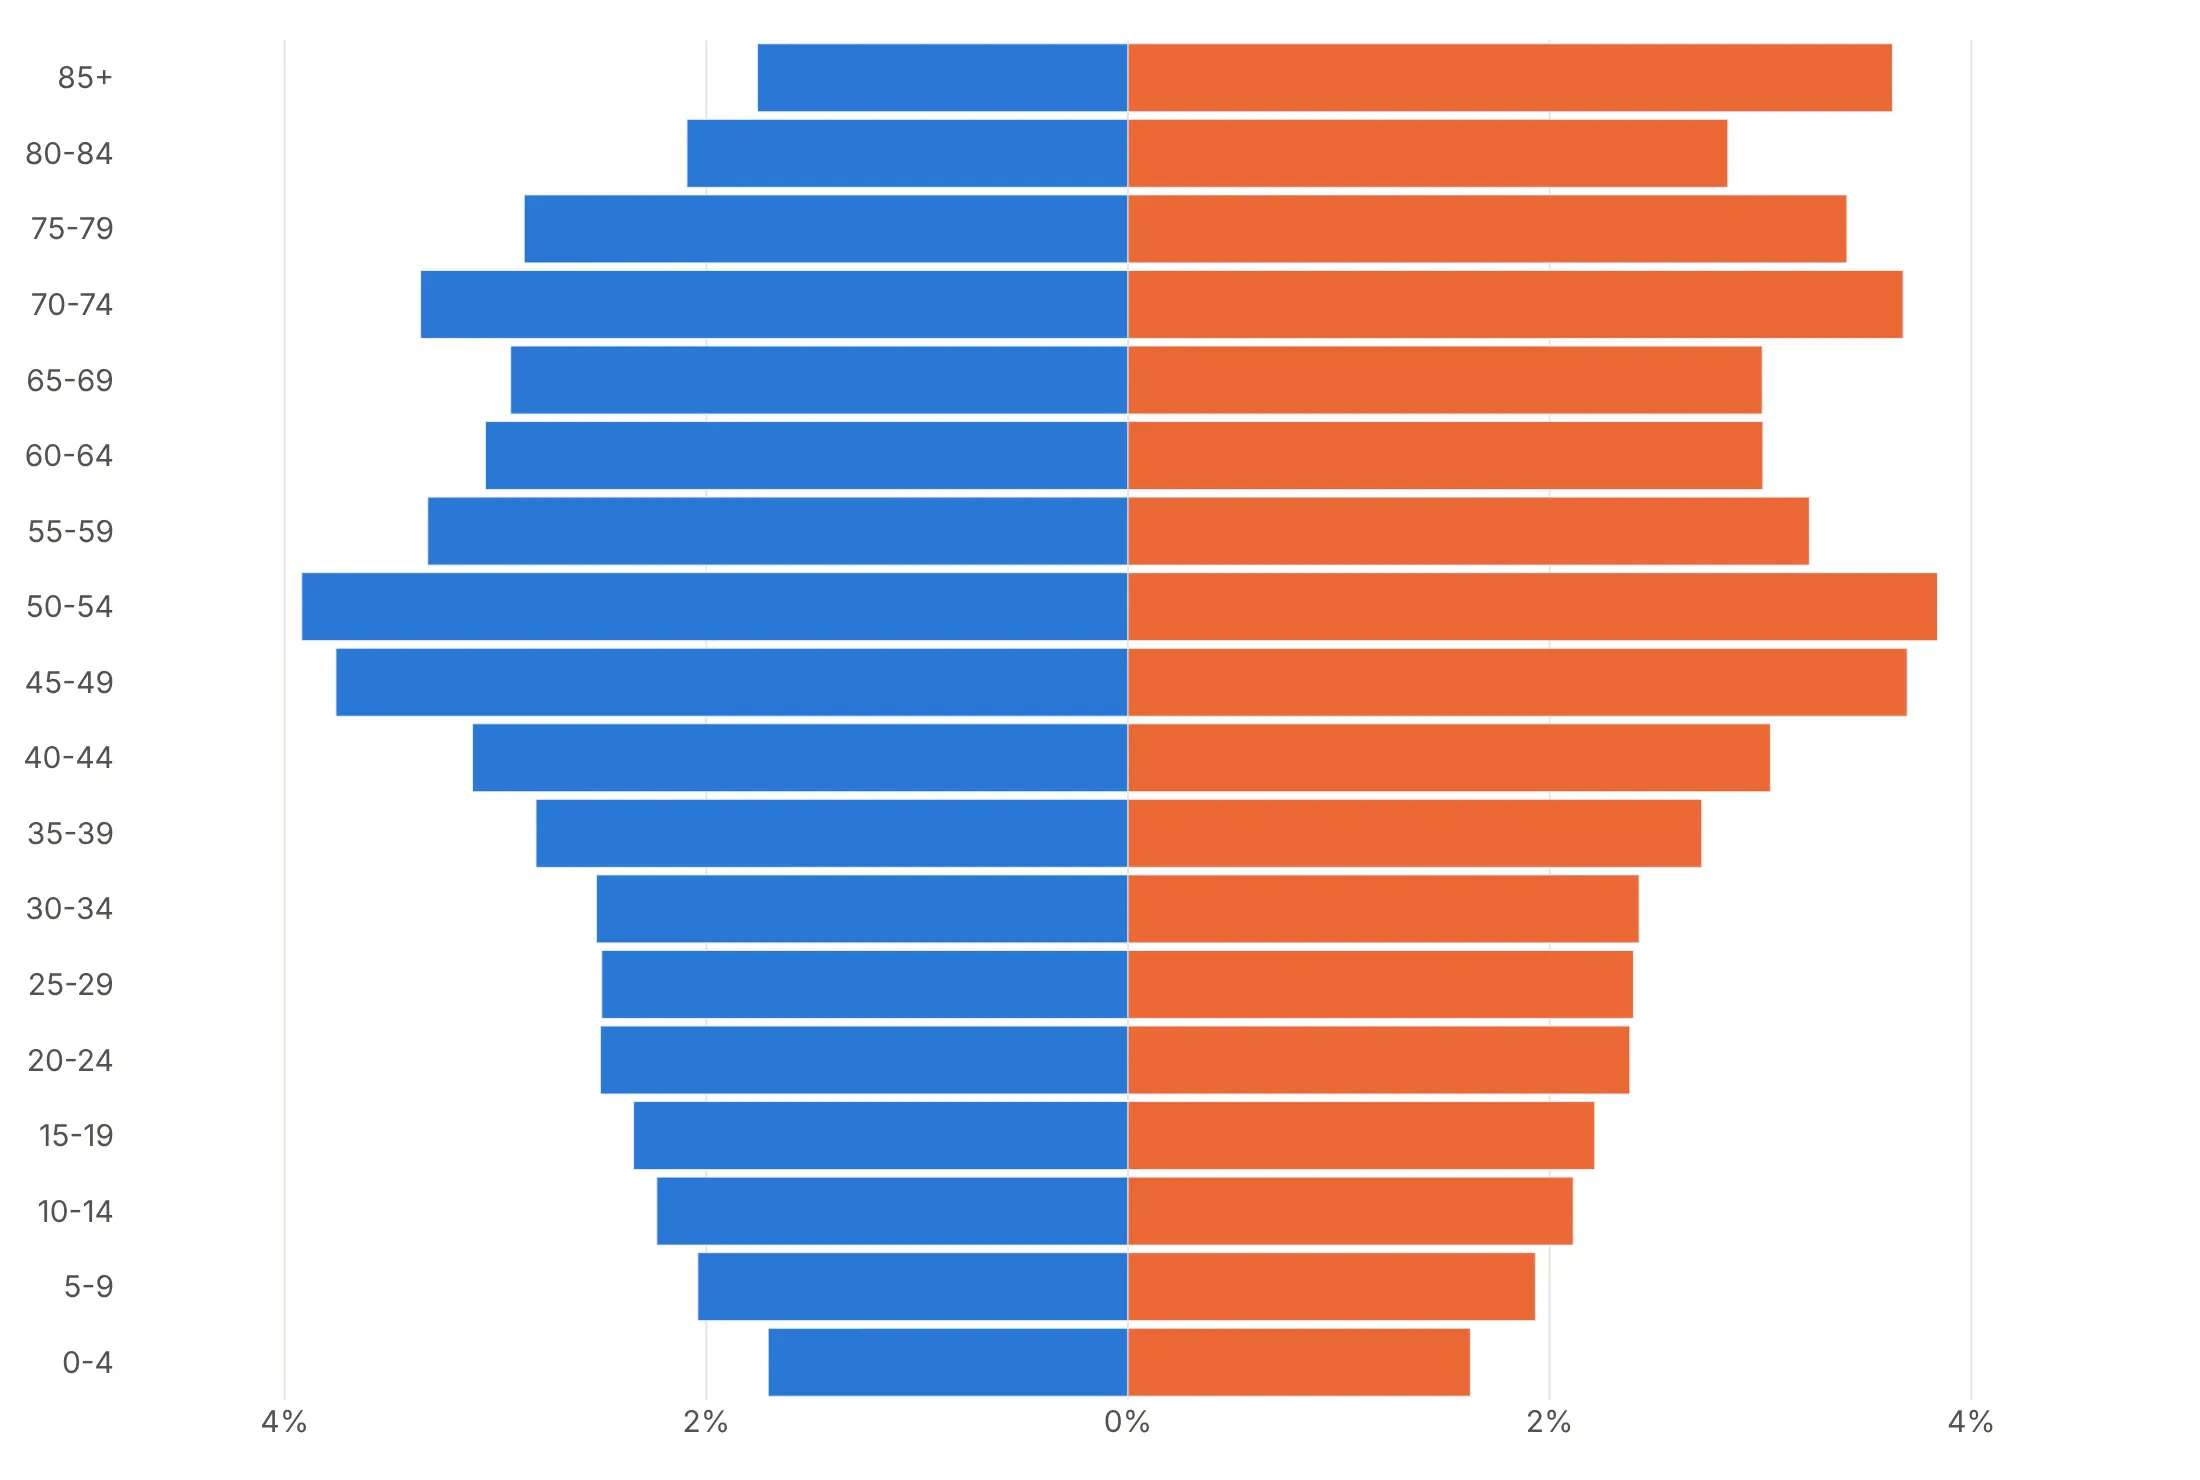
- Demographers classify pyramids by their overall shape. Japan's base is narrower than its middle, with 0.77 million babies aged 0, which they call a constrictive shape.
- Compare the two sides near the top before reading anything else into the shape. In the oldest rows the orange bars are much wider than the blue ones, with 2.8 women for every man aged 90 or older, so the top of the pyramid leans toward the women's side.
It's often used for charts like these:
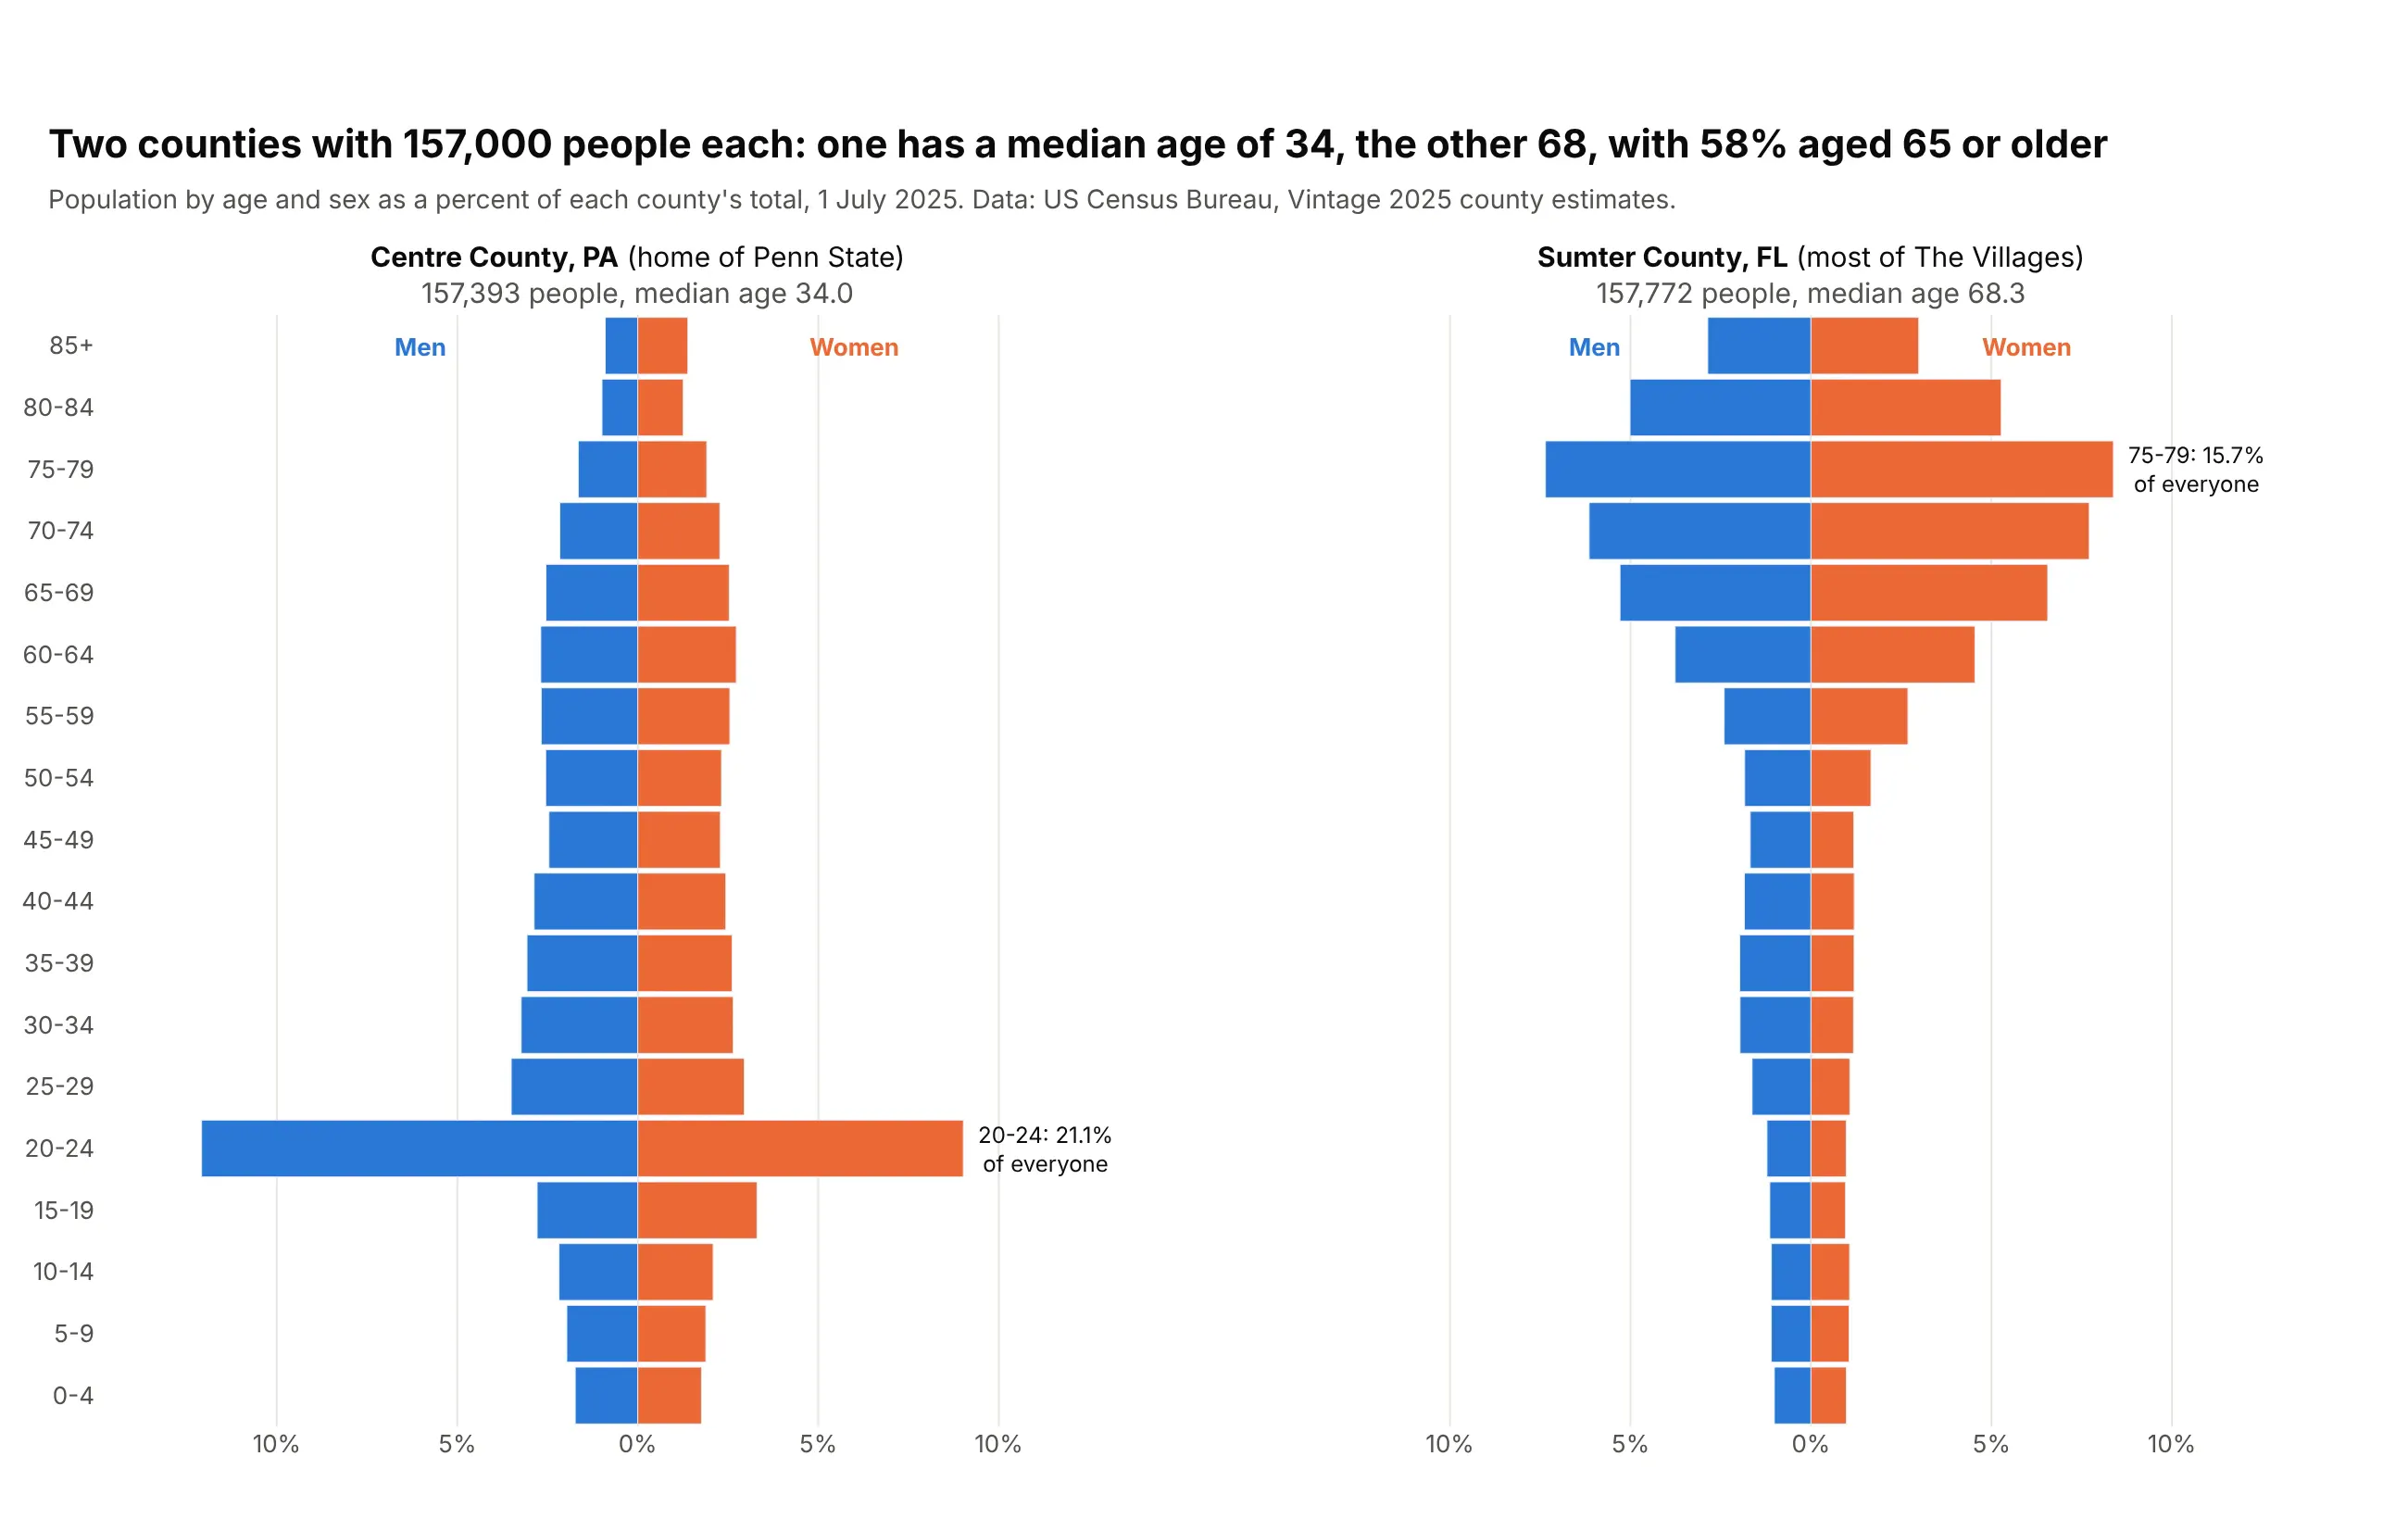
Comparing places. Centre County, Pennsylvania, home of Penn State, and Sumter County, Florida, home of most of The Villages, each have about 157,000 people, but 21.1% of the first are aged 20-24 and 58% of the second are 65 or older. Data: US Census Bureau, Vintage 2025 county estimates.
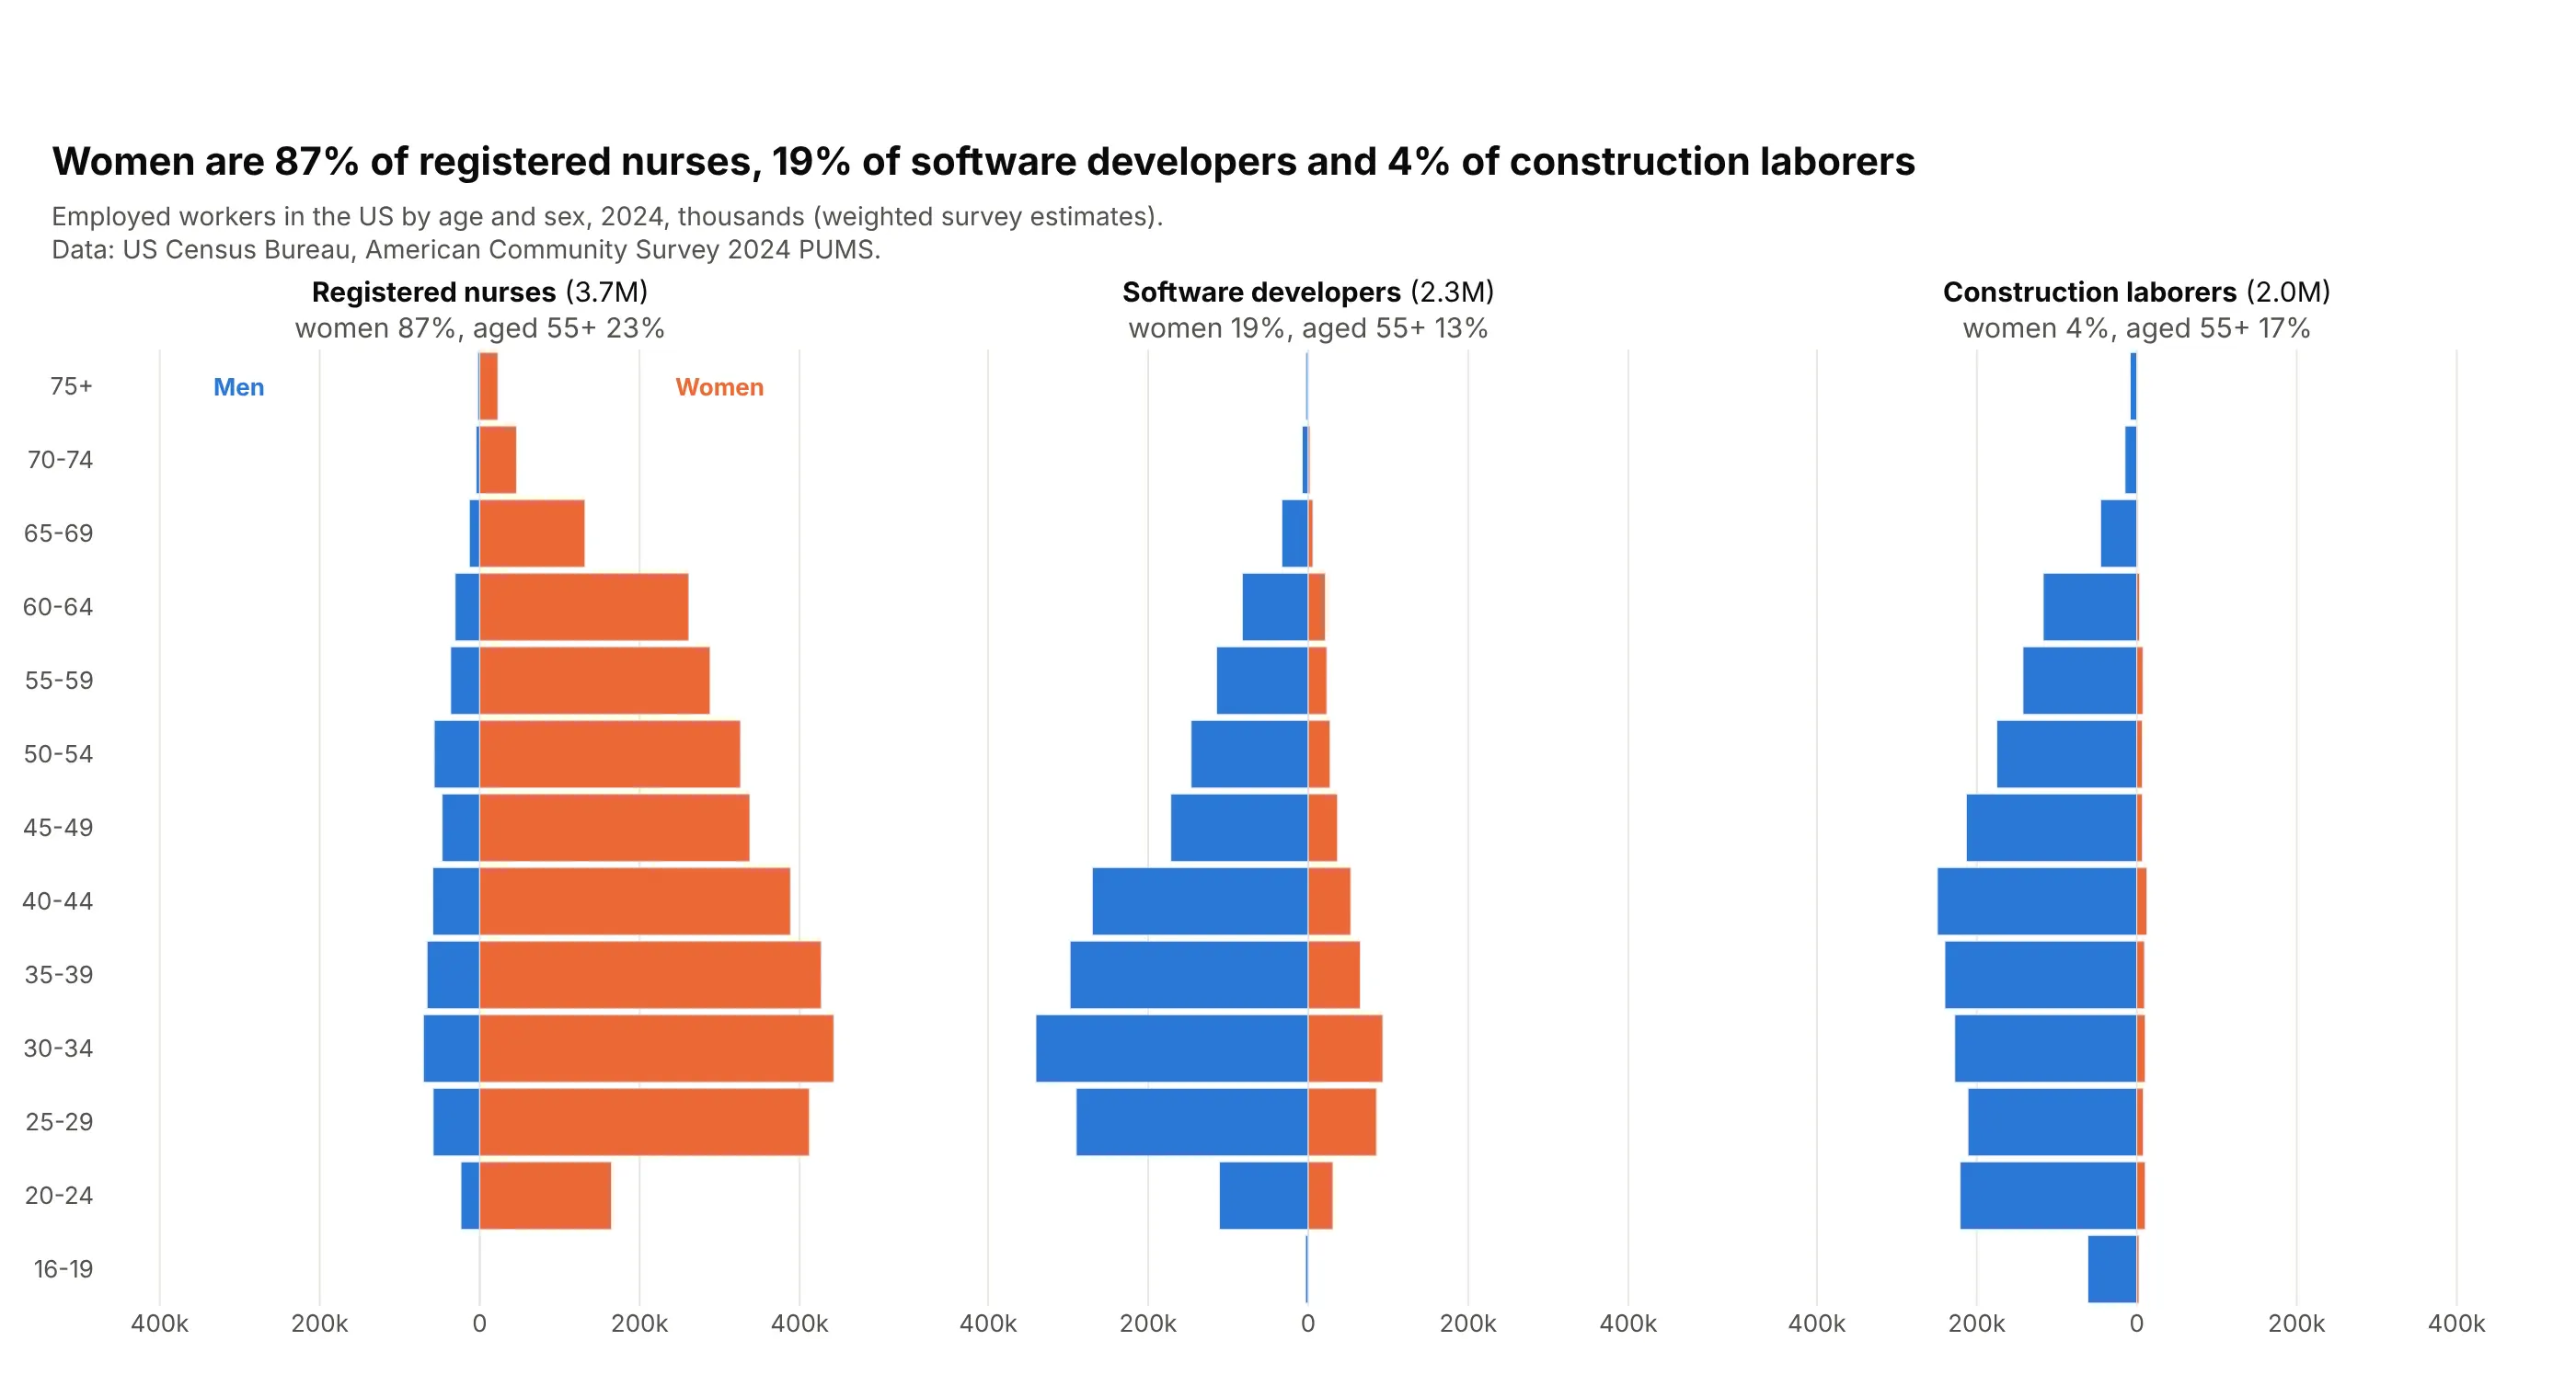
A workforce. Women are 87% of 3.7 million US registered nurses, 19% of software developers and 4% of construction laborers. Data: US Census Bureau, American Community Survey 2024 PUMS.
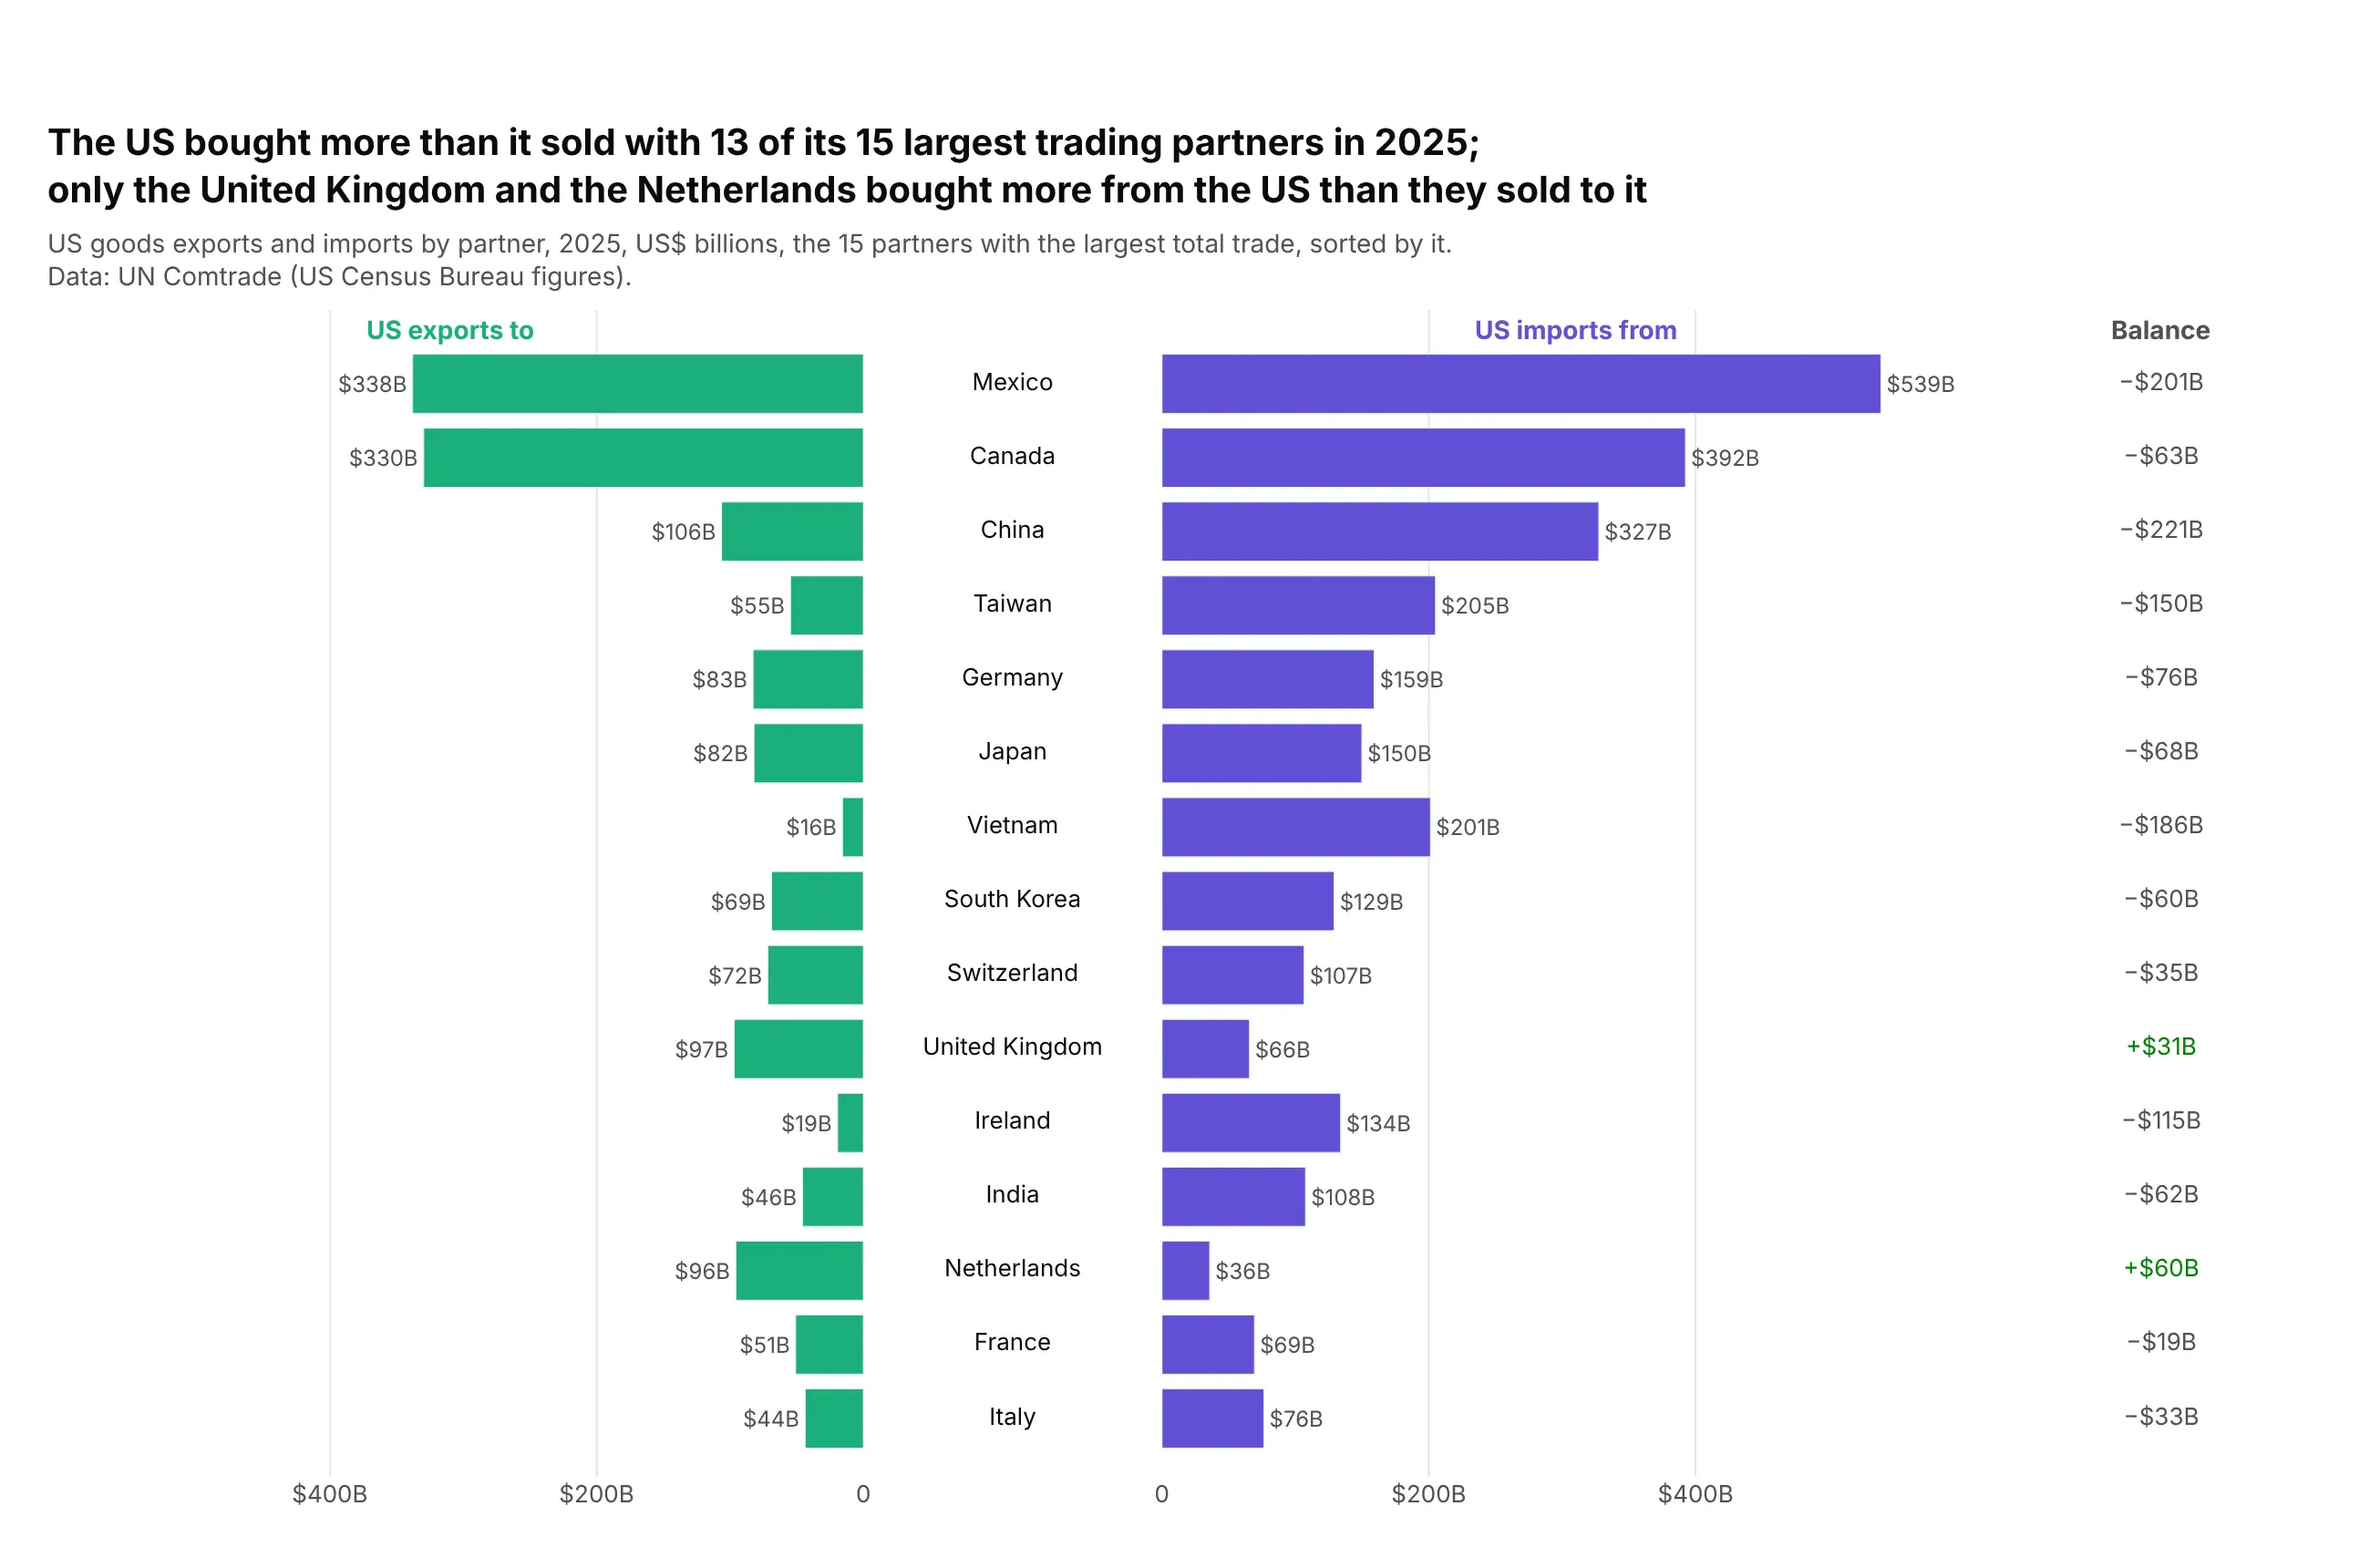
Any two quantities in one unit, as a butterfly chart. In 2025 the US bought more than it sold with 13 of its 15 largest trading partners, the most with China ($221 billion). Data: UN Comtrade (US Census Bureau figures).
A short history
The first population pyramid is credited to the Statistical Atlas of the United States that Francis A. Walker published in 1874 from the 1870 census (the plate in the David Rumsey Map Collection). Its plate is titled "Charts showing the distribution by age and sex of the population of the United States". The 1870 age tables are only published as scanned pages (1870 census publications), so we haven't redrawn it here.
Alternatives to a population pyramid
Here's the same US population drawn six ways. Some are better for the question, some worse, some just different:
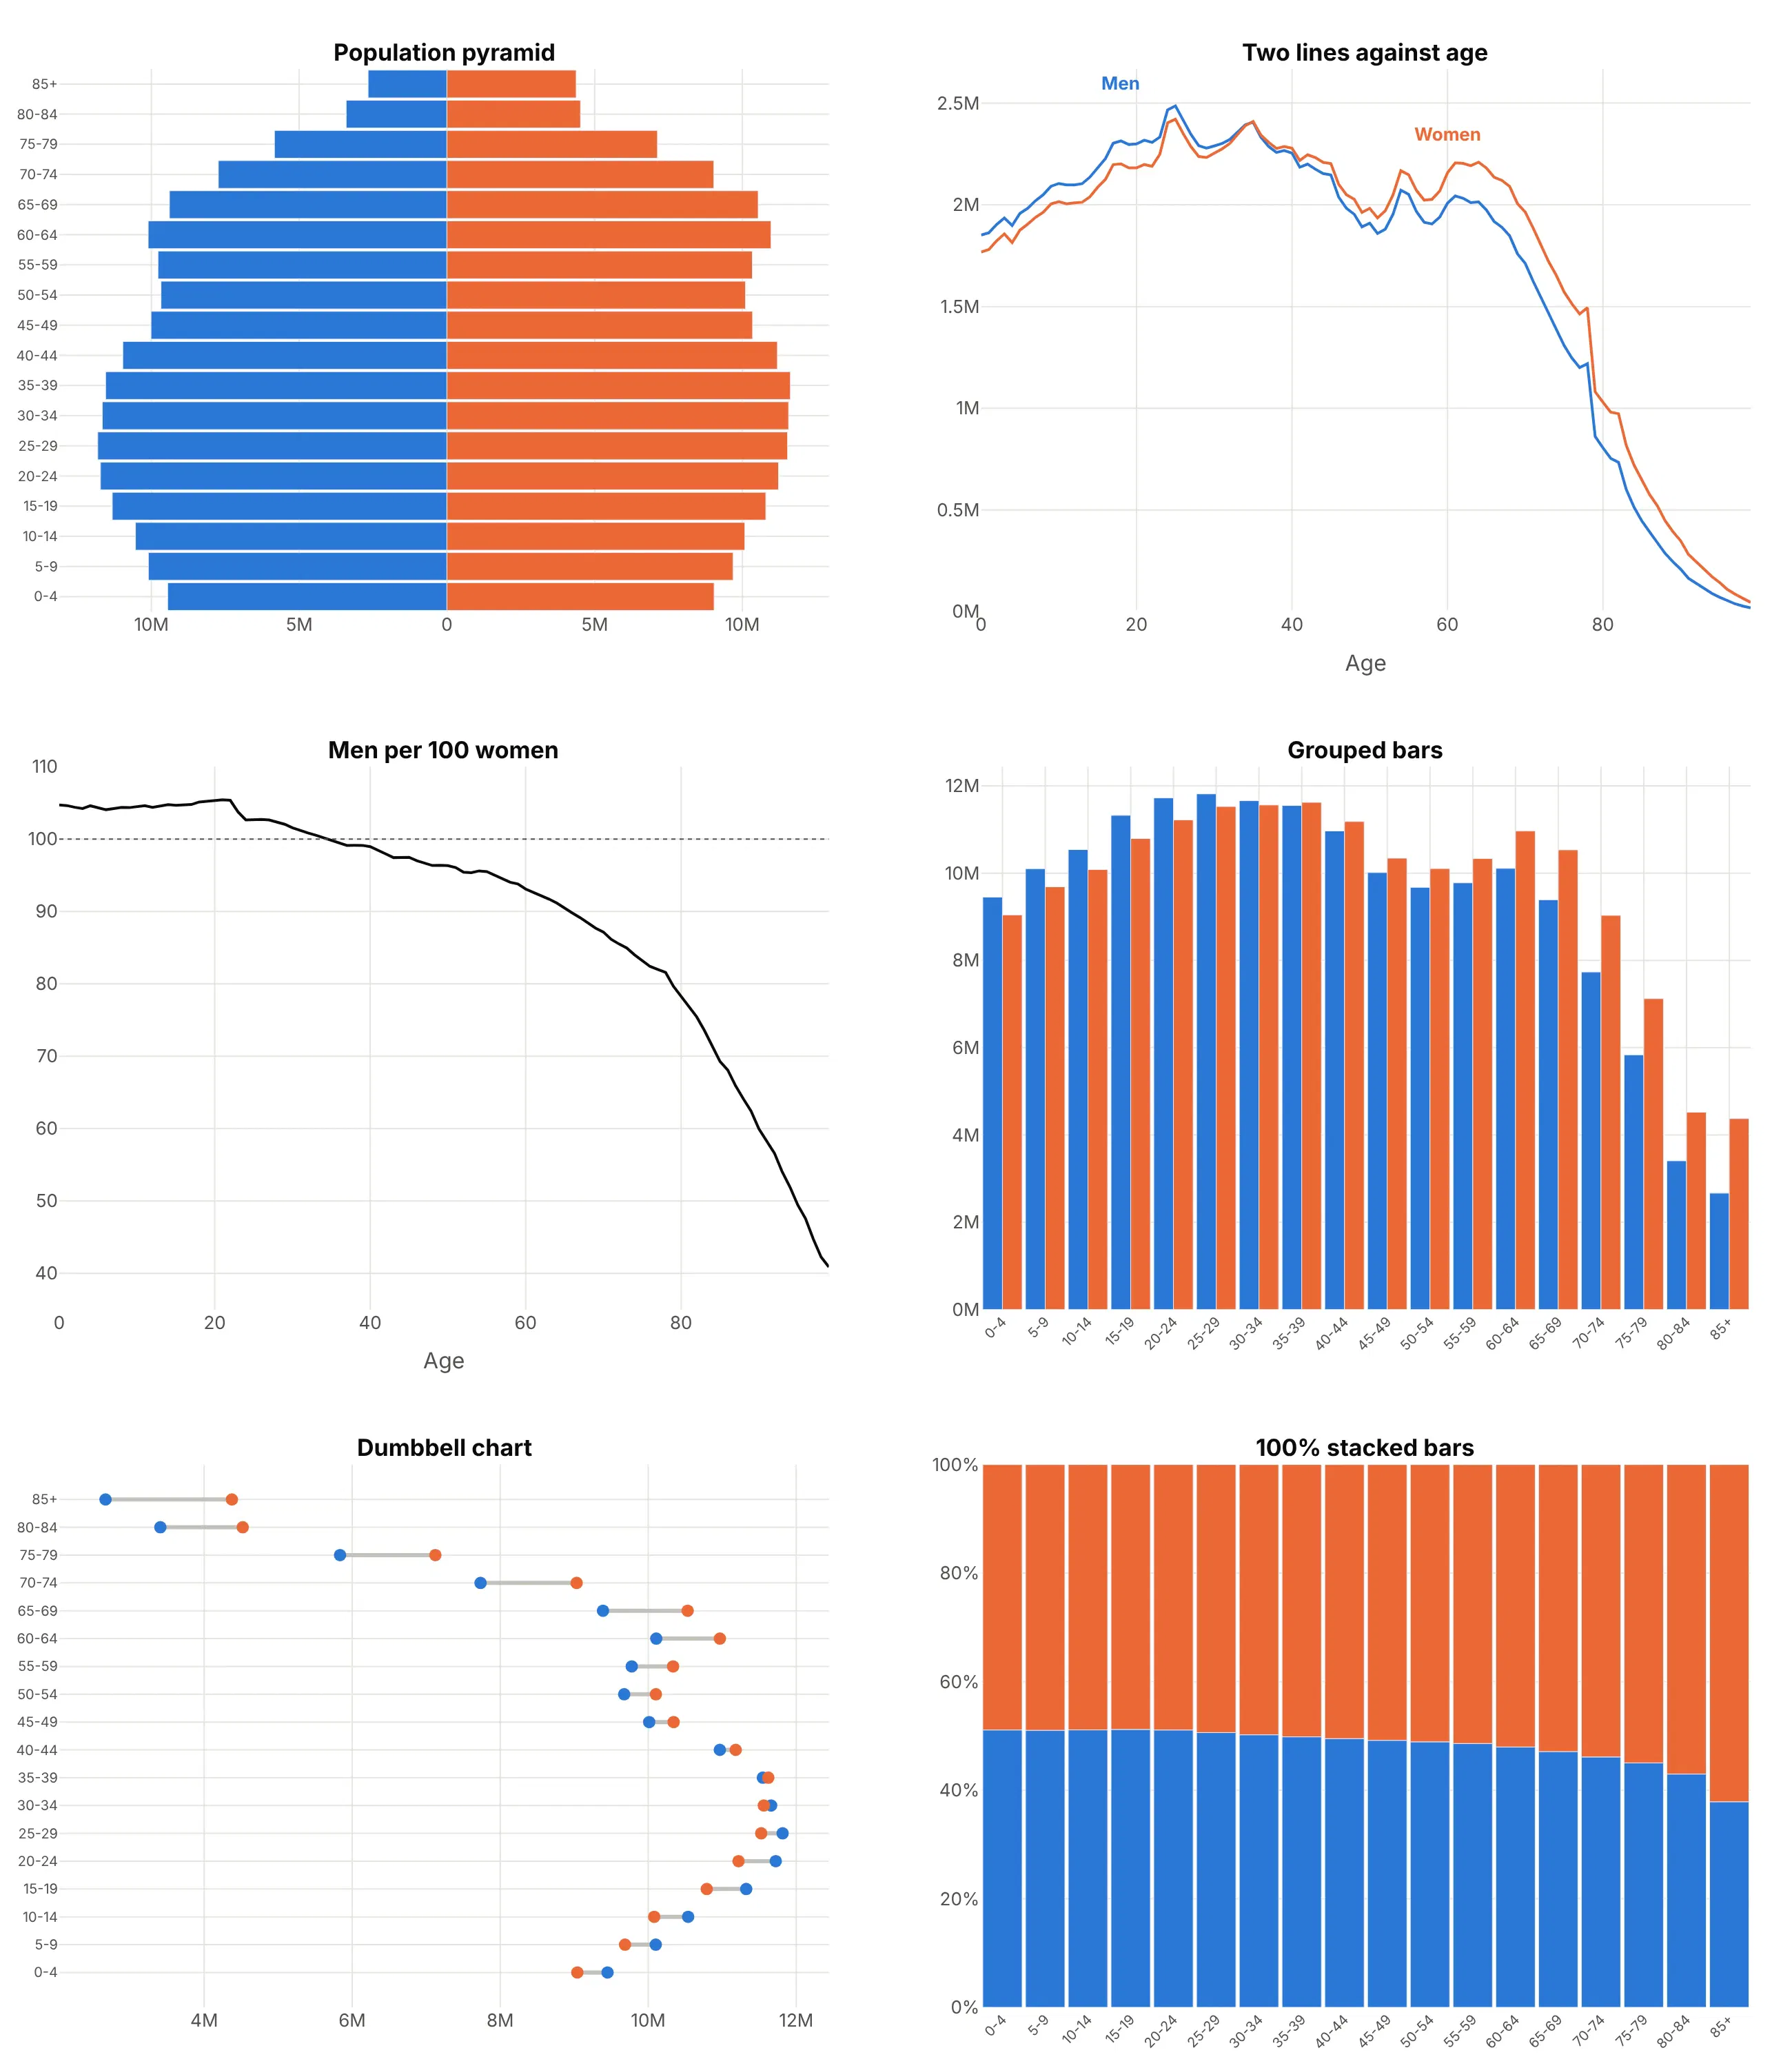
- Two lines against age (better for comparing years or places). Men and women on one axis start from the same baseline, which people read more accurately than bars growing out from a center line (Cleveland and McGill, 1984), and you can overlay several years without clutter. You lose the familiar shape.
- Men per 100 women (better when the balance is the question). One line shows that US women outnumber men at every age from 35, which the pyramid only hints at. It drops the sizes.
- Grouped bars (worse). Thirty-six vertical bars show the same numbers, but the silhouette that makes a pyramid readable at a glance is gone.
- Dumbbell chart (different). It puts both values for each age group on one axis, so the gap is easy to see, and it works well when the gap is the story. See our dumbbell chart guide.
- 100% stacked bars (different). They show the share of women in each age group and nothing about how many people there are.
How to make a population pyramid
With AI
ChatGPT, Claude Code, GitHub Copilot, Cursor and other AI tools are excellent at writing Plotly code. Name Plotly in the prompt, say which group goes on which side, and list the checks you want:
Make a plotly population pyramid from population.csv (columns: age_group, age, male, female).- Use two go.Bar traces with orientation="h",the men's values negated, and barmode="relative".- Youngest at the bottom: fix the row order with yaxis.categoryarray.- A symmetric x range, with tickvals/ticktext so the labels show no minus signs.- Write "Men" and "Women" above the top row instead of a legend.- A title that states the main takeaway.- Assert there is one row per age group and the total matches the source.- Save it as pyramid.html and as a PNG at 2x scale.
With Plotly Studio
Plotly Studio is a desktop app where you point an AI at a dataset and it builds charts and a Dash app around your questions. Ask for a population pyramid the same way:
Show a population pyramid of this country by single year of age, men on the left and women on the right, with no minus signs on the axis. Add a slider for the year and draw 1990 as a black outline for comparison.
Make a population pyramid in Python or JavaScript
This is the code AI tools write under the hood. In Python, a small helper builds a pyramid from two horizontal bar traces:
import plotly.graph_objects as godef make_pyramid(df, y, left, right, names=("Men", "Women"), colors=("#2a78d6", "#eb6834")):top = max(df[left].max(), df[right].max())step = float(f"{top / 2:.1g}") # a round tick stepticks = [-2 * step, -step, 0, step, 2 * step]fig = go.Figure([go.Bar(y=df[y], x=-df[left], orientation="h", name=names[0], marker_color=colors[0]),go.Bar(y=df[y], x=df[right], orientation="h", name=names[1], marker_color=colors[1]),])fig.update_layout(barmode="relative", bargap=0.08, showlegend=False,xaxis=dict(range=[-top * 1.1, top * 1.1], tickvals=ticks,ticktext=[f"{abs(t):,g}" for t in ticks]),yaxis=dict(categoryorder="array", categoryarray=list(df[y])))for x, text, color in [(-top / 2, names[0], colors[0]), (top / 2, names[1], colors[1])]:fig.add_annotation(x=x, y=df[y].iloc[-1], yshift=22, text=f"<b>{text}</b>",showarrow=False, font=dict(color=color))return figimport pandas as pd# World population in 2023, billions (UN World Population Prospects 2024)world = pd.DataFrame({"age_group": ["0-19", "20-39", "40-59", "60-79", "80+"],"male": [1.37, 1.23, 0.94, 0.46, 0.06],"female": [1.29, 1.17, 0.93, 0.52, 0.10]})make_pyramid(world, "age_group", "male", "female").show()
In JavaScript, plotly.js builds the same thing from two bar traces:
<div id="chart"></div><script src="https://cdn.plot.ly/plotly-4.1.1.min.js"></script><script>// World population in 2023, billions (UN World Population Prospects 2024)const ages = ["0-19", "20-39", "40-59", "60-79", "80+"];const men = [1.37, 1.23, 0.94, 0.46, 0.06];const women = [1.29, 1.17, 0.93, 0.52, 0.10];Plotly.newPlot("chart", [{type: "bar", orientation: "h", y: ages, x: men.map(v => -v), name: "Men",customdata: men, hovertemplate: "Men %{y}: %{customdata}B<extra></extra>"},{type: "bar", orientation: "h", y: ages, x: women, name: "Women"}], {barmode: "relative",xaxis: {tickvals: [-1, -0.5, 0, 0.5, 1], ticktext: ["1B", "0.5B", "0", "0.5B", "1B"]}});</script>
Without barmode="relative" (or "overlay"), Plotly groups the two traces and draws each row's bars side by side, half a row apart.
Share it
Every Plotly chart has a Share chart button (the cloud icon in its toolbar) that uploads it to Plotly Cloud and gives you a link. Only you can see it until you change its visibility.
For a live app, put the chart in a Dash app and publish it with the Plotly Cloud CLI. Coding agents can run these commands for you:
pip install "dash[cloud]"plotly user loginplotly app publish
If your data has to stay in your own cloud or data center, publish to Dash Enterprise instead.
Dos and don'ts
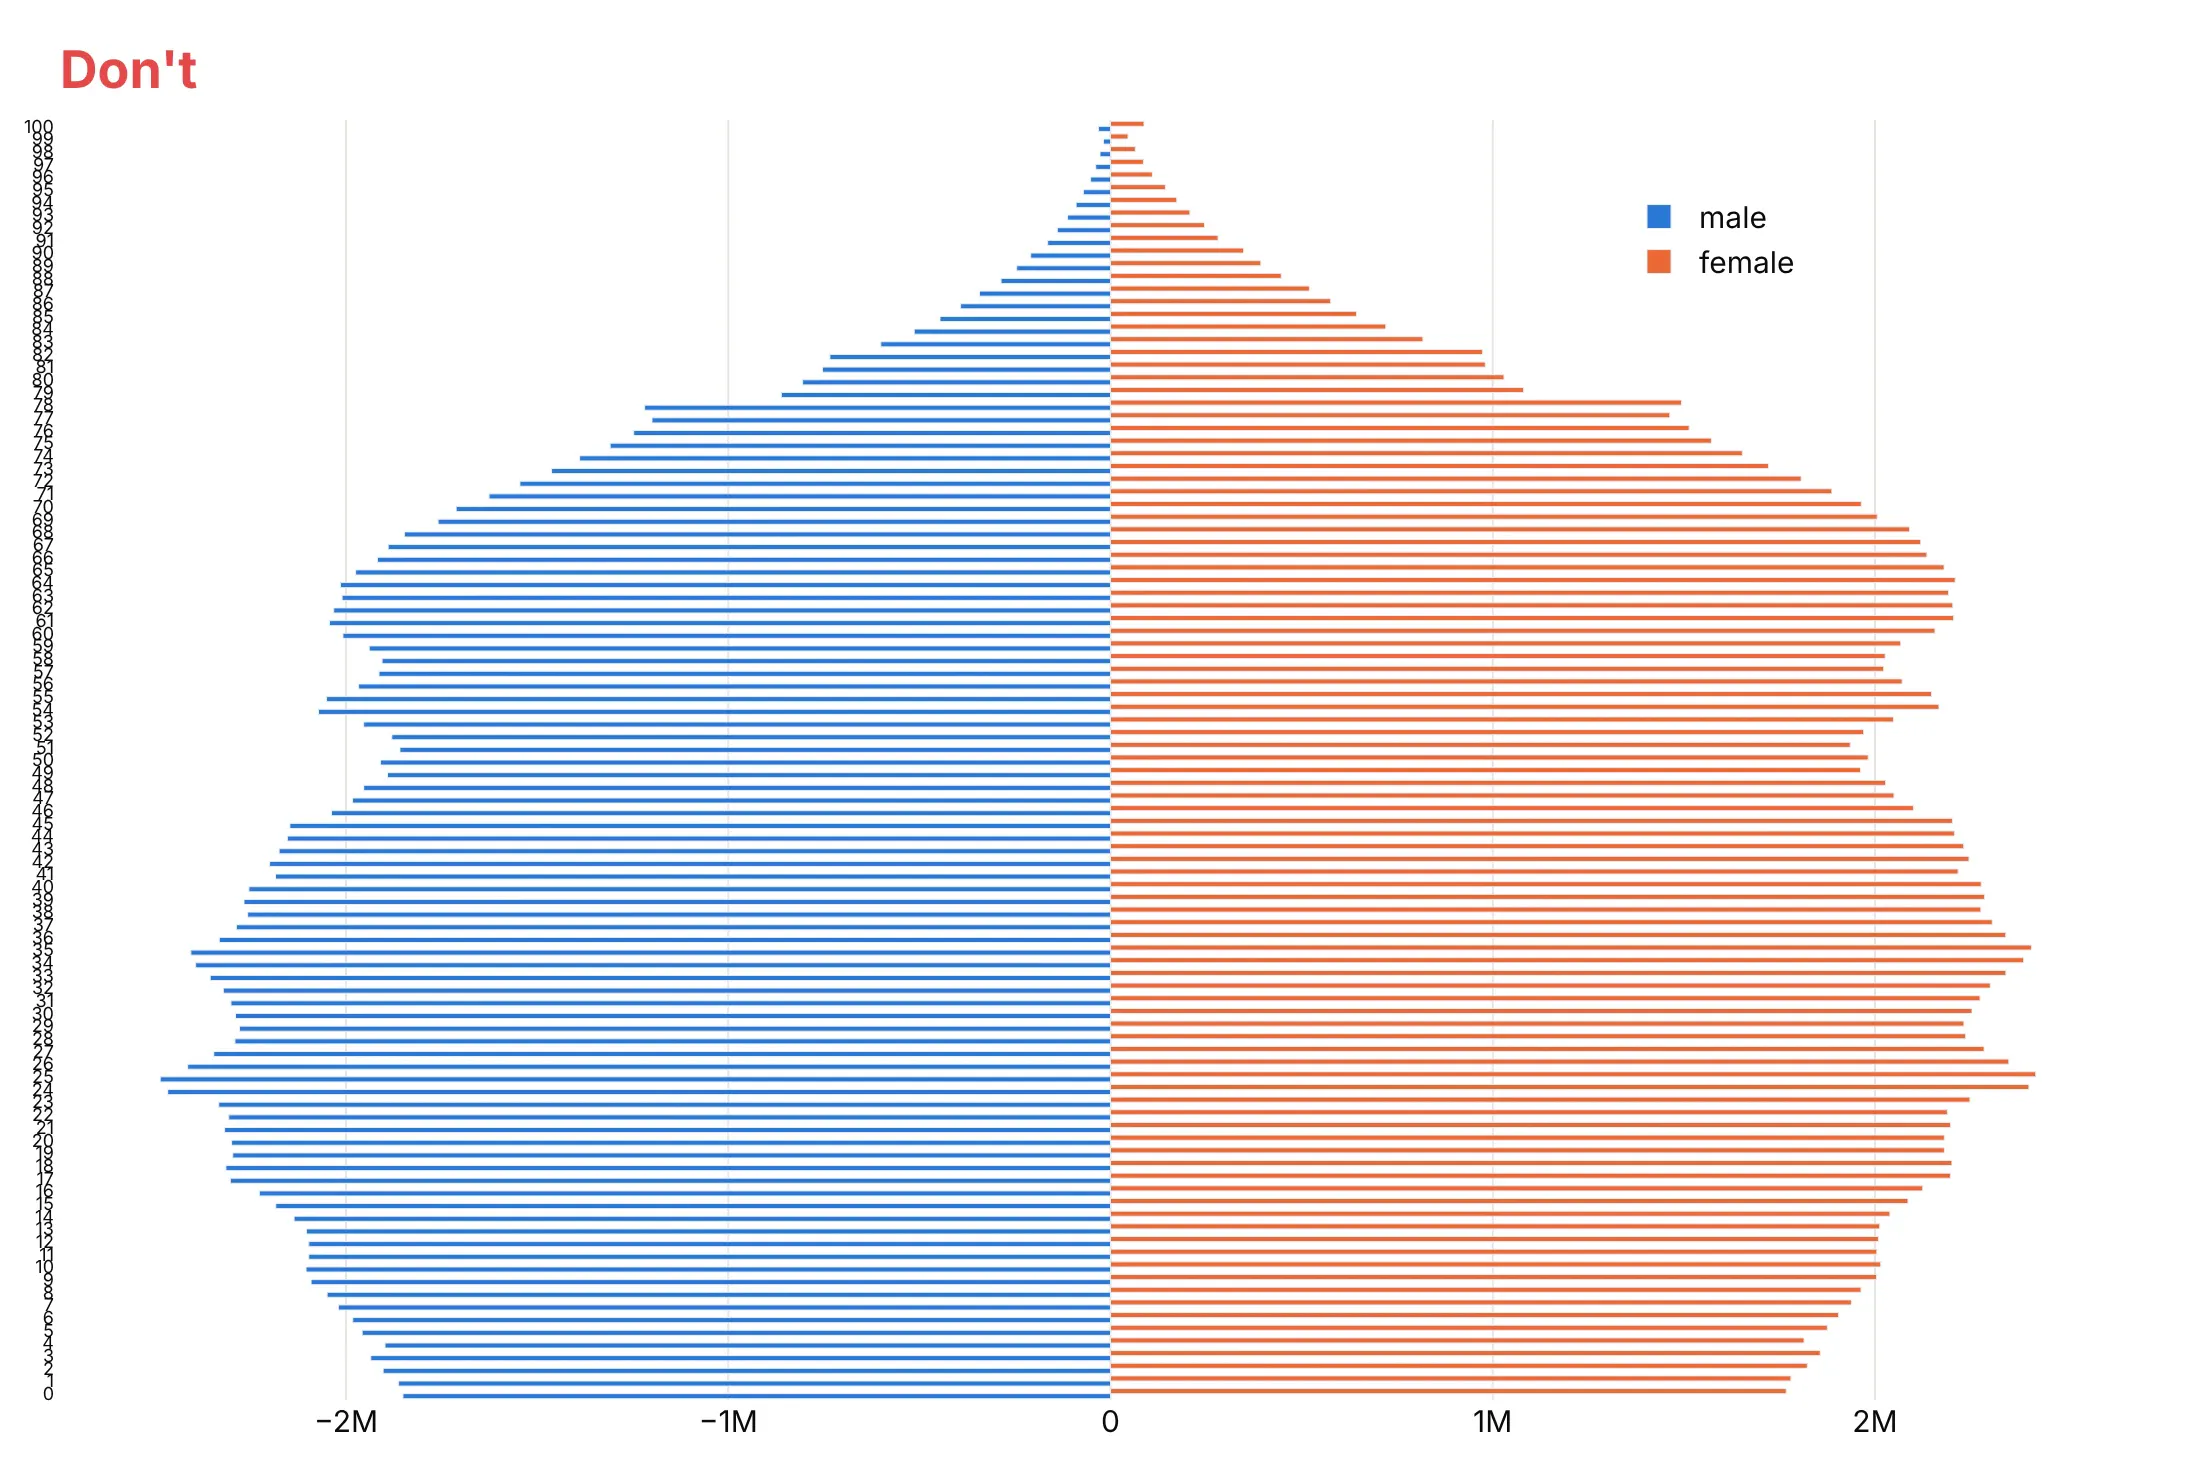
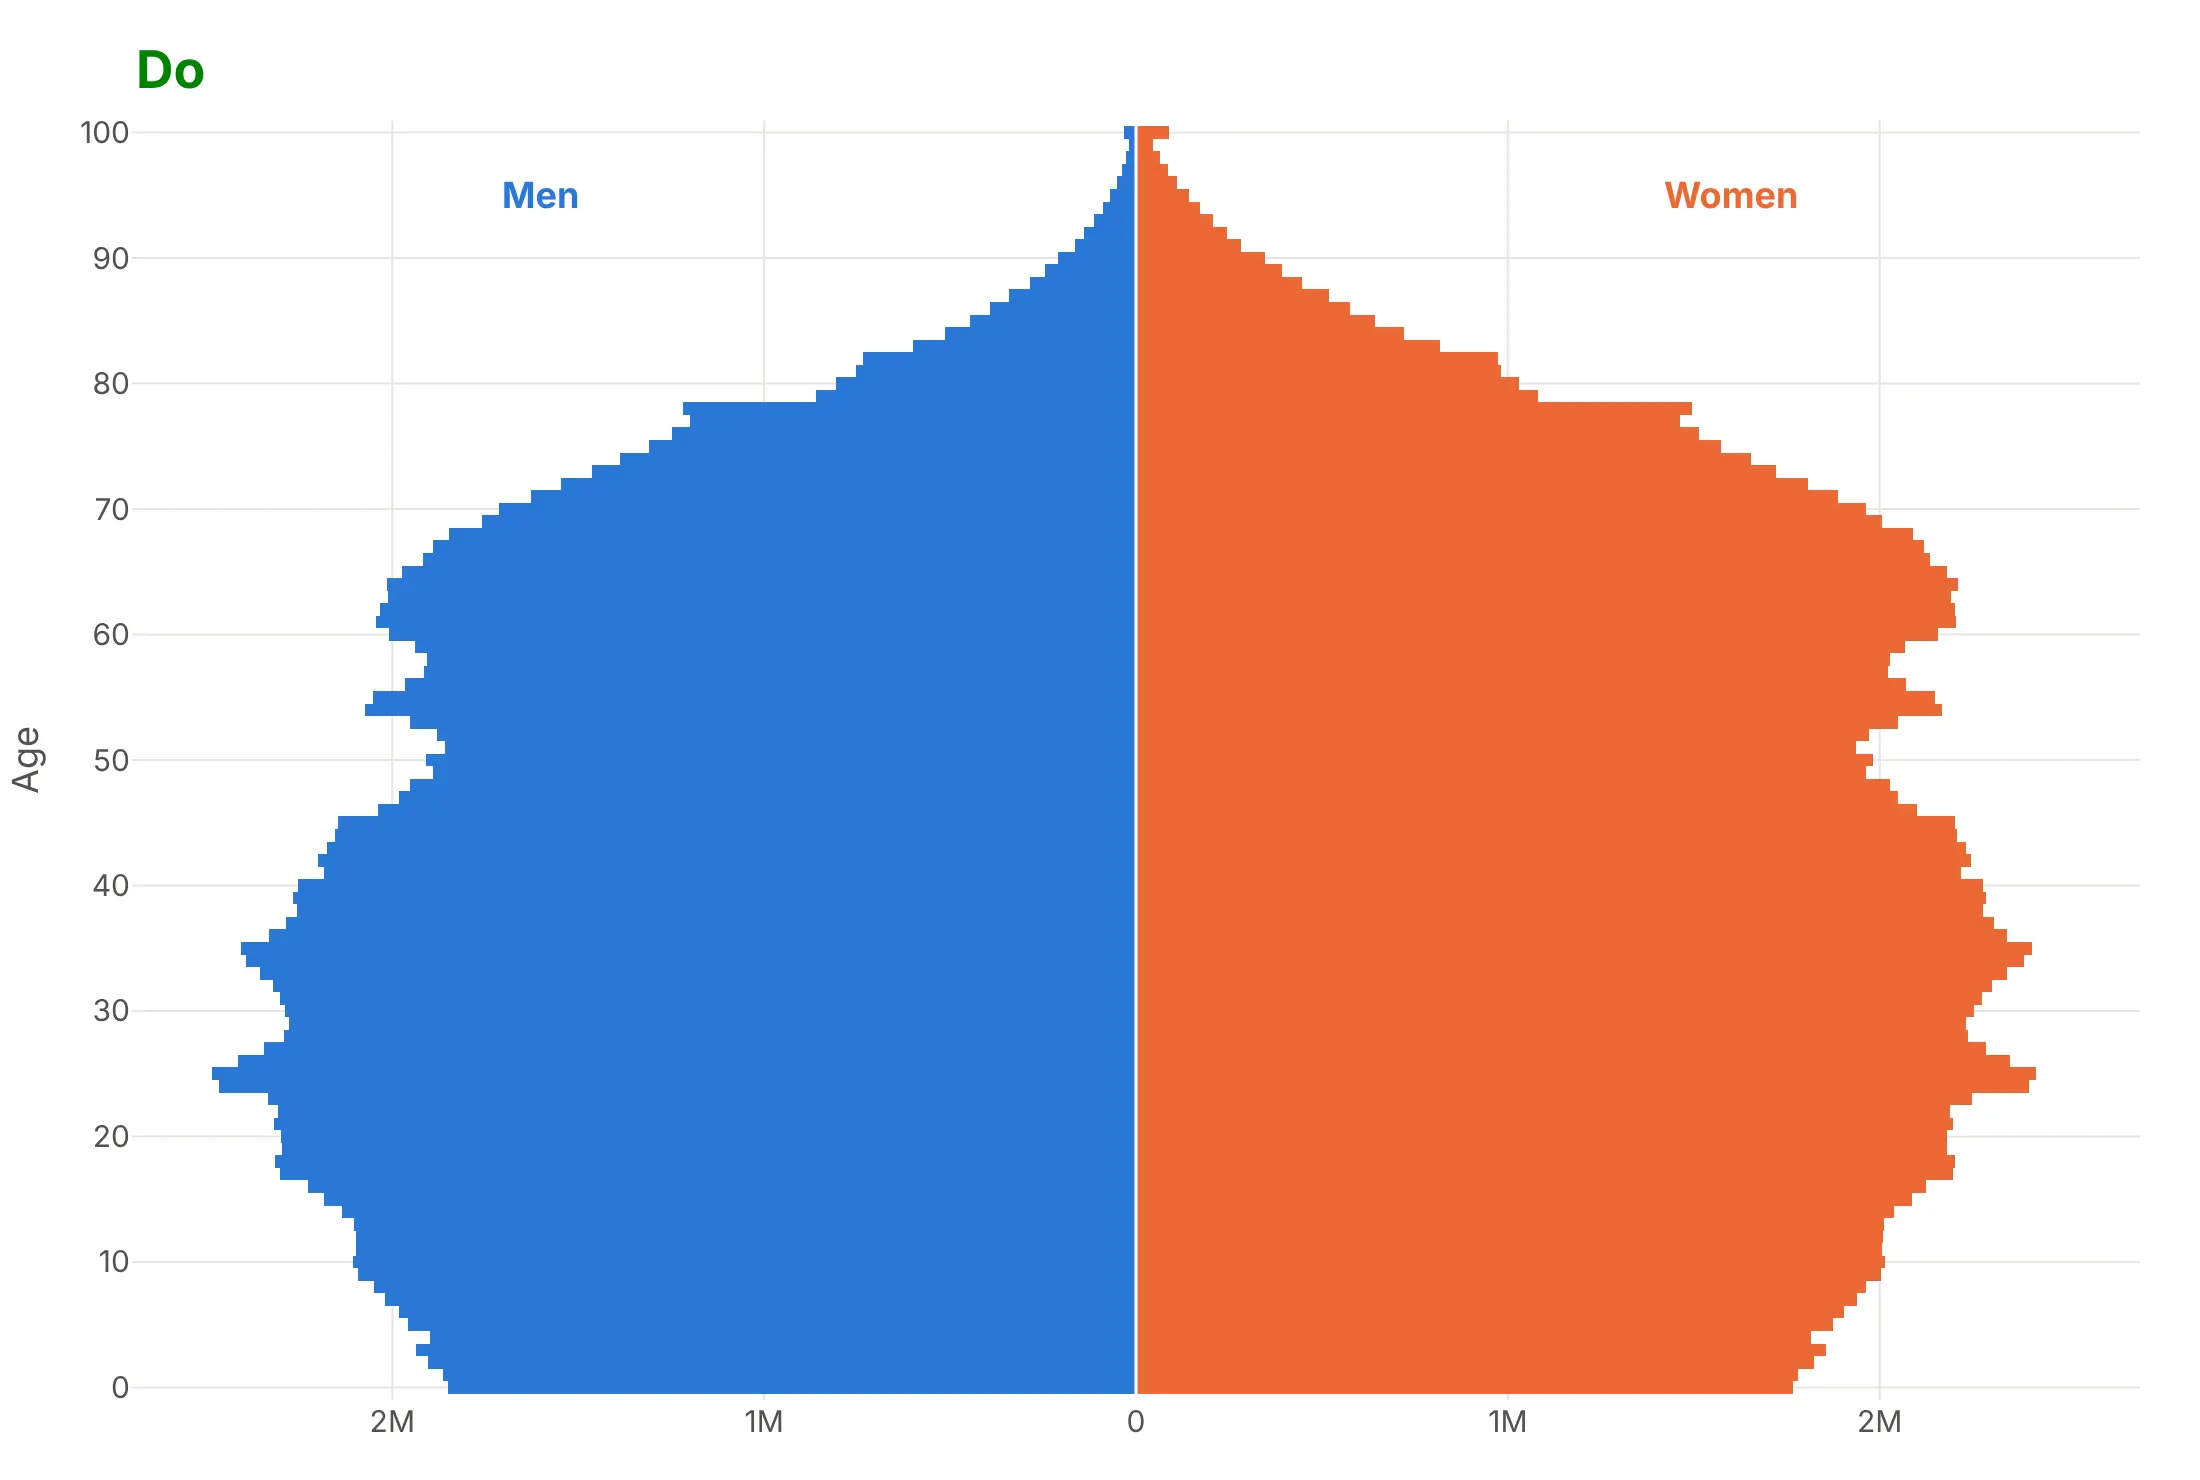
Most published pyramids that are hard to read share the same few mistakes, and none of them is about color. Here is the US population in 2025 both ways, with the same blue and orange.
Don't leave the bars in the default grouped mode (each age's two bars sit half a row apart), print minus signs on the men's side, put a legend over the data or label every one of 101 ages:
Do put both bars on one row with barmode="relative", drop the minus signs, label ages every 10 years and write "Men" and "Women" on the chart:
Four ways to style the same pyramid
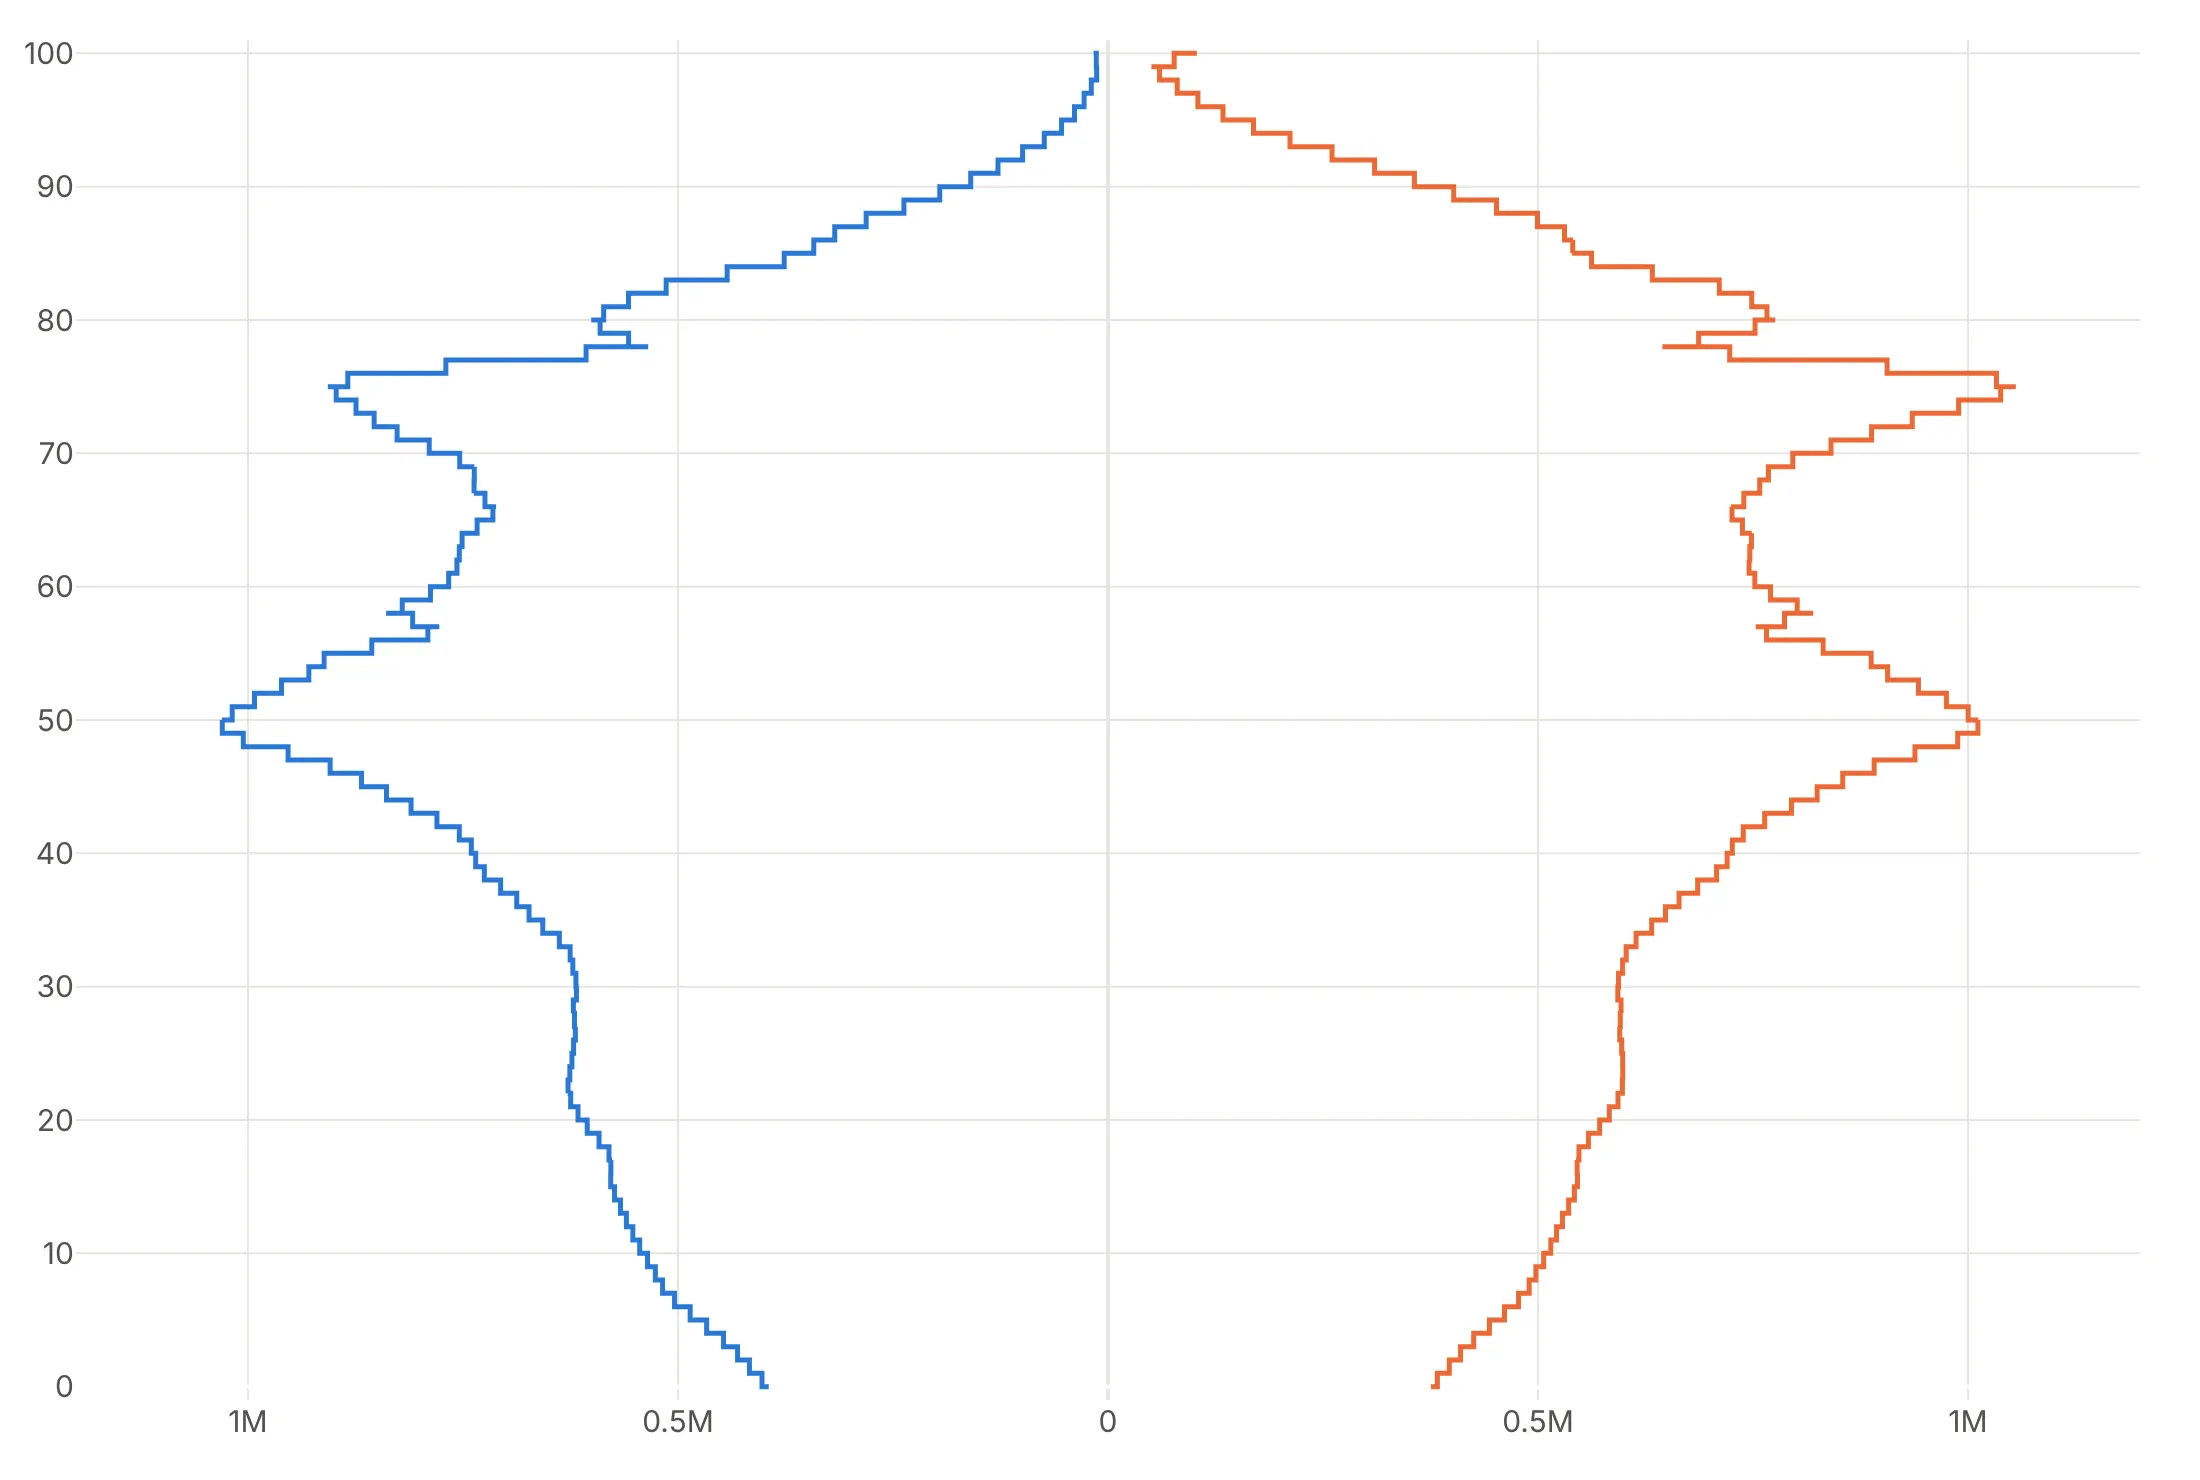
Here is Japan's population in 2023 four ways. Pick the one that fits the question.
Single years, in counts. With bargap=0 the 101 bars form one silhouette and every cohort shows, including both baby booms.
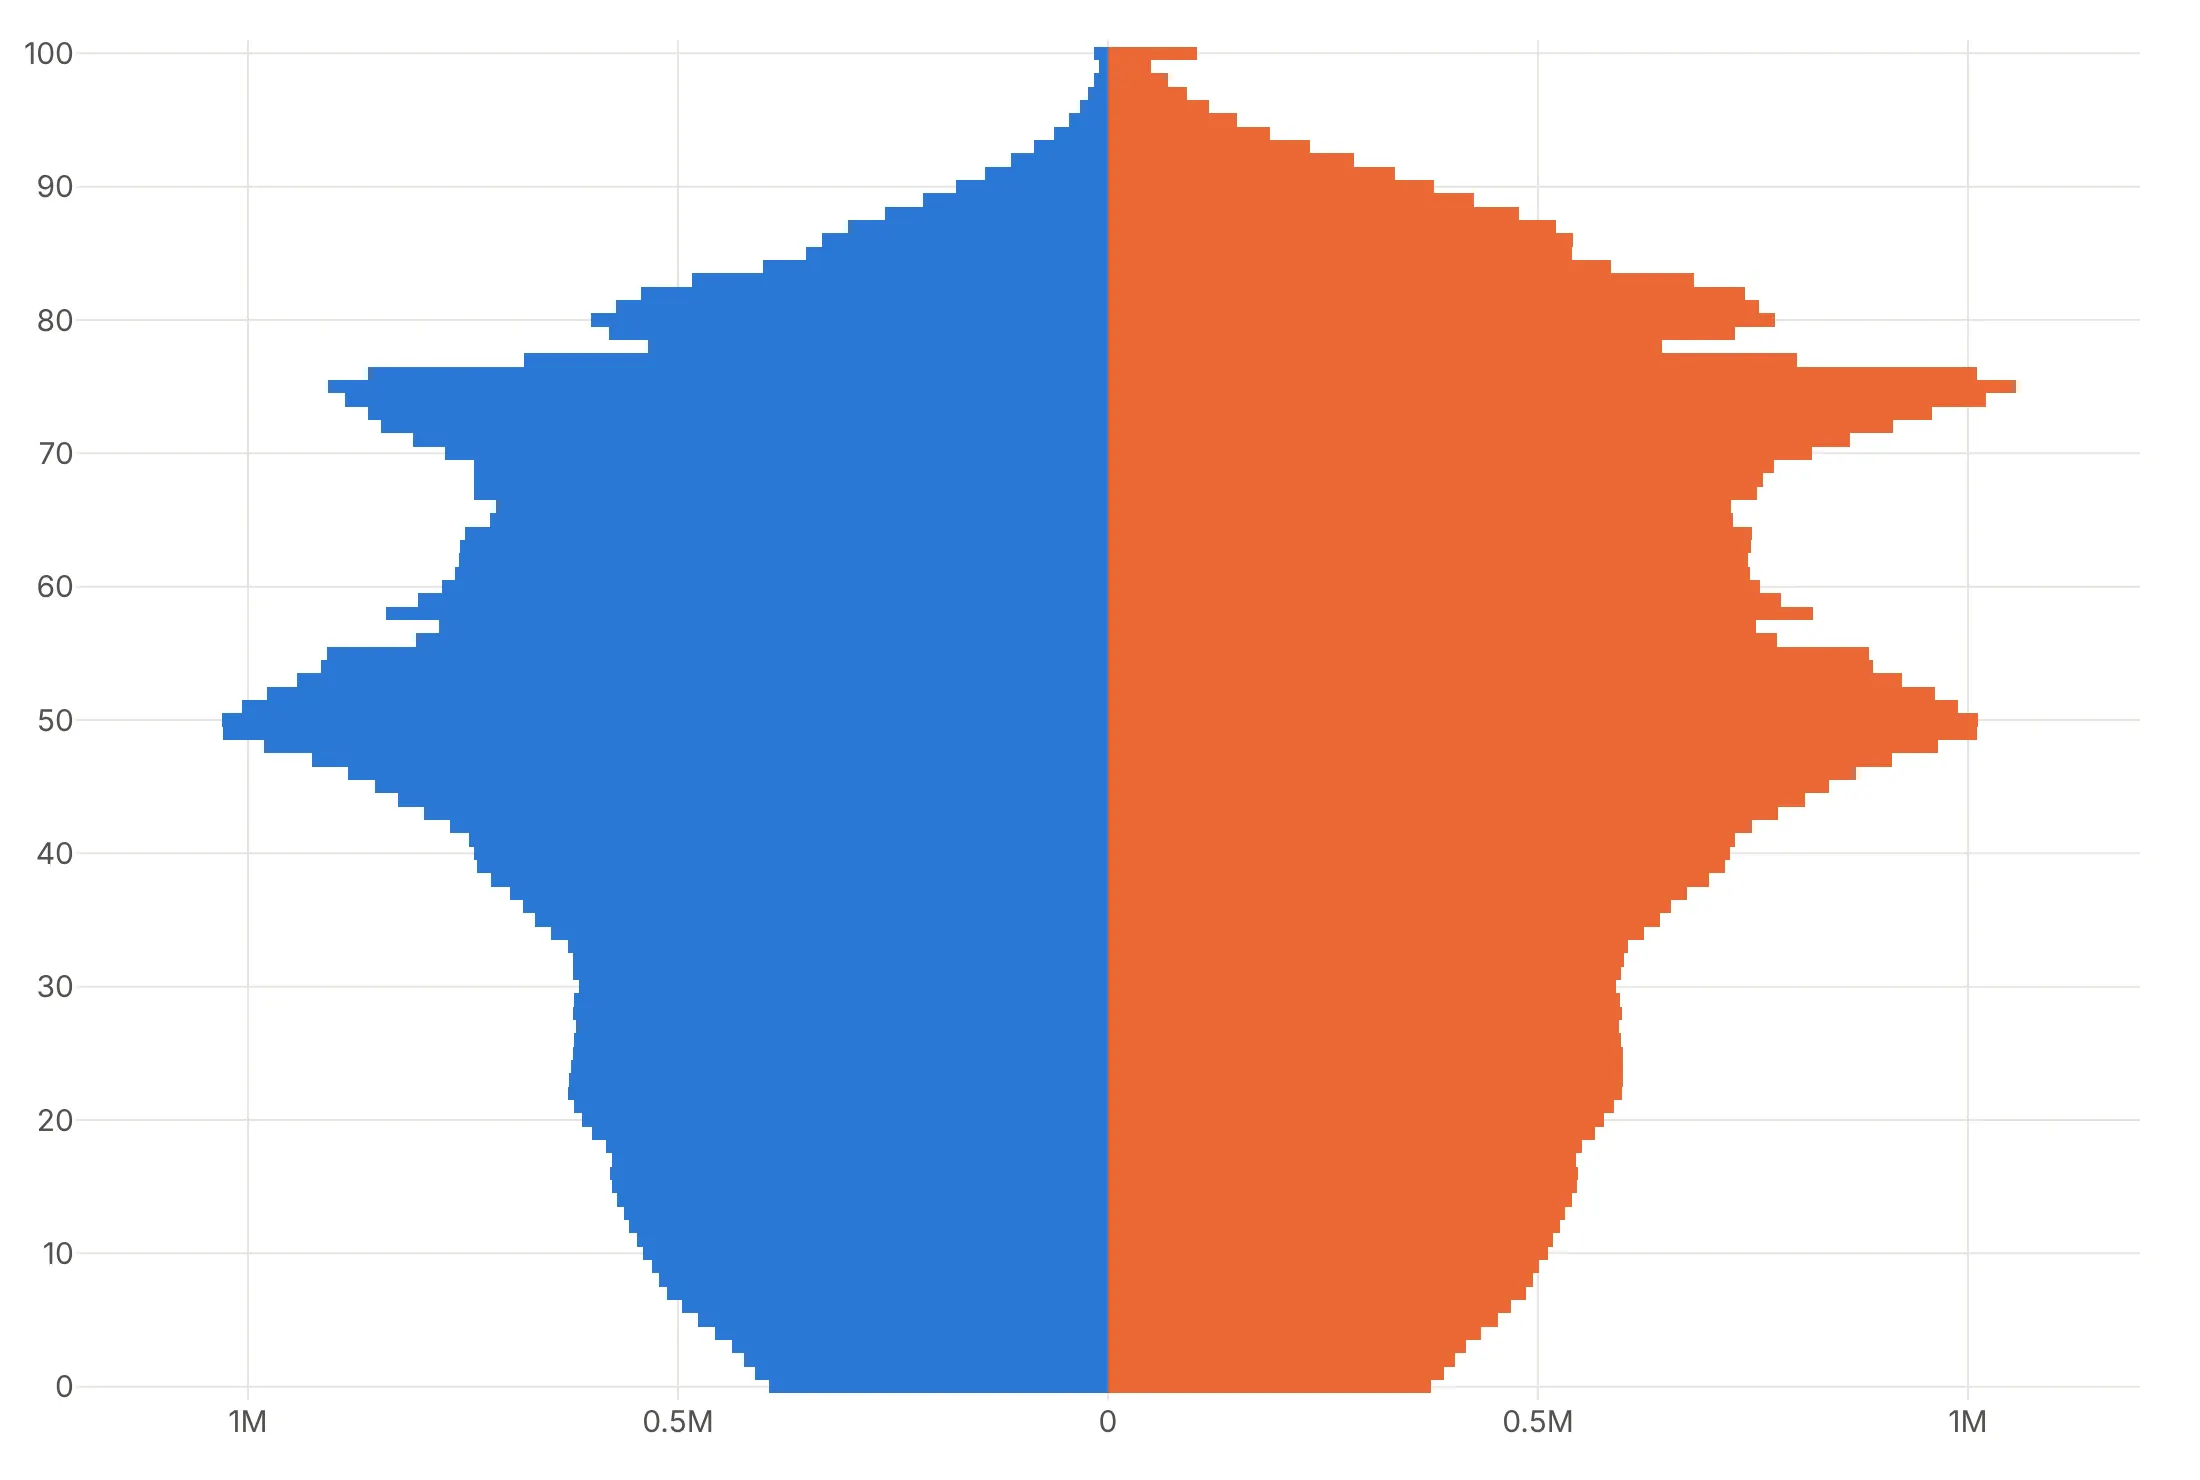
5-year groups, in percent. Fewer, wider rows read faster, and percent of the total compares with any other country.
Outline only. A step line per side leaves room to overlay a second year or a projection in another color.
Highlight one story. Gray bars with the two baby-boom cohorts in purple tell the reader exactly where to look.
Checklist
Do
- Write a title that states the takeaway.
- Use barmode="relative" and a symmetric axis range.
- Drop the minus signs with tickvals and ticktext.
- Name the two sides on the chart, above the top row.
- Use percent of the total when you compare populations of different sizes.
- Label projections as projections.
Don't
- Fit each side's axis separately.
- Mix age-group widths (16-19 next to 20-24) without saying so.
- Read the open-ended top group (85+, 100+) as one more 5-year row.
- Use a log axis on negated values; it can't show them.
Options to customize
These are the go.Bar and layout options that matter most for a pyramid. The full list is in the Plotly bar trace reference.
- orientation="h" with negated x: draws one side to the left of zero.
- barmode="relative" (layout): puts both sides on one row and stacks extra traces outward, for stacked pyramids.
- barmode="overlay" (layout): draws traces on top of each other, for an outlined reference population over filled bars.
- xaxis.tickvals, xaxis.ticktext: custom tick labels that drop the minus signs.
- xaxis.range: keep it symmetric, and fixed in animations.
- bargap: 0 for single years of age.
- customdata, hovertemplate: show positive values in the hover for the negated side.
- marker.color as a list: one color per bar, for generations, life stages or a highlighted cohort.
- marker.pattern.shape: hatching, to mark a projection.
- go.Scatter(line_shape="hvh"): a step line along the bar edges, to outline a second year.
- go.Scatter(mode="text"): a column of ratios or balances beside the bars.
- make_subplots(shared_yaxes=True): small multiples, mirrored log axes, or labels in a middle column.
- xaxis.type="log", xaxis.autorange="reversed": a log scale on each side of mirrored subplots.
- yaxis.type="category", yaxis.categoryarray: fix the row order, and stop Plotly reading labels like "2000-04" as dates.
More population pyramid examples
Ten more pyramids and butterfly charts built from real public data, each with its source, the technique that makes it work and a prompt to rebuild it.
1. China in 1990 and 2023
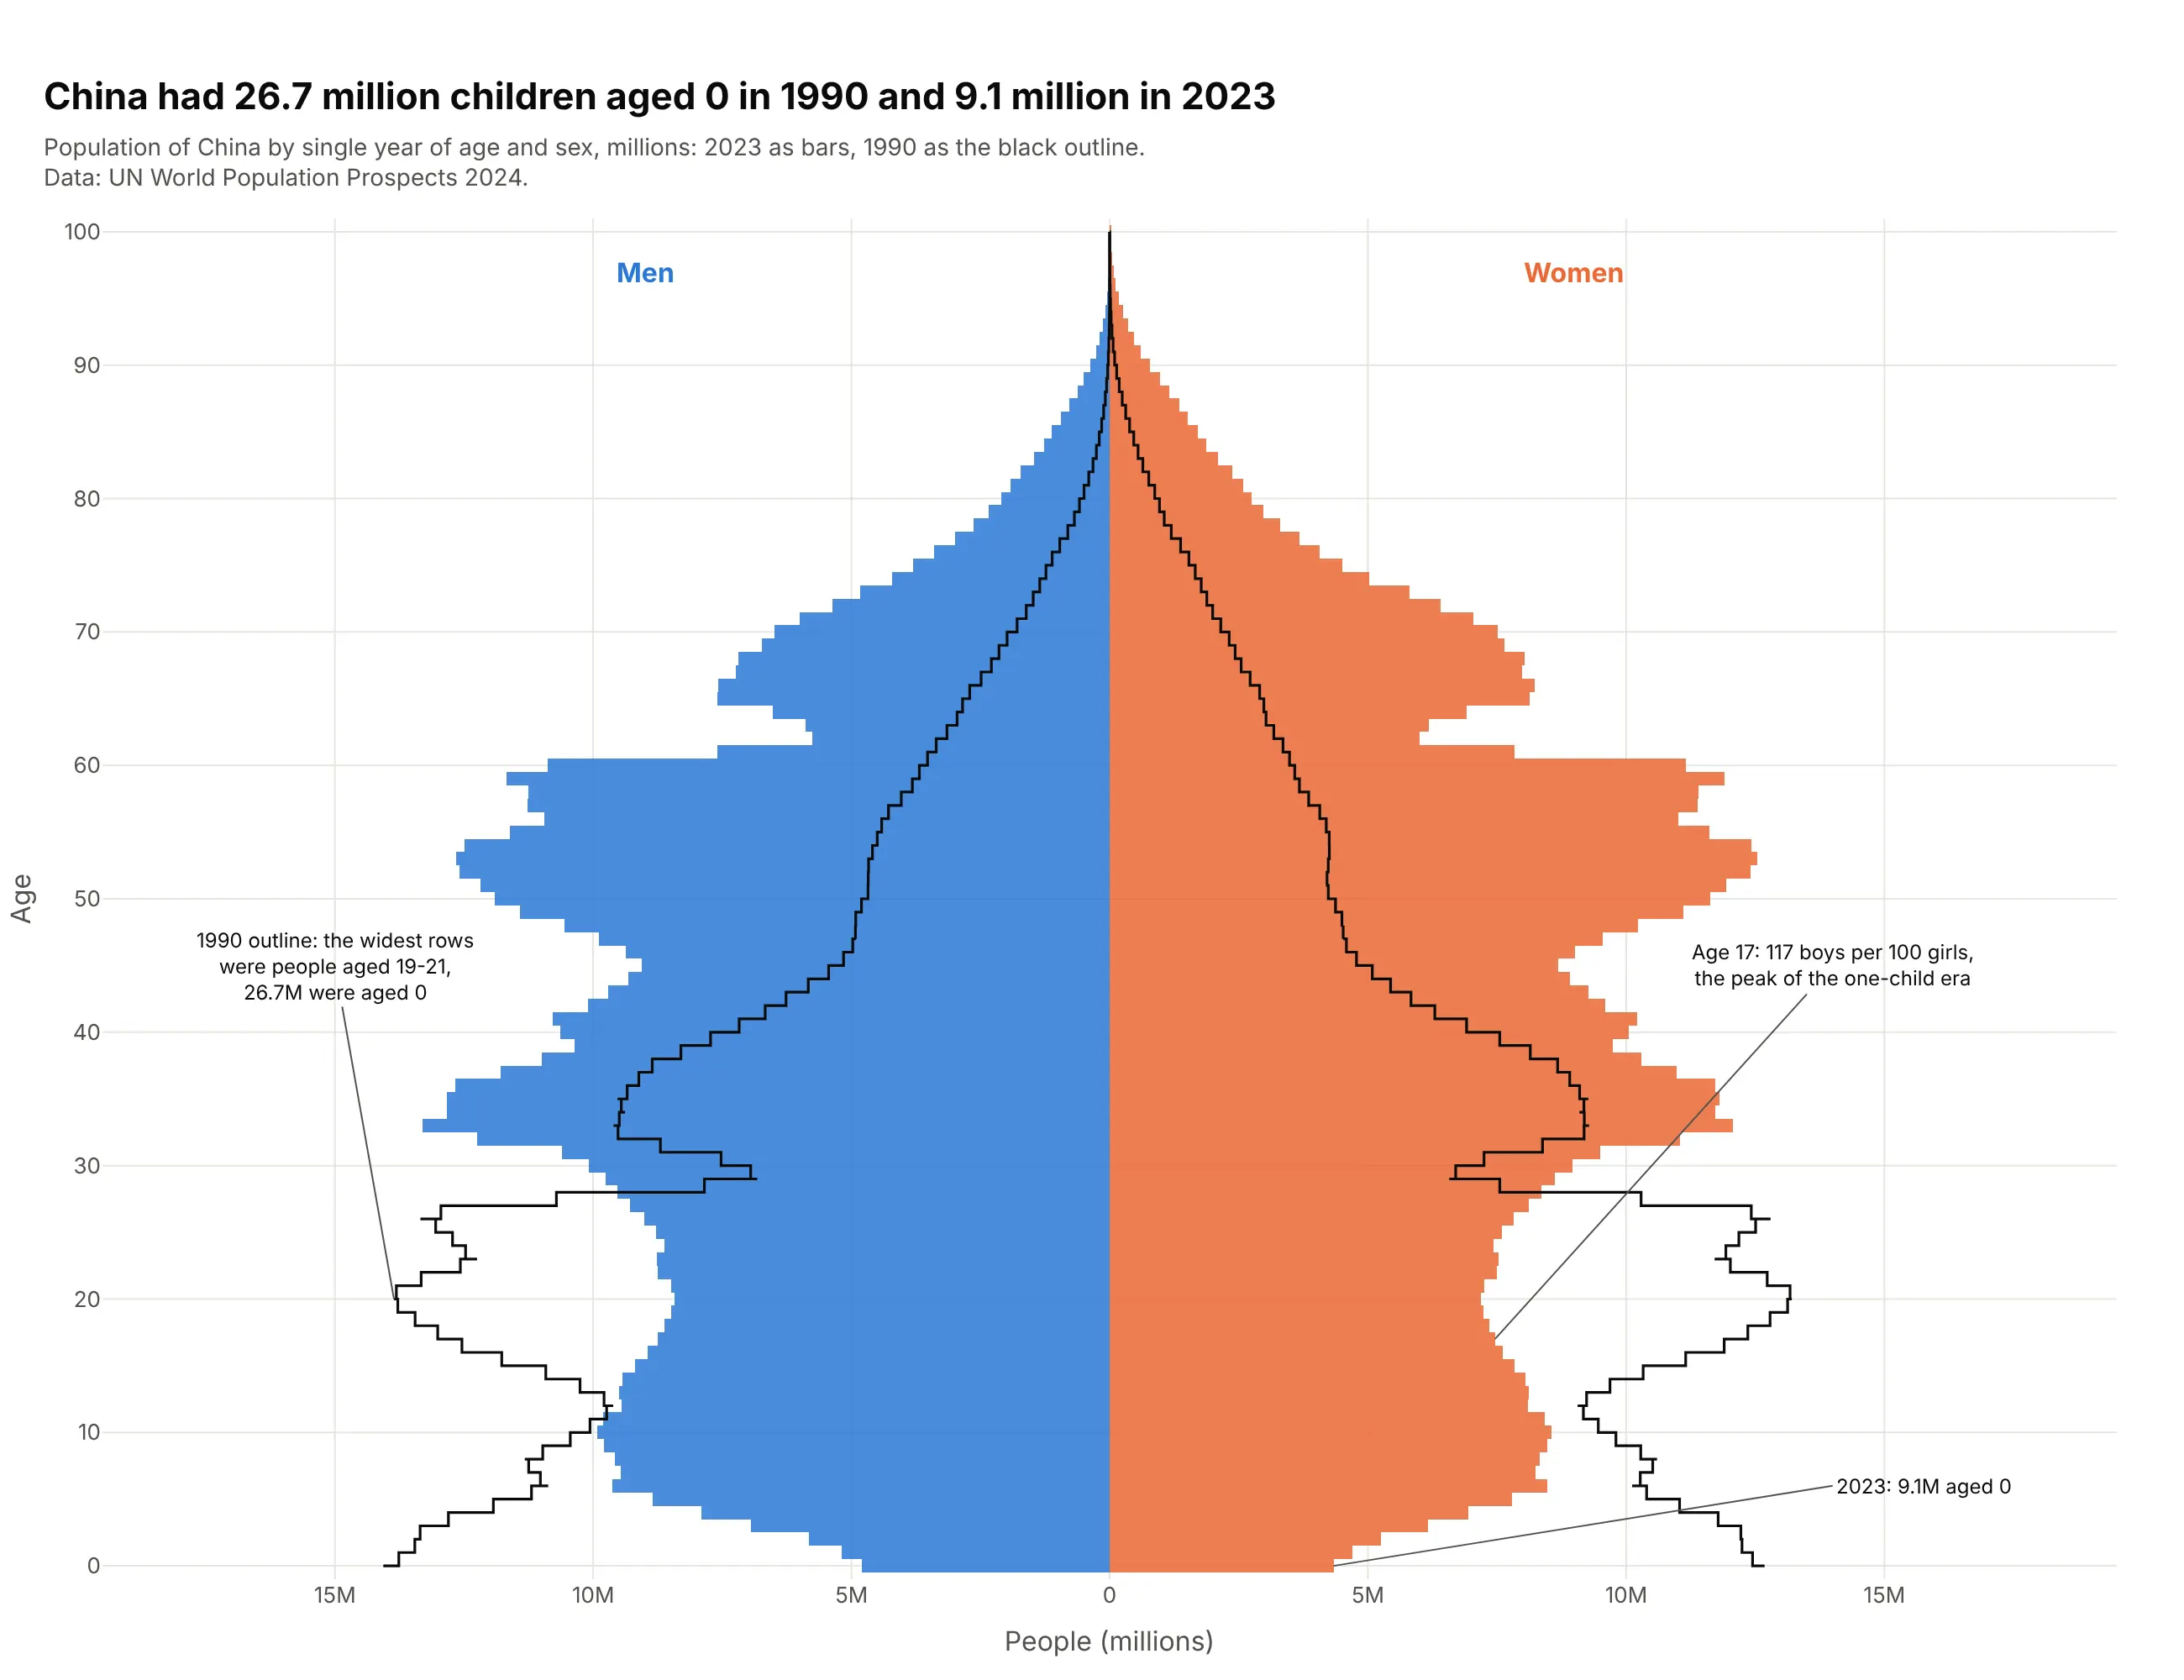
China had 26.7 million children aged 0 in 1990 and 9.1 million in 2023. The 1990 base, drawn as an outline, has moved up to the 30s, and boys outnumber girls 117 to 100 at age 17, the imbalance the one-child era produced (Zhu, Lu and Hesketh, 2009). Data: UN World Population Prospects 2024.
Tip: draw the earlier year as go.Scatter(mode="lines", line_shape="hvh") on both sides so it traces the bar edges.
Get the data from the UN World Population Prospects 2024 CSV "Population by single age and sex"(1950-2023), location China, years 1990 and 2023(columns: year, age, male, female, in thousands).Build a plotly population pyramid of 2023 with bargap=0, and draw 1990 as a black step outline(go.Scatter, line_shape="hvh") on each side.- Annotate the age-0 counts for both years and the age where boys per 100 girls peaks.
2. South Korea today and in 2050 (projection)
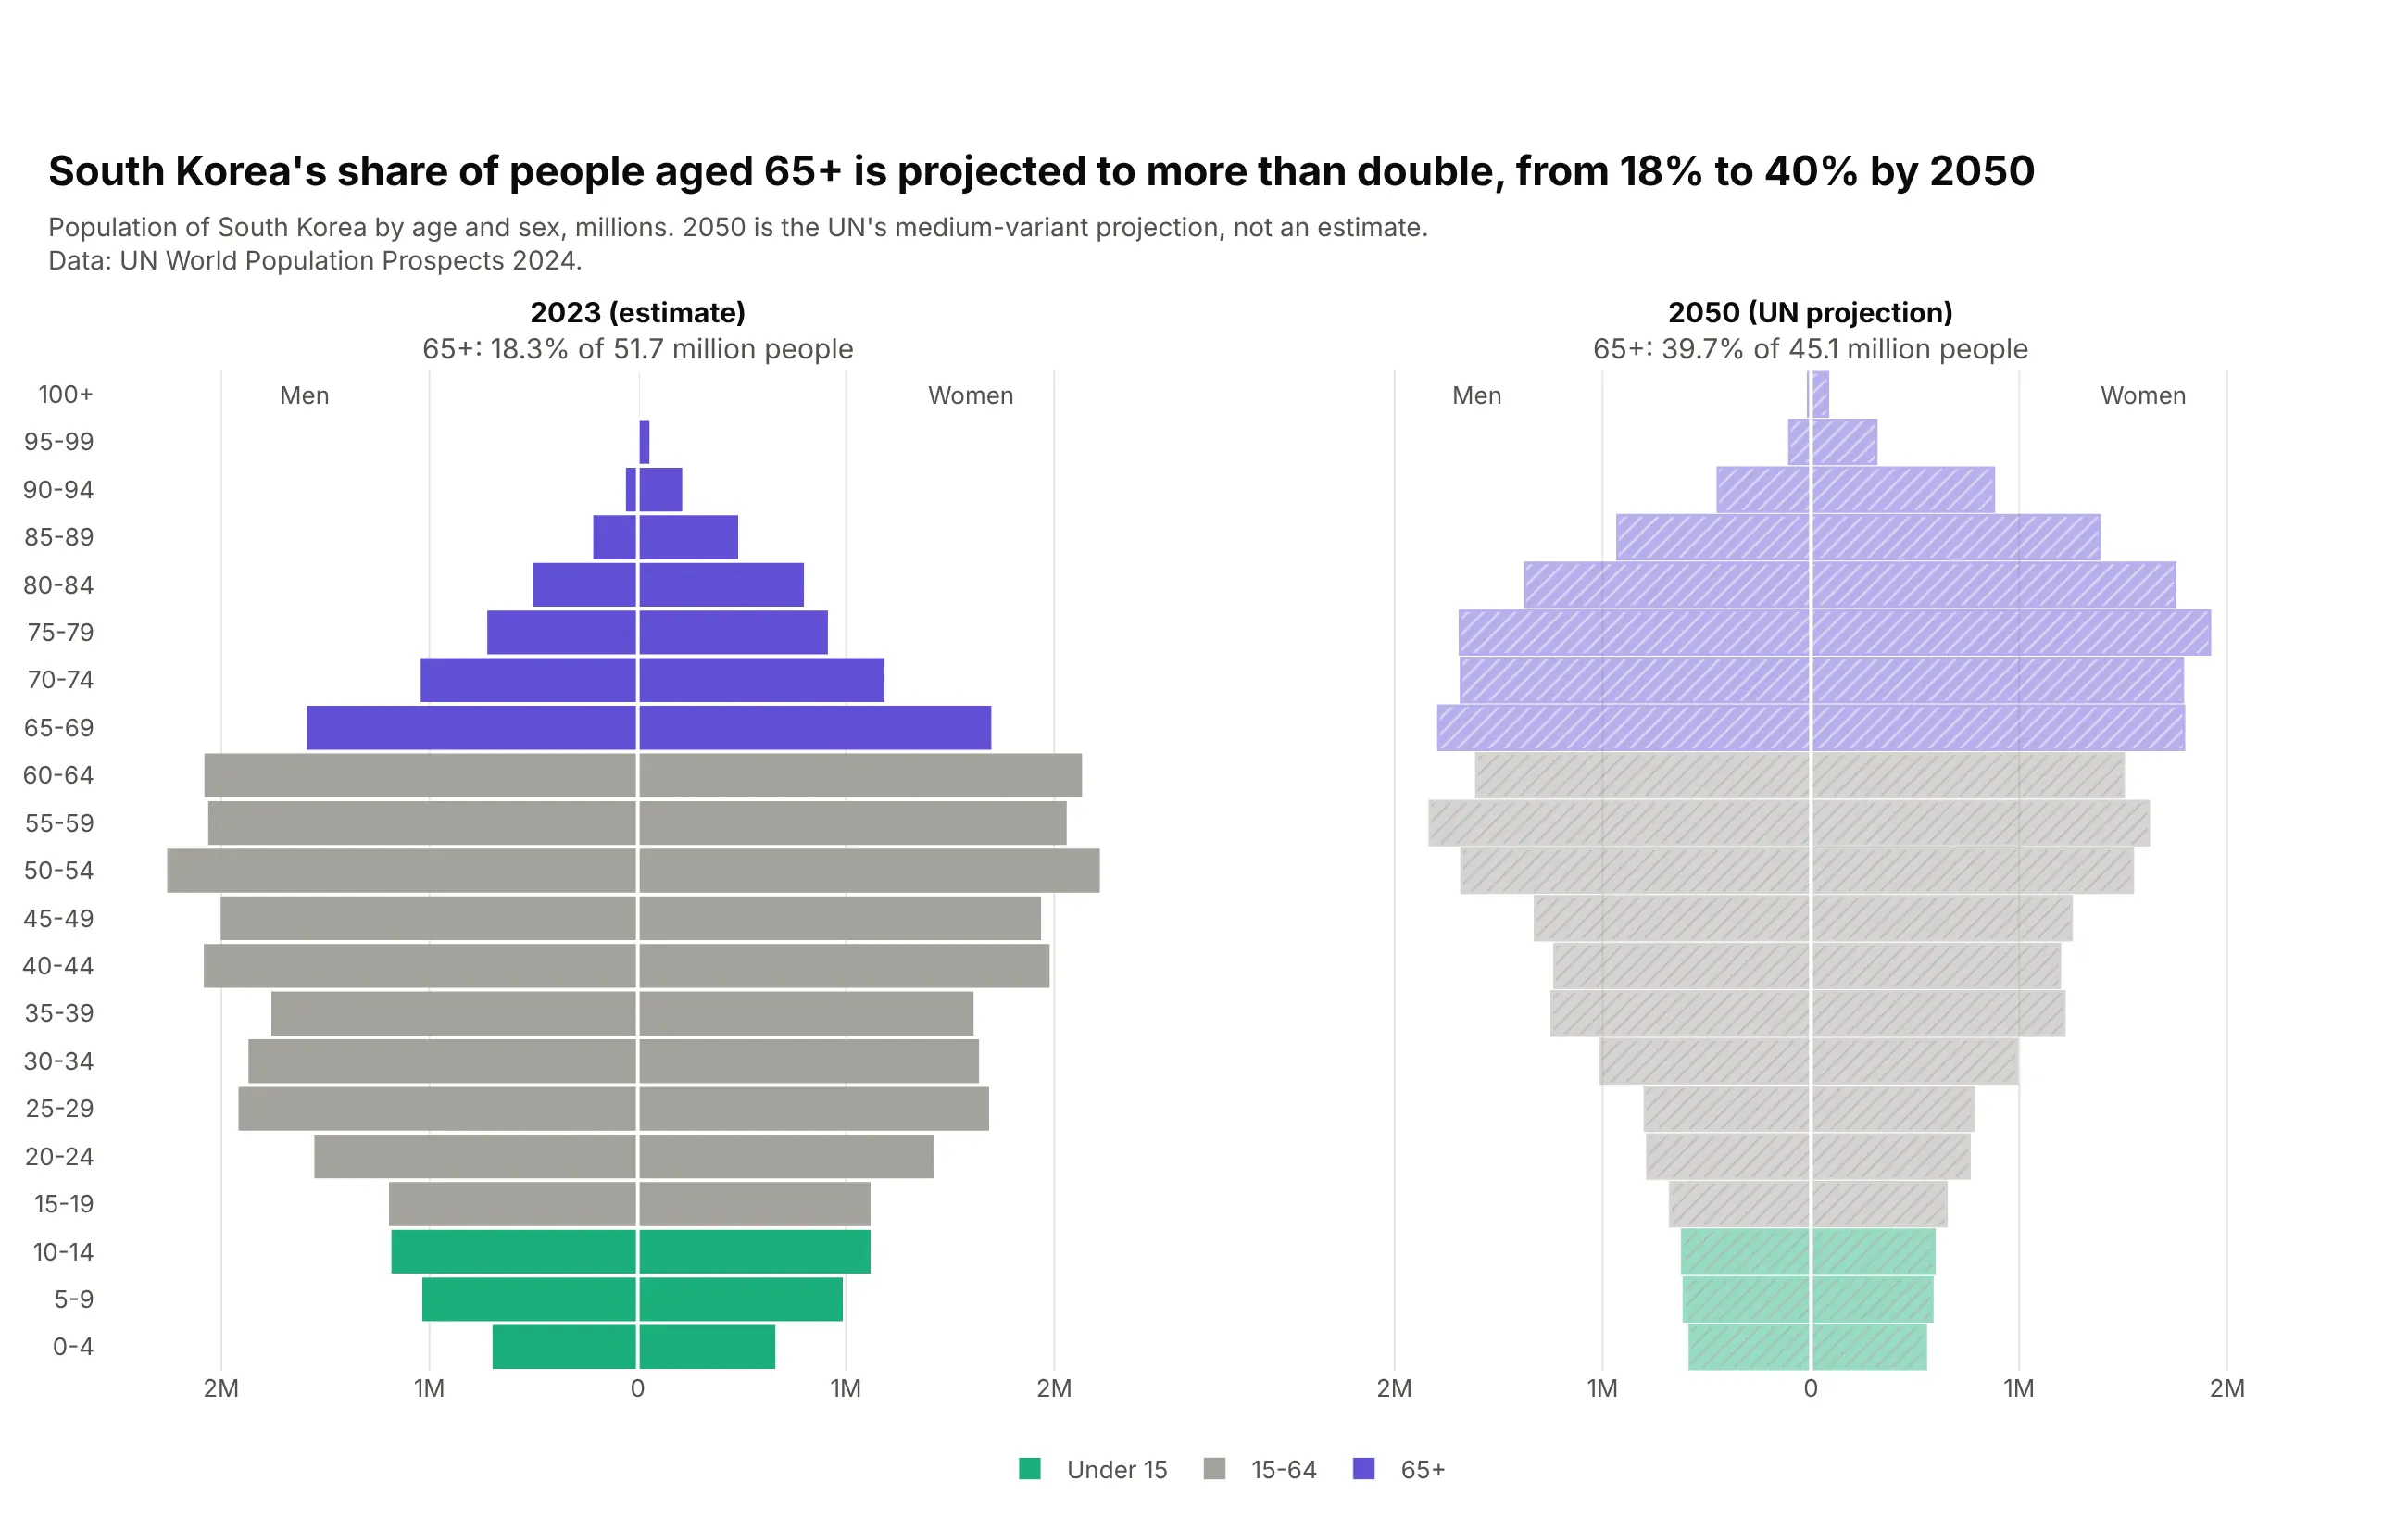
The UN projects South Korea's share aged 65+ to more than double, from 18.3% in 2023 to 39.7% in 2050, while the population falls from 51.7 million to 45.1 million. Coloring by life stage shows the working-age block shrinking. Data: UN World Population Prospects 2024 (2050 is the medium-variant projection).
Tip: give a projection its own panel, a hatched fill (marker.pattern.shape="/") and the word "projection" in its title.
Get the data from the UN World Population Prospects 2024 CSV "Population by 5-year age groupsand sex", location Republic of Korea, years 2023 and 2050 (medium variant)(columns: year, age_group, age, male, female, in thousands).Build two plotly population pyramids side by side, 2023 and 2050.- Color bars by life stage: under 15, 15-64, 65+.- Mark 2050 as a projection: lighter hatched fill and "(UN projection)" in its title.- Panel titles with the share aged 65+ and the total.
3. Russia's missing men
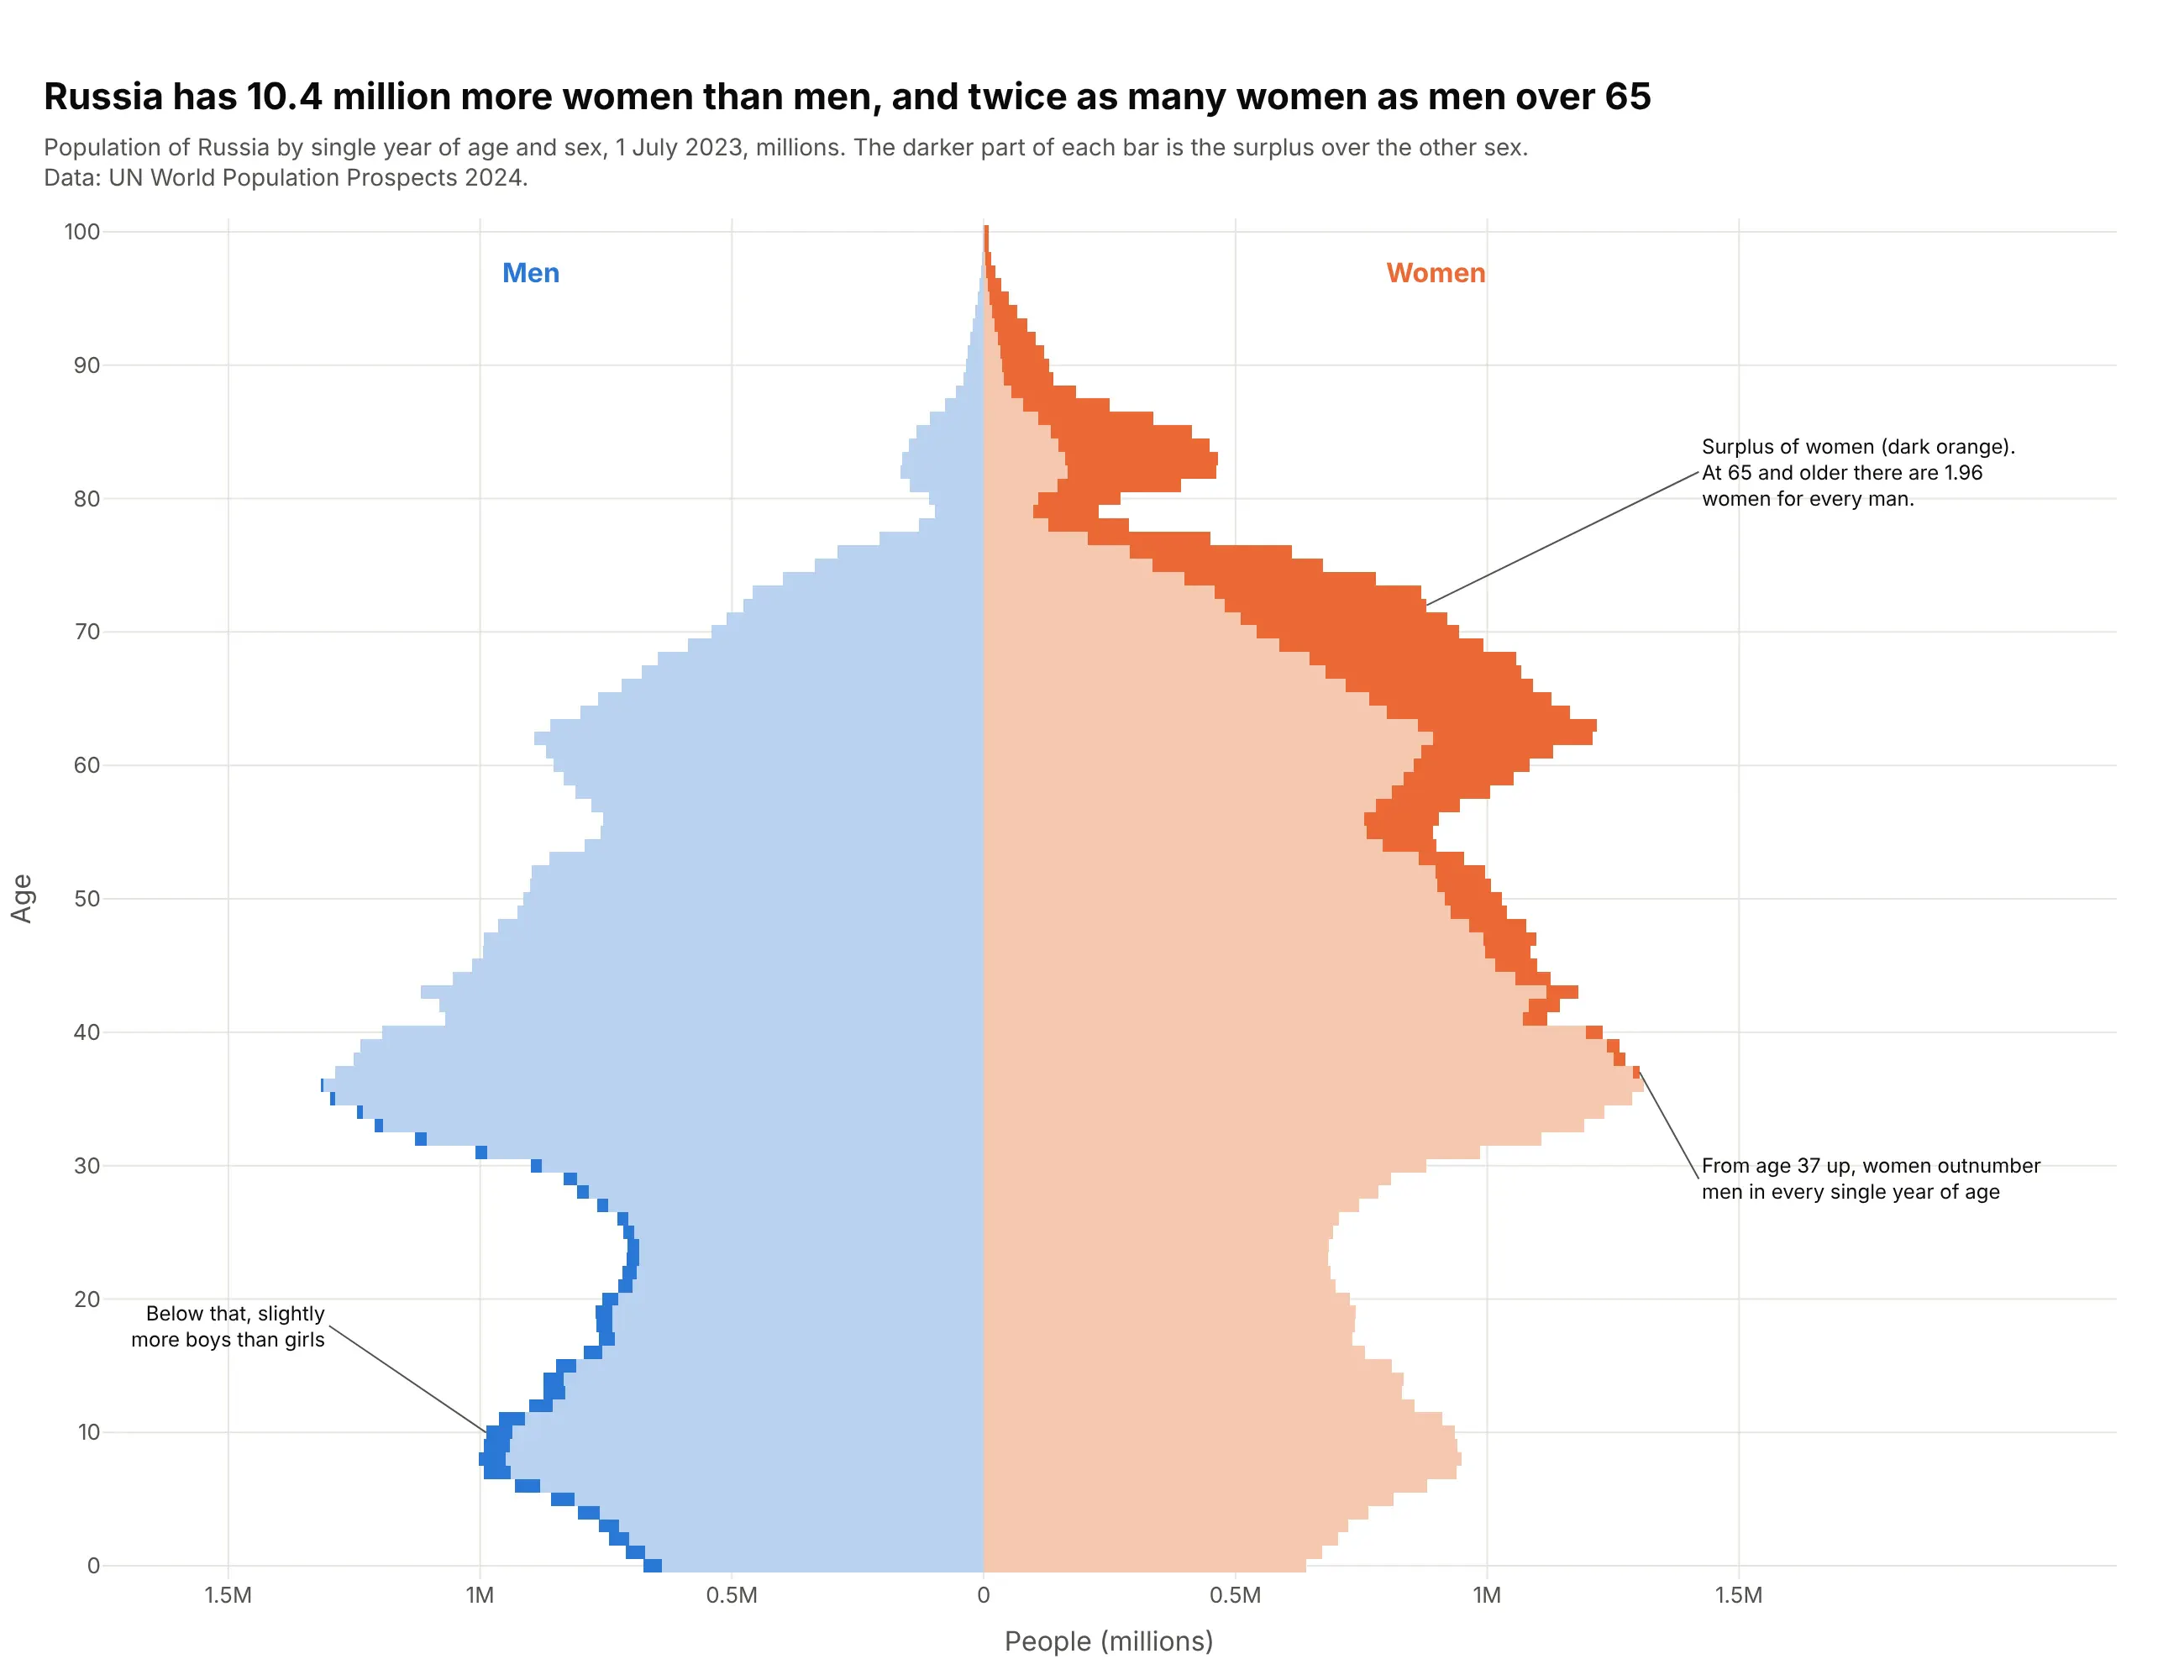
Russia has 10.4 million more women than men. Splitting each bar into the matched part and the surplus shows where they are: from age 37 up women outnumber men at every age, and at 65 and older there are 1.96 women per man. Data: UN World Population Prospects 2024.
Tip: stack a light "matched" trace and a dark "surplus" trace on each side so the gap becomes its own shape.
Get the data from the UN World Population Prospects 2024 CSV "Population by single age and sex"(1950-2023), location Russian Federation, year 2023 (columns: age, male, female, in thousands).Build a plotly population pyramid with four traces: min(male, female) in a light tint on eachside, and the surplus (male - min, female - min) in full color stacked outside it.- Annotate the first age with more women than men and the ratio at 65+.
4. Four countries, four shapes
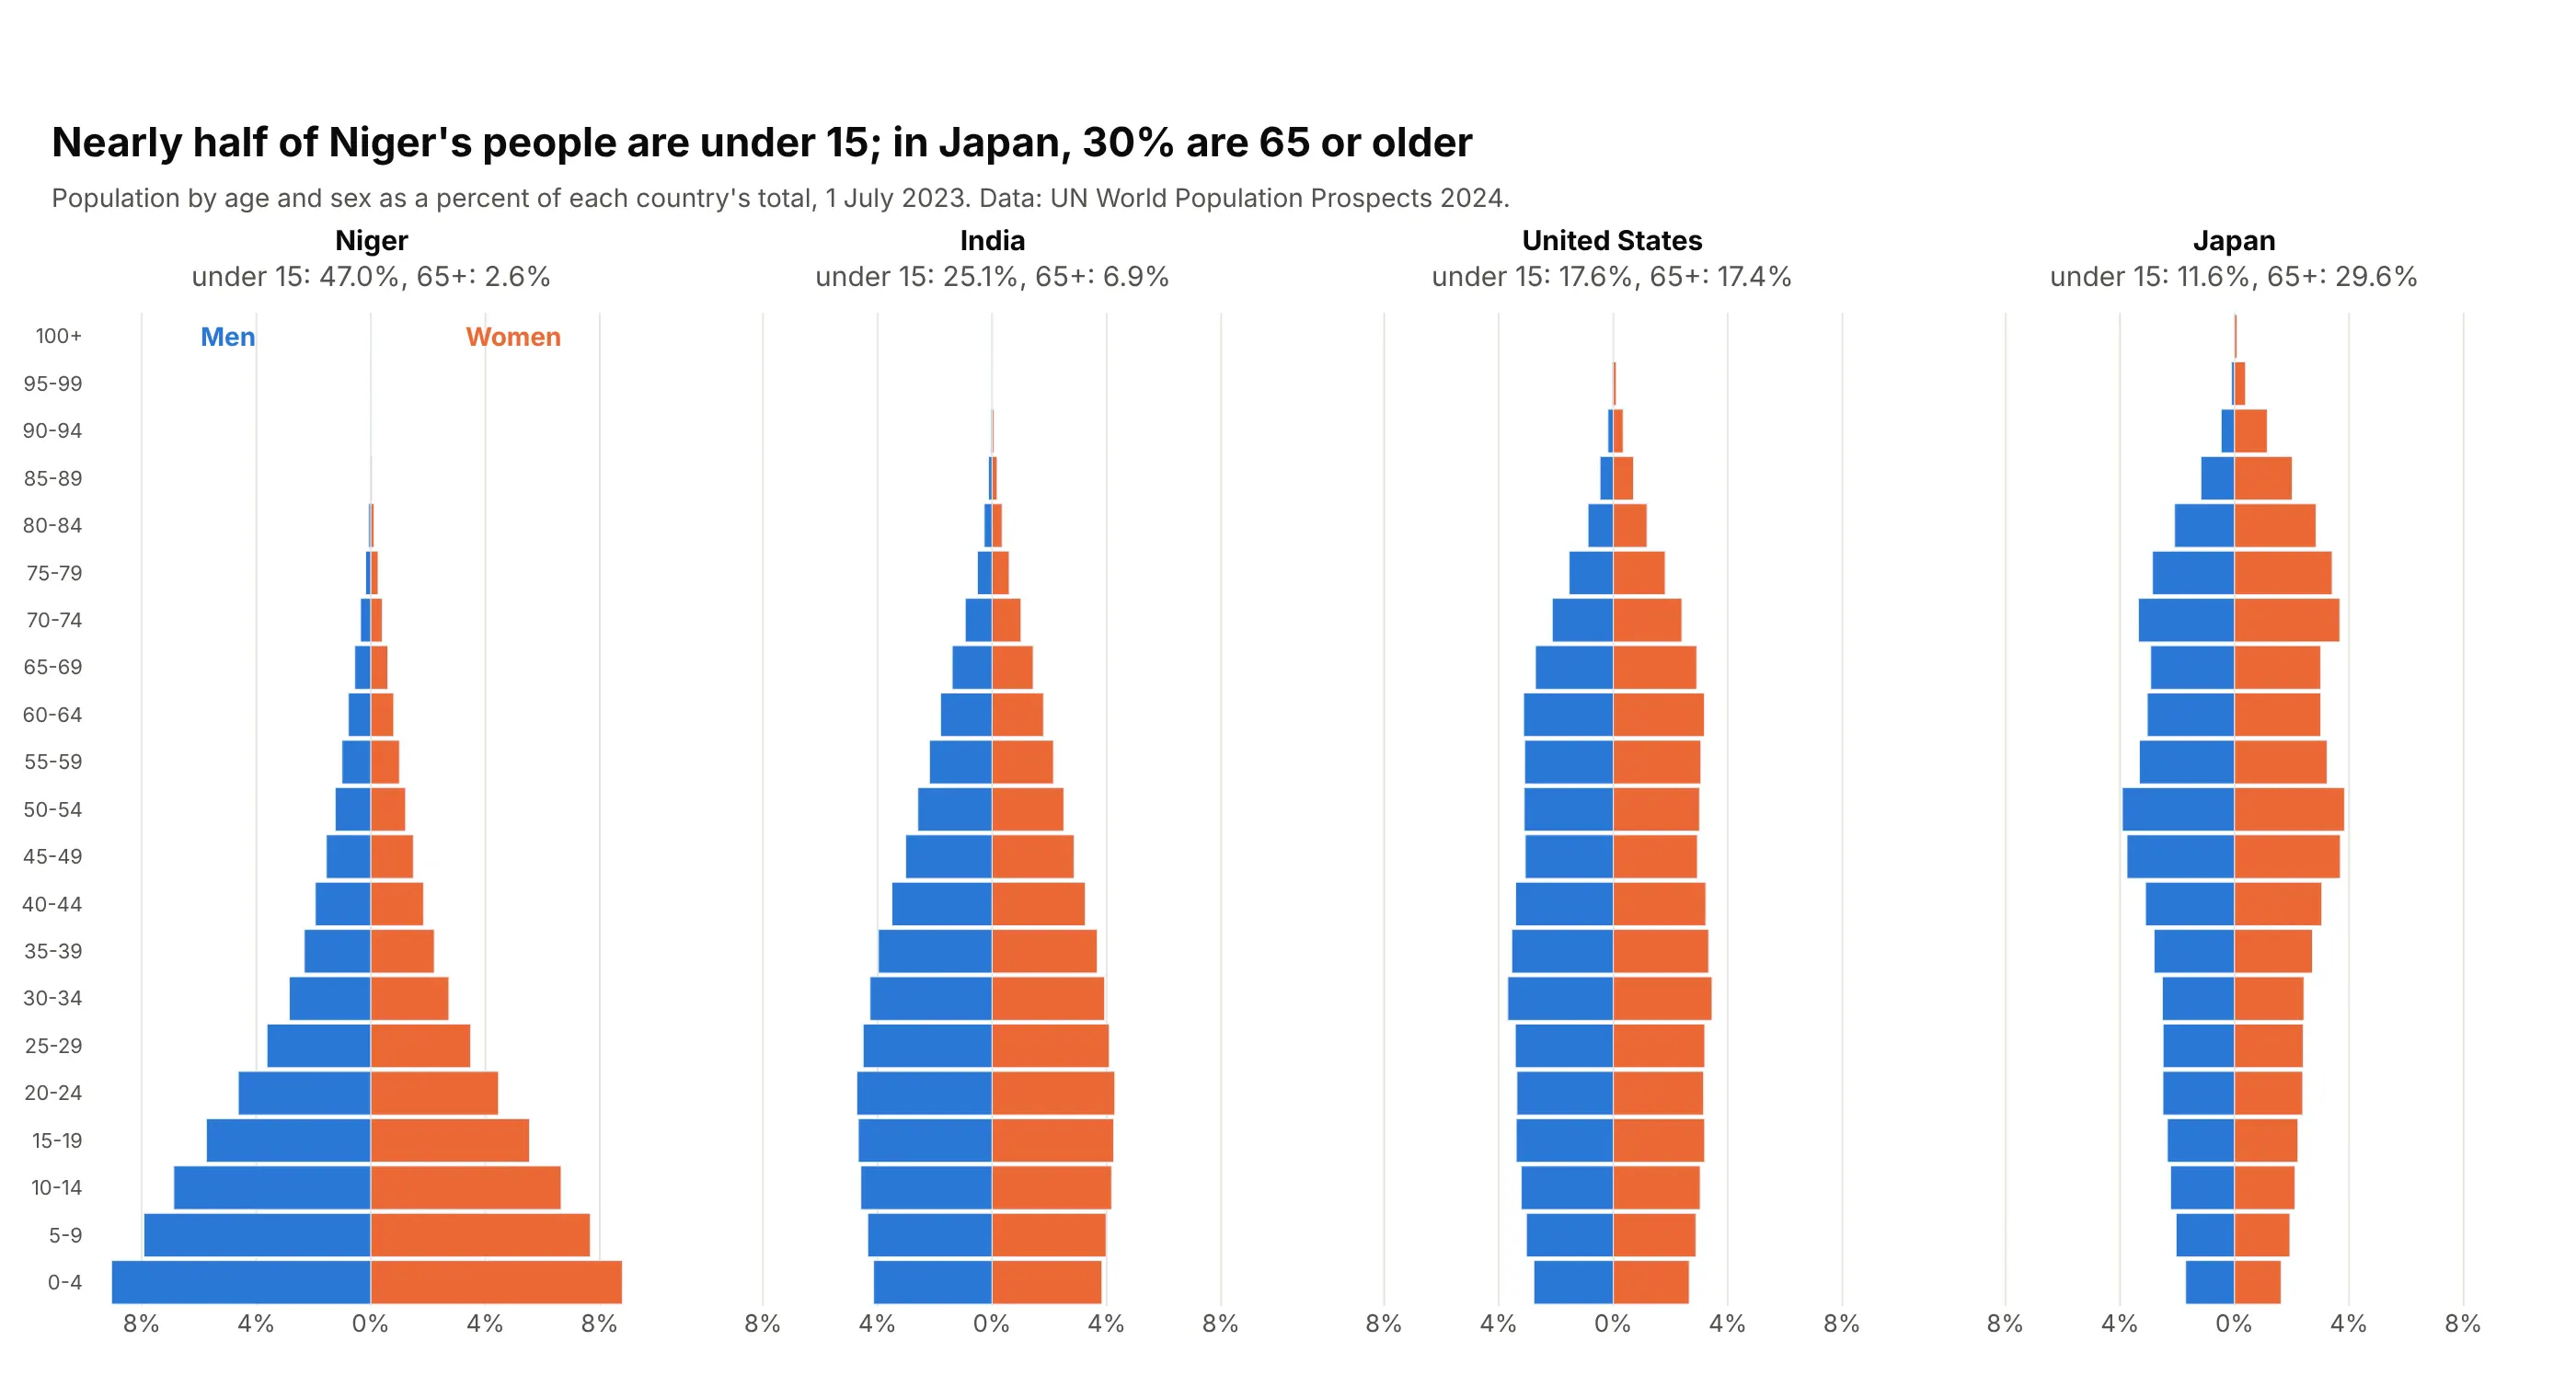
These are the four textbook shapes: expansive Niger (47.0% under 15), early-transition India, stationary United States and constrictive Japan (29.6% aged 65+). Percent of each total puts Niger's 26 million people and India's 1.4 billion on one scale. Data: UN World Population Prospects 2024.
Tip: use make_subplots(shared_yaxes=True) and one shared percent axis so the shapes compare.
Get the data from the UN World Population Prospects 2024 CSV "Population by 5-year age groupsand sex", year 2023, for Niger, India, United States of America and Japan(columns: location, age_group, age, male, female; add male_pct and female_pct as percentof each country's total).Build four plotly population pyramids side by side with make_subplots(cols=4, shared_yaxes=True).- Same x range on every panel, in percent, no minus signs.- Panel titles with the share under 15 and 65+.
5. The US pyramid colored by generation
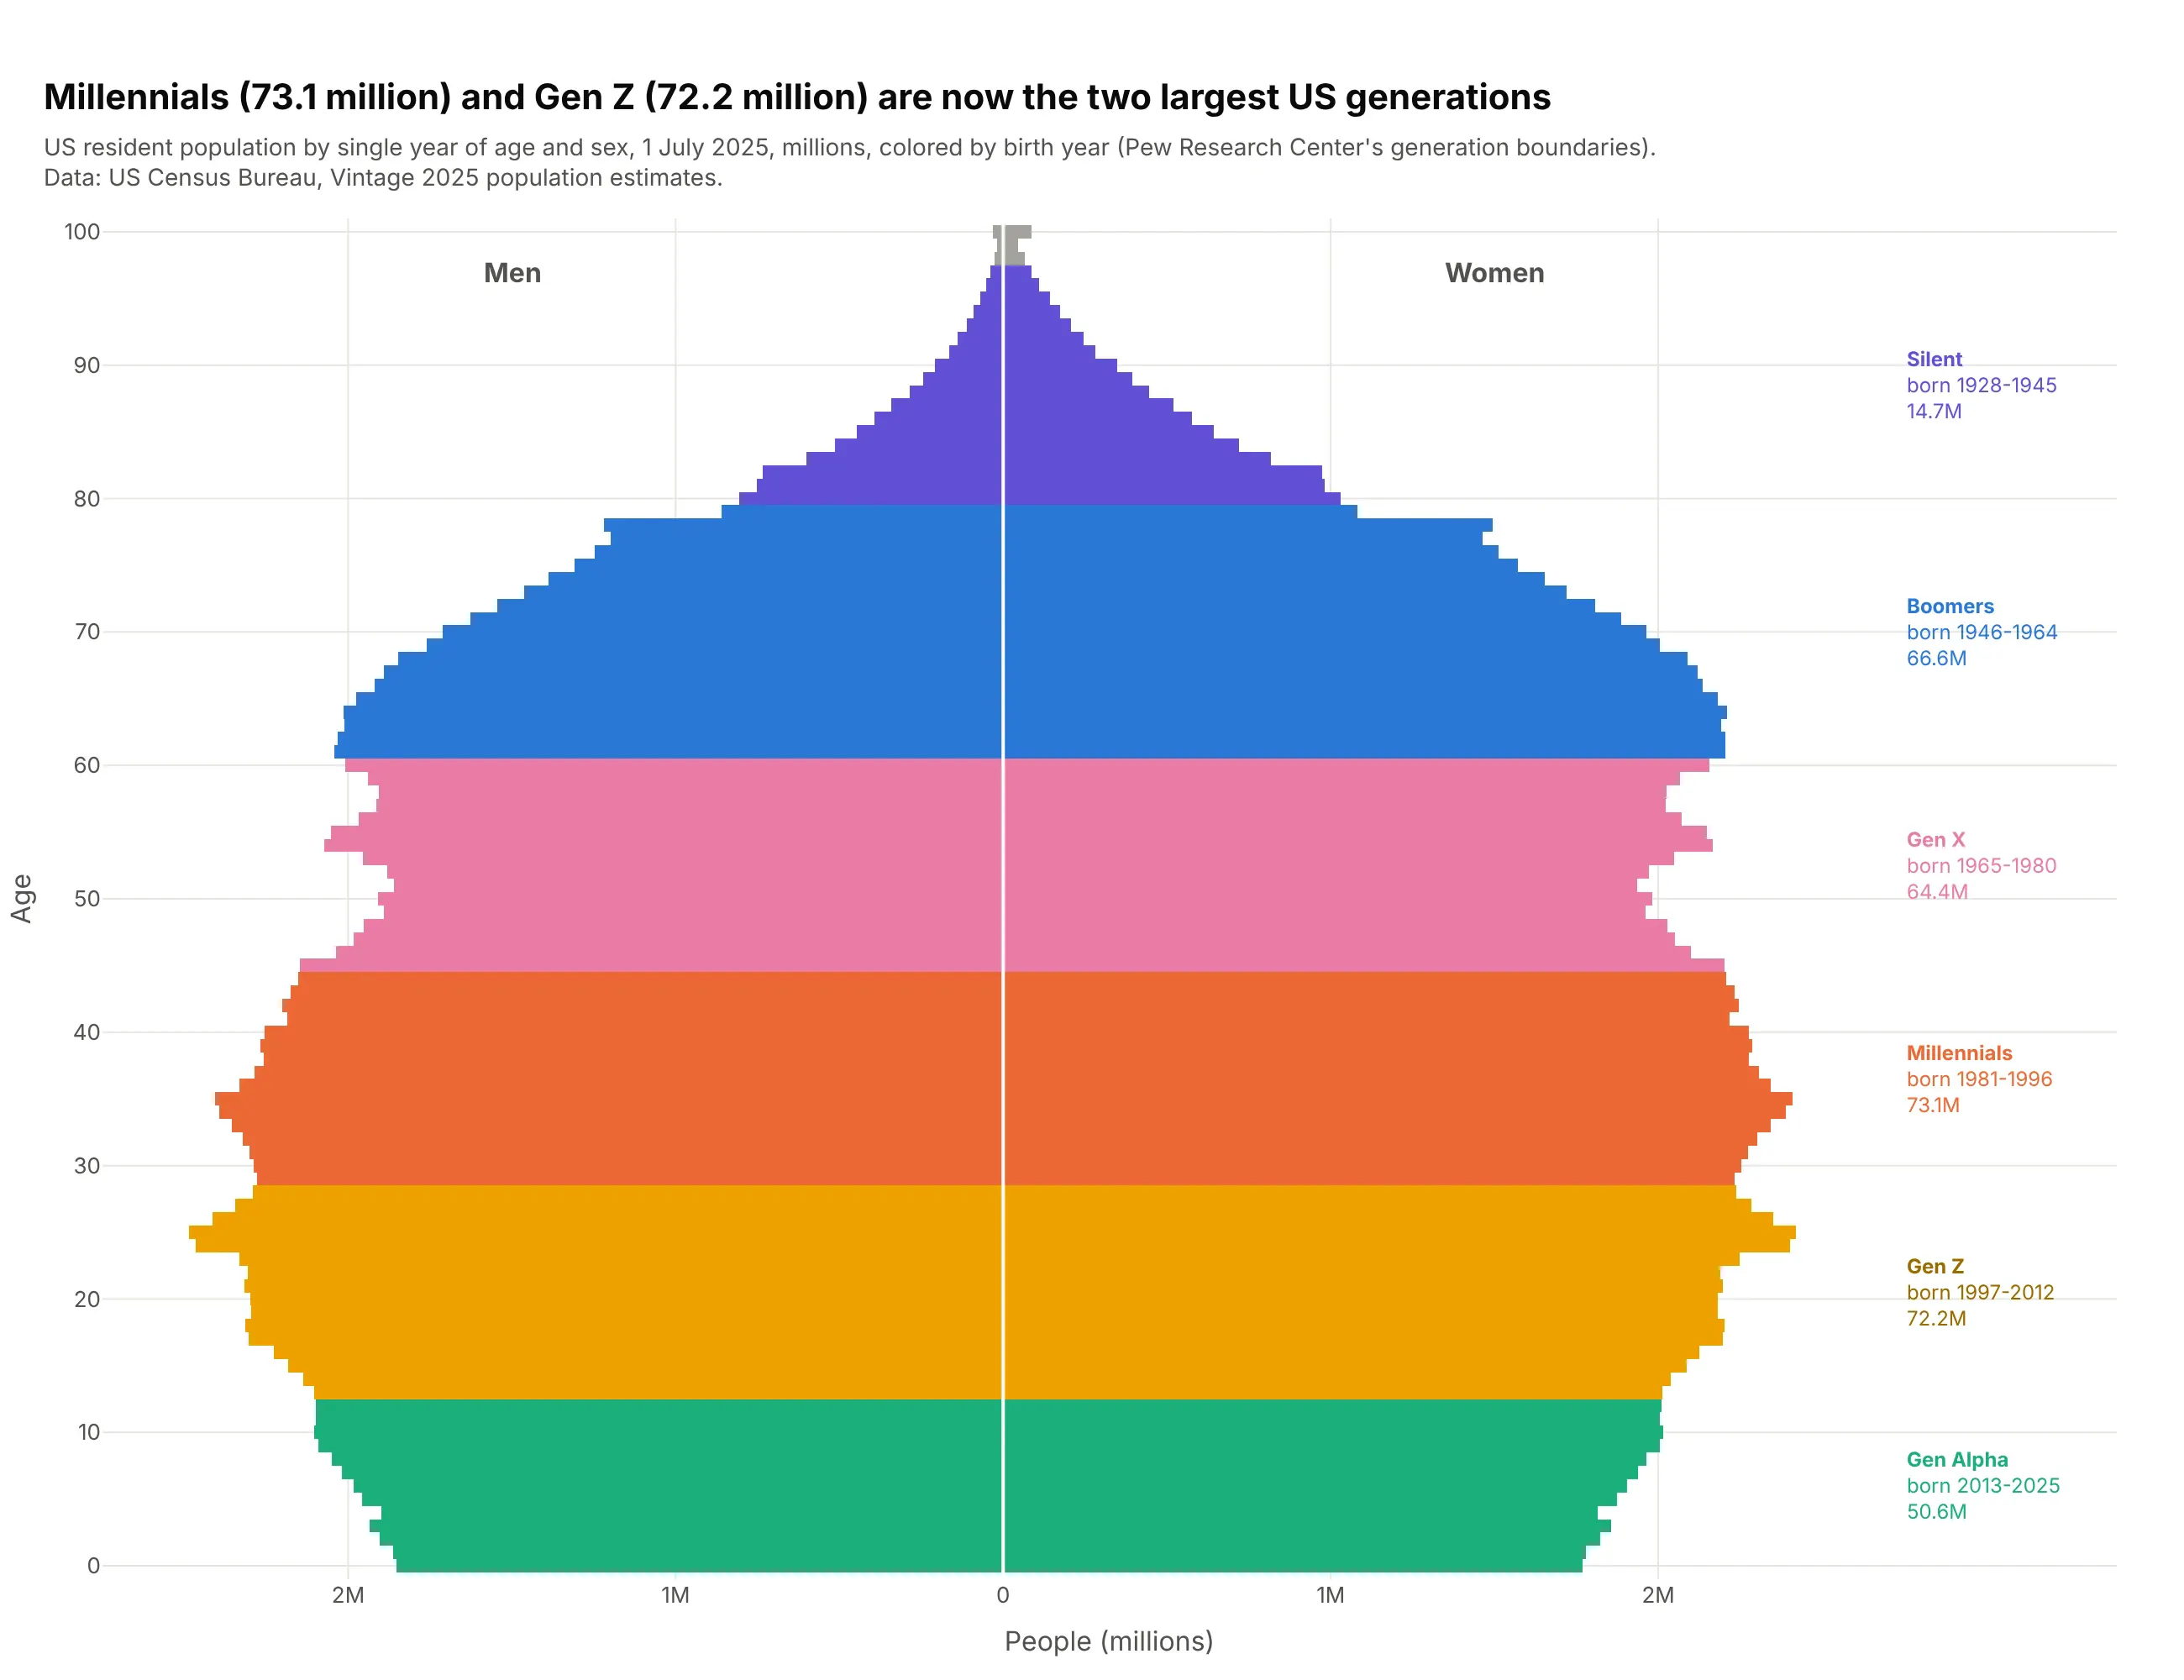
Coloring single years by birth cohort turns the pyramid into a map of generations. In 2025 Millennials (73.1 million) and Gen Z (72.2 million) are the largest, ahead of Boomers (66.6 million). Data: US Census Bureau, Vintage 2025 population estimates.
Tip: color by a category instead of by sex, and separate the sides with fig.add_vline(x=0, line_color="white").
Get the data from the US Census Bureau Vintage 2025 national population estimates,file nc-est2025-agesex-res.csv (single year of age by sex, POPESTIMATE2025)(columns: age, birth_year = 2025 - age, generation from Pew's birth-year boundaries, male, female).Build a plotly population pyramid by single year of age, one color per generation on both sides.- Label each generation on the right with its birth years and total.
6. New cancer cases by age, sex and site
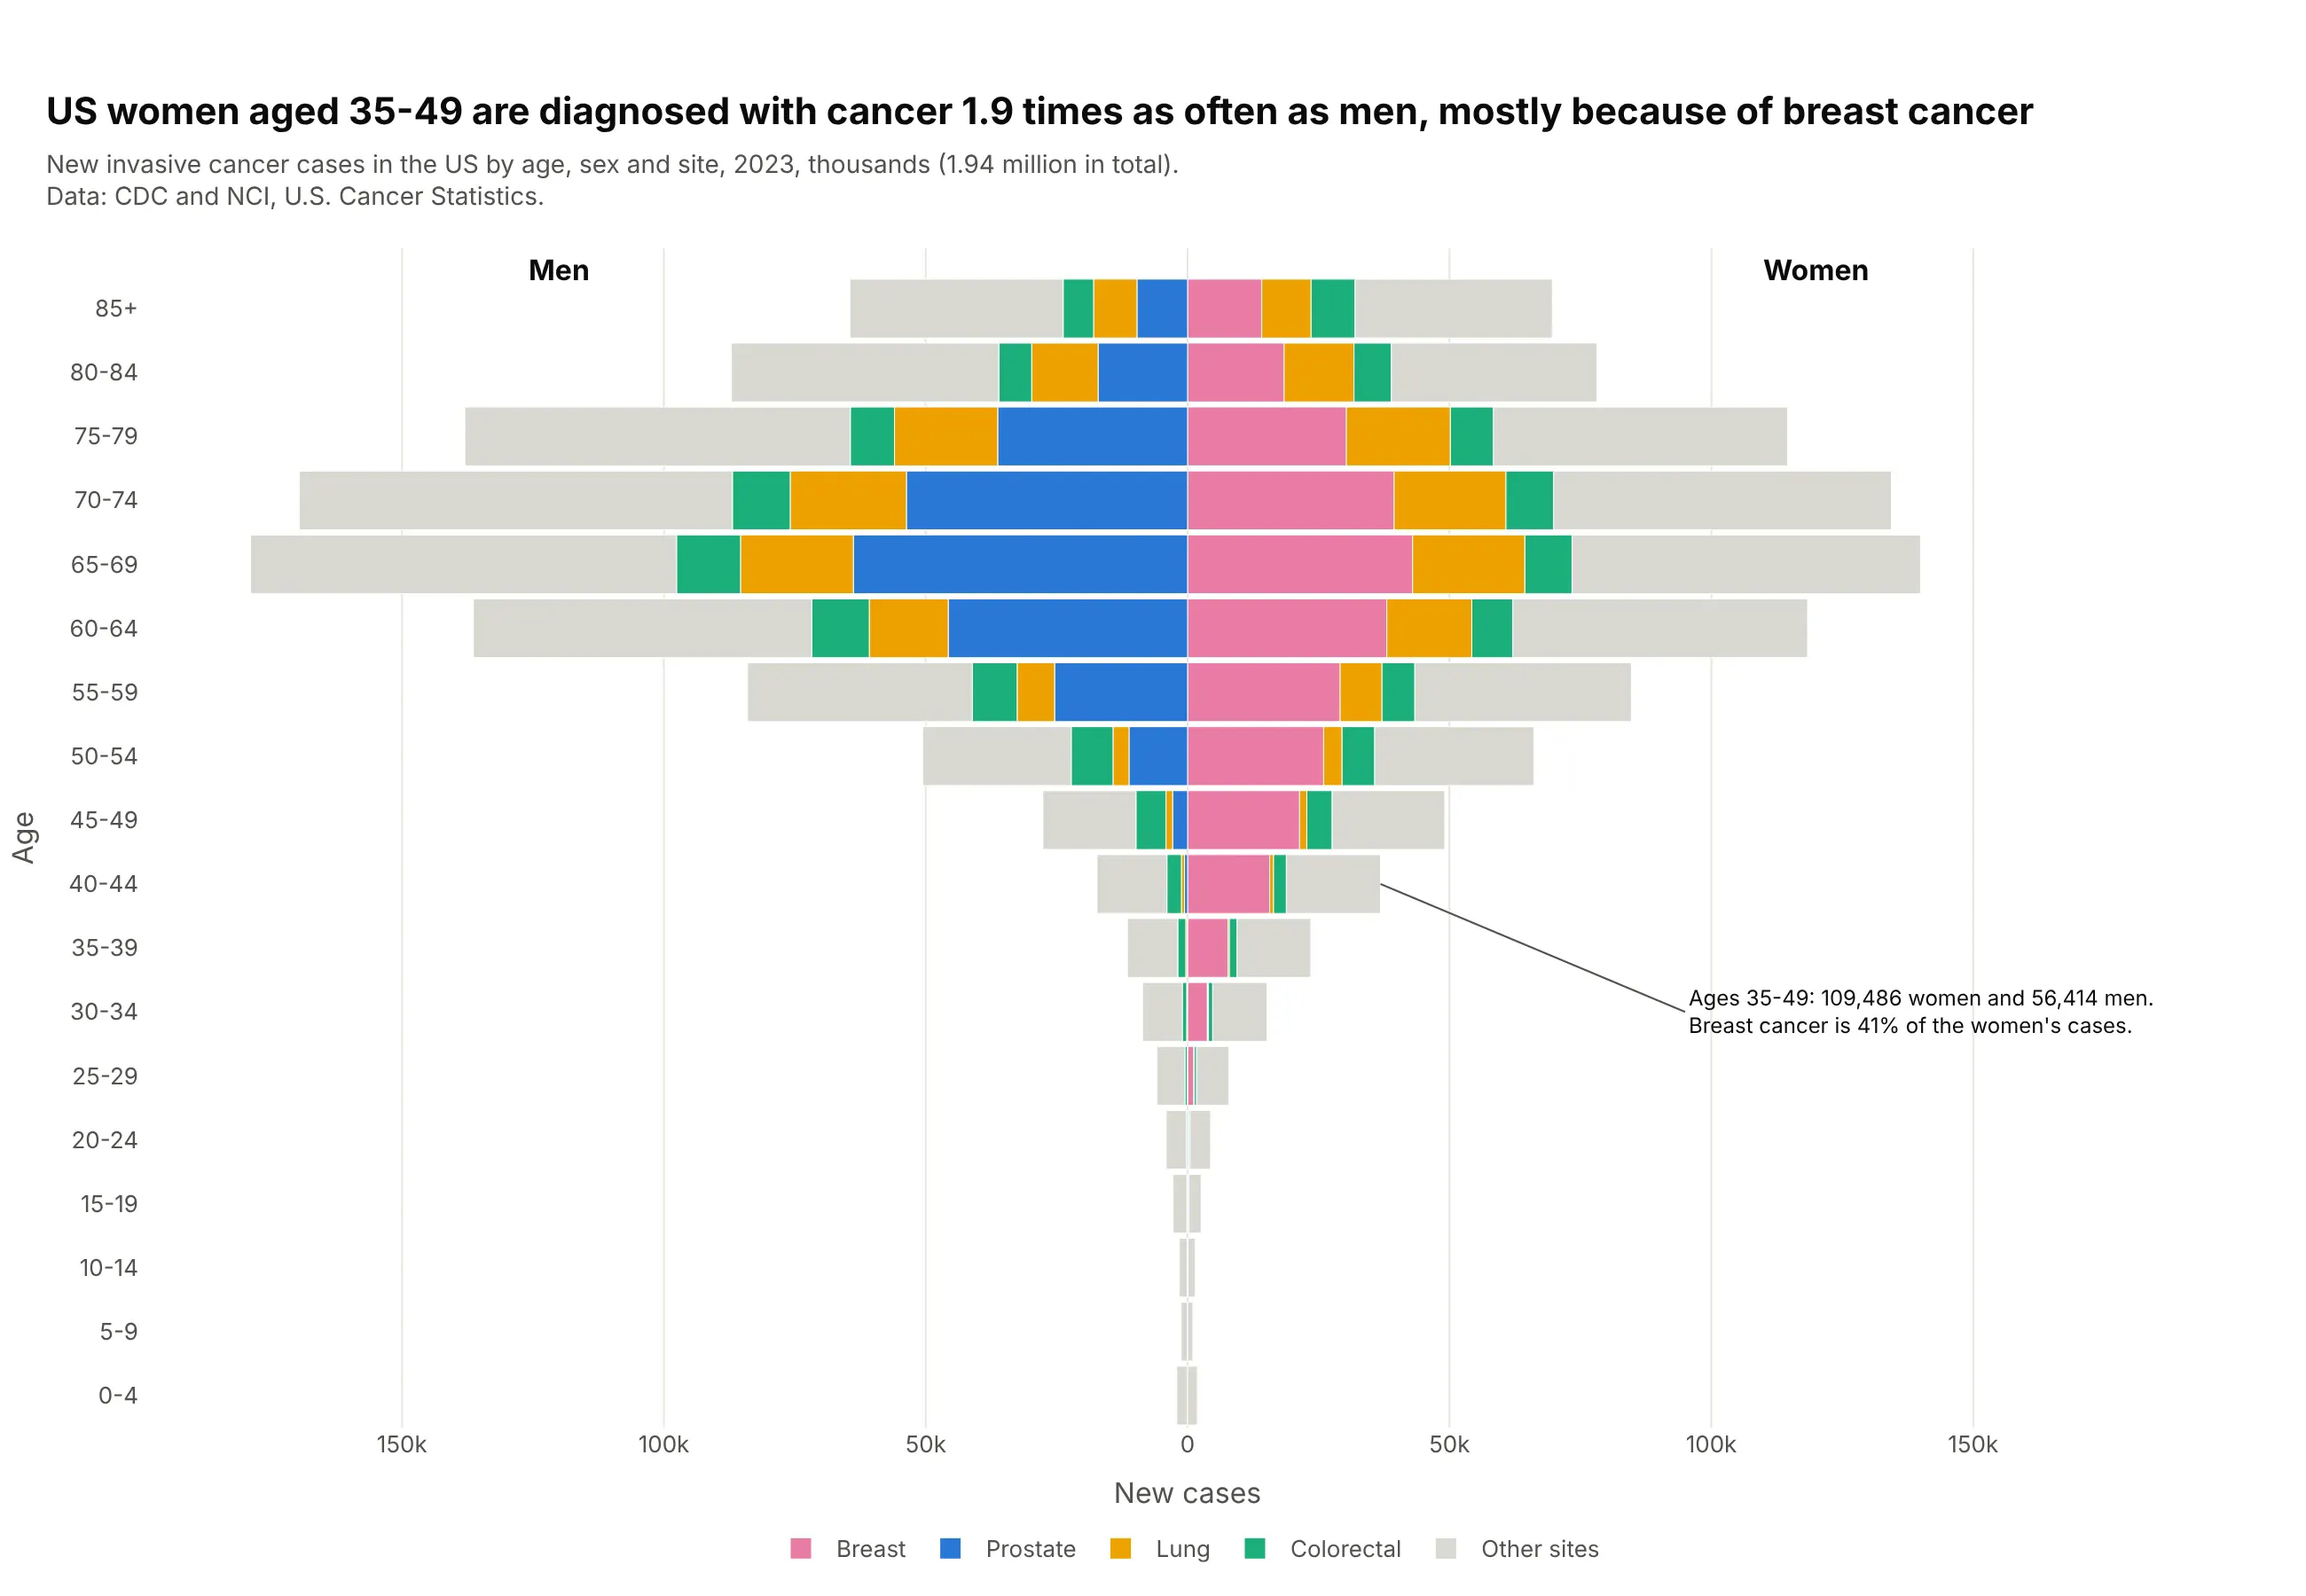
US women aged 35-49 are diagnosed with cancer 1.9 times as often as men of the same age, and breast cancer is 41% of their cases. Prostate cancer drives the men's side from the 50s. Stacking sites inside each bar shows why the shape is what it is. Data: CDC and NCI, U.S. Cancer Statistics, 2023.
Tip: put the sex-specific sites next to the axis and "other" in light gray on the outside.
Get the data from CDC and NCI U.S. Cancer Statistics public use data (USCS-1999-2023-ASCII.zip,BYAGE.TXT): incidence, All Races, 2023, by age group and sex for breast, prostate, lung and bronchus,colon and rectum, and all sites (columns: age_group, age, sex, site, cases).Build a stacked plotly population pyramid: one trace per site and side, barmode="relative","Other sites" = all sites minus the four.- Annotate the 35-49 totals for women and men.
7. Semaglutide adverse event reports against the population
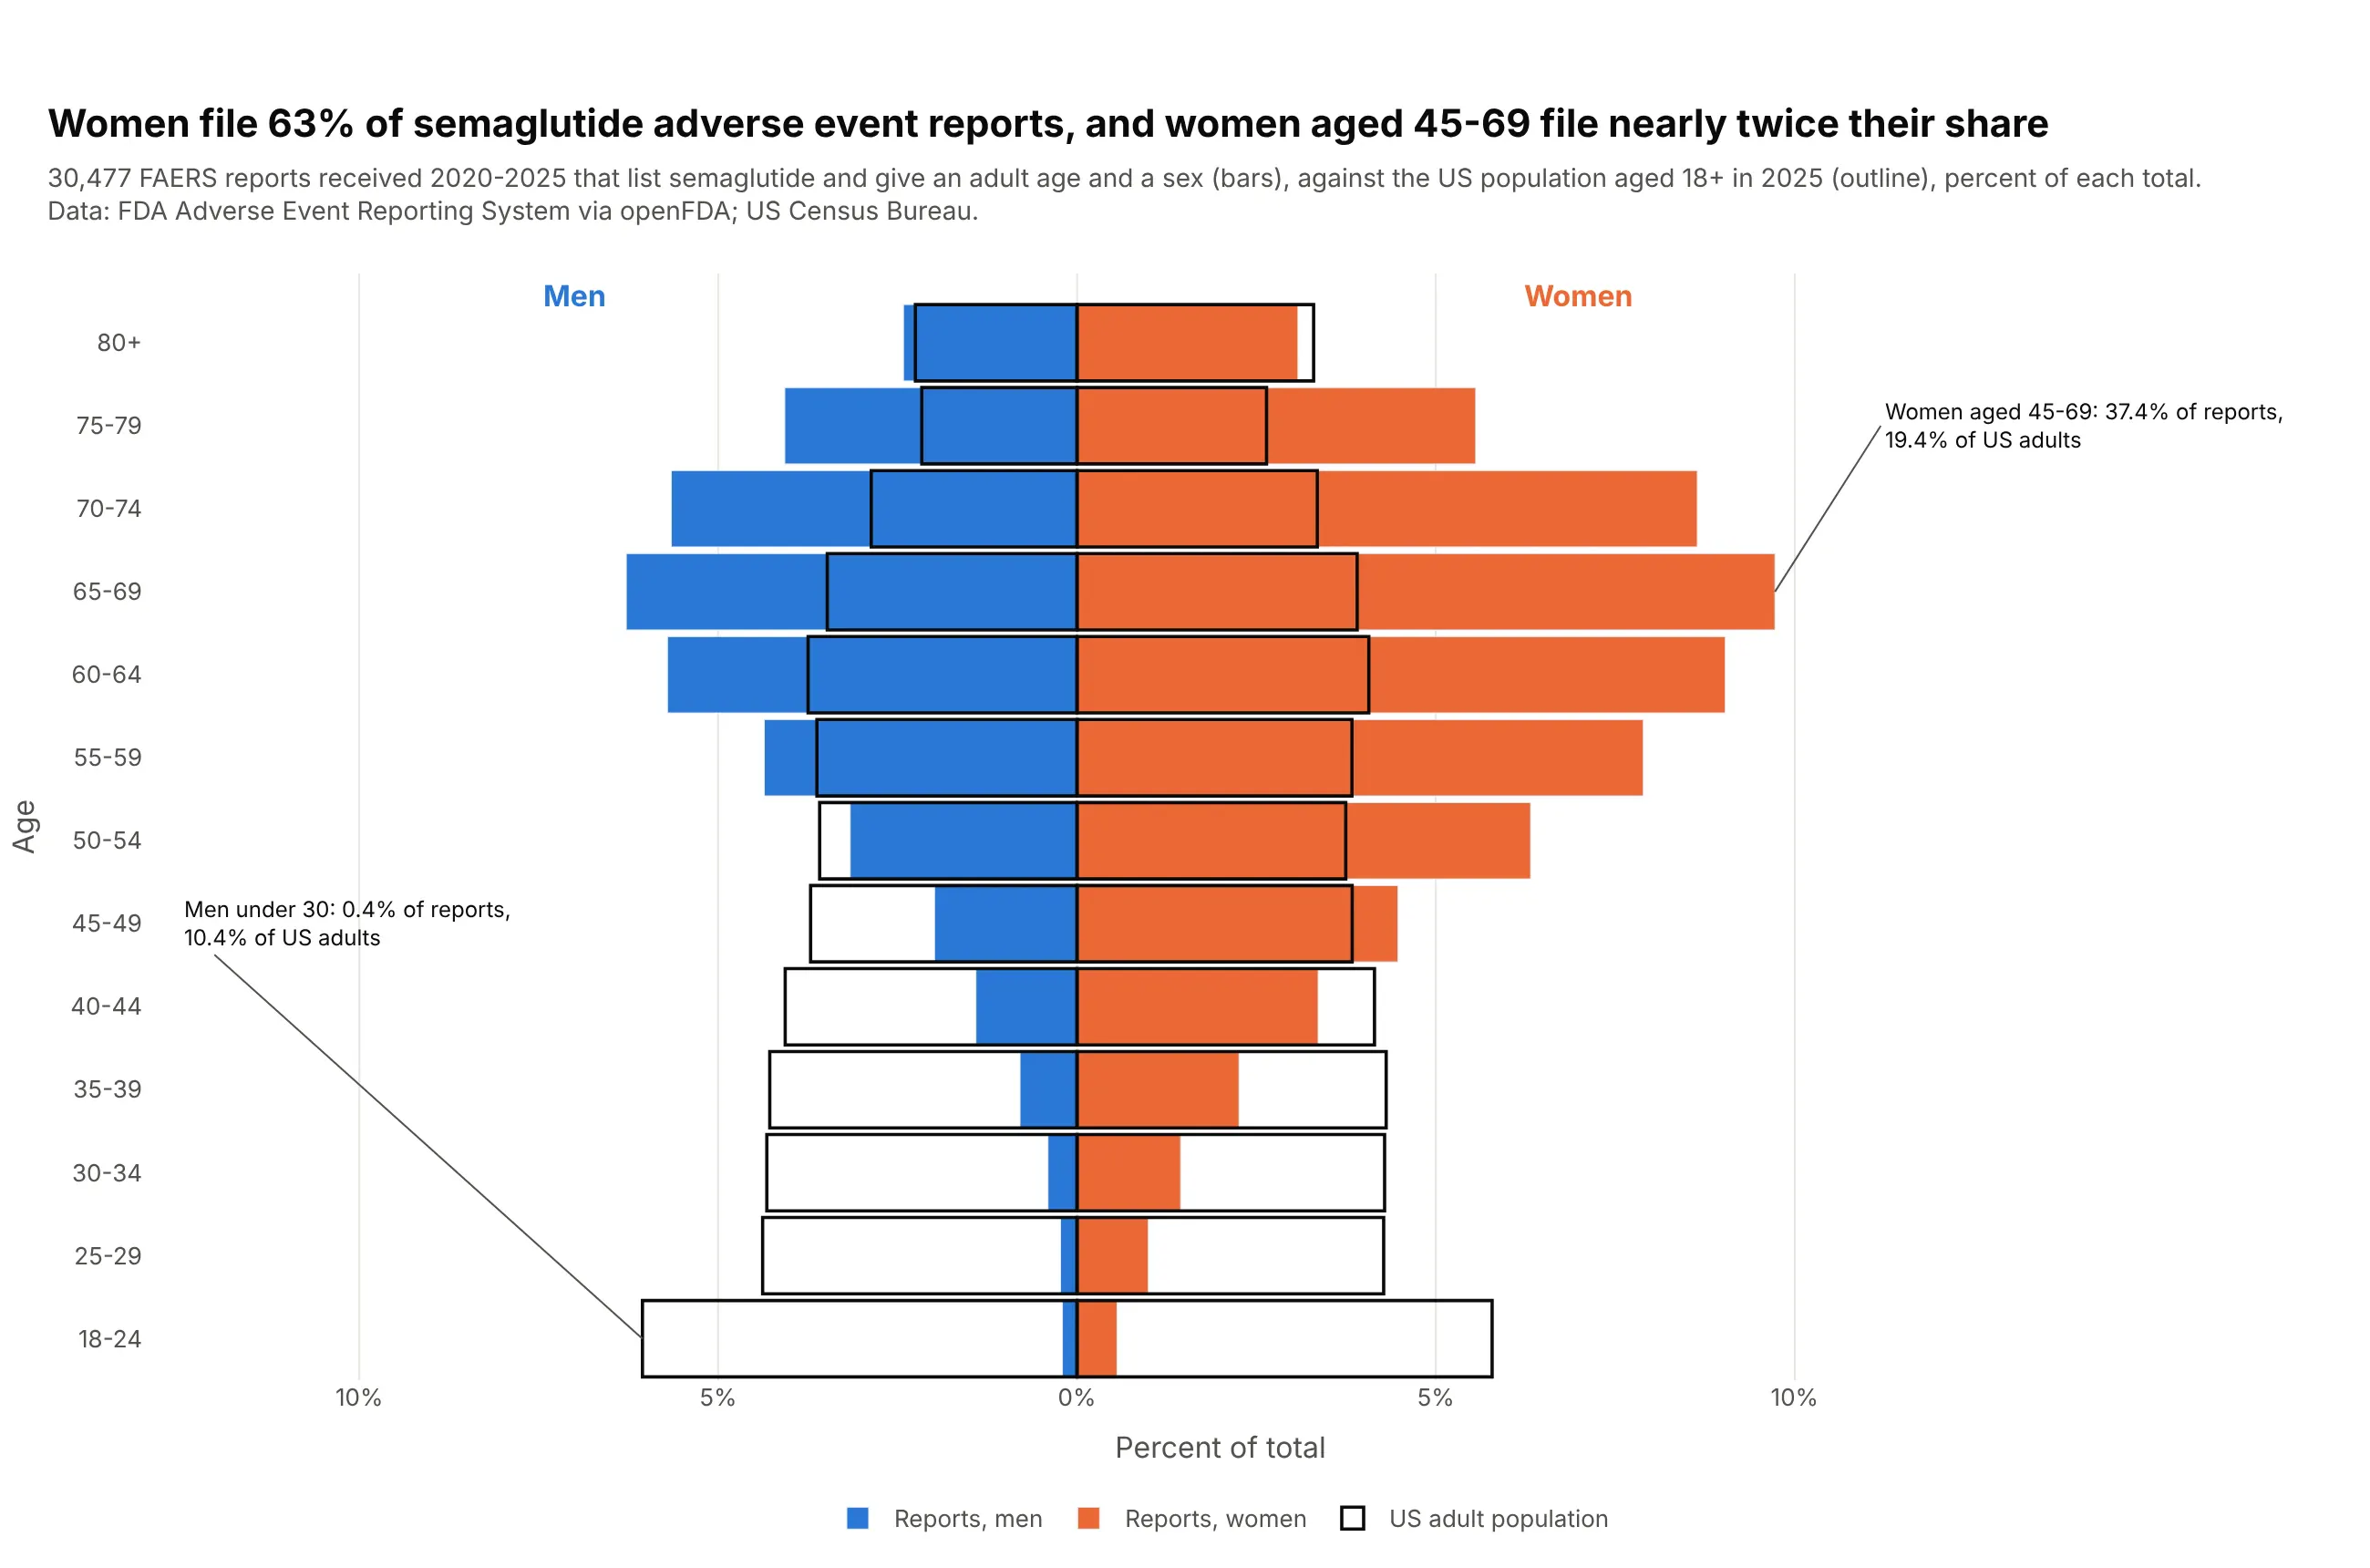
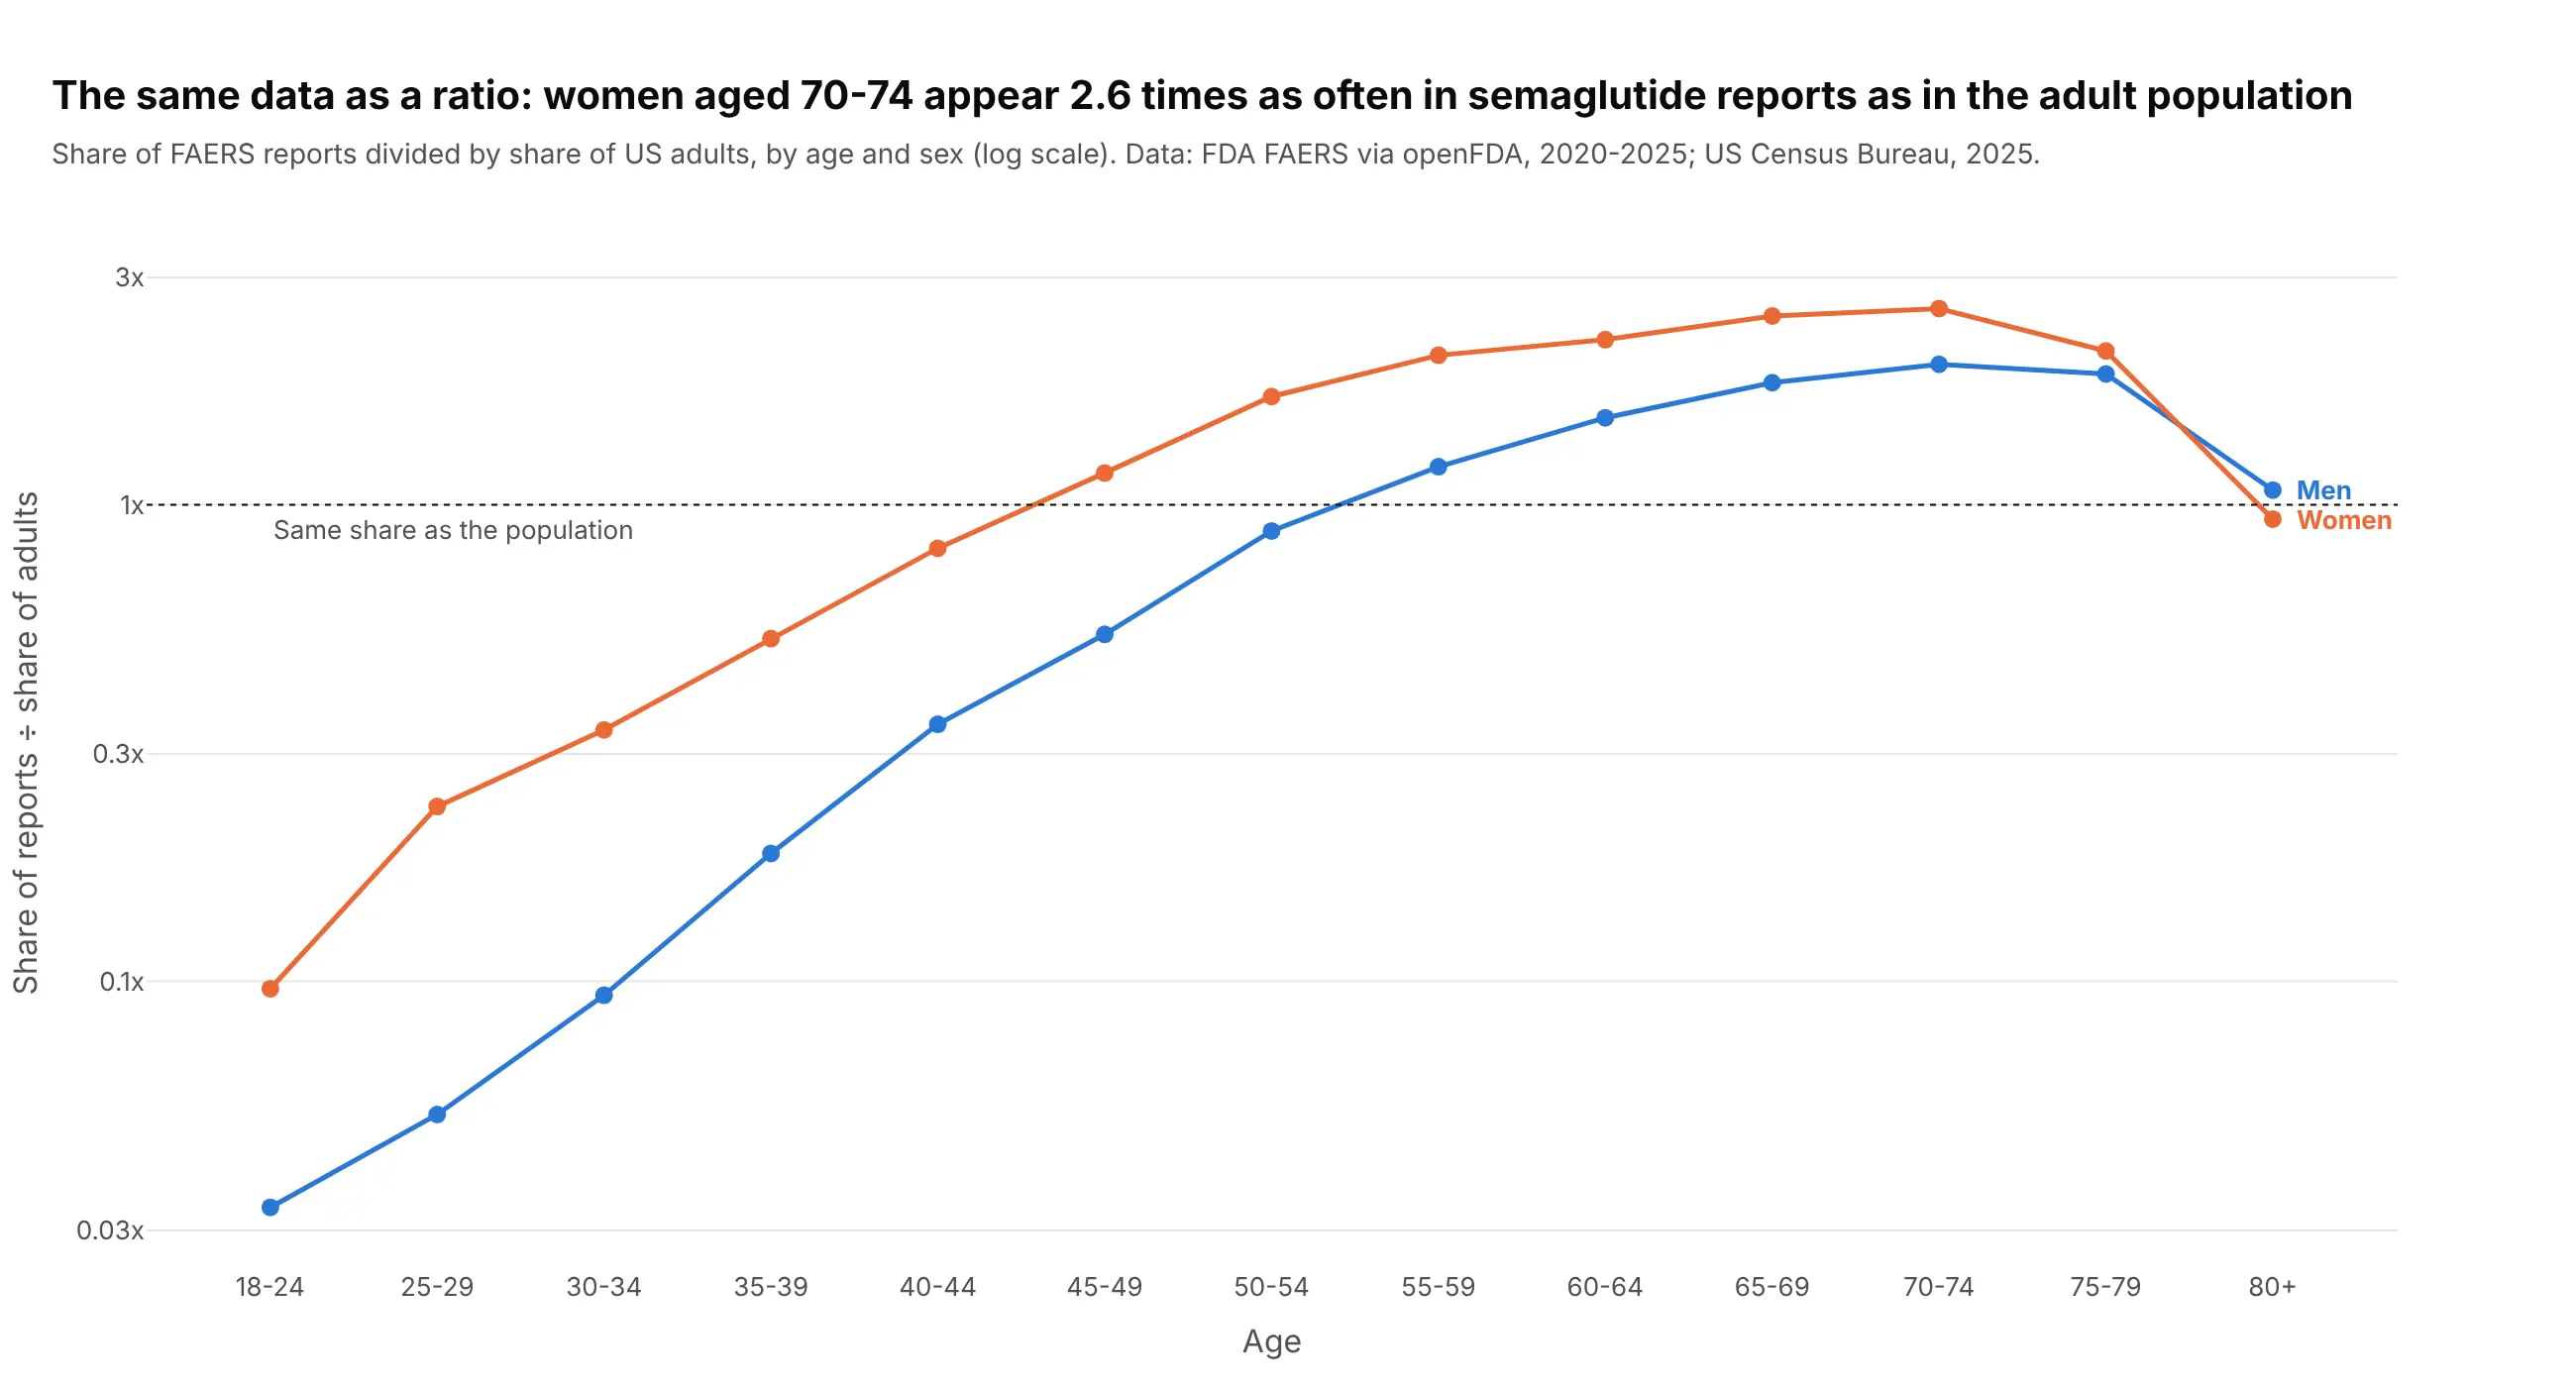
Comparing a sample with the population it comes from is everyday work in pharma. Women file 63% of the 30,477 semaglutide adverse event reports with an age and sex, and women aged 45-69 make up 37.4% of reports against 19.4% of US adults. Data: FDA FAERS via openFDA (2020-2025); US Census Bureau.
Tip: draw the reference population as empty bars with a black edge and barmode="overlay".
Get the data from the FDA Adverse Event Reporting System through the openFDA drug event API:reports received 2020-2025 listing semaglutide, counted by patient.patientonsetage (years) foreach patientsex; and the US Census Bureau Vintage 2025 national estimates for ages 18+(columns: age_group, male_reports, female_reports, male_pop, female_pop, each also as percent of its total).Build a plotly population pyramid in percent: reports as filled bars, the population astransparent bars with a black outline, barmode="overlay".
Another way to see it: dividing each group's share of reports by its share of adults gives one number per group, 2.6 for women aged 70-74.
8. COVID-19 death rates on mirrored log axes
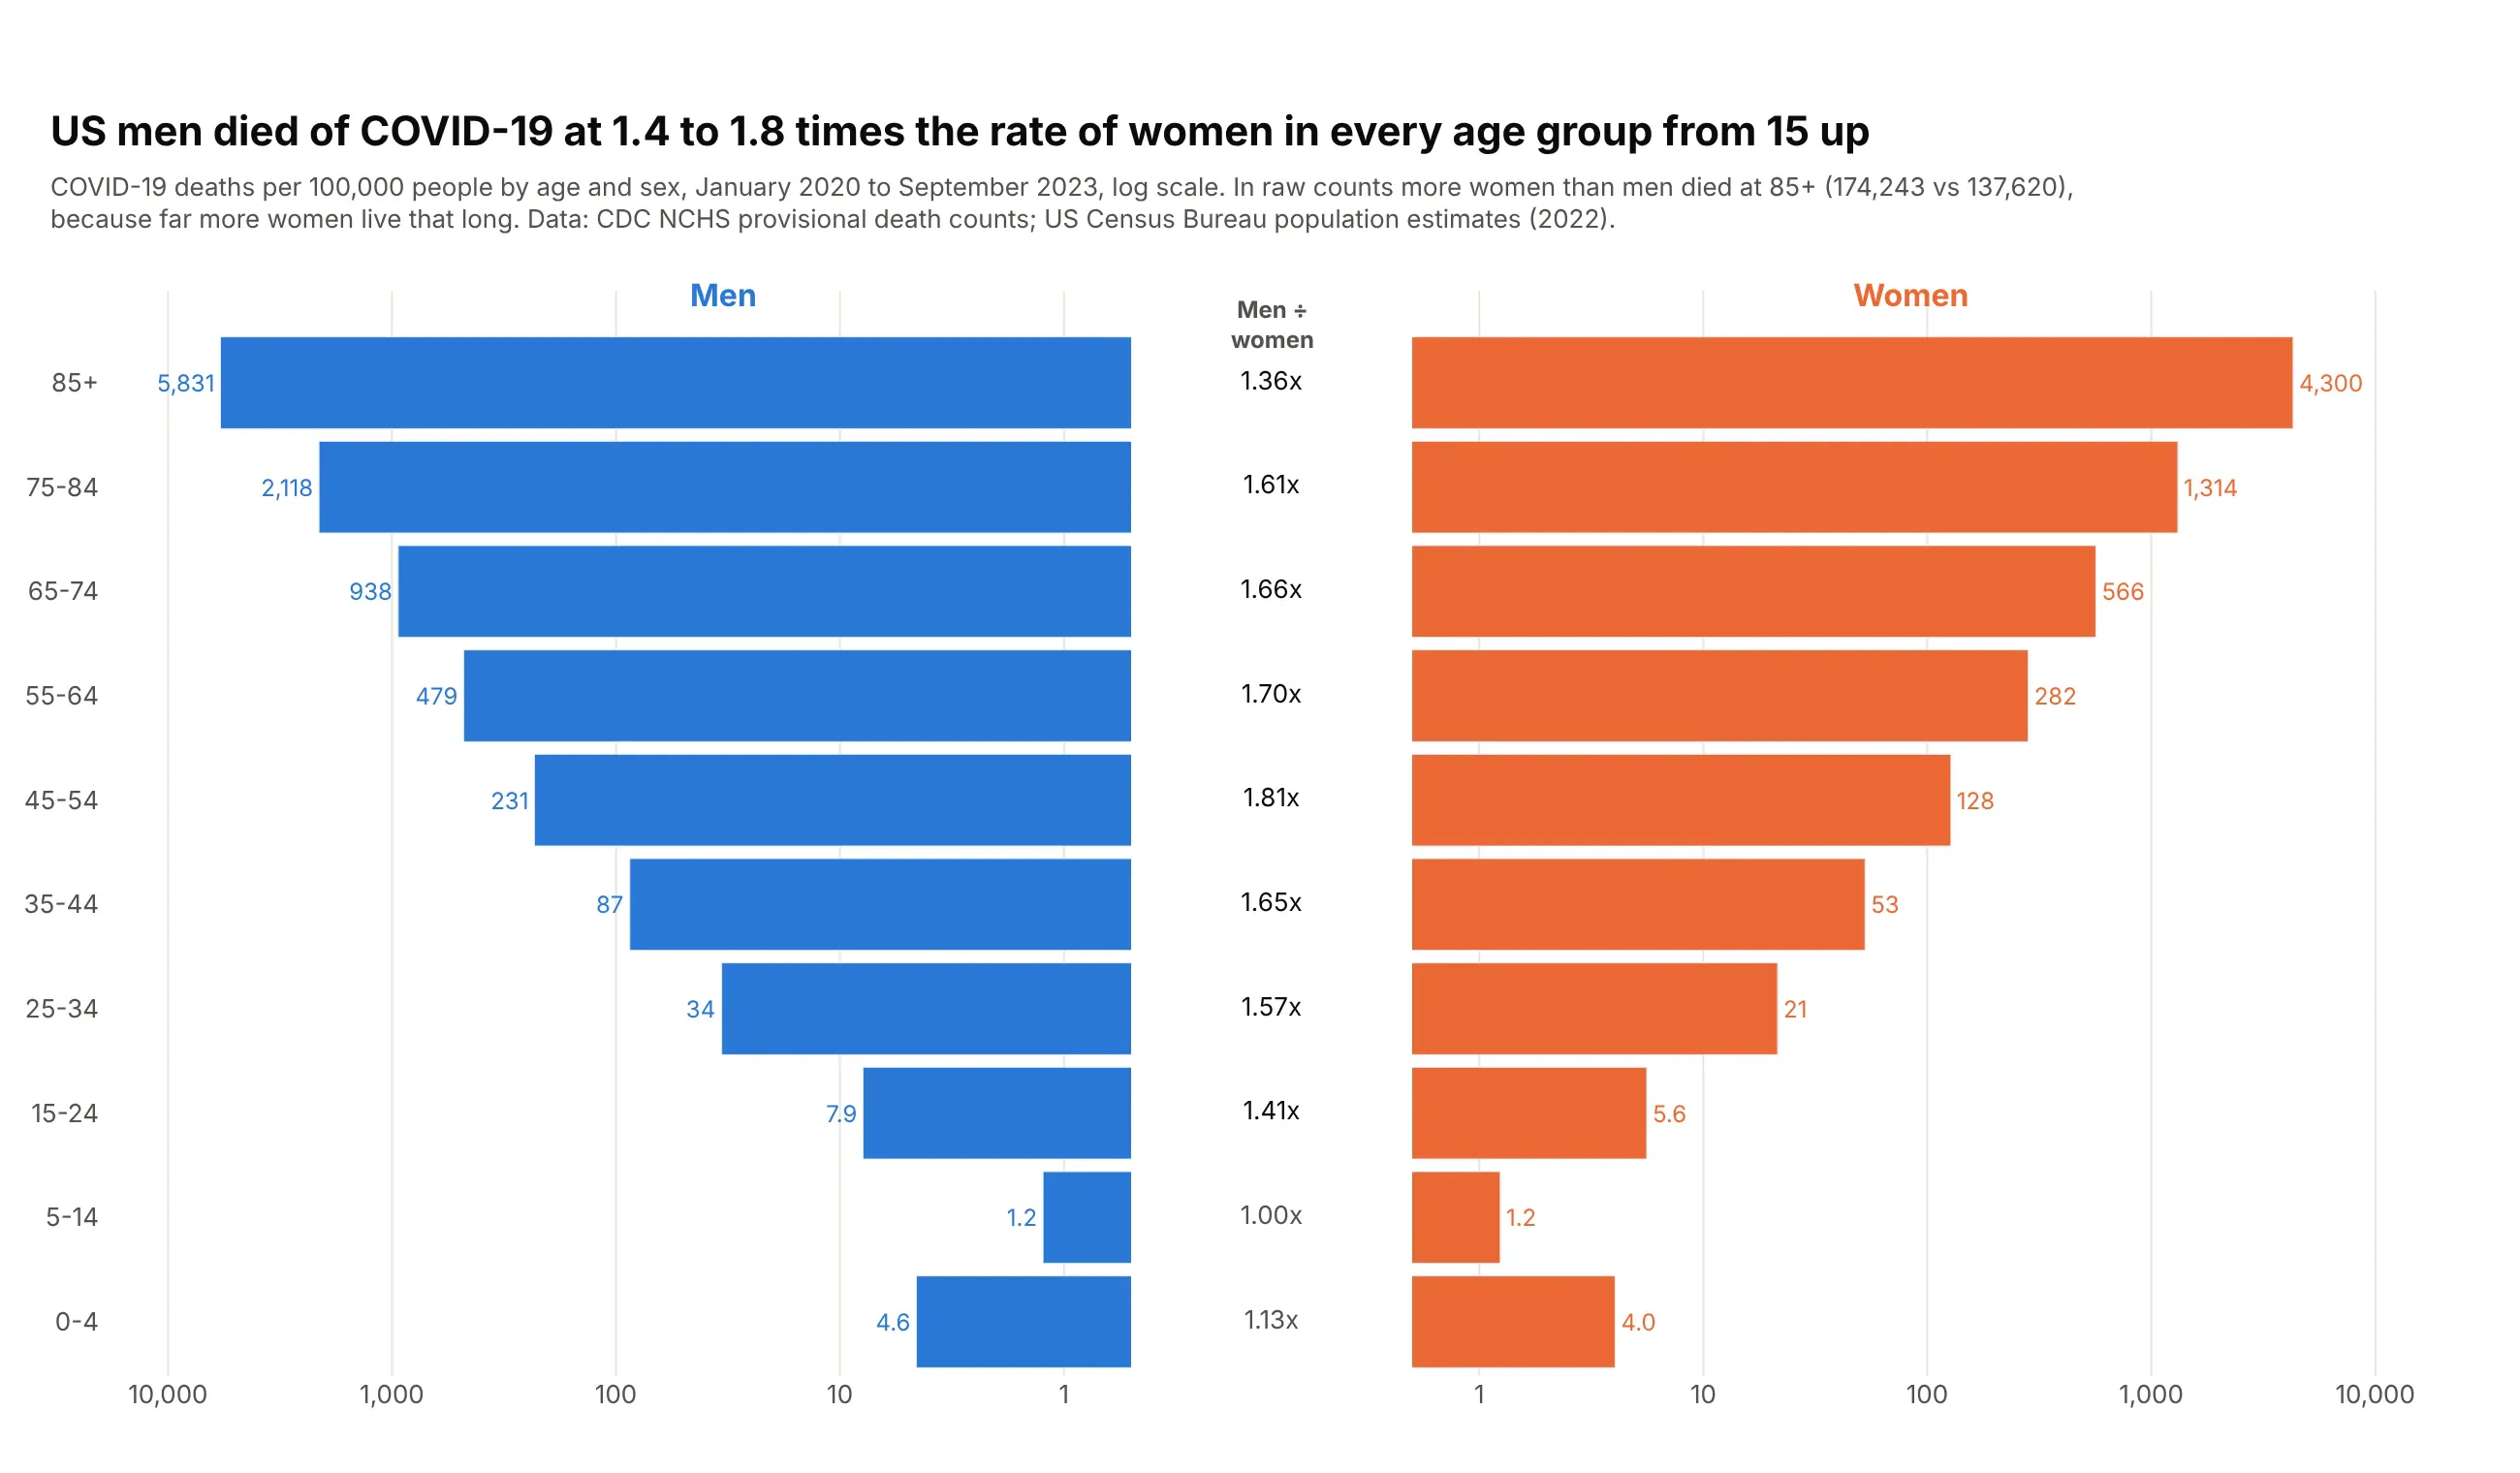
Men died of COVID-19 at 1.4 to 1.8 times the rate of women in every age group from 15 up. Rates matter here: in counts, more women than men died at 85+ because far more women live that long. Data: CDC NCHS provisional death counts; US Census Bureau population estimates.
Tip: a log axis can't take negative values, so use two subplots and reverse the left axis.
Get the data from the CDC NCHS "Provisional COVID-19 Deaths by Sex and Age" dataset(data.cdc.gov 9bhg-hcku), group By Total, United States, plus the US Census Bureau Vintage 2025national estimates for 2022 (columns: age_group, male_deaths, female_deaths, male_pop,female_pop, male_rate, female_rate per 100,000).Build a plotly butterfly chart with make_subplots(cols=3, shared_yaxes=True): men's rates onthe left with a reversed log axis, the men-to-women ratio as text in the middle, women's rateson the right with a log axis.
9. An age pyramid of the US power grid
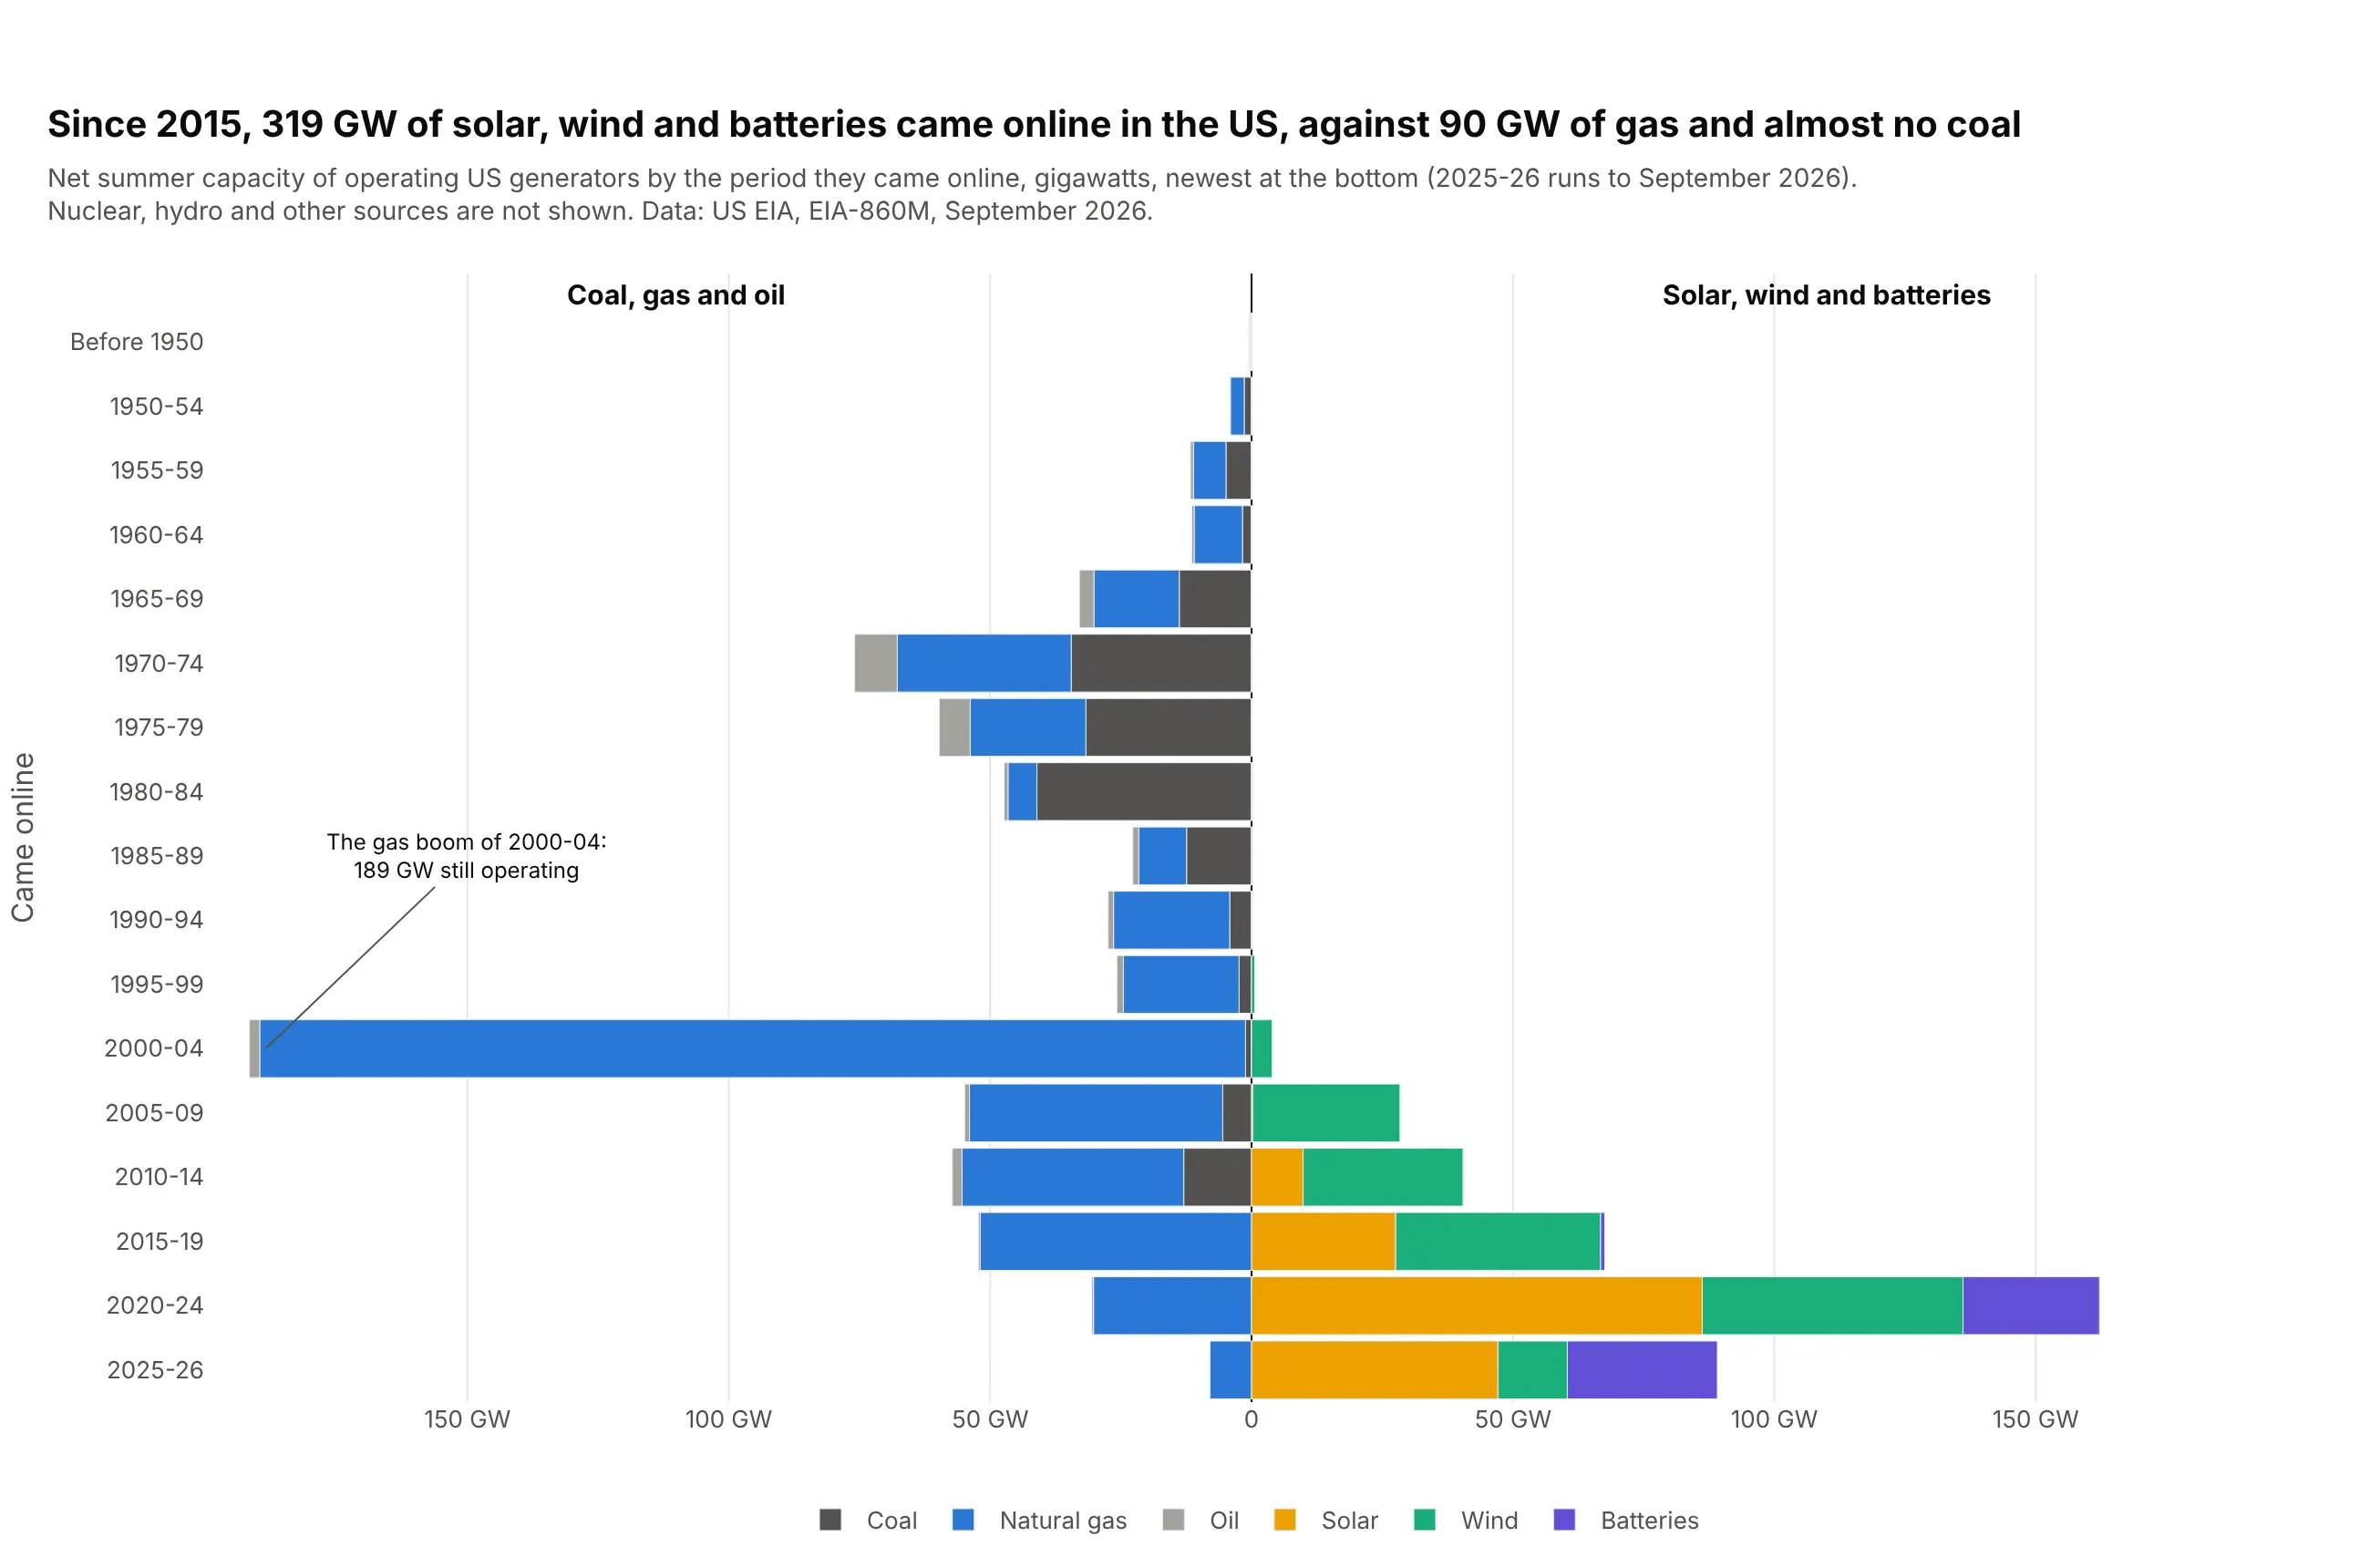
A fleet of power plants has an age structure too. Since 2015, 319 GW of solar, wind and batteries came online in the US against 90 GW of gas and almost no coal, while 84% of operating coal capacity predates 1990. Data: US EIA, EIA-860M, September 2026.
Tip: put the newest period at the bottom, like age 0, so it reads as an age pyramid.
Get the data from the US EIA's EIA-860M monthly generator inventory (latest month), sheetOperating: net summer capacity by operating year and technology, grouped into coal, natural gas,oil, solar, wind and batteries and binned into 5-year periods (columns: period, start, group, gw).Build a plotly butterfly chart: coal, gas and oil stacked on the left, solar, wind and batterieson the right, barmode="relative", newest period at the bottom (yaxis type="category").
10. The age pyramid of the US Congress
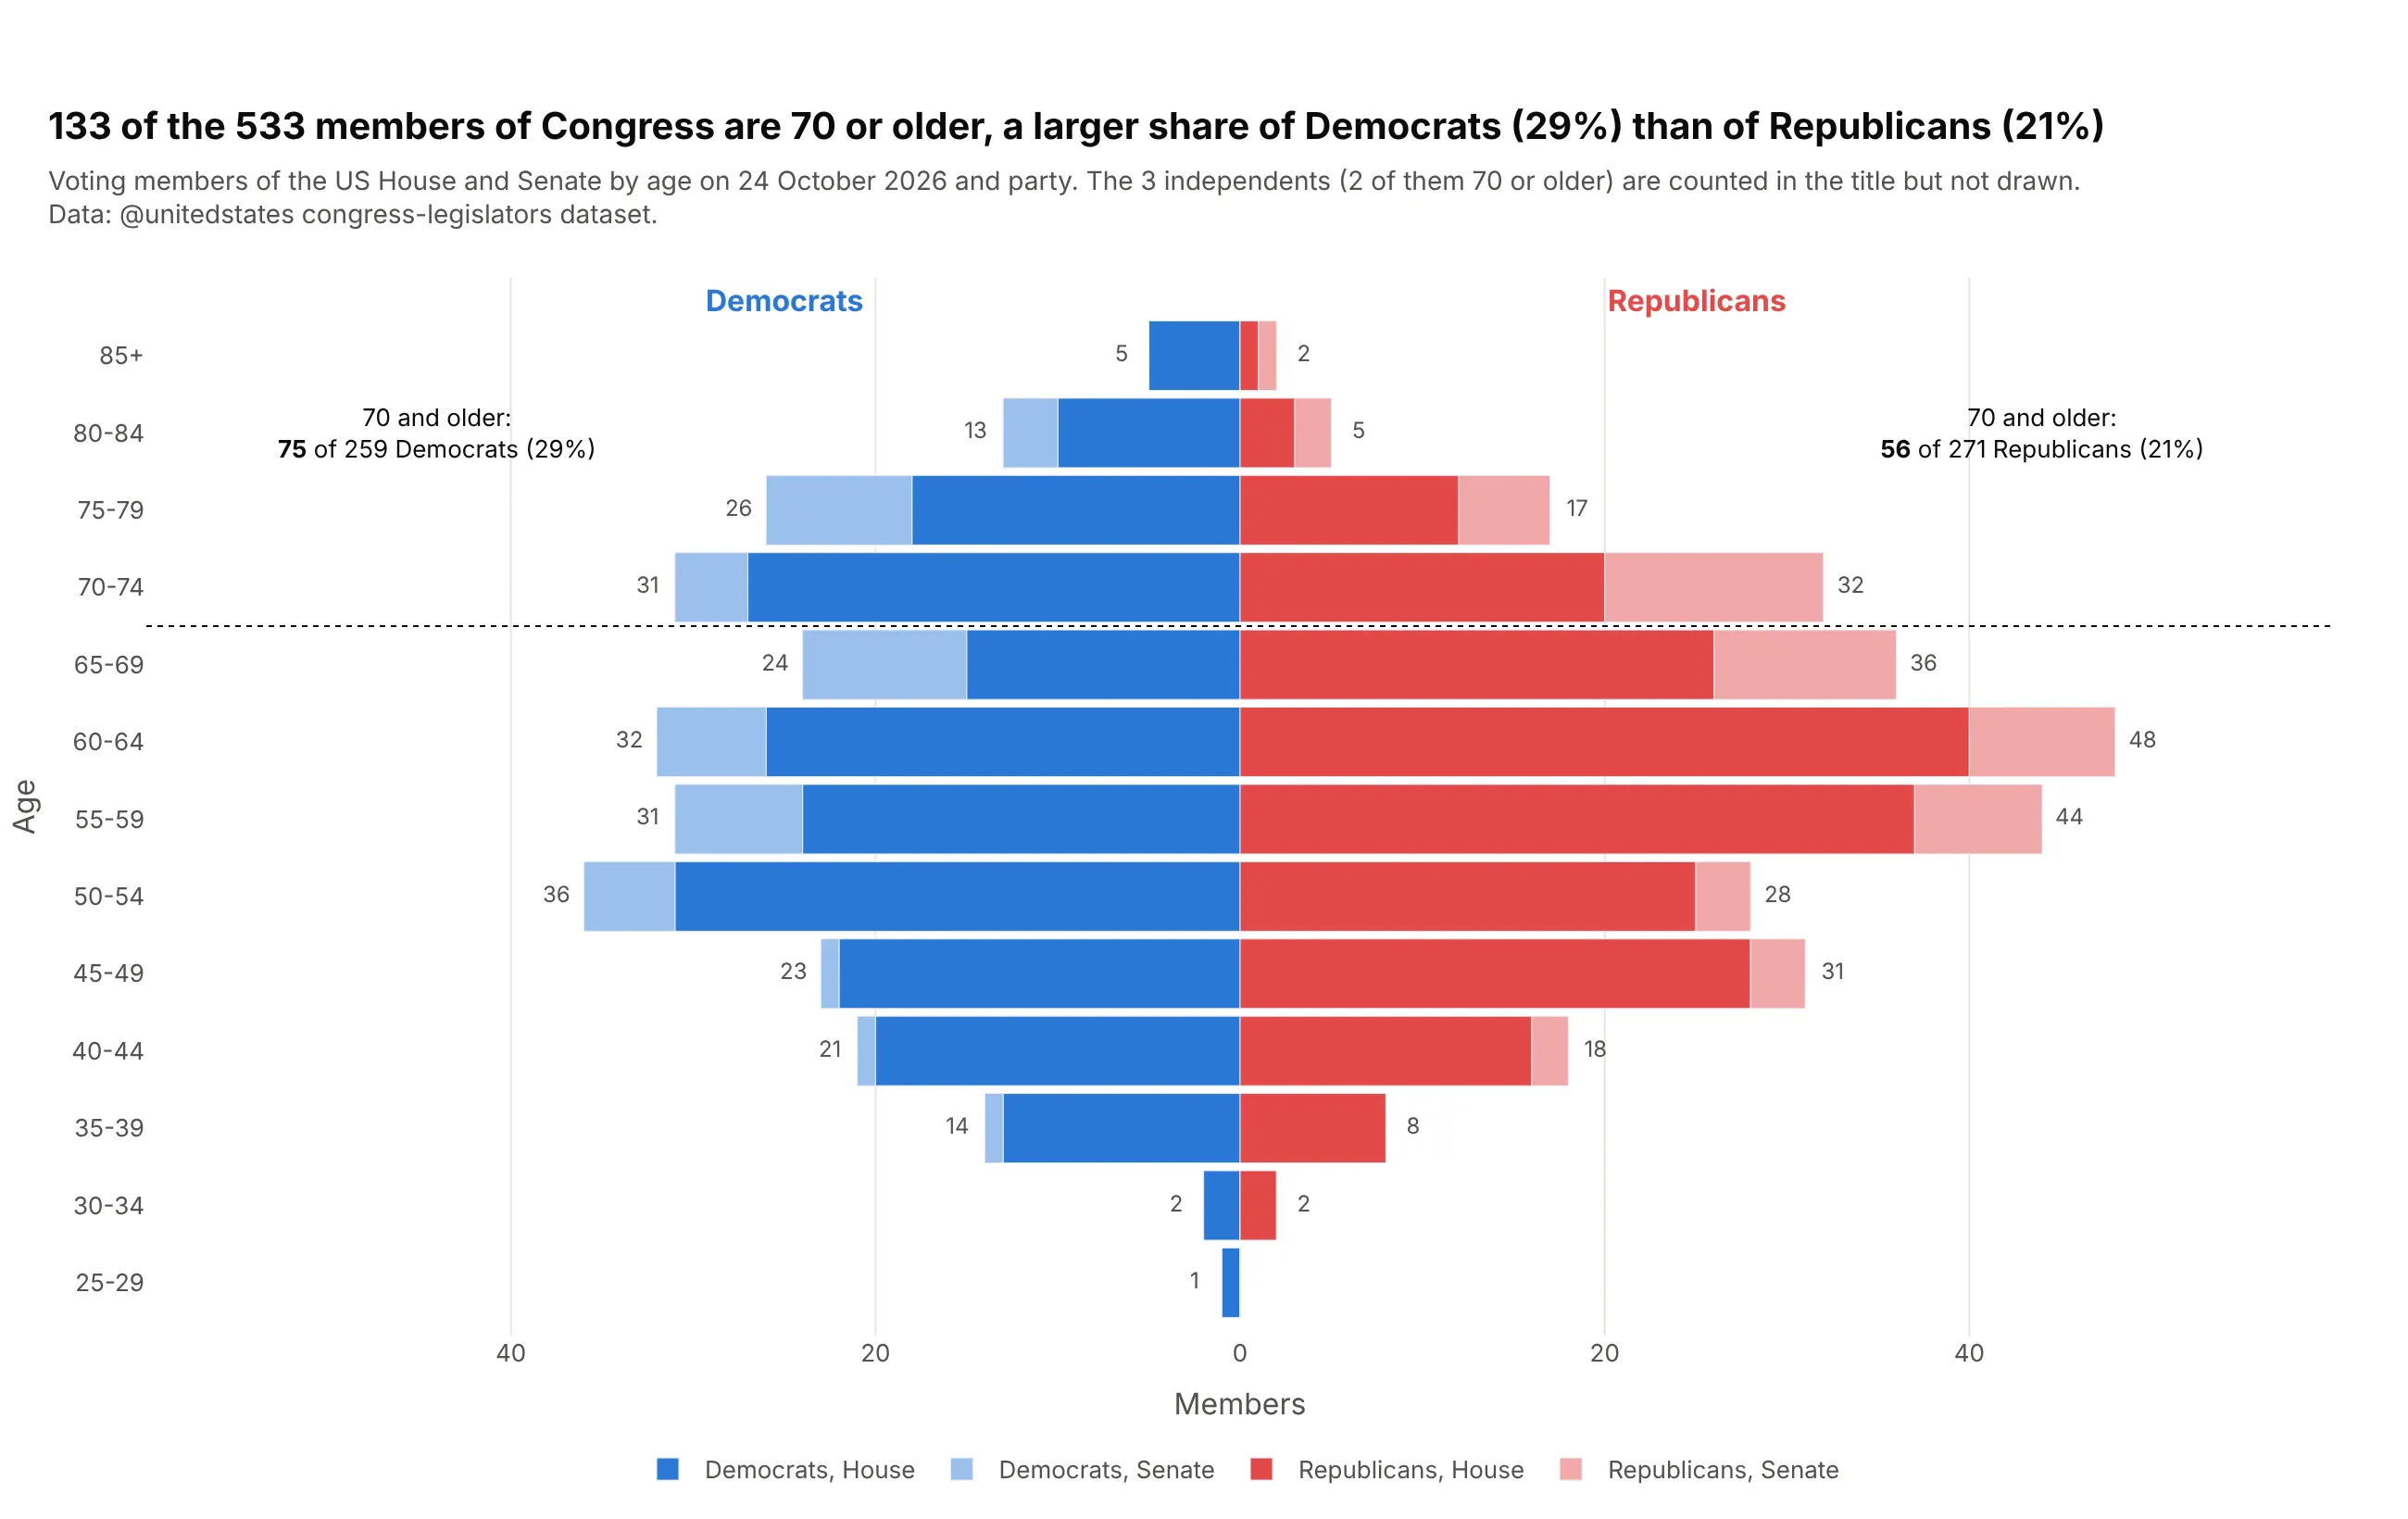
Any institution has a pyramid. 133 of the 533 members of Congress are 70 or older: 29% of Democrats and 21% of Republicans. Stacking the Senate in a lighter tint shows it is older: 37 of 100 senators are 70 or older, against 96 of 433 representatives. Data: @unitedstates congress-legislators dataset, ages on 24 October 2026.
Tip: add a reference line at the age that matters with fig.add_hline.
Get the data from the @unitedstates congress-legislators dataset (legislators-current.csv),voting members only, with age on today's date (columns: age_group, age, chamber, party, members).Build a plotly butterfly chart: Democrats left, Republicans right, House and Senate stackedin two tints of each party color, counts at the end of each bar, a dotted line at 70.