
Chris Parmer
November 7, 2026
KPI Cards - A Complete Guide
TL;DR
- A KPI card shows one key performance indicator (KPI), a number a team watches to judge how something is going, as a big number with a label, its units and date, a delta that says how much it moved against a reference, and often a sparkline of its recent history.
- KPI cards are also known as scorecards, cards, stat panels, single value charts, big number charts, and number charts, and in Plotly as indicators. They are similar to gauge charts and bullet charts, which add a scale, and to line charts, which show the history a card leaves out.
- The two decisions that matter most are the delta's reference (last week, a year ago, a target, or a forecast) and its colors: a falling gasoline price is good news and a falling inventory is neither good nor bad, so red and green aren't always right.
- You can make KPI cards with Plotly from go.Indicator (modes number, number+delta, number+delta+gauge), add a go.Scatter sparkline under each one, and lay a row of them out in a Dash app.
What is a KPI card?
KPI cards look like this:
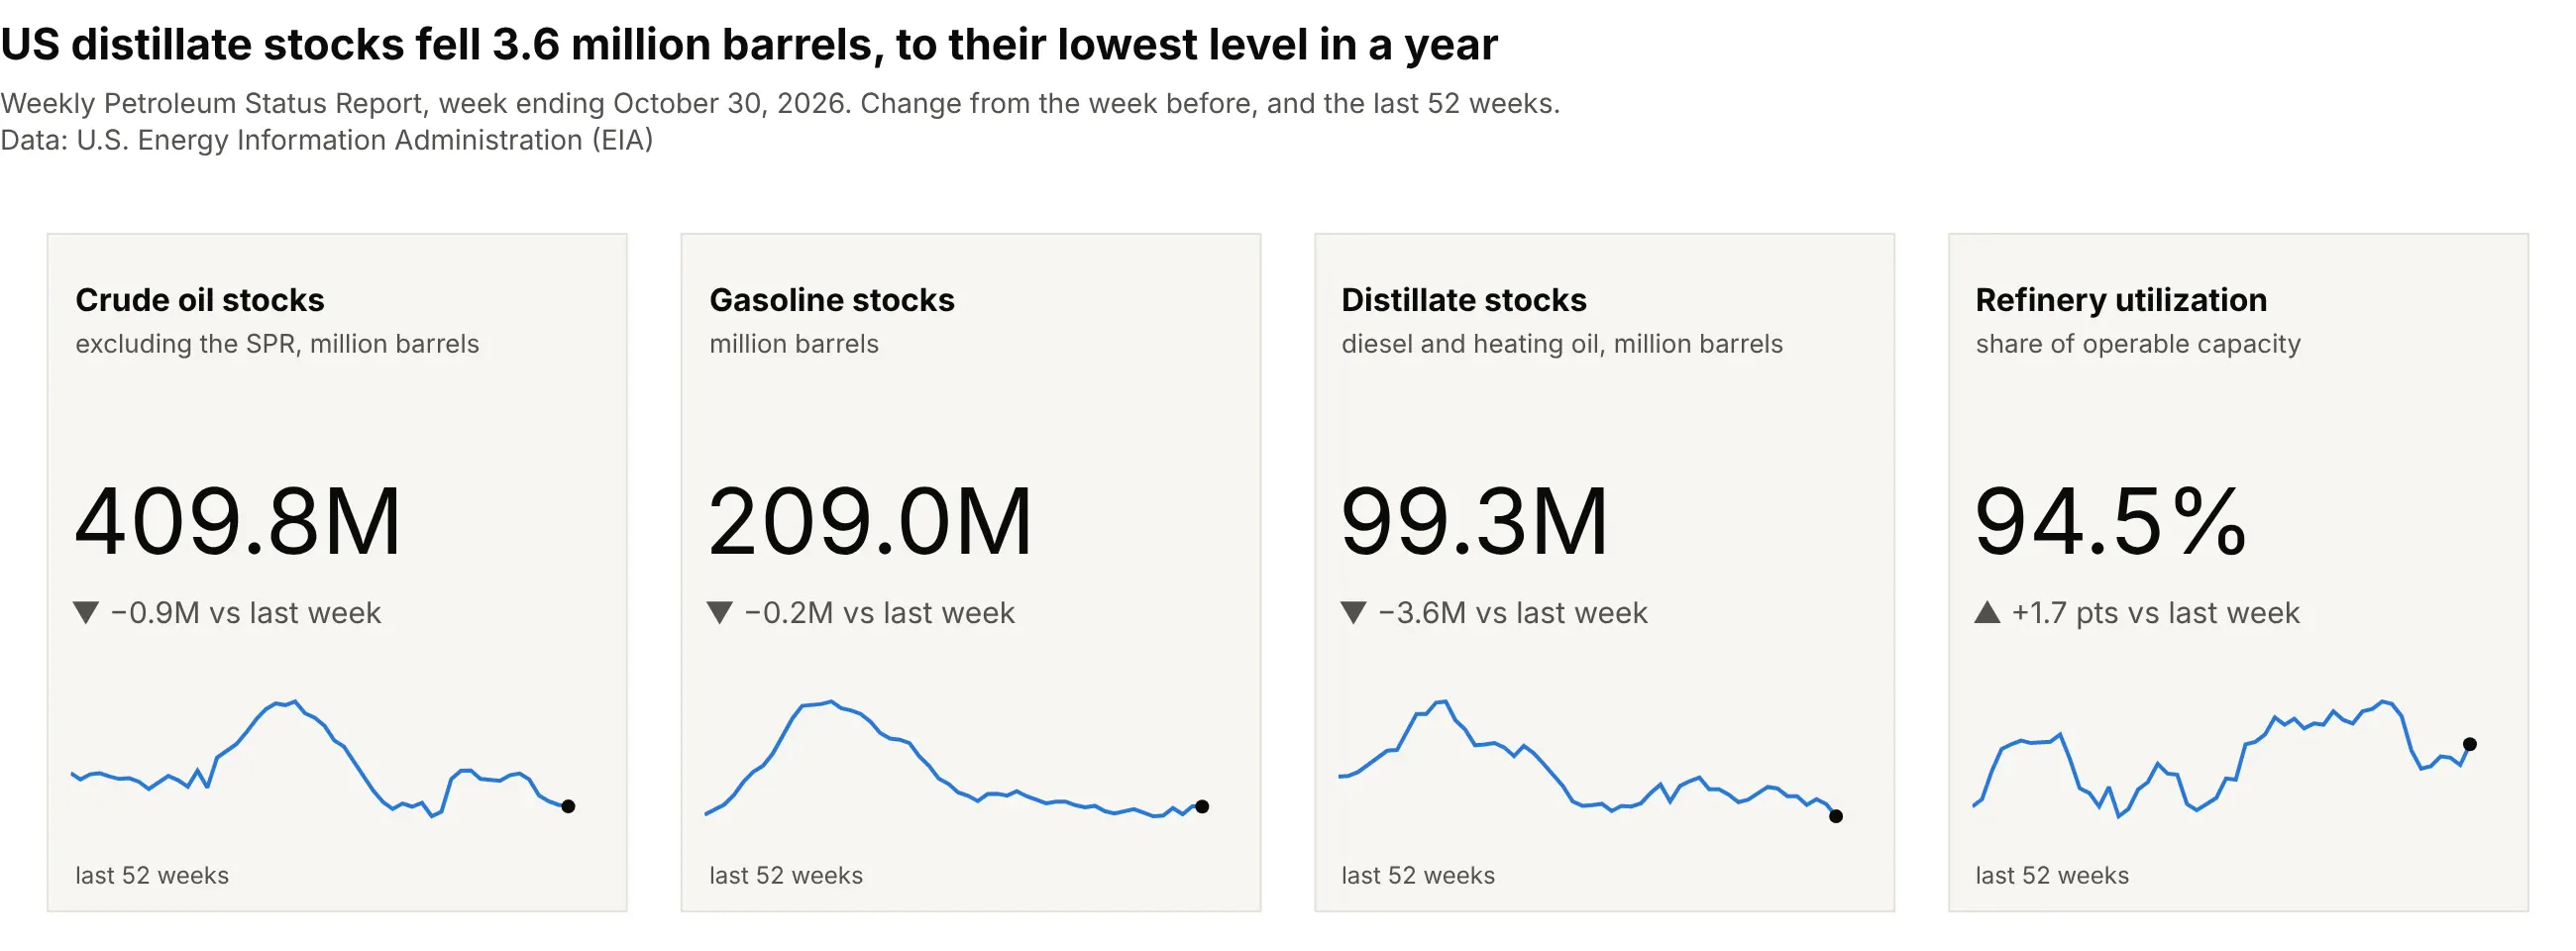
Data: U.S. Energy Information Administration (EIA), Weekly Petroleum Status Report (WPSR), week ending October 30, 2026.
How do you read a KPI card? In the example above, notice these things:
- Each card answers one question, how much of something there is right now, and the big number is the answer. The title and the gray line under it say what it measures and in which units: 409.8M is million barrels of crude oil in commercial storage, excluding the government's Strategic Petroleum Reserve (SPR).
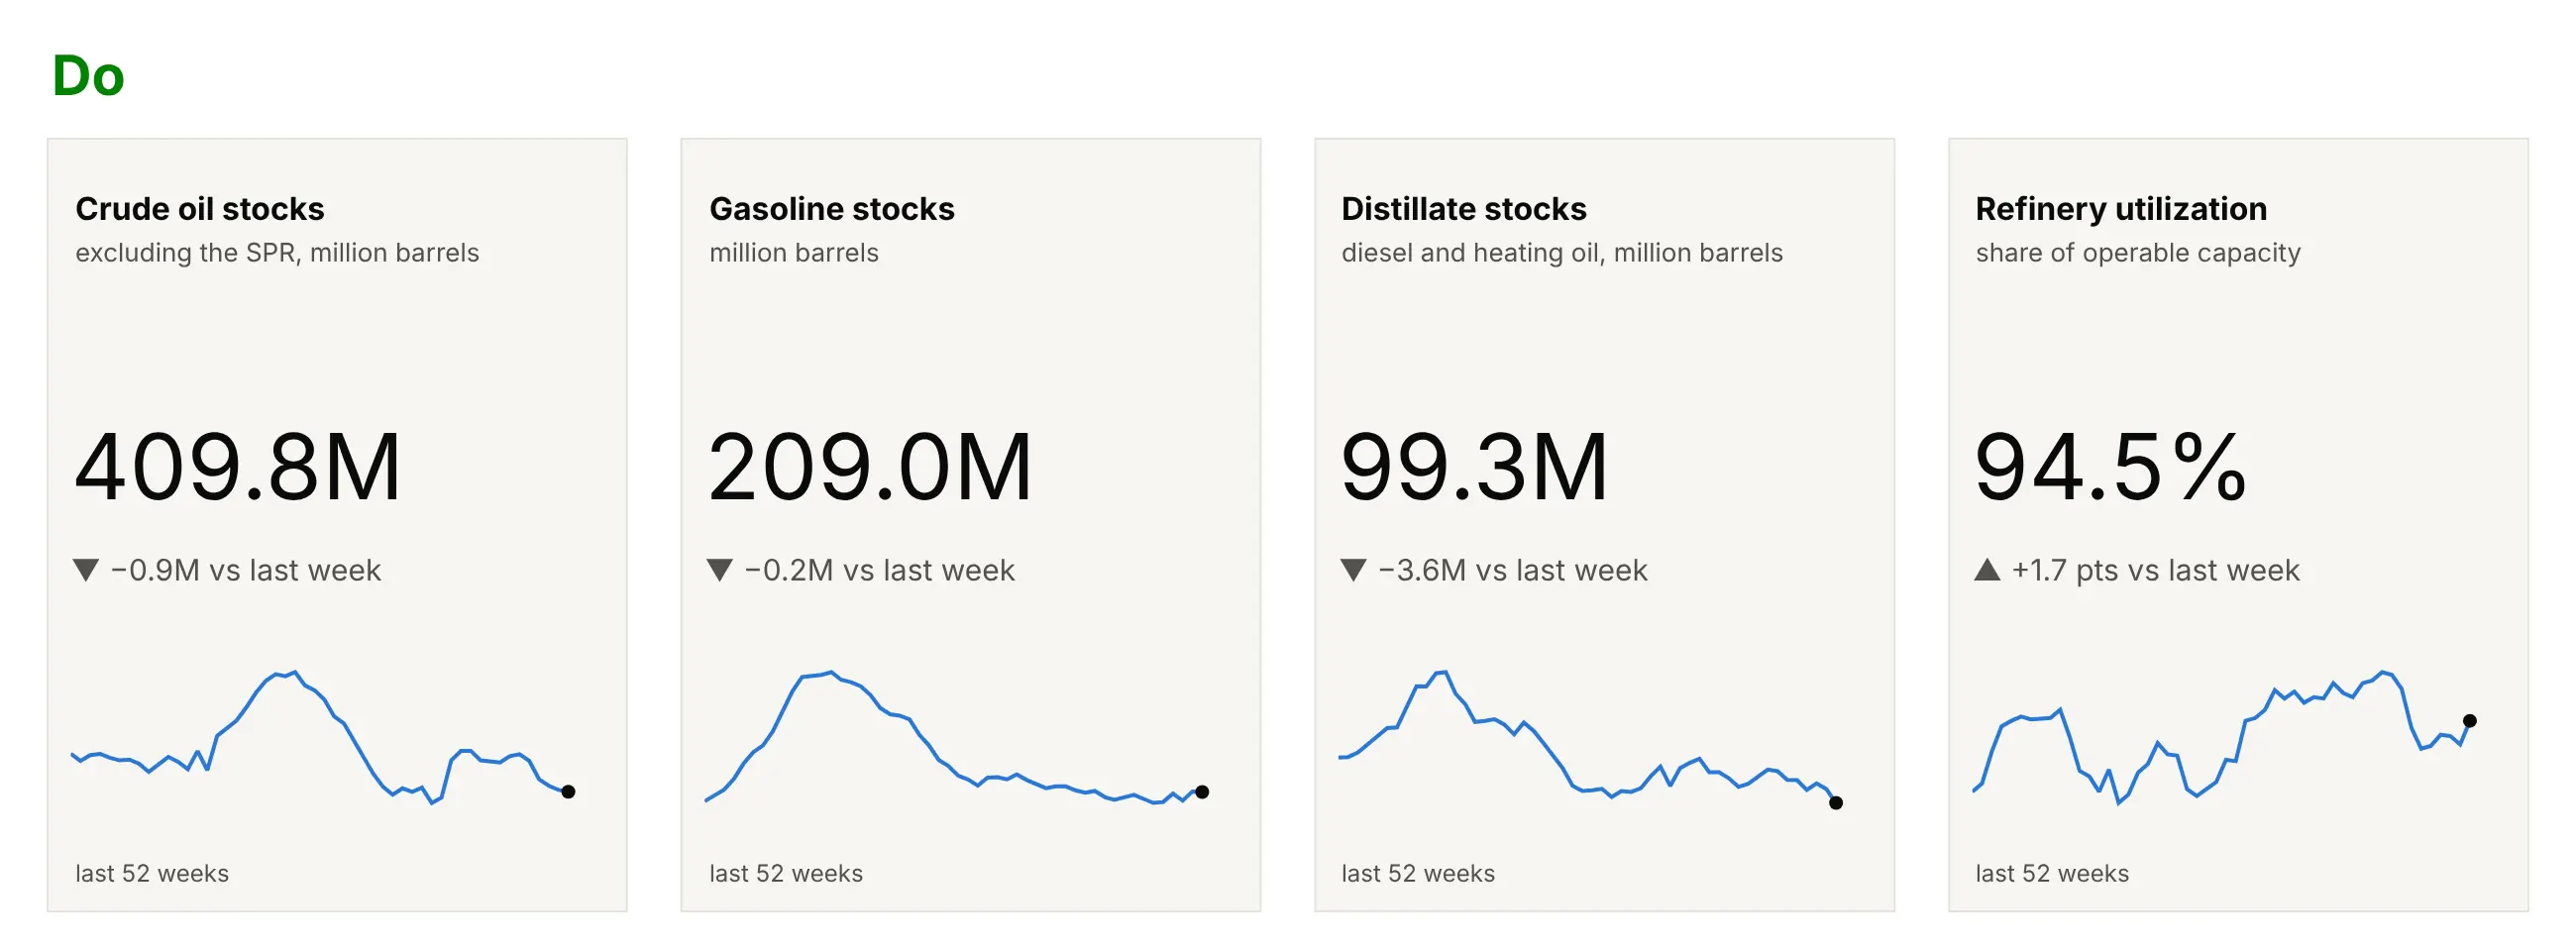
- The line under the number is the delta, the change from a reference. Here every reference is the week before, and the label says so: distillate stocks (diesel and heating oil) fell 3.6 million barrels, from 102.8M to 99.3M.
- The deltas are gray, not red and green, because a fall in inventories is neither good nor bad on its own: it is good for a refiner selling into a tight market and bad for a buyer. The arrows still show the direction.
- The sparkline at the bottom of each card is the last 52 weeks with a dot on this week. It shows what the delta can't, that distillate stocks are at the lowest point of the year (the year's high was 132.9M), while refinery utilization is in the upper part of its range, between a low of 86.0% and a high of 98.0%.
It's often used for charts like these:
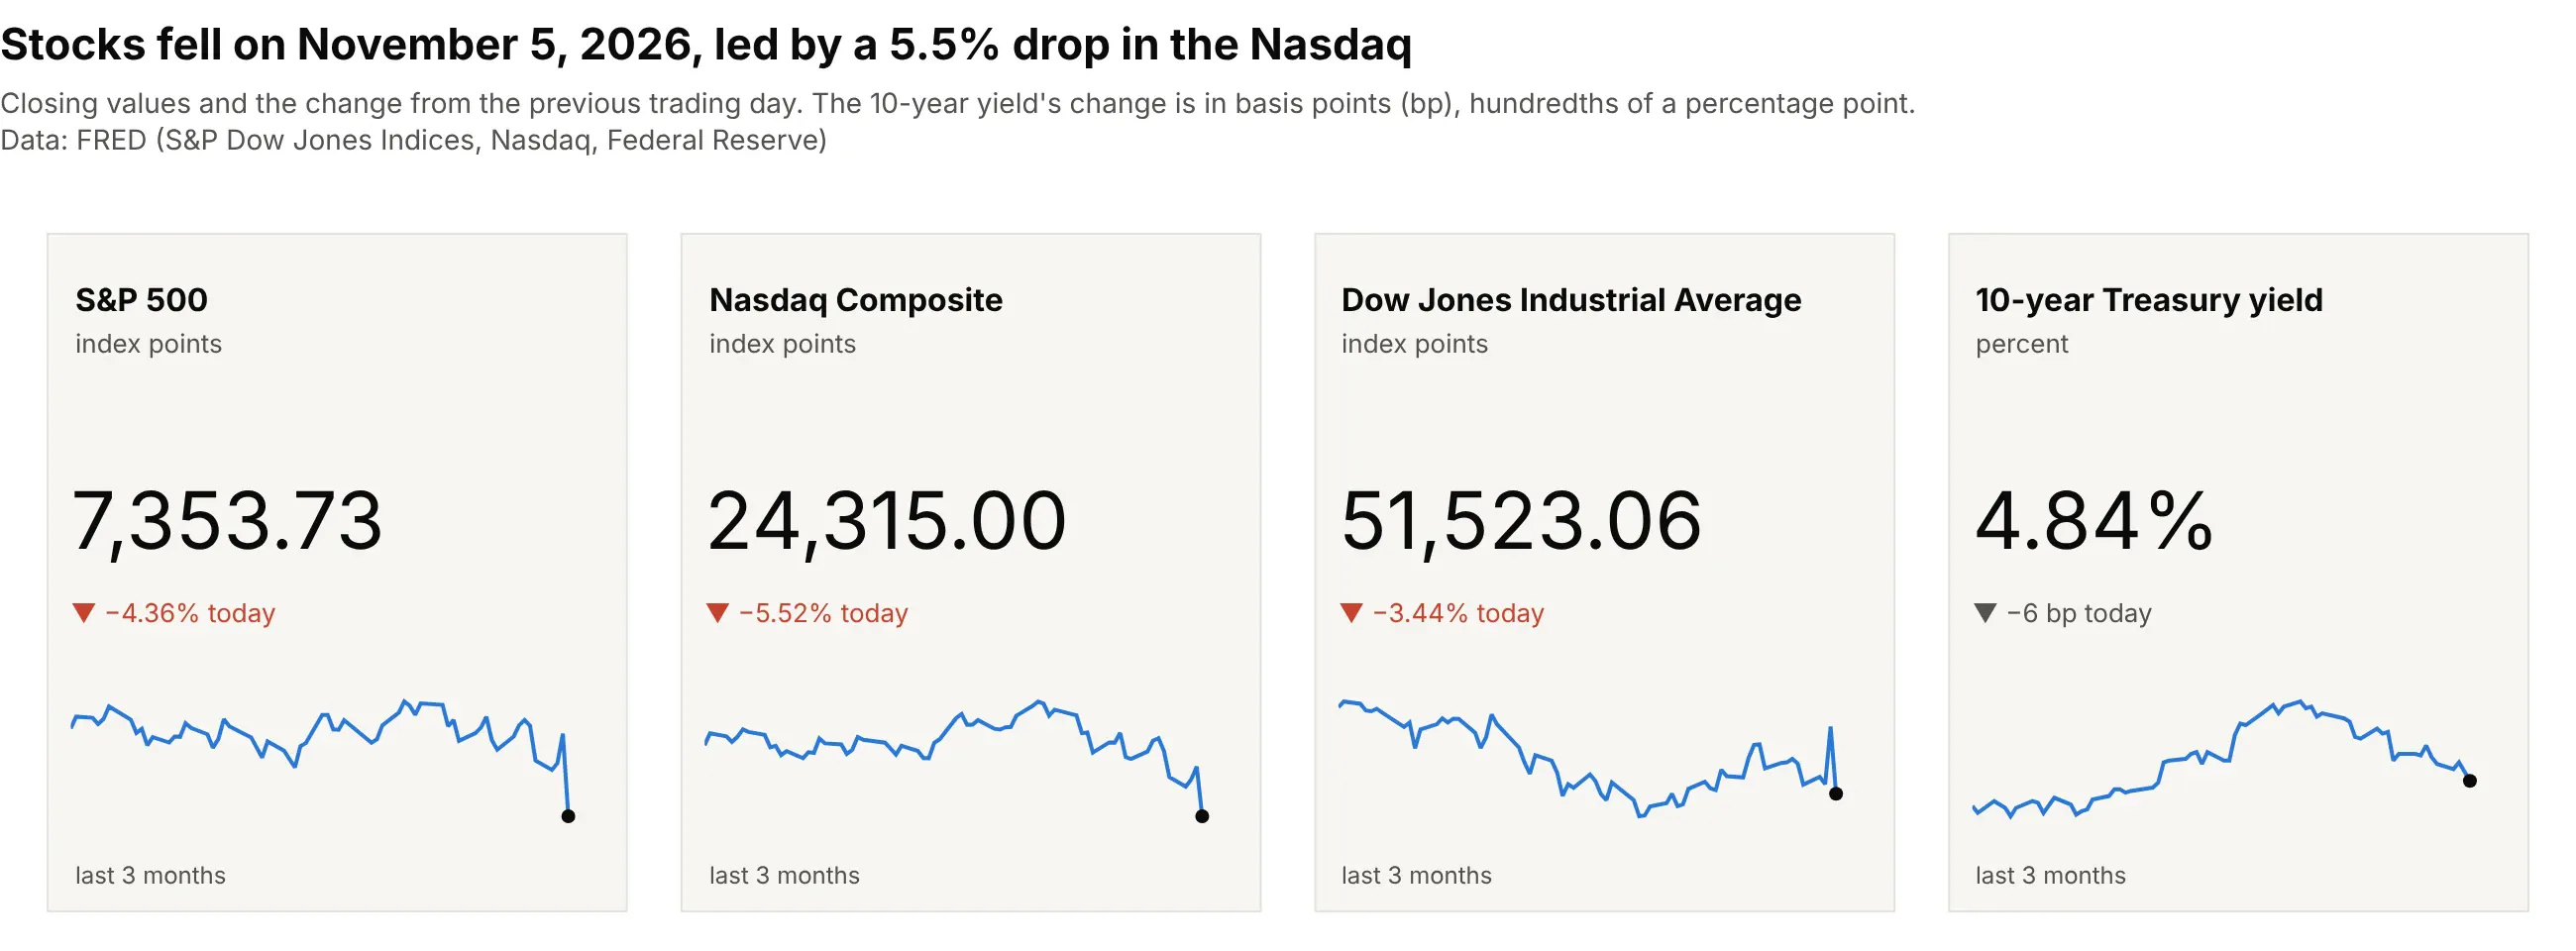
Market quotes, the classic use. Quote boards show a price and the day's change for each instrument, as the Nasdaq's 5.52% fall on November 5, 2026 here; the bond yield's change is in basis points (bp), hundredths of a percentage point, and gray, because a lower yield is good for some readers and bad for others. Data: FRED (Federal Reserve Economic Data): S&P Dow Jones Indices, Nasdaq, Federal Reserve.
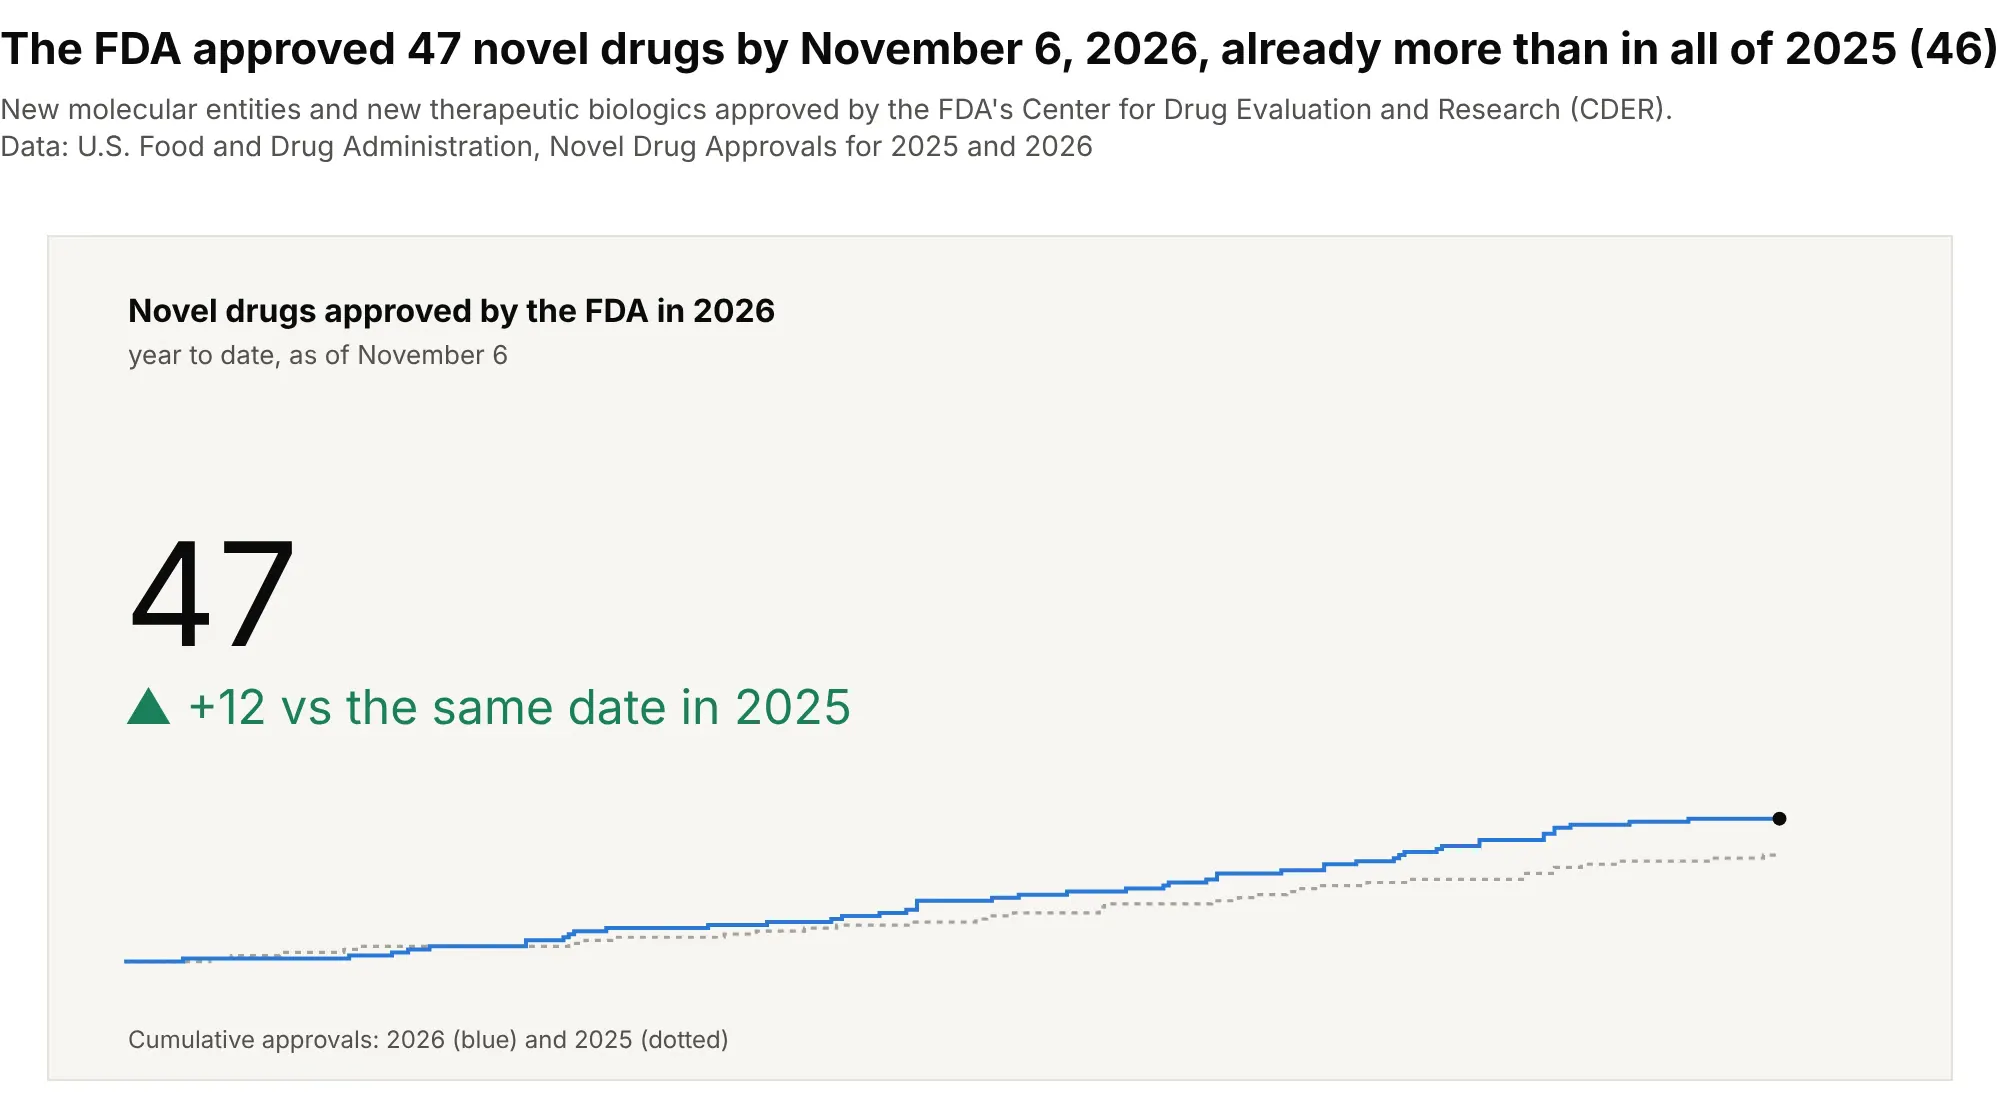
A count so far this year. The US Food and Drug Administration (FDA) approved 47 novel drugs by November 6, 2026, 12 more than by the same date in 2025 and already more than all 46 of 2025, so the card compares with the same date, not with last year's total. Data: FDA, Center for Drug Evaluation and Research (CDER), Novel Drug Approvals for 2025 and 2026.
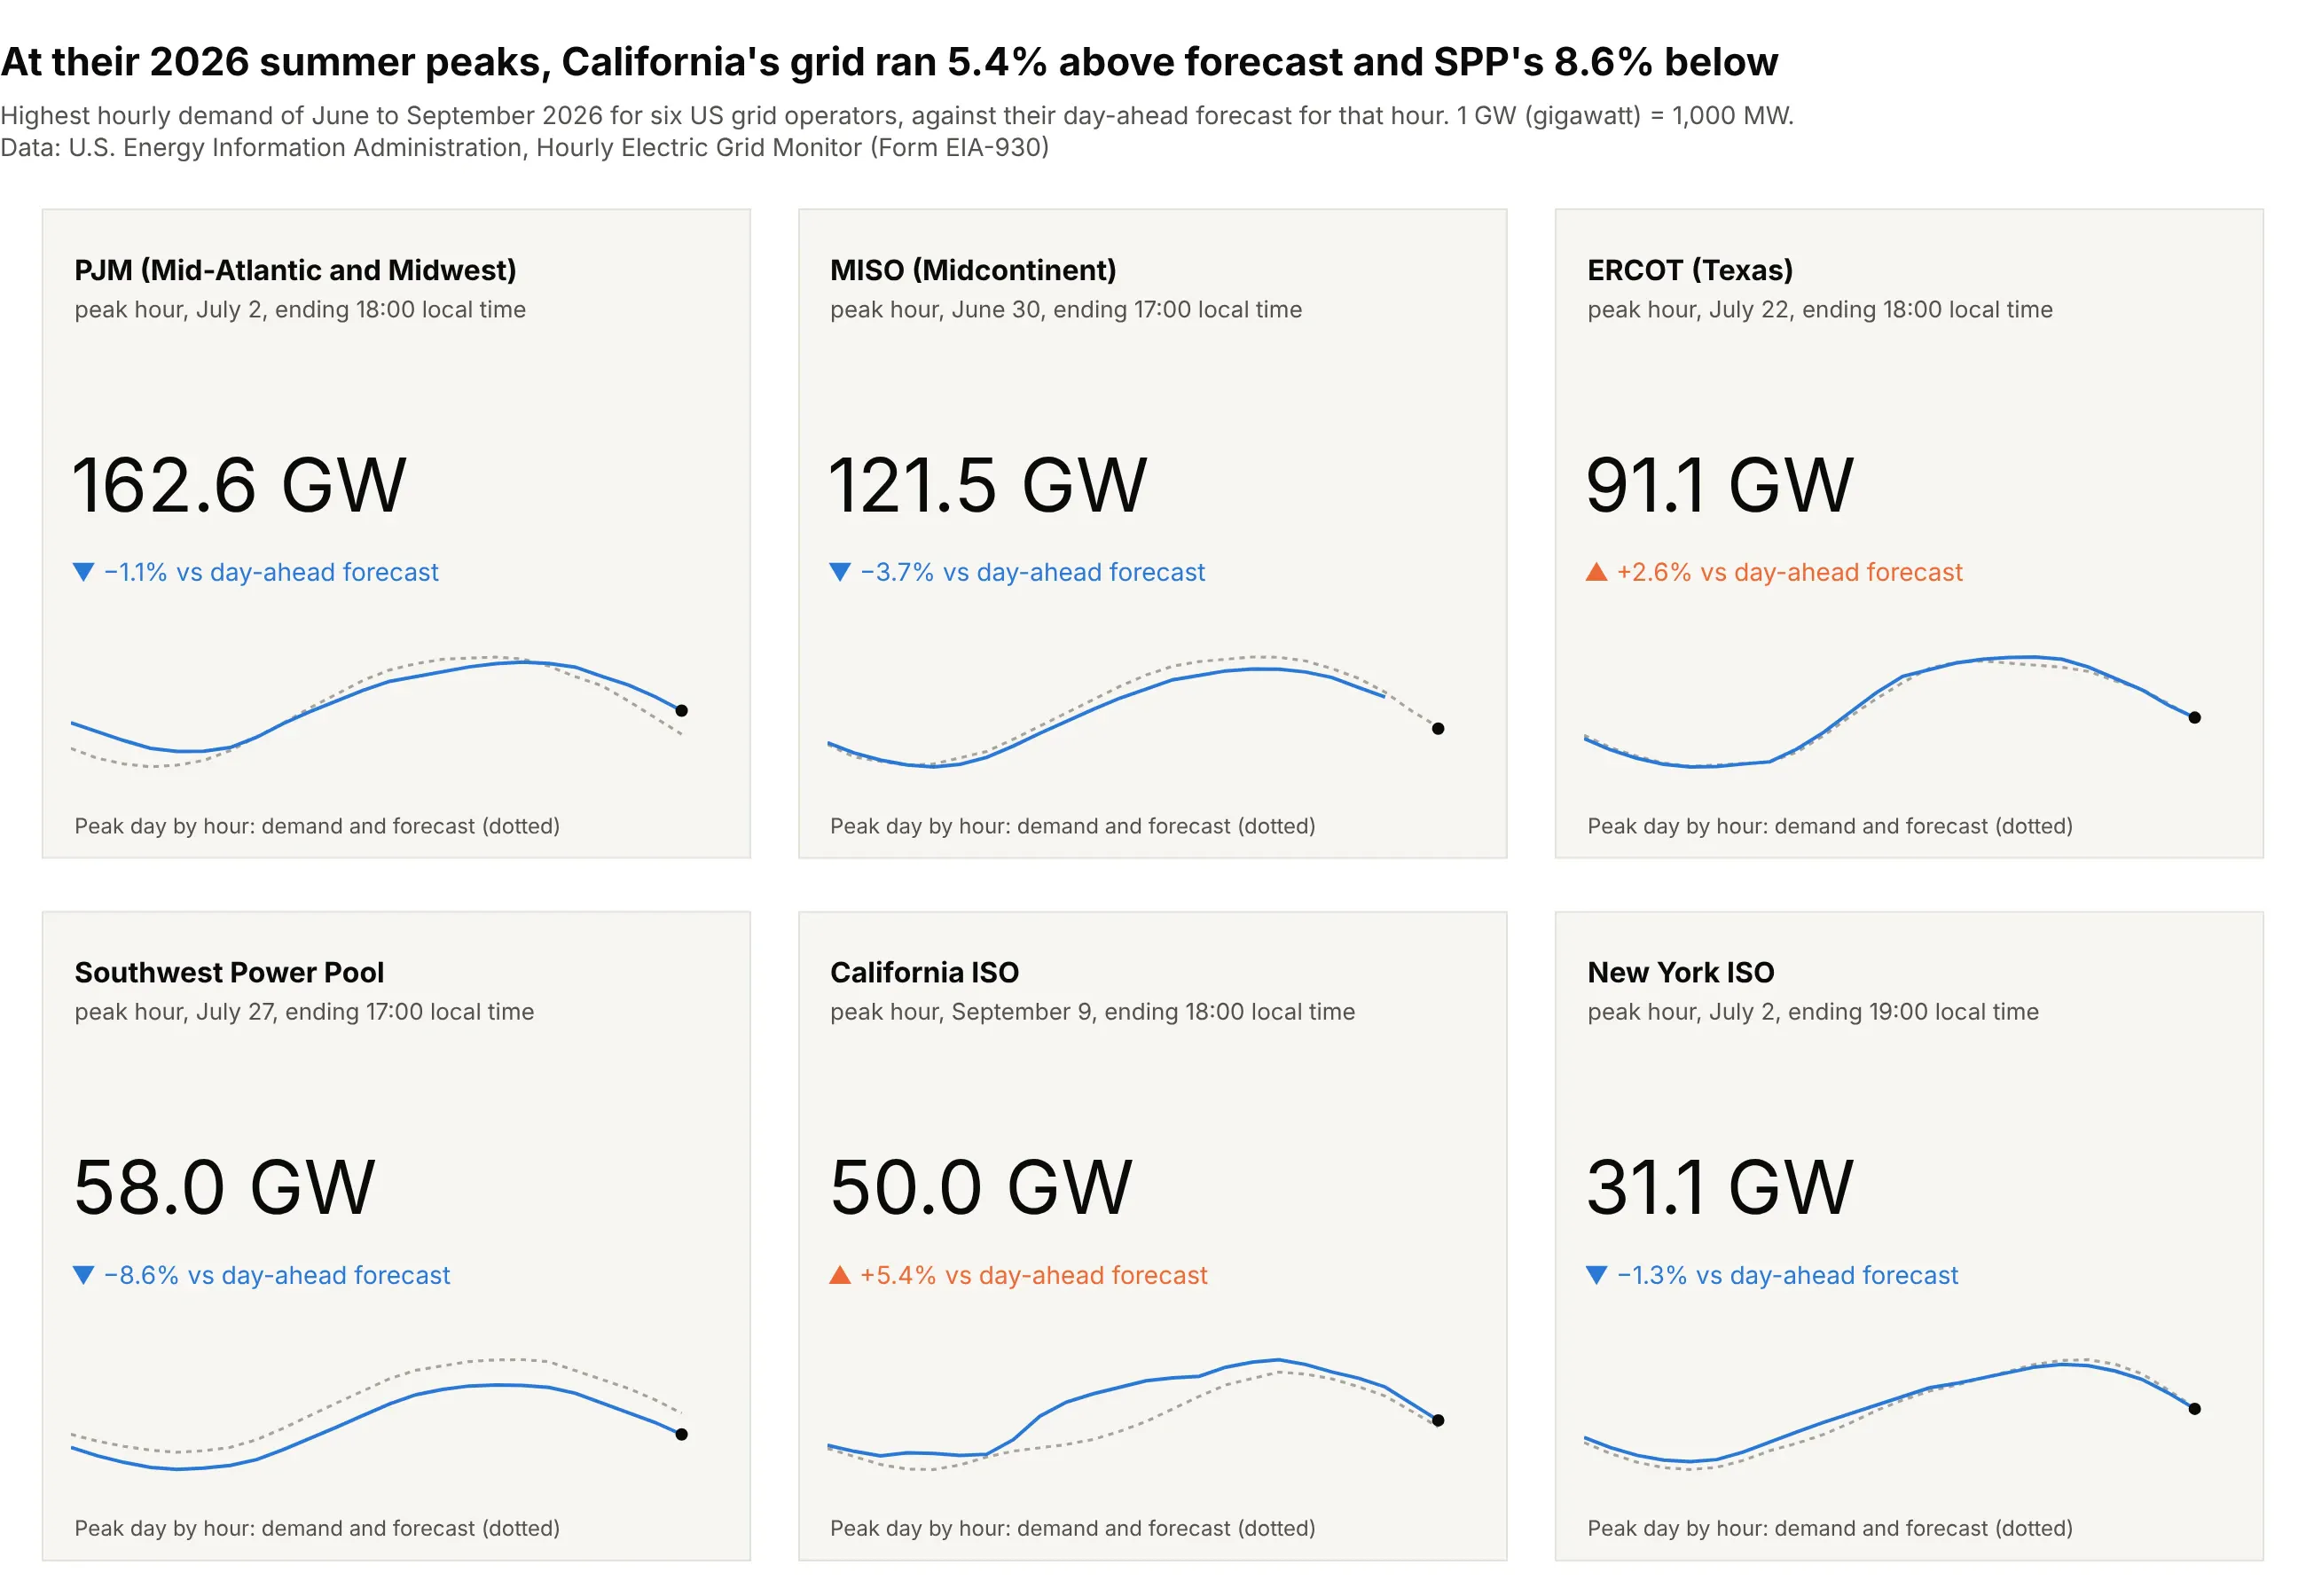
An actual against a forecast. At its 2026 summer peak hour, the California Independent System Operator (CAISO) carried 50.0 gigawatts (GW), 5.4% more than its day-ahead forecast, while the Southwest Power Pool (SPP) came in 8.6% below. Data: EIA, Hourly Electric Grid Monitor (Form EIA-930).
How a KPI card works
A KPI card looks like the simplest chart there is, but each of its parts is a decision, and most bad KPI cards get one of them wrong. These are the parts and what to decide for each.
The four modes of go.Indicator
Plotly draws the number, the delta and an optional gauge with one trace, go.Indicator, and its mode picks which of them appear. Here is the same refinery utilization reading in each mode:
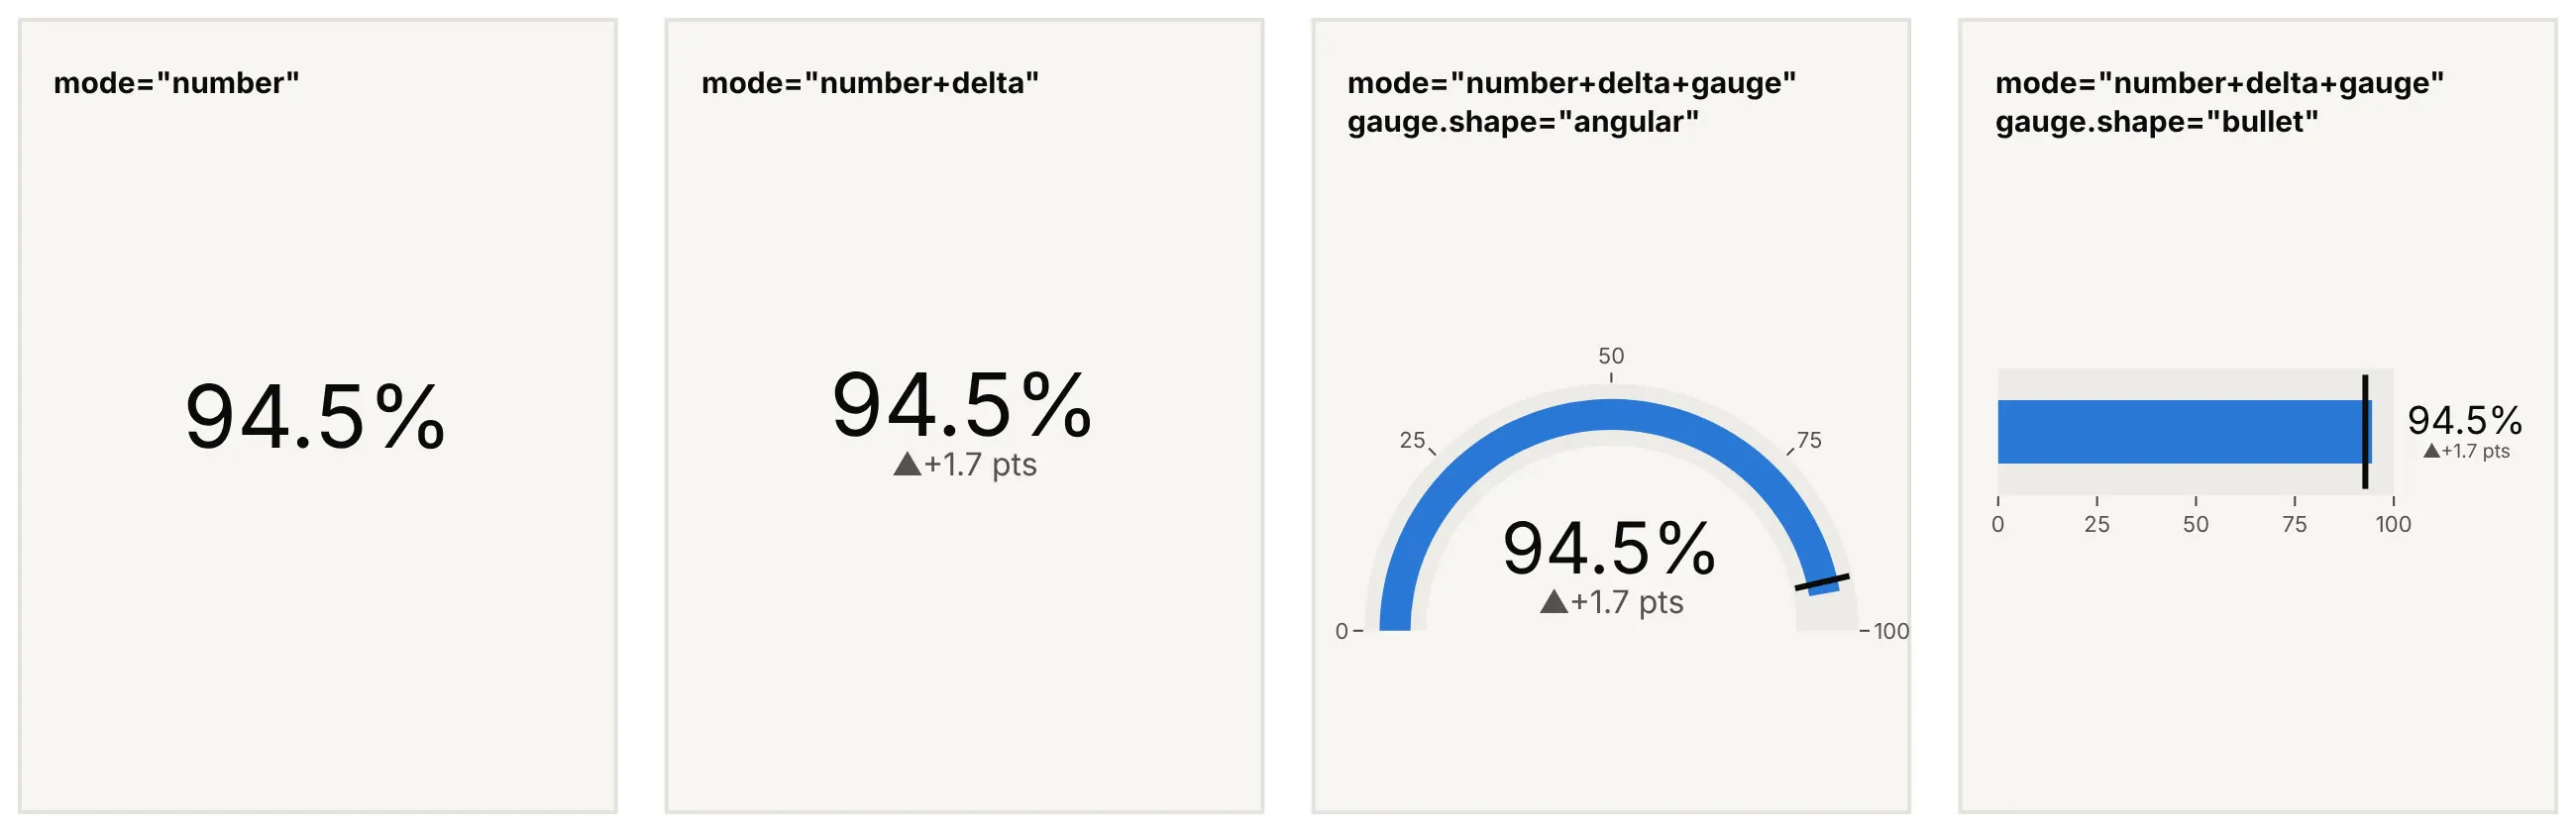
Data: EIA Weekly Petroleum Status Report, refinery utilization in the weeks ending October 23 and 30, 2026.
mode="number" is the plain big number, "number+delta" adds the change against delta.reference, and adding "gauge" puts the value on a scale, as a dial with gauge.shape="angular" or as a bar with gauge.shape="bullet". A gauge only helps when the number has a natural scale, like a percentage of capacity, and the gauge chart guide and bullet chart guide cover those two modes in detail. The rest of this guide is about the card without a gauge.
The delta, and what it compares with
The delta is the value minus a reference, and the reference decides what the card says. These four cards show the same crude oil stocks of 409.8 million barrels, each against a different reference:
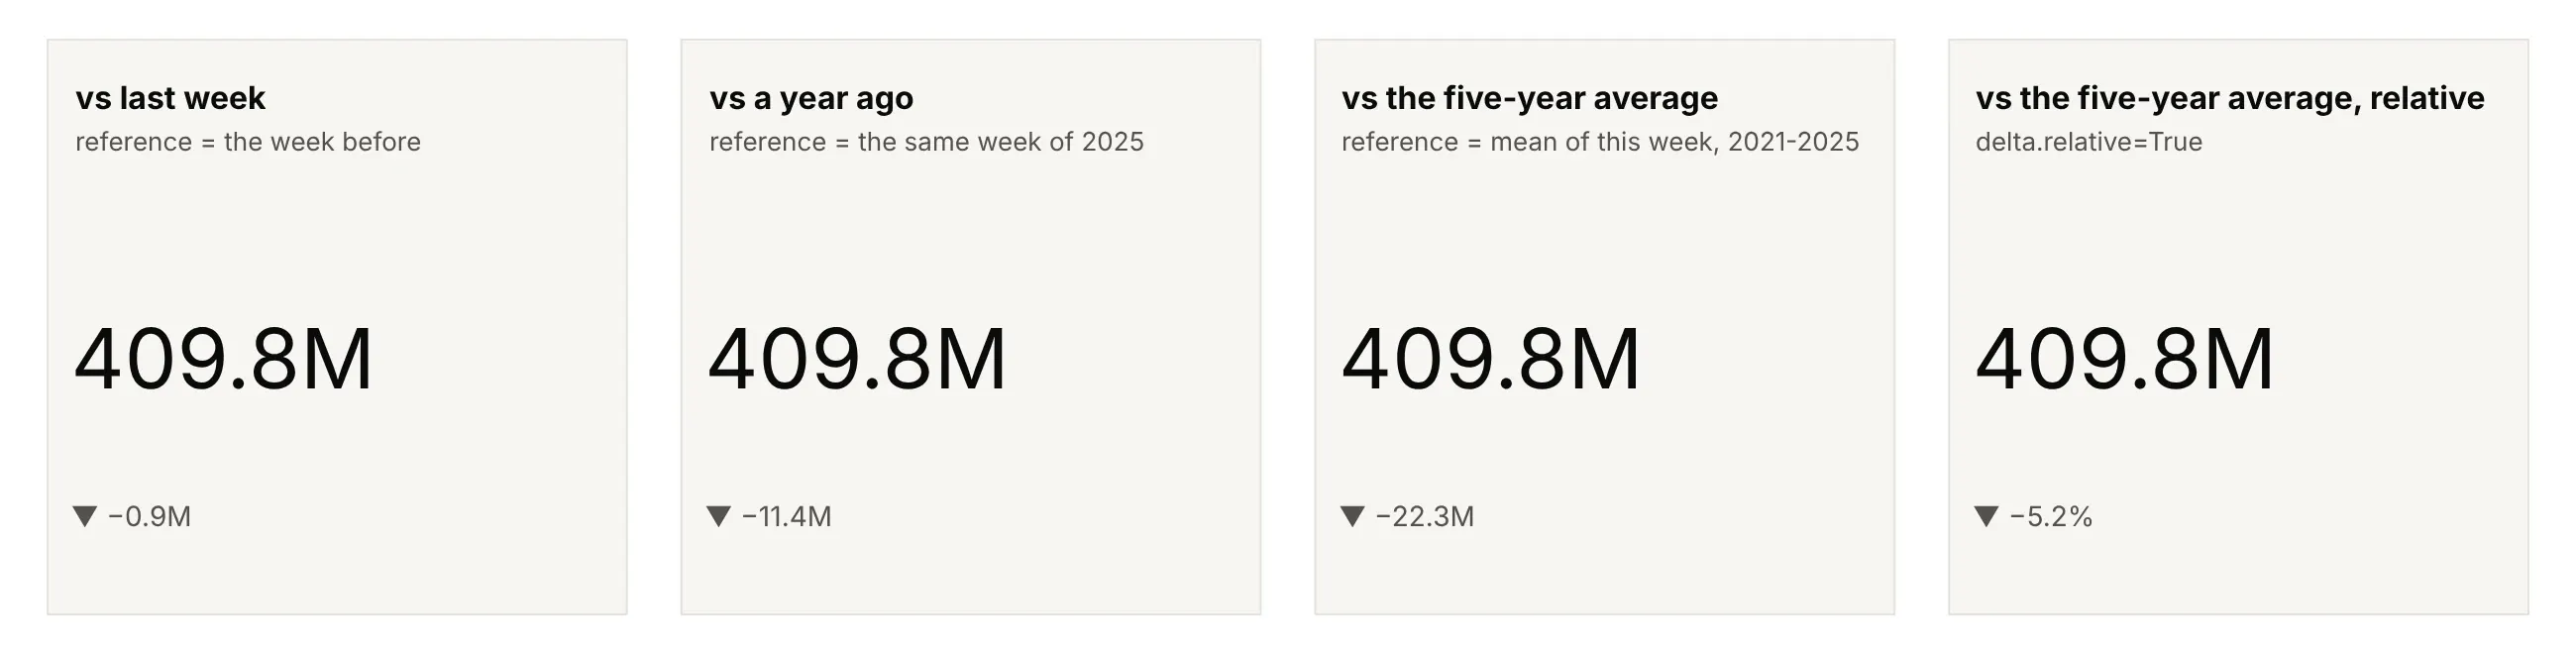
Data: EIA Weekly Petroleum Status Report, crude oil stocks excluding the SPR.
- The previous period (last week, yesterday, the previous close) answers "what just happened?" and is what news and trading desks quote: crude stocks fell 0.9 million barrels.
- The same period a year ago removes the seasons, which matters for anything seasonal: crude stocks are 11.4 million barrels lower than in the same week of 2025. The Mauna Loa carbon dioxide example below shows a month-over-month delta and a year-over-year delta pointing in opposite directions.
- A typical value such as the five-year average for the same week says whether the number is unusual. Here it says stocks are 22.3 million barrels, or 5.2%, below normal for early November.
- A target or a forecast says whether the plan held. The grid example compares each operator's peak with its own day-ahead forecast.
delta.relative=True divides the change by the reference, so with valueformat=".1%" the card shows -5.2% instead of -22.3M. Use relative deltas to compare cards with very different sizes, as in the market quotes, and absolute ones when the units carry the meaning, as with barrels or degrees. Whichever you choose, say what the delta compares with in delta.suffix, because a bare "-0.9" can mean any of these.
Increasing and decreasing colors, and when red isn't bad
By default Plotly colors a positive delta green with an up arrow and a negative delta red with a down arrow. That is right when up is good, as for approvals of new drugs or registrations of clinical trials, and wrong in three other cases:
- Up is bad. For a price that consumers pay, a cost, or a defect rate, reverse the colors with delta.increasing.color and delta.decreasing.color. The gasoline example below shows an 11.6-cent fall in green.
- Neither is good or bad. Inventories, interest rates, grid demand against a forecast, and most sensor readings move both ways for reasons the card can't judge. Use one neutral gray for both, or two neutral hues such as orange and blue, and keep the arrows (increasing.symbol, decreasing.symbol) to show the direction.
- The audience reads colors differently. Follow the convention of the people who read the cards, and never let color be the only signal: the arrow and the sign carry it too, which also helps readers with color vision deficiency.
Number formatting
A KPI card has room for about four to six characters, so the formatting is most of the design. Plotly's default for an indicator rounds to three significant digits, which looks tidy but can say the wrong thing:
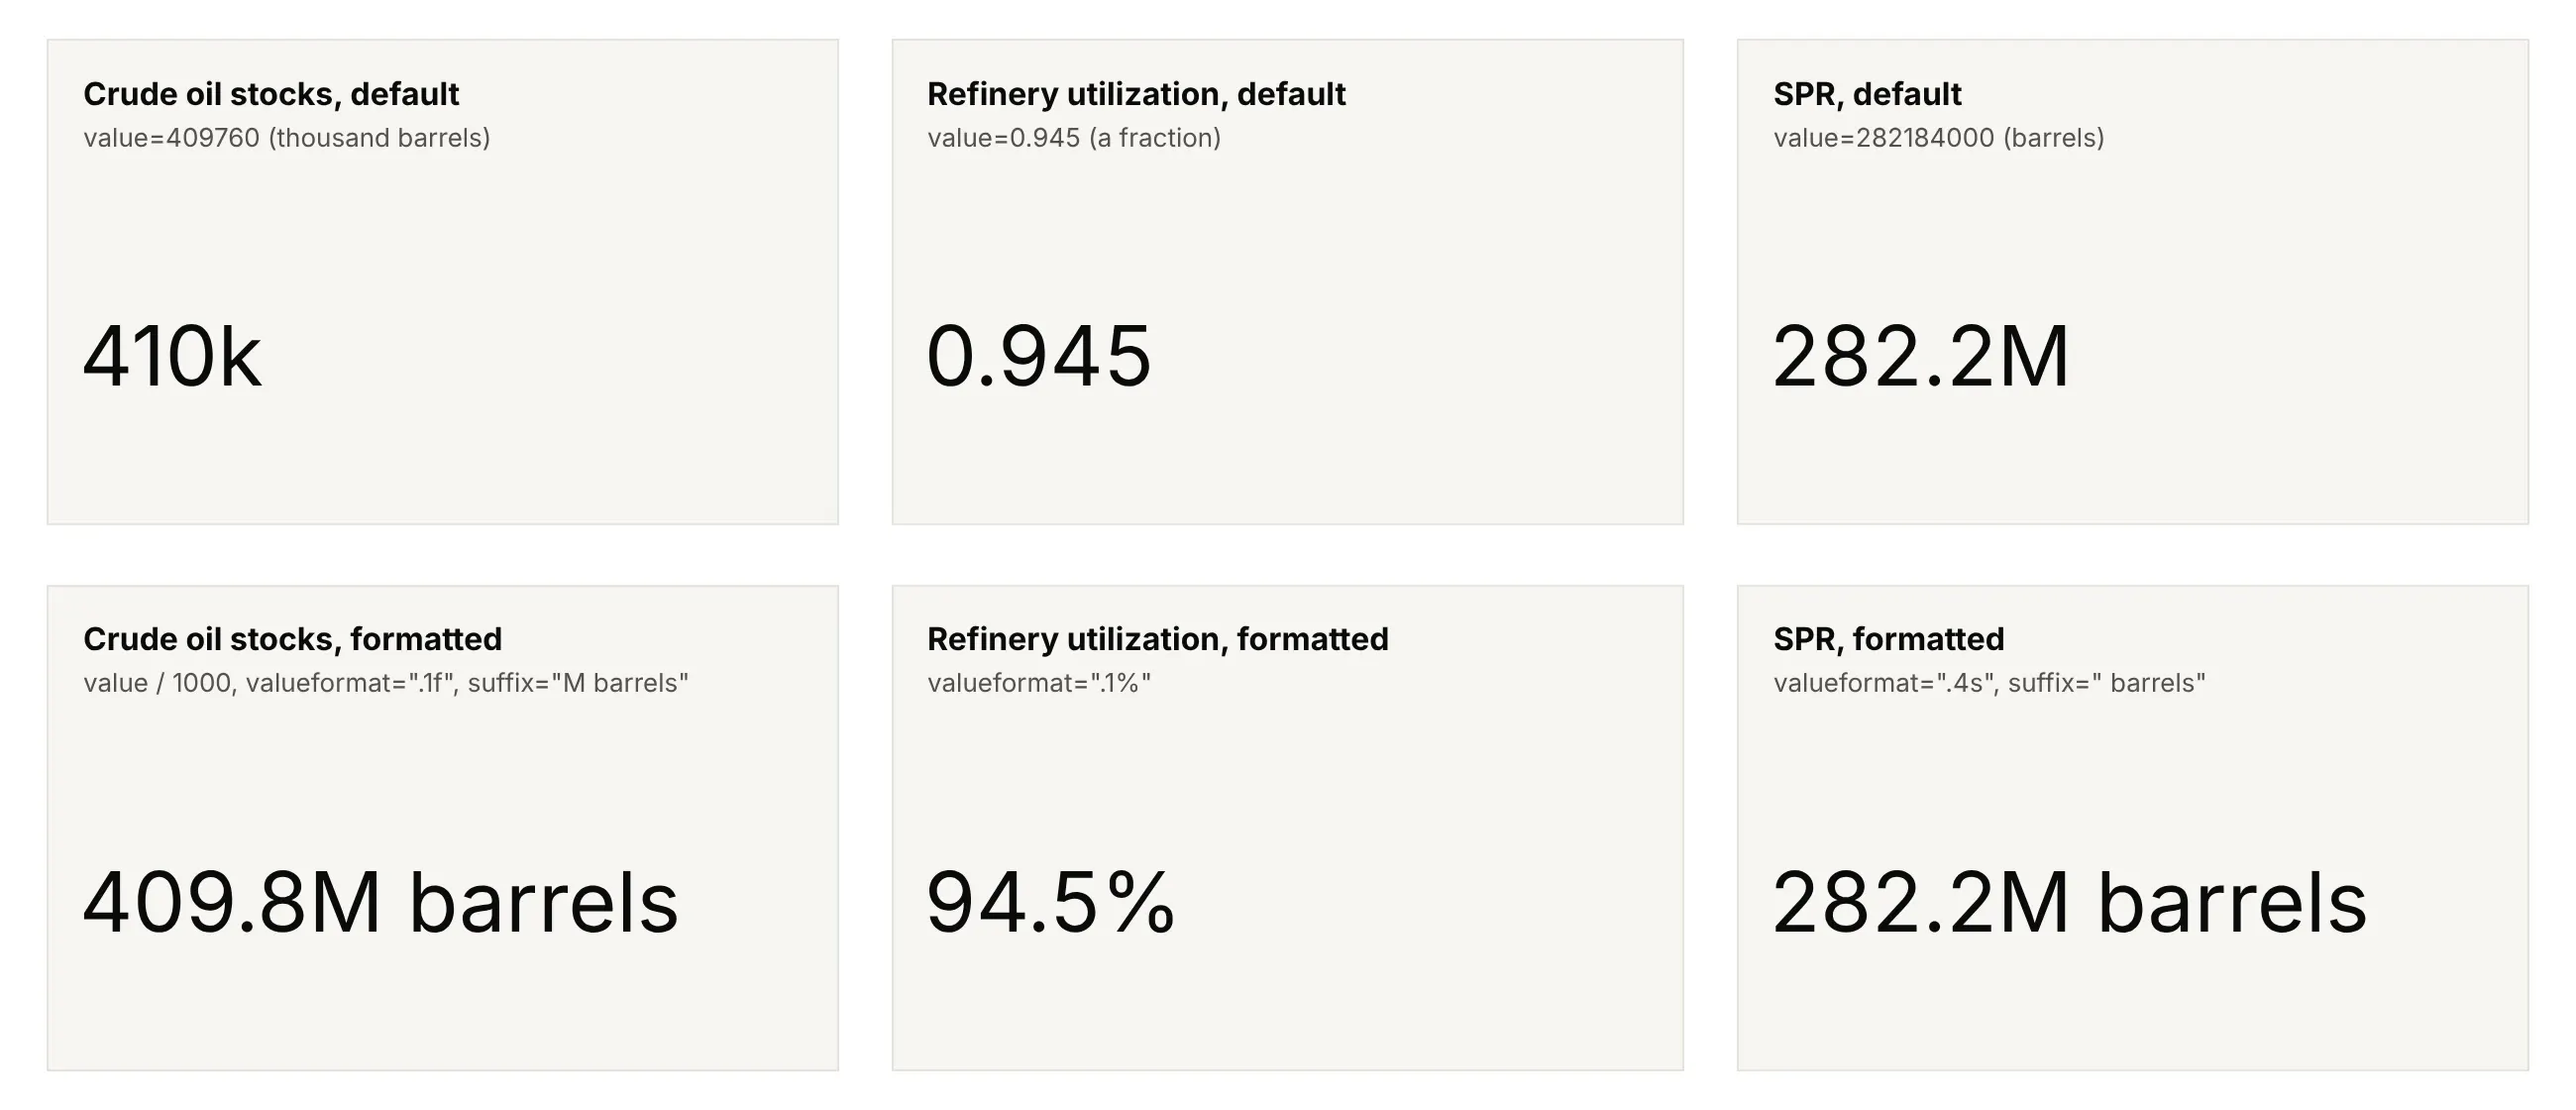
Data: EIA Weekly Petroleum Status Report, week ending October 30, 2026.
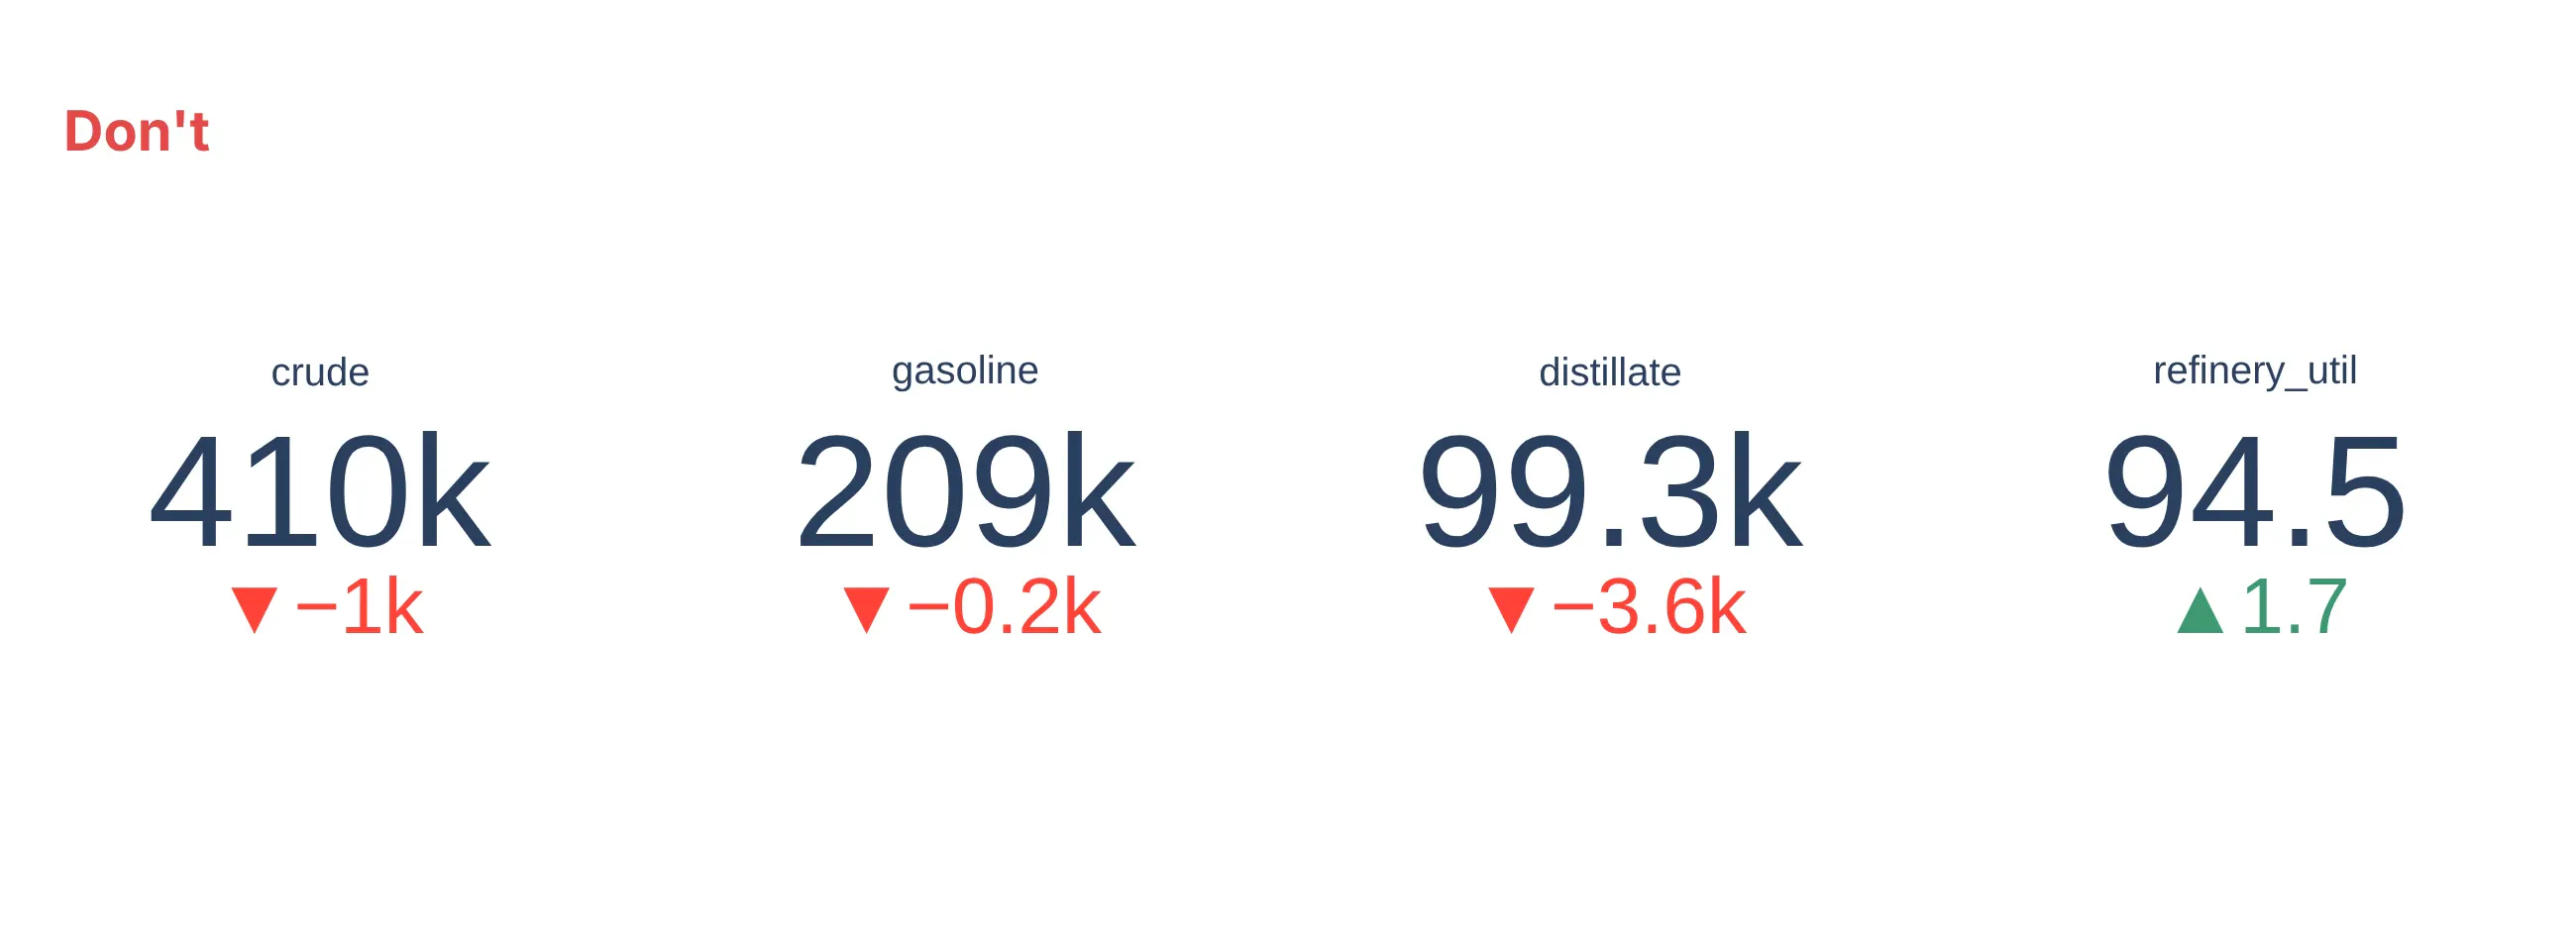
EIA publishes stocks in thousands of barrels, so the default "410k" is a thousand times too small for 410 million barrels, and nothing on the card says so. The fixes are all in number:
- valueformat takes a d3-format string: ",.0f" for 45,738, ".1f" for one decimal, ".1%" to turn 0.945 into 94.5%, ".3s" or "~s" for metric (SI, International System of Units) prefixes such as 45.7k and 282M.
- prefix and suffix add the currency and the units: prefix="$" for $4.15, suffix=" GW", suffix="M". A suffix is also how you write a range: the Fed funds card below uses prefix="3.75-" and suffix="%".
- Scale the value yourself when the unit isn't an SI step. d3's s format writes billions as "G" (giga), so for dollars divide by 1e9 and add suffix="B".
- Format the delta separately with delta.valueformat: "+.1f" shows the sign on increases too, and the delta can have its own units. To show a change in basis points or cents under a number in percent or dollars, draw a second indicator with mode="delta" and the value and reference multiplied by 100, as the interest rate and gasoline examples do.
Round only for display. Compute the delta from the full-precision values, because 409.760 - 410.625 is -0.865, which shows as -0.9, while the rounded 409.8 - 410.6 gives -0.8.
Sparklines next to the number
A sparkline is a small line chart without axes, sized to sit next to a number. Edward Tufte named them in 2006 for "small, high resolution graphics embedded in a context of words, numbers" (Wikipedia). On a card it answers the question the delta can't, which is whether this value is unusual. In Plotly, a sparkline is a go.Scatter on its own small x and y axes, with visible=False on both, placed under the indicator with domain.
Three details make them work. Give each sparkline its own y range, because the cards have different units, and say what period it covers, such as "last 52 weeks". Mark the latest point with a dot, so readers connect it to the big number. Use line_shape="hv" for values that change in steps, like a policy rate or a running count, and draw a reference such as last year or a forecast as a dotted gray line behind it.
When a single number beats a chart
A card is the better choice when the reader's question has a one-number answer and they already know the context: how much crude is in storage this week, how many drugs the FDA has approved this year, what the 10-year yield closed at. Readers check these numbers every day or week, and a card puts the answer where the eye lands first, at a size readable across a room or on a phone.
A chart is better when the question is about shape or comparison: how the value got here, whether it is seasonal, or which of 20 regions is highest. A card with a sparkline covers the middle ground, a number first and just enough history to judge it. If you find yourself adding axes, gridlines and labels to the sparkline, you need a line chart next to the cards, which is what the Dash app below does.
A short history
Stock exchanges posted prices on chalkboards, updated by clerks called board markers, and Edward A. Calahan's stock ticker, unveiled in New York on November 15, 1867, printed a stream of prices and changes onto paper tape (Wikipedia). In 1884 the Dow Jones company published the first stock market averages, single numbers that summarized a market (Wikipedia). In 2006 Stephen Few's Information Dashboard Design set out how to design screens full of such numbers, and Edward Tufte named the sparkline, the small trend line many cards now carry. Business intelligence tools each named their version (a scorecard in Looker Studio, a card in Power BI, a stat panel in Grafana), and Plotly added the indicator trace in plotly.js 1.49.0 on July 24, 2019. A quote board has no single original chart to redraw, so this guide doesn't recreate one.
Alternatives to a KPI card
Here's the same crude oil stocks reading drawn six ways. Some are better for the question, some worse, some just different:
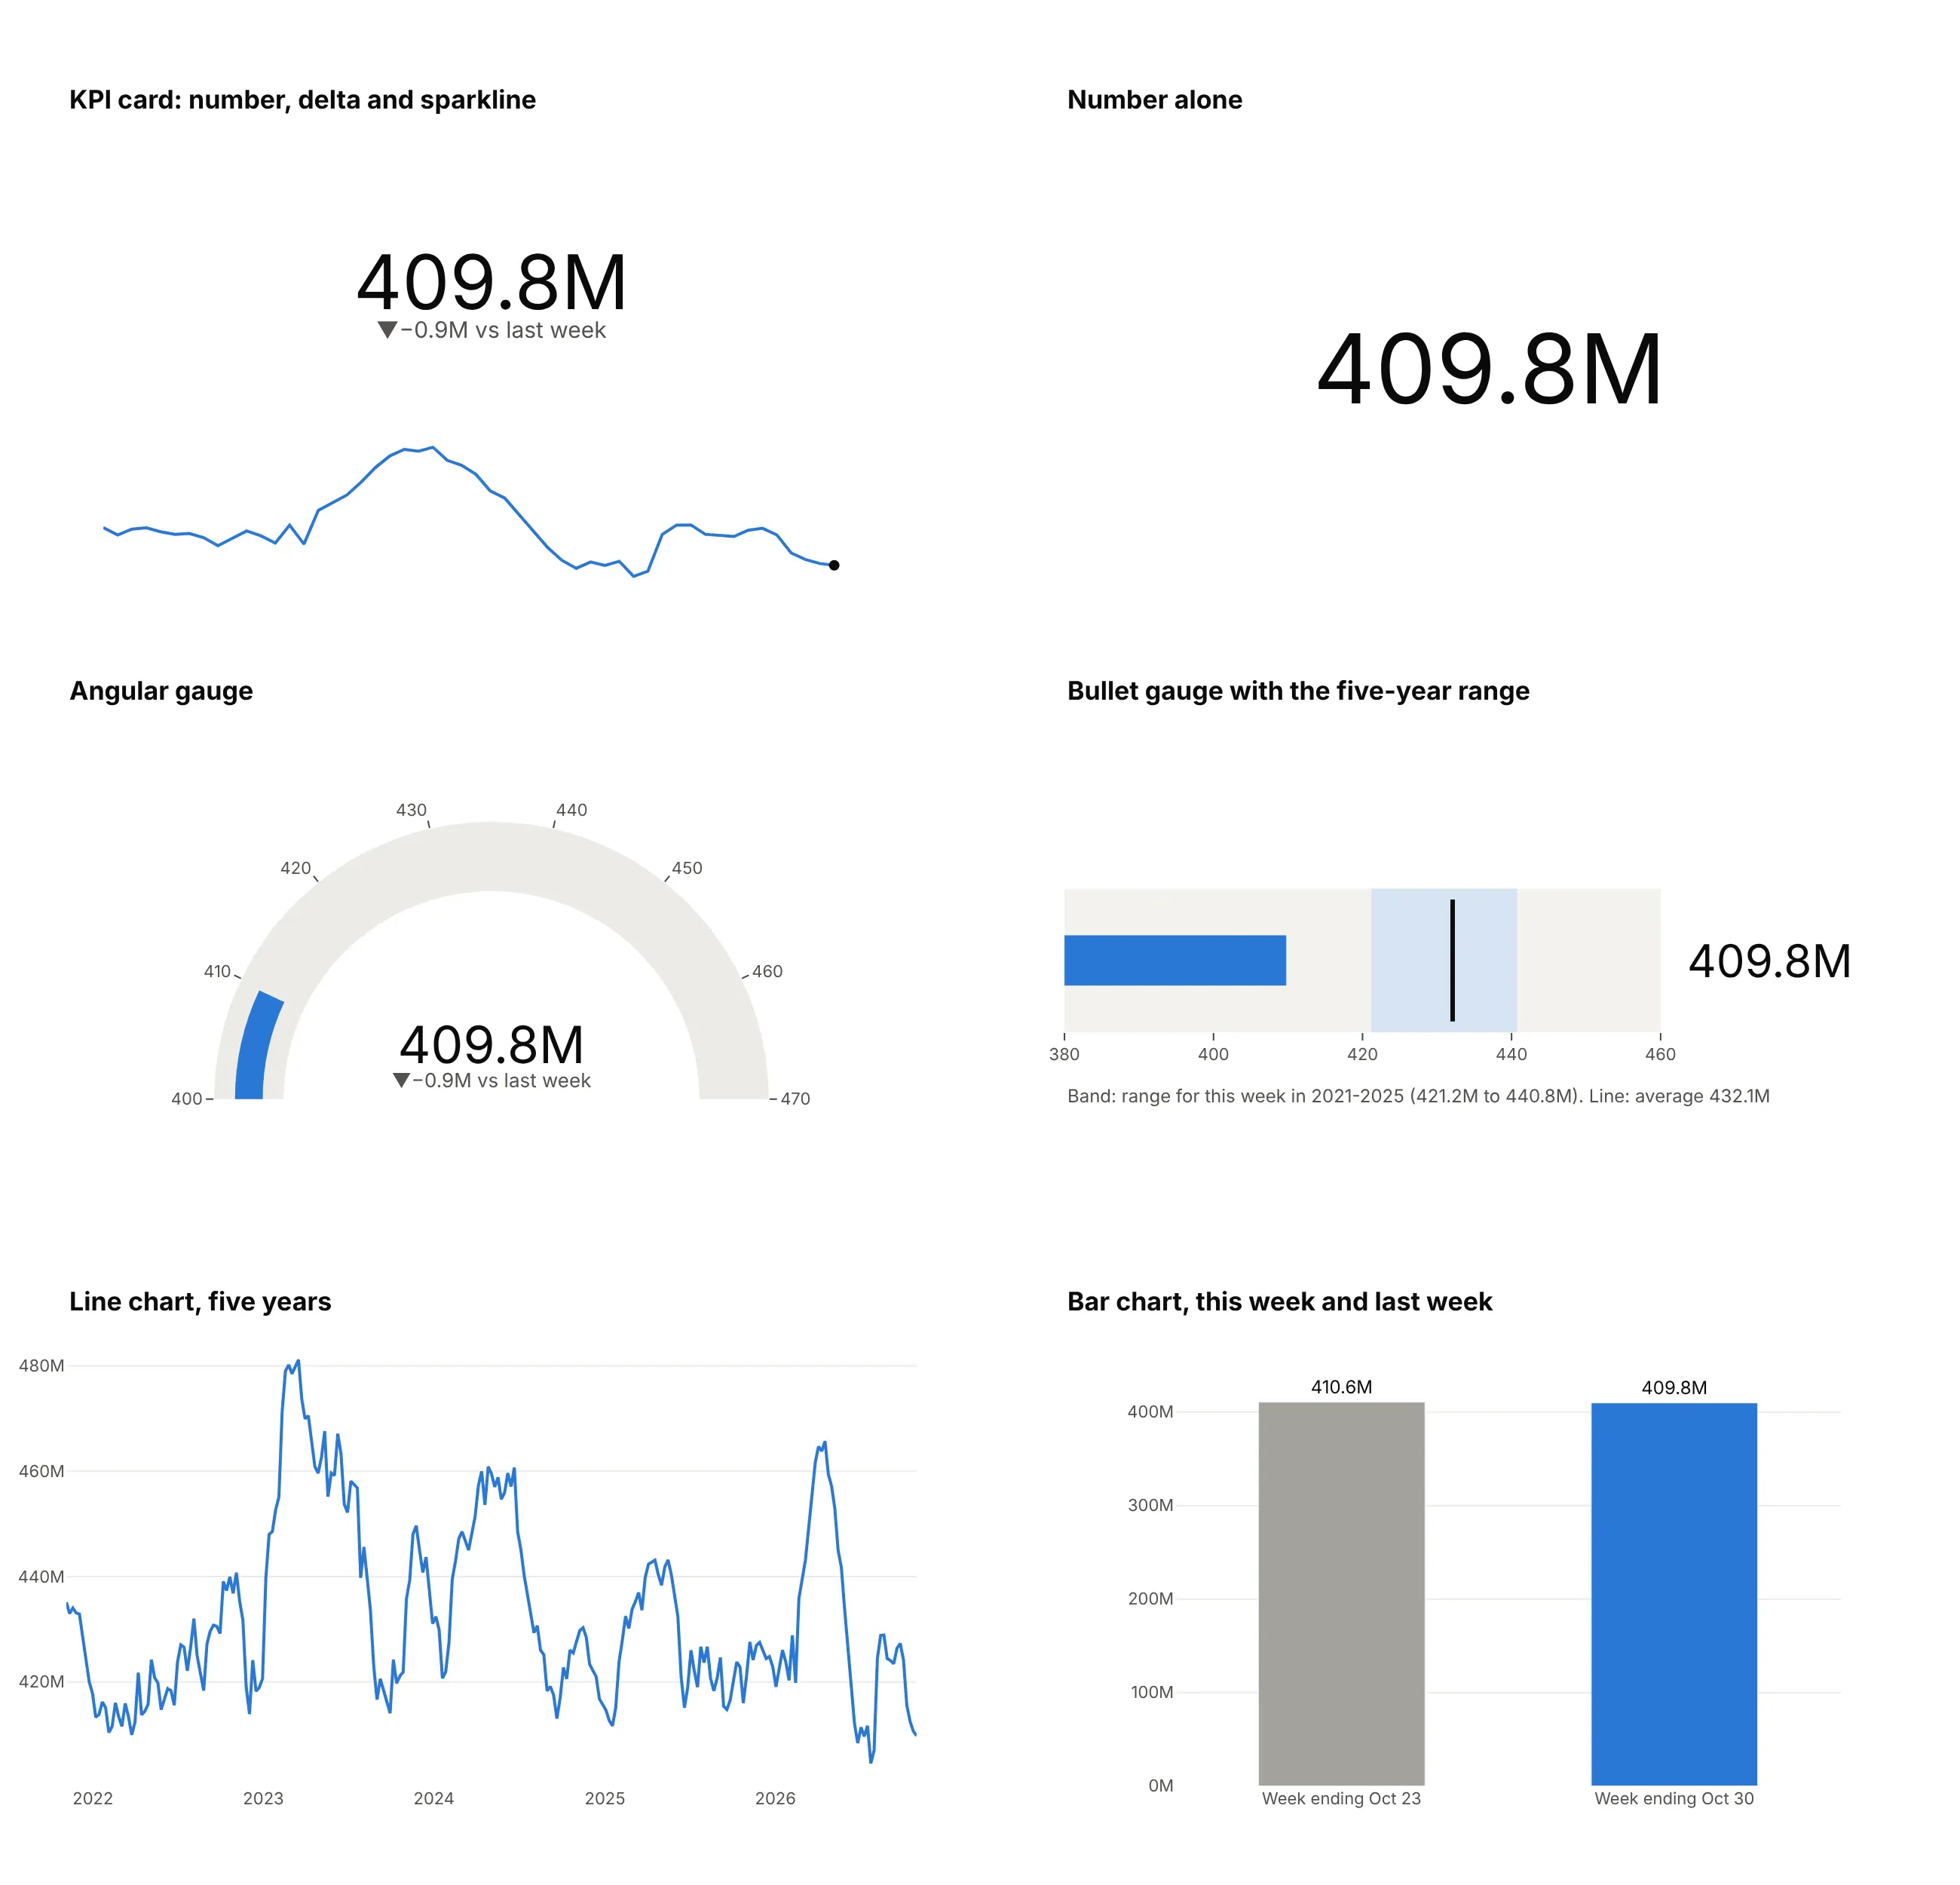
- Number alone (worse, unless the reader knows the context). It is the smallest possible display, and fine for a number people already track, but it can't say whether 409.8M is high, low, or changing.
- Gauge chart (worse here). Inventories have no natural maximum, so the dial's range from 400 to 470 is arbitrary, and the arc takes four times the space of a card. Gauges work when the scale is real, like a percentage of capacity.
- Bullet chart (better for "is this normal?"). The five-year range for the week as a band and the average as a line show at a glance that stocks are below anything seen in that week from 2021 to 2025. The SPR example below uses one against its capacity.
- Line chart (better for the history). Five years of weekly stocks show the seasonal swings and the 2023 peak, but the current value is the last pixel on the right and readers have to work out the number.
- Bar chart of this week and last week (worse). Bars must start at zero, so a 0.9-million-barrel change on 410 million is invisible; the delta says it in four characters.
How to make a KPI card
With AI
ChatGPT, Claude Code, GitHub Copilot, Cursor, and other AI tools are excellent at writing Plotly code. Name Plotly in the prompt, and say which reference the delta uses, what the colors mean, and how to format the numbers:
Make a row of plotly KPI cards from petroleum_status.csv (columns: date, series, value; weekly EIA data,series crude, gasoline, and distillate in thousand barrels and refinery_util in percent).- One go.Indicator per series with mode="number+delta", the latest week as the value and the week before asdelta.reference.- Stocks in million barrels with one decimal and an "M" suffix, utilization with a "%" suffix; deltas with asign and a suffix that says "vs last week".- Neutral gray deltas for both directions, because inventory changes aren't good or bad.- A 52-week sparkline (go.Scatter, no axes) under each number with a dot on the latest week.- Title with the week-ending date and the data source.
With Plotly Studio
Plotly Studio is a desktop app where you point an AI at a dataset and it builds charts and a Dash app around your questions. Ask for KPI cards the same way:
Show a row of KPI cards for the latest week of each series, each with the change from last week in gray, units, a 52-week sparkline, and a dropdown to compare with a year ago or the five-year average instead.
Make KPI cards in Python or JavaScript
This is the code AI tools write under the hood. A KPI card in Plotly is a go.Indicator trace, and a row of them with sparklines is a make_subplots grid with indicator cells on top and small line charts below:
import pandas as pdimport plotly.graph_objects as gofrom plotly.subplots import make_subplotsdf = pd.read_csv("petroleum_status.csv", parse_dates=["date"]) # date, series, value (EIA weekly)wide = df.pivot(index="date", columns="series", values="value").iloc[-52:] # the last 52 weekscards = [ # column, title, scale, number suffix, delta suffix("crude", "Crude oil stocks", 1e-3, "M", "M vs last week"),("gasoline", "Gasoline stocks", 1e-3, "M", "M vs last week"),("distillate", "Distillate stocks", 1e-3, "M", "M vs last week"),("refinery_util", "Refinery utilization", 1, "%", " pts vs last week"),]fig = make_subplots(rows=2, cols=4, row_heights=[0.7, 0.3], vertical_spacing=0.05,specs=[[{"type": "indicator"}] * 4, [{"type": "xy"}] * 4])for i, (col, title, scale, suffix, delta_suffix) in enumerate(cards, start=1):s = wide[col] * scalefig.add_trace(go.Indicator(mode="number+delta", value=s.iloc[-1], title=dict(text=title),number=dict(valueformat=".1f", suffix=suffix),delta=dict(reference=s.iloc[-2], valueformat="+.1f", suffix=delta_suffix, position="bottom",increasing=dict(color="gray"), decreasing=dict(color="gray")),), row=1, col=i)fig.add_trace(go.Scatter(x=s.index, y=s, mode="lines", line_color="#2a78d6"), row=2, col=i)fig.update_xaxes(visible=False)fig.update_yaxes(visible=False)fig.update_layout(showlegend=False, height=380, template="simple_white")fig.show()
For the card backgrounds, left-aligned numbers, and labeled sparklines in this guide's images, the folder's make_kpi_cards.py places each indicator and sparkline by domain and draws a rectangle shape behind each card. A single card is just the go.Indicator call with domain=dict(x=[0, 1], y=[0, 1]).
In JavaScript, plotly.js draws a card with an indicator trace and a scatter trace on a small axis:
<div id="kpi"></div><script src="https://cdn.plot.ly/plotly-4.1.1.min.js"></script><script>// US commercial crude oil stocks, million barrels, last 8 weeks to October 30, 2026 (EIA, series WCESTUS1)const weeks = ["2026-09-11", "2026-09-18", "2026-09-25", "2026-10-02", "2026-10-09", "2026-10-16", "2026-10-23", "2026-10-30"];const crude = [423.429, 426.398, 427.320, 424.134, 415.577, 412.517, 410.625, 409.760];const last = crude[crude.length - 1], prev = crude[crude.length - 2];Plotly.newPlot("kpi", [{type: "indicator", mode: "number+delta", value: last, domain: {x: [0, 1], y: [0.4, 1]},title: {text: "Crude oil stocks, excluding the SPR"},number: {valueformat: ".1f", suffix: "M"},delta: {reference: prev, valueformat: "+.1f", suffix: "M vs last week", position: "bottom",increasing: {color: "gray"}, decreasing: {color: "gray"}}},{type: "scatter", mode: "lines", x: weeks, y: crude, line: {color: "#2a78d6"}}], {width: 420, height: 300, showlegend: false, margin: {l: 20, r: 20, t: 30, b: 10},xaxis: {domain: [0.1, 0.9], visible: false}, yaxis: {domain: [0, 0.3], visible: false}});</script>
A KPI row in a Dash app
In a data app, the cards usually sit in a row across the top, with the detail below. In Dash, make each card its own dcc.Graph holding one indicator figure, and lay the row out with a CSS grid, so the cards wrap to two columns and then one on a phone. A callback can then change every card at once:
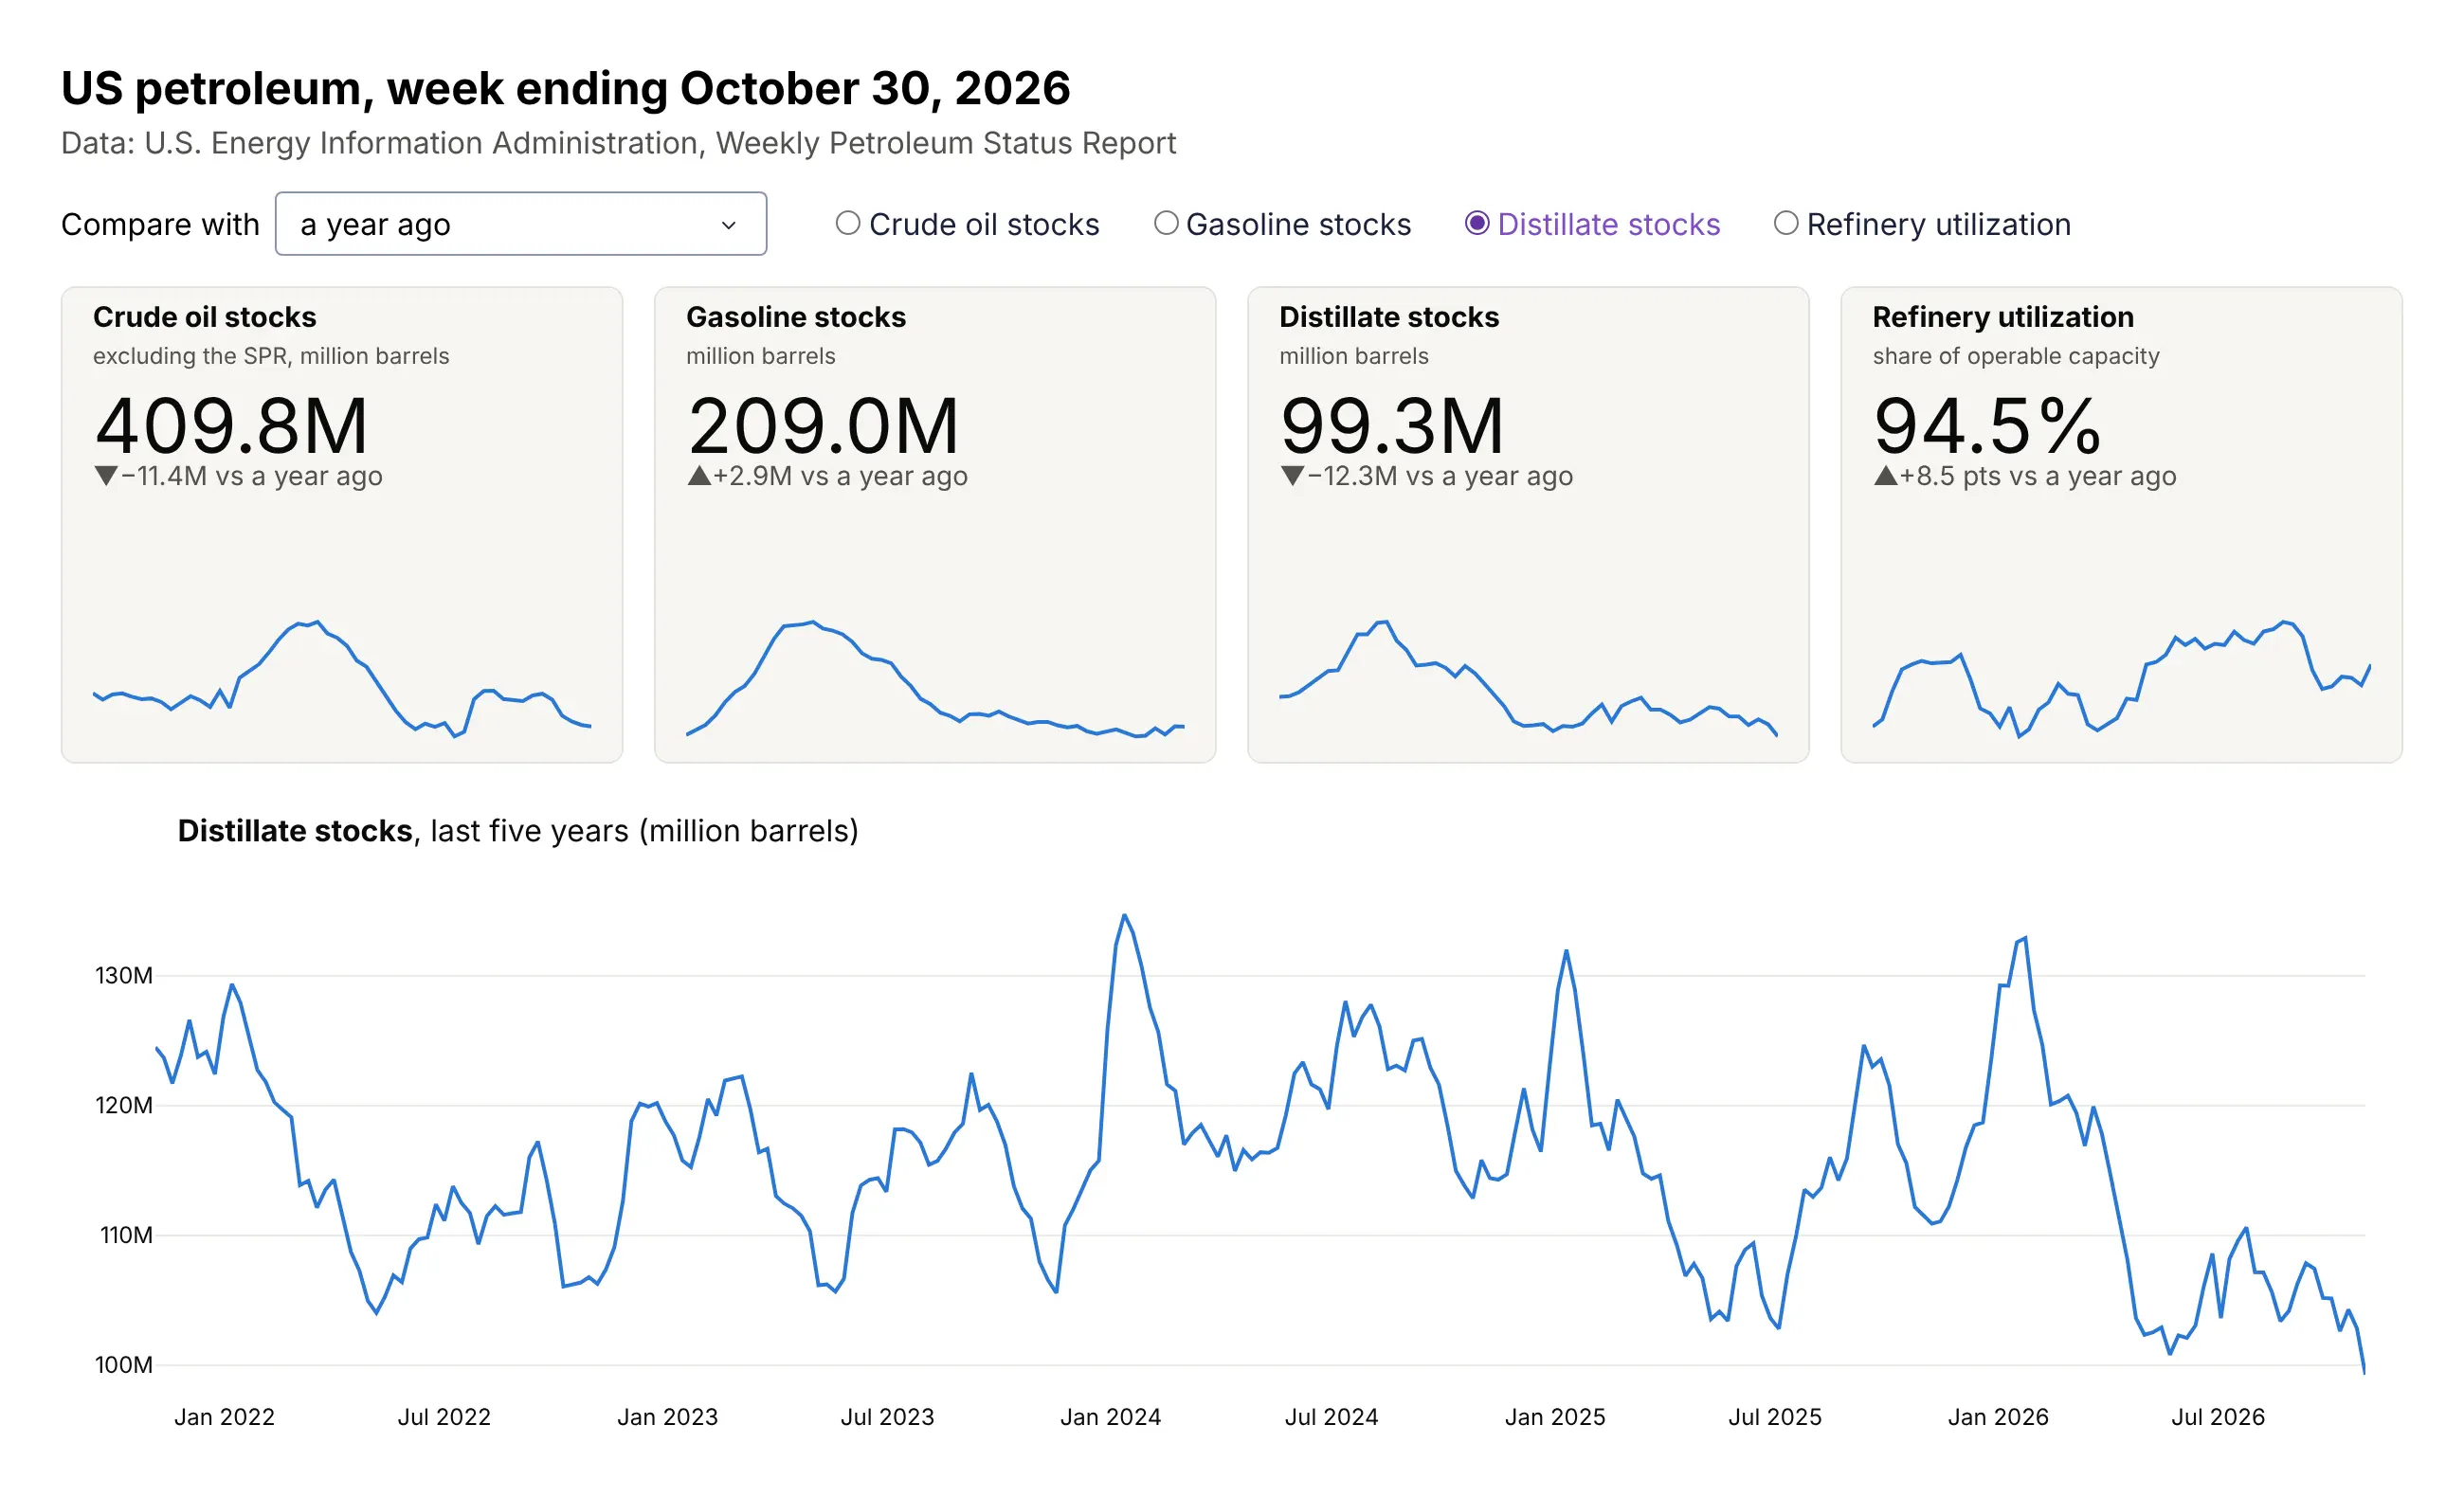
Data: EIA Weekly Petroleum Status Report. The app is dash_app/app.py in this guide's folder, run locally.
from dash import Dash, Input, Output, dcc, htmlapp = Dash(__name__)app.layout = html.Div([dcc.Dropdown(id="ref", options=["last week", "a year ago", "the 2021-2025 average"], value="last week"),# The KPI row: four cards that wrap on narrow screenshtml.Div(id="cards", style={"display": "grid", "gap": "16px","gridTemplateColumns": "repeat(auto-fit, minmax(260px, 1fr))"}),dcc.Graph(id="line"),])@app.callback(Output("cards", "children"), Input("ref", "value"))def update_cards(ref):# card_figure() returns a go.Figure with one go.Indicator and a sparkline, as in the Python examplereturn [dcc.Graph(figure=card_figure(series, ref), config={"displayModeBar": False})for series in ["crude", "gasoline", "distillate", "refinery_util"]]
Set each card figure's height (250 px here) and hide the mode bar, so the row looks like cards and not like four charts. If the numbers must update while the page is open, add a dcc.Interval as a second input to the callback.
Share it
Every Plotly chart has a Share chart button (the cloud icon in its toolbar) that uploads it to Plotly Cloud and gives you a link. Only you can see it until you change its visibility.
For a live app, put the chart in a Dash app and publish it with the Plotly Cloud CLI. Coding agents can run these commands for you:
pip install "dash[cloud]"plotly user loginplotly app publish
If your data has to stay in your own cloud or data center, publish to Dash Enterprise instead.
Dos and don'ts
Most of the work in a KPI card is the formatting and the labels around the number. Here are the four petroleum numbers both ways.
Don't leave the values in the source's units with Plotly's default formatting (EIA's thousand barrels show as "410k", a thousand times too small), leave out the units, the date and what the delta compares with, show refinery utilization without a % sign, use the raw column names as titles, or keep the default green and red, which calls every inventory build good and every draw bad:
Do scale the values to the unit people use, put the units and the date in the label, say what the delta compares with, use neutral colors when the direction isn't good or bad, and add a sparkline so readers can judge the number:
Checklist
Do
- Put the units and the as-of date on every card, and say what the delta compares with.
- Pick the reference on purpose: the previous period for news, the same period last year for seasonal data, and a target or forecast for performance.
- Color deltas by what the change means for the reader, and use neutral colors when it means nothing by itself.
- Format numbers to four to six characters and the precision the decision needs, and compute deltas before rounding.
- Keep every card in a row the same size, with the same font sizes and the same sparkline period.
Don't
- Show a year-to-date number against last year's full-year total.
- Let Plotly's automatic rounding hide a unit, as "410k" does for 410 million barrels.
- Fill an app or a report with dozens of cards; past about eight, a table or a chart compares them better.
- Rely on color alone; keep the arrow and the sign.
Options to customize
These are the options that matter most for a KPI card. The full list is in the indicator trace reference and the indicator tutorial.
- mode: "number", "number+delta", "delta", or with "+gauge" a dial or a bullet bar.
- number.valueformat: a d3-format string such as ",.0f", ".1f", ".1%" or "~s"; leave it empty and Plotly rounds to three significant digits.
- number.prefix and number.suffix: currency signs, units, or the first half of a range.
- number.font.size: set it, so every card in a row uses the same size instead of fitting its own domain.
- delta.reference: the value the delta compares with: last period, a year ago, a target, or a forecast.
- delta.relative: True shows the change as a share of the reference; pair it with delta.valueformat=".1%".
- delta.valueformat, delta.prefix and delta.suffix: the sign, the precision, and a label such as "vs last week".
- delta.increasing.color, delta.decreasing.color and their symbol: reverse or neutralize the default green and red, and change the arrows.
- delta.position: "bottom", "right", "left", or "top" relative to the number.
- title.text and align: the label above the number, and left, center, or right alignment of number and delta.
- domain: where the indicator sits in the figure, which is how you build a grid of cards and leave room for a sparkline; make_subplots(specs=[[{"type": "indicator"}]]) does the same on a grid.
- go.Scatter on its own axes with visible=False, line_shape="hv", and a marker on the last point: the sparkline.
More KPI card examples
Six more KPI cards built from real public data, each with its source, the technique that makes it work, and a prompt to rebuild it.
1. Interest rates: basis points and a target range
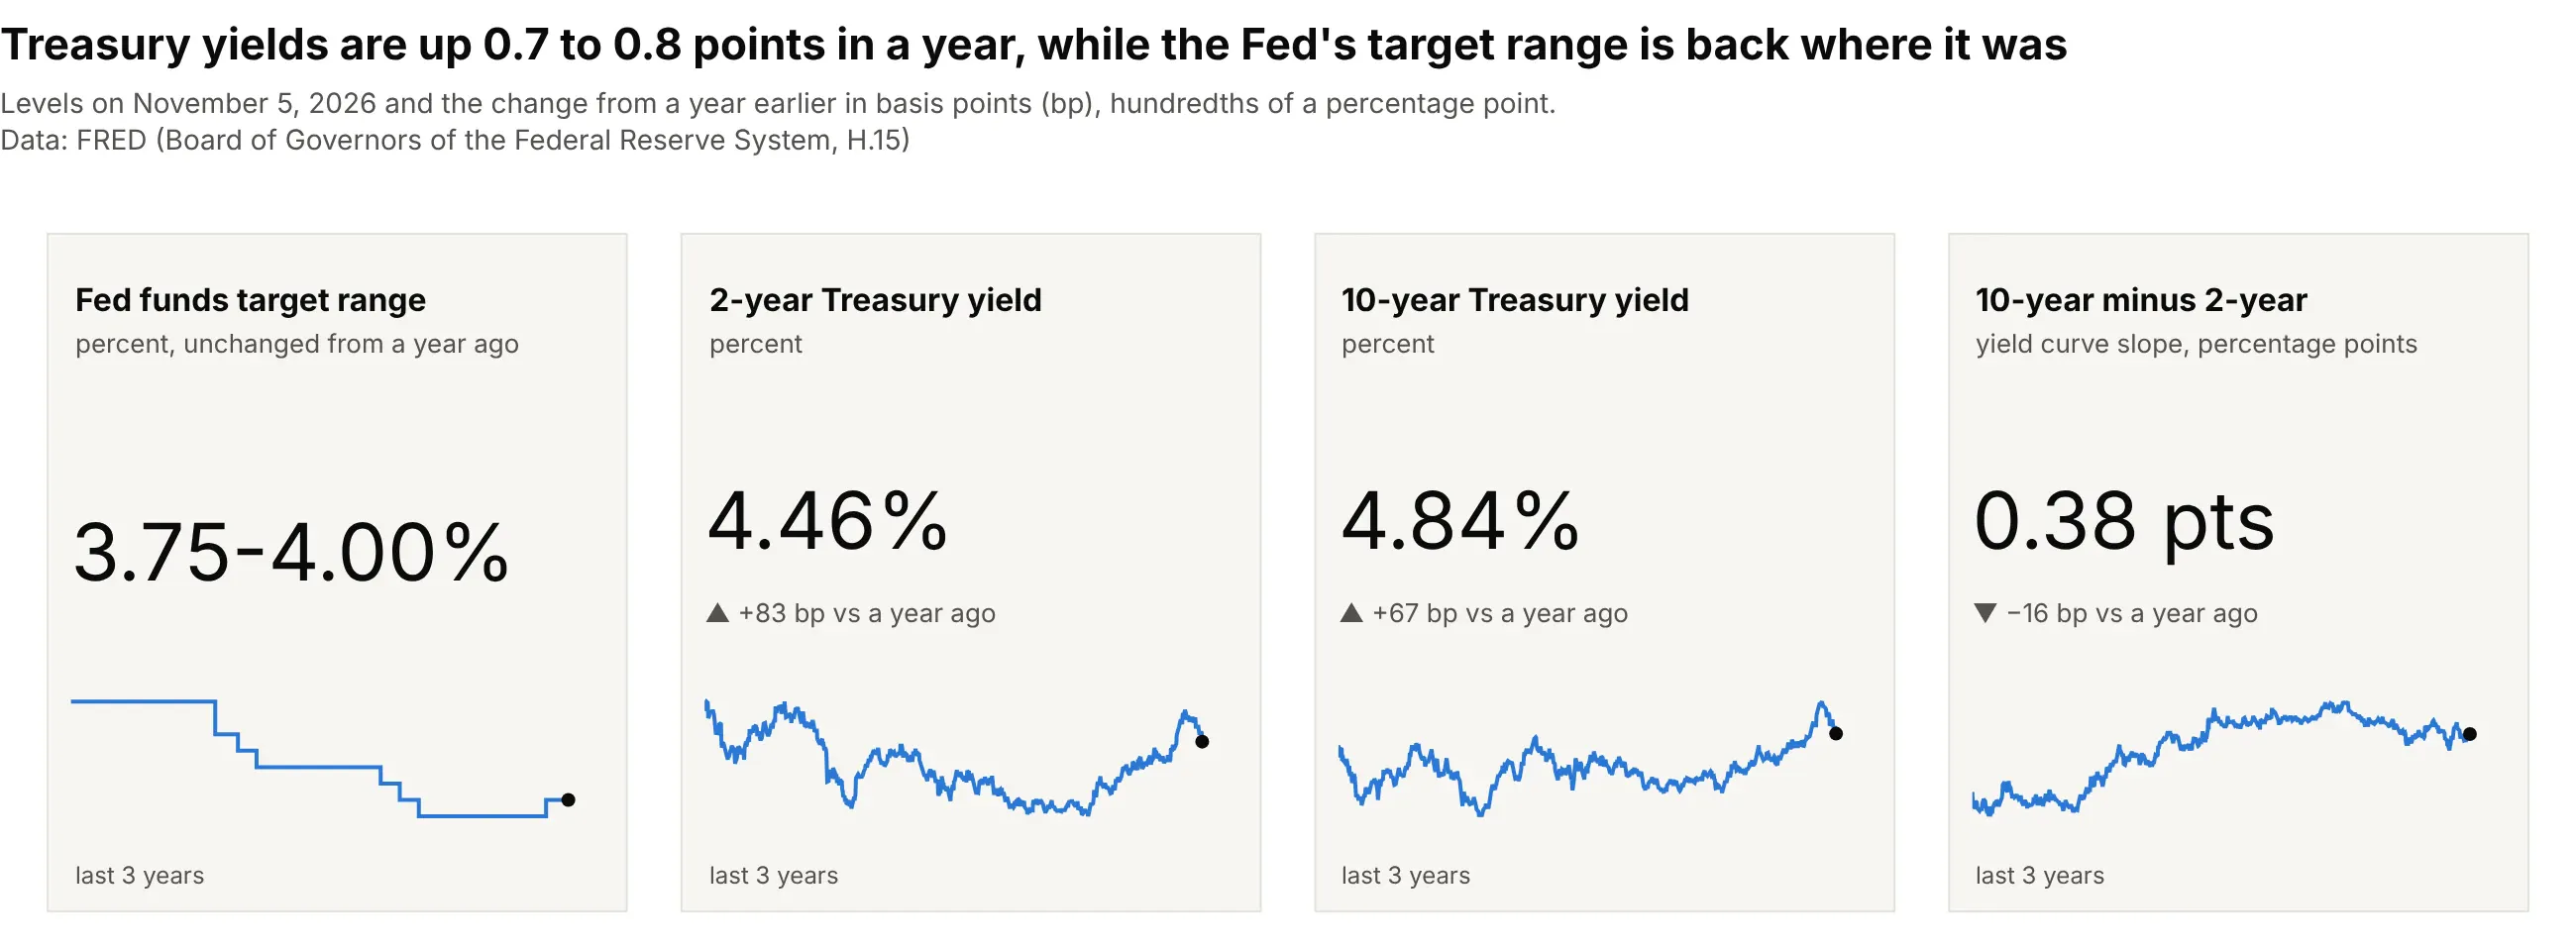
The 2-year Treasury yield is 83 basis points higher than a year ago, while the Fed funds target range is back at 3.75% to 4.00% after a cut in December 2025 and a hike in September 2026. Rate desks quote changes in basis points, so each delta is a second, delta-only indicator with the values multiplied by 100. Data: FRED, series DFEDTARL, DFEDTARU, DGS2, and DGS10 (Board of Governors of the Federal Reserve System).
Tip: write a range as one number with number.prefix="3.75-", and draw policy rates as step lines with line_shape="hv".
Get the data from FRED (Federal Reserve Economic Data, fred.stlouisfed.org), series DFEDTARL and DFEDTARU (Fedfunds target range) and DGS2 and DGS10 (Treasury yields), daily from 2023 (columns: date, series, value).Build four plotly KPI cards for the latest date: each rate in percent with two decimals, the change from a yearearlier in basis points in gray, and a three-year sparkline, stepped for the Fed funds range.
2. Gasoline prices: when falling is green
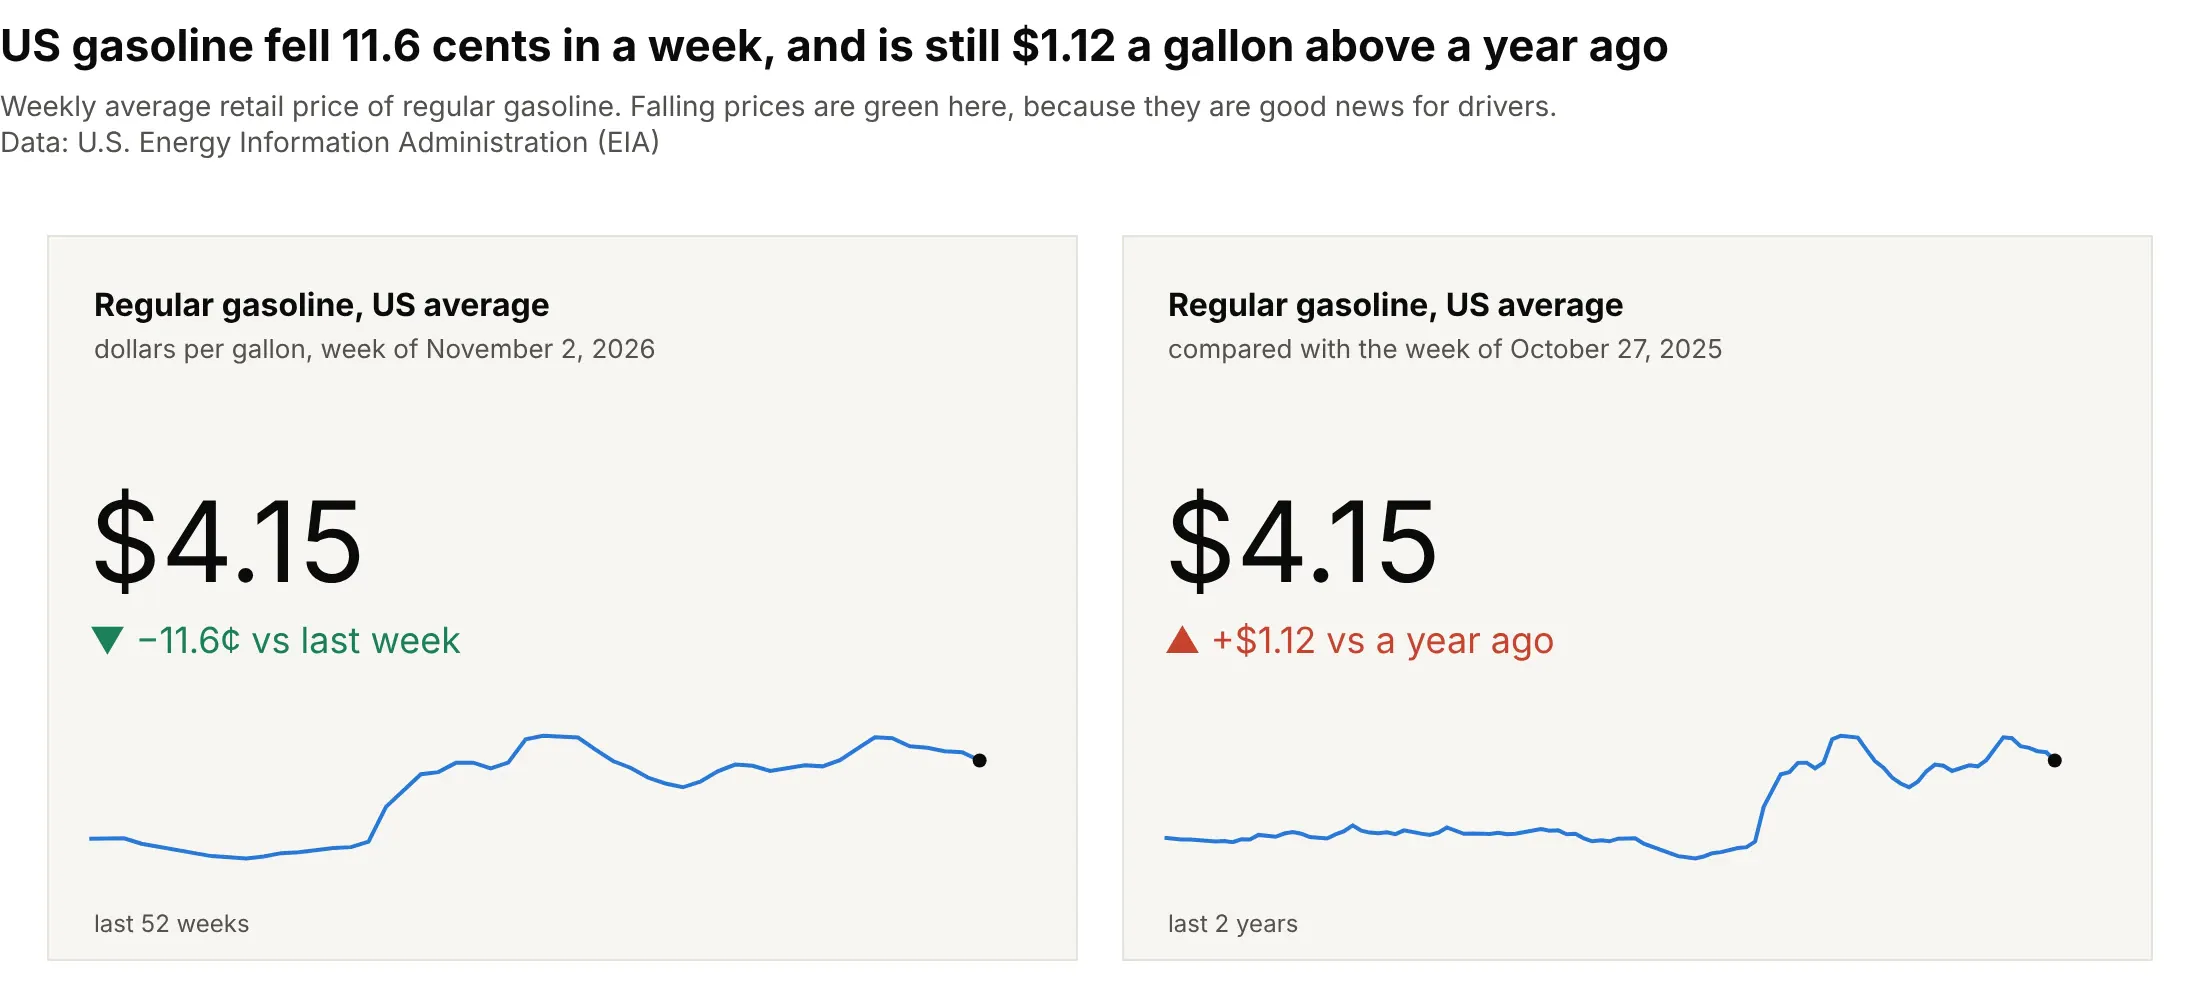
The average US gallon of regular fell 11.6 cents in a week to $4.15 but is $1.12 more than a year earlier. For drivers a falling price is good news, so these cards reverse Plotly's default colors, and two cards with the same number show the short-term and long-term stories. Data: EIA, Gasoline and Diesel Fuel Update, U.S. regular all formulations retail price.
Tip: set delta.increasing.color to red and delta.decreasing.color to green when up is bad for your reader.
Get the data from EIA's Gasoline and Diesel Fuel Update (eia.gov, series EMM_EPMR_PTE_NUS_DPG, weekly US averageretail price of regular gasoline in dollars per gallon) (columns: date, price).Build two plotly KPI cards with the latest price as "$4.15": one with the change from last week in cents and onewith the change from a year ago in dollars, decreases green and increases red, each with a sparkline.
3. Carbon dioxide at Mauna Loa: two references, two answers
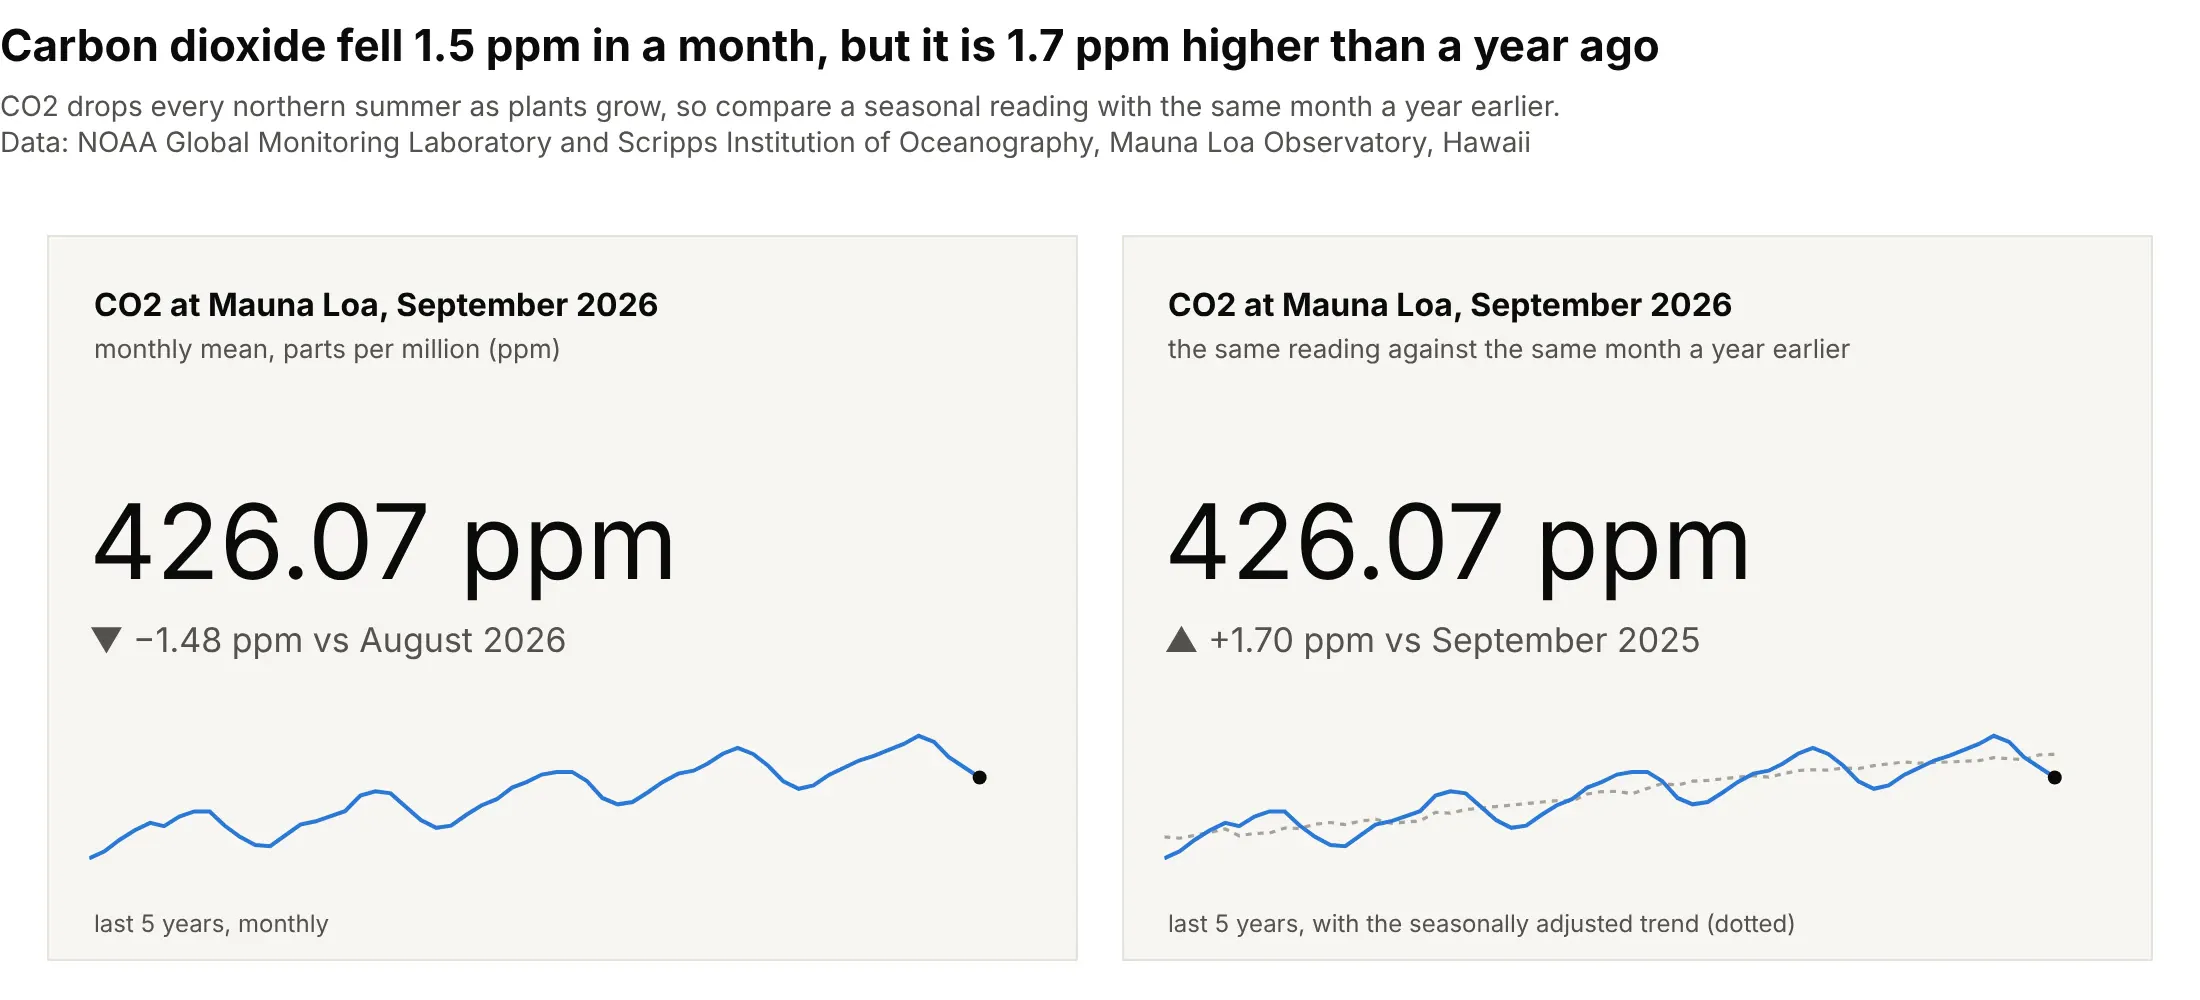
Carbon dioxide (CO2) at Mauna Loa fell 1.48 parts per million (ppm) from August to September 2026, because plants in the northern hemisphere draw it down every summer, and rose 1.70 ppm from September 2025. Only the year-over-year delta measures the trend. Data: NOAA (US National Oceanic and Atmospheric Administration) Global Monitoring Laboratory and Scripps Institution of Oceanography, monthly mean CO2 at Mauna Loa Observatory.
Tip: for seasonal data, compare with the same month a year earlier, and let the sparkline show the season.
Get the data from NOAA's Global Monitoring Laboratory (gml.noaa.gov, co2_mm_mlo.csv, monthly mean CO2 at MaunaLoa in ppm, with a deseasonalized column) (columns: date, co2_ppm, deseasonalized_ppm).Build two plotly KPI cards for the latest month in ppm with two decimals, one against the previous month andone against the same month a year earlier, gray deltas, and five-year sparklines with the deseasonalized trenddotted on the second.
4. A sensor station: four instruments on one buoy
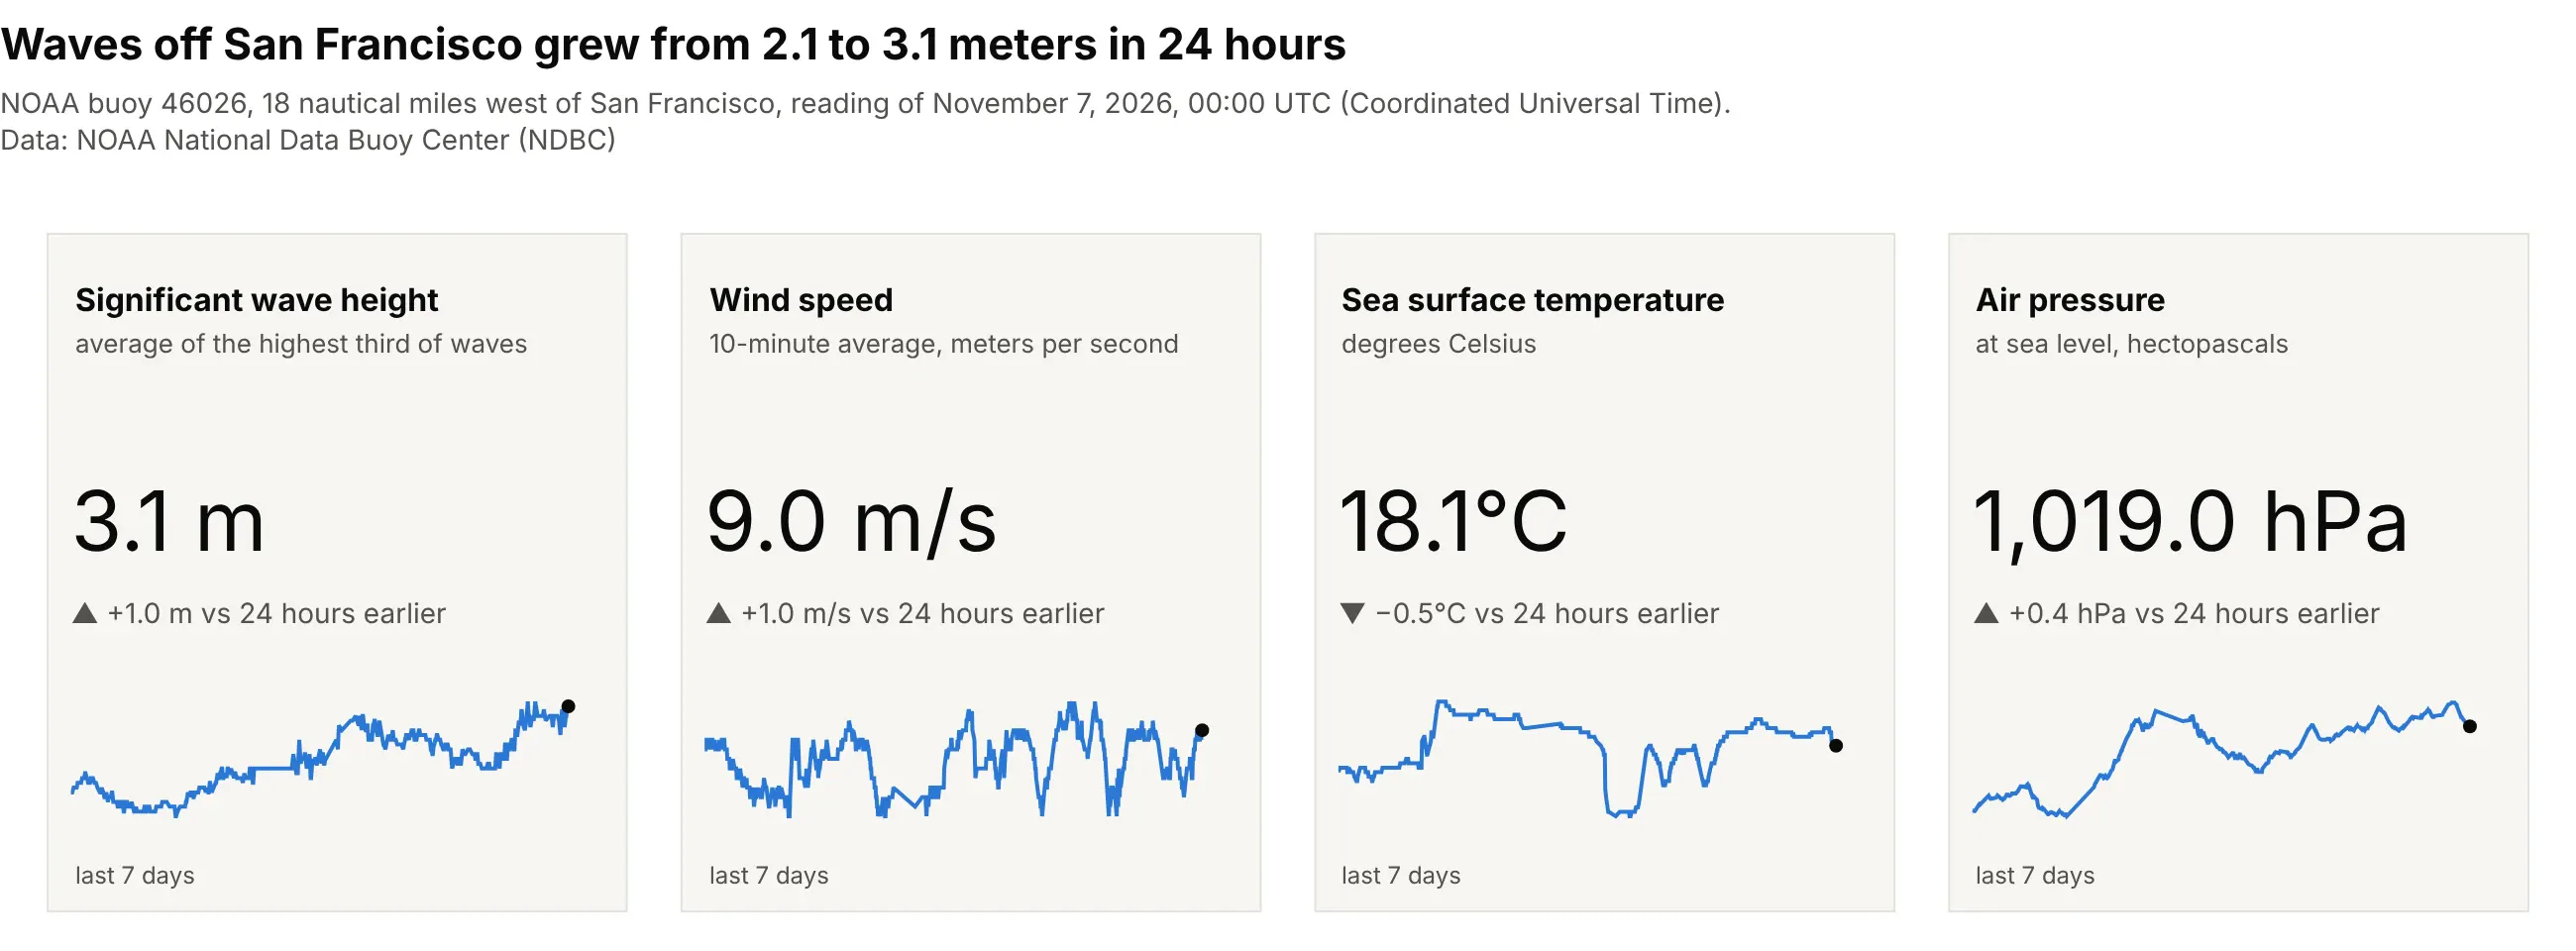
Waves at the buoy 18 nautical miles west of San Francisco grew from 2.1 to 3.1 meters in 24 hours. The same layout works for any instrument with several sensors, a test bench, or a plant historian, because each card has its own units and precision. Data: NOAA National Data Buoy Center (NDBC), station 46026, real-time standard meteorological data (times in Coordinated Universal Time, UTC).
Tip: compare live readings with the same time yesterday, so daily cycles don't show up as changes.
Get the data from NOAA's National Data Buoy Center (ndbc.noaa.gov, realtime2/46026.txt, readings every 10 to 30minutes with MM for missing) (columns: time_utc, wave_height_m, wind_speed_ms, water_temp_c, pressure_hpa).Build four plotly KPI cards for the latest time with all four readings, each with its units, the change from 24hours earlier in gray, and a seven-day sparkline that skips missing values.
5. The Strategic Petroleum Reserve against its capacity
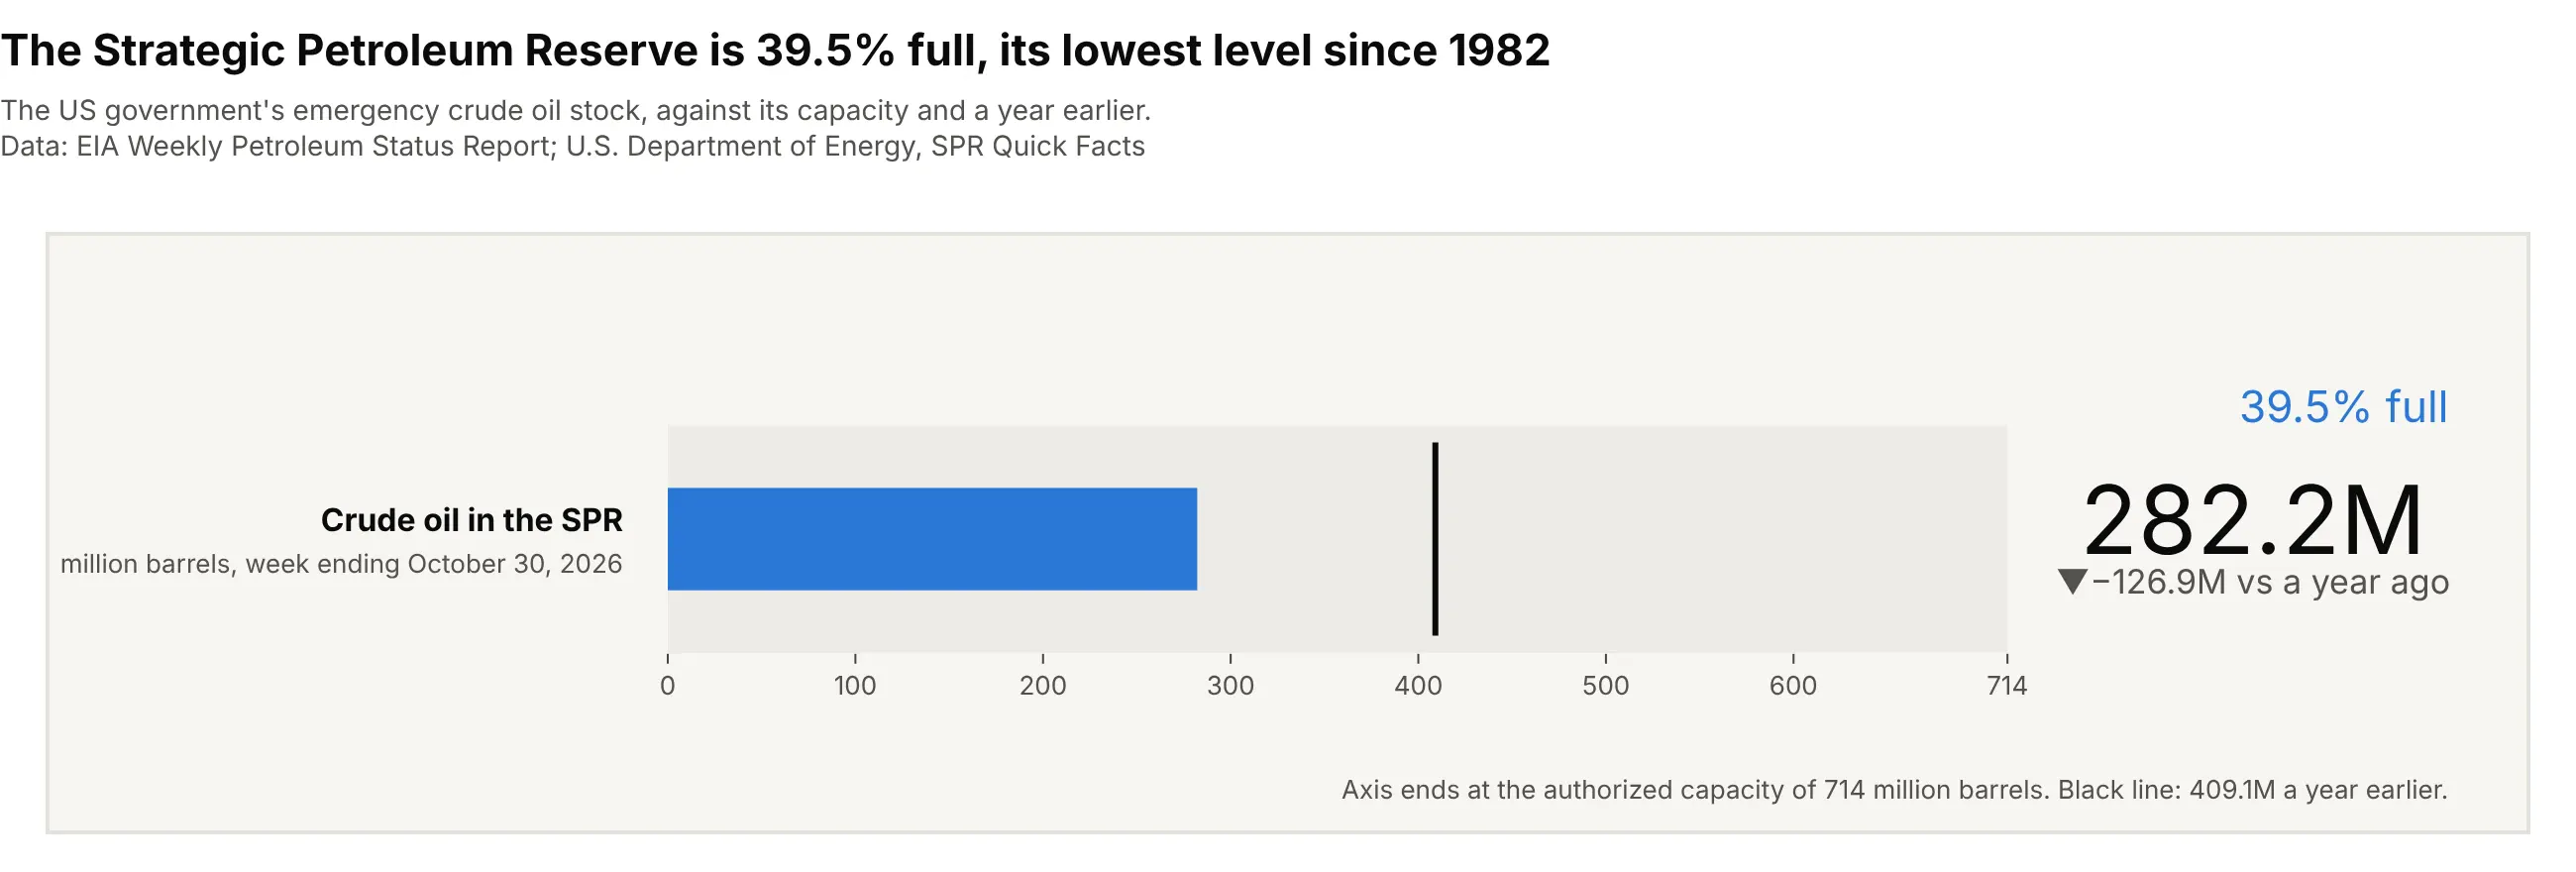
The SPR, the US government's emergency crude oil stock, held 282.2 million barrels, 39.5% of its 714-million-barrel authorized capacity and the lowest level since October 1982. A capacity gives the number a natural scale, which is when mode="number+delta+gauge" with a bullet bar earns its space. Data: EIA Weekly Petroleum Status Report (series WCSSTUS1); U.S. Department of Energy, SPR Quick Facts.
Tip: end the gauge axis at the real capacity and put the reference value on it as gauge.threshold.
Get the data from EIA's Weekly Petroleum Status Report (eia.gov, series WCSSTUS1, crude oil in the StrategicPetroleum Reserve in thousand barrels, weekly) (columns: date, spr_kbbl), and the 714-million-barrel capacityfrom DOE's SPR Quick Facts.Build a plotly go.Indicator with mode="number+delta+gauge" and gauge.shape="bullet", in million barrels, axis 0 to714, the change from a year ago as the delta and a threshold line at the year-ago level.
6. Clinical trial registrations, nested counts
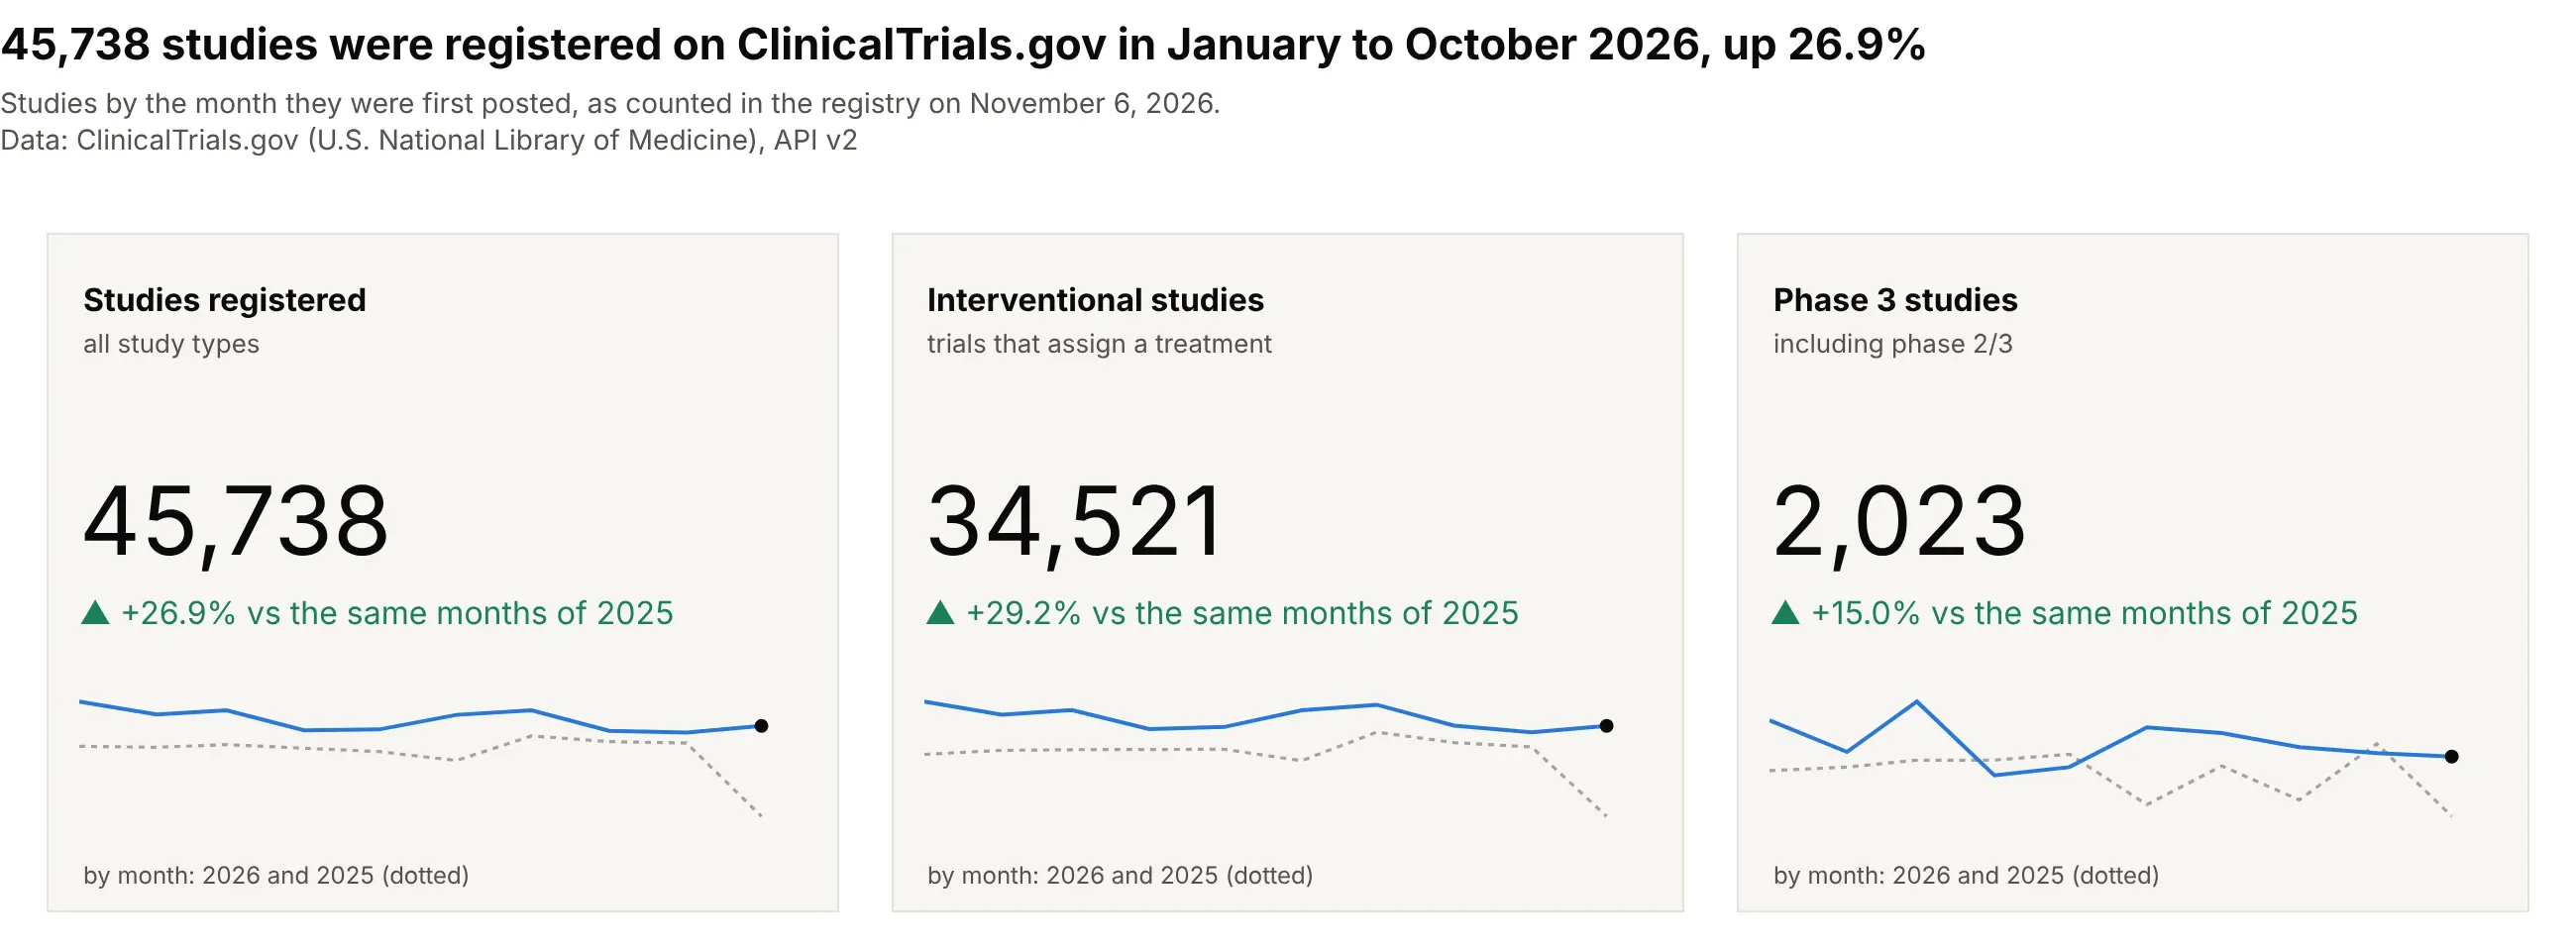
45,738 studies were first posted on ClinicalTrials.gov from January to October 2026, 26.9% more than in the same months of 2025, and phase 3 registrations rose 15.0%. Relative deltas make three counts of very different sizes comparable, and the full counts with thousands separators keep them exact. Data: ClinicalTrials.gov (US National Library of Medicine), API v2, studies by first posted date, counted on November 6, 2026.
Tip: compare a year-to-date count with the same months of last year, and show both years in the sparkline.
Get the data from the ClinicalTrials.gov API v2 (clinicaltrials.gov/api/v2/studies with countTotal=true, countingstudies by StudyFirstPostDate each month for all studies, StudyType INTERVENTIONAL, and Phase PHASE3) (columns:month, all, interventional, phase3).Build three plotly KPI cards with January-October 2026 totals formatted ",.0f", relative deltas against the samemonths of 2025 in green, and monthly sparklines with 2025 dotted.