
Chris Parmer
October 24, 2026
Box Plots - A Complete Guide
TL;DR
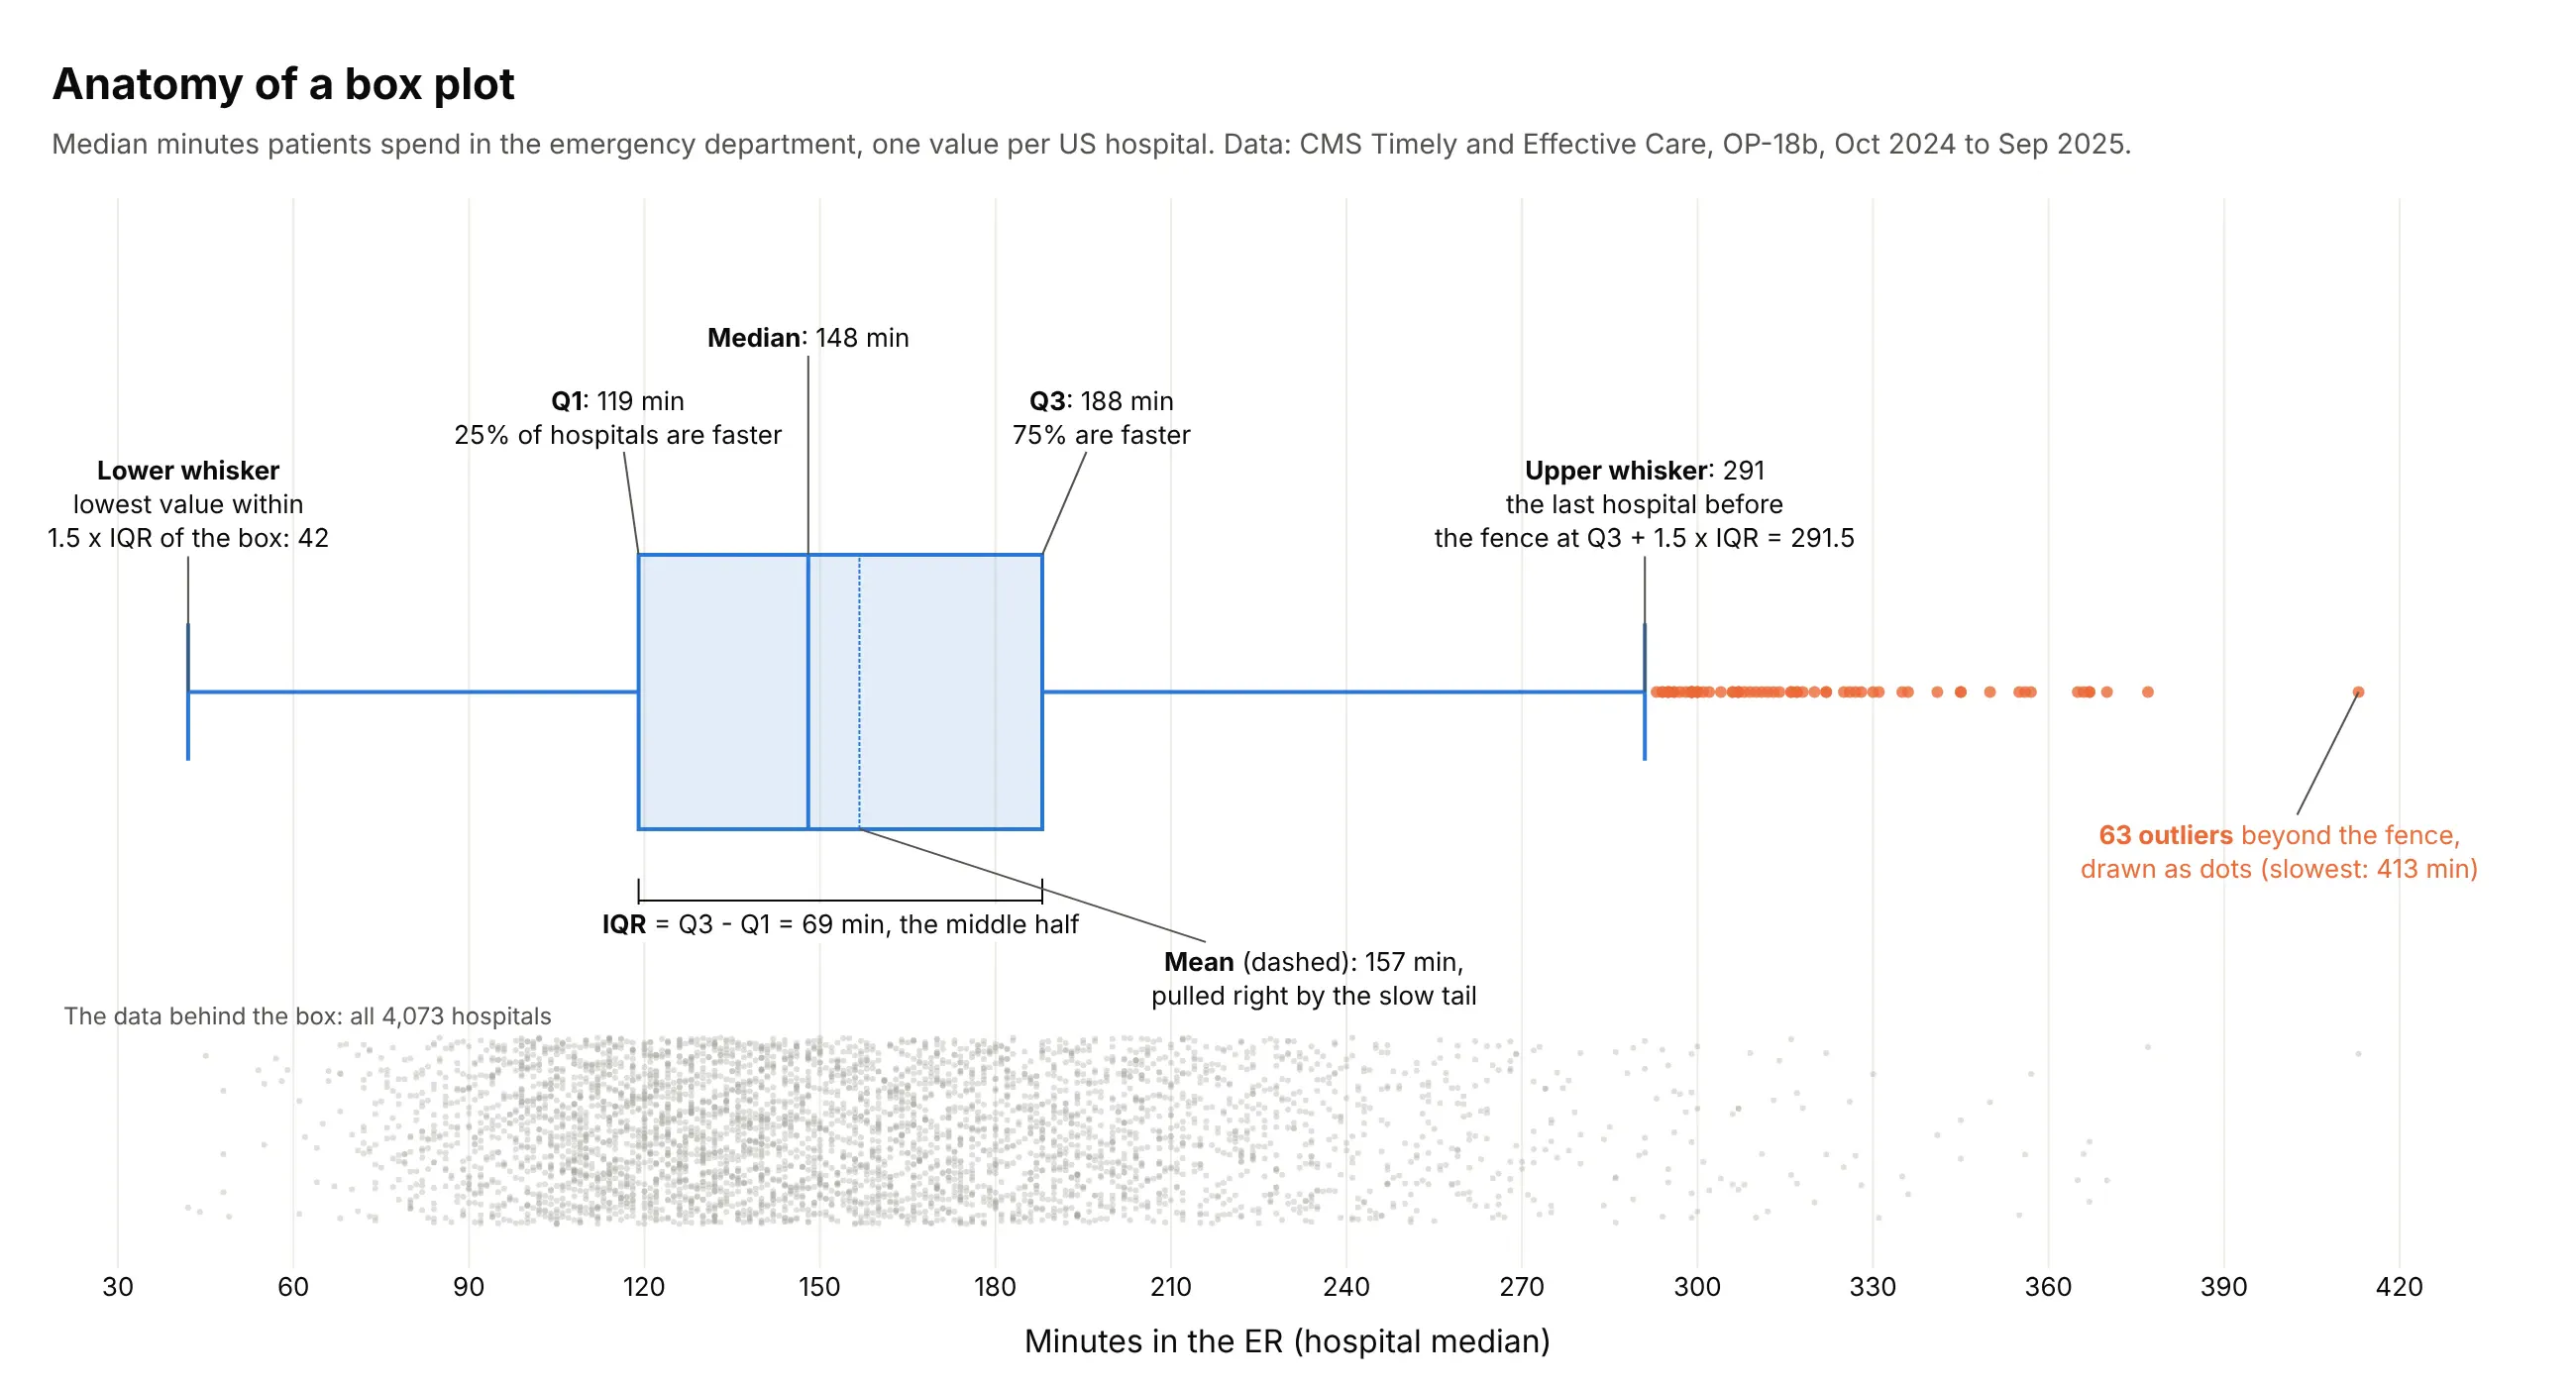
- A box plot summarizes a group of numbers with five values: a box from the first to the third quartile, a line at the median, and whiskers to the furthest points within 1.5 times the box's length, with anything beyond drawn as an outlier.
- Box plots are also known as box-and-whisker plots, box-and-whisker diagrams and boxplots, and are similar to violin plots, histograms and ridgeline plots.
- Use one to compare a number across many groups at once, such as 50 states, 49 industries or 20 drivers, where a histogram per group would no longer be readable.
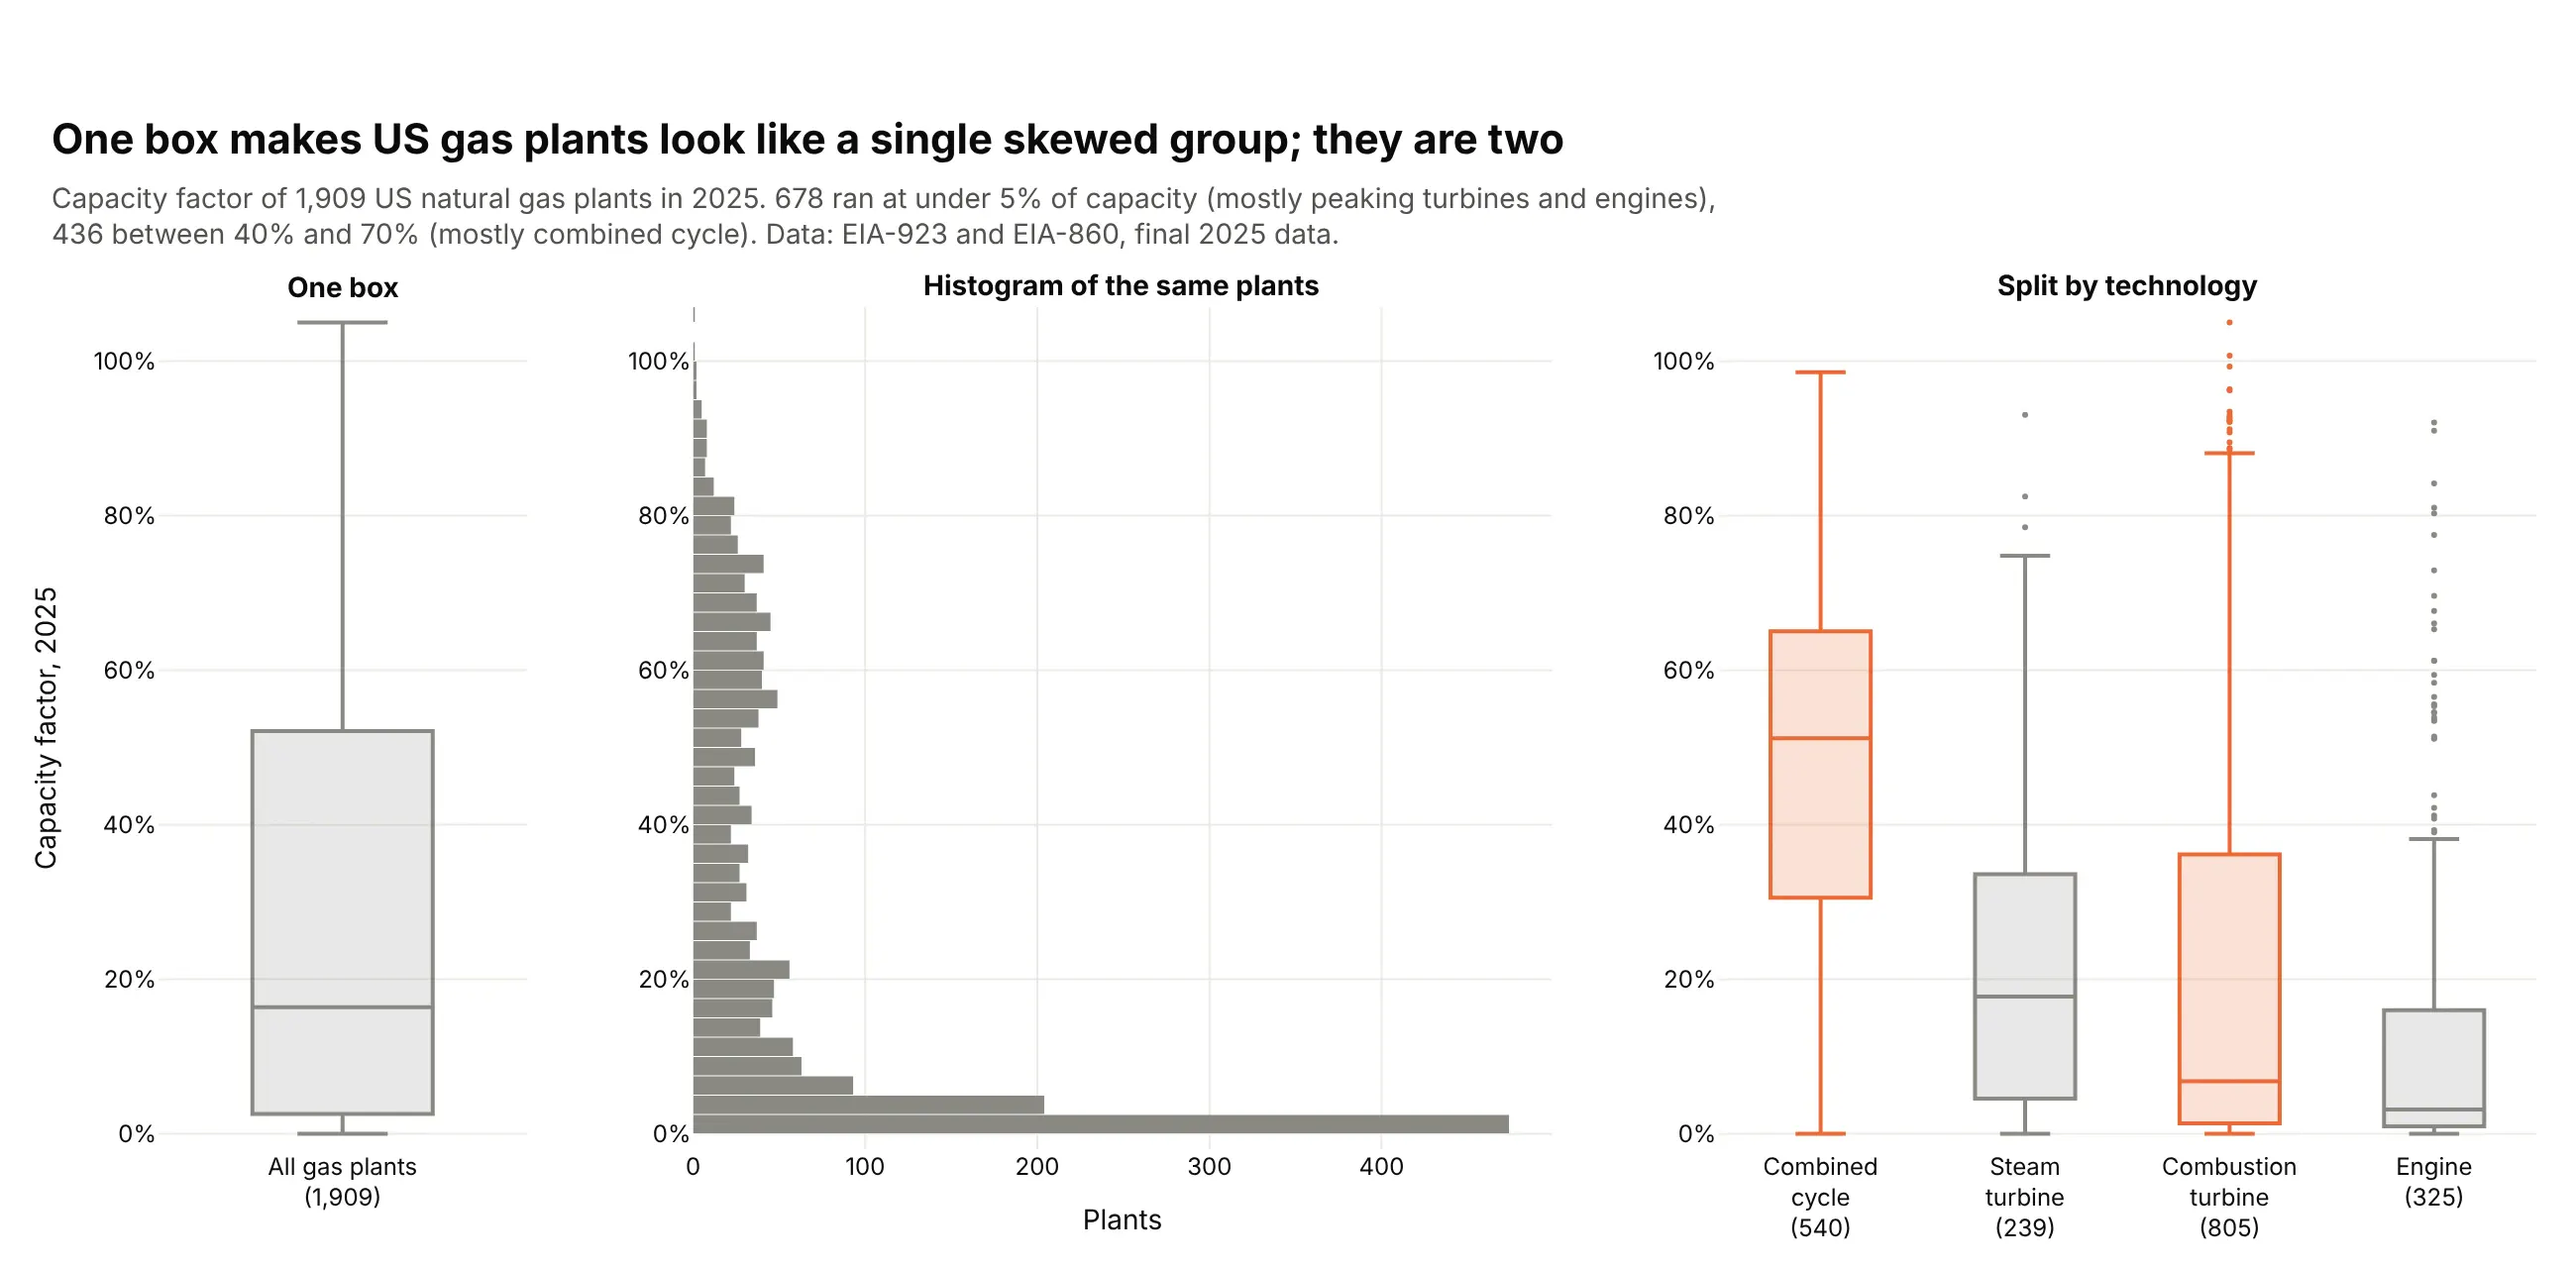
- A box hides the shape inside it, so two clusters or a tiny sample look like an ordinary box. Show the points or check a histogram before you publish.
- Any coding agent can make one with Plotly in a minute. In Python it's px.box(df, x="group", y="value").
What is a box plot?
Box plots look like this:
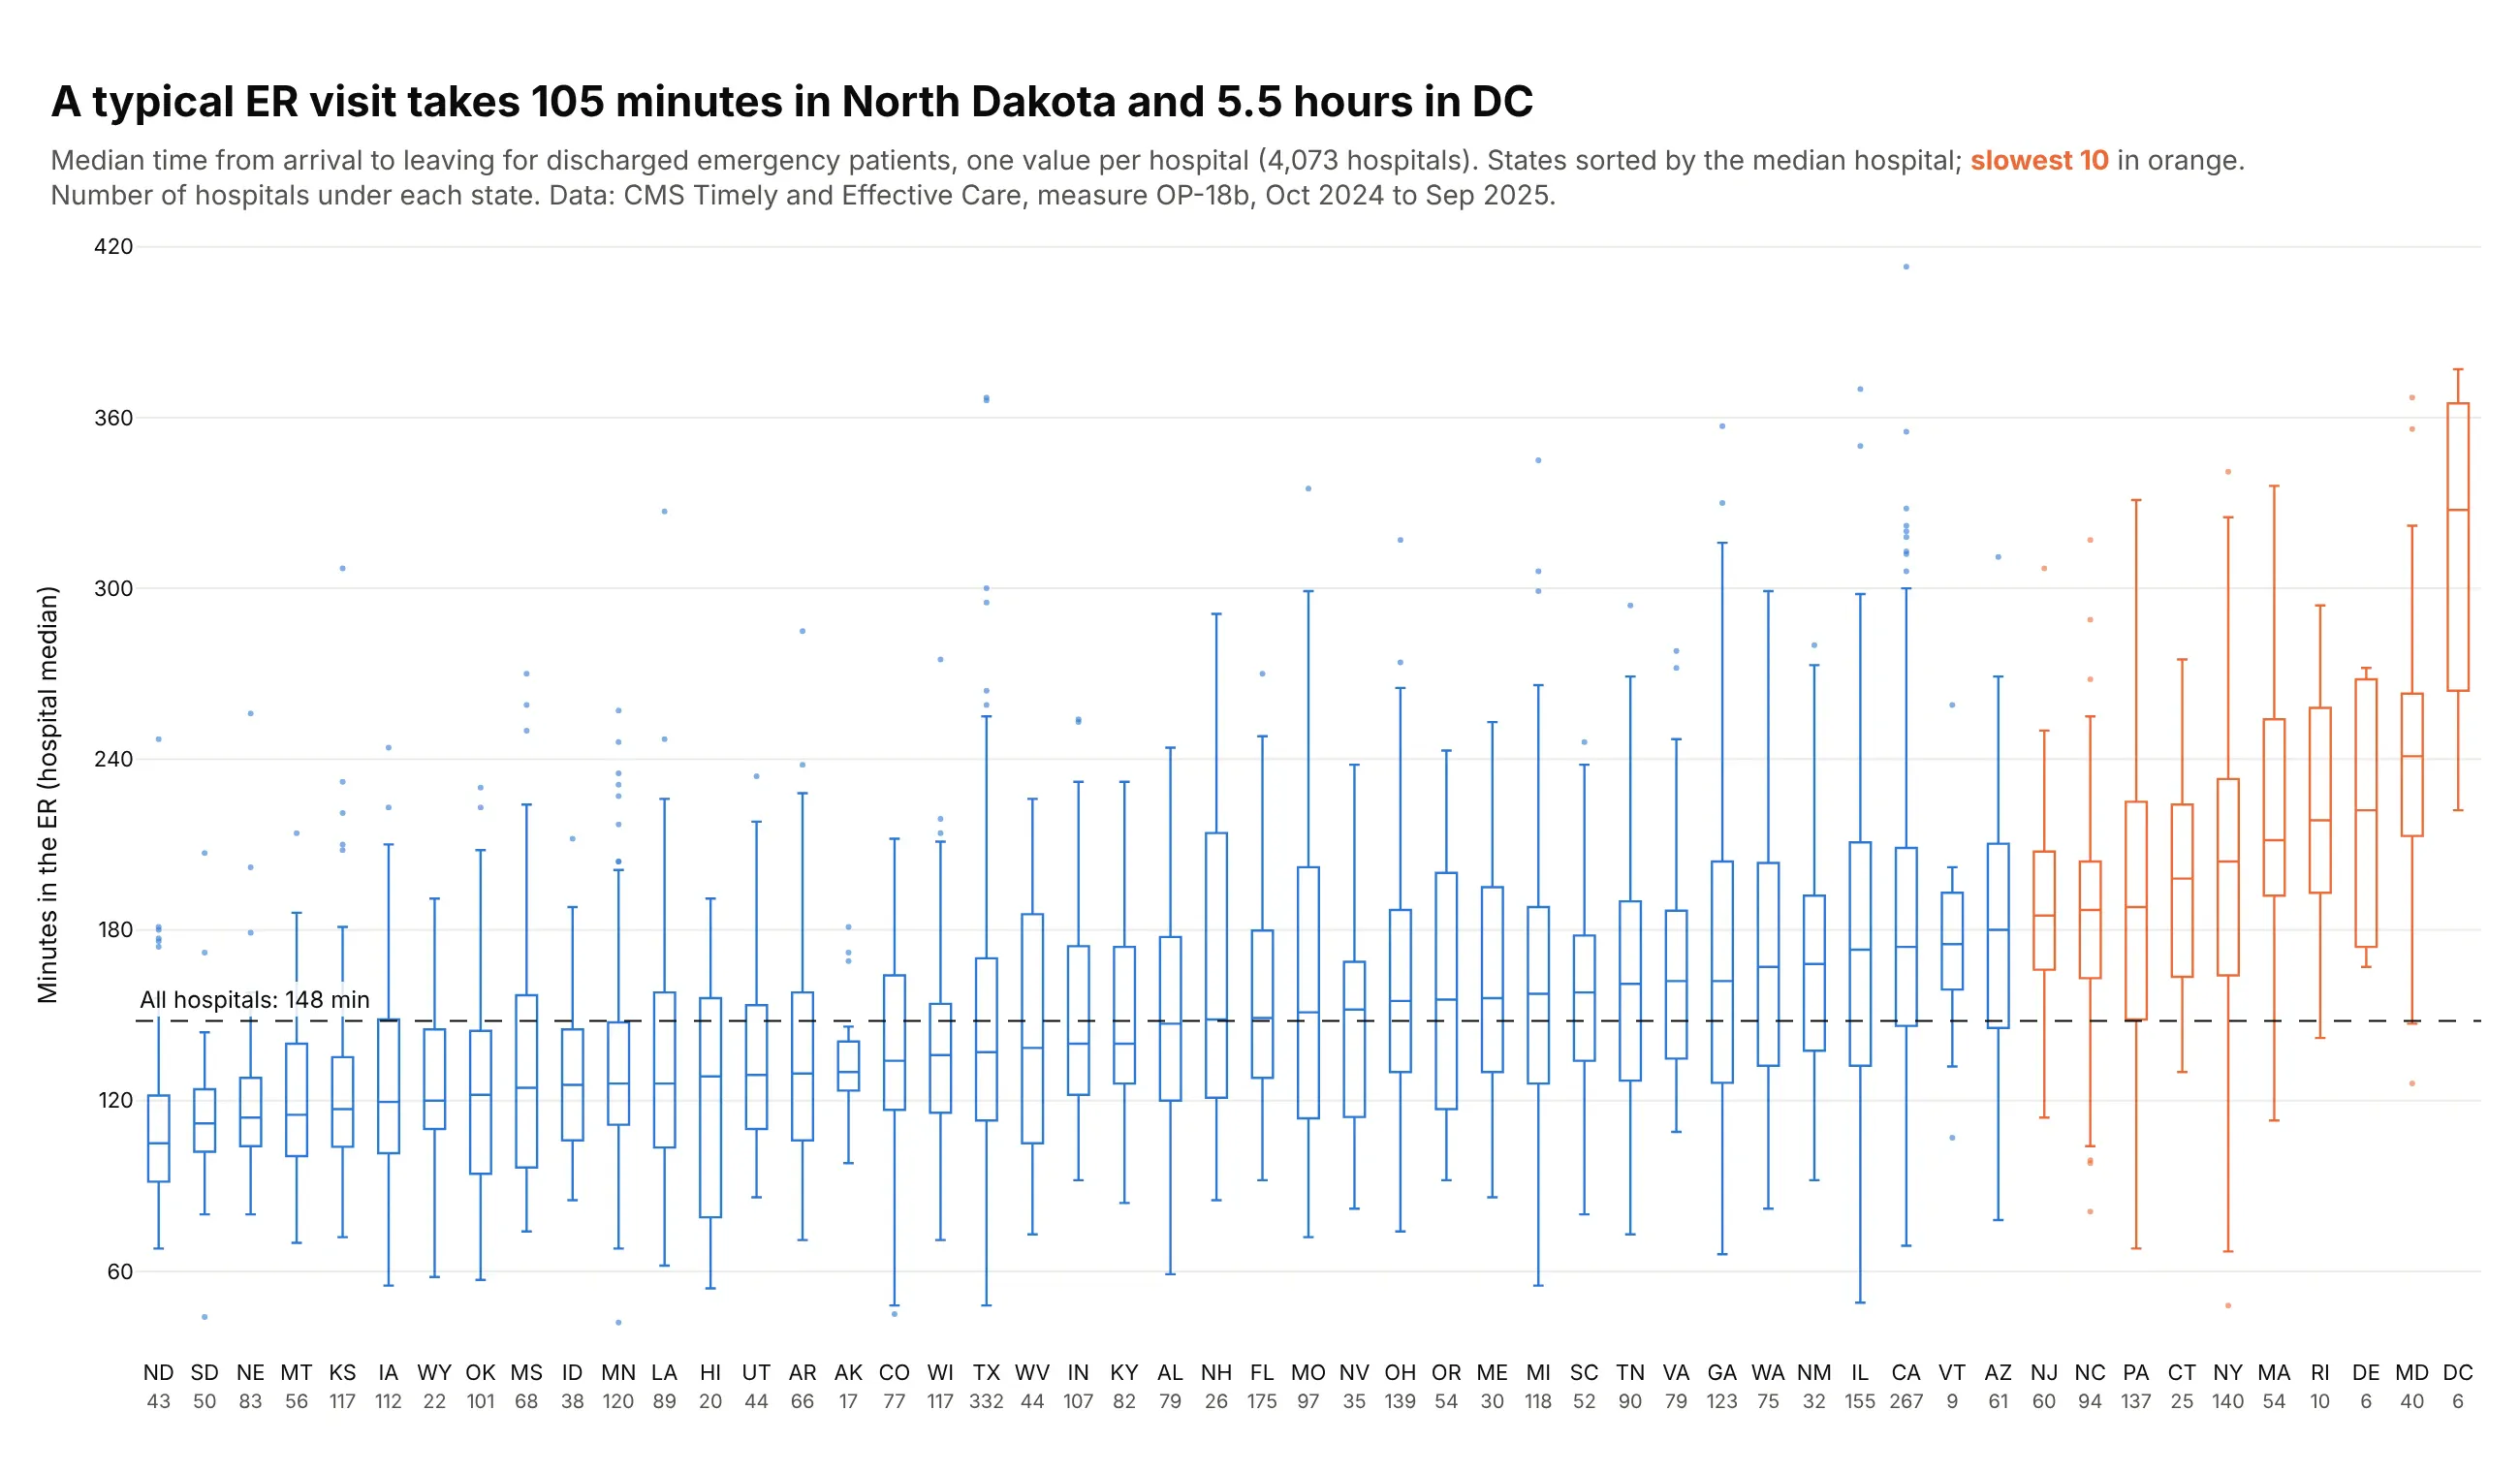
Data: CMS Timely and Effective Care, measure OP-18b, October 2024 to September 2025.
How do you read a box plot? In the example above, notice these things:
- Each box is one state, built from the median ER times of its hospitals, and the number of hospitals is printed under each state's name.
- The line inside a box is the state's median hospital, and the box covers the middle half of its hospitals, so North Dakota's box at the far left sits low and DC's at the far right sits high.
- The whiskers reach the furthest hospitals within 1.5 box lengths, and the dots beyond them are outliers, like Loma Linda University Medical Center in California, the slowest hospital in the chart.
- The states are sorted by their median and the dashed line marks the median of all hospitals, so you can see where states cross from faster than typical to slower, and the orange boxes for the 10 slowest states are mostly in the Northeast and Mid-Atlantic.
- Check the counts before trusting a box, because DC's tall box comes from only 6 hospitals, which is far less data than a box like Texas's.
It's often used for charts like these:
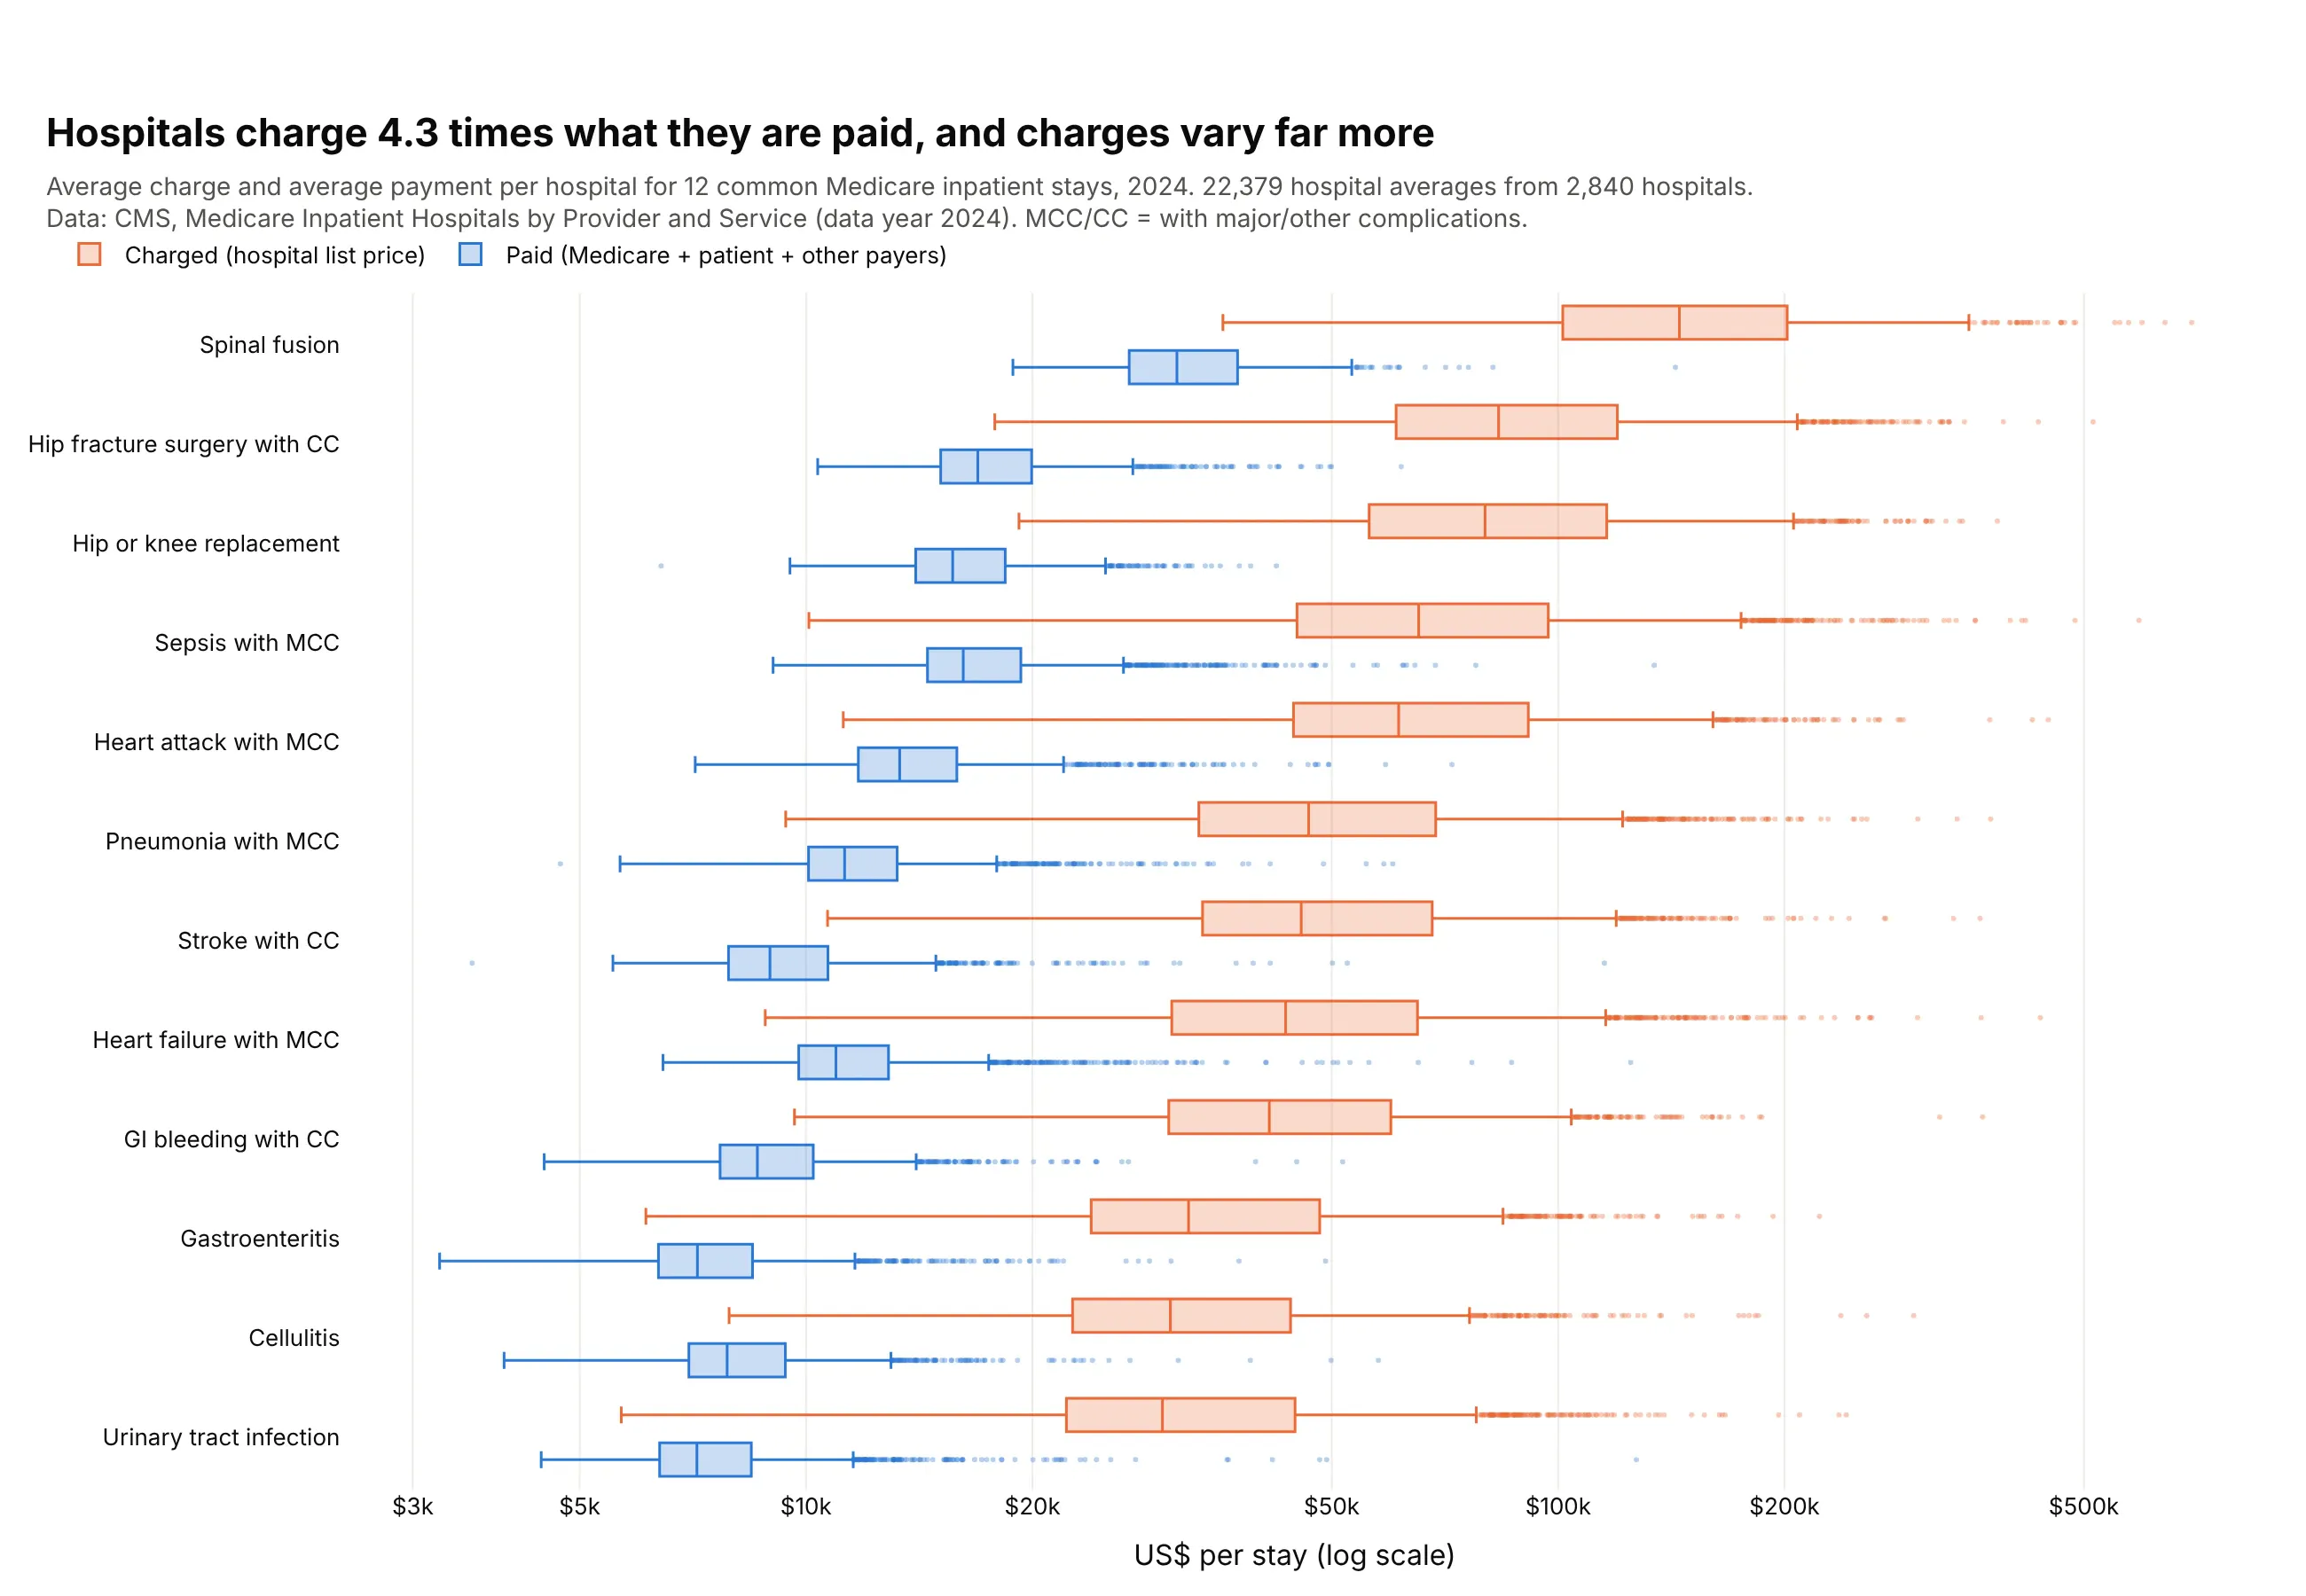
Prices across hospitals. Across 22,379 hospital averages for 12 common stays, hospitals charged a median 4.3 times what Medicare and other payers actually paid them. Data: CMS, Medicare Inpatient Hospitals by Provider and Service, 2024.
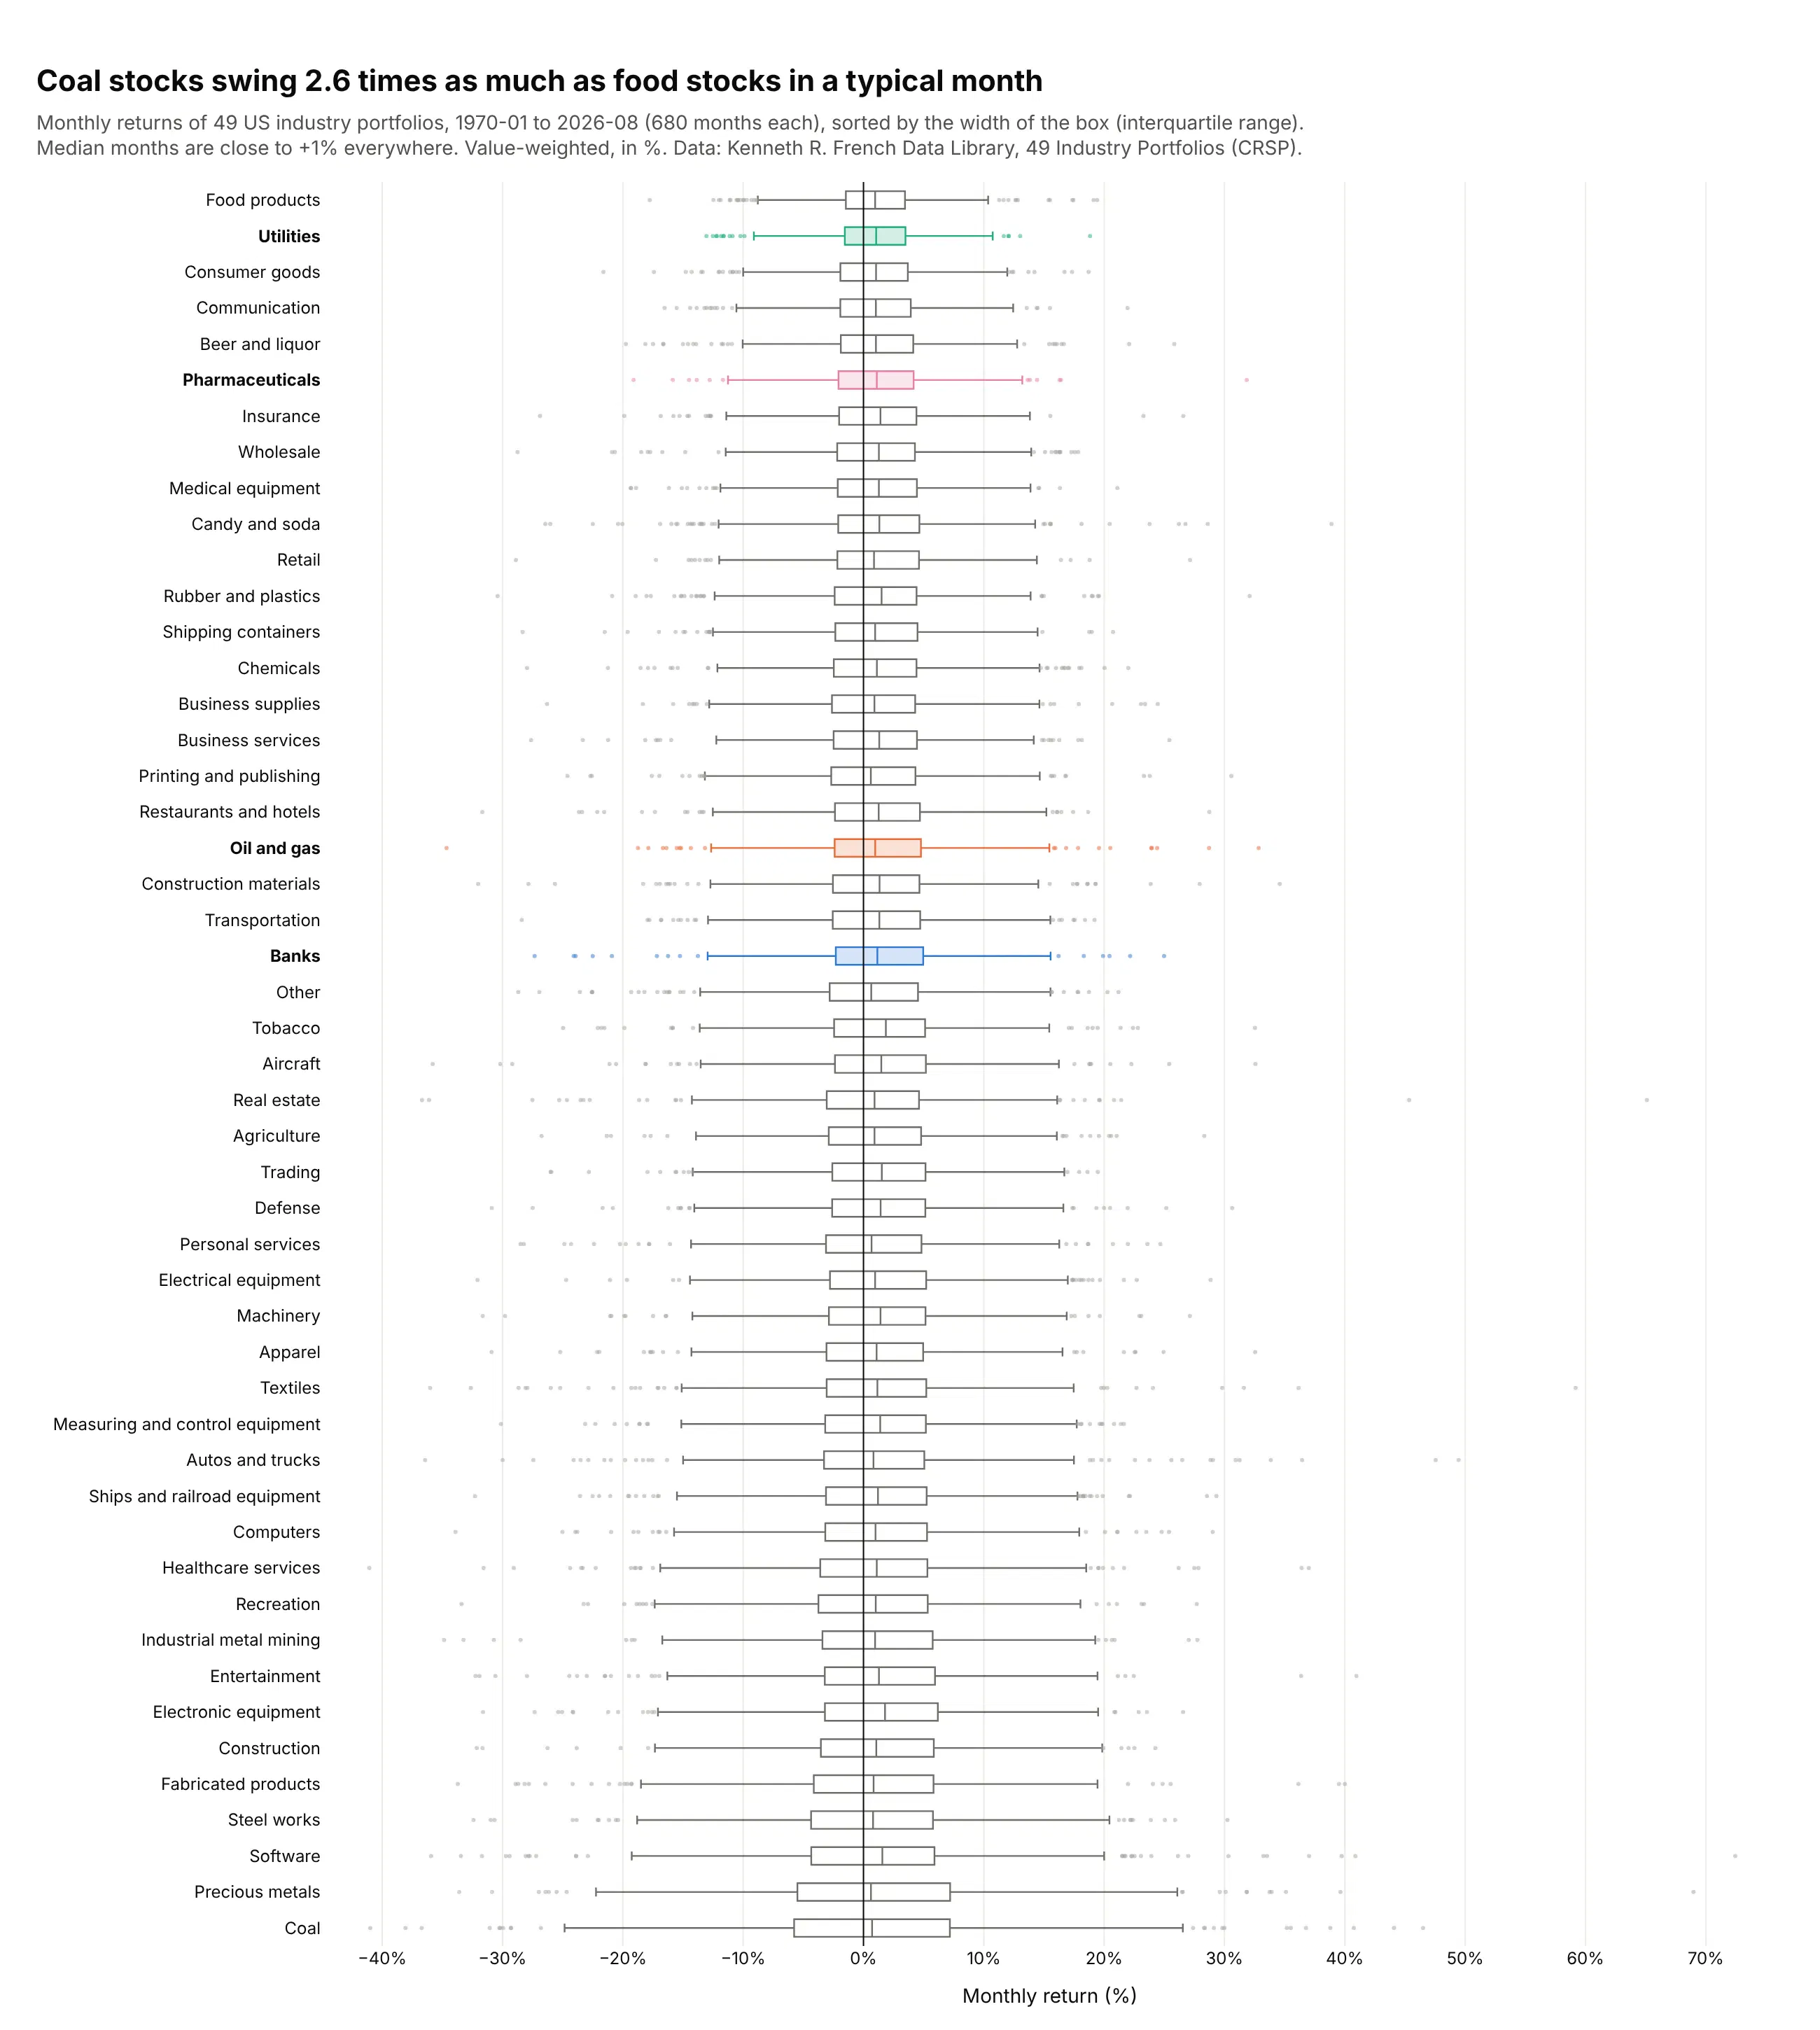
Risk across industries. Over 680 months the median month is between +0.6% and +1.9% for all 49 industries, but the middle half of coal's months spans 12.9 percentage points, 2.6 times food's 4.9. Data: Kenneth R. French Data Library, 49 Industry Portfolios, value-weighted, January 1970 to August 2026.
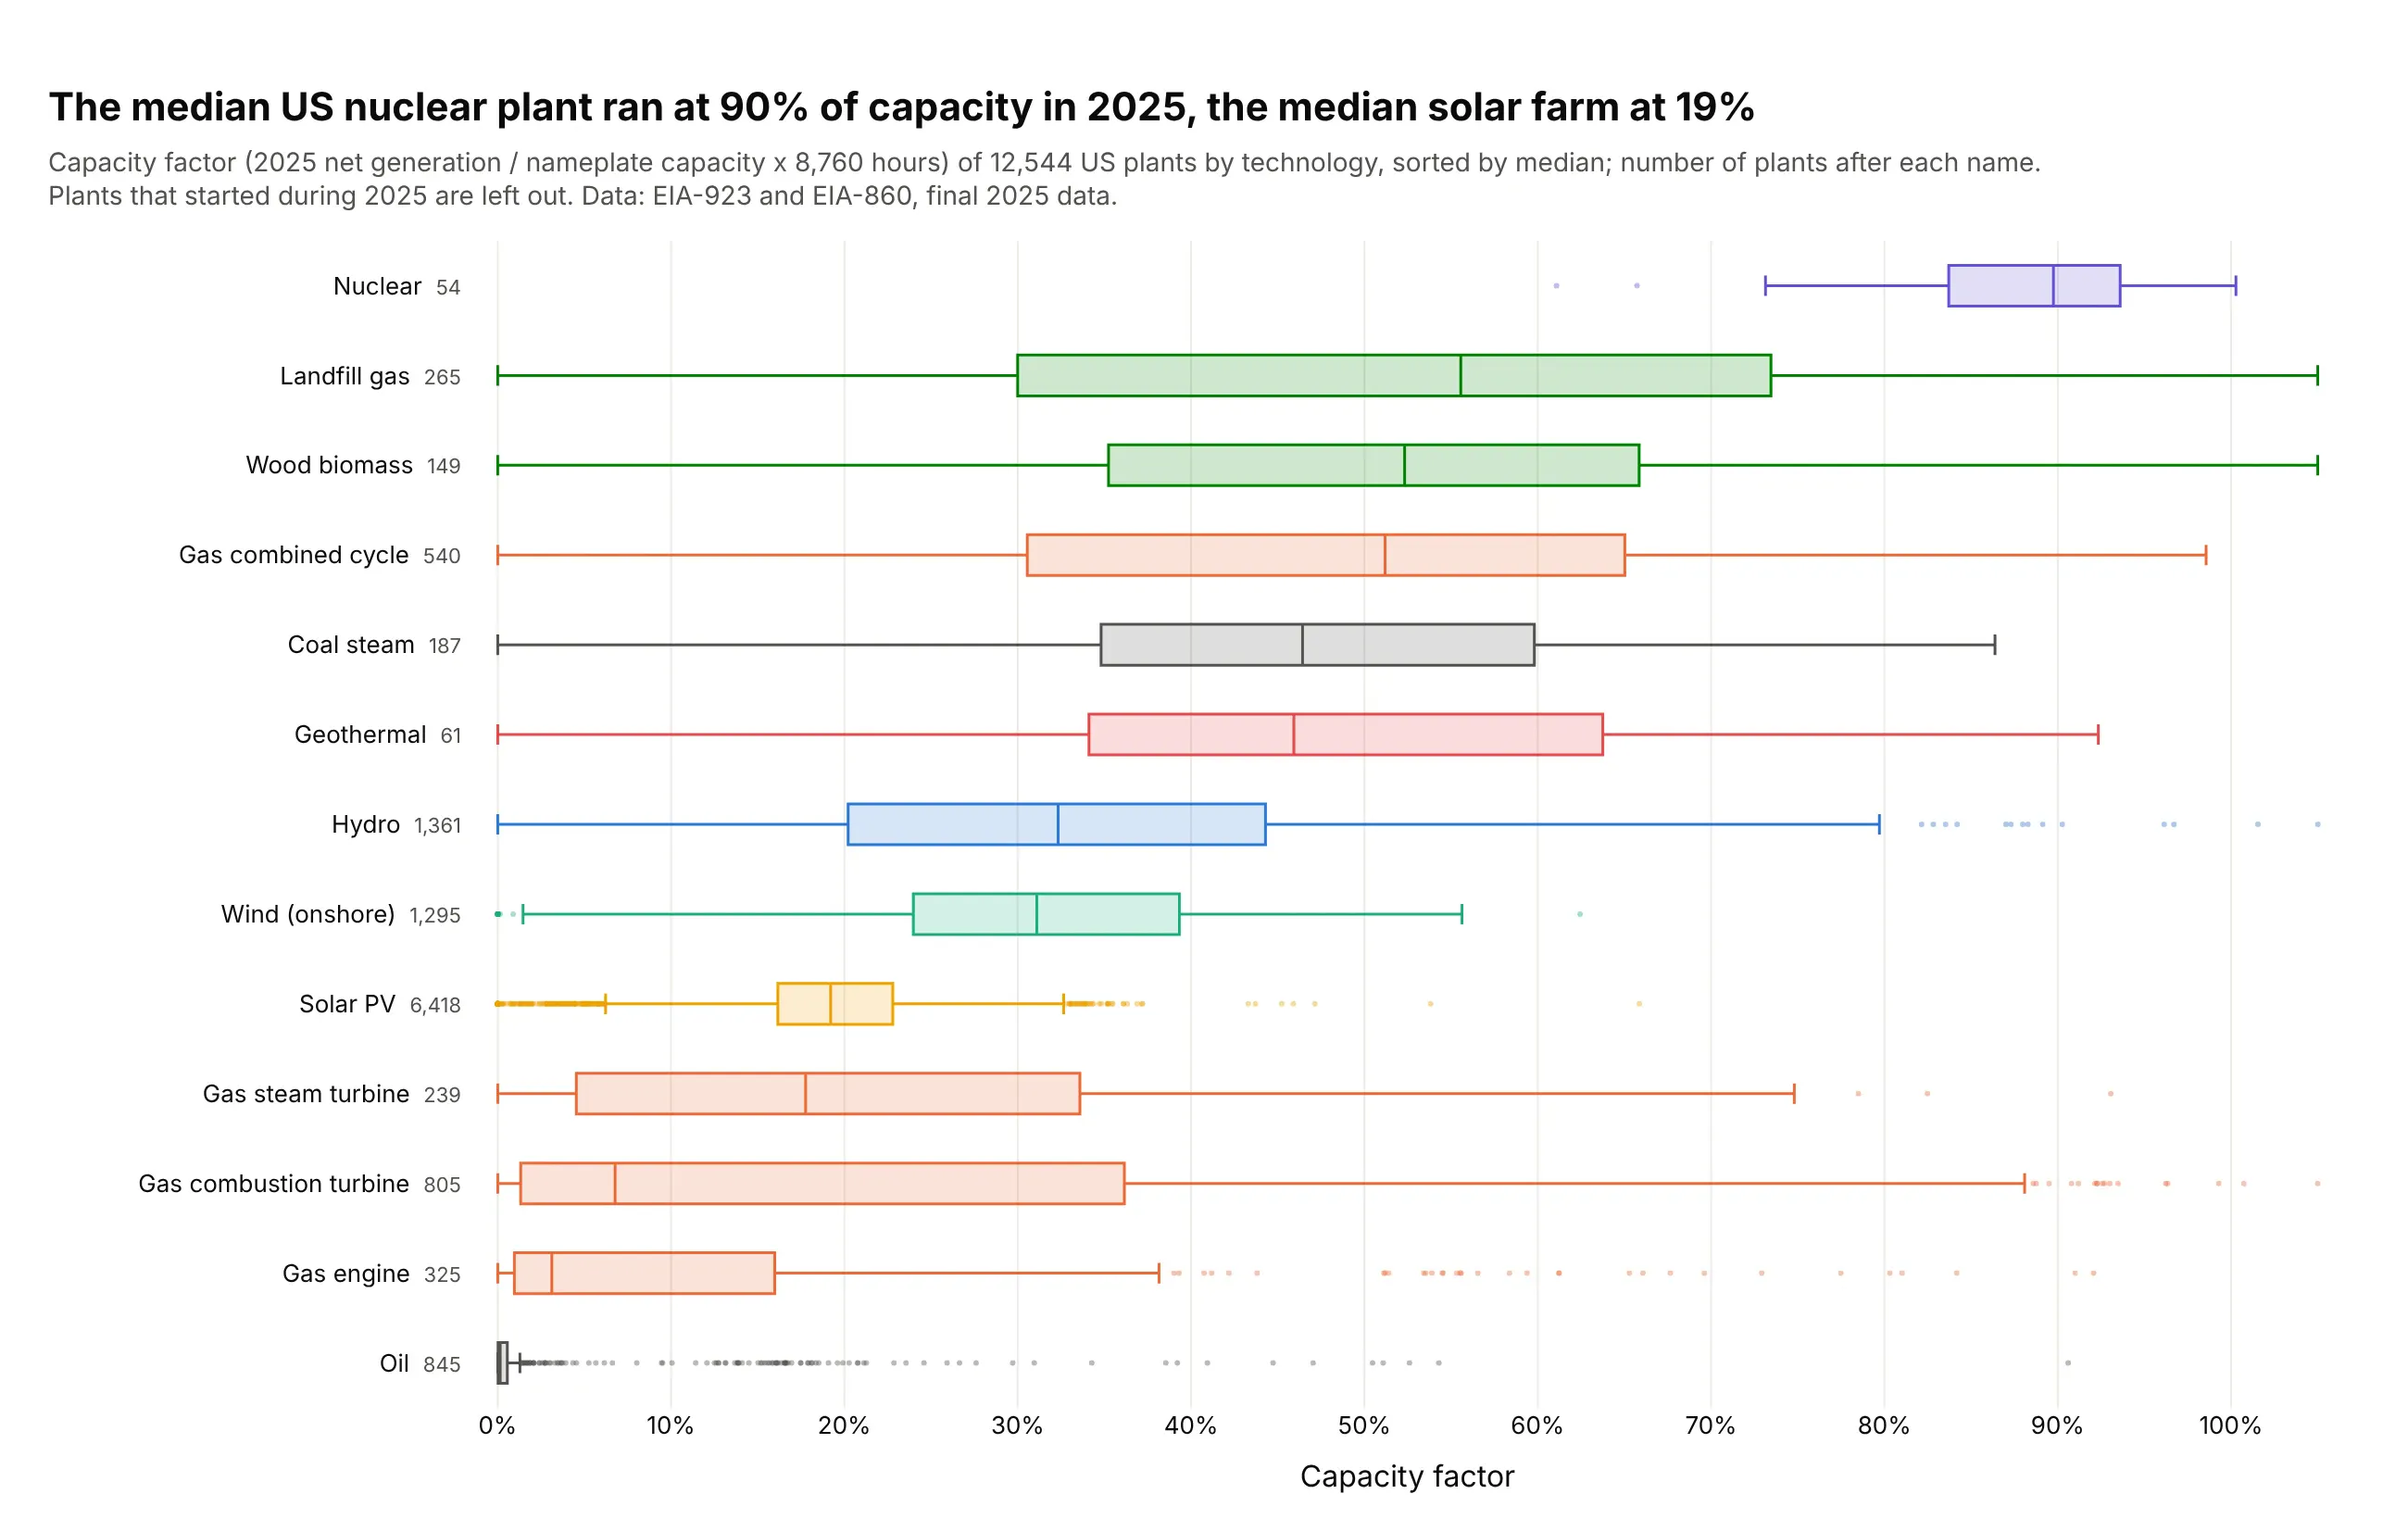
Performance across assets. The median US nuclear plant ran at 90% of its capacity in 2025 and the median solar farm at 19%, while gas plants span everything from 51% (combined cycle) to 7% (combustion turbines). Data: EIA-923 and EIA-860, final 2025 data.
To see what each part of a box means, here is one box taken apart, using all 4,073 hospitals from the ER example at once:
A short history
Mary Eleanor Spear drew a "range bar" with a box for the middle half and a median line in Charting Statistical Data (1952). John Tukey turned it into the box-and-whisker plot in Exploratory Data Analysis (1977), with whiskers that stop at 1.5 times the interquartile range and outliers drawn one by one, and a year later Robert McGill, Tukey and Wayne Larsen added notches in "Variations of Box Plots" (The American Statistician, 1978). Here are the three forms redrawn with Plotly on Albert Michelson's 1879 speed of light measurements, five experiments of 20 runs each:
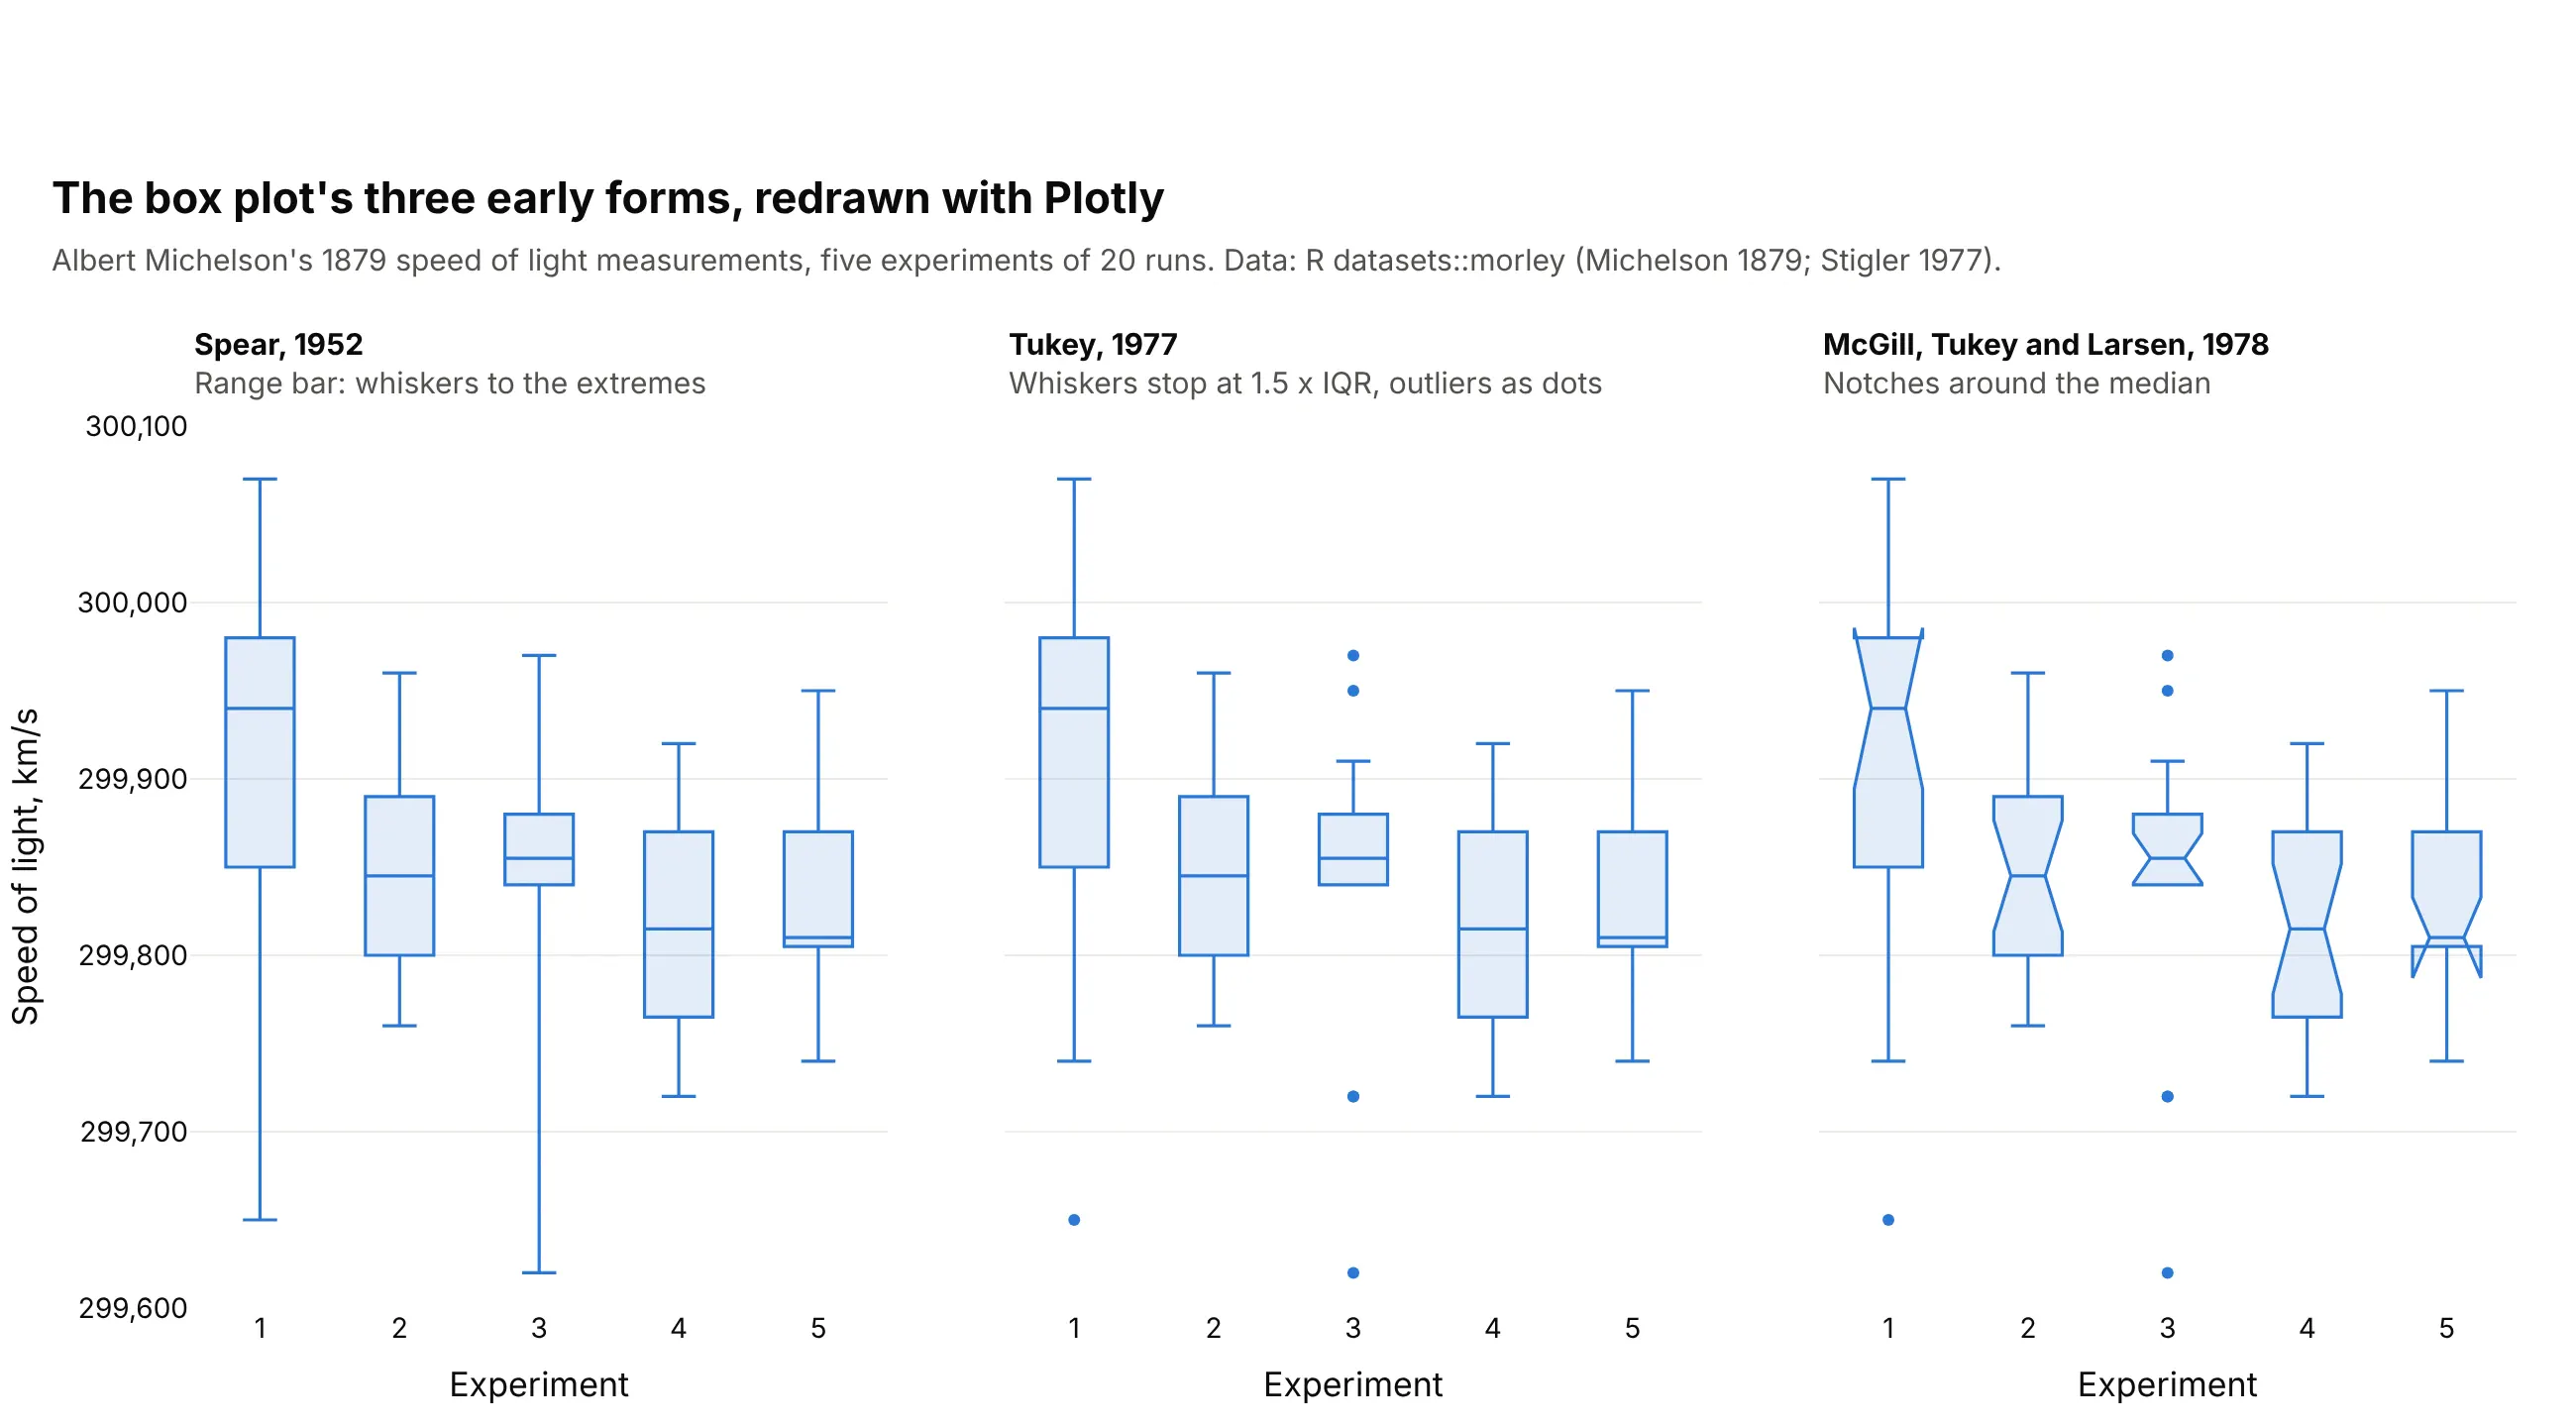
Michelson's first experiment came out at a median 299,940 km/s, 100 km/s above the other four, and its notch doesn't overlap theirs. In 1989, Michael Frigge, David Hoaglin and Boris Iglewicz found that statistical packages drew different boxes for the same data, because they computed quartiles differently, which is still true today (see the FAQ).
Alternatives to a box plot
Here's the same ER data for three states drawn six ways. Some are better for the question, some worse, some just different:
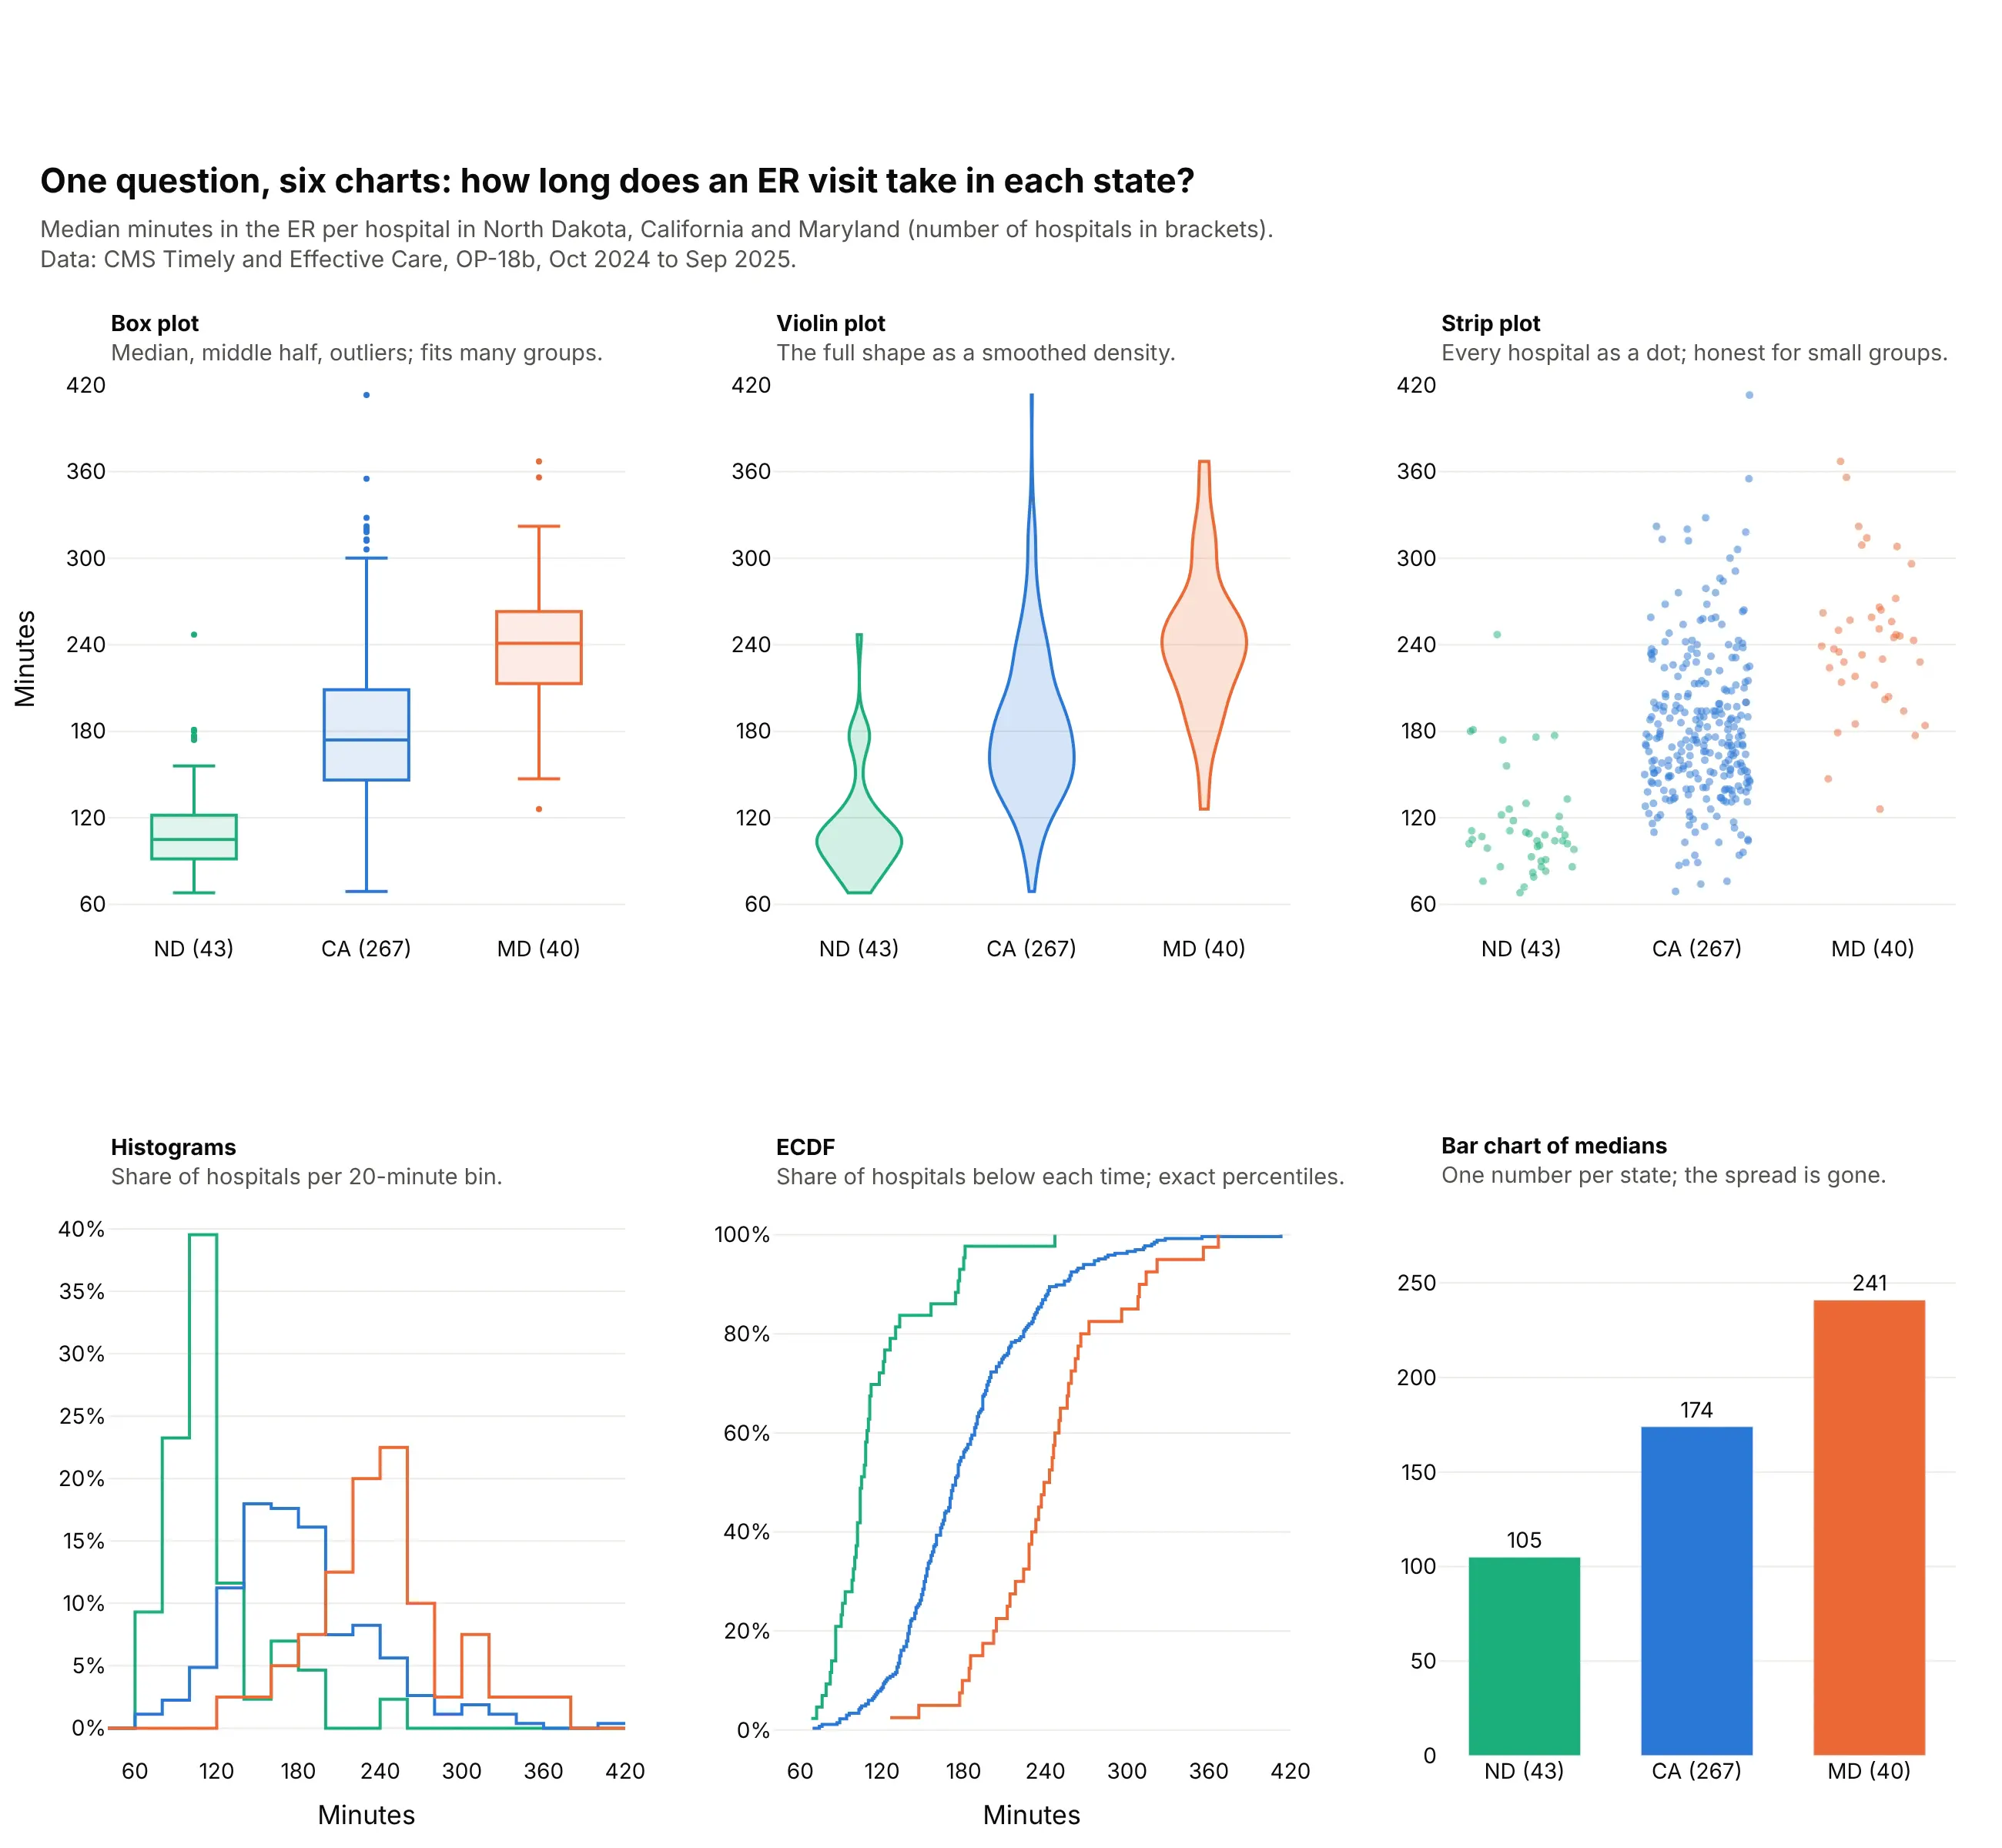
- Violin plot (different, better for shape). It draws the whole distribution as a smoothed density, so it shows two peaks or a gap that a box hides, at the cost of more ink per group. See our violin plot guide.
- Strip plot (better for small groups). Every value is a dot, which is the most honest view when a group has fewer than about 50 values and unreadable when it has thousands. Plotly can draw the dots on top of the box with boxpoints="all".
- Histogram (better for one distribution). It shows the shape of a single group in detail, but three overlaid histograms are already hard to read and 50 are impossible. See our histogram guide.
- ECDF (different). Each line shows the share of hospitals below each time, so you can read any percentile exactly, but most readers need it explained.
- Bar chart of medians (worse). One number per group is easy to read, but it hides the spread, which is often the story. Maryland's median (241 minutes) is 2.3 times North Dakota's (105), and the bars can't show that North Dakota's slowest hospital (247 minutes) takes longer than Maryland's median.
Here's where the histogram wins. A single box of 1,909 US gas plants looks like an ordinary skewed group, while the histogram shows two kinds of plants, 678 peakers that ran under 5% of the time and a broad hump of plants between 40% and 70%:
How to make a box plot
With AI
ChatGPT, Claude Code, GitHub Copilot, Cursor and other AI tools are excellent at writing Plotly code. Name Plotly in the prompt, describe the groups and the value, and list the checks you want:
Make a plotly box plot from claims.csv (columns: payer, procedure, allowed_amount_usd).- One horizontal box per procedure, sorted by median allowed amount; n after each label.- Boxes in gray, with the procedure named in the title in orange.- boxpoints="outliers"; cap the x axis at the 99th percentile and say in the subtitle how manyvalues are off the chart.- A title that states the main takeaway, and the data source in a muted subtitle.- Print each procedure's median and quartiles computed with numpy method="hazen" and checkthey match the hover values in the chart.- Save it as box.html and as a PNG at 2x scale.
The last check catches the most common bug in box plot reporting, which is quoting quartiles from pandas that don't match the chart.
With Plotly Studio
Plotly Studio is a desktop app where you point an AI at a dataset and it builds charts and a Dash app around your questions. Ask for a box plot the same way:
Show a box plot of emergency department time by state, one box per state sorted by median, with the number of hospitals under each state. Add a dropdown to switch between states and hospital types, and a table of the slowest hospitals in the selected state.
Make a box plot in Python or JavaScript
This is the code AI tools write under the hood. In Python, Plotly Express draws one box per group from a tidy table with one row per value:
import plotly.express as pxdf = px.data.tips()fig = px.box(df, x="day", y="total_bill", color="smoker", notched=True, points="outliers",category_orders={"day": ["Thur", "Fri", "Sat", "Sun"]})fig.show()
When the data is too big to send to the browser, compute the statistics first (in pandas, SQL or Spark) and pass them to go.Box instead of the raw values:
import plotly.graph_objects as go# s: one row per group with q1, median, q3, lowerfence and upperfencefig = go.Figure(go.Box(y=s.group, q1=s.q1, median=s["median"], q3=s.q3,lowerfence=s.lowerfence, upperfence=s.upperfence, orientation="h"))
In JavaScript, plotly.js takes one trace per box with its raw values. These are the first two of Michelson's 1879 experiments:
<div id="chart"></div><script src="https://cdn.plot.ly/plotly-4.1.1.min.js"></script><script>const exp1 = [299850, 299740, 299900, 300070, 299930, 299850, 299950, 299980, 299980, 299880,300000, 299980, 299930, 299650, 299760, 299810, 300000, 300000, 299960, 299960];const exp2 = [299960, 299940, 299960, 299940, 299880, 299800, 299850, 299880, 299900, 299840,299830, 299790, 299810, 299880, 299880, 299830, 299800, 299790, 299760, 299800];Plotly.newPlot("chart", [{type: "box", y: exp1, name: "Experiment 1", notched: true, boxpoints: "all", jitter: 0.4},{type: "box", y: exp2, name: "Experiment 2", notched: true, boxpoints: "all", jitter: 0.4}], {yaxis: {title: {text: "Speed of light (km/s)"}}, showlegend: false});</script>
Share it
Every Plotly chart has a Share chart button (the cloud icon in its toolbar) that uploads it to Plotly Cloud and gives you a link. Only you can see it until you change its visibility.
For a live app, put the chart in a Dash app and publish it with the Plotly Cloud CLI. Coding agents can run these commands for you:
pip install "dash[cloud]"plotly user loginplotly app publish
If your data has to stay in your own cloud or data center, publish to Dash Enterprise instead.
Dos and don'ts
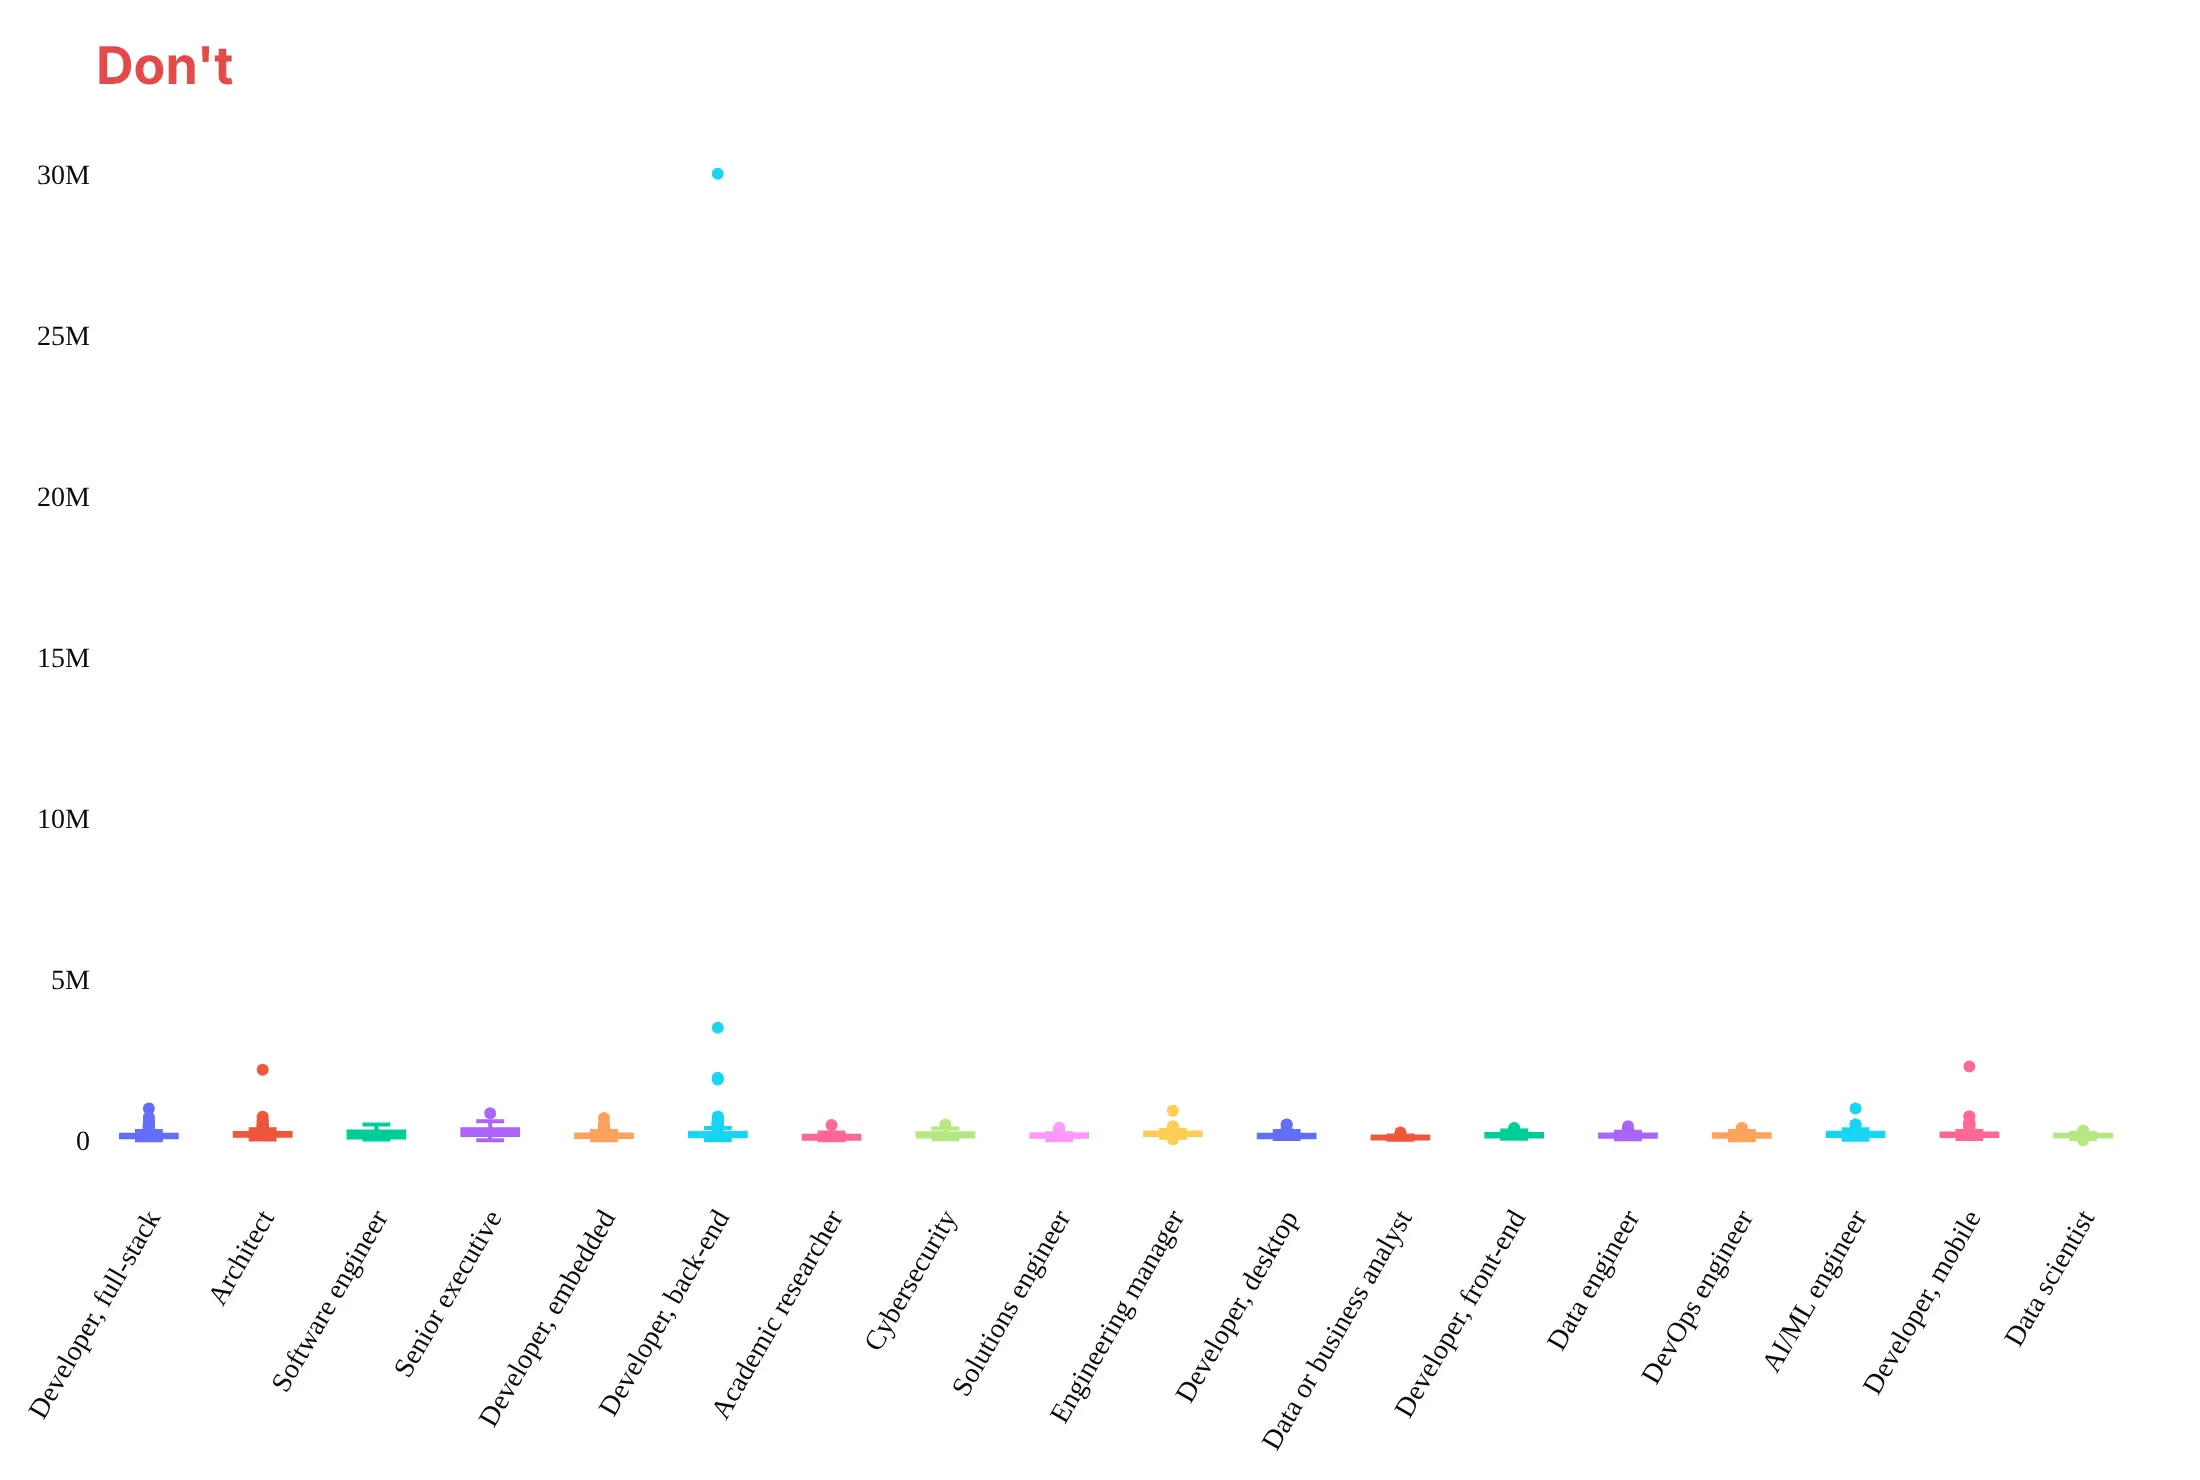
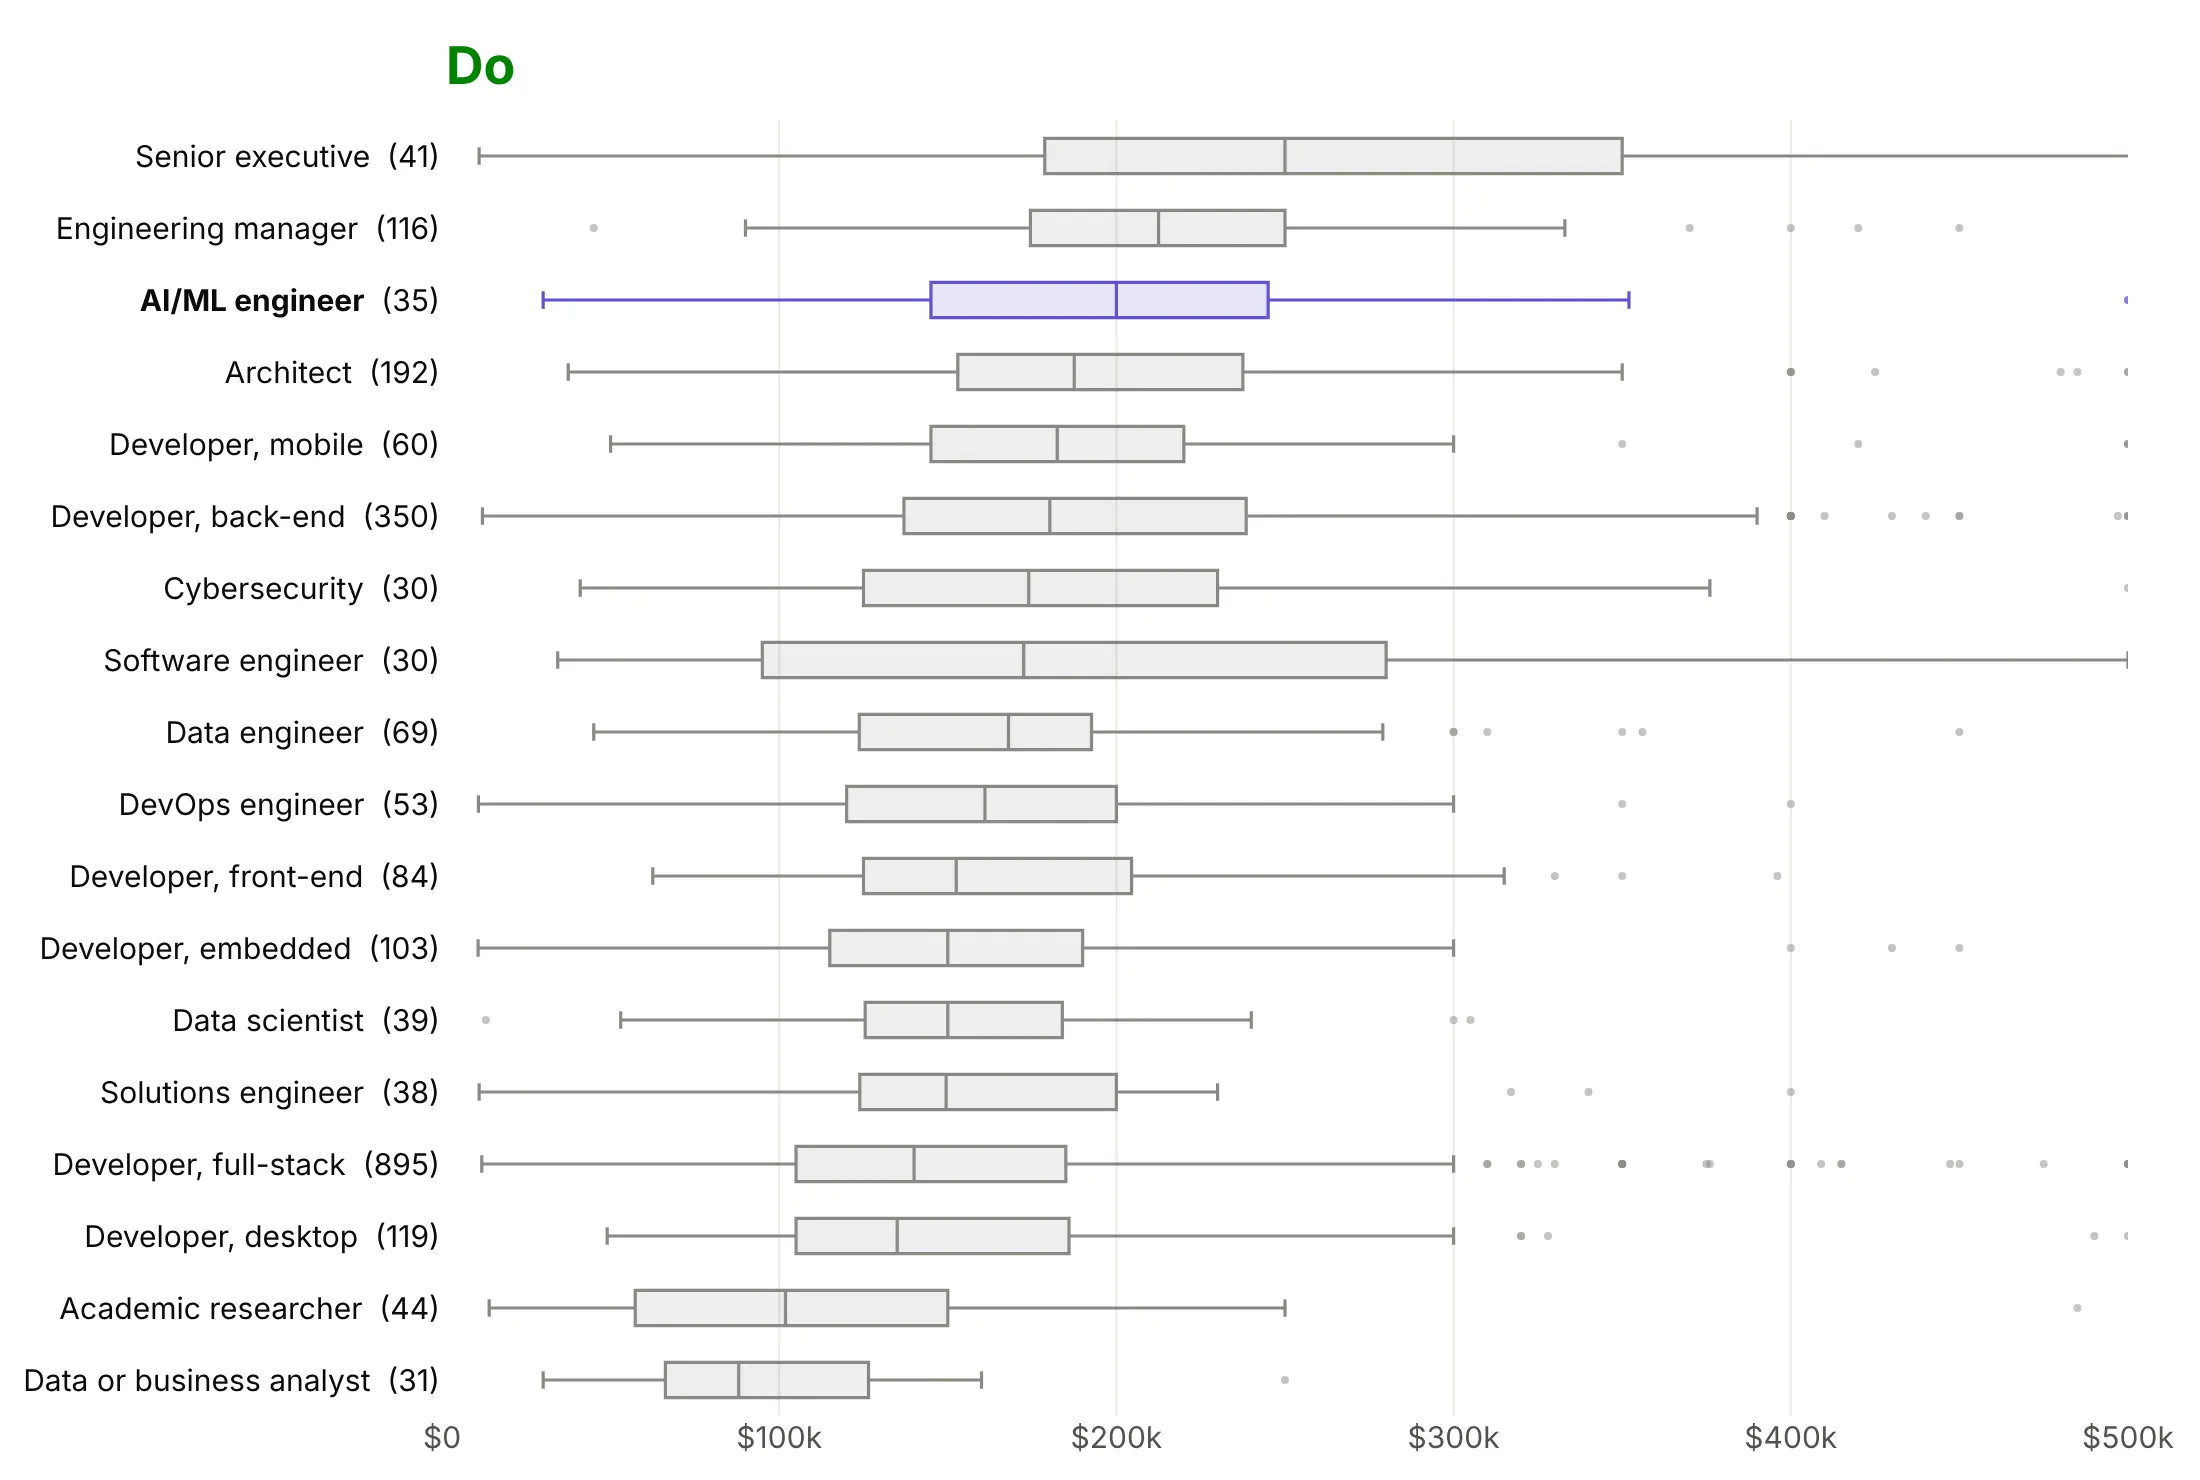
Plotly's defaults are made for exploring. For a published chart, most of the work is deciding what to leave out. Here are the yearly salaries of 2,329 US developers in 18 roles from the Stack Overflow Developer Survey 2026, drawn both ways.
Don't plot the groups in file order with rotated labels and a color per box, or let one $30 million answer set the axis, which squashes every box flat:
Do draw horizontal boxes sorted by median, gray with the one role the story is about in color, put the count after each role and cap the axis at $500k. Say on the page that 36 answers are above the cap:
Show as much of the data as the question needs
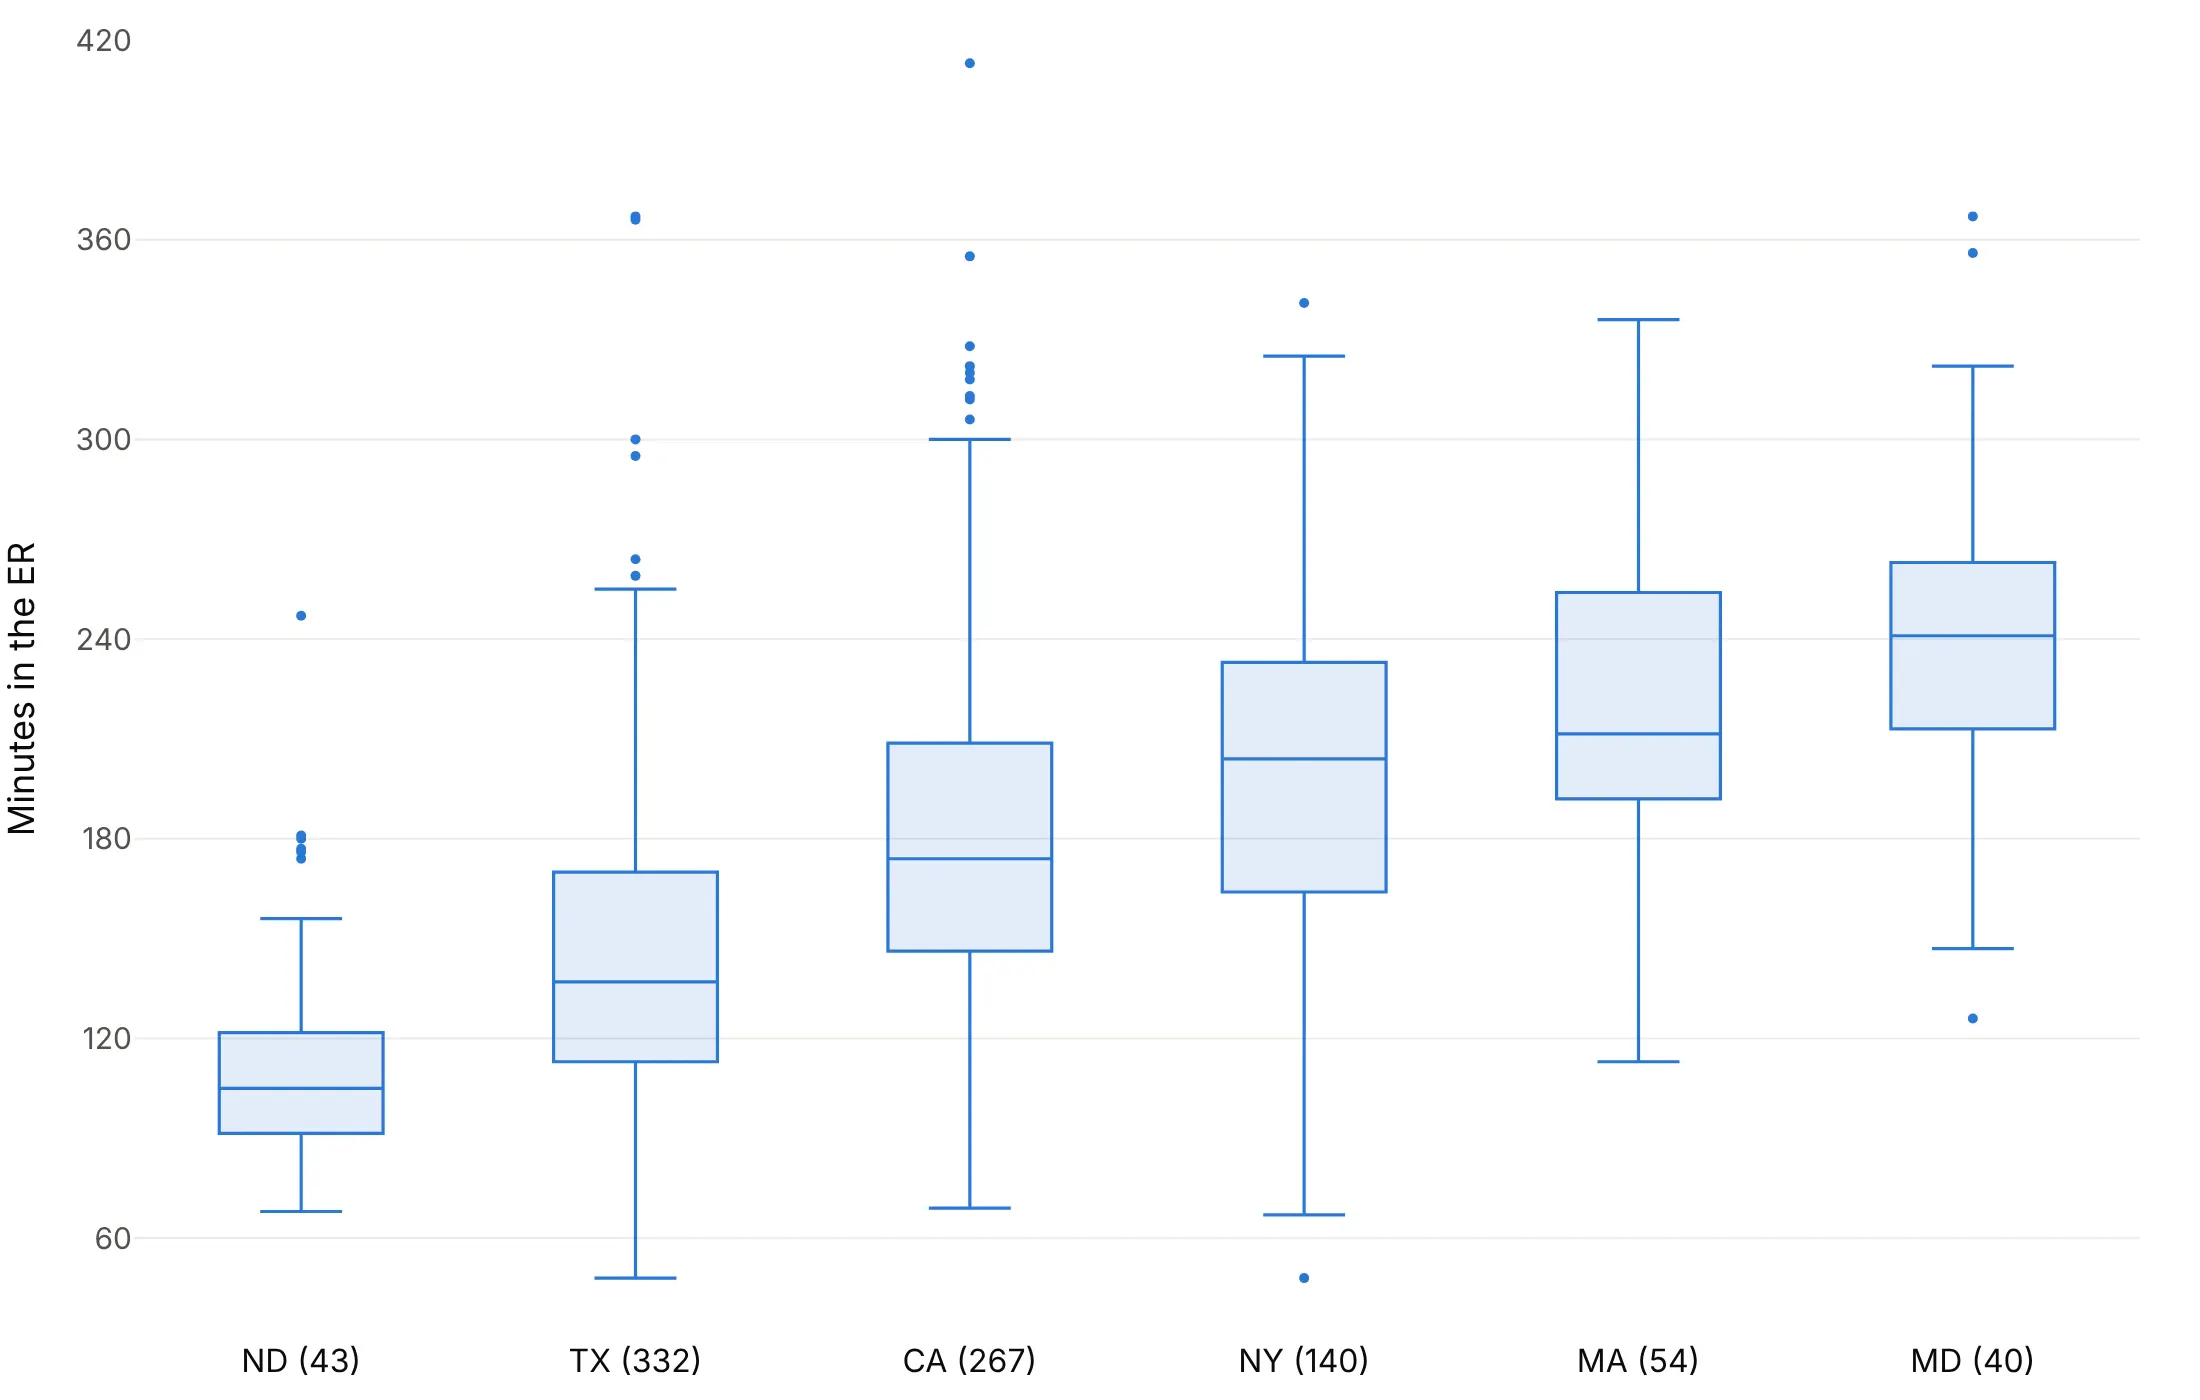
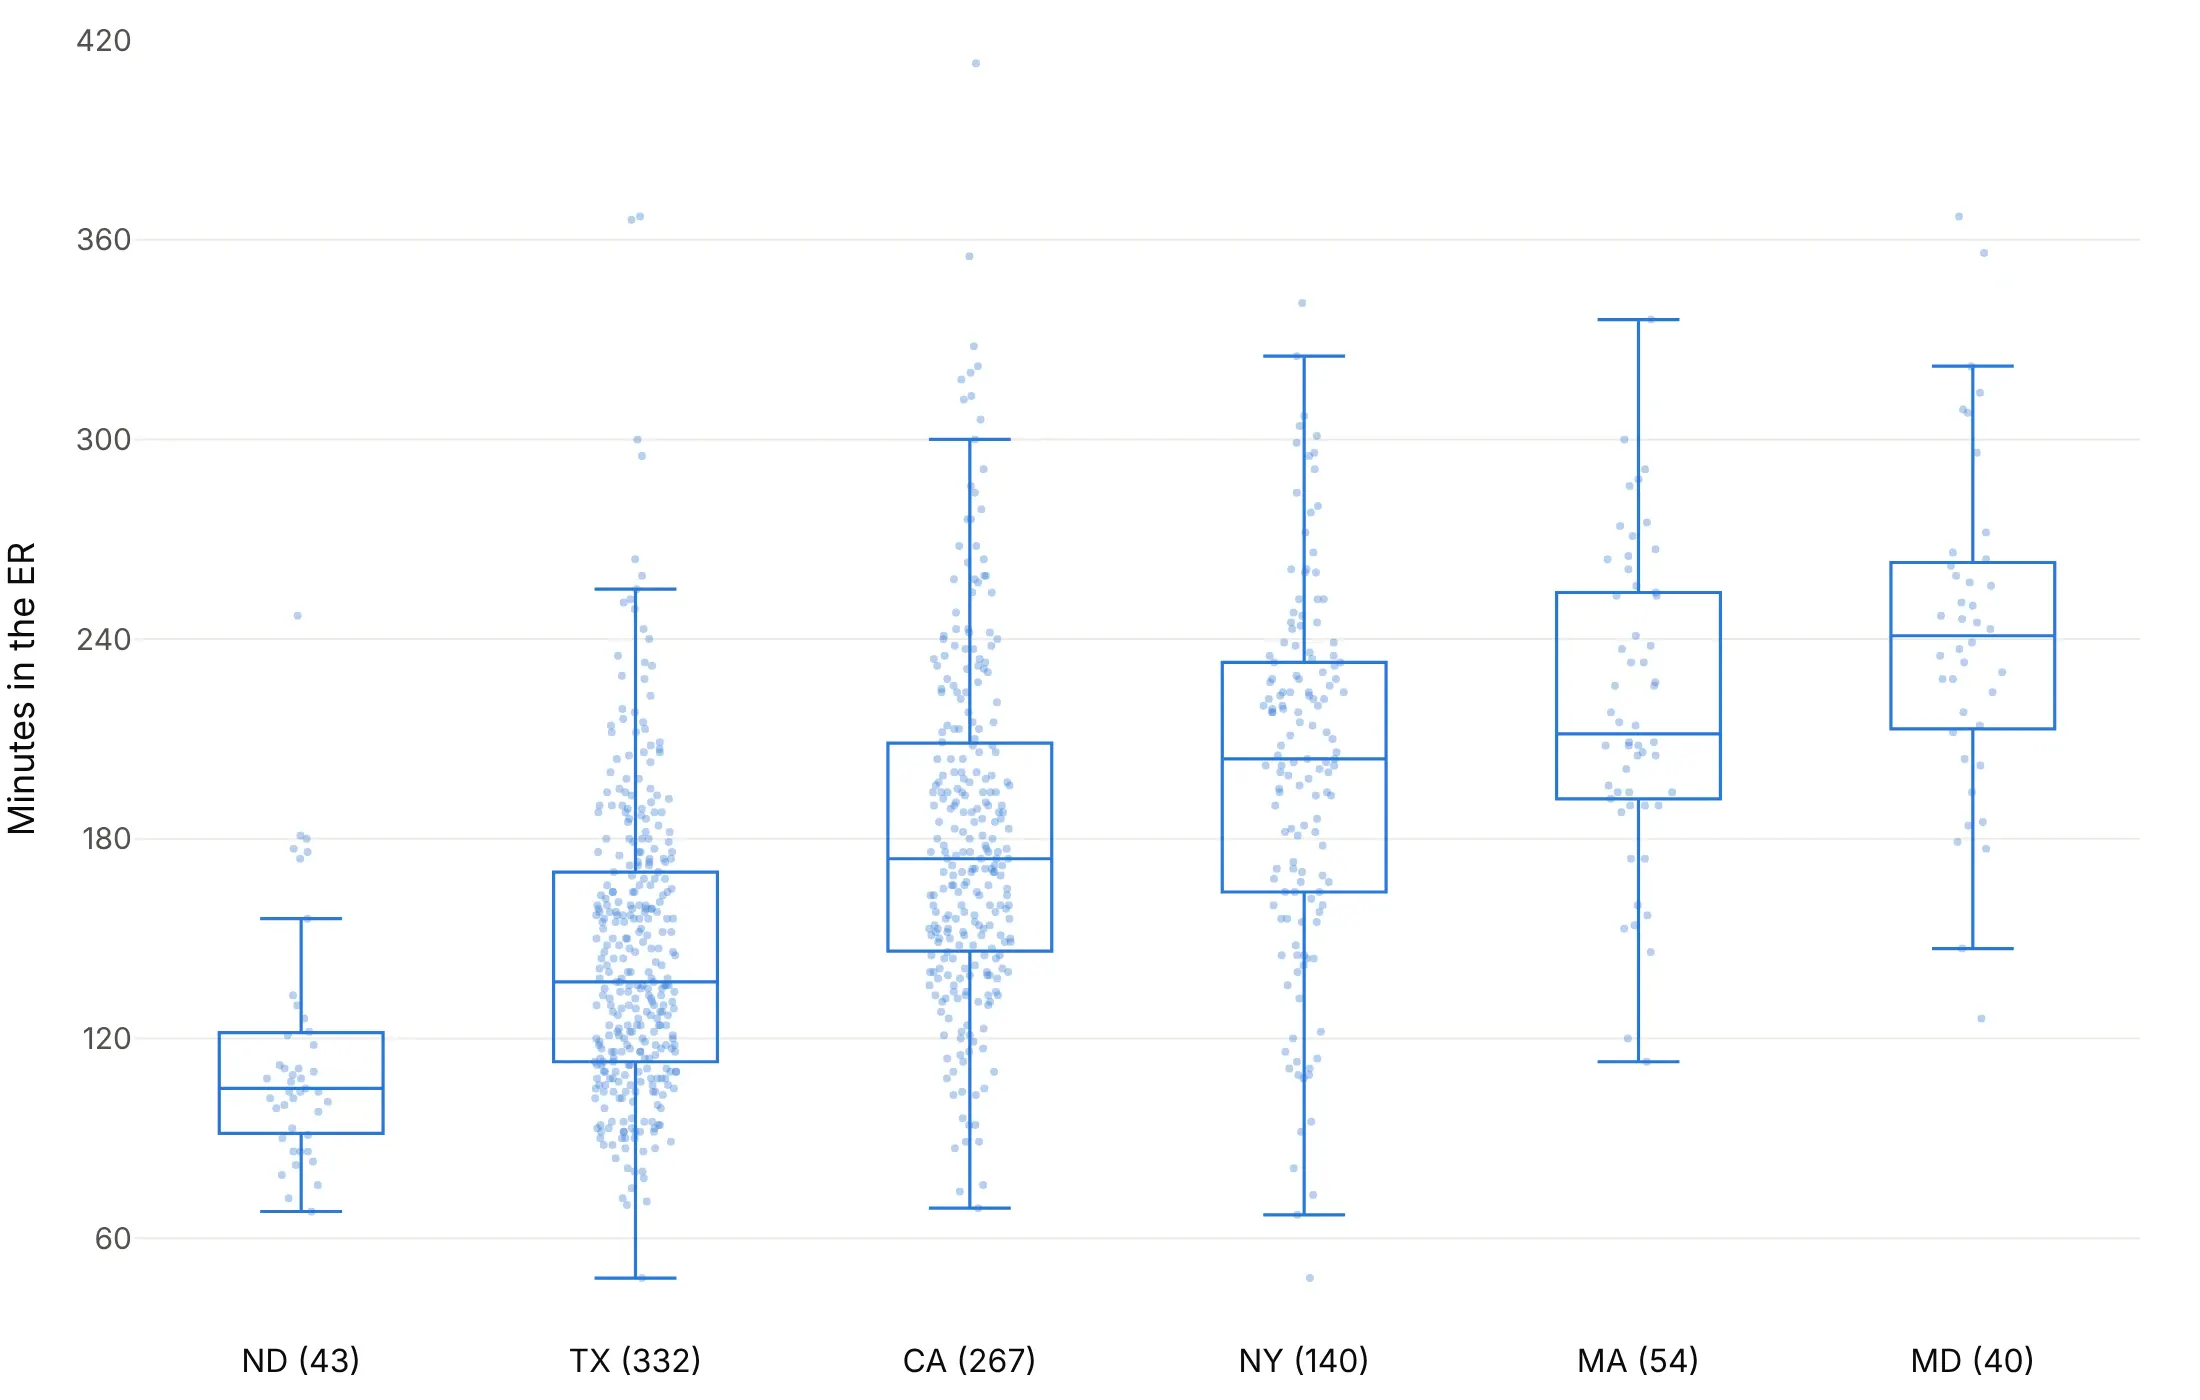
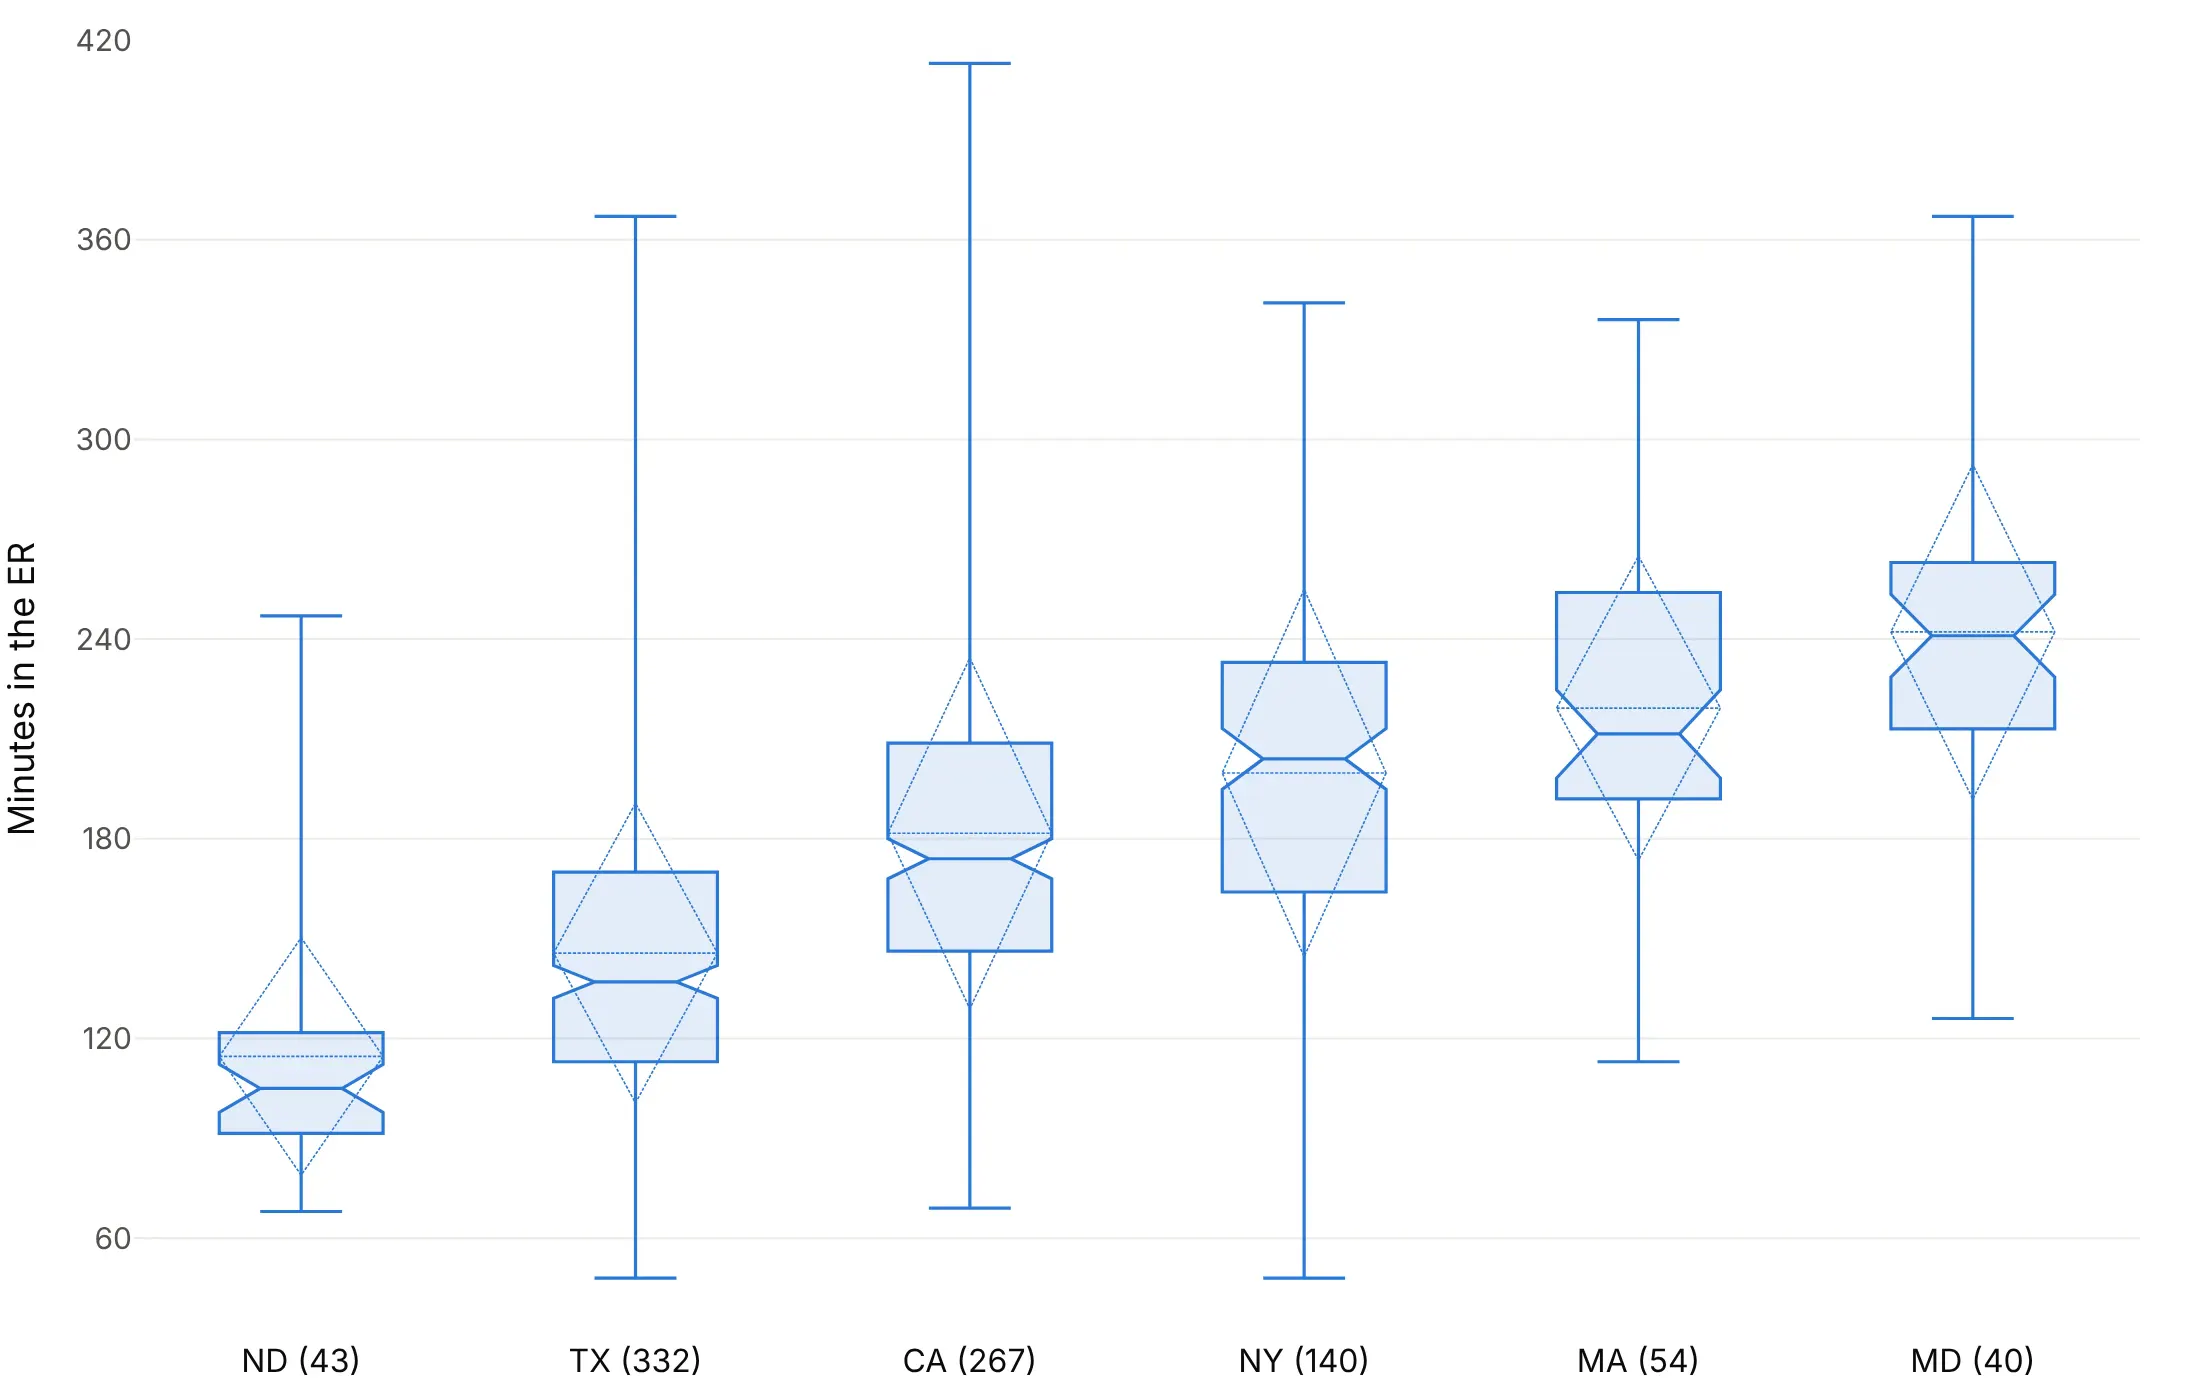
The other big choice is how many of the values to draw. Here are four options on the ER times of hospitals in six states, with the number of hospitals after each state.
Outlier dots only. Plotly's default (boxpoints="outliers"), and the right one for large groups.
Every value. boxpoints="all" with jitter puts each hospital on its box, which shows how few hospitals stand behind the North Dakota and Maryland boxes.
Notches, mean and standard deviation. notched=True answers whether two medians really differ, and boxmean="sd" adds the mean and one standard deviation. With boxpoints=False the whiskers move to the minimum and maximum.
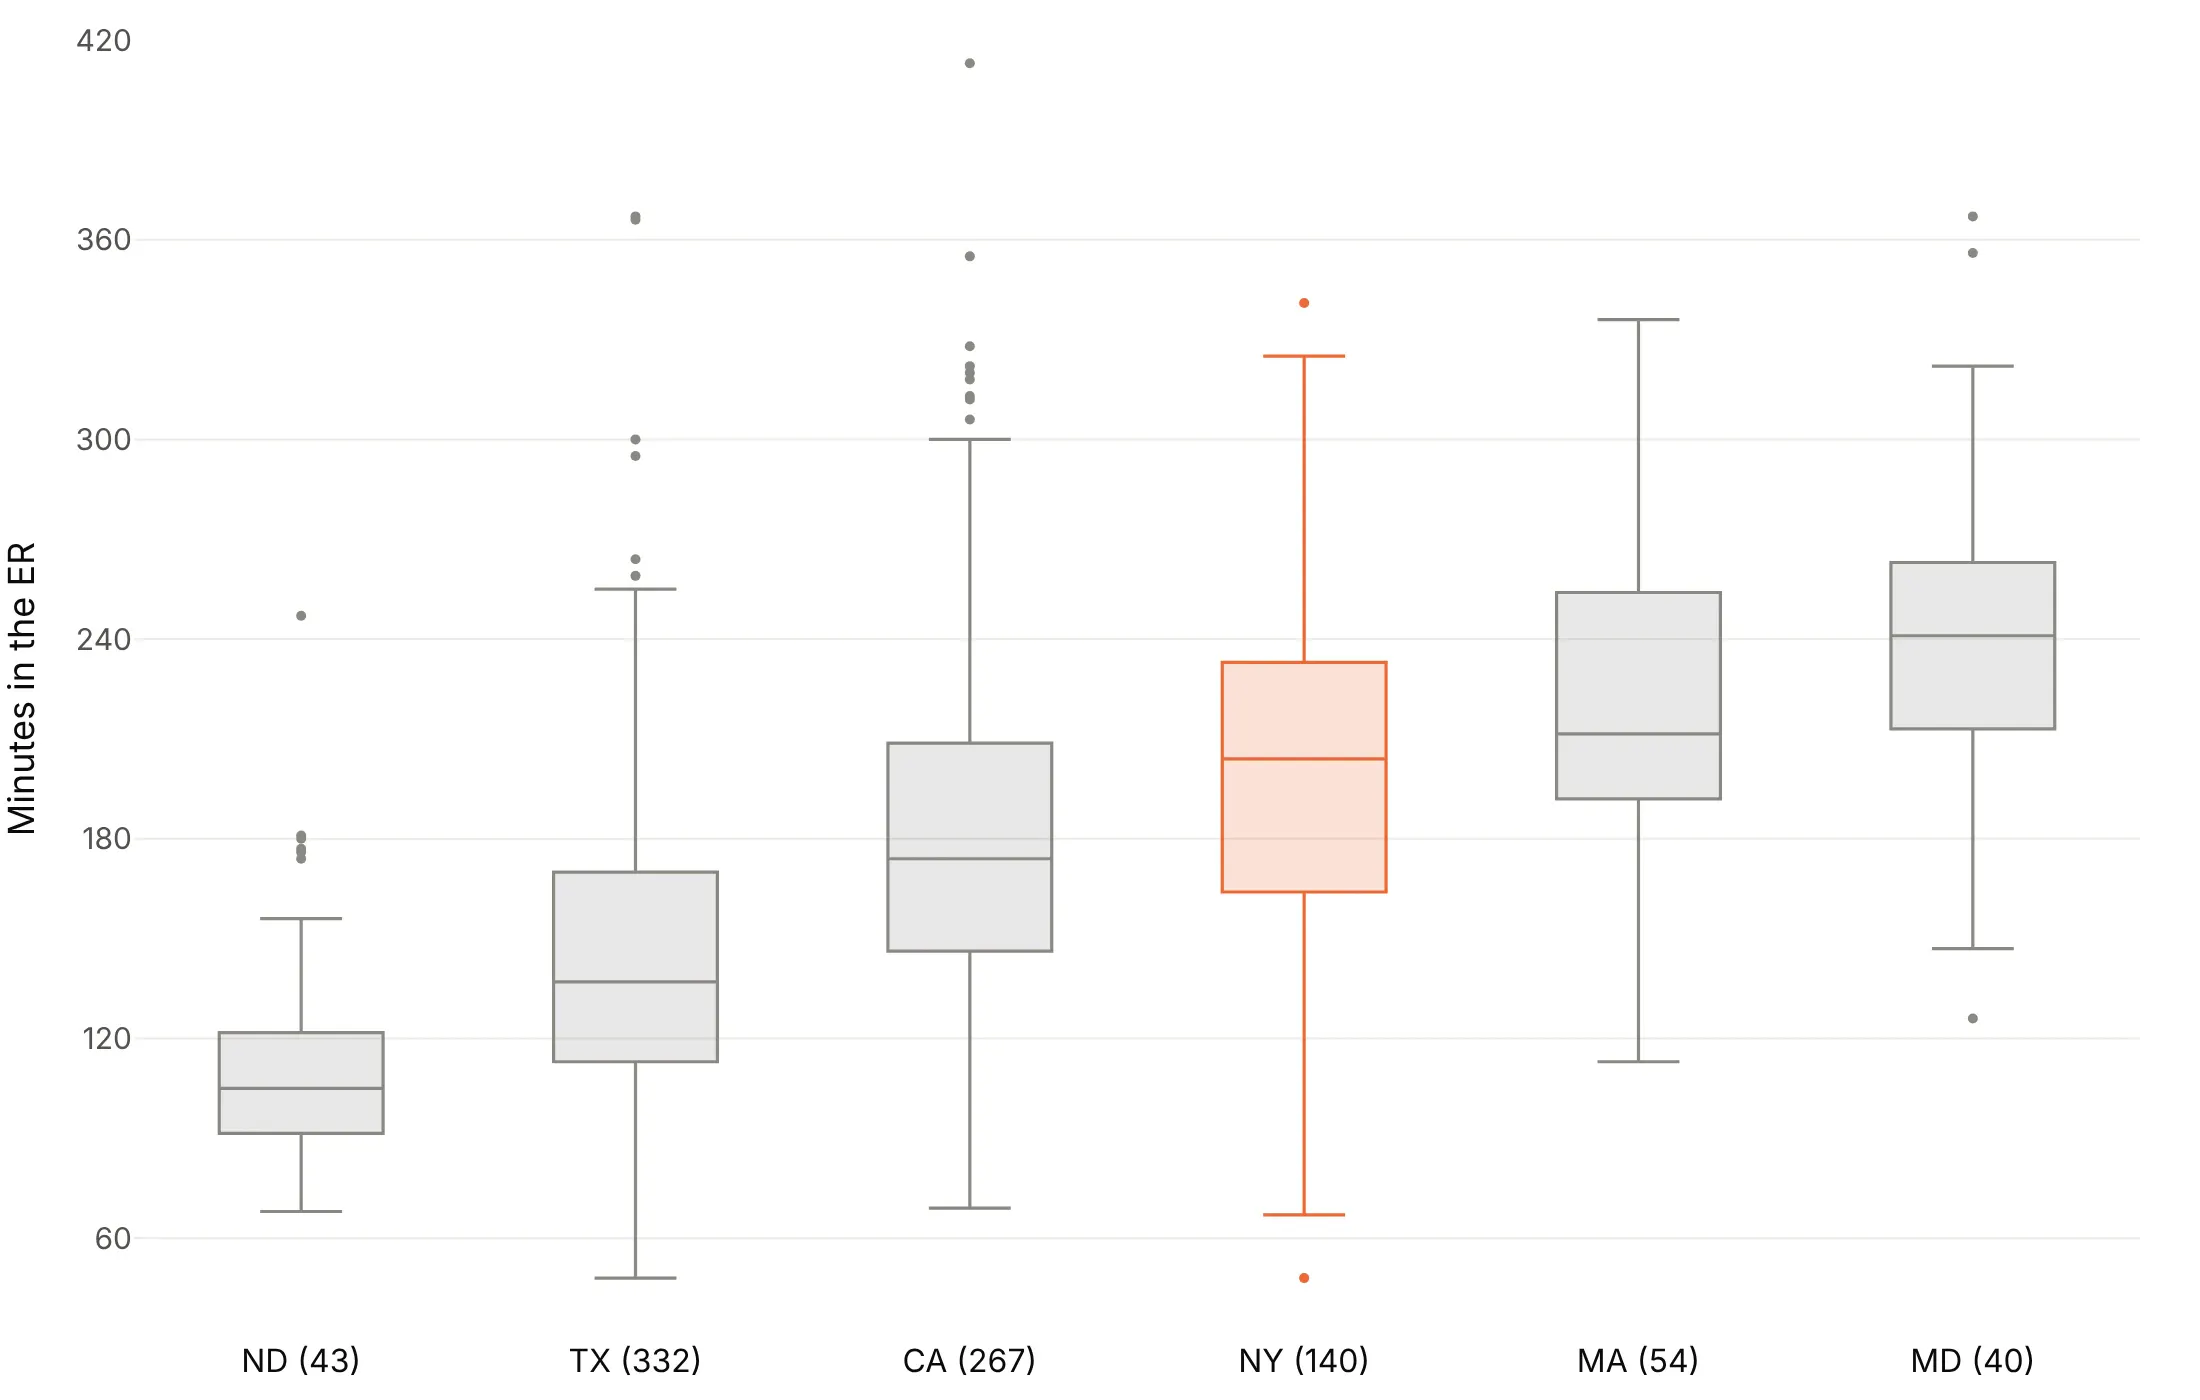
One story. Gray boxes with one state in color, here New York, when the title is about one group.
Checklist
Do
- Write a title that states the takeaway.
- Sort the groups by median, or by IQR when spread is the story, unless they have a natural order like months.
- Go horizontal when labels are long, with orientation="h" or the values on x.
- Print the count next to each group label, because a box of 21 values and a box of 1,438 look the same.
- Show every point for small groups with boxpoints="all", jitter and pointpos.
- Cap the axis when a few extreme values squash the boxes, and say how many points are off the chart.
Don't
- Plot in file order with rotated labels.
- Color each box differently unless the color means something.
- Trust a single box for data that might have two groups in it.
- Hide outliers silently, since boxpoints=False also moves the whiskers to the minimum and maximum.
- Put two $ signs in one title or label, which makes Plotly render it as LaTeX; write $ for one of them.
Options to customize
These are the go.Box (and px.box) options that matter most. The full list is in the Plotly box plot documentation.
- x, y: the values and the group of each value; put the values on x with orientation="h" for horizontal boxes.
- orientation: "v" or "h"; horizontal suits long group labels.
- boxpoints: "outliers" (default), "suspectedoutliers", "all" or False; False also moves the whiskers to the minimum and maximum.
- jitter, pointpos: how far points spread, and where they sit relative to the box (0 on it, -1.6 beside it).
- notched, notchwidth, notchspan: notches at median ± 1.57 x IQR / √n, for comparing medians.
- boxmean: True adds the mean as a dashed line, "sd" adds the standard deviation too.
- quartilemethod: "linear" (default), "inclusive" or "exclusive", to match quartiles from another tool.
- q1, median, q3, lowerfence, upperfence, mean, sd: precomputed statistics instead of raw values, for millions of rows.
- sizemode, sdmultiple: draw the box as the mean ± k standard deviations, for audiences used to error bars.
- marker.outliercolor, marker.line.outliercolor: the colors of mild outliers with "suspectedoutliers".
- width, whiskerwidth: box width, and the whisker cap width as a share of it; setting width turns off automatic grouping.
- offsetgroup, alignmentgroup: which boxes share a slot when you group boxes across traces.
- boxmode, boxgap, boxgroupgap (layout): grouped or overlaid boxes and the gaps between them, for two categorical variables.
- hovertemplate, customdata: hover content, for naming outliers (a hospital, a date, a driver).
More box plot examples
Ten more box plots built from real public data, each with its source, the technique that makes it work and a prompt to rebuild it.
1. Liver blood tests across the stages of hepatitis C
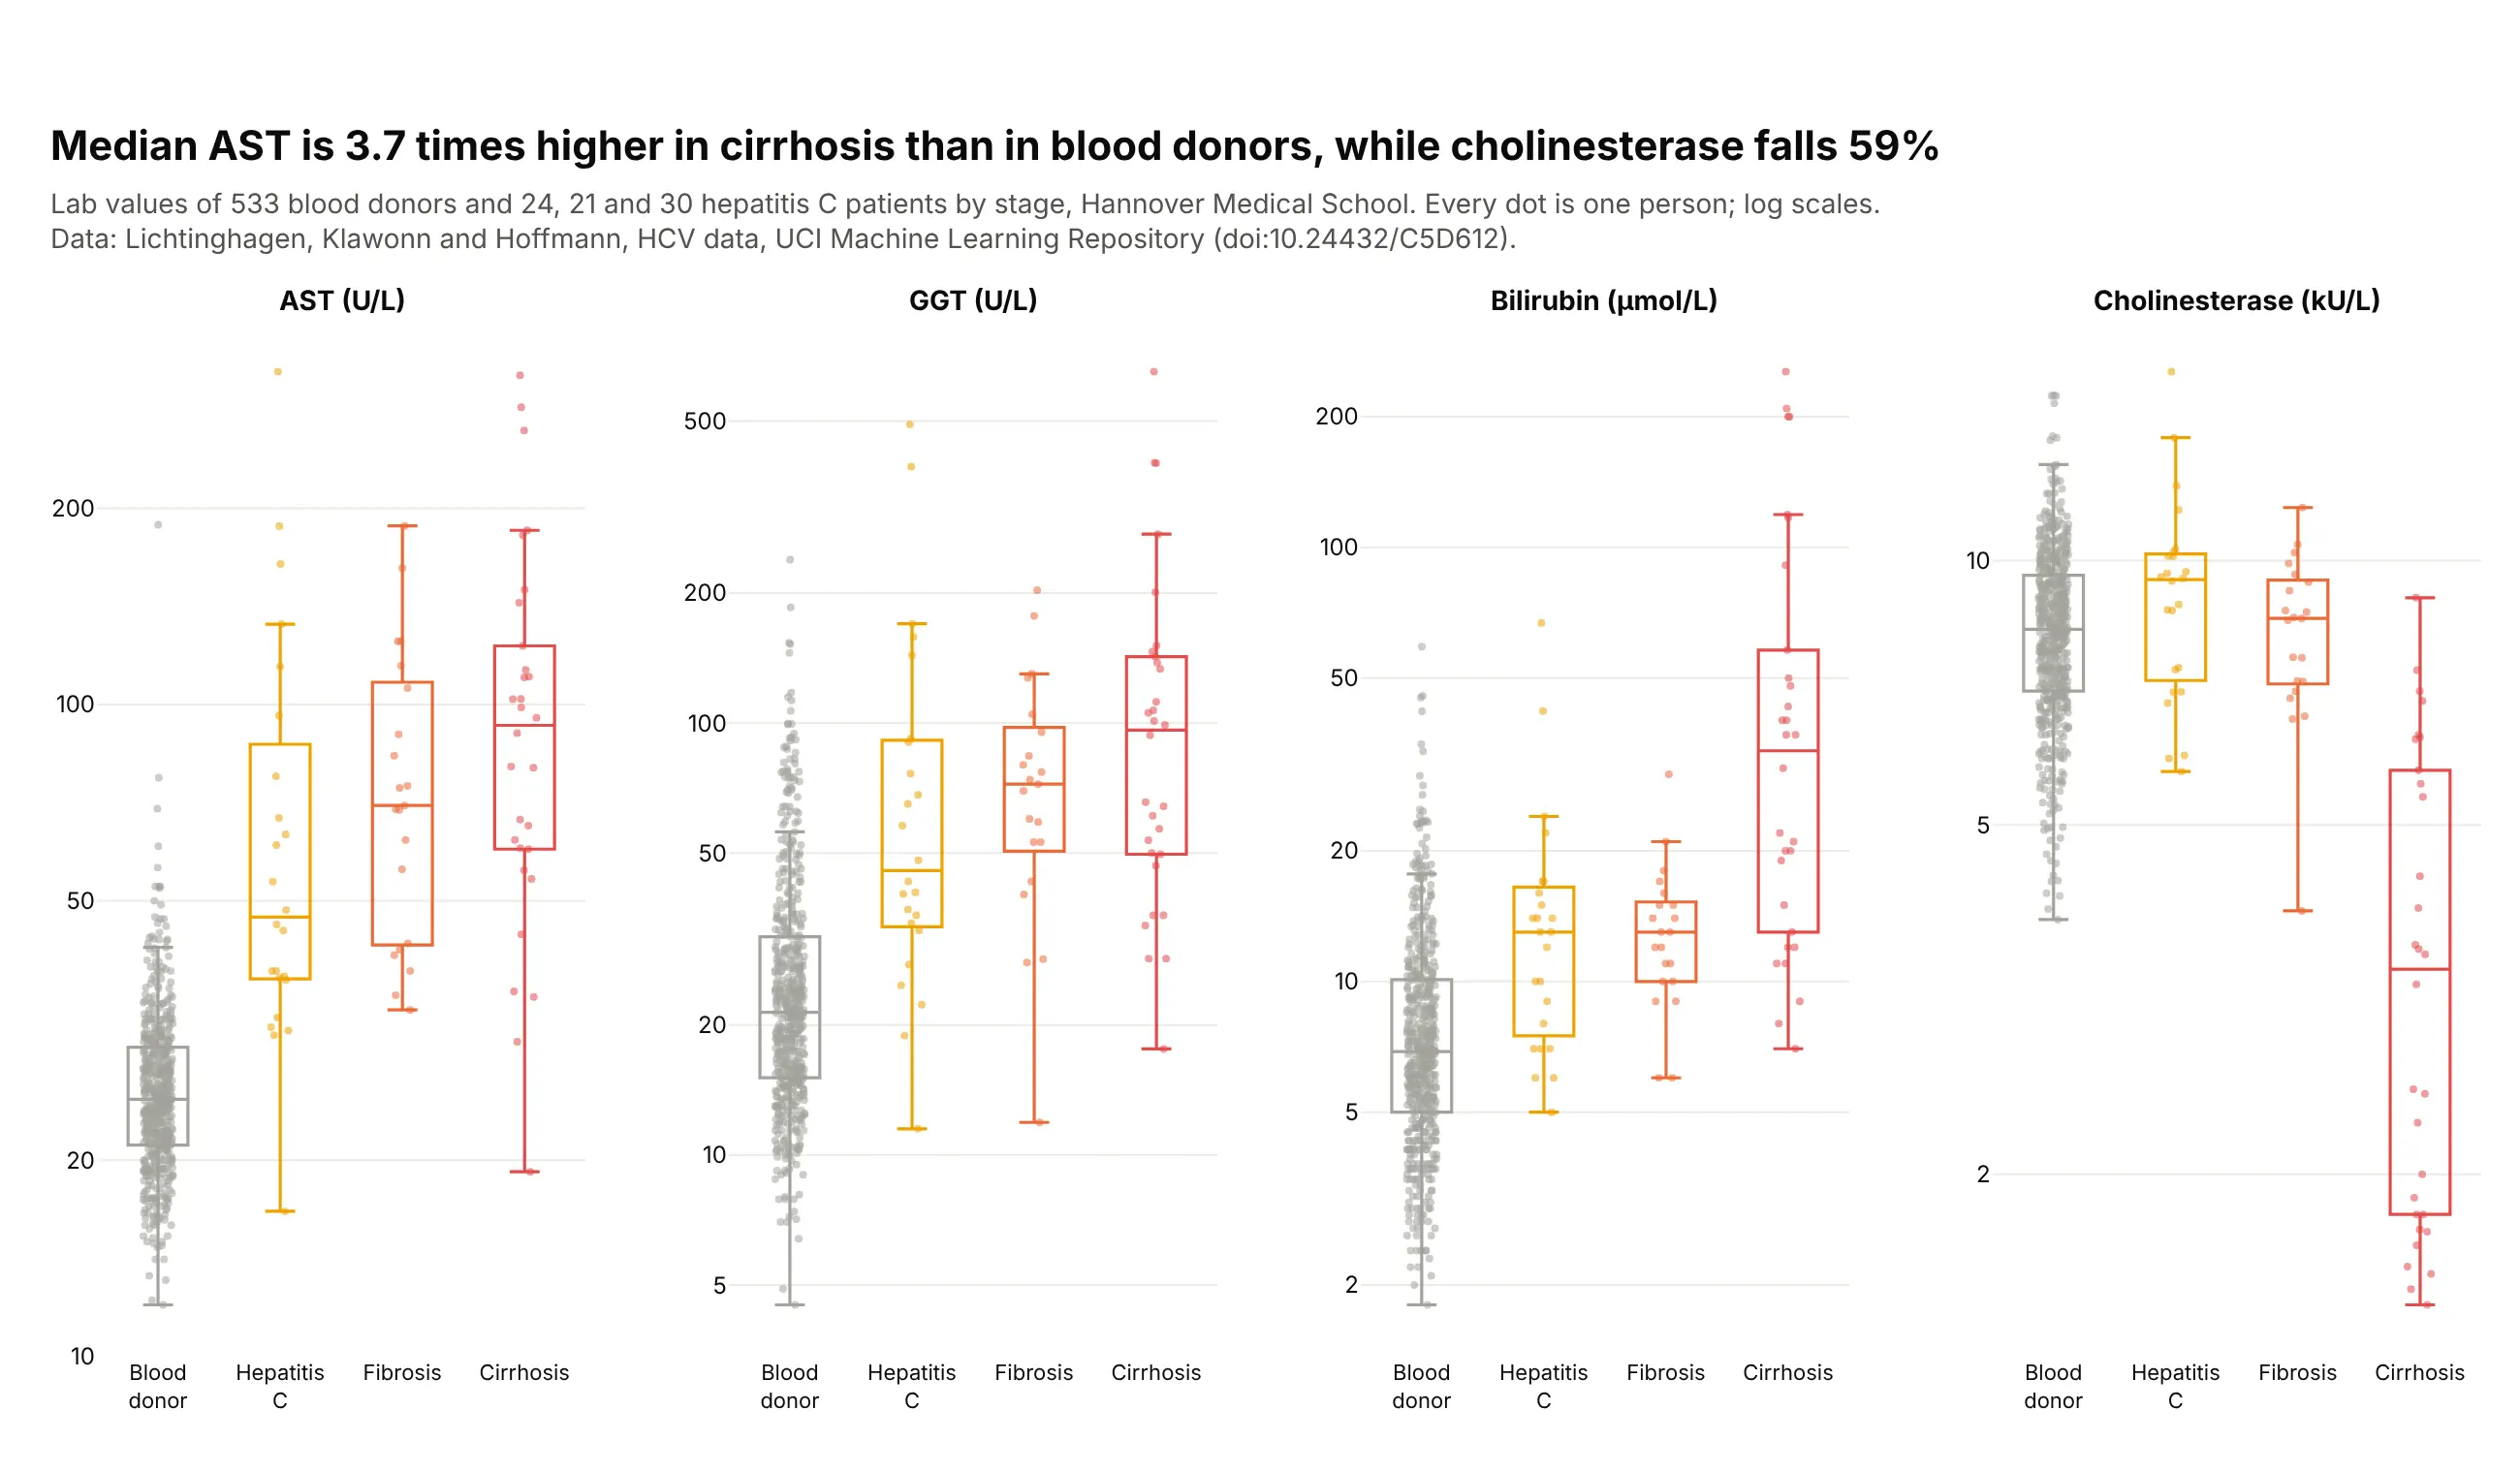
Median AST rises from 24.8 U/L in blood donors to 92.9 in cirrhosis, 3.7 times higher, while cholinesterase, which a working liver makes, falls 59%. With 21 to 30 patients per stage, every patient is drawn. Data: Lichtinghagen, Klawonn and Hoffmann, HCV data, UCI Machine Learning Repository (doi:10.24432/C5D612).
Tip: boxpoints="all" with pointpos=0 puts each patient on the box when groups are small.
Get the data from the HCV dataset in the UCI Machine Learning Repository (archive.ics.uci.edu/dataset/571)and shape it into a long table (columns: category [Blood donor, Hepatitis C, Fibrosis, Cirrhosis],sex, age, test [AST, GGT, bilirubin, cholinesterase], value).Build a 1x4 plotly figure with make_subplots, one panel per test.- In each panel one box per stage in order, colored gray, yellow, orange, red.- boxpoints="all", jitter=0.5, pointpos=0, translucent dots; transparent box fill.- Log y axes with ticks 1, 2, 5, 10, 20, 50, 100, 200, 500.- Title with the AST and cholinesterase changes from donors to cirrhosis.
2. Where the GLP-1 receptor is expressed
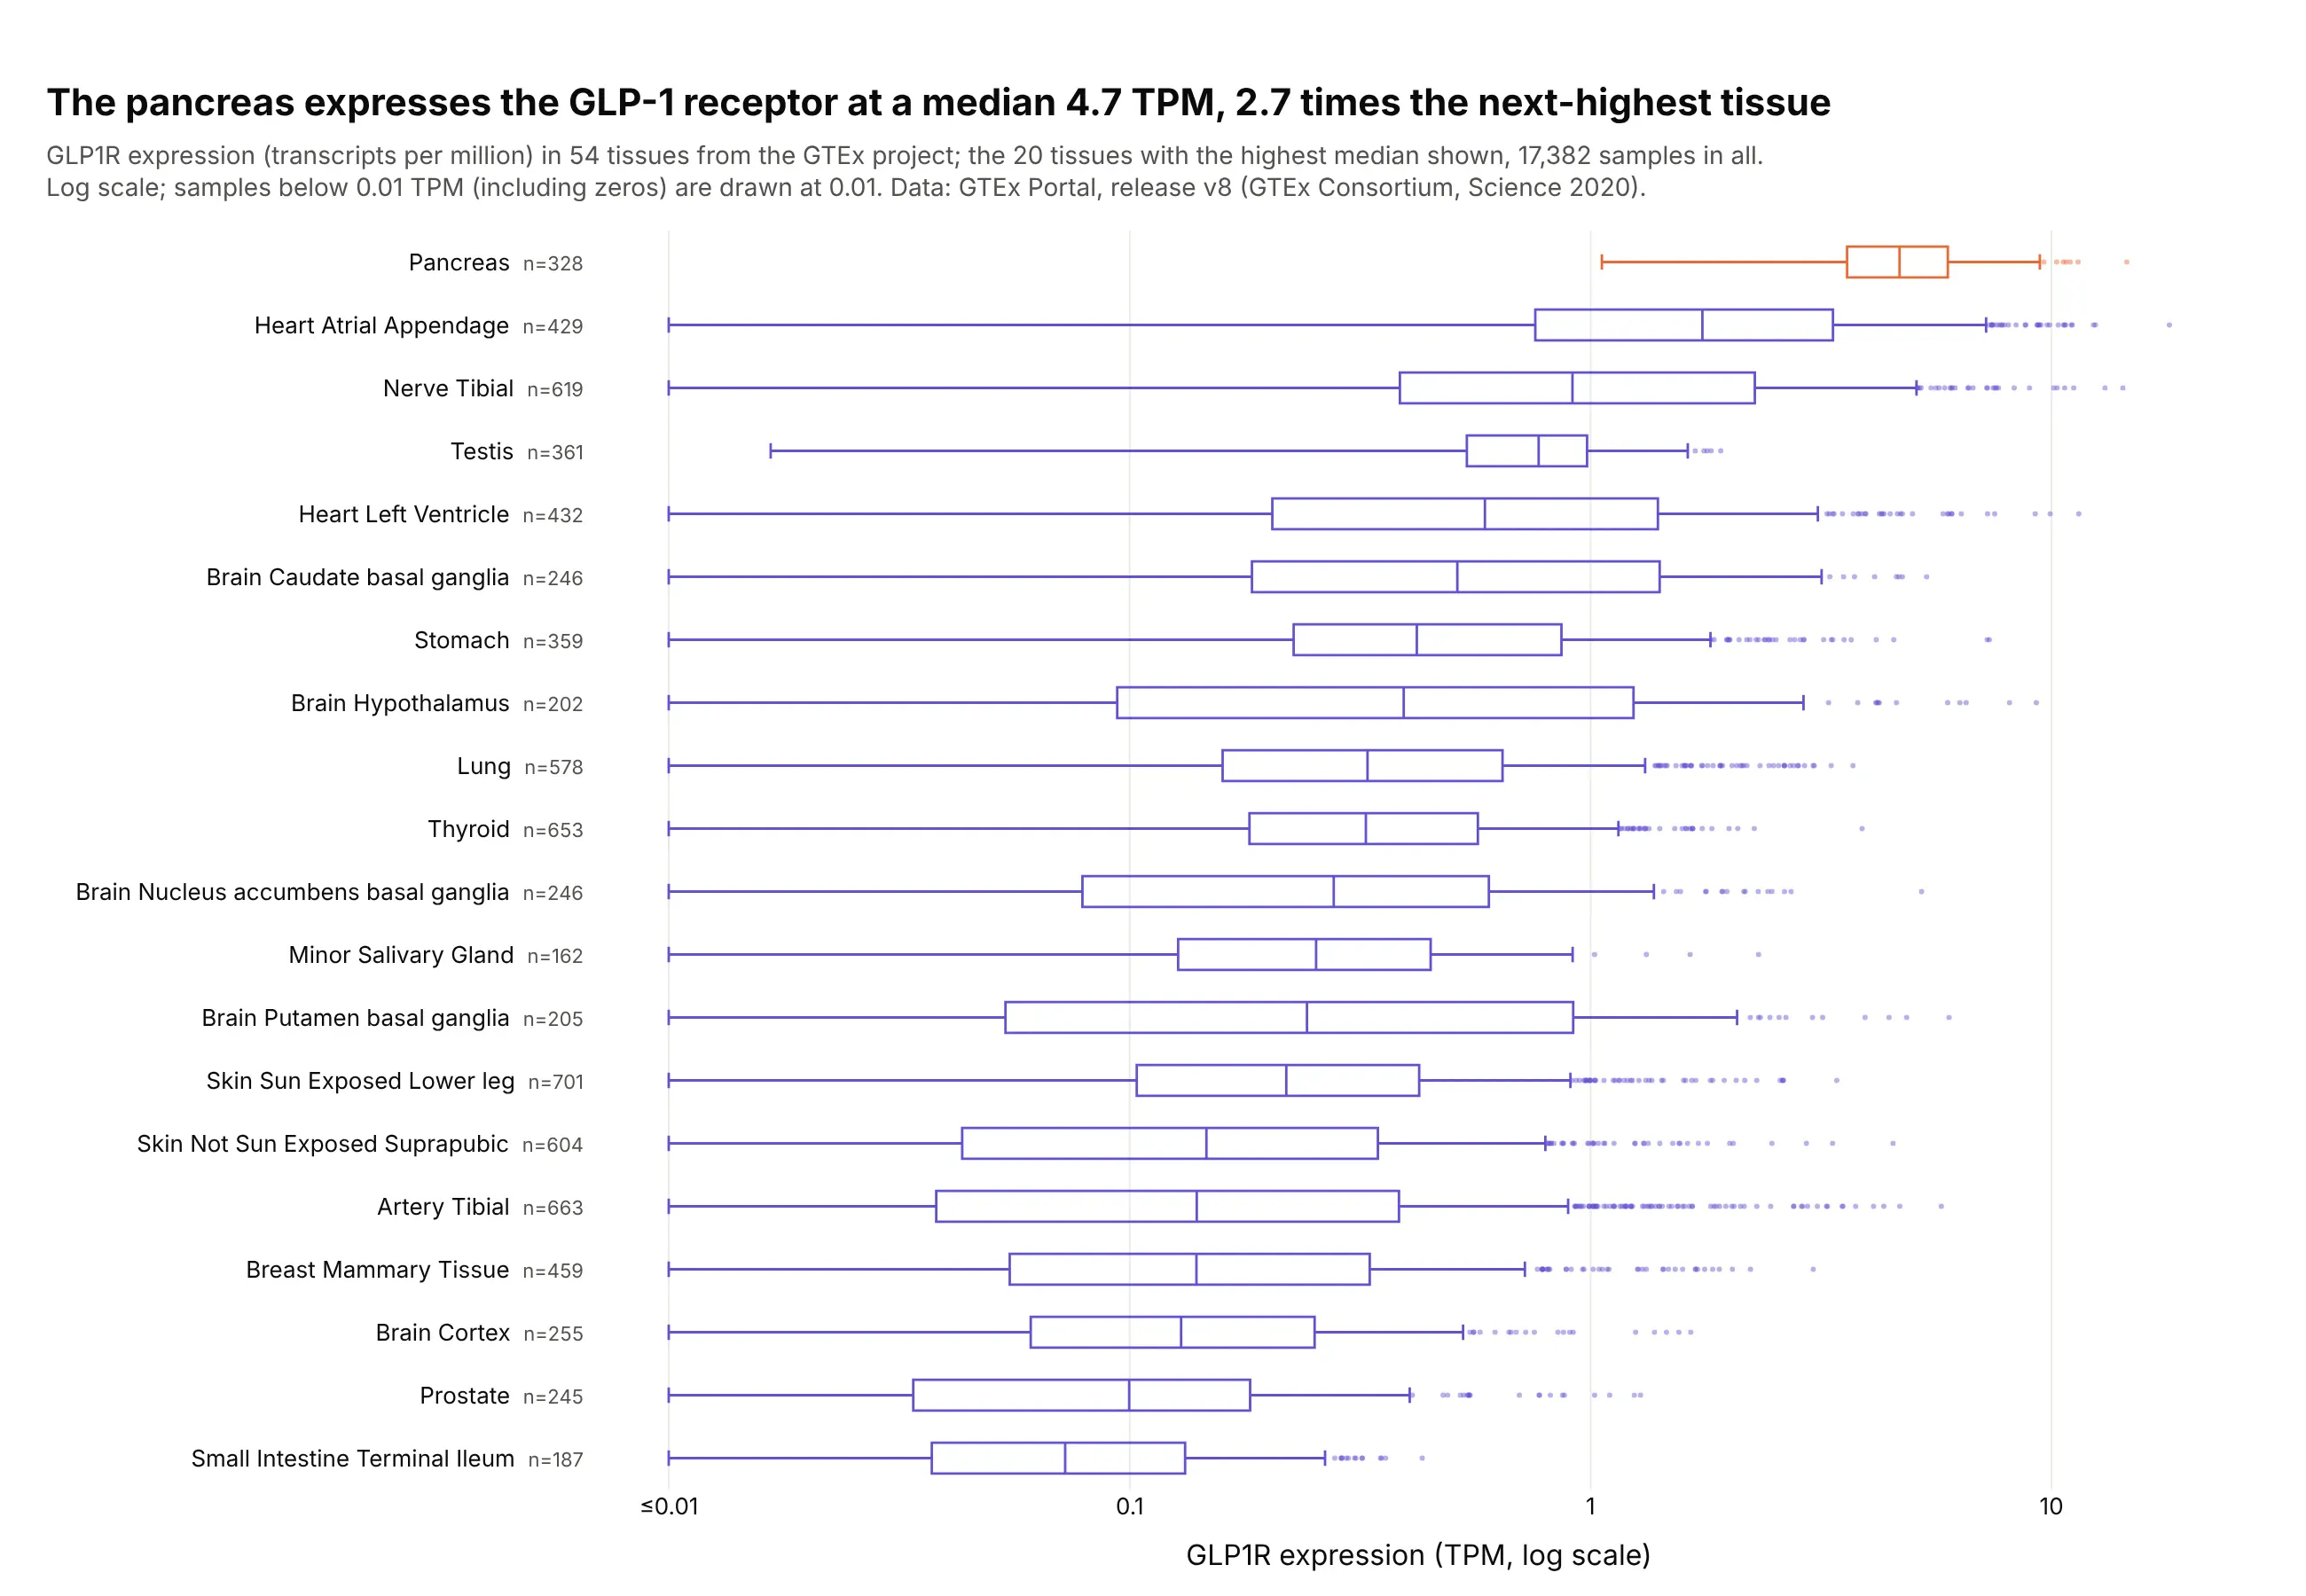
GLP1R, the receptor that semaglutide and tirzepatide act on, has a median 4.7 transcripts per million in the pancreas, 2.7 times the next tissue, and every pancreas sample is above 1 TPM. The stomach and the hypothalamus, both involved in appetite, follow at 0.42 and 0.39. Data: GTEx Portal, release v8, 17,382 samples (GTEx Consortium, Science 2020).
Tip: a log axis for skewed expression data, with zeros floored at 0.01 and the floor stated in the subtitle.
Get the data from the GTEx Portal API v2 (gtexportal.org), gene expression for GLP1R(ENSG00000112164.5) in dataset gtex_v8, and shape it into a table (columns: tissue, tpm [one rowper sample, transcripts per million]).Build a horizontal plotly box plot of the 20 tissues with the highest median, sorted by median.- Log x axis; clip values below 0.01 to 0.01 and label that tick "≤0.01".- Purple boxes (#6250d6) with the pancreas in orange (#eb6834); n after each tissue name.- Title with the pancreas median and its ratio to the next tissue.
3. Bank efficiency by size, with notches
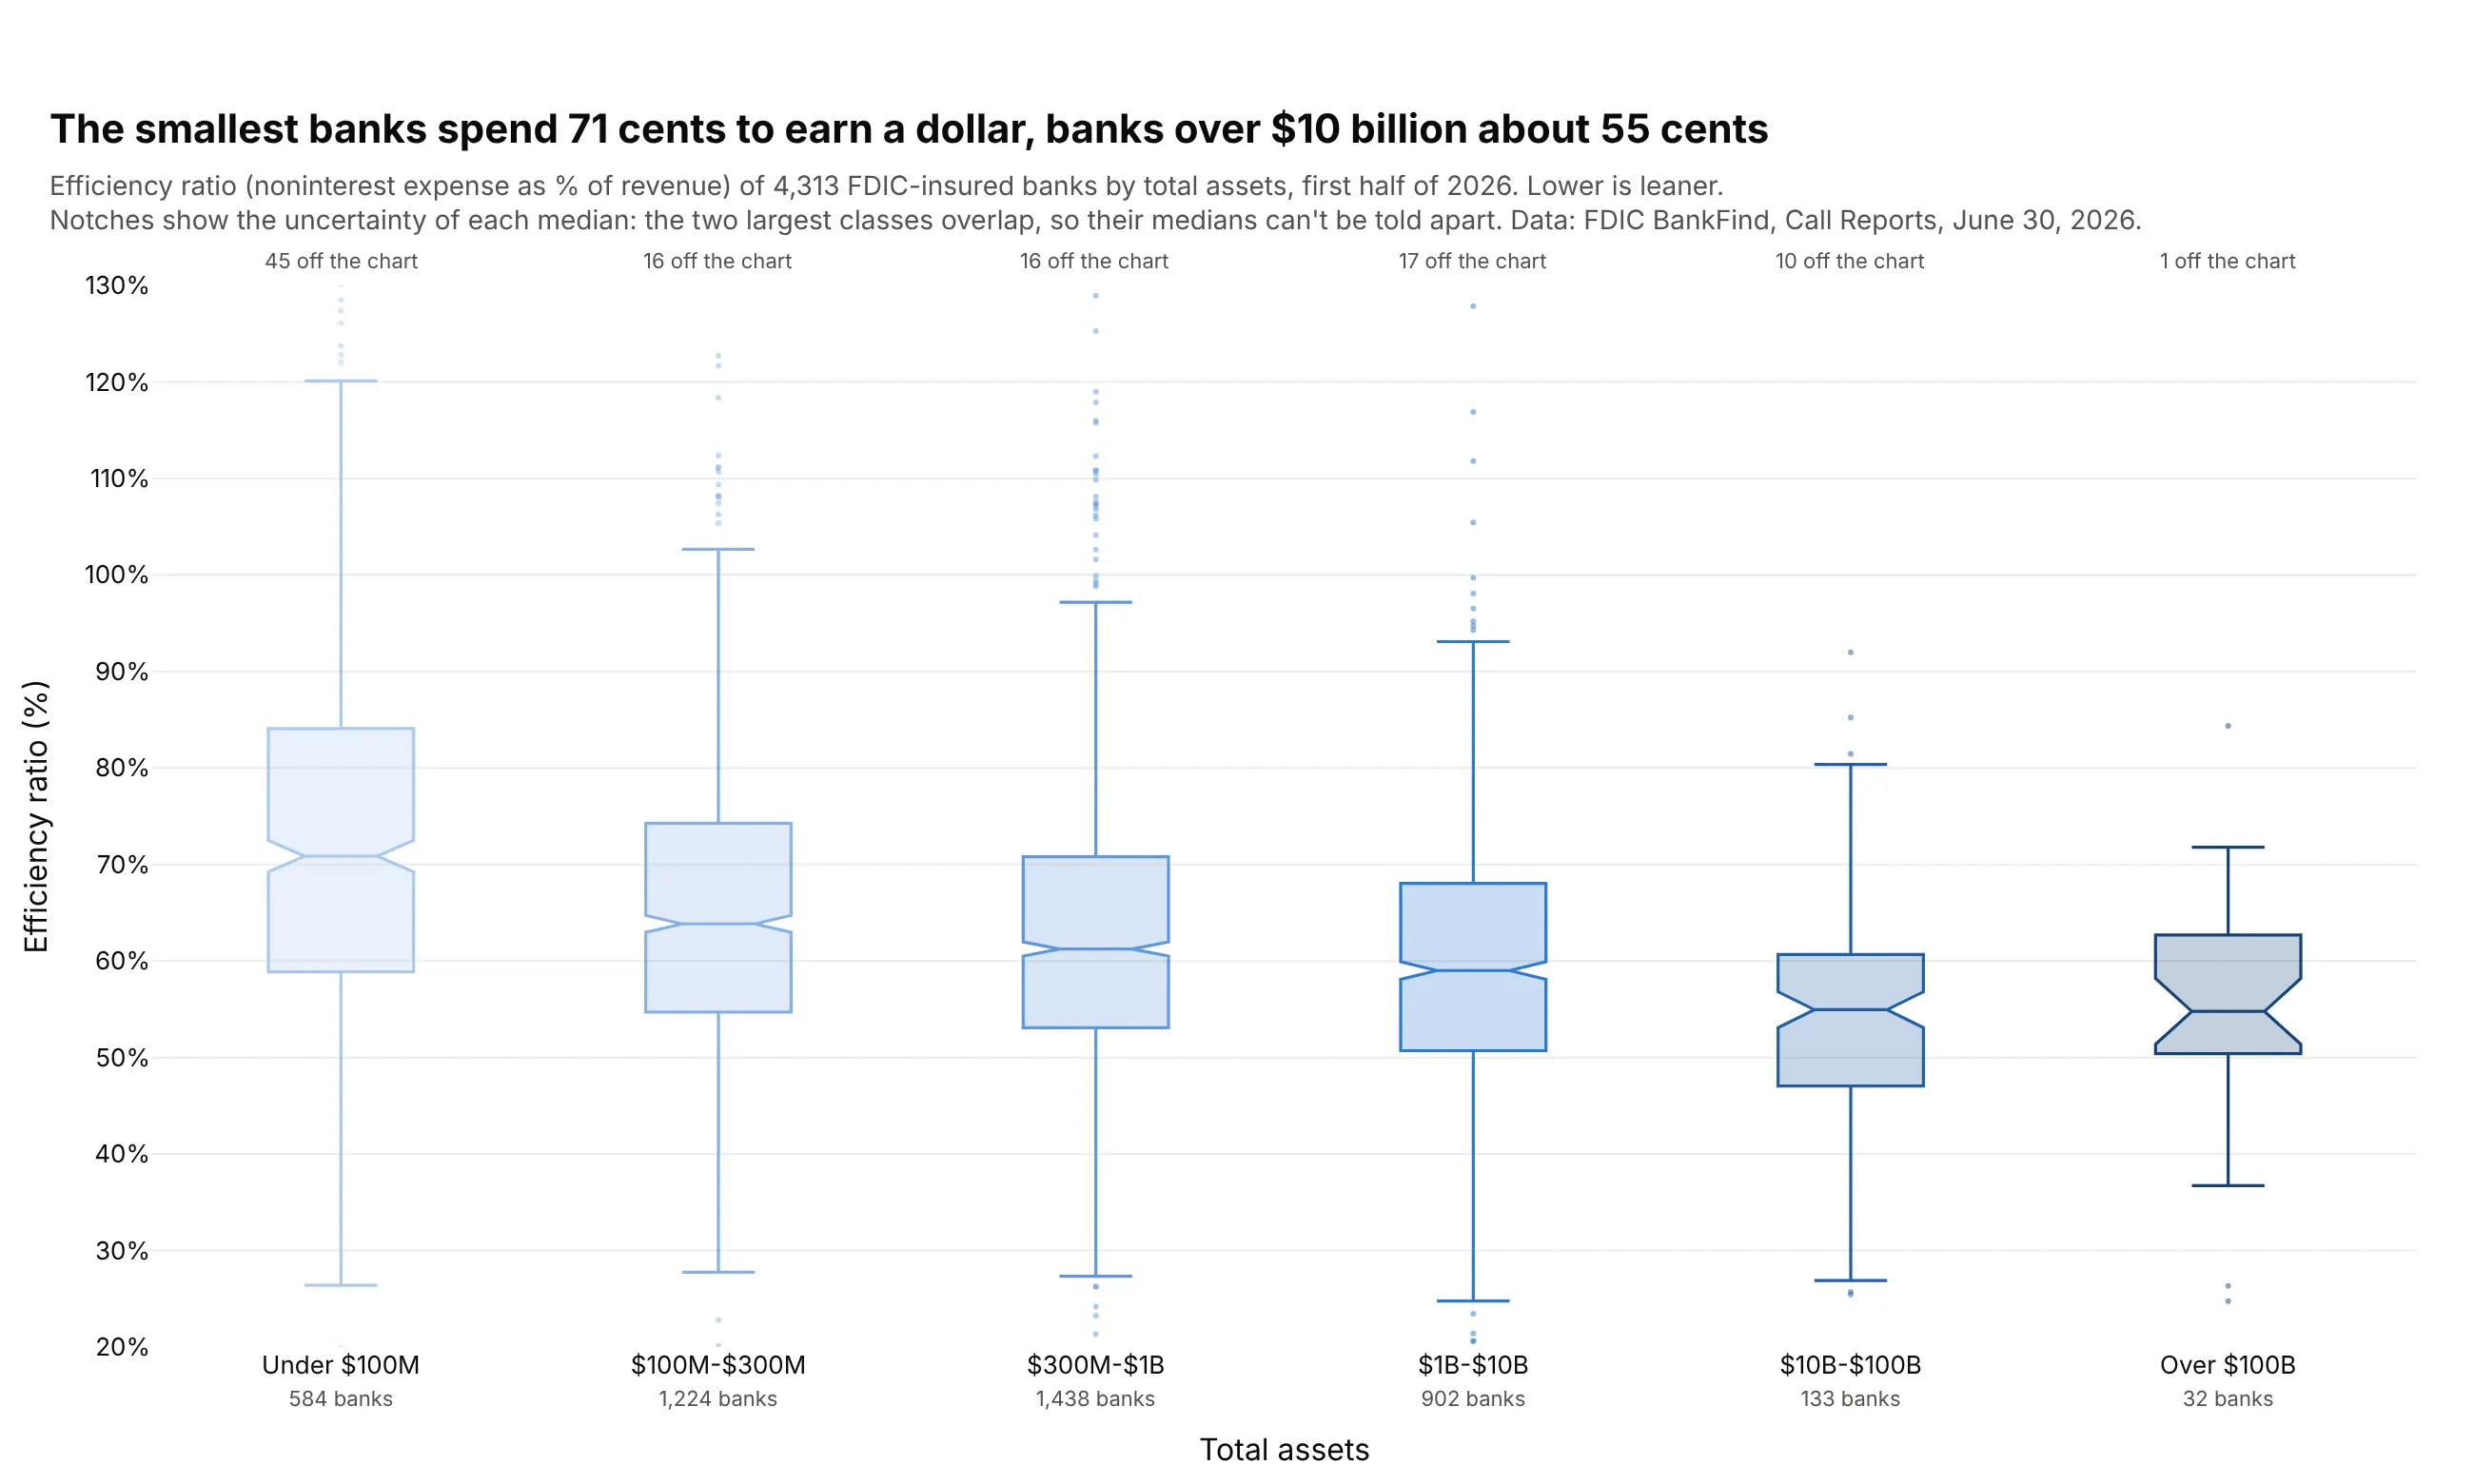
Banks under $100 million in assets spend a median 71 cents to earn a dollar of revenue, and banks over $10 billion spend about 55. The notches of the two largest classes overlap, so their medians can't be told apart. Data: FDIC BankFind Suite, Call Reports for June 30, 2026.
Tip: notched=True, with the axis capped at 20-130% and the banks outside counted above each box.
Get the data from the FDIC BankFind Suite API, institution financials for report date 2026-06-30(api.fdic.gov/banks/financials), and shape it into a table (columns: cert, name, state, assets_k,efficiency_ratio, roa, nim, size_class [six classes from under $100M to over $100B]).Build a plotly box plot of efficiency_ratio by size_class in size order.- notched=True, sequential blues from light (small) to dark (large).- Cap the y axis at 20% to 130% and write "N off the chart" above each box.- Two-line x labels with the number of banks.- Title comparing the smallest and largest medians; explain notches in the subtitle.
4. Demand at US Treasury auctions
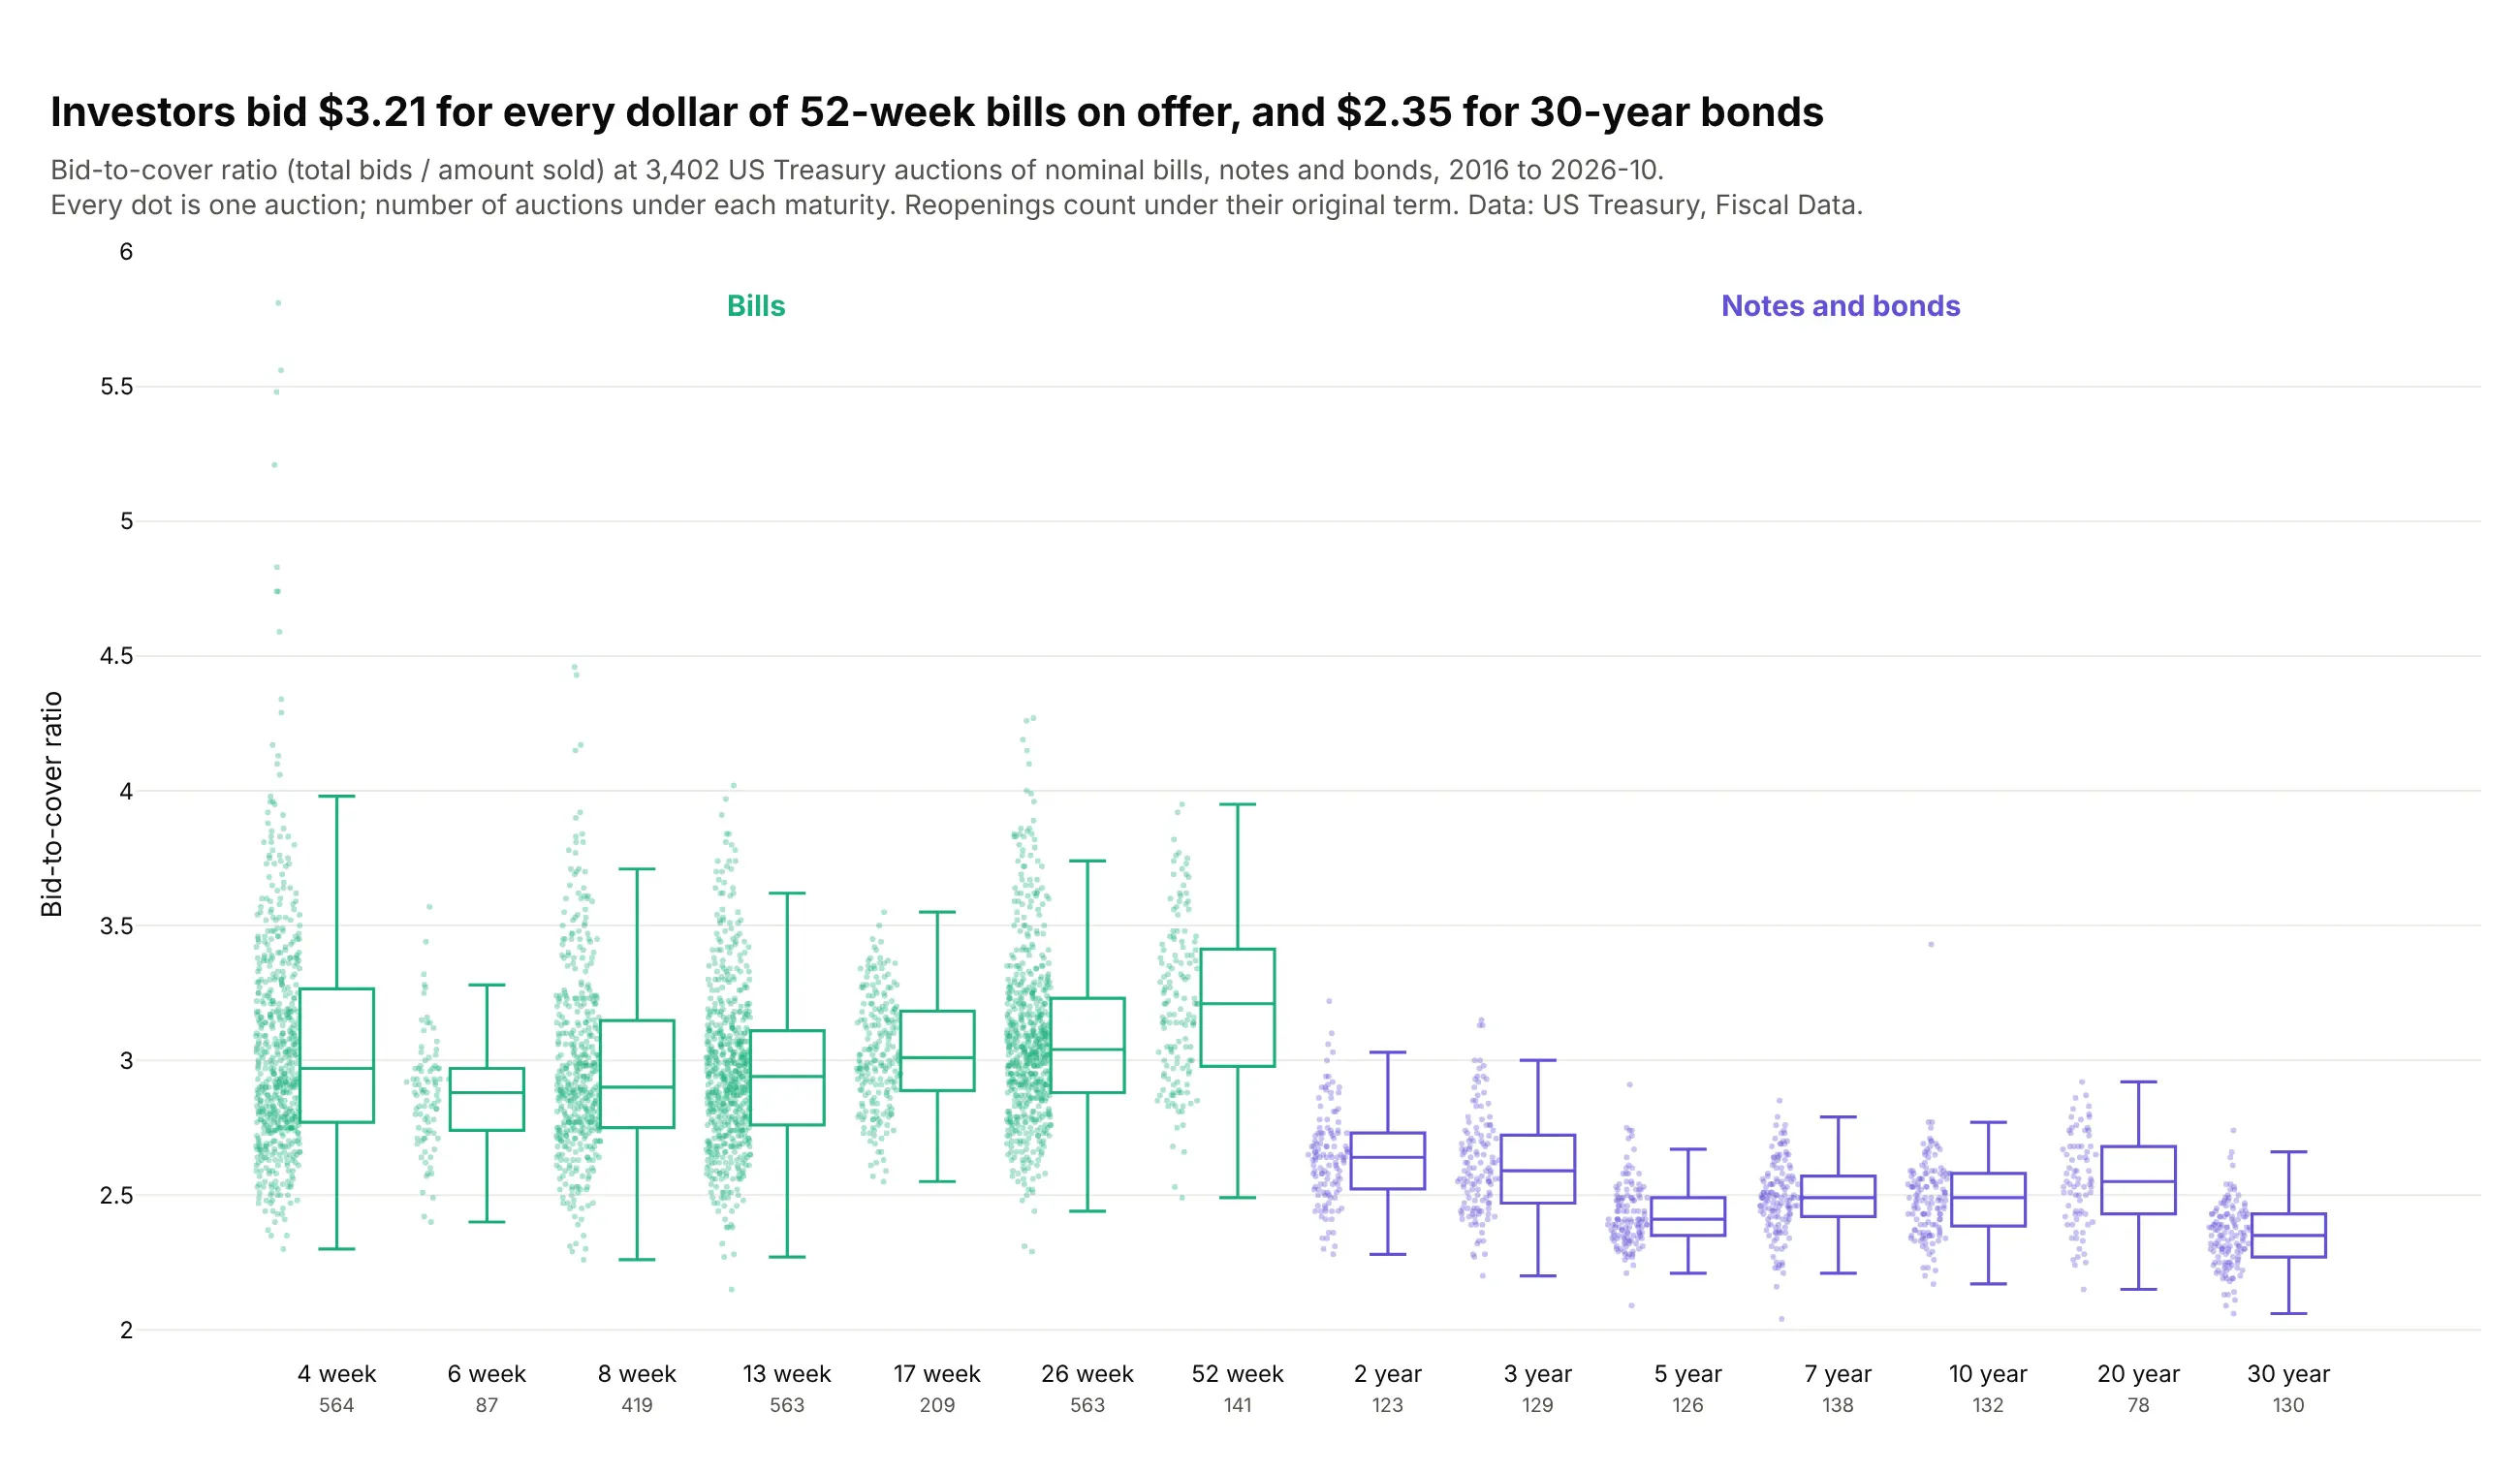
Since 2016, investors bid a median $3.21 for every dollar of 52-week bills on offer and $2.35 for 30-year bonds. Bills draw about 3 bids per dollar at every maturity, and demand thins as notes and bonds get longer. Data: US Treasury, Fiscal Data, Treasury Securities Auctions Data, January 2016 to October 2026.
Tip: pointpos=-1.6 draws the dots beside each box, so the number of auctions shows without hiding the box.
Get the data from US Treasury Fiscal Data, Treasury Securities Auctions Data(fiscaldata.treasury.gov/datasets/treasury-securities-auctions-data), auctions since 2016, and shapeit into a table (columns: auction_date, security_type, term, reopening, offering_amt_bn,bid_to_cover, rate). Leave out TIPS, FRNs and cash management bills.Build a plotly box plot of bid_to_cover by term in maturity order (4-week to 30-year).- Bills in #1baf7a, notes and bonds in #6250d6.- boxpoints="all", jitter=0.6, pointpos=-1.6, small translucent dots.- Number of auctions under each label; group labels "Bills" and "Notes and bonds" above.- Title comparing 52-week bills with 30-year bonds.
5. New York City's power price by hour
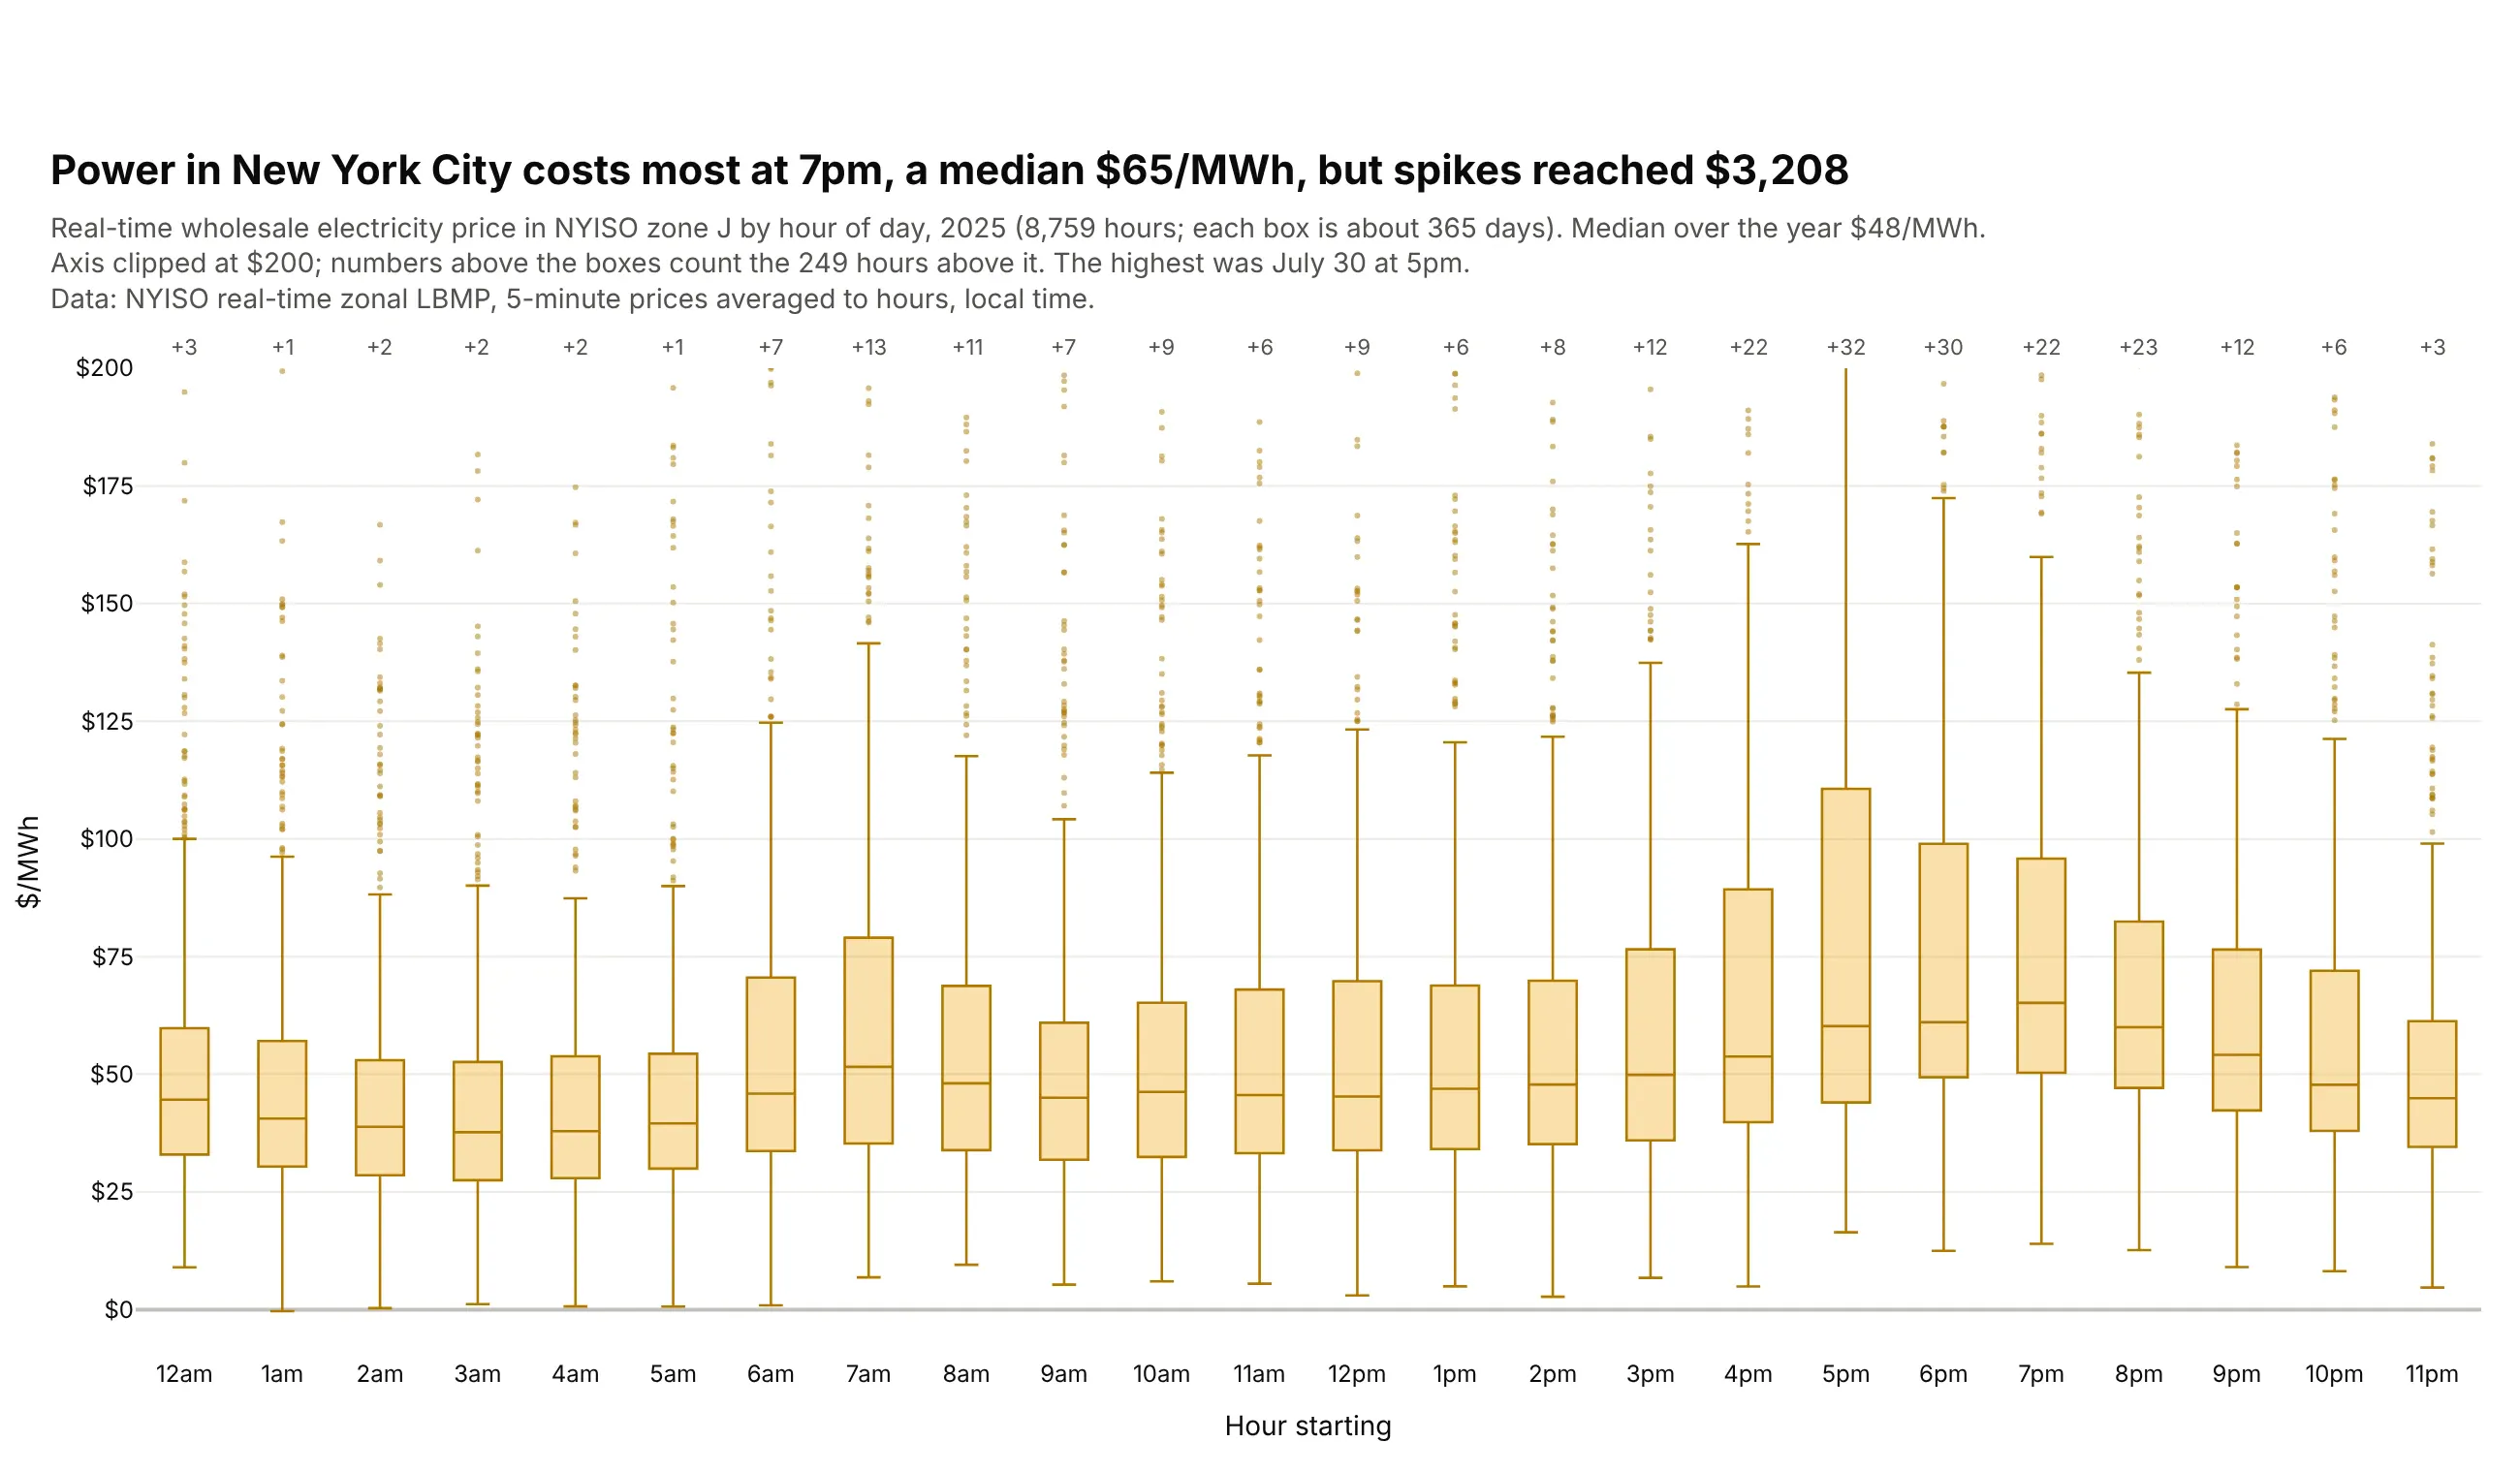
New York City's real-time power price peaks at a median $65/MWh at 7pm, against $38 at 3am. 249 hours cost more than $200, and on July 30 at 5pm the price reached $3,208. Data: NYISO real-time zonal LBMP, zone J, 2025.
Tip: clip the axis to where the boxes are and print the number of clipped values above each box.
Get the data from NYISO real-time zonal LBMP for 2025 (mis.nyiso.com/public/csv/rtlbmp/), averagedfrom 5-minute to hourly prices, and shape it into a table (columns: hour, zone, price [$/MWh]).Build a plotly box plot of zone J (New York City) prices by hour of day (24 boxes, "12am" to "11pm").- Yellow boxes, boxpoints="outliers", y axis clipped at $200.- Above each box, the number of hours over $200 in small gray text.- Title with the most expensive median hour and the highest price of the year.- Write dollar signs in titles as $ so plotly doesn't render them as LaTeX.
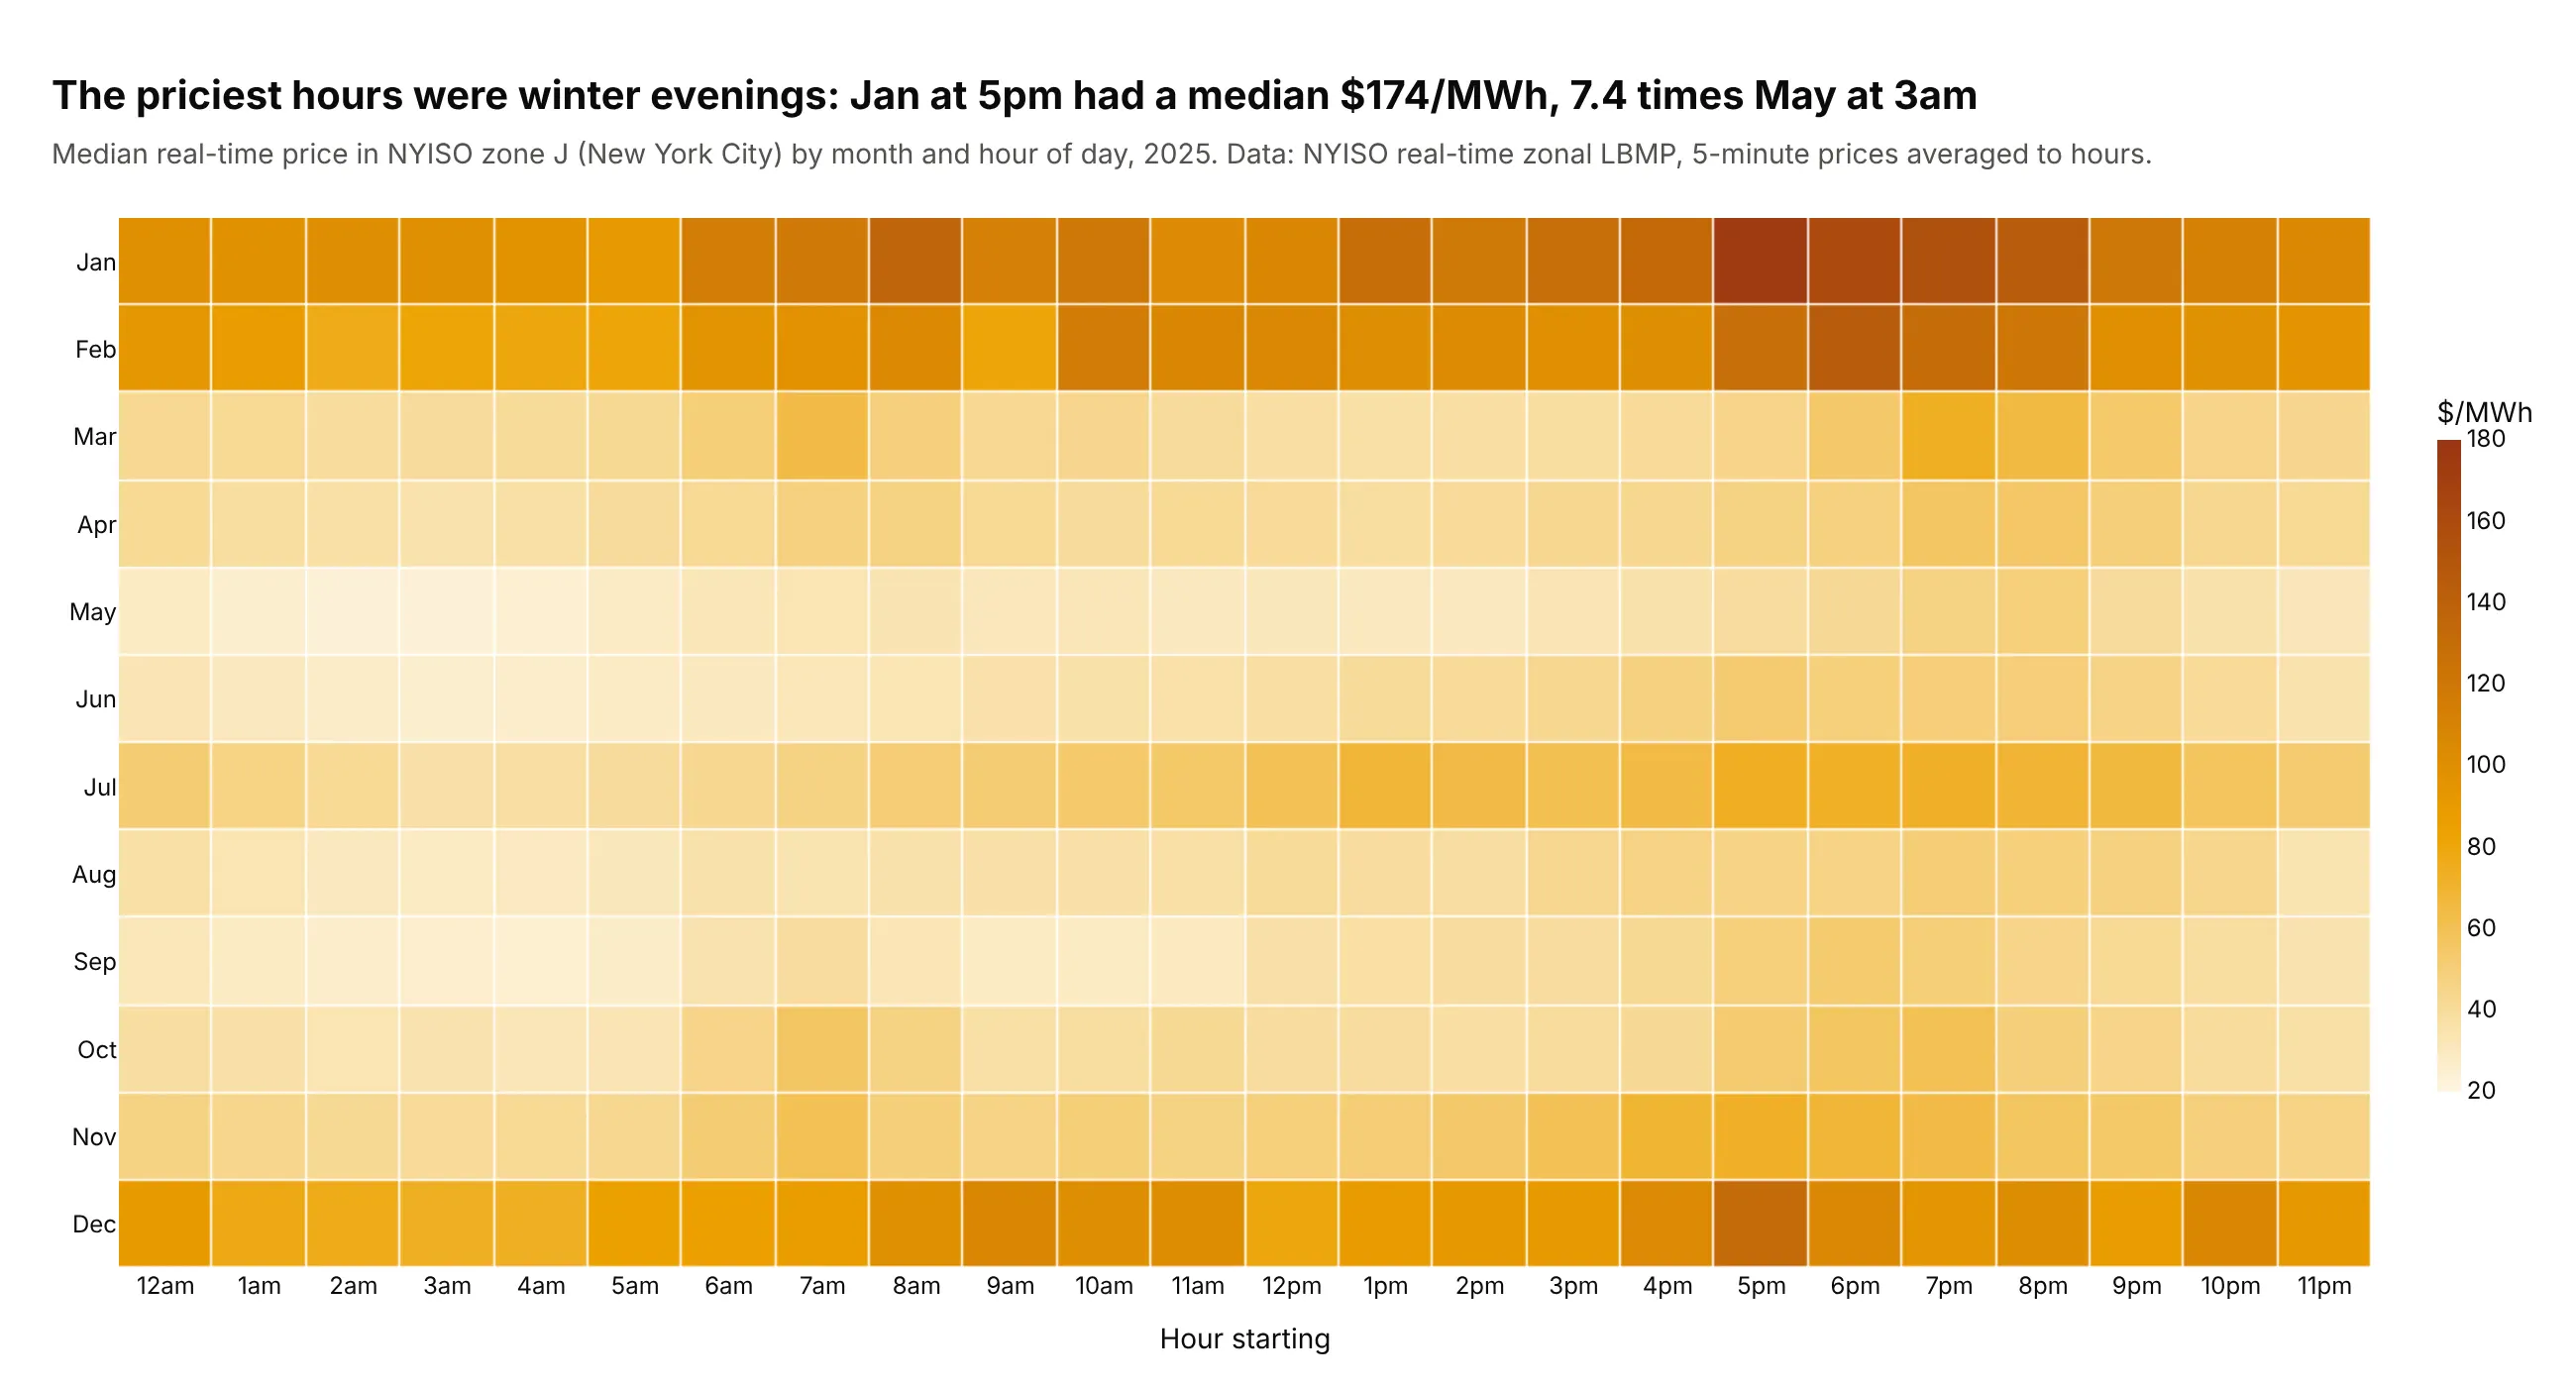
Another way to see it: a heatmap of the median price by month and hour shows when the expensive hours happen. January evenings were the priciest at a median $174, 7.4 times May nights.
6. Household power prices by region and ownership
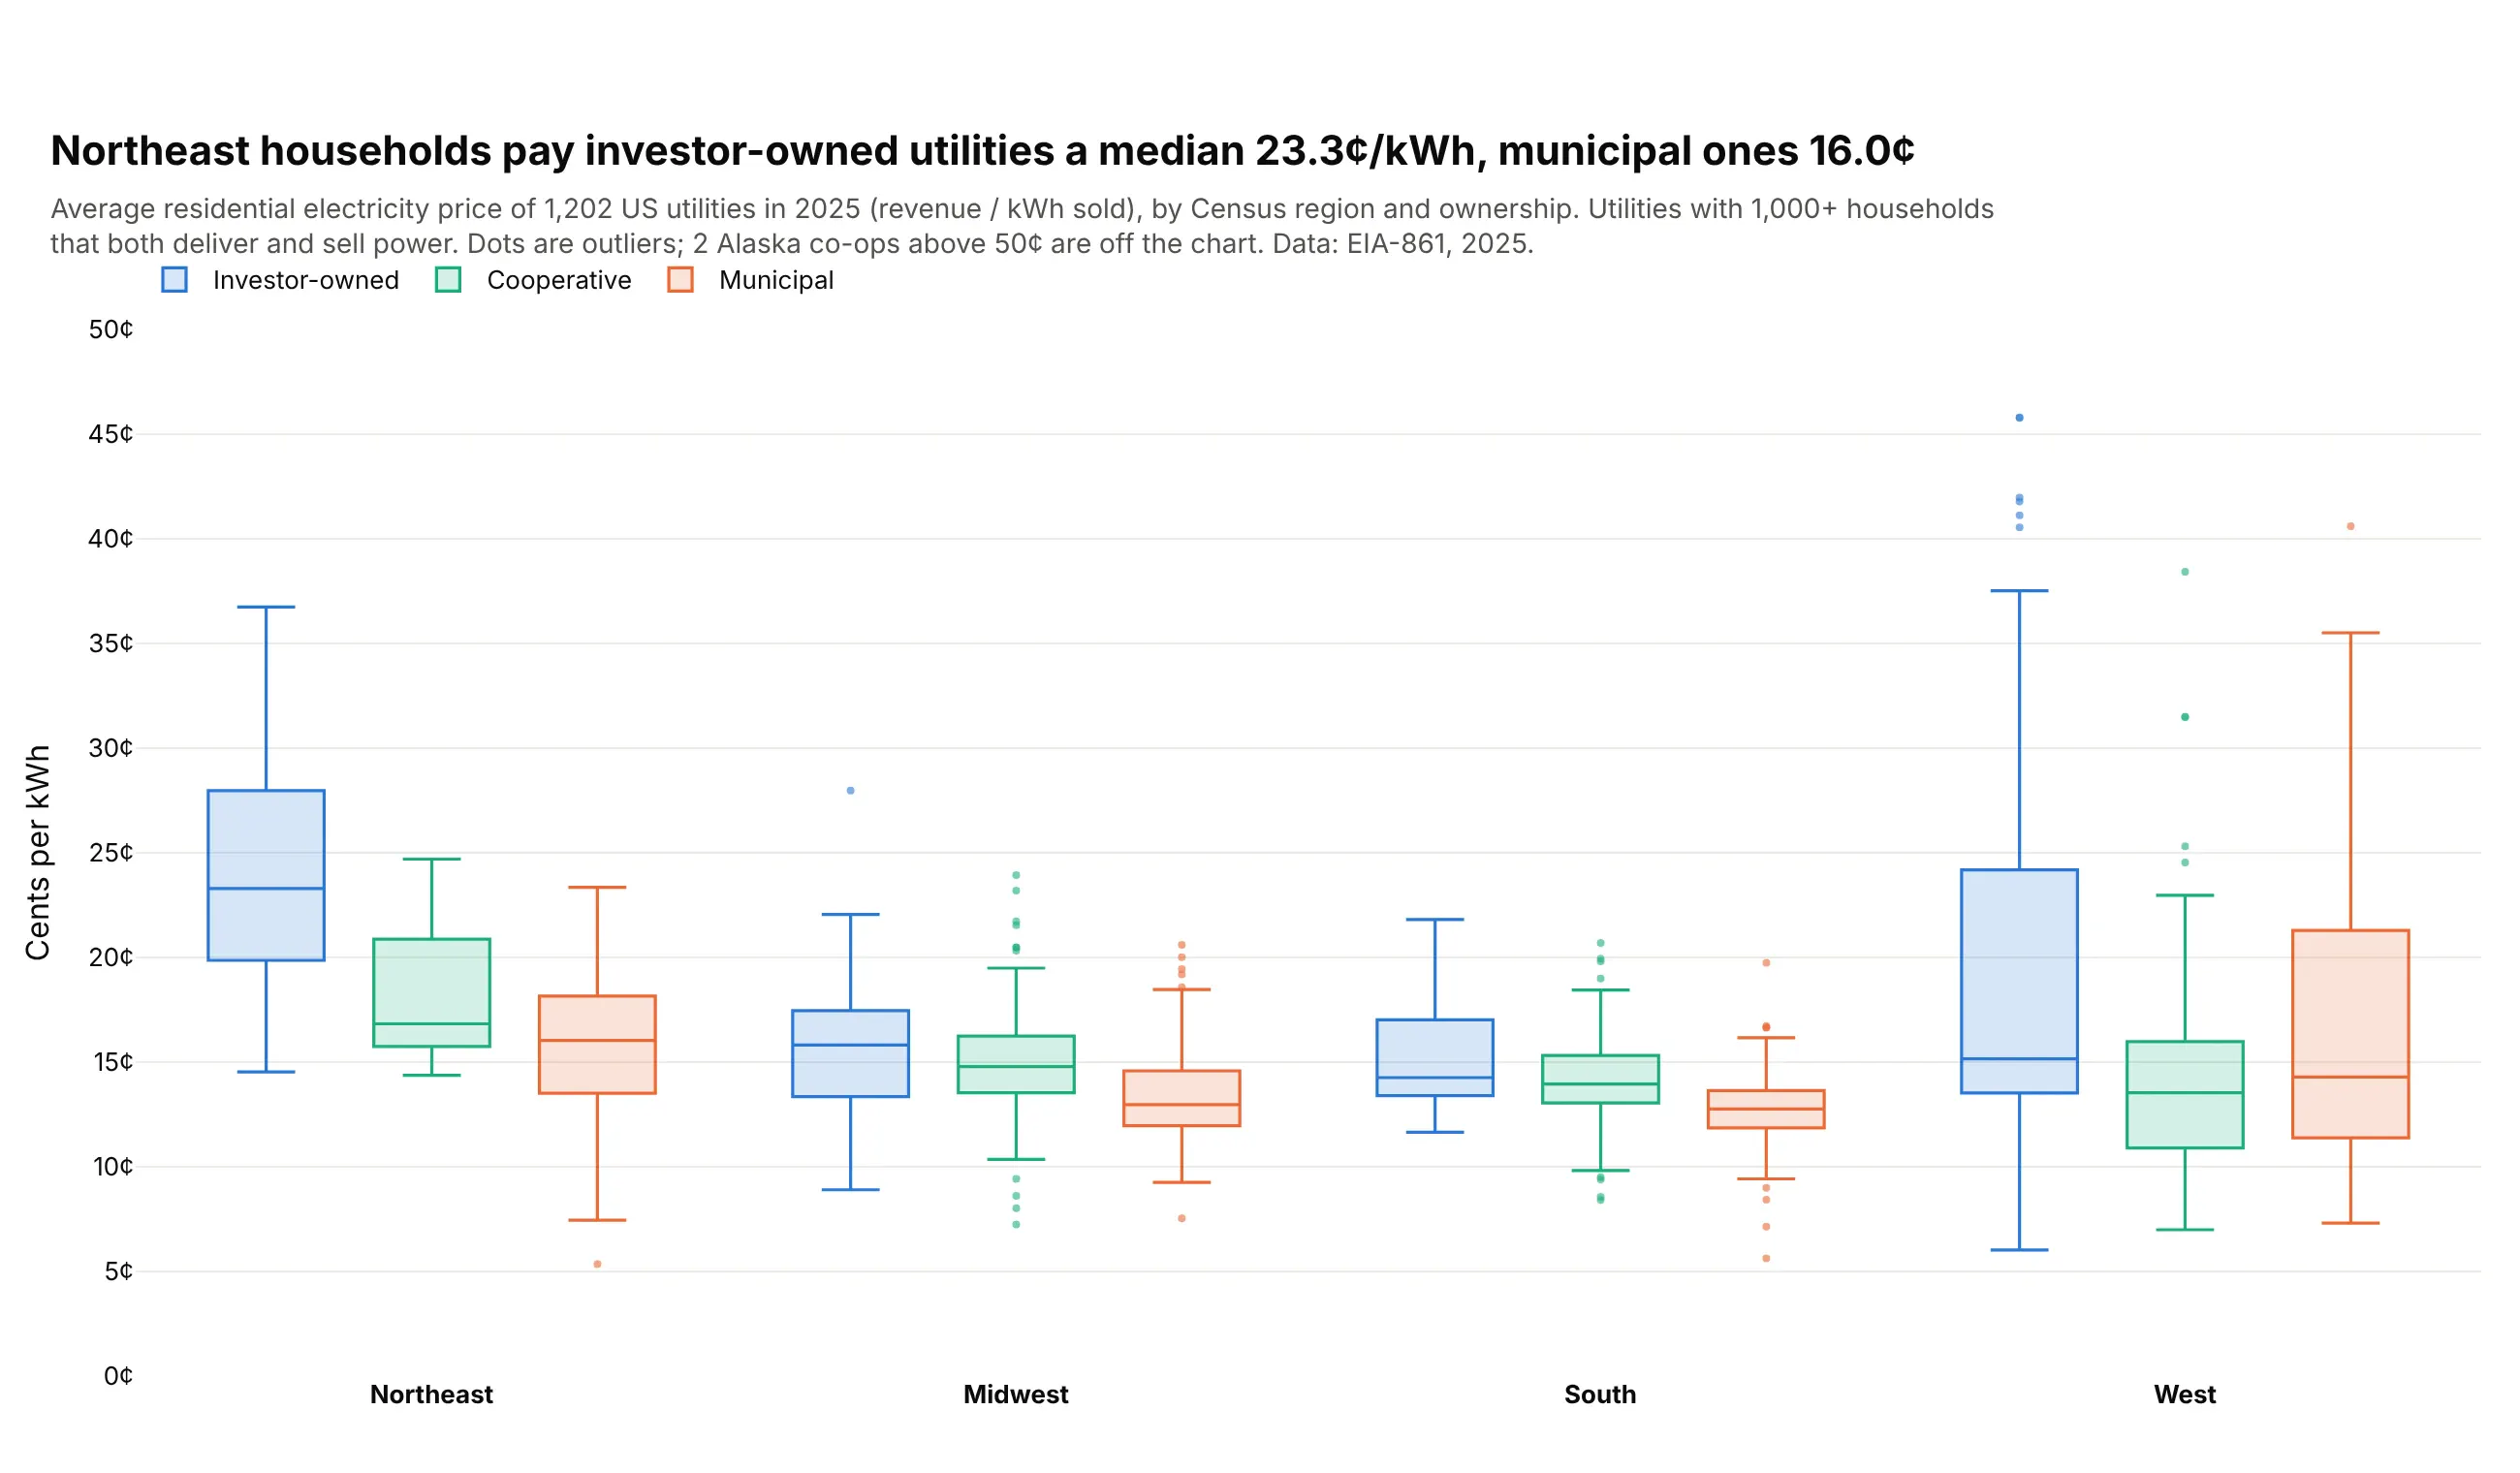
Northeast households pay investor-owned utilities a median 23.3 cents per kWh and municipal ones 16.0. In the Midwest and South the three kinds of utility sit within 3 cents of each other, and the West has the widest spread. Data: EIA-861, 2025.
Tip: boxmode="group" with the same ownership order and colors in every region.
Get the data from EIA-861 annual data for 2025, Sales_Ult_Cust_2025.xlsx (eia.gov/electricity/data/eia861),and shape it into a table (columns: utility, state, region [Census region], ownership[Investor-owned, Cooperative, Municipal], customers, cents_per_kwh [residential revenue / sales]).Keep bundled service and utilities with 1,000+ residential customers.Build a grouped plotly box plot: x = region, y = cents_per_kwh, color = ownership.- boxmode="group", boxpoints="outliers"; blue, green, orange.- Cap the y axis at 50 cents and say how many utilities are above it.- Title with the Northeast investor-owned vs municipal medians.
7. New York's air in the year of the wildfire smoke
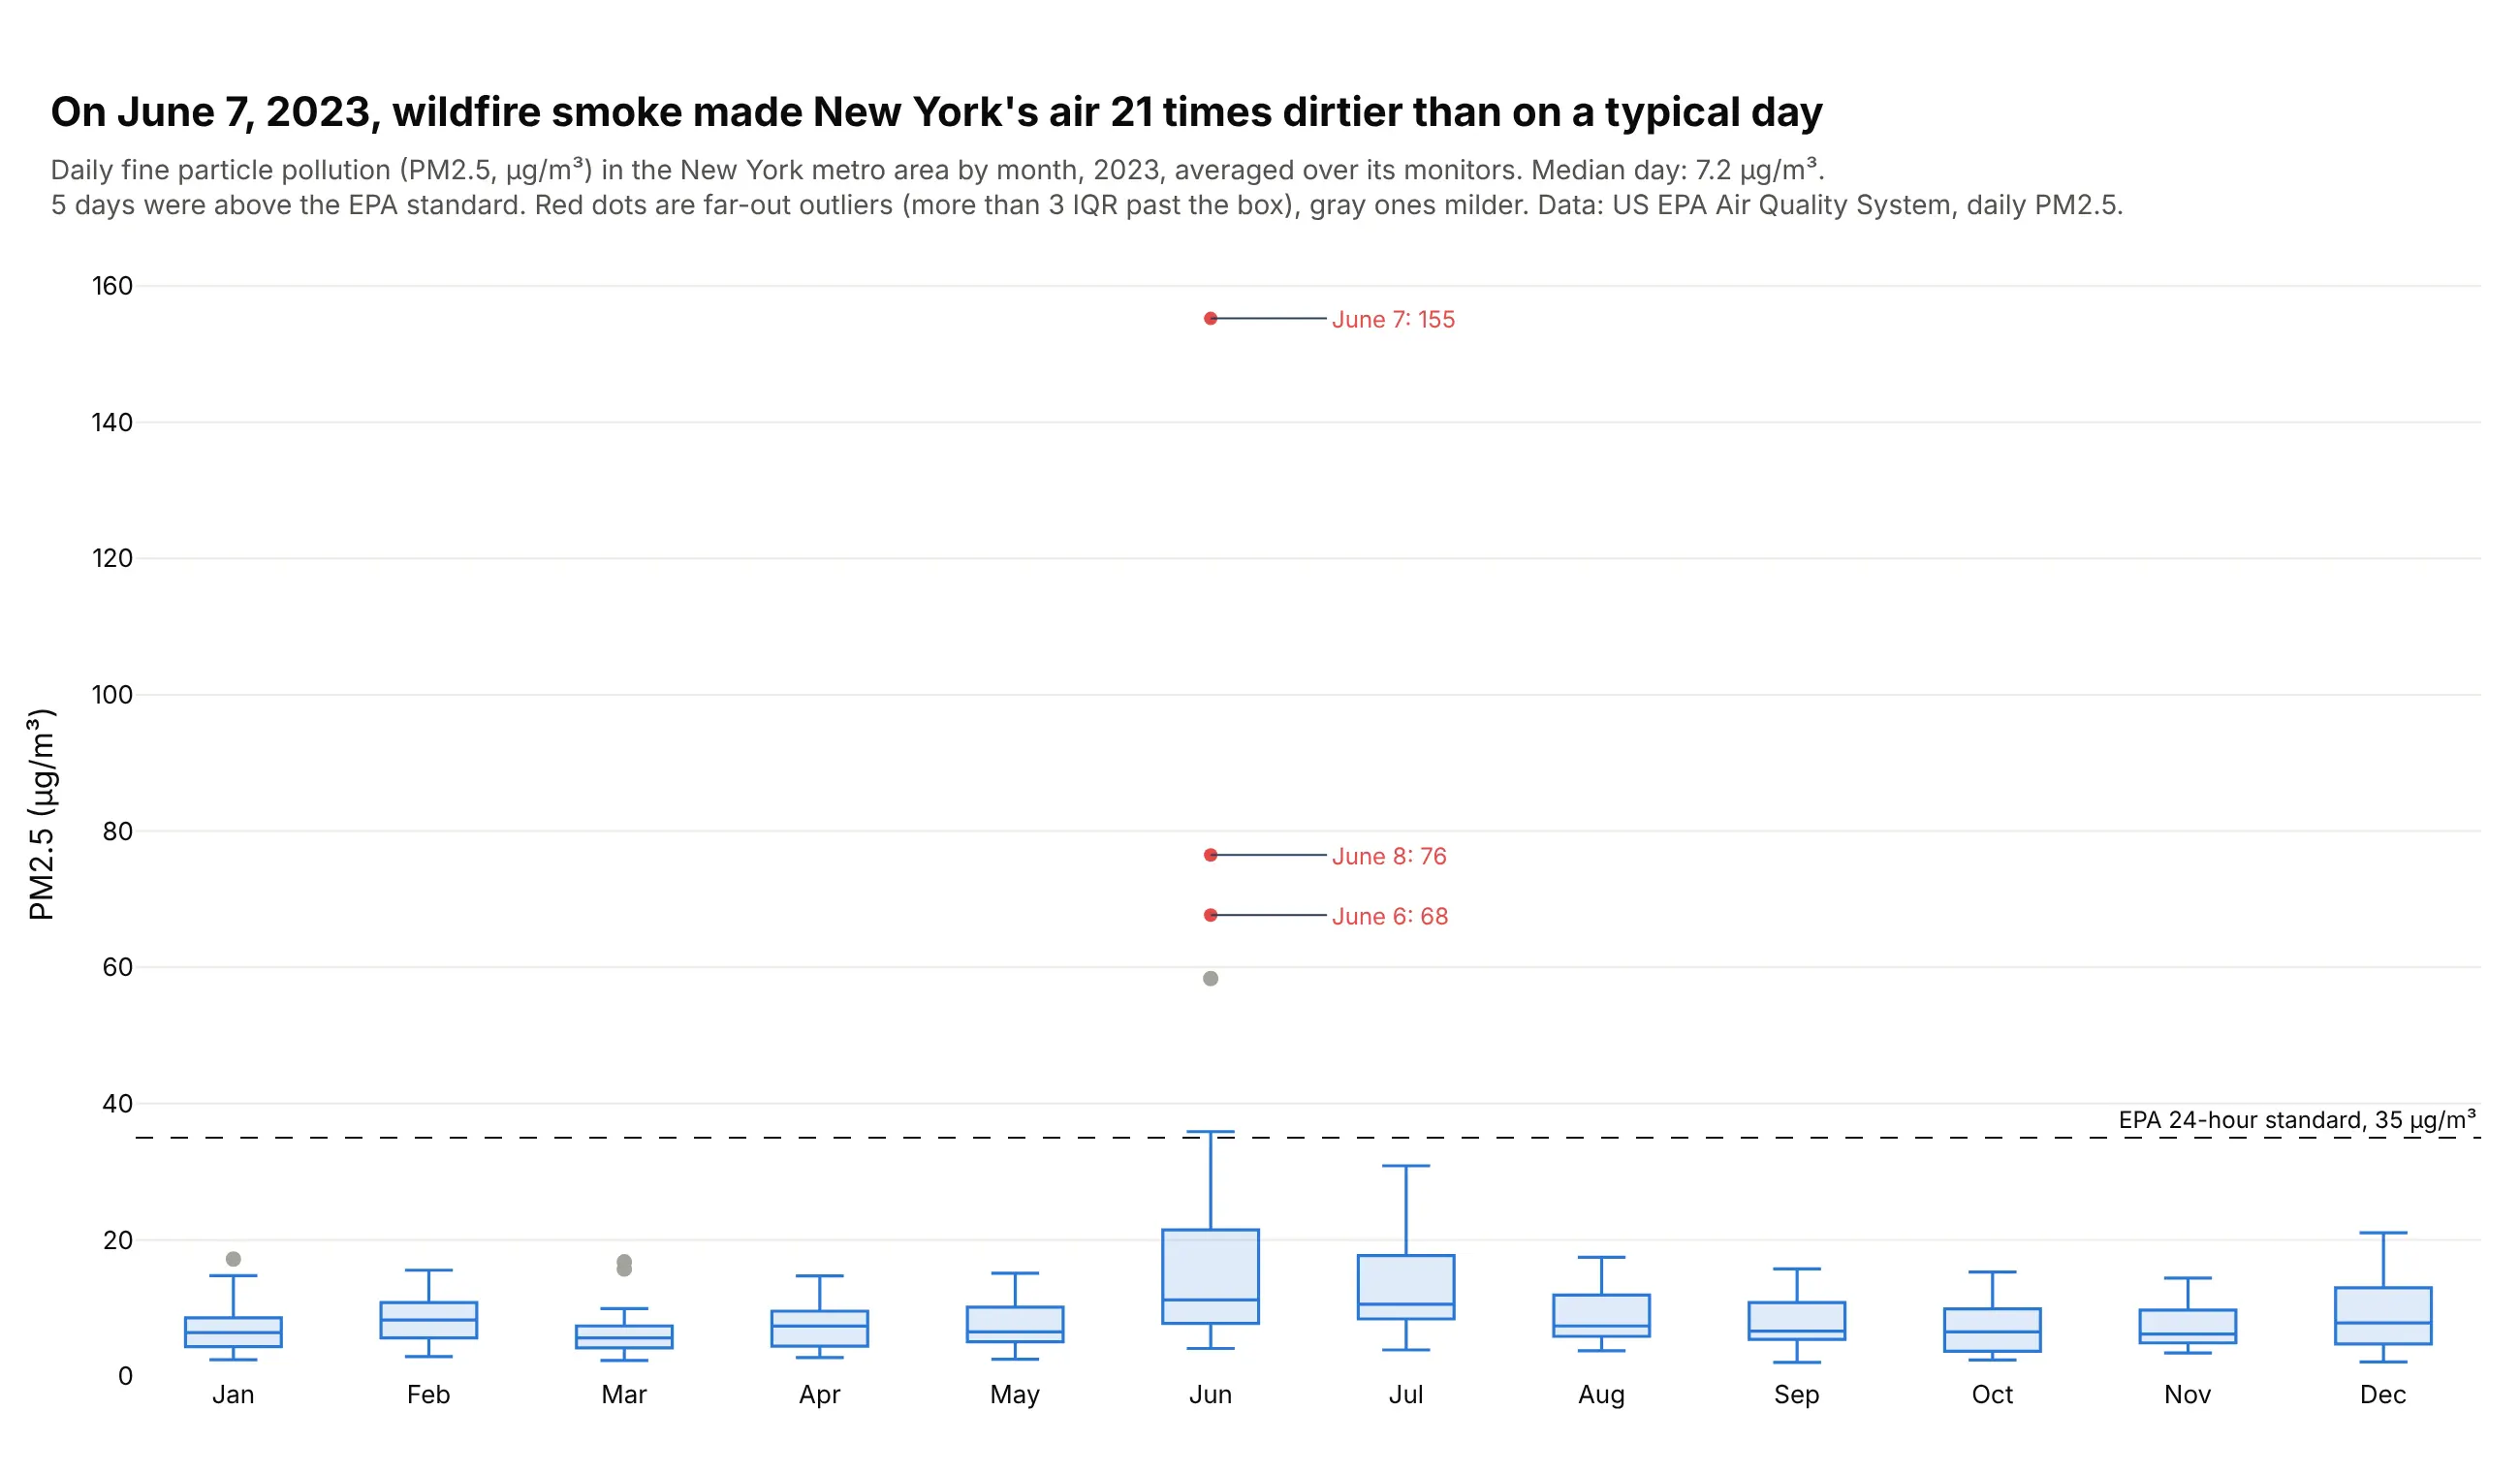
On a typical day in 2023, New York's air had 7.2 µg/m³ of fine particles. On June 7, smoke from Canadian wildfires pushed it to 155, 21 times as much, and five days broke the EPA's 24-hour standard. Data: US EPA Air Quality System, daily PM2.5, New York-Newark-Jersey City metro area, 2023.
Tip: boxpoints="suspectedoutliers" separates mild outliers from far-out ones, so the smoke days stand out in red.
Get the data from the US EPA Air Quality System daily PM2.5 file for 2023(aqs.epa.gov/aqsweb/airdata/daily_88101_2023.zip), keeping the New York-Newark-Jersey City CBSAand averaging all monitors per day, and shape it into a table (columns: date, pm25, monitors).Build a plotly box plot of pm25 by month.- boxpoints="suspectedoutliers"; far-out outliers in red, mild ones in gray.- Label the three highest days with their date and value.- Dashed line at 35 µg/m³ labeled "EPA 24-hour standard".- Title with the worst day and its ratio to the median day.
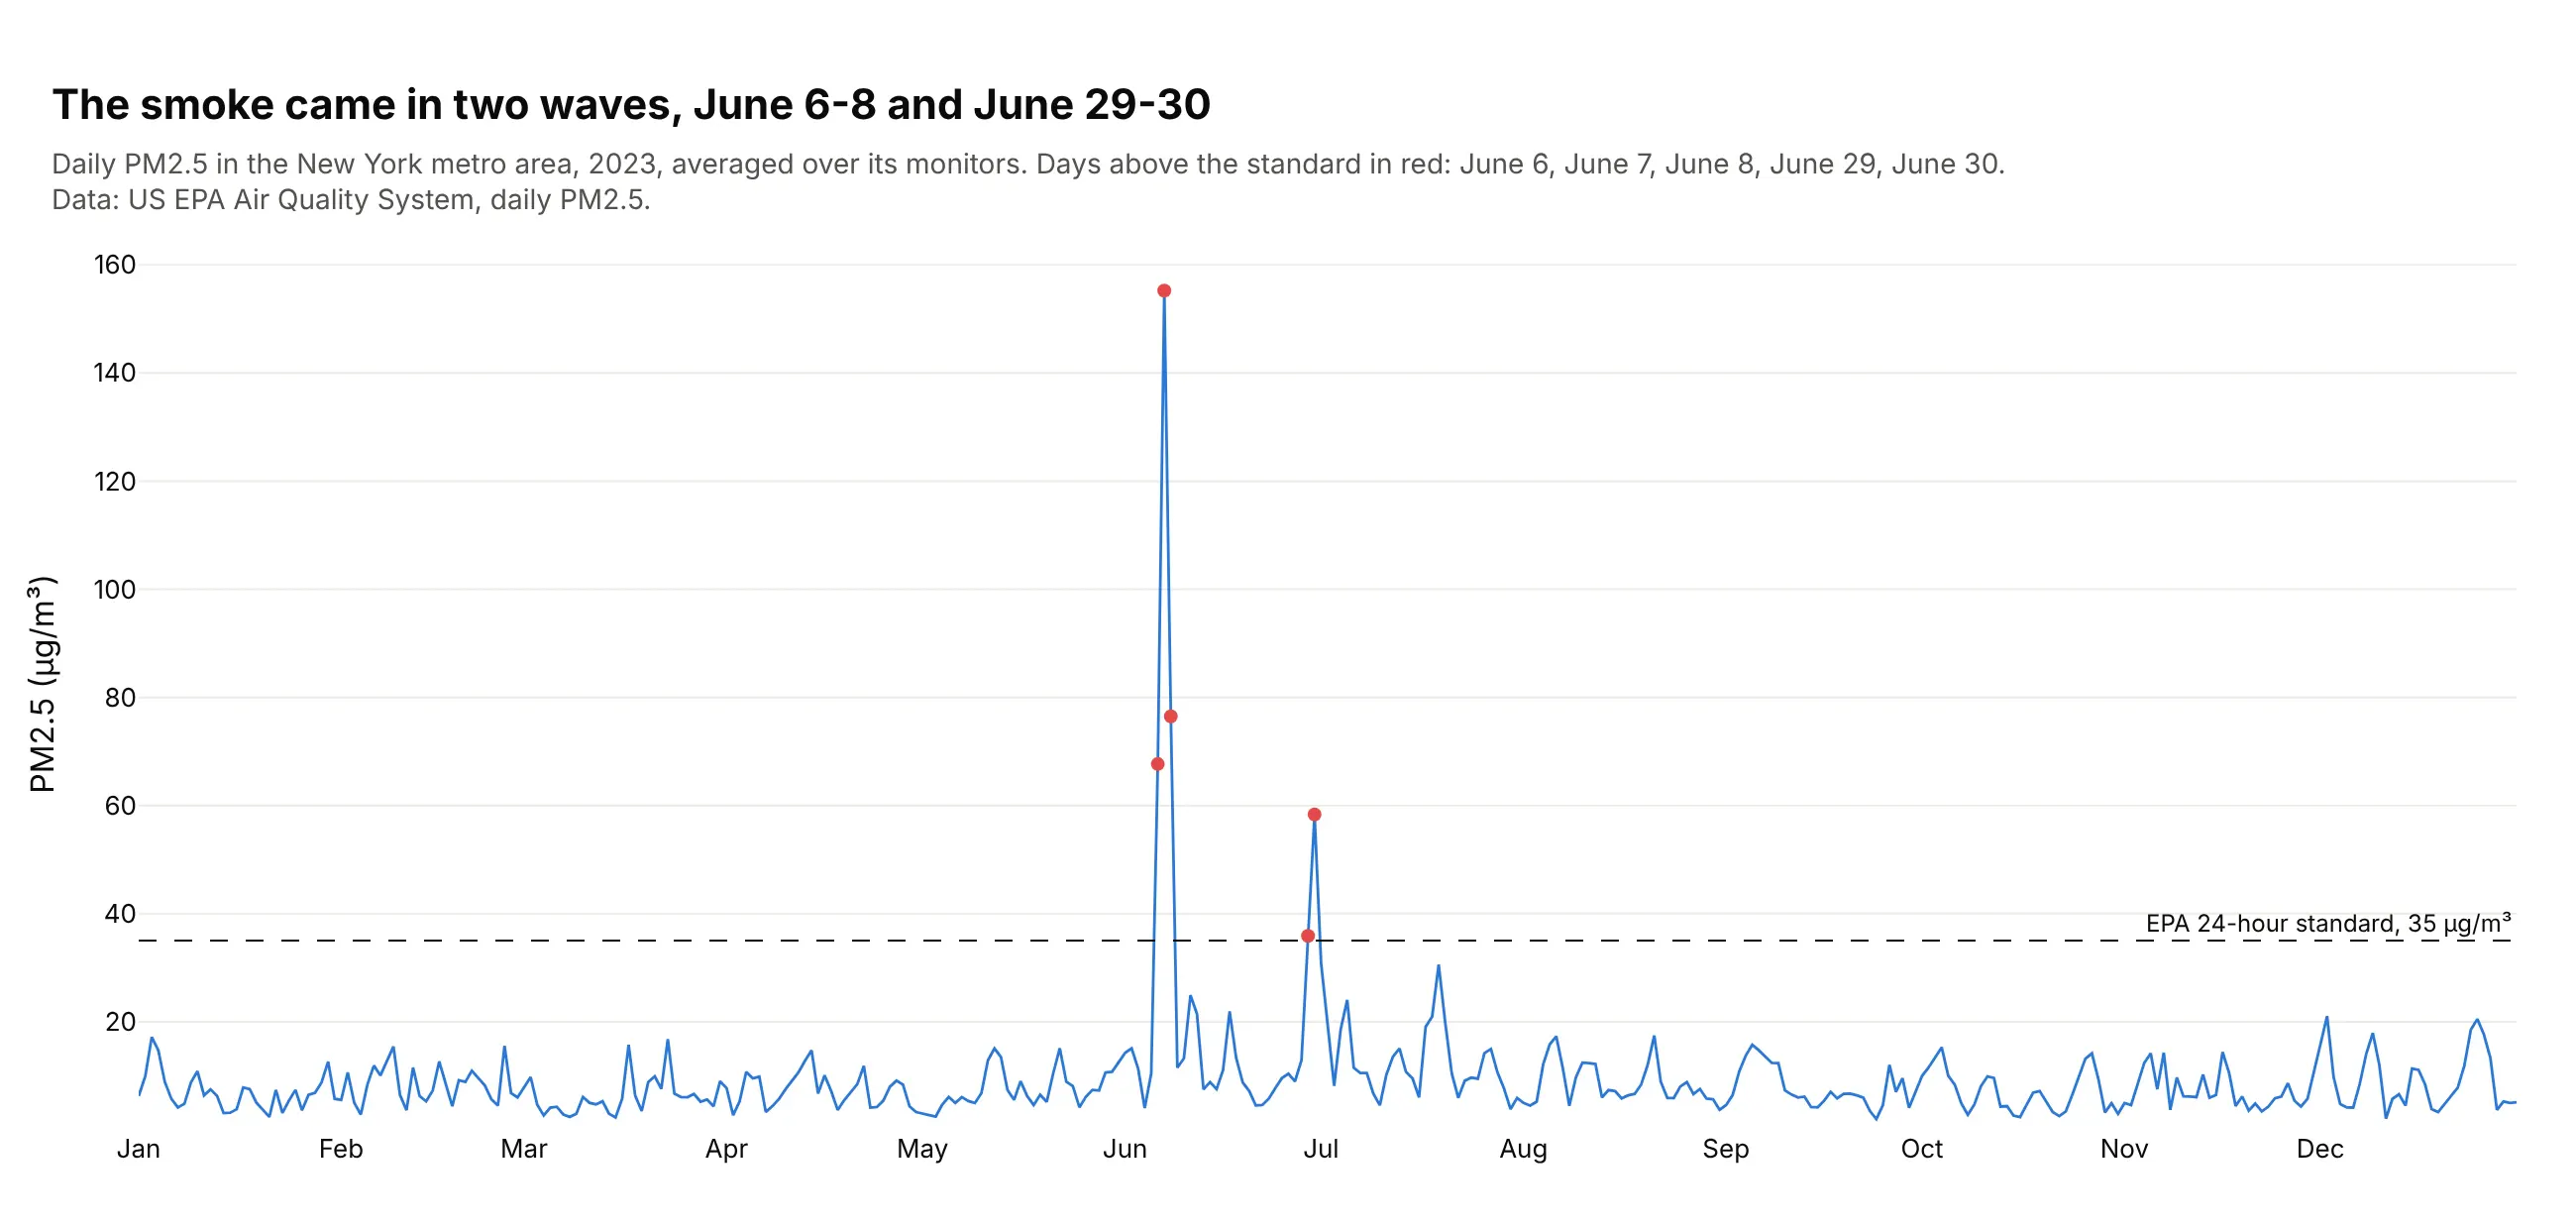
Another way to see it: the daily values as a line show that the smoke came in two waves, June 6-8 and June 29-30, which a monthly box can't separate.
8. US developer salaries by role
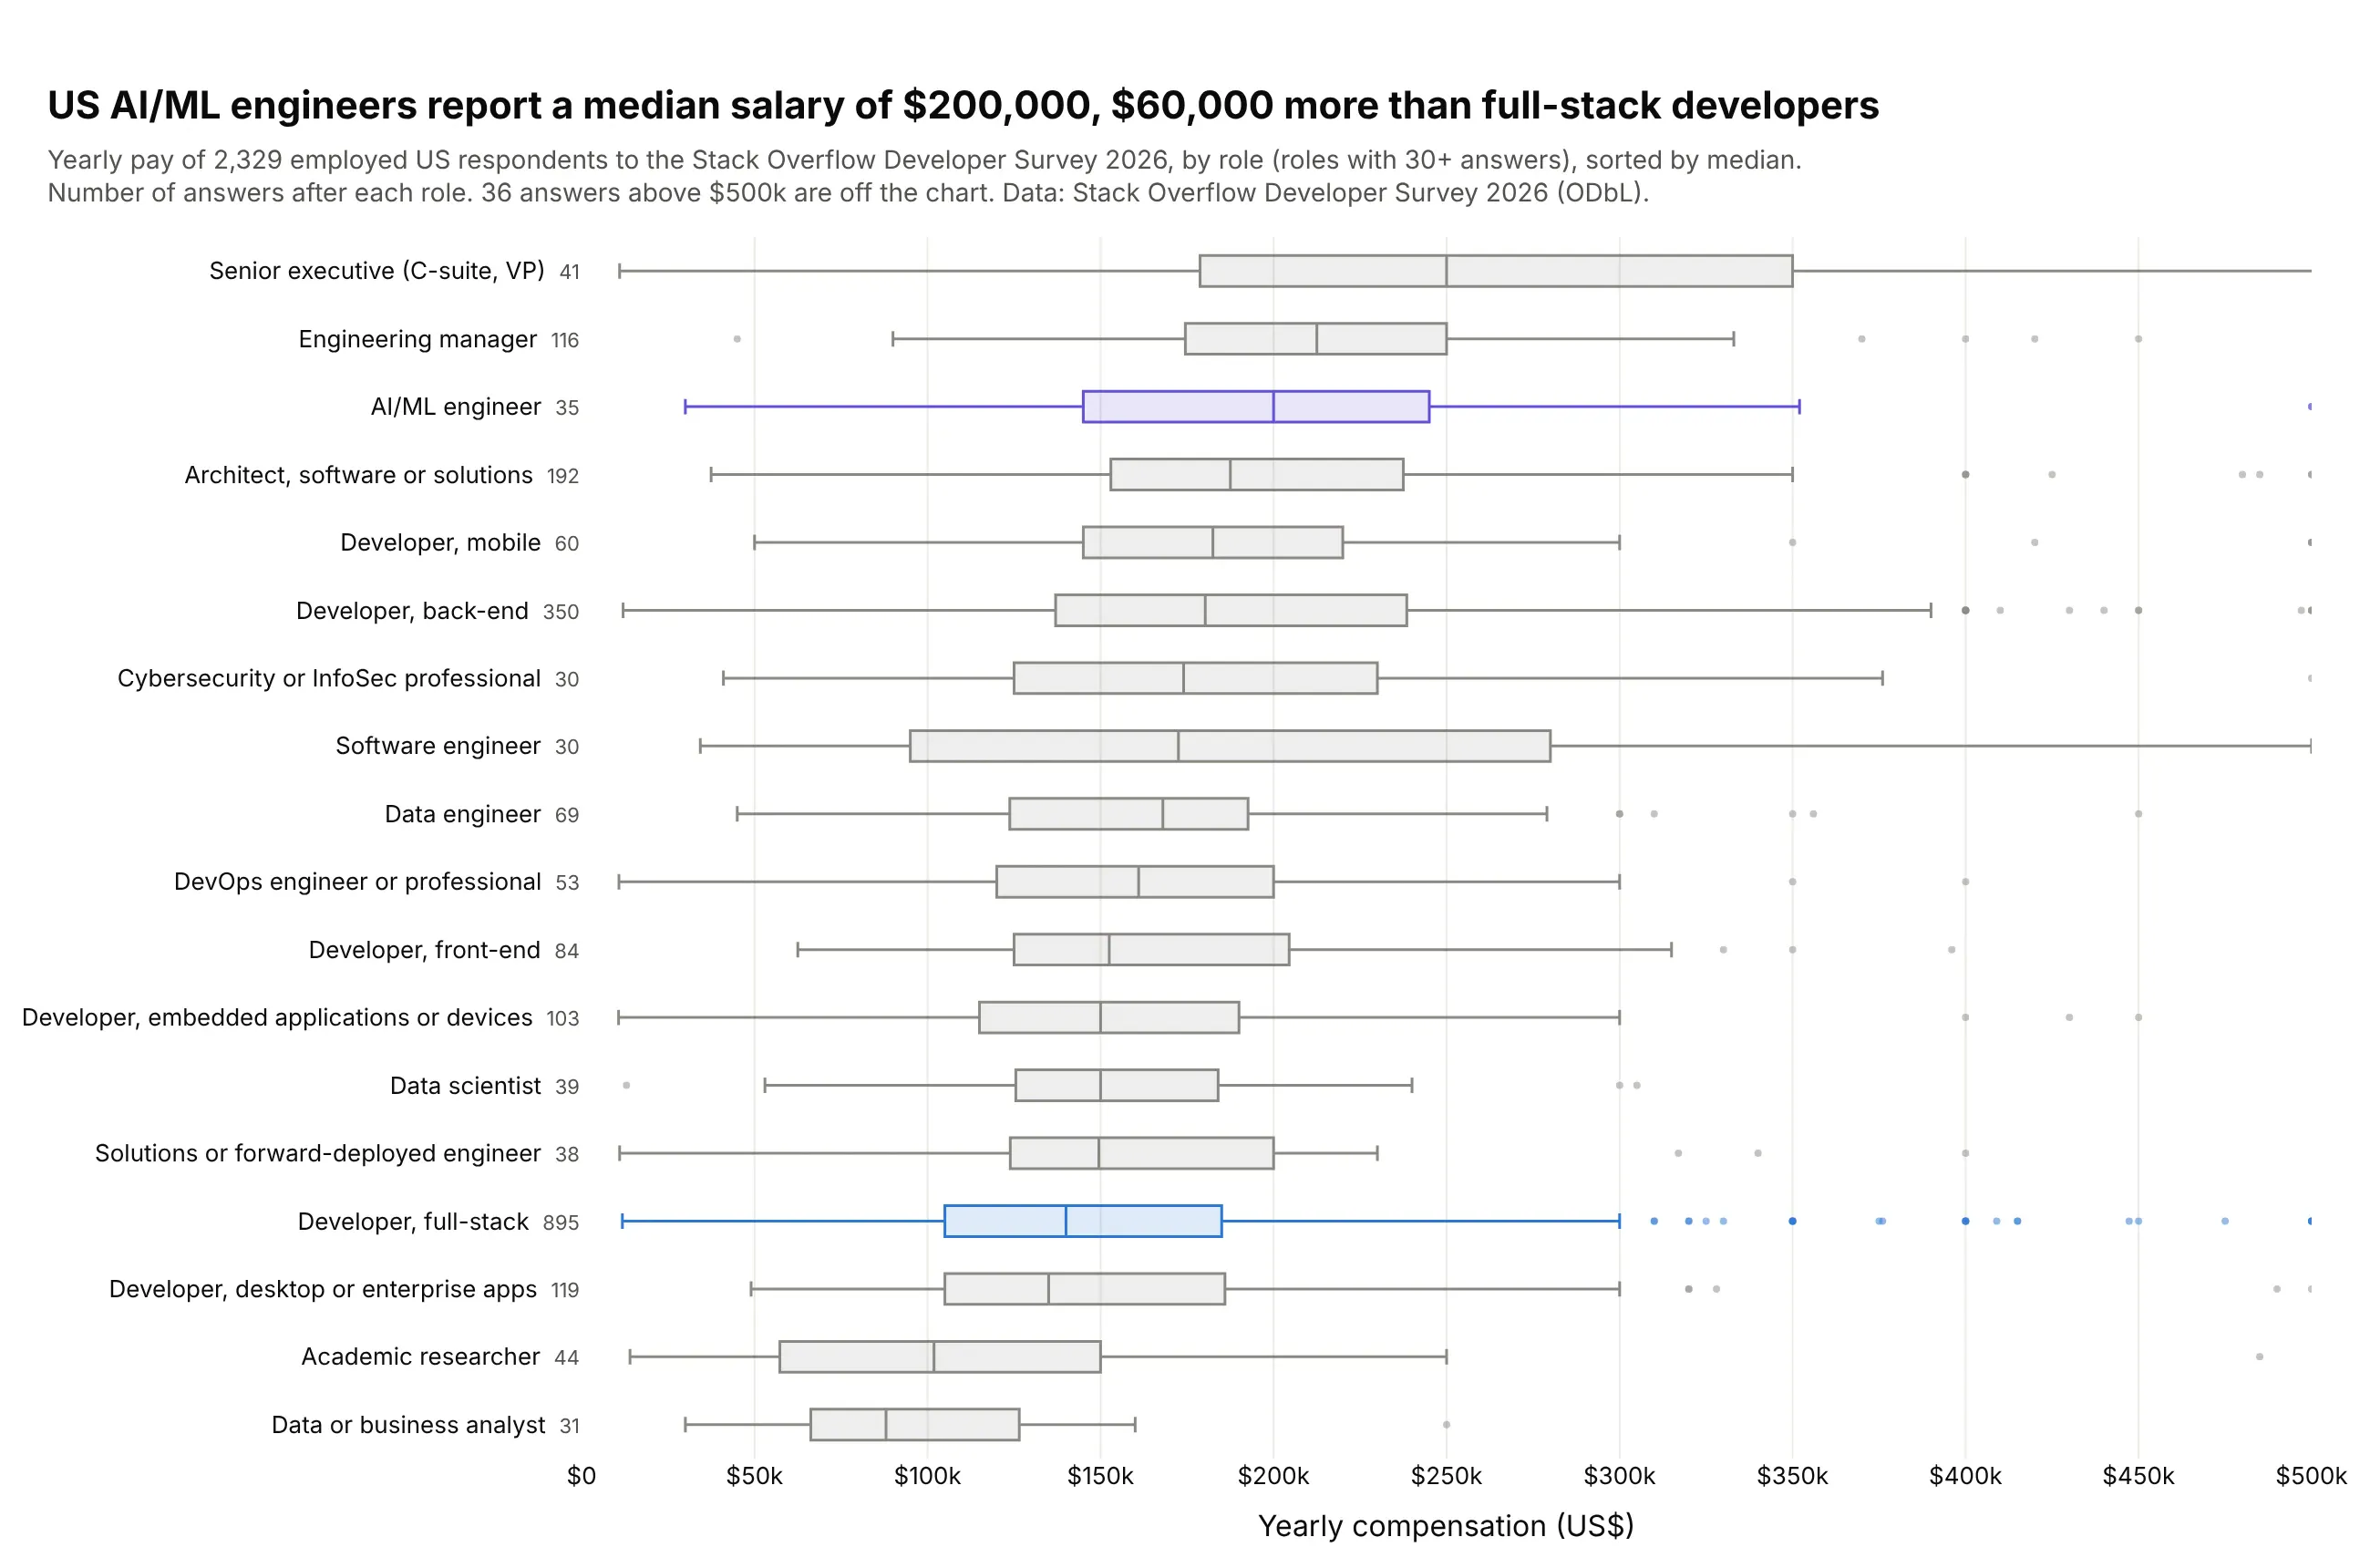
US AI/ML engineers report a median $200,000, $60,000 more than full-stack developers. Only 35 AI/ML engineers answered, against 895 full-stack developers, which is why the count sits next to each role. Data: Stack Overflow Developer Survey 2026 (ODbL).
Tip: cap the axis and state how many answers are beyond it (36 here), so one $30 million answer doesn't flatten every box.
Get the data from the Stack Overflow Developer Survey 2026 public results (survey.stackoverflow.co),keeping employed US respondents with a yearly compensation of at least $10,000 and roles with 30+answers, and shape it into a table (columns: role, salary_usd, years_code).Build a horizontal plotly box plot of salary_usd by role, sorted by median.- Gray boxes; AI/ML engineer in purple and full-stack developer in blue.- Response count after each role; x axis capped at $500k with "$" tick prefixes.- Subtitle with the number of answers above the cap.
9. 6.9 million flights from 14 rows of statistics
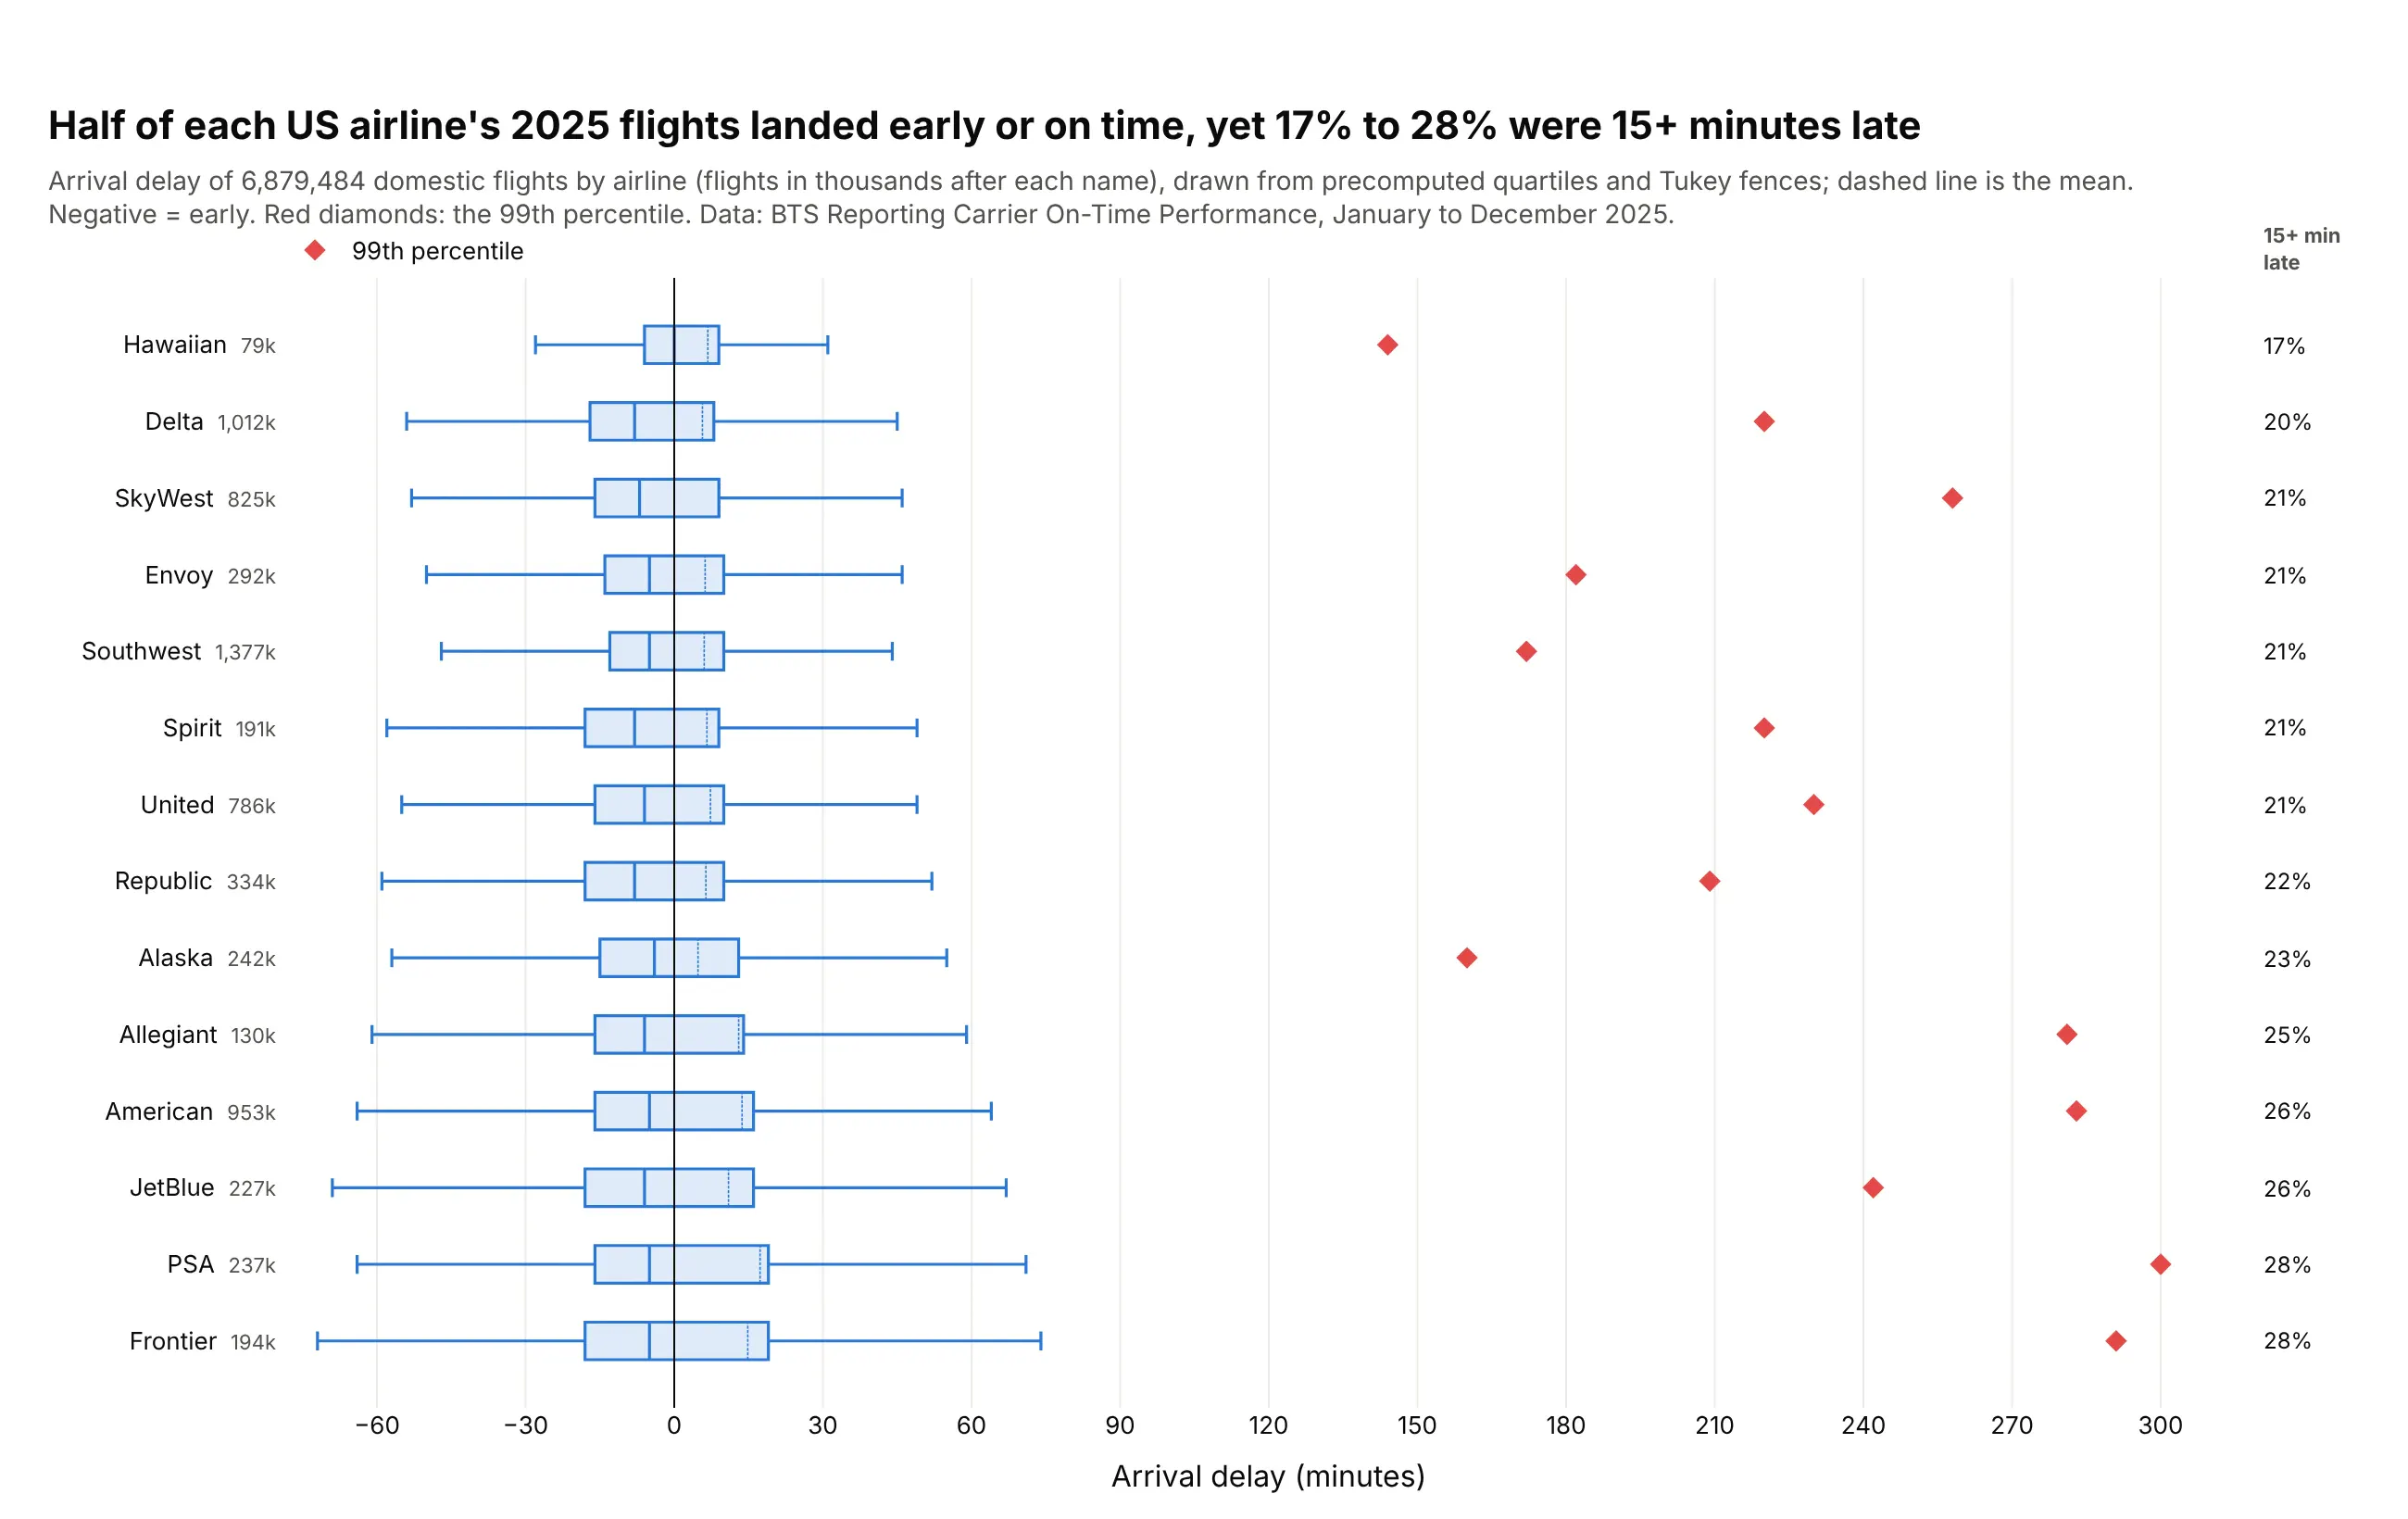
On every US airline in 2025, at least half the flights landed early or on time, yet 17% (Hawaiian) to 28% (Frontier) arrived 15 minutes or more late. The 99th percentile reaches 144 to 300 minutes, which pulls every airline's mean delay above zero. Data: BTS Reporting Carrier On-Time Performance, January to December 2025.
Tip: pass q1, median, q3, lowerfence, upperfence and mean to go.Box instead of the raw rows.
Get the data from BTS Reporting Carrier On-Time Performance for January-December 2025(transtats.bts.gov), and in pandas reduce it to one row per airline (columns: airline, flights, q1,median, q3 [numpy method="hazen"], lowerfence, upperfence [Tukey 1.5 x IQR], mean, p99,share_late_15) from ArrDelay of flights that arrived.Build a horizontal plotly box plot from the precomputed statistics (q1, median, q3, lowerfence,upperfence, mean; boxmean=True), sorted by share_late_15.- Add a scatter of red diamonds at each airline's p99.- Print share_late_15 at the right edge; vertical line at 0 (on time).- Title with the range of share_late_15.
10. Every lap of the 2025 Abu Dhabi Grand Prix
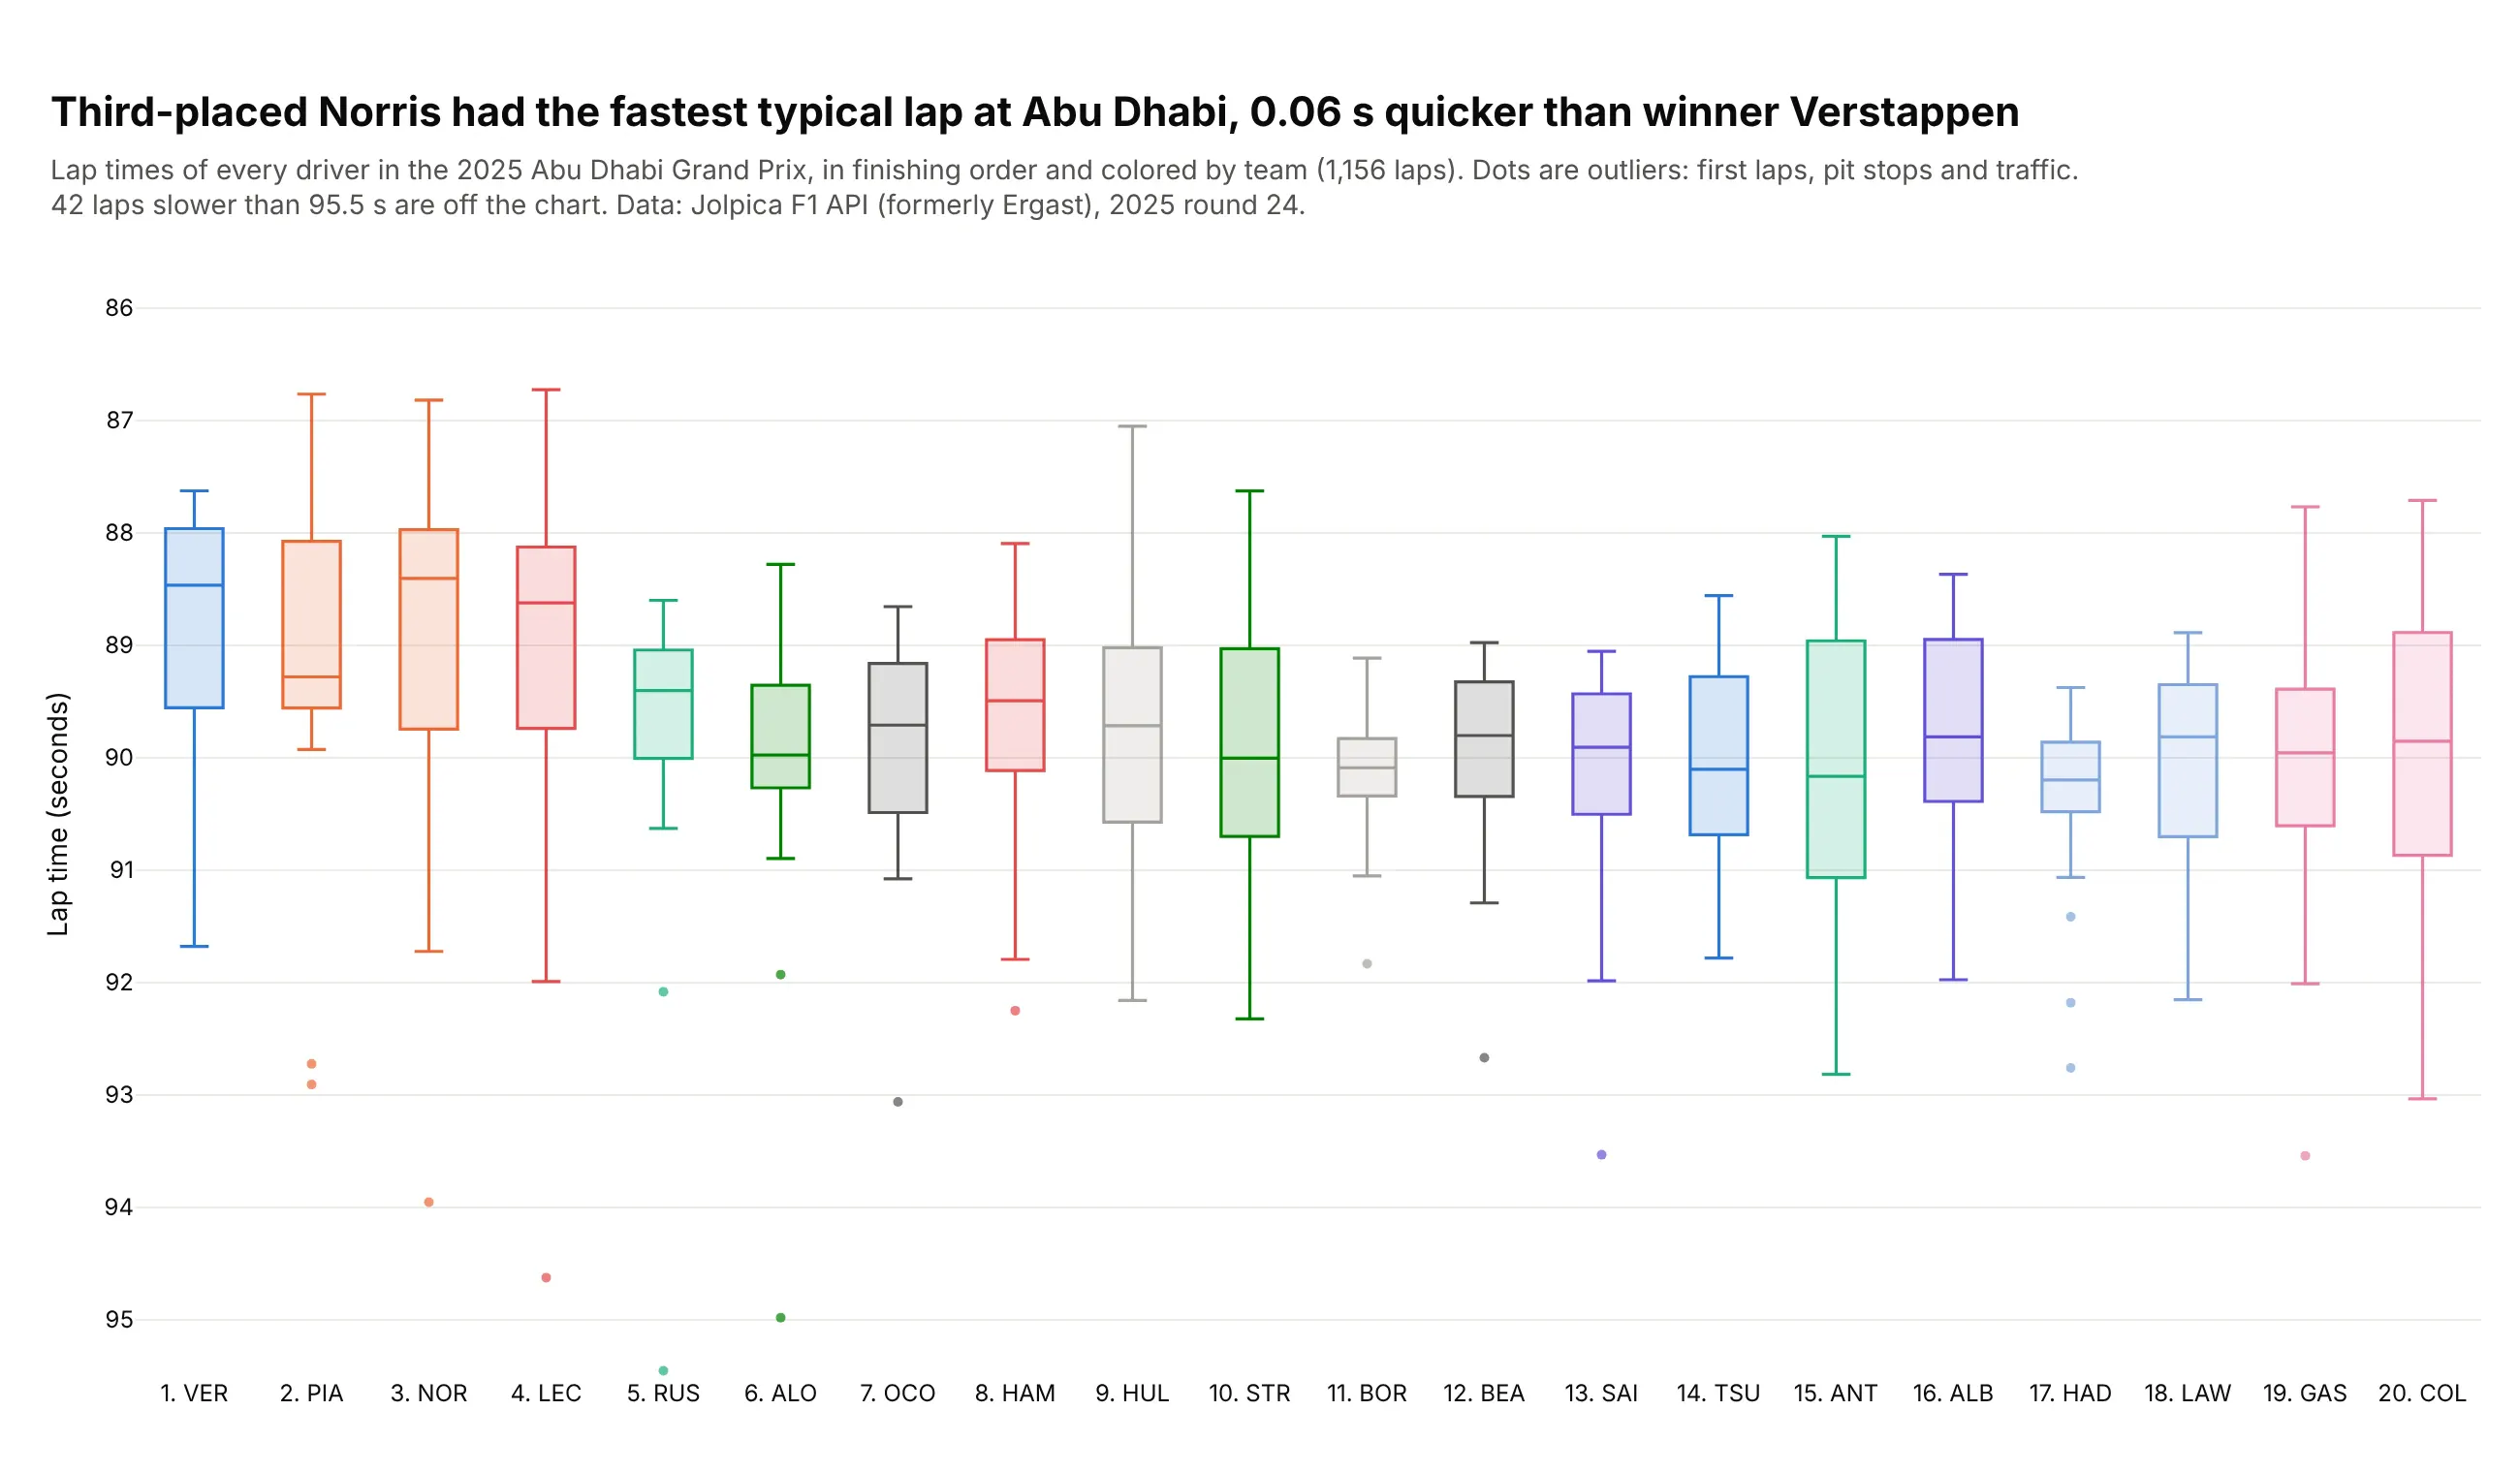
Lando Norris finished third but had the fastest median lap, 88.40 seconds, 0.06 s quicker than the winner Max Verstappen. The outliers are first laps, pit stops and traffic, so the box shows race pace better than an average would. Data: Jolpica F1 API (formerly Ergast), 2025 round 24.
Tip: reverse the y axis so faster is higher, and zoom it to 10 seconds so tenths show.
Get the data from the Jolpica F1 API (api.jolpi.ca/ergast/f1/2025/24): results, laps and pit stops,and shape it into a table (columns: driver, code, team, finish, status, lap, seconds, pit_lap).Build a plotly box plot of lap seconds by driver, in finishing order ("1. VER").- One color per team; boxpoints="outliers".- y axis from 95.5 down to 85.5 (reversed) and the count of slower laps in the subtitle.- Title comparing the fastest median with the winner's.