
Chris Parmer
October 24, 2026
Lollipop Charts - A Complete Guide
TL;DR
- A lollipop chart is a bar chart with each bar drawn as a thin stem and a dot at the value, so it shows the same lengths from zero with much less ink.
- Lollipop charts are also known as lollipop plots and stem plots, and are similar to bar charts, dot plots and dumbbell charts.
- Use one instead of bars when there are many bars of similar length, values around a benchmark, ordered categories such as months, or events in time.
- Stems must start at zero or at a benchmark you name. For a zoomed axis, use a dot plot instead.
- You can make a lollipop chart with Plotly from two go.Scatter traces, one for the stems with None between rows and one for the heads, and any coding agent can build one in a minute.
What is a lollipop chart?
Lollipop charts look like this:
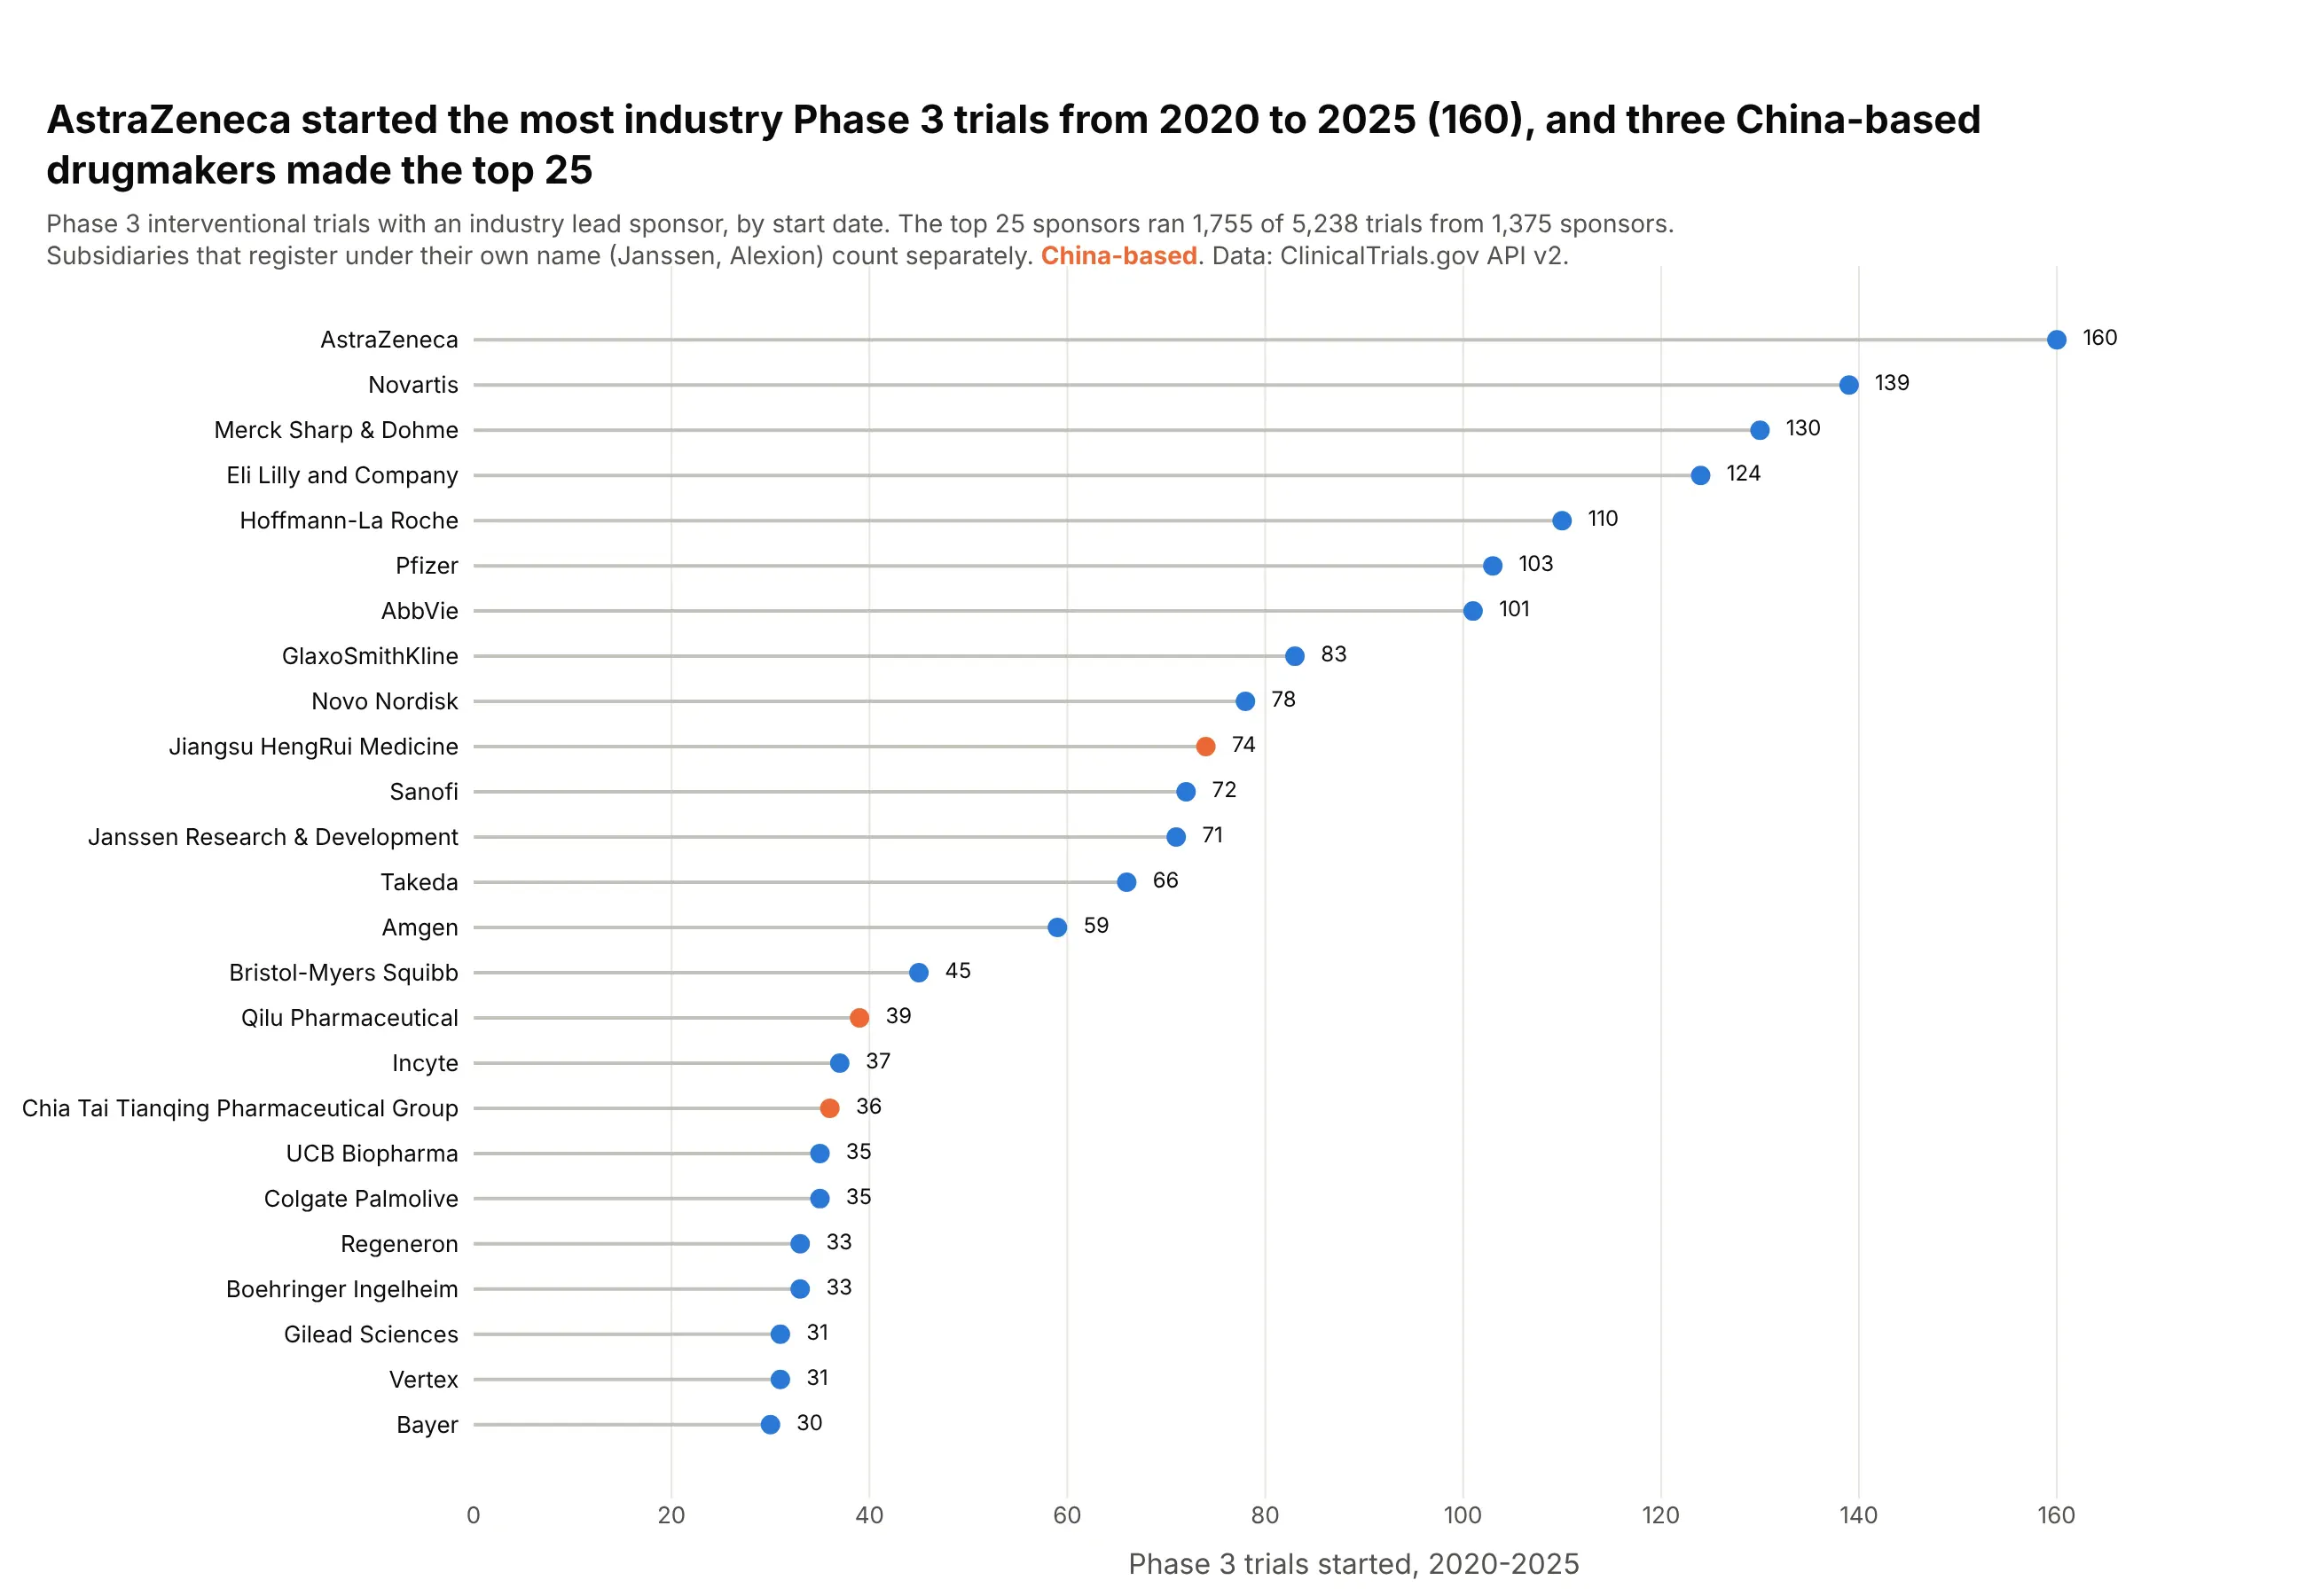
Data: ClinicalTrials.gov API v2, industry-sponsored Phase 3 trials started 2020-2025.
How do you read a lollipop chart? In the example above, notice these things:
- Each row is one drug company, and its lollipop is a thin stem from zero to the number of industry Phase 3 trials it started, with a dot at the end.
- The stem's length is the value, as with a bar, and every stem starts at zero. That is why AstraZeneca's stem can be read as just over twice as long as Janssen's.
- The rows are sorted from the most trials to the fewest, which puts AstraZeneca at the top and shows how gradually the counts fall from Novartis down to Bayer.
- The thin stems leave room to print each count next to its dot, and color carries one more fact, so the three China-based sponsors, led by Jiangsu HengRui, stand out in orange.
- Sponsors are counted under the name they register with, so a subsidiary like Janssen gets its own row apart from its parent company. Check how the categories were defined before you compare two rows.
It's often used for charts like these:
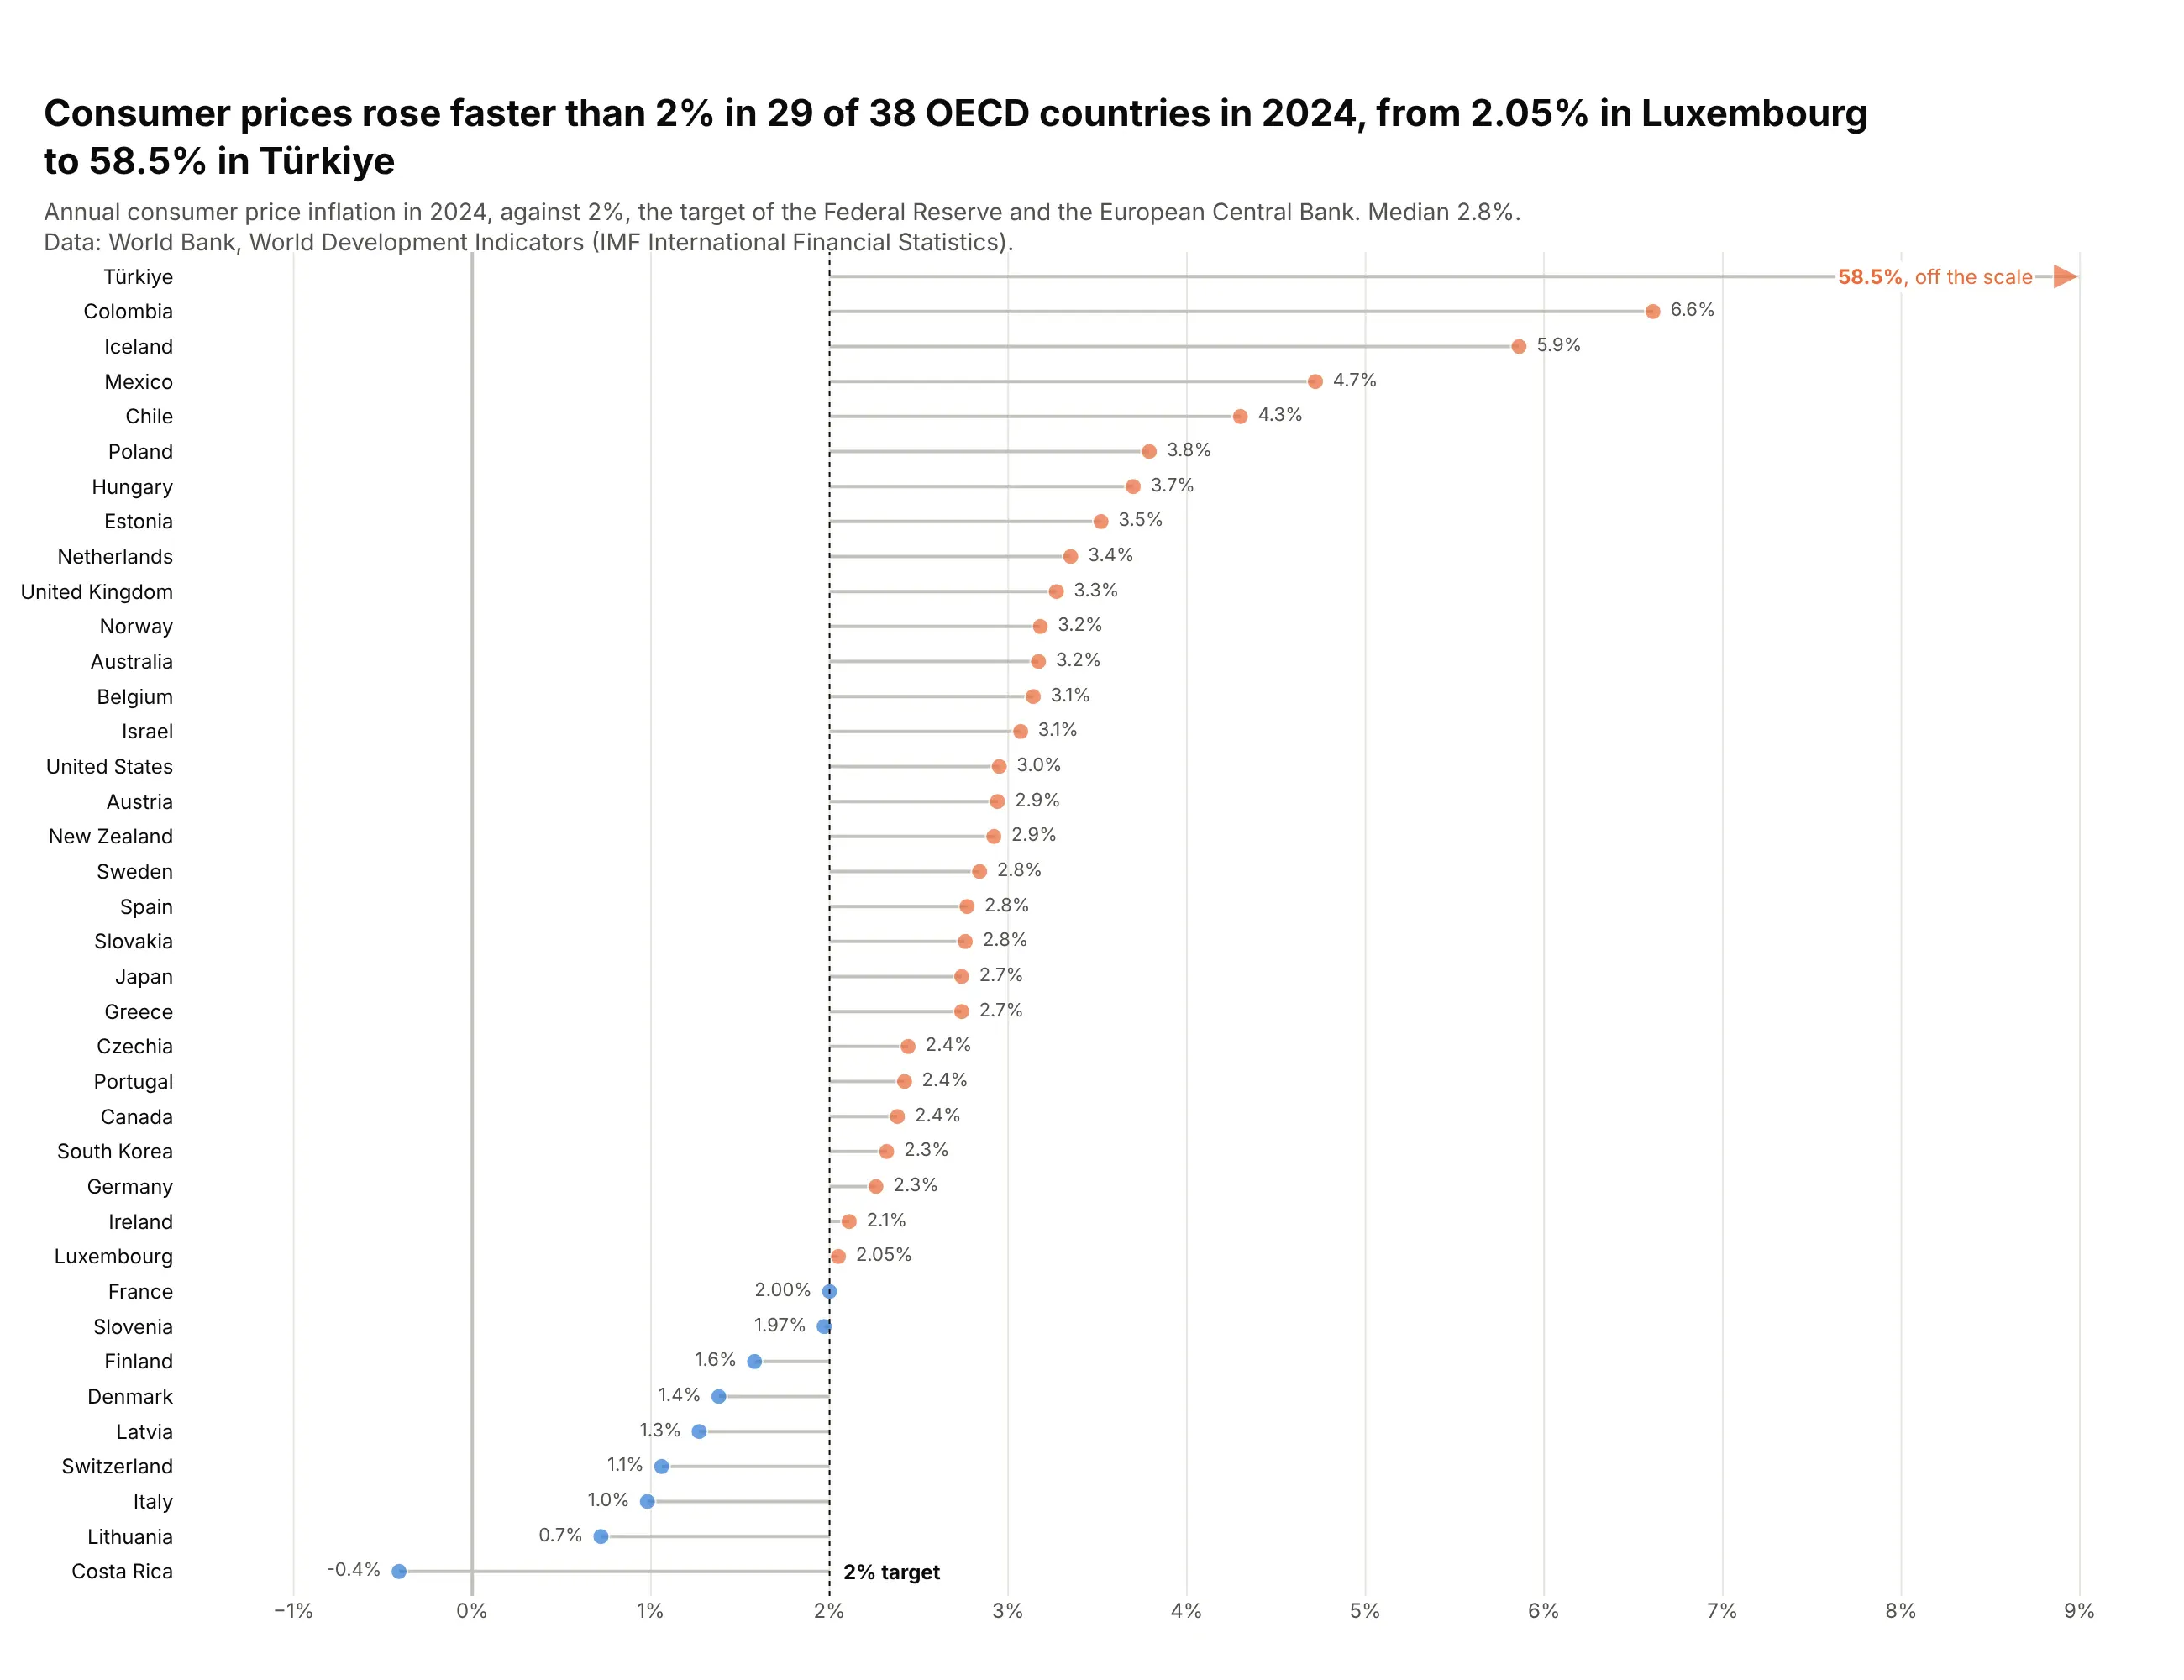
Distance from a target. With stems that grow from 2% instead of zero, consumer prices rose faster than that in 29 of the 38 OECD countries in 2024, and Türkiye's 58.5% is drawn as an arrow off the scale. Data: World Bank, World Development Indicators (IMF).
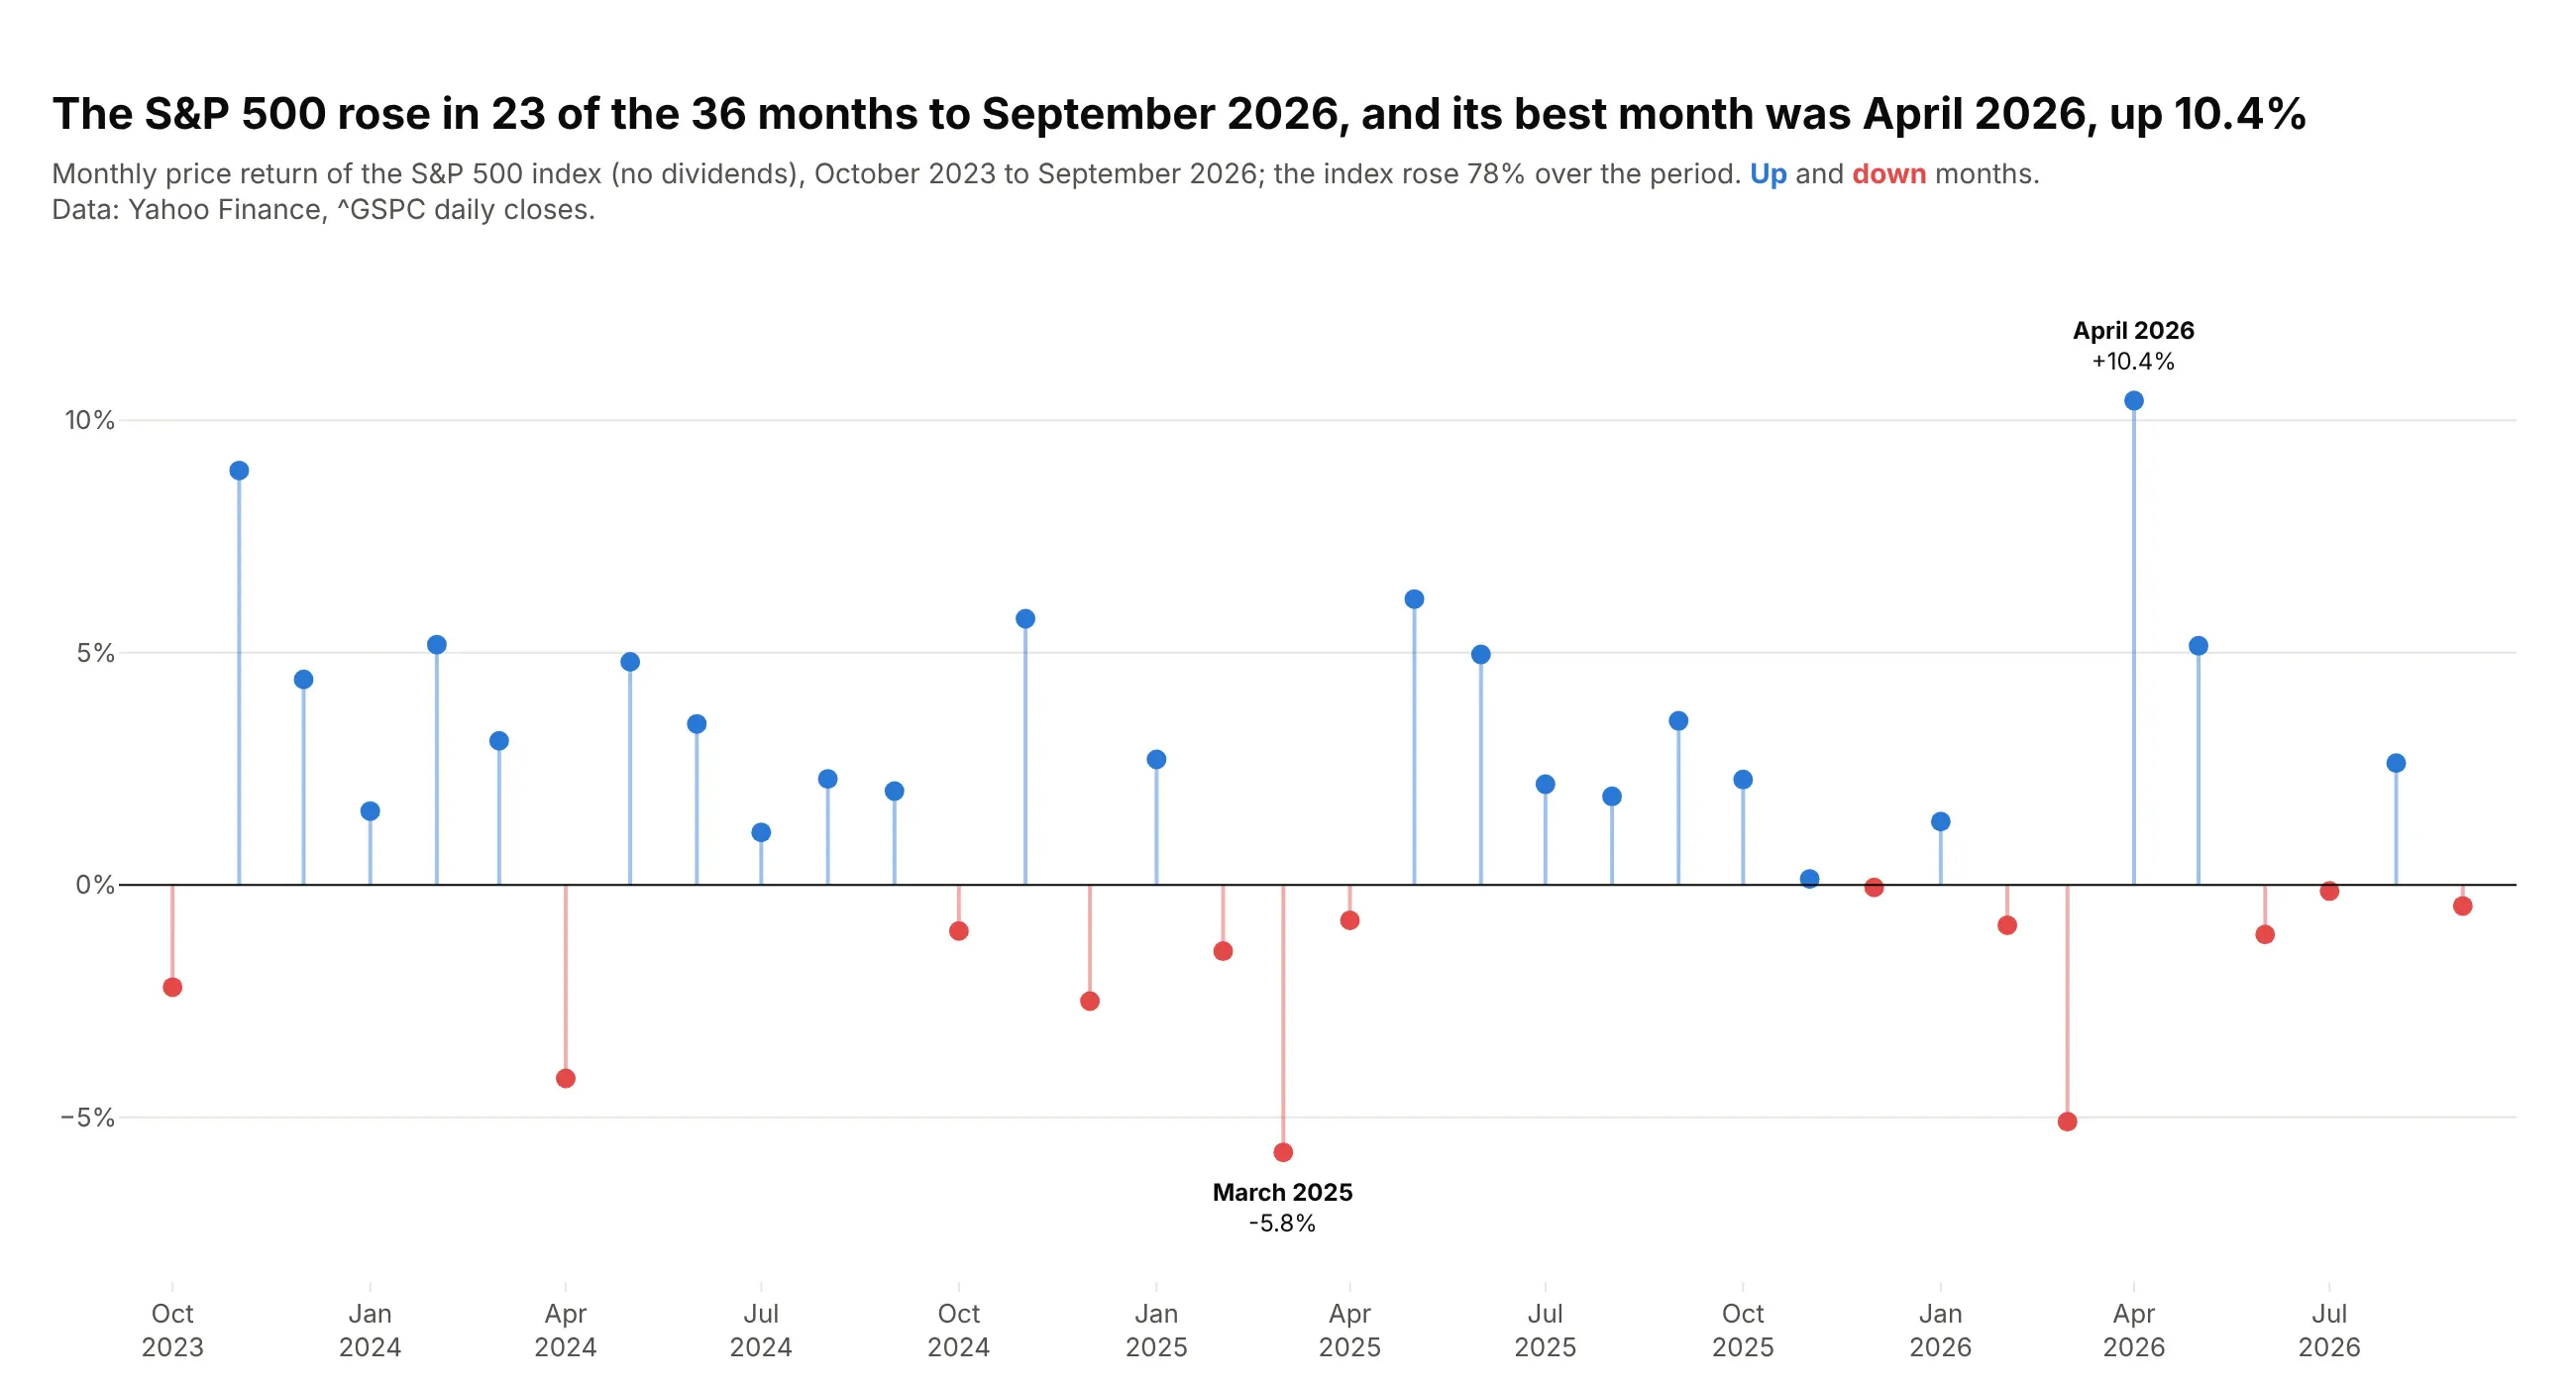
Gains and losses over time. The S&P 500 rose in 23 of the 36 months to September 2026, and the stems show the size of each month around zero, from -5.8% in March 2025 to +10.4% in April 2026. Data: Yahoo Finance, ^GSPC daily closes.
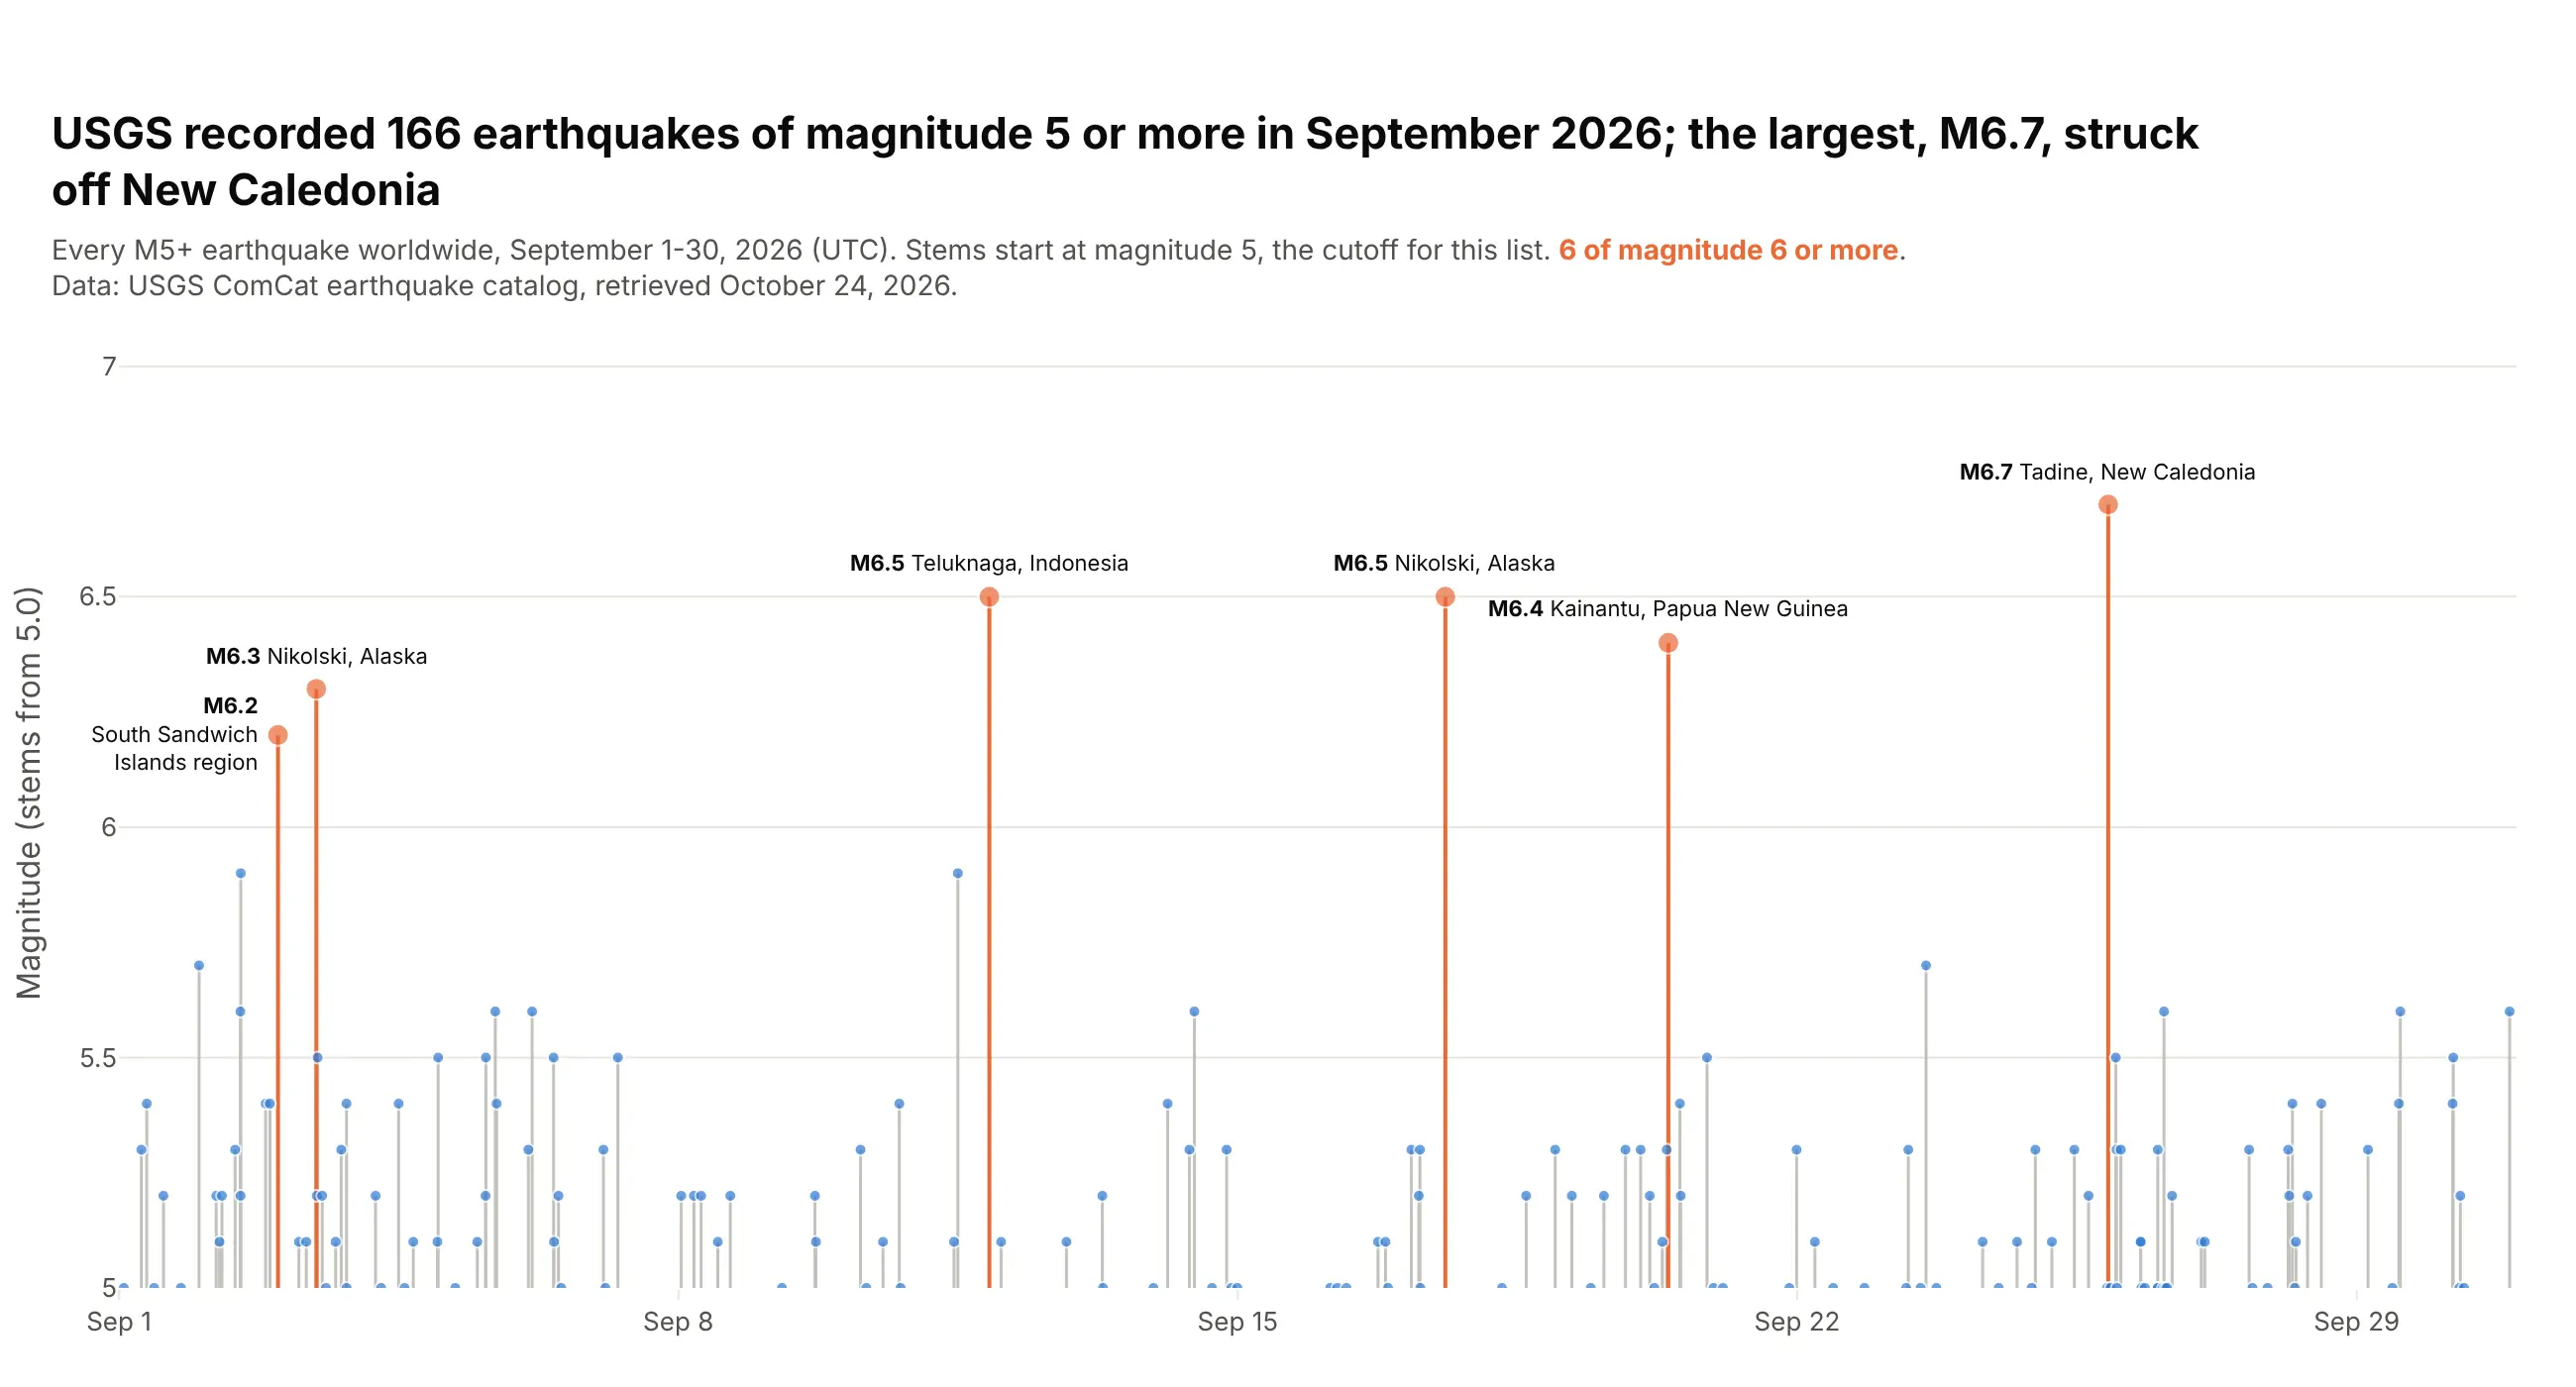
Events in time, as a stem plot. USGS recorded 166 earthquakes of magnitude 5 or more in September 2026, each drawn as a stem at the moment it happened, and the largest was M6.7 off New Caledonia. Data: USGS ComCat earthquake catalog.
A short history
The lollipop chart grew out of the dot chart, which William Cleveland proposed in 1984 as a more accurate replacement for bar and pie charts (Cleveland, 1984, The American Statistician). His dot charts put one dot per row with a dotted line across the whole row to guide the eye; here is that style redrawn with Plotly on the Phase 3 sponsors (a redraw of the style, not of his original figure):
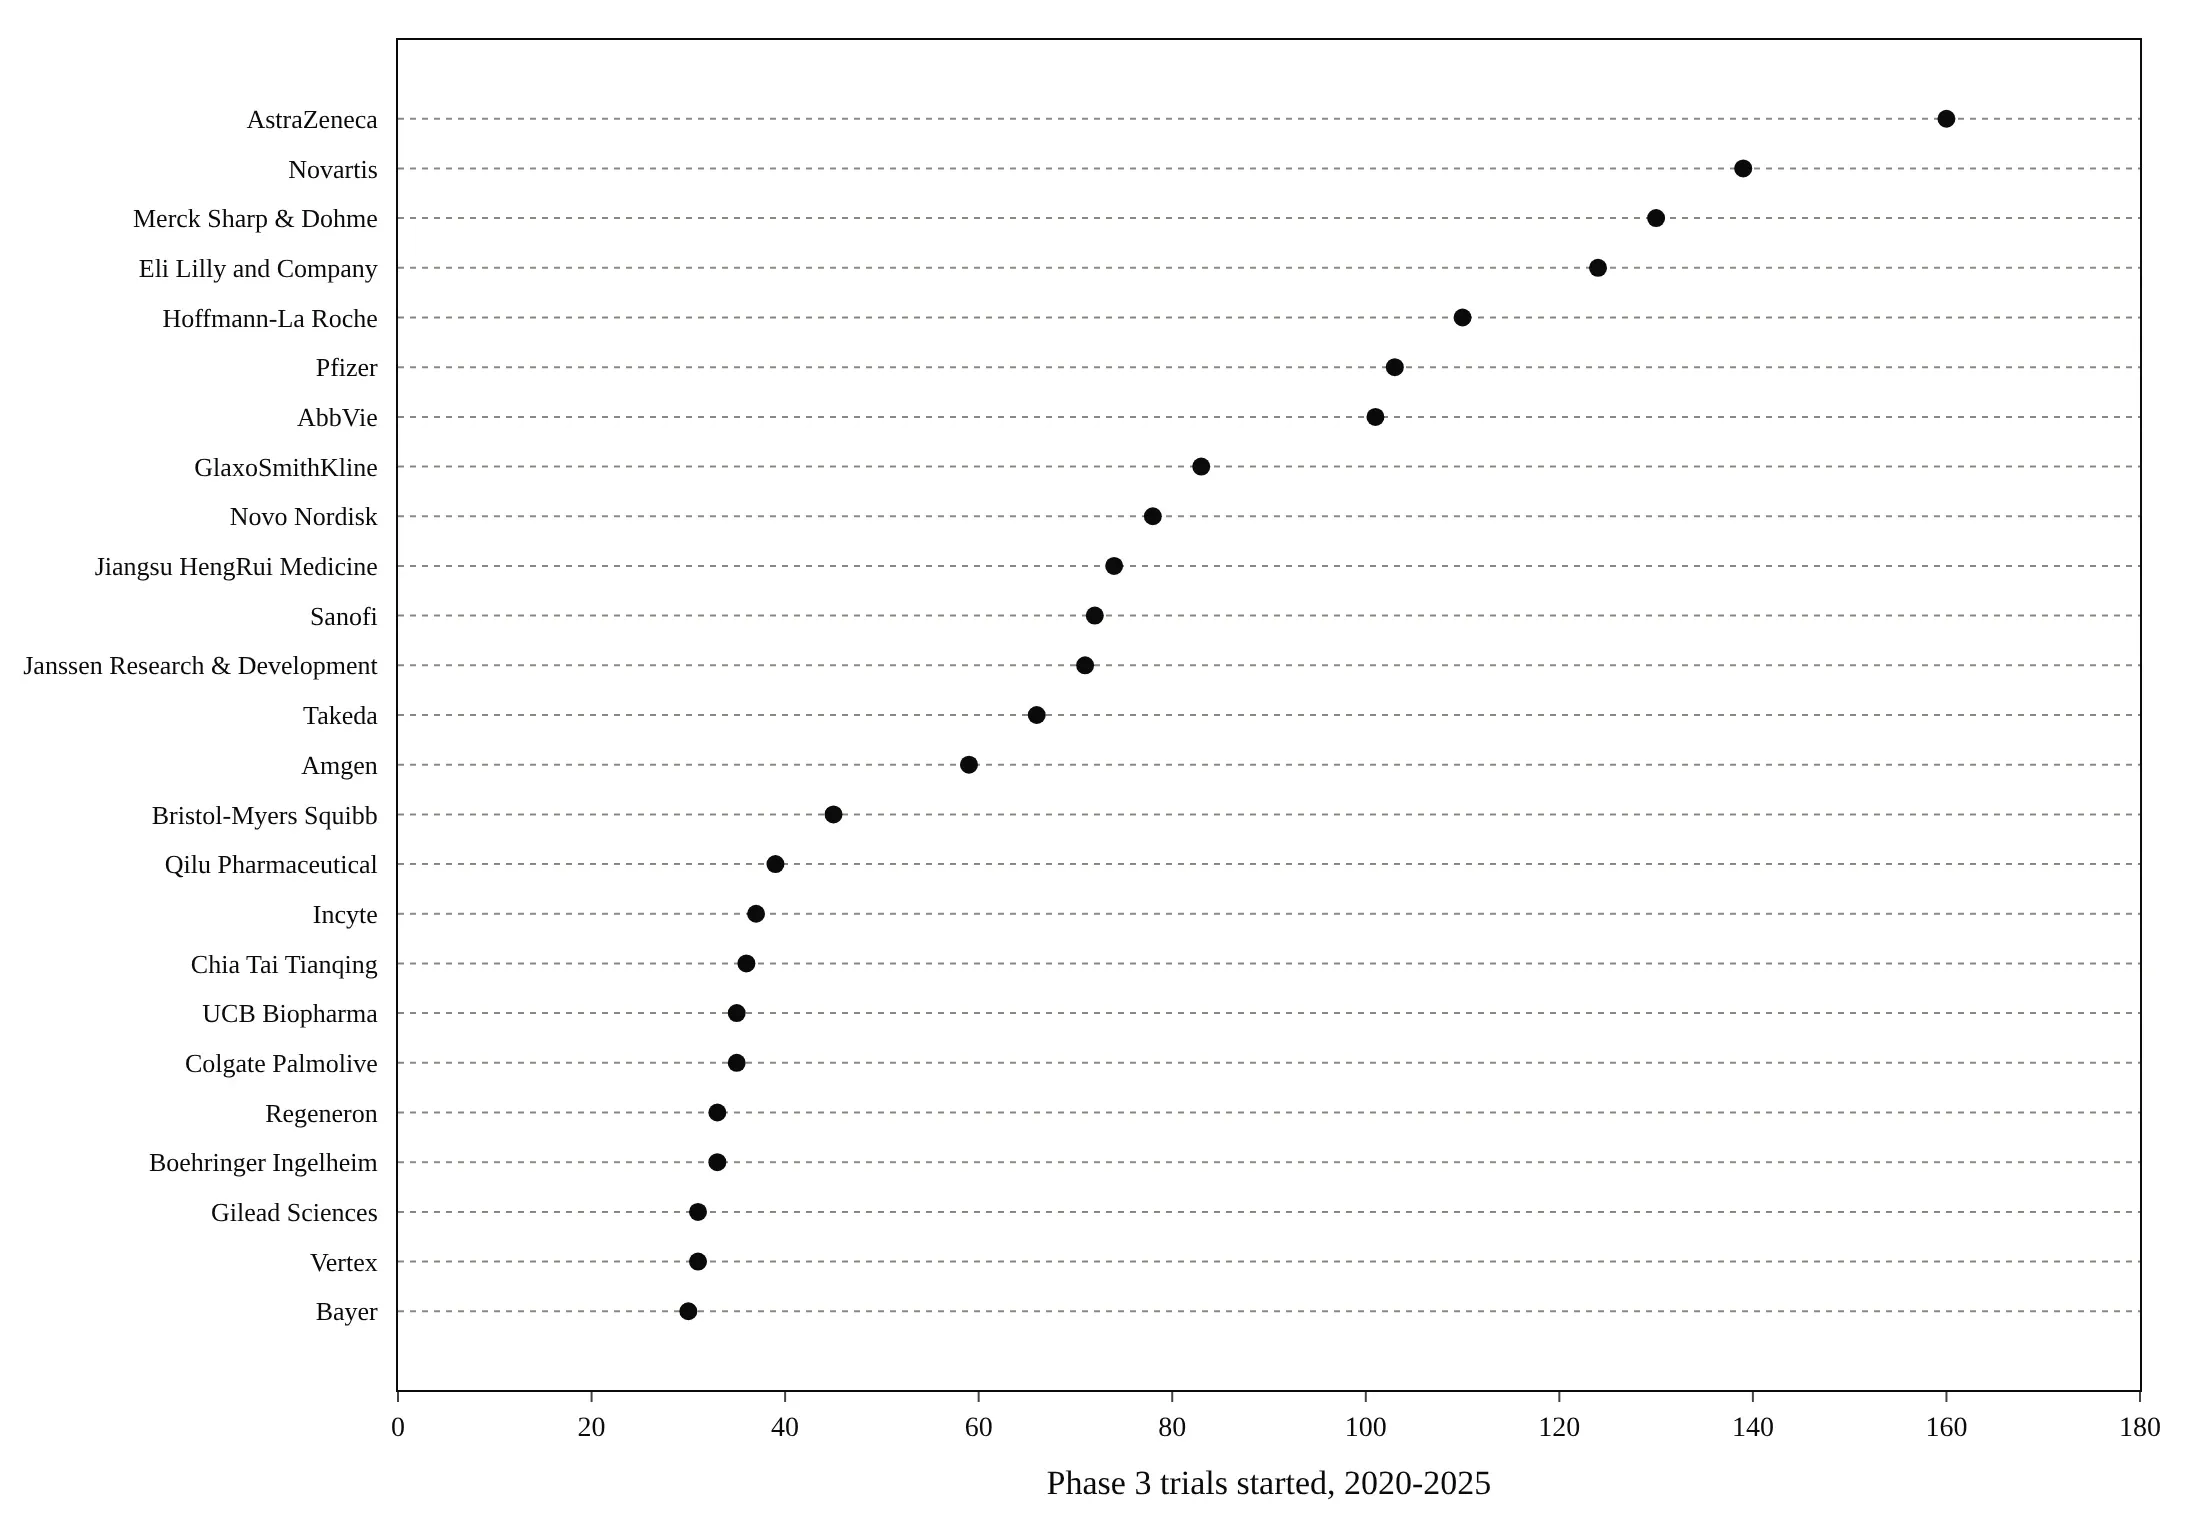
His experiments with Robert McGill showed that people judge position along a common scale more accurately than length or area (Cleveland and McGill, 1984). The lollipop keeps the dot and replaces the dotted guide with a stem from zero, so the length reads like a bar again. In signal processing the same chart is called a stem plot.
Alternatives to a lollipop chart
Here are the same 12 sponsors drawn four ways. Some are better for the question, some worse, some just different:
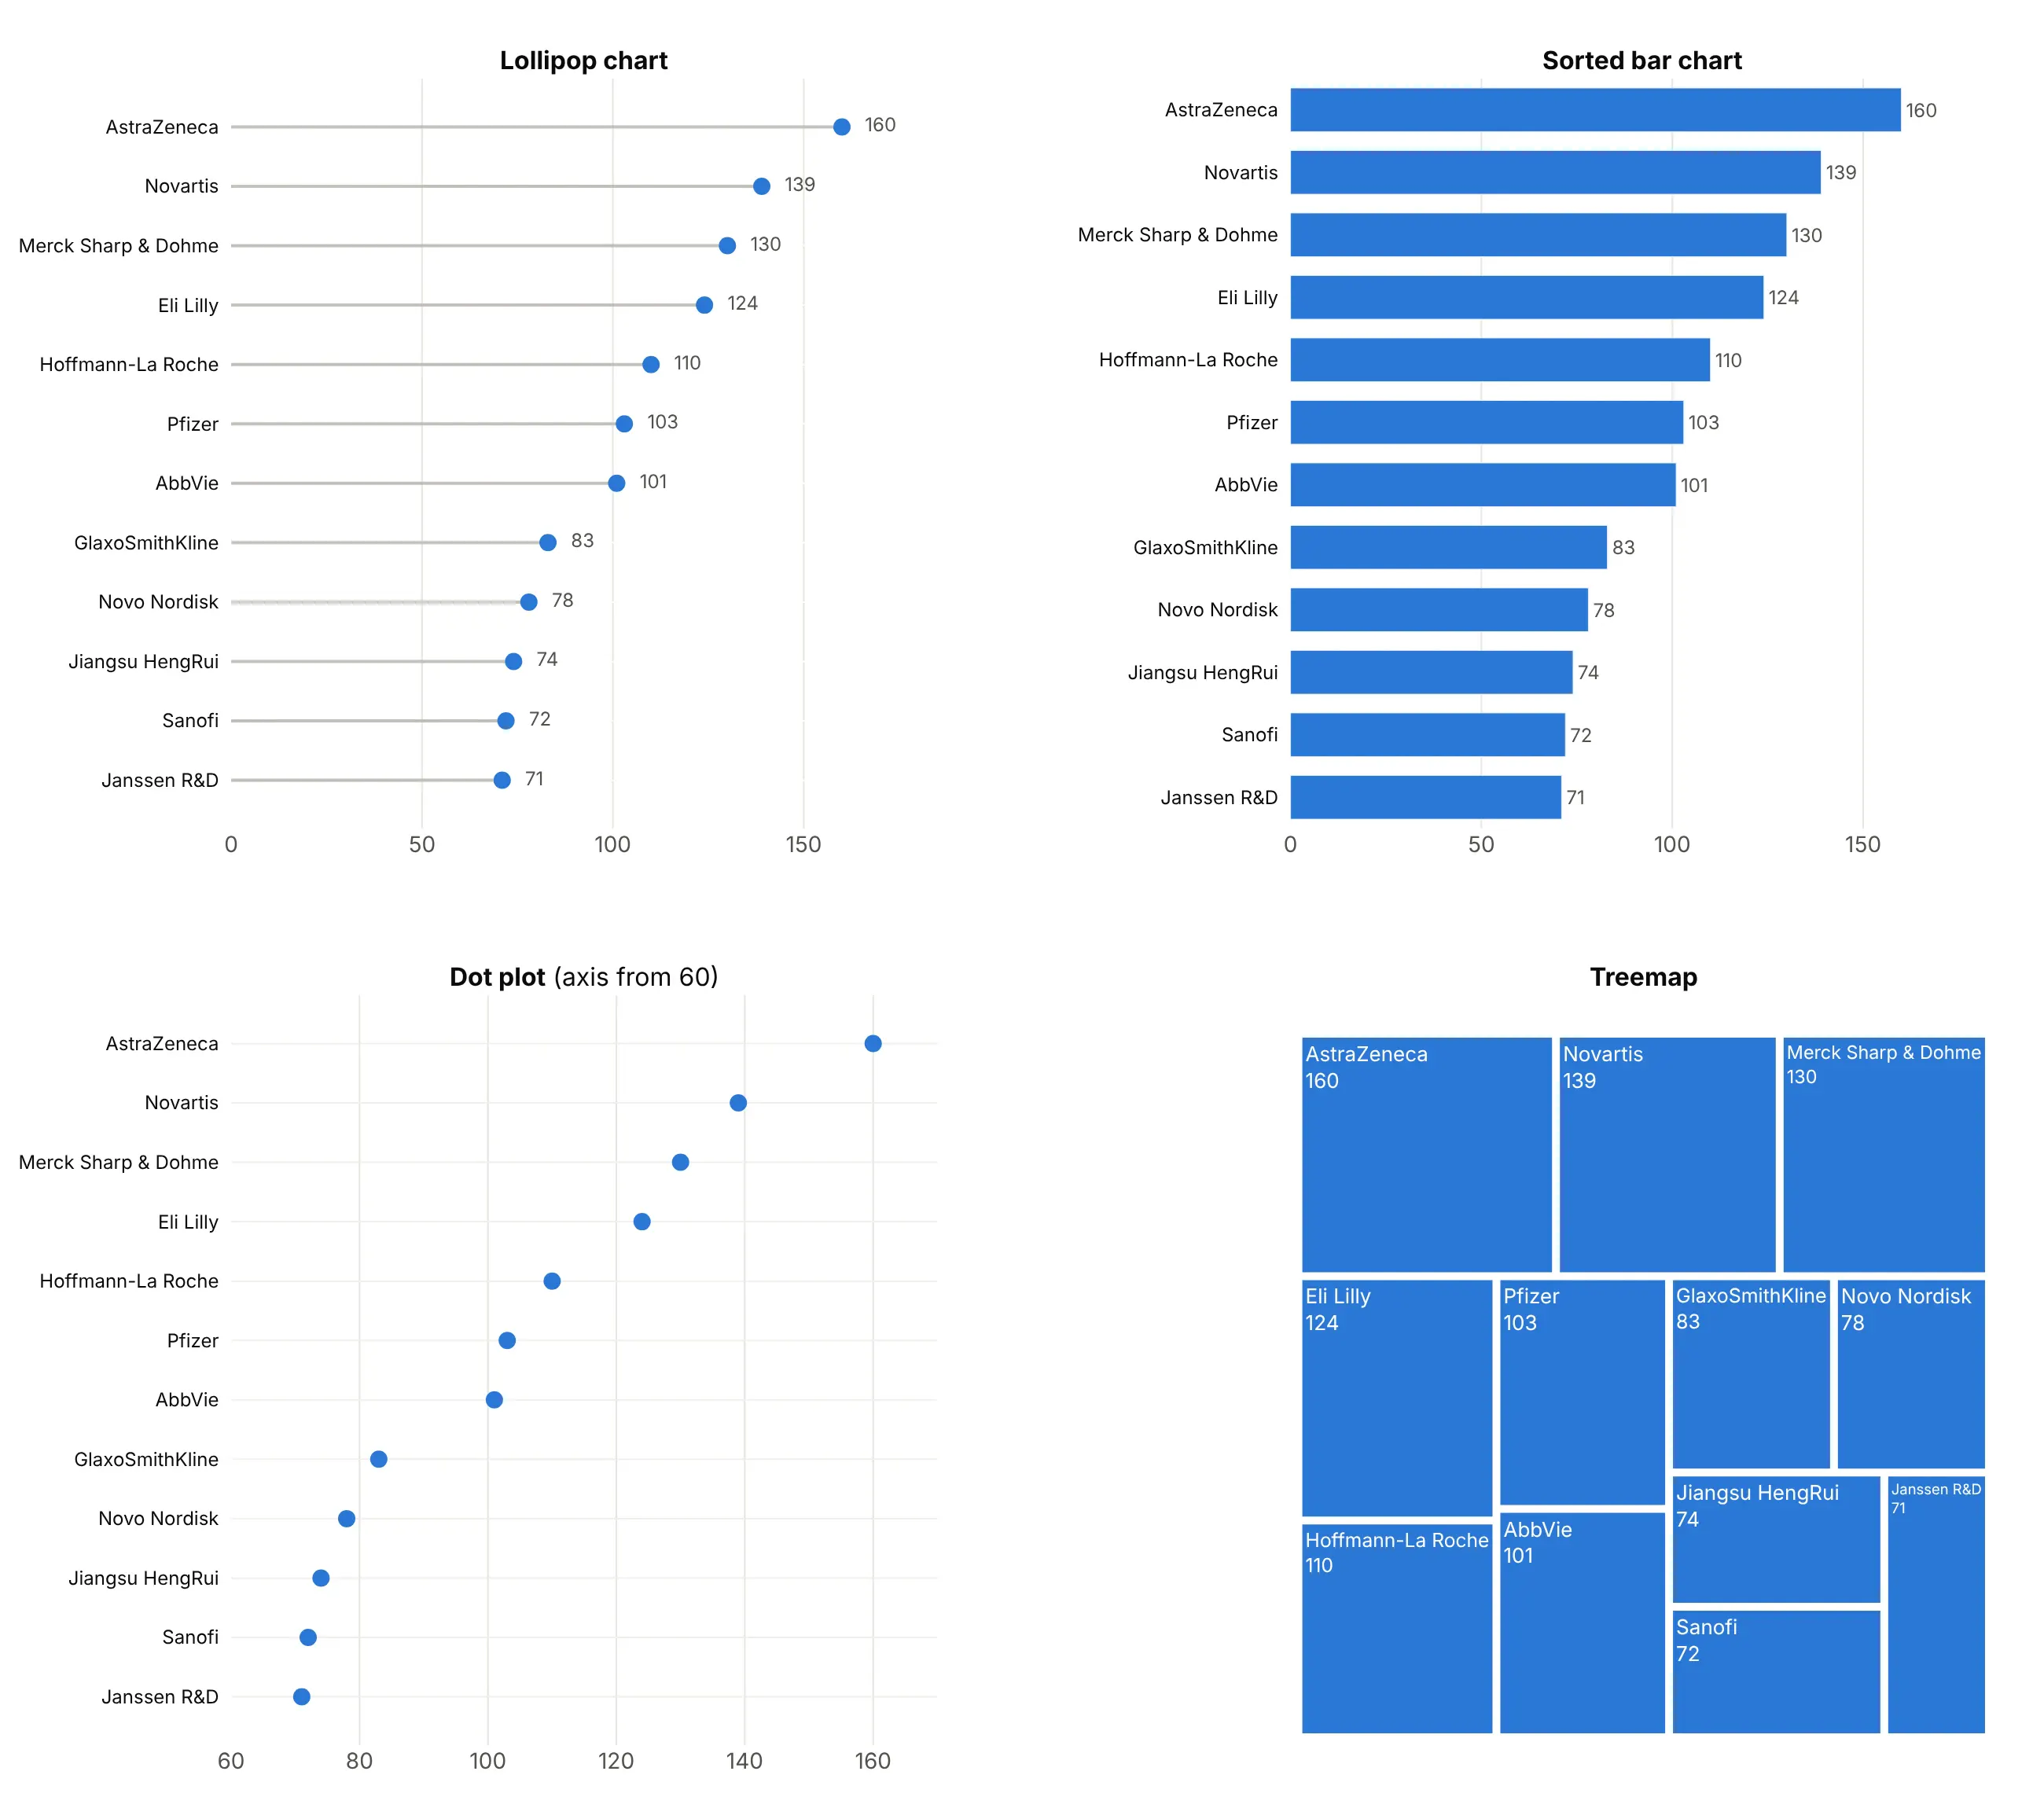
- Sorted bar chart (works too, better for a few bars). It encodes the same length from zero, and with fewer than about ten bars it is just as clear. With 30 or 50 bars of similar length it turns into a block of stripes, which is where the lollipop wins.
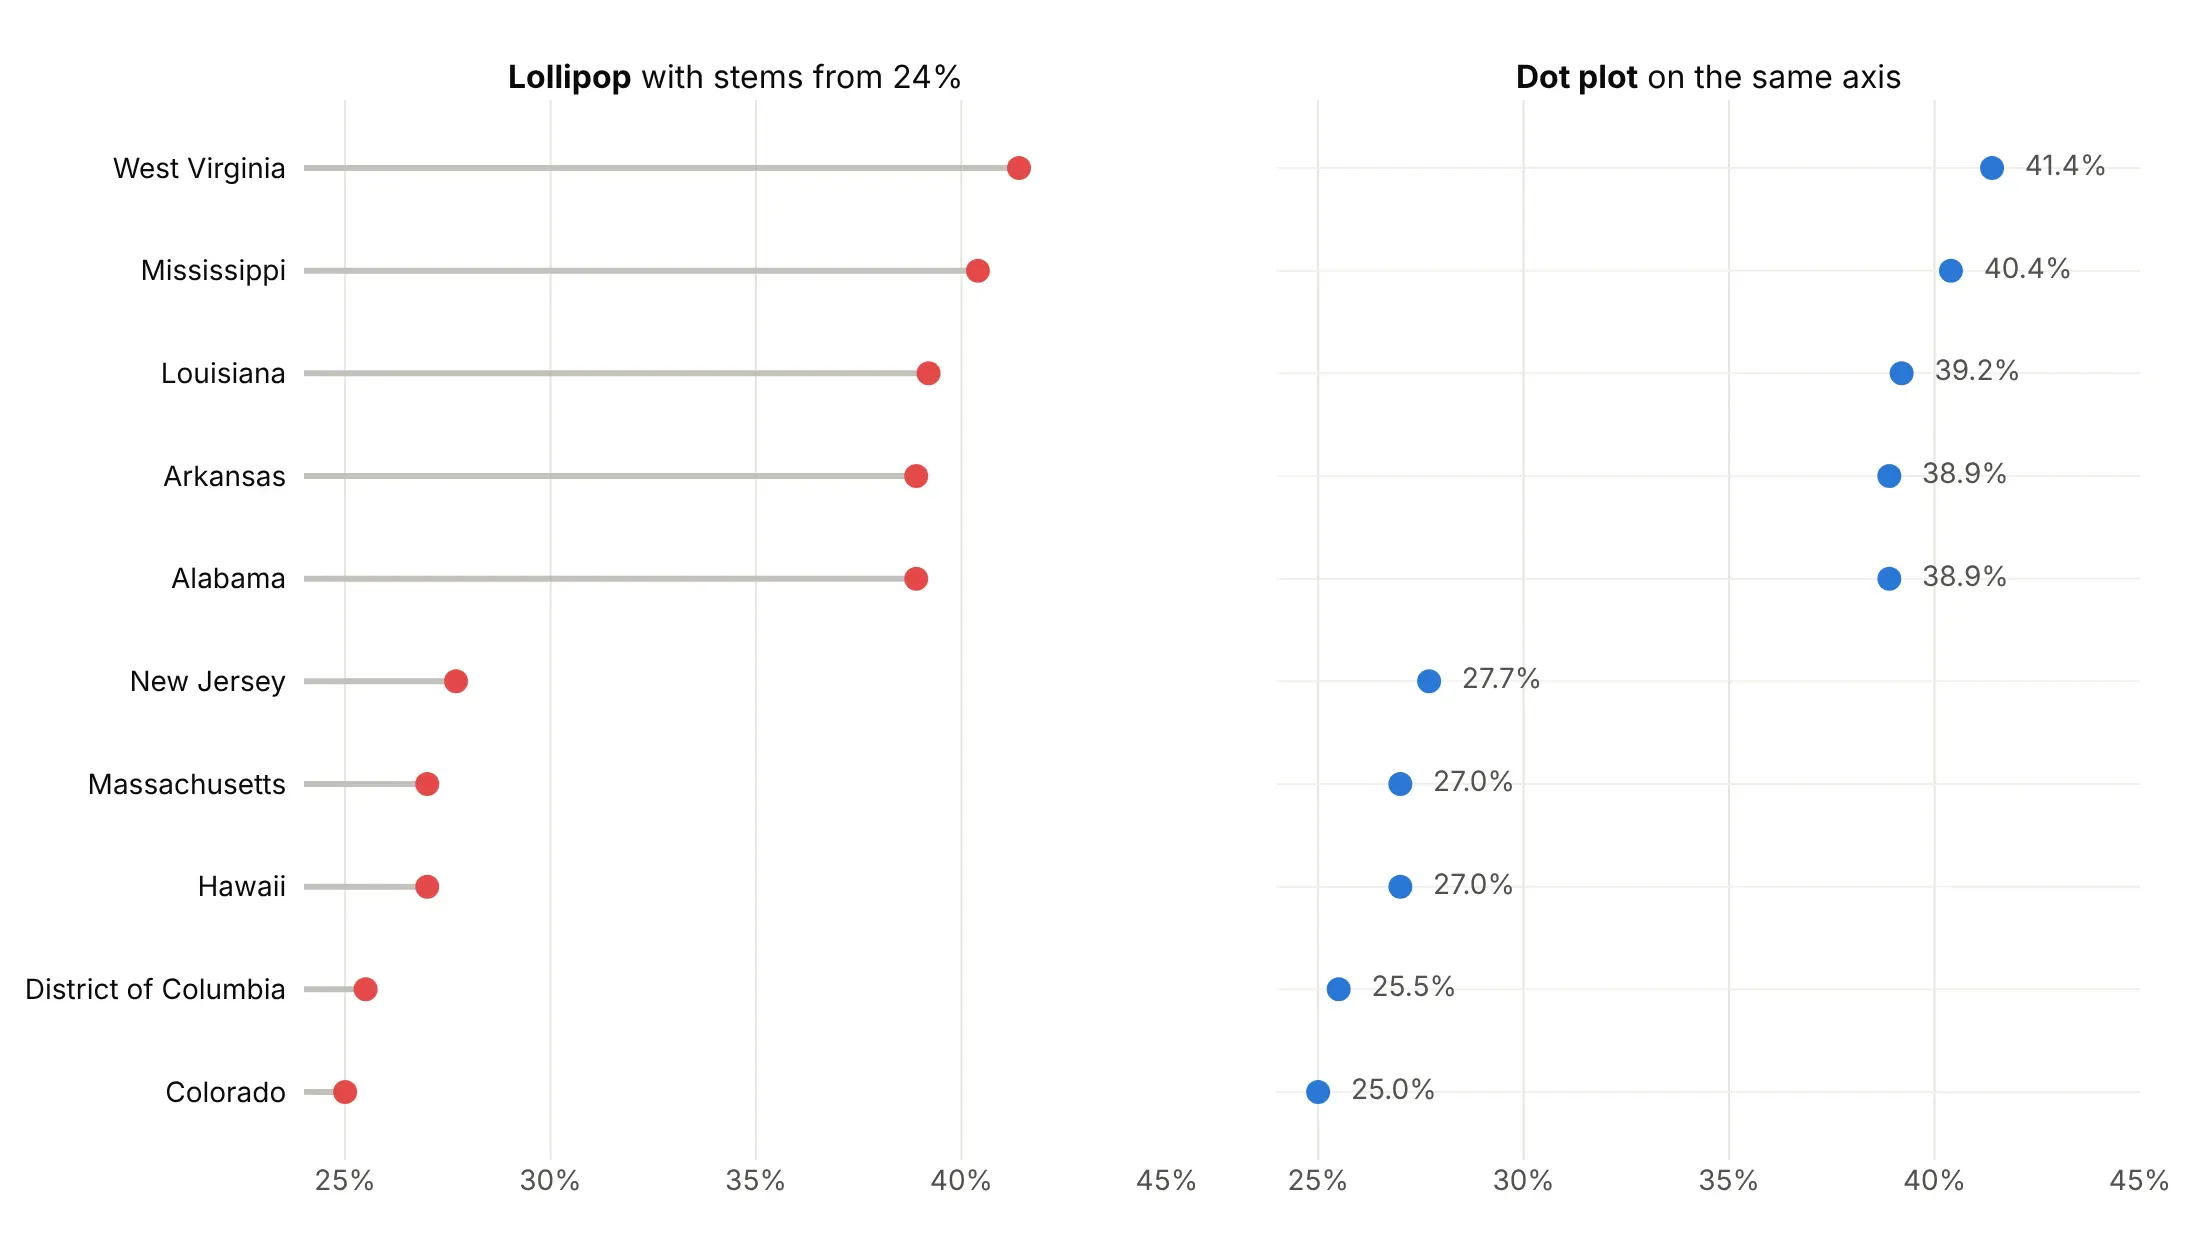
- Dot plot (better when you need to zoom). Without stems, the axis can start anywhere, so a dot plot can zoom into 60 to 170 trials or 24% to 45% without exaggerating differences. It loses the length from zero.
- Treemap (different). Shows each sponsor as a share of the total, which suits parts of a whole but makes close values hard to compare. See our treemap guide.
For two values per row, such as two years or two groups, use a dumbbell chart instead.
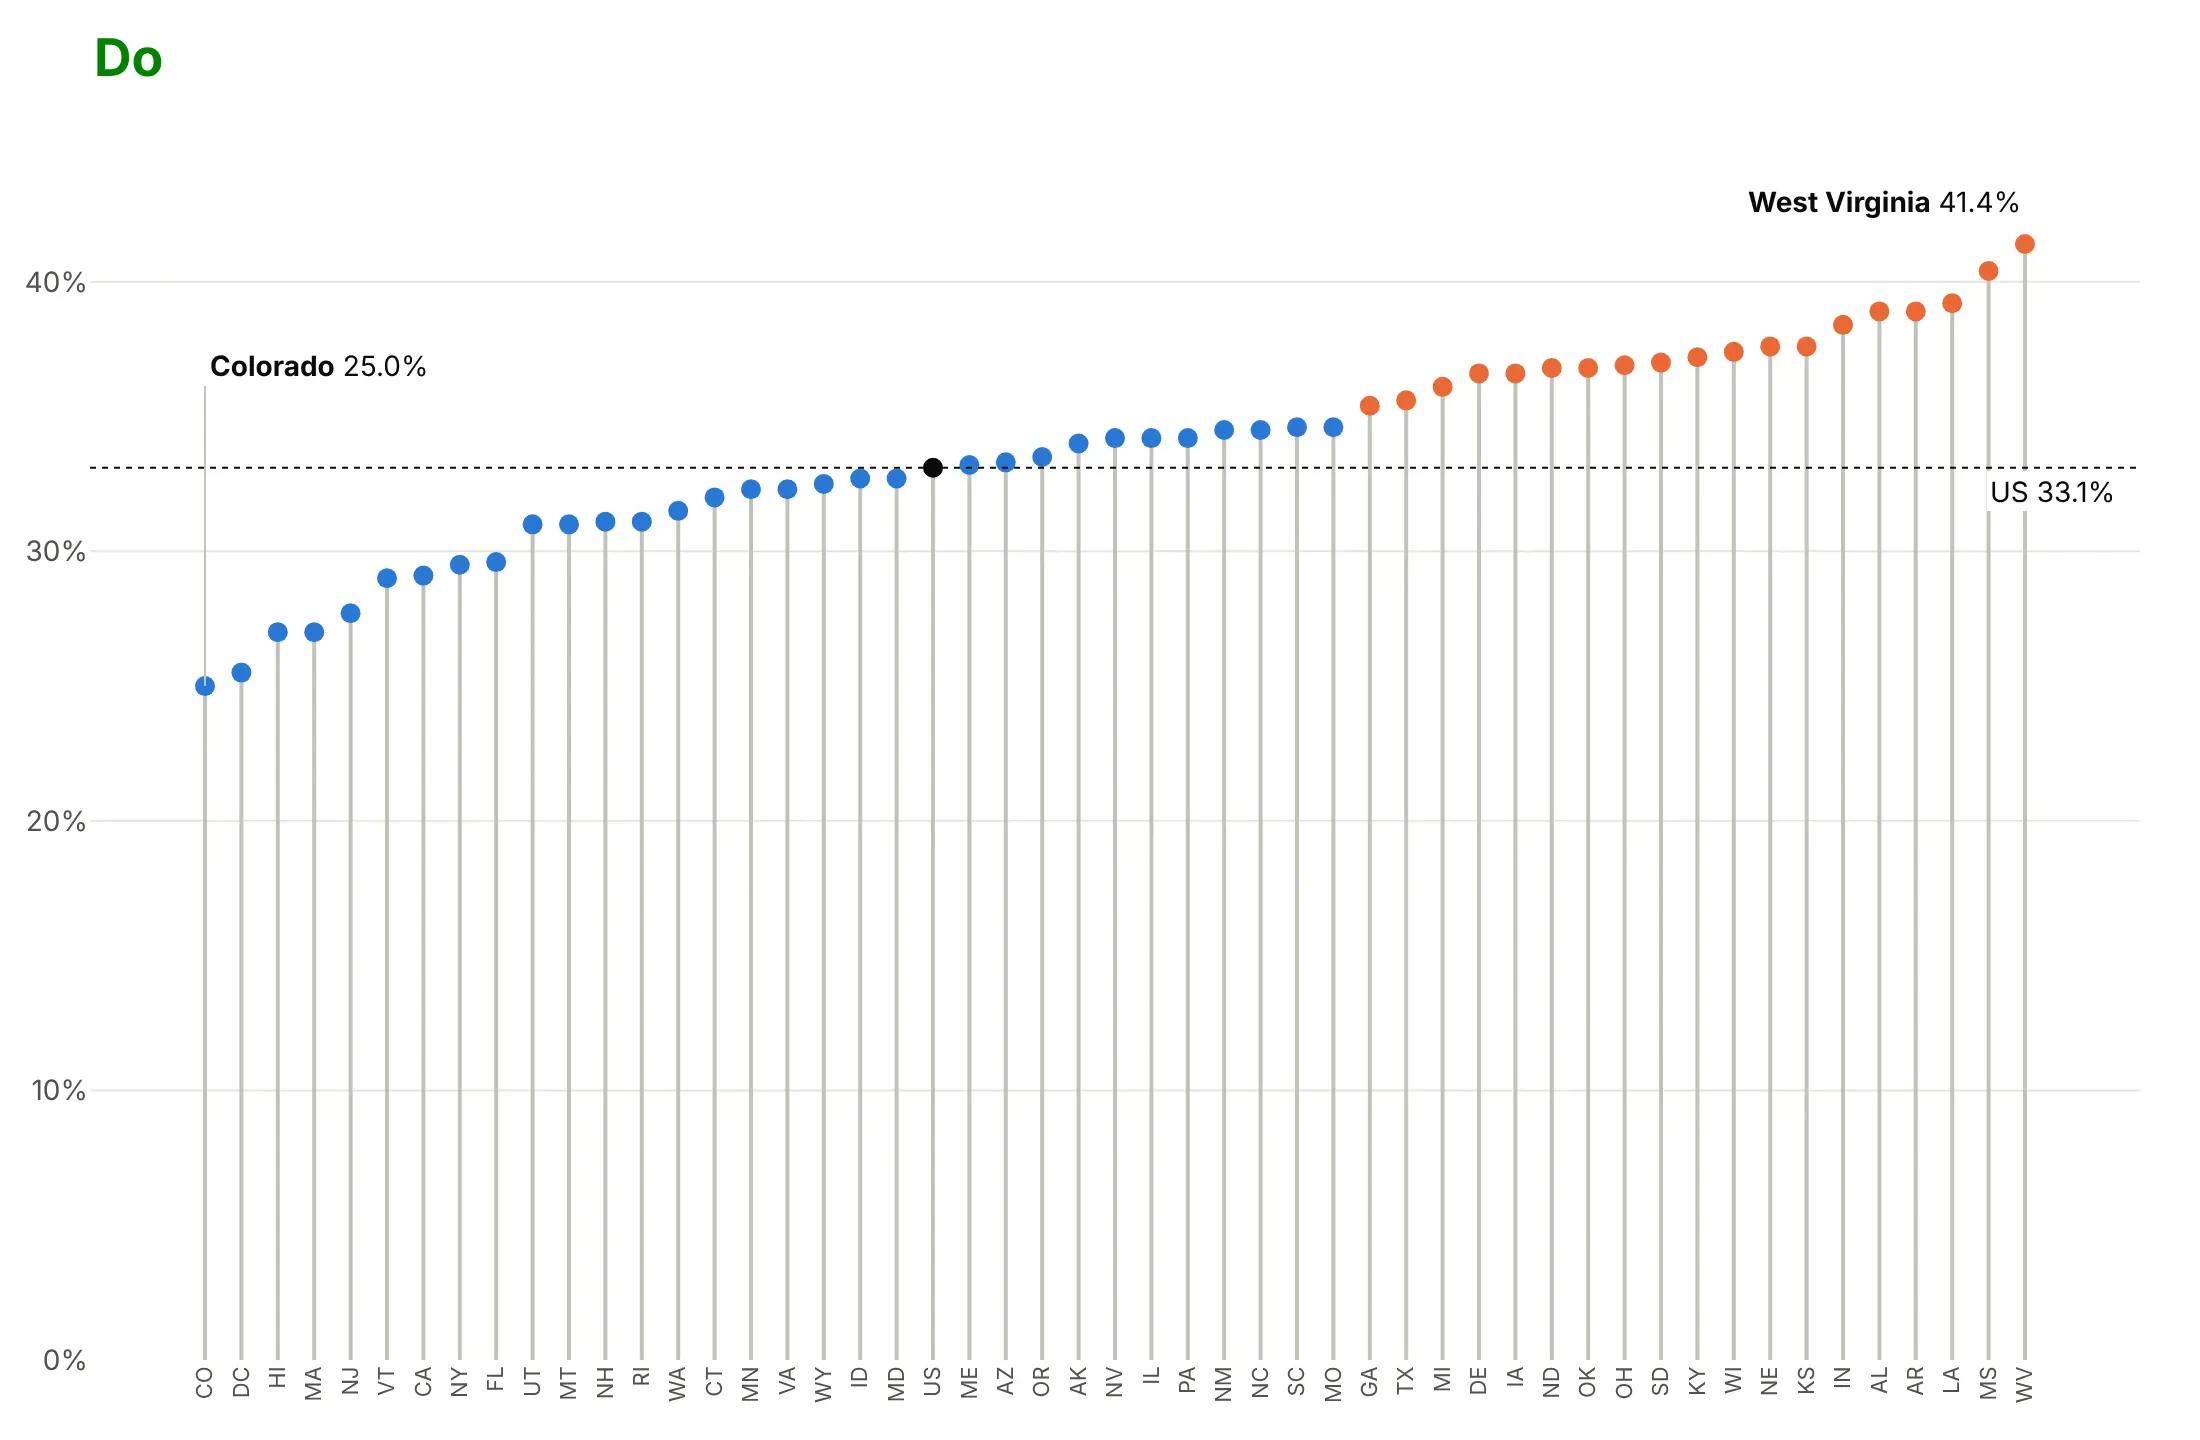
Here's where the dot plot wins. Zoomed into 24% to 45% adult obesity, stems that start at 24% make West Virginia (41.4%) look 17 times Colorado (25.0%), when it is 1.7 times; dots on the same axis don't make that claim:
How to make a lollipop chart
With AI
ChatGPT, Claude Code, GitHub Copilot, Cursor and other AI tools are excellent at writing Plotly code. Name Plotly in the prompt, say where the stems start and how to sort, and list the checks you want:
Make a plotly lollipop chart from inflation.csv (columns: country, iso3, inflation_2024).- Draw the stems as ONE go.Scatter in mode="lines" with Nonebetween rows, plus one marker trace for the heads. Don't use add_shape in a loop.- Stems start at 2% (a dotted reference line labeled "2% target"), not at zero.- One row per country, sorted by value, highest at the top.- Orange heads above 2%, blue below; print the value next to each head on the outer side.- Clip the x axis at 9% and draw any country above it as an arrow with its value.- A title that states the main takeaway. Assert there are 38 rows and no missing values.- Save it as lollipop.html and as a PNG at 2x scale.
With Plotly Studio
Plotly Studio is a desktop app where you point an AI at a dataset and it builds charts and a Dash app around your questions. Ask for a lollipop chart the same way:
Show a lollipop chart of 2024 consumer price inflation for the 38 OECD countries, with stems growing from a 2% reference line, sorted by value, orange above 2% and blue below.
Make a lollipop chart in Python or JavaScript
This is the code AI tools write under the hood. In Python, a small helper builds the two traces from a DataFrame, sorts the rows, grows the stems from zero or a benchmark and prints each value on the side its stem points to:
import pandas as pdimport plotly.graph_objects as godef make_lollipop(df, label, value, base=0, color="#2a78d6",highlight=(), highlight_color="#eb6834", fmt="{:.1f}"):d = df.sort_values(value)xs, ys = [], []for v, c in zip(d[value], d[label]):xs += [base, v, None] # None breaks the line between rowsys += [c, c, None]colors = [highlight_color if c in highlight else color for c in d[label]]sides = ["middle right" if v >= base else "middle left" for v in d[value]]fig = go.Figure([go.Scatter(x=xs, y=ys, mode="lines", line=dict(color="#c3c2bc", width=2)),go.Scatter(x=d[value], y=d[label], mode="markers+text",marker=dict(size=11, color=colors),text=[" " + fmt.format(v) + " " for v in d[value]], textposition=sides),])if base:fig.add_vline(x=base, line=dict(dash="dot"))fig.update_layout(template="simple_white", showlegend=False)return figdf = pd.DataFrame({"country": ["France", "Germany", "India"], "grams": [55.3, 371.3, 713.0]})make_lollipop(df, "country", "grams", highlight=["India"], fmt="{:.0f} g").show()
In JavaScript, plotly.js takes the same two traces, with null between the rows of the stem trace:
<div id="chart"></div><script src="https://cdn.plot.ly/plotly-4.1.1.min.js"></script><script>const countries = ["France", "Germany", "India"];const grams = [55.3, 371.3, 713.0];Plotly.newPlot("chart", [{x: grams.flatMap(v => [0, v, null]),y: countries.flatMap(c => [c, c, null]),mode: "lines", line: {color: "#c3c2bc", width: 2}, hoverinfo: "skip"},{x: grams, y: countries, mode: "markers+text", marker: {size: 12, color: "#2a78d6"},text: grams.map(v => " " + v + " g"), textposition: "middle right"}], {showlegend: false});</script>
For vertical stems, swap x and y. A single marker trace with error bars back to zero, error_y=dict(type="data", symmetric=False, array=up, arrayminus=down, width=0), draws the stems too (example 8).
Share it
Every Plotly chart has a Share chart button (the cloud icon in its toolbar) that uploads it to Plotly Cloud and gives you a link. Only you can see it until you change its visibility.
For a live app, put the chart in a Dash app and publish it with the Plotly Cloud CLI. Coding agents can run these commands for you:
pip install "dash[cloud]"plotly user loginplotly app publish
If your data has to stay in your own cloud or data center, publish to Dash Enterprise instead.
Dos and don'ts
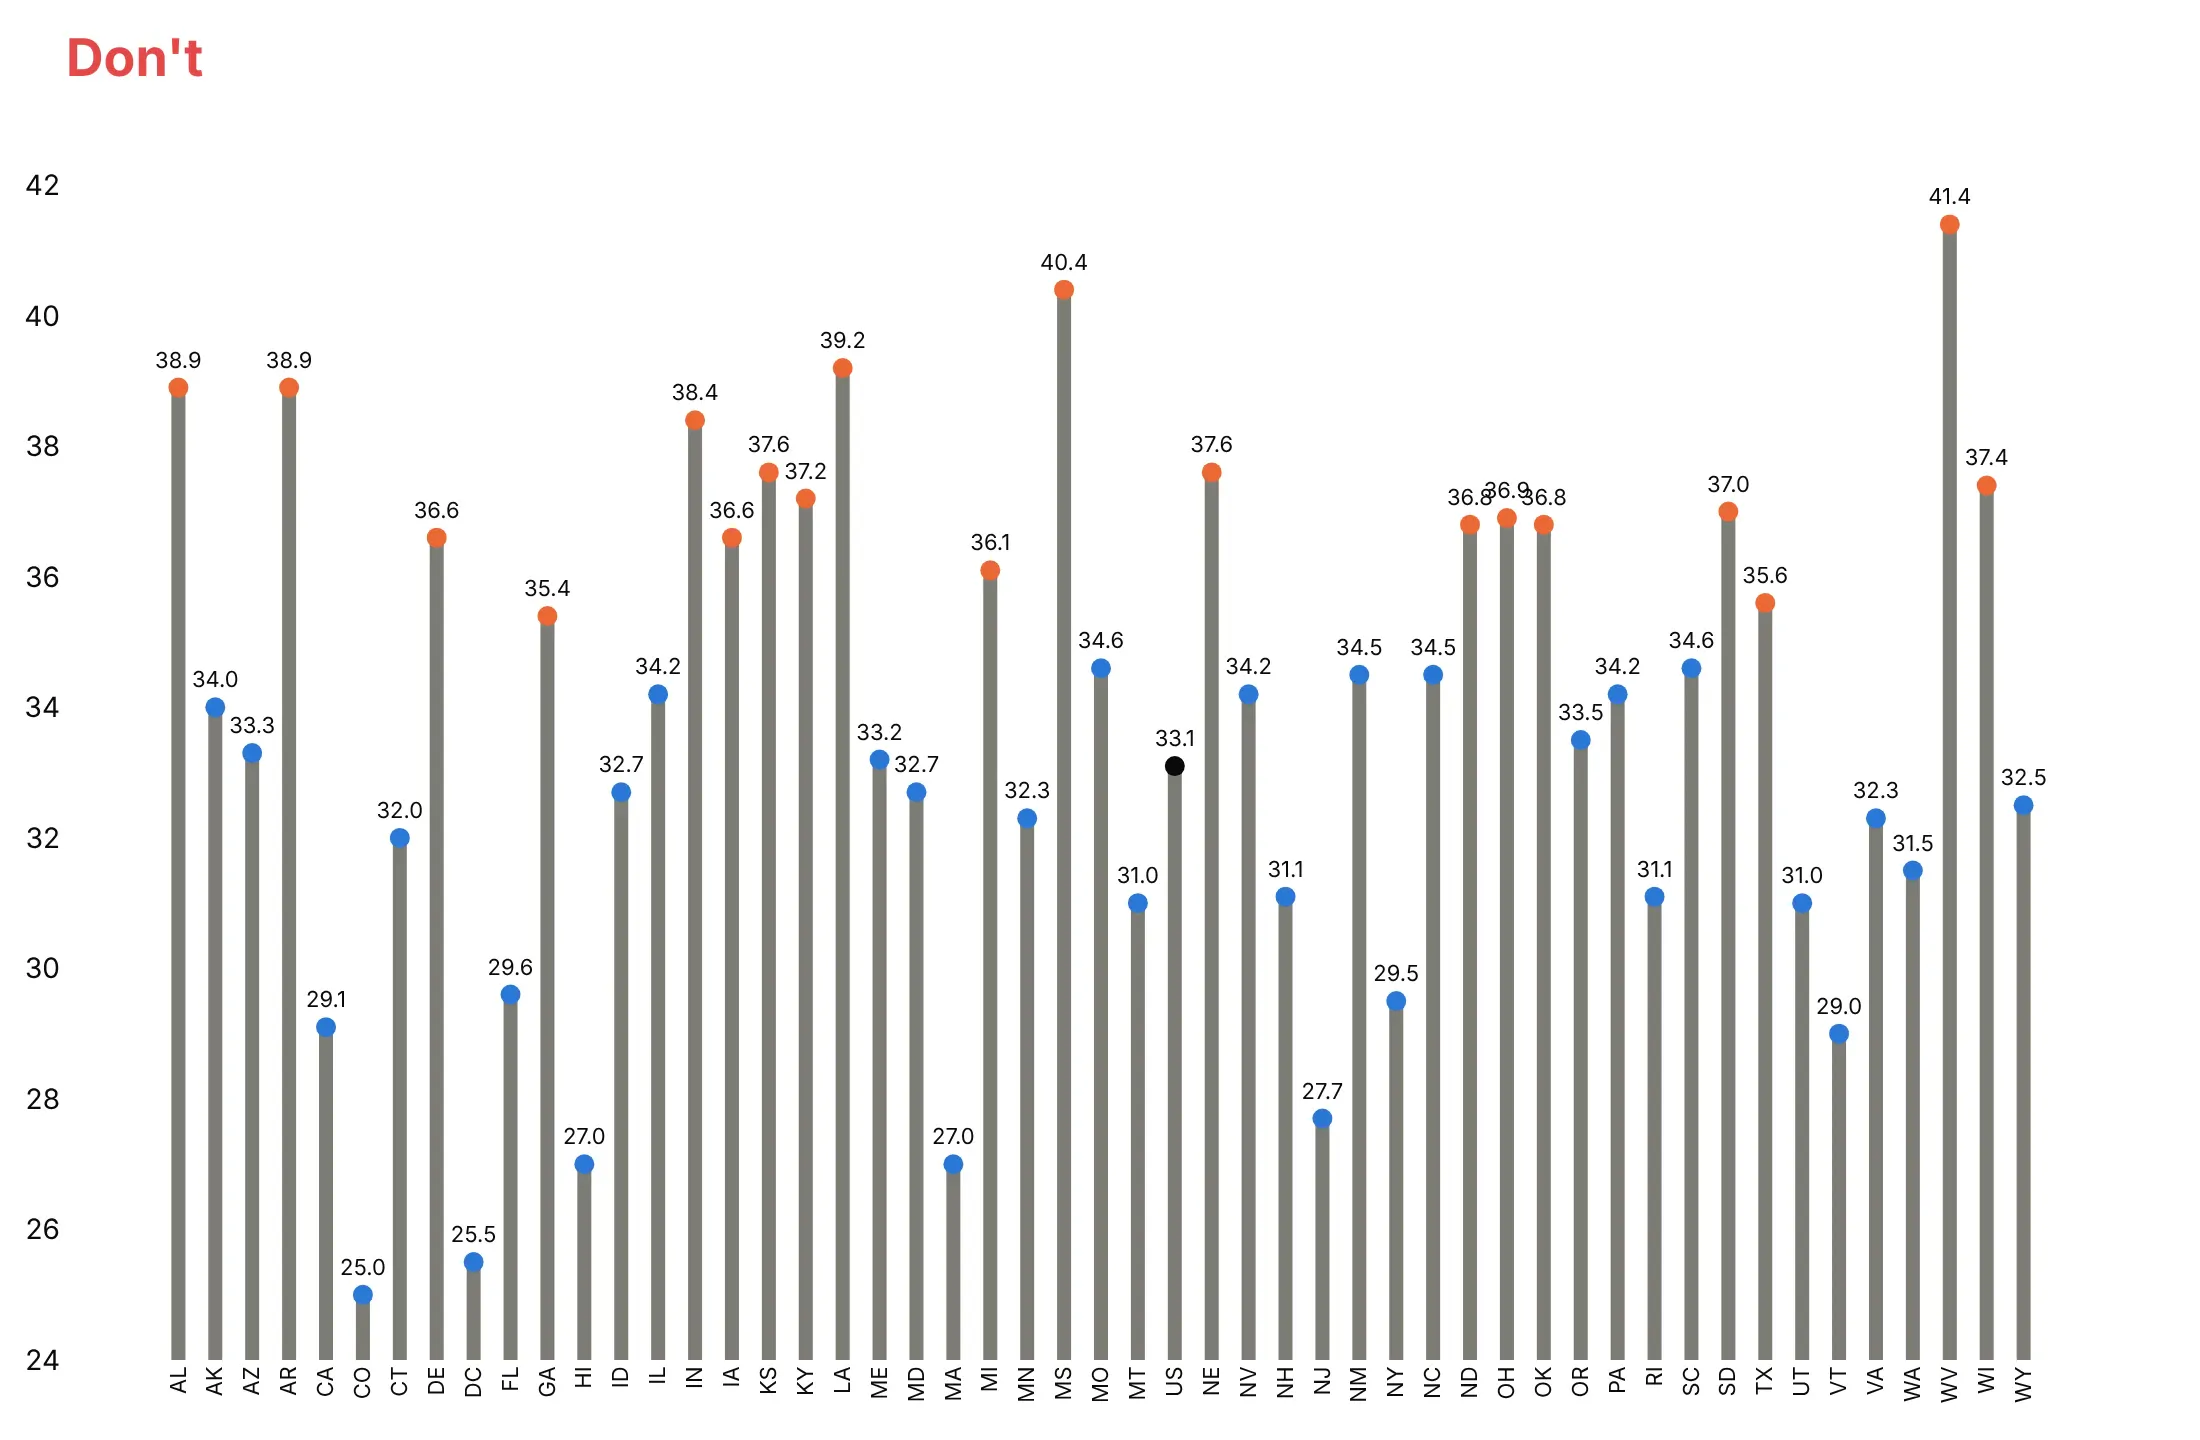
A lollipop chart only works if the stems mean something, so most mistakes are about the baseline, the order and clutter. Here is the same adult obesity data both ways, with the same colors: orange for states at 35% or more, blue for the rest and black for the national value.
Don't start the stems at 24%, keep the states in alphabetical order, draw thick dark stems or print an unformatted number on every head:
Do sort the states, start the stems at zero, keep them thin and light, and label only the extremes and the national value:
Choose the baseline and the color
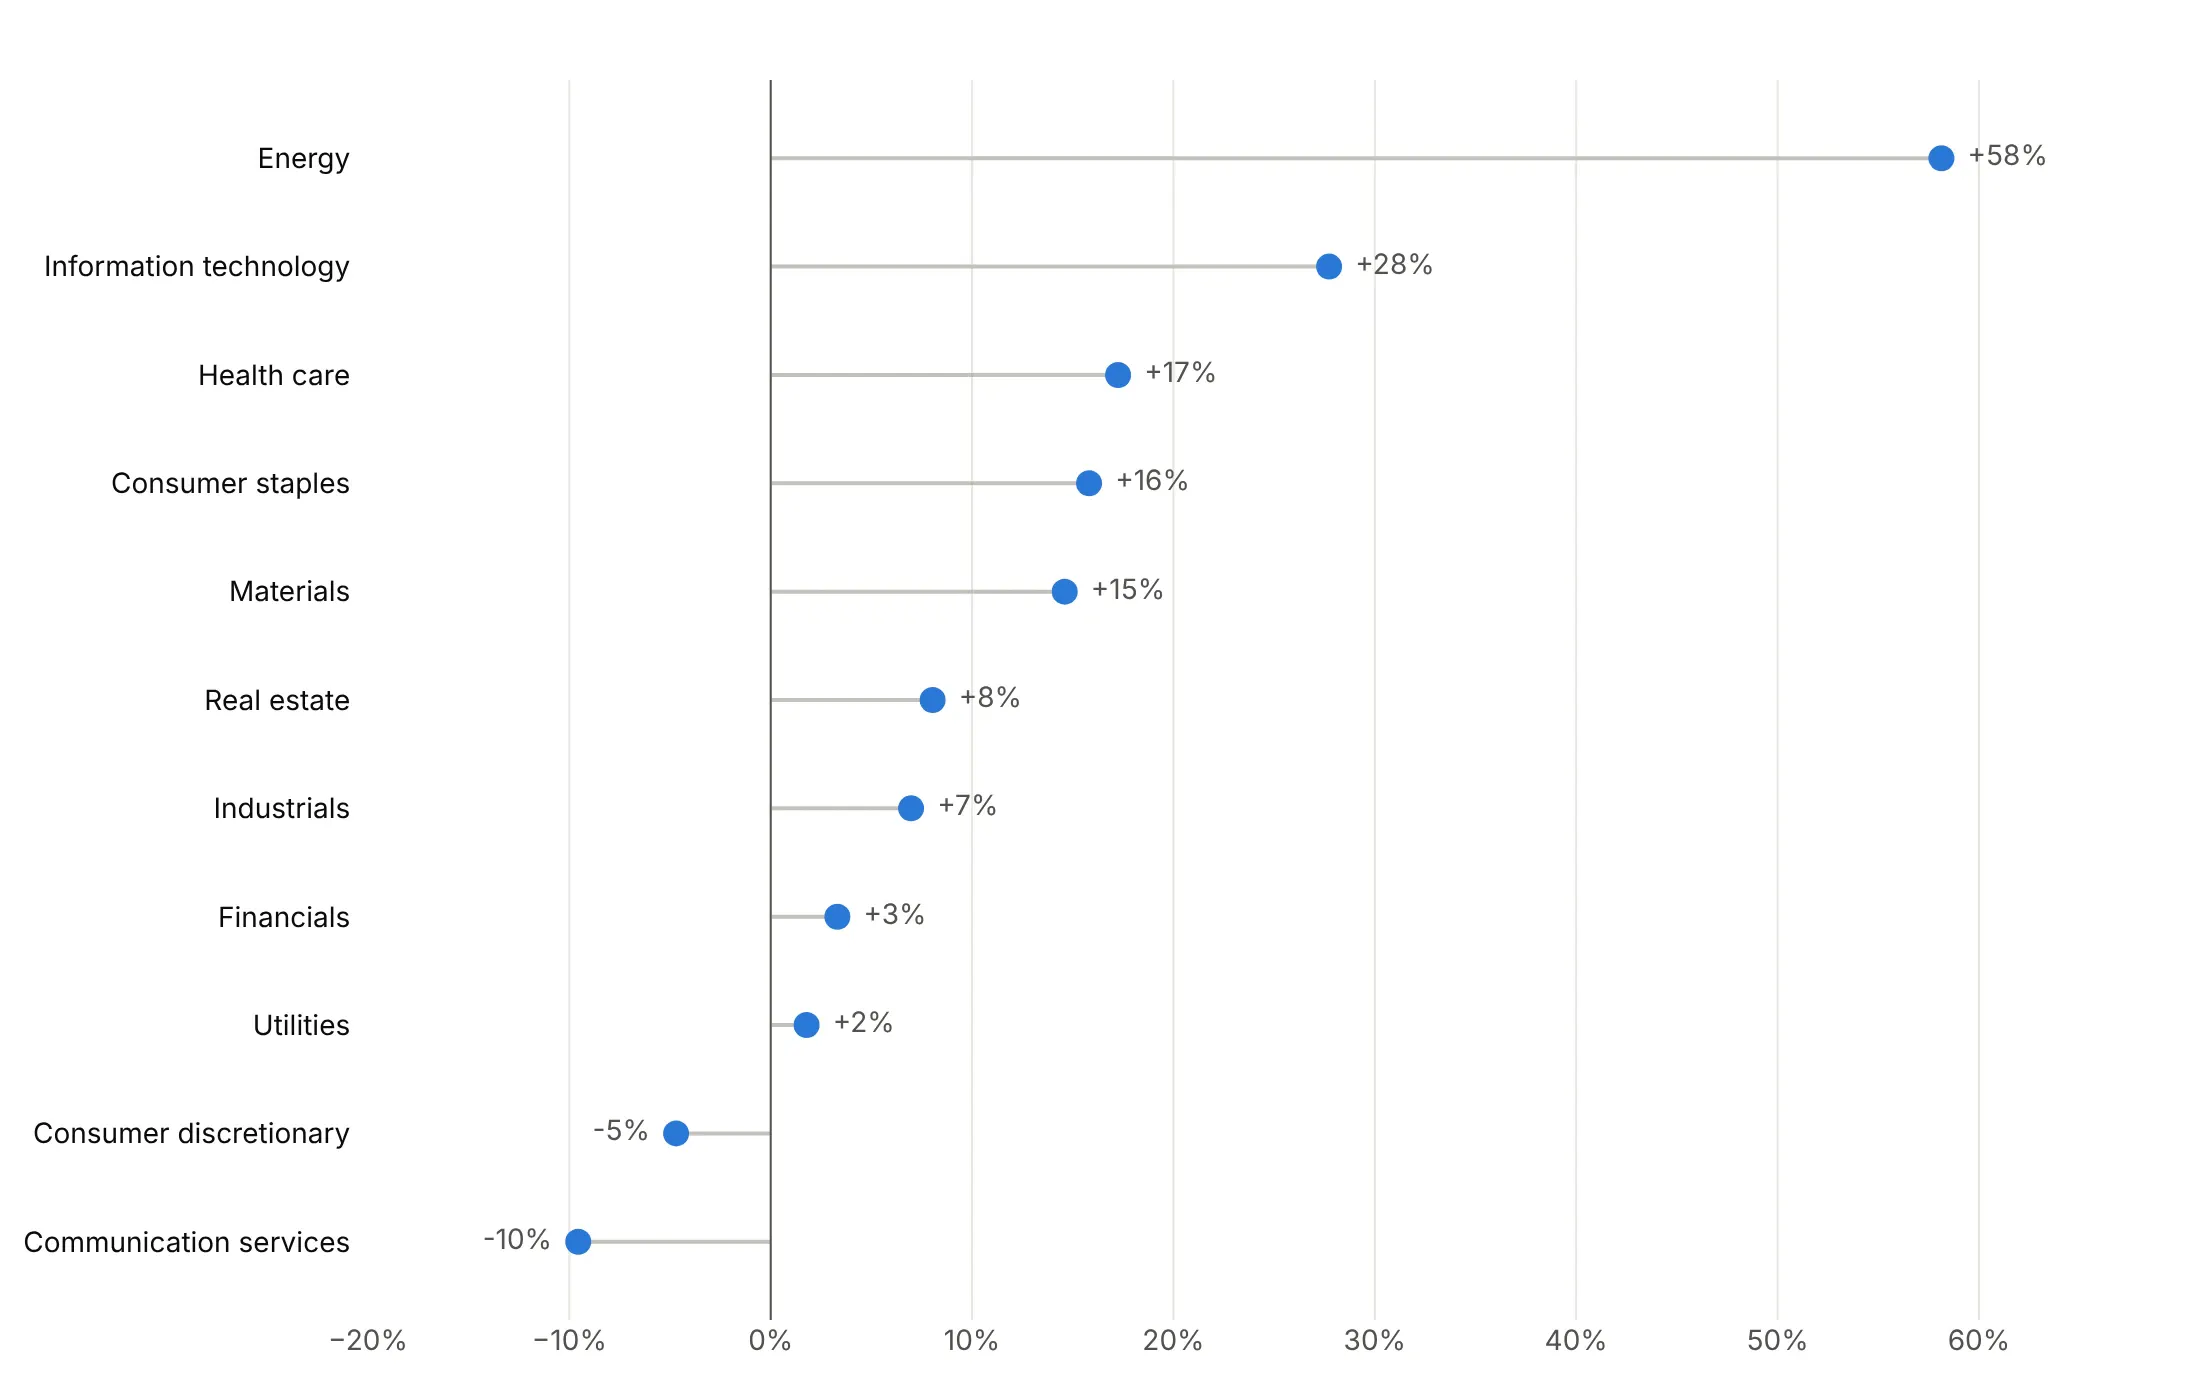
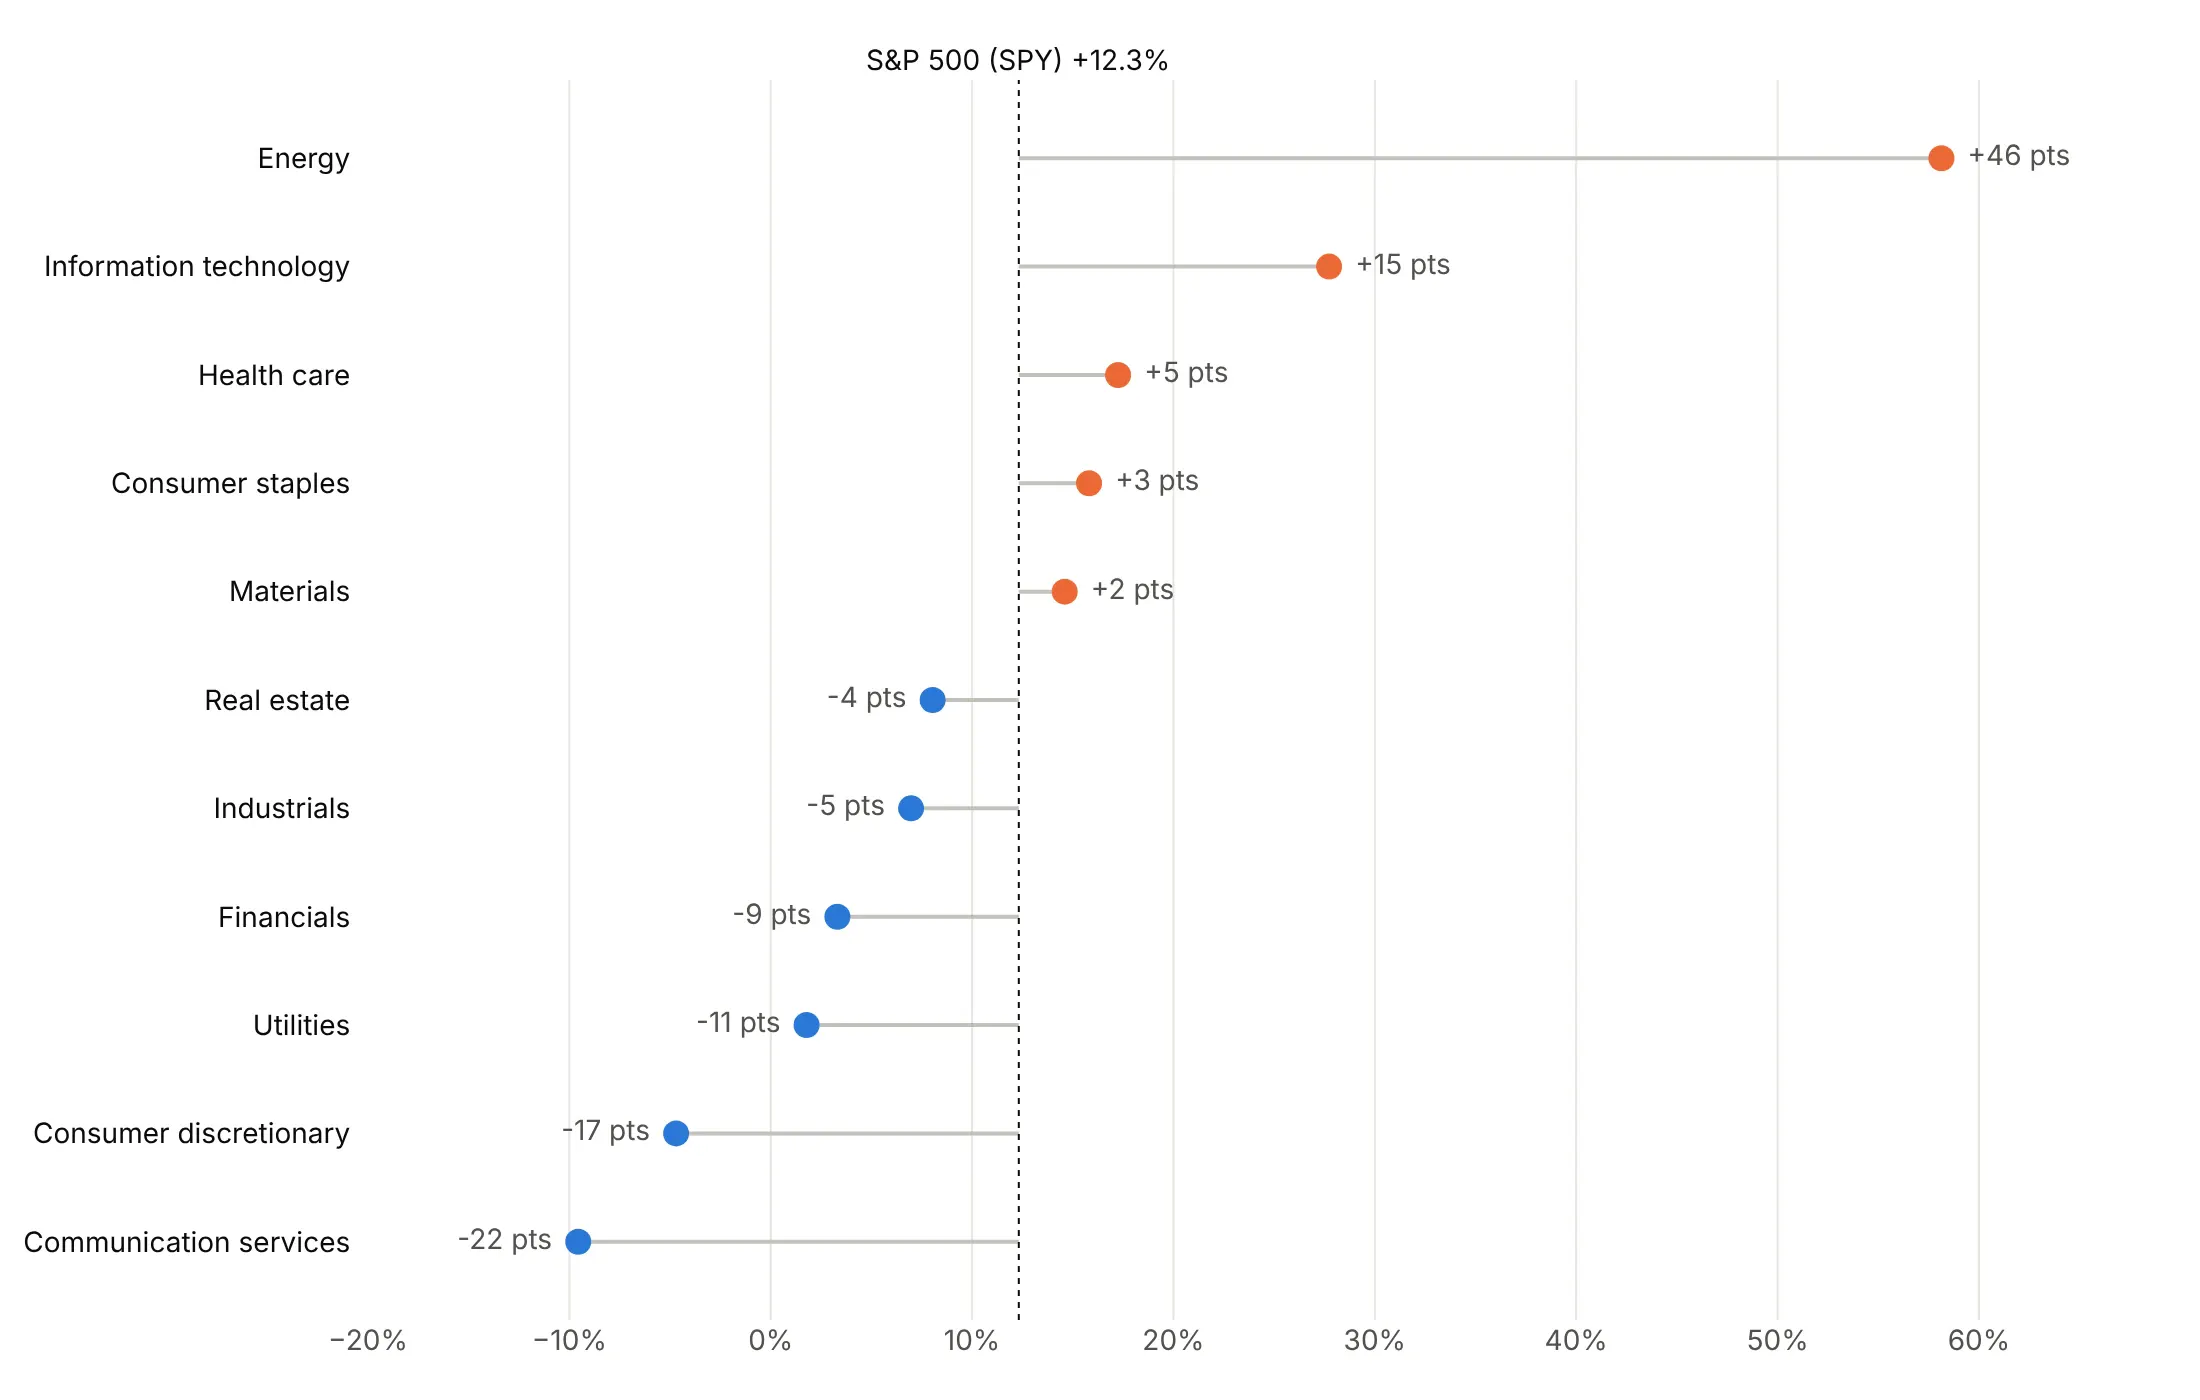
The baseline and the colors decide what the chart says. Here are four options on the 2026 returns of the 11 S&P 500 sectors.
Plain and sorted. Stems from zero in one color show the ranking and the sign, and it's a good default.
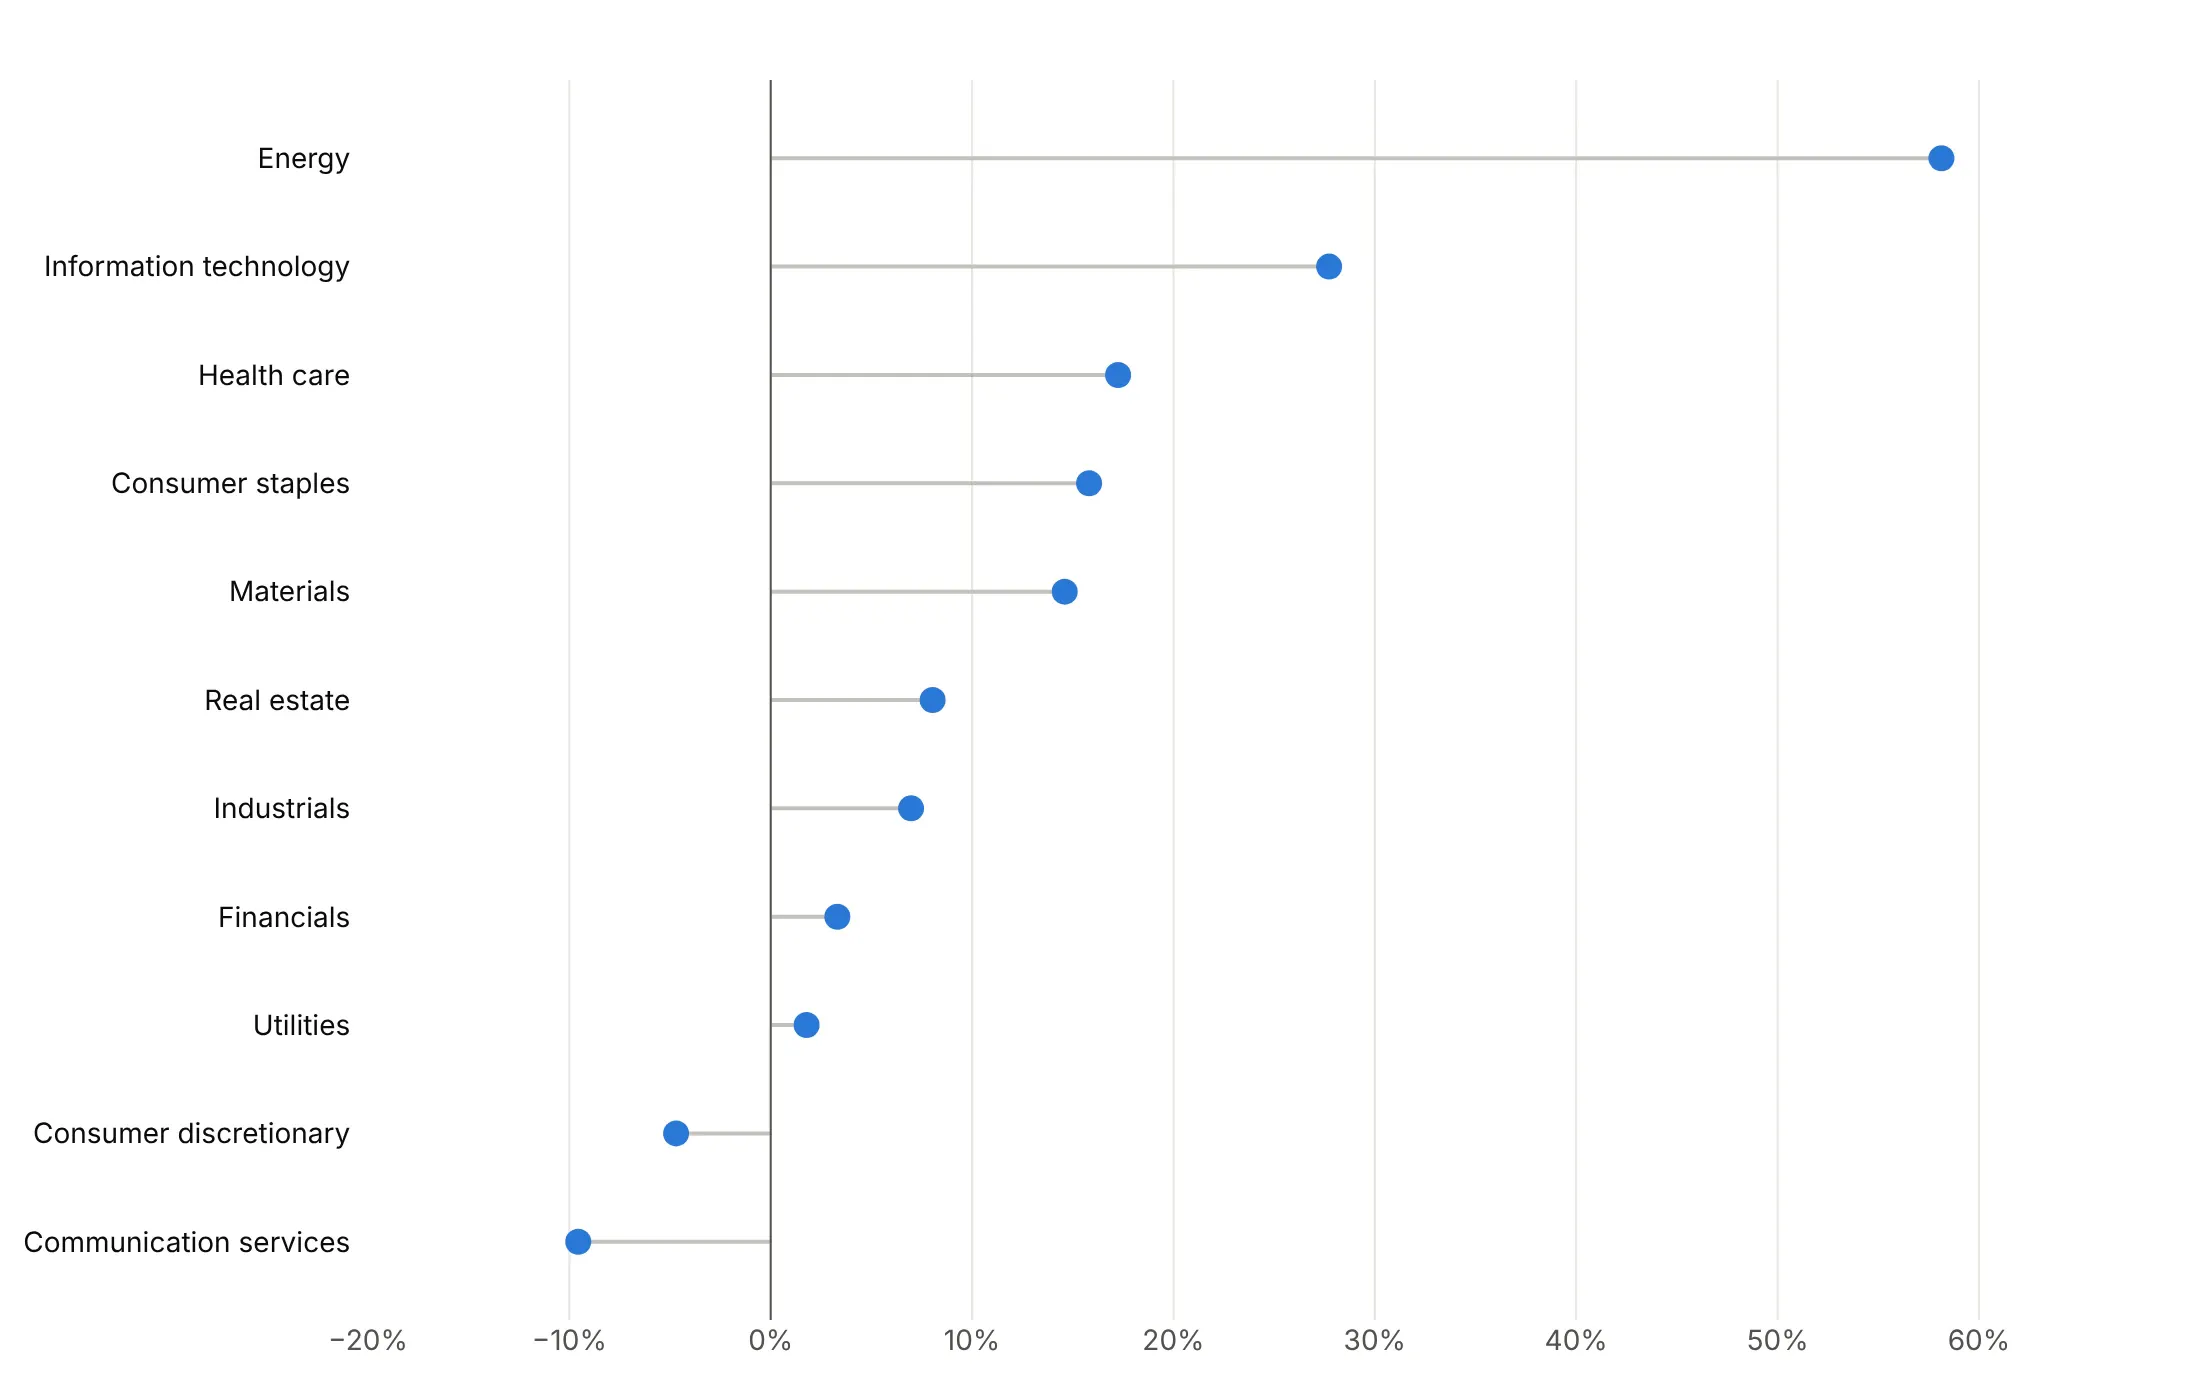
Values at the head. Printing each return on the outer side saves readers from reading the axis.
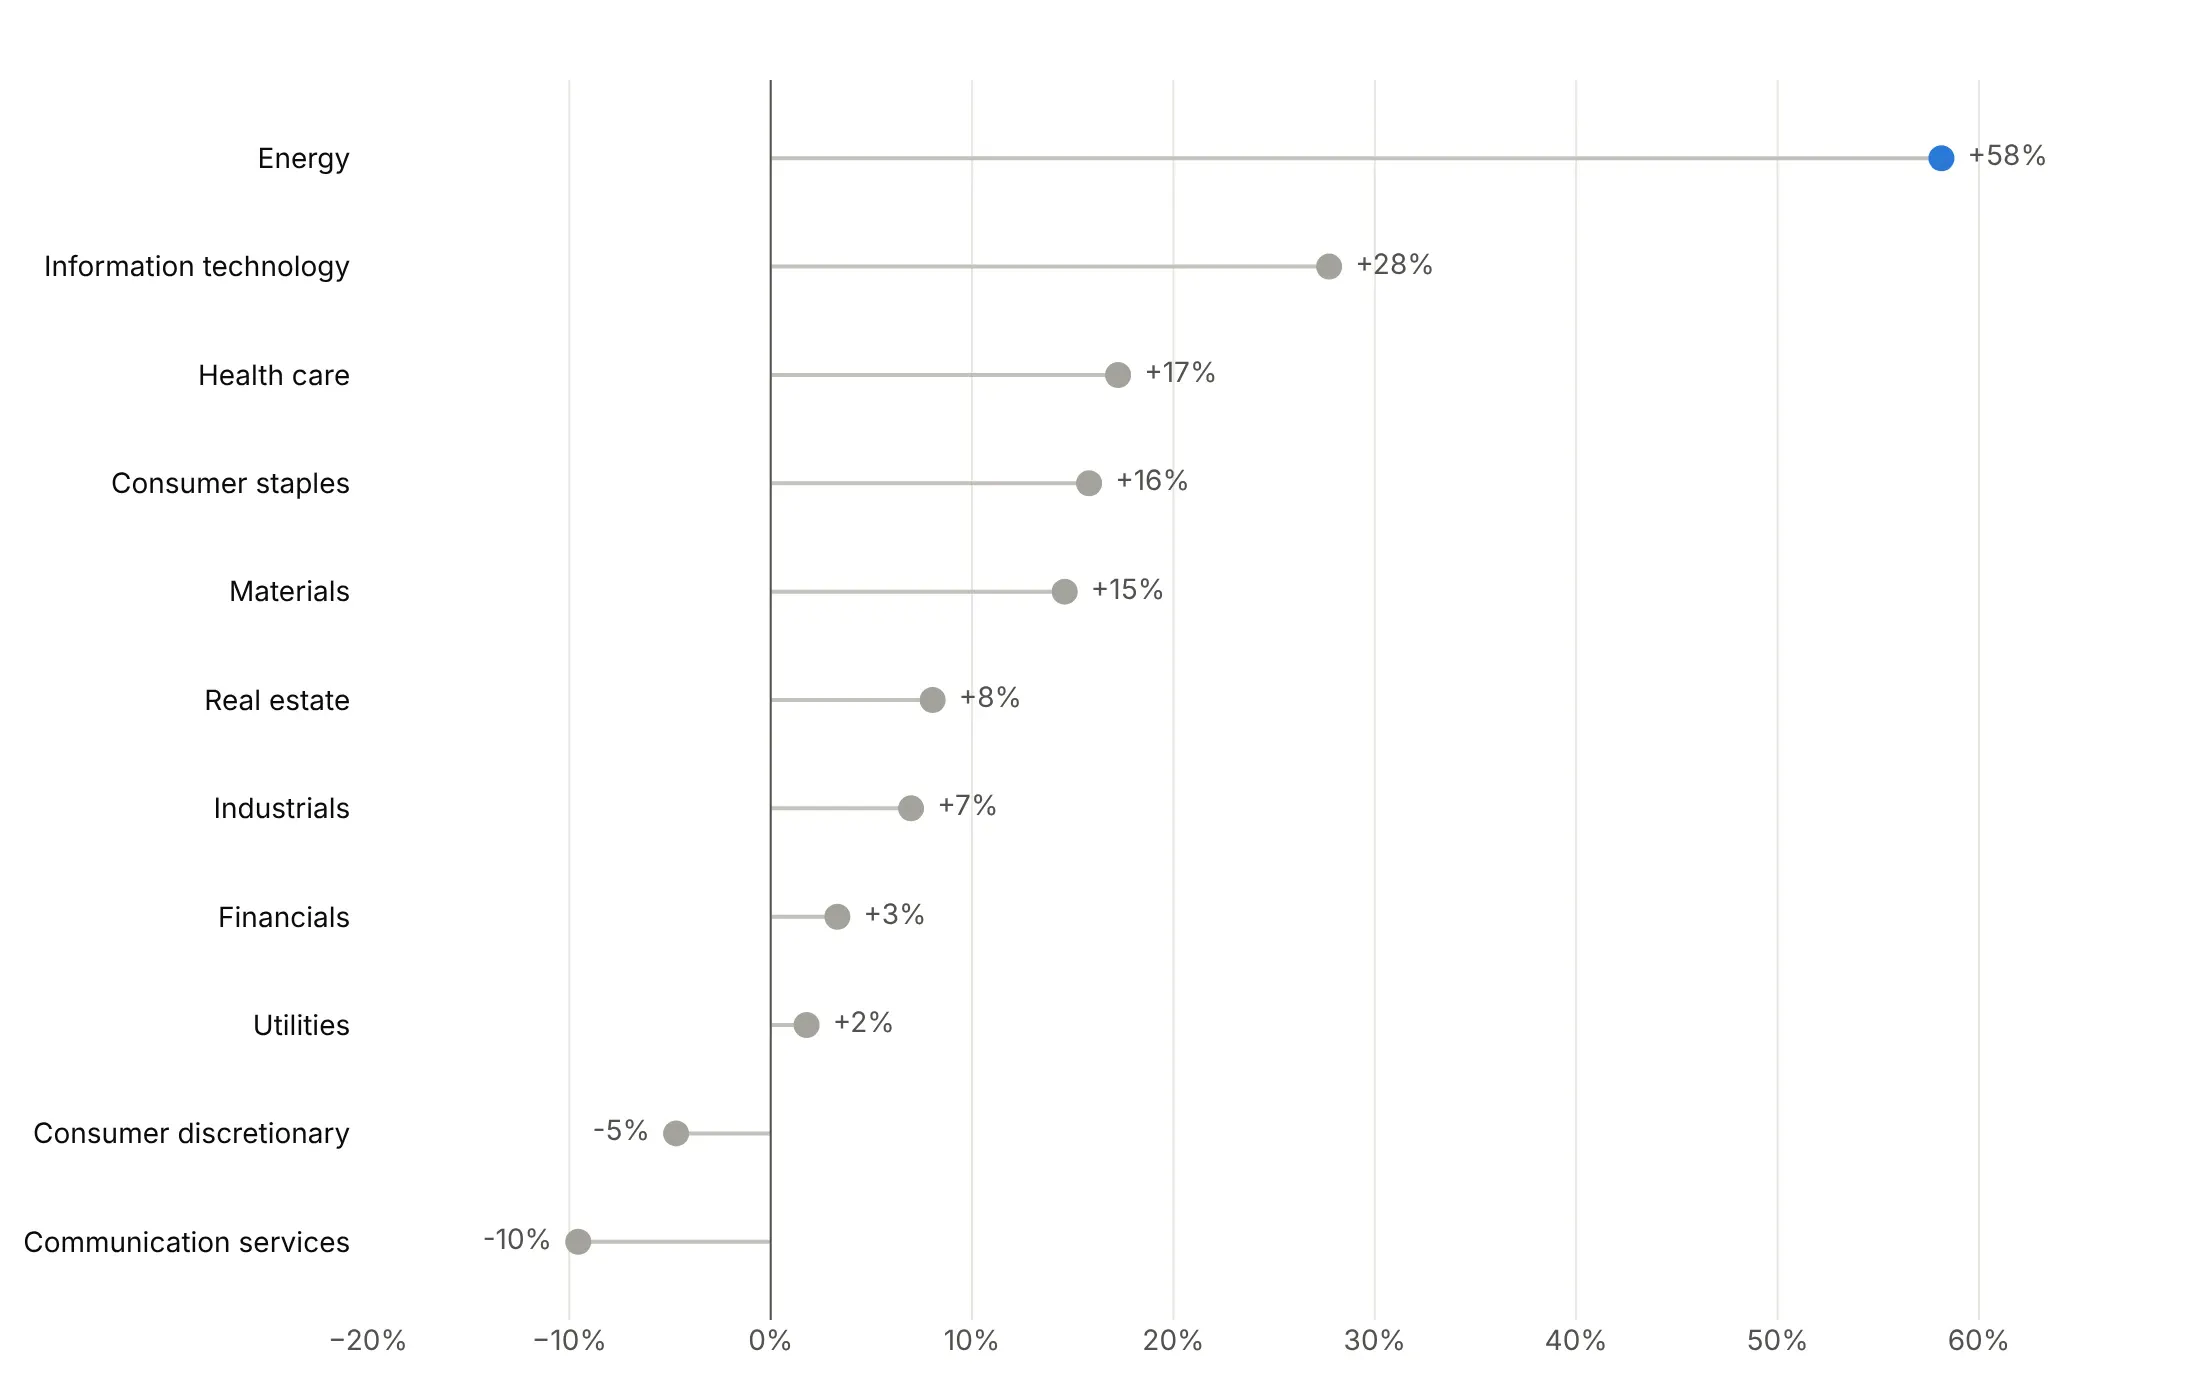
Stems from a benchmark. Starting the stems at the market's 12.3% turns the chart into "beat the market or not": five sectors did, led by Energy at 46 points above.
Highlight one story. Energy is the only color and every other sector is gray.
Checklist
Do
- Write a title that states the takeaway.
- Sort by value, unless the categories have a natural order (months, versions, league positions).
- Start stems at zero, or at a benchmark you name on the chart.
- Keep stems thin and light gray (1 to 3 px) and heads 8 to 14 px.
- Print values on the side the stem points to, or label only the ones that matter.
- Clip the axis for one extreme outlier and mark it with an arrow and its value.
Don't
- Start stems at an arbitrary value or use them on a log axis; use a dot plot instead.
- Draw stems with fig.add_shape() in a loop.
- Give every row its own color or add a legend for rows that are already labeled.
- Use a lollipop for two values per row; use a dumbbell chart.
Options to customize
These are the go.Scatter and layout options that build a lollipop chart. The full list is in the Plotly scatter reference.
- mode="lines" with None in x and y: one trace draws every stem; None breaks the line between rows.
- mode="markers" or "markers+text": the heads, with or without printed values.
- line.color, line.width: keep stems light gray and 1 to 3 px.
- marker.color, marker.size as lists: one color or size per row, for a highlight, a sign or a second variable.
- marker.symbol: "arrow-right" for an outlier drawn off the scale.
- text, texttemplate, textposition: values at the heads; textposition can be a list, left for negative stems and right for positive.
- error_x, error_y with symmetric=False, array, arrayminus, width=0: error bars as stems on a single marker trace (one stem color).
- yaxis.categoryorder="array", categoryarray: fix the row order, sorted or natural.
- fig.add_vline, fig.add_hline: the benchmark or zero line.
- xaxis.range: clip the axis so one outlier doesn't flatten the rest.
- make_subplots(rows, cols, shared_xaxes=True): panels for groups or more than about 50 rows.
- hovertemplate, customdata: counts or extra columns on hover.
More lollipop chart examples
Eight more lollipop charts built from real public data, each with its source, the technique that makes it work and a prompt to rebuild it.
1. Adverse event reports for four GLP-1 drugs
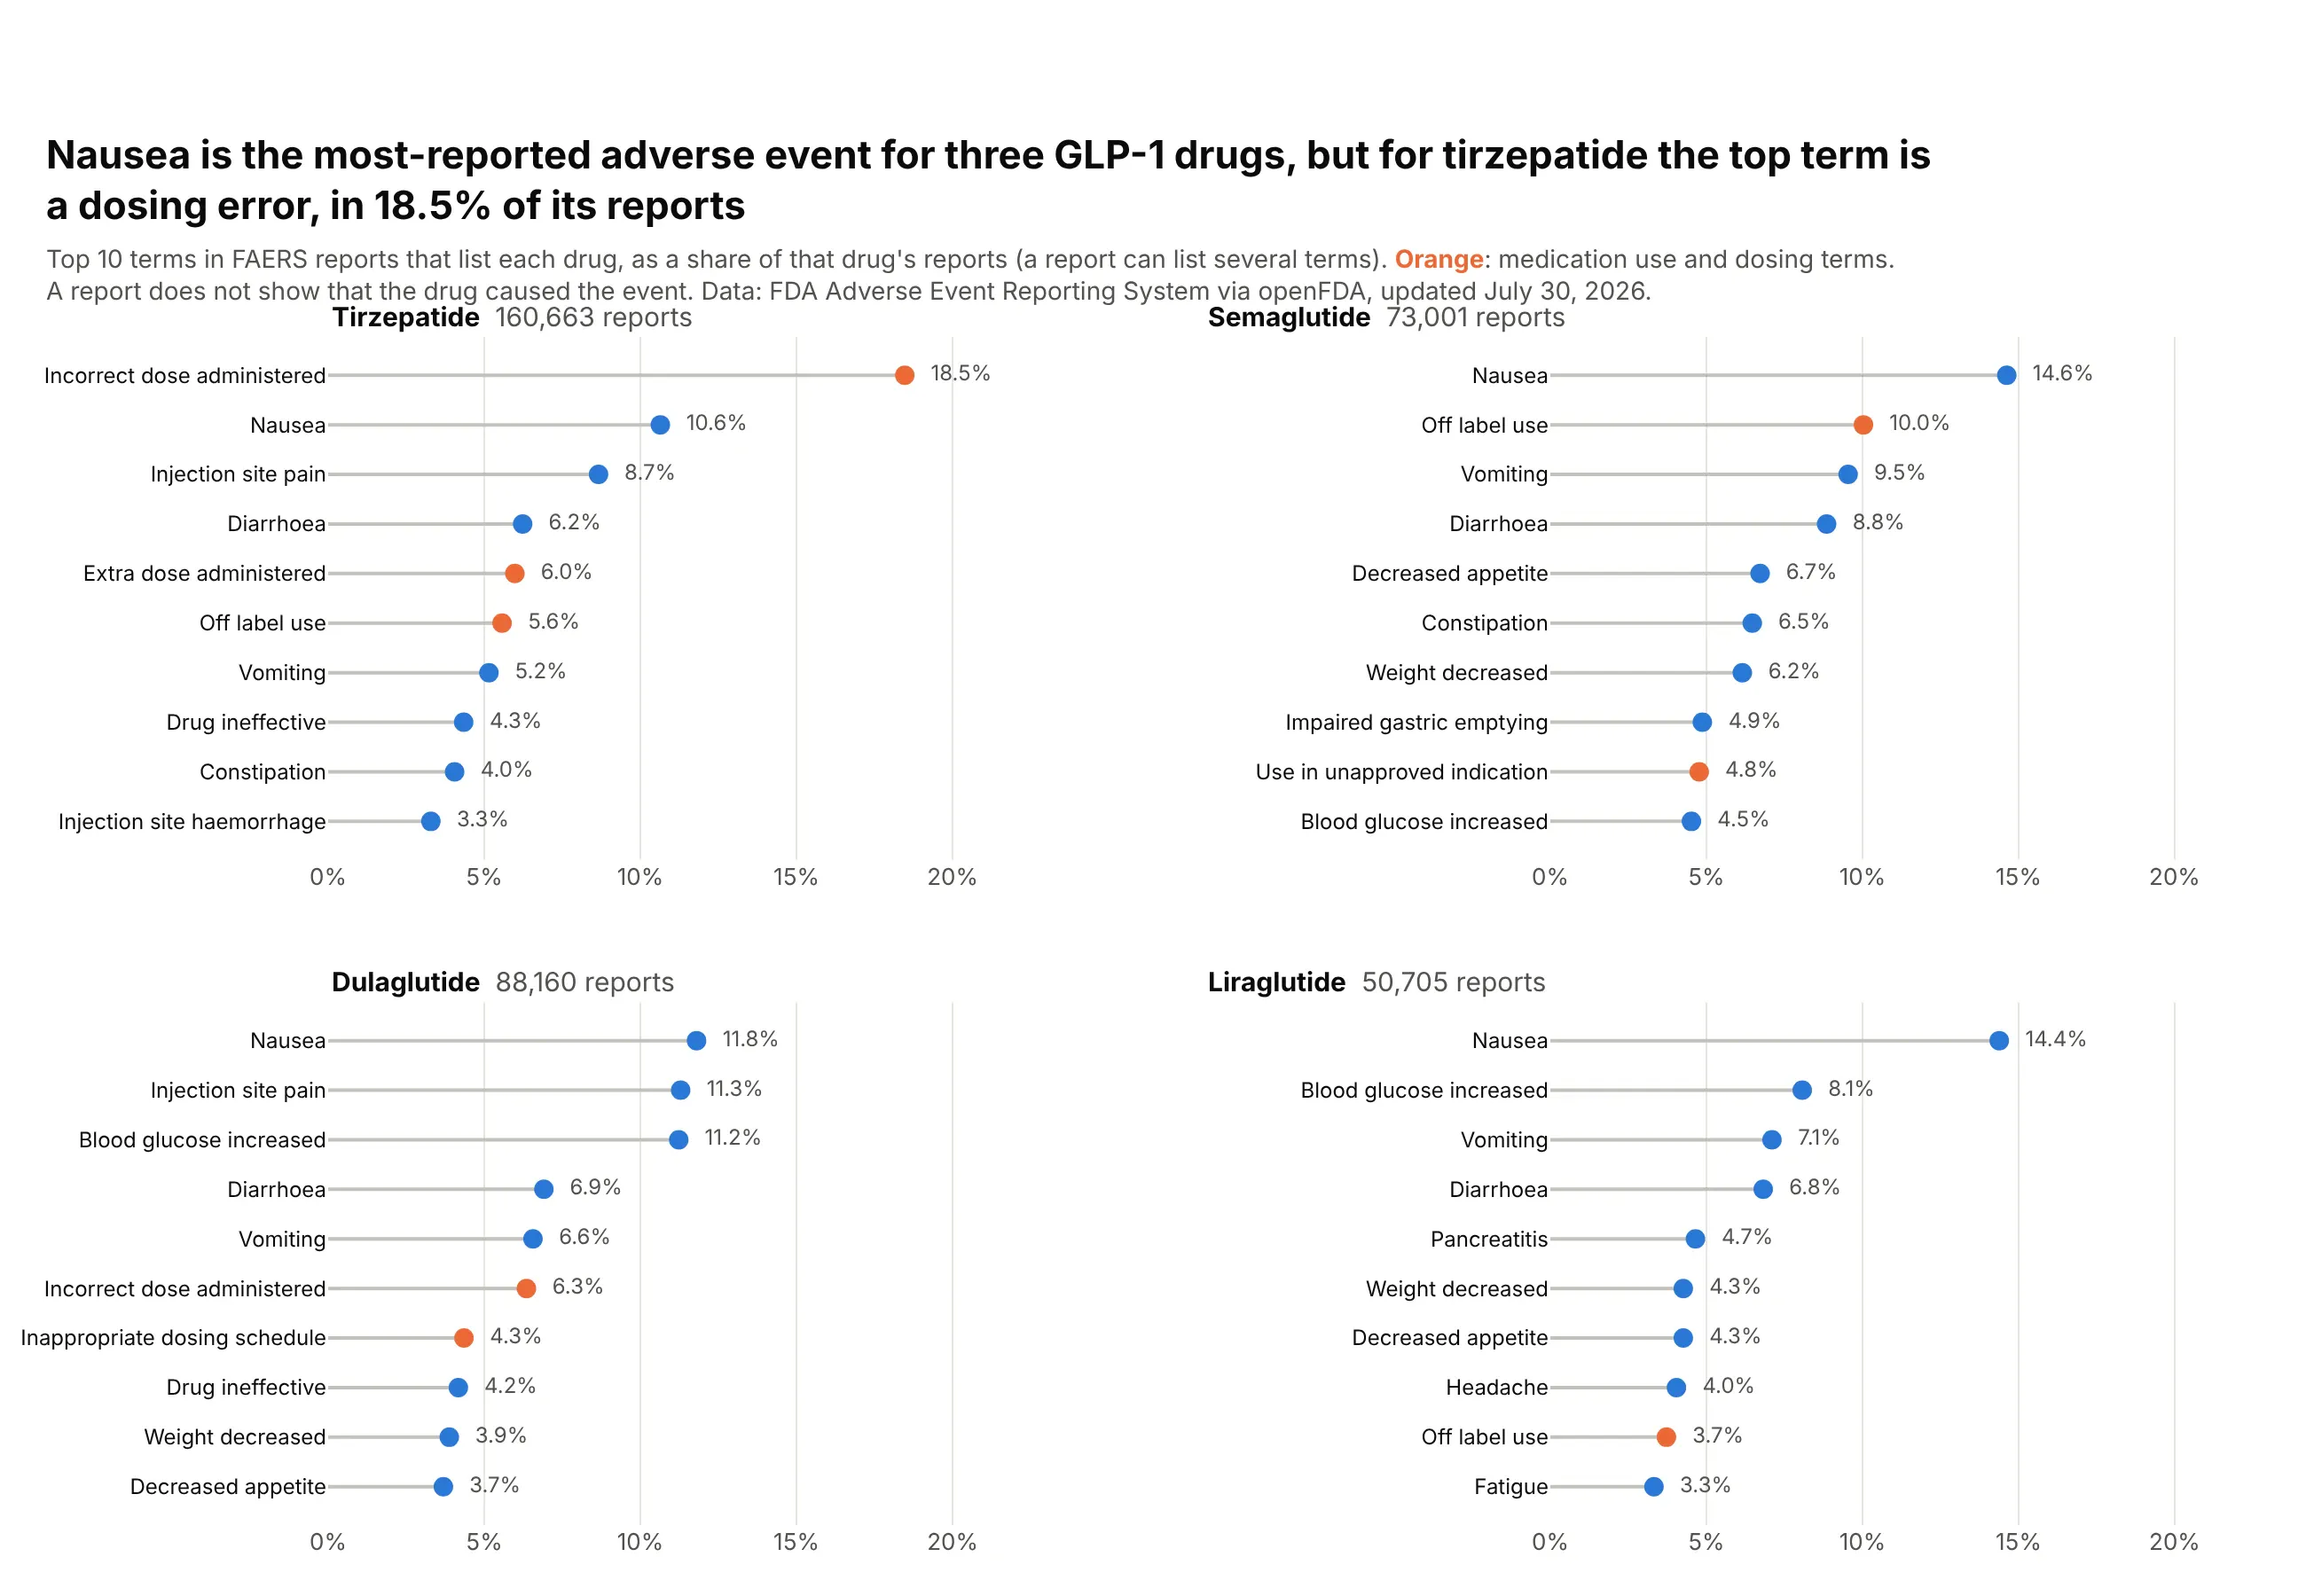
Nausea is the most-reported adverse event term for semaglutide, liraglutide and dulaglutide. For tirzepatide, the top term is "incorrect dose administered", in 18.5% of its 160,663 FAERS reports. Reports show what was reported, not what the drug caused. Data: FDA Adverse Event Reporting System via openFDA.
Tip: small multiples with a shared x axis compare shares across drugs, while each panel keeps its own sort.
Get the data from the openFDA drug adverse event API (FDA Adverse Event Reporting System):for semaglutide, tirzepatide, liraglutide and dulaglutide, the number of reports listing the drug(patient.drug.openfda.generic_name) and the top 10 counts of patient.reaction.reactionmeddrapt.exactand shape it into a table (columns: drug, reports, term, count, pct_of_reports, rank).Build a 2x2 plotly lollipop chart, one panel per drug, sorted within each panel.- Stems as one go.Scatter with None gaps per panel; shared x axis in % of reports.- Orange heads for dosing and off-label terms, blue for the rest; print the share at each head.- Panel titles with the drug name and its number of reports.
2. Adult obesity by state
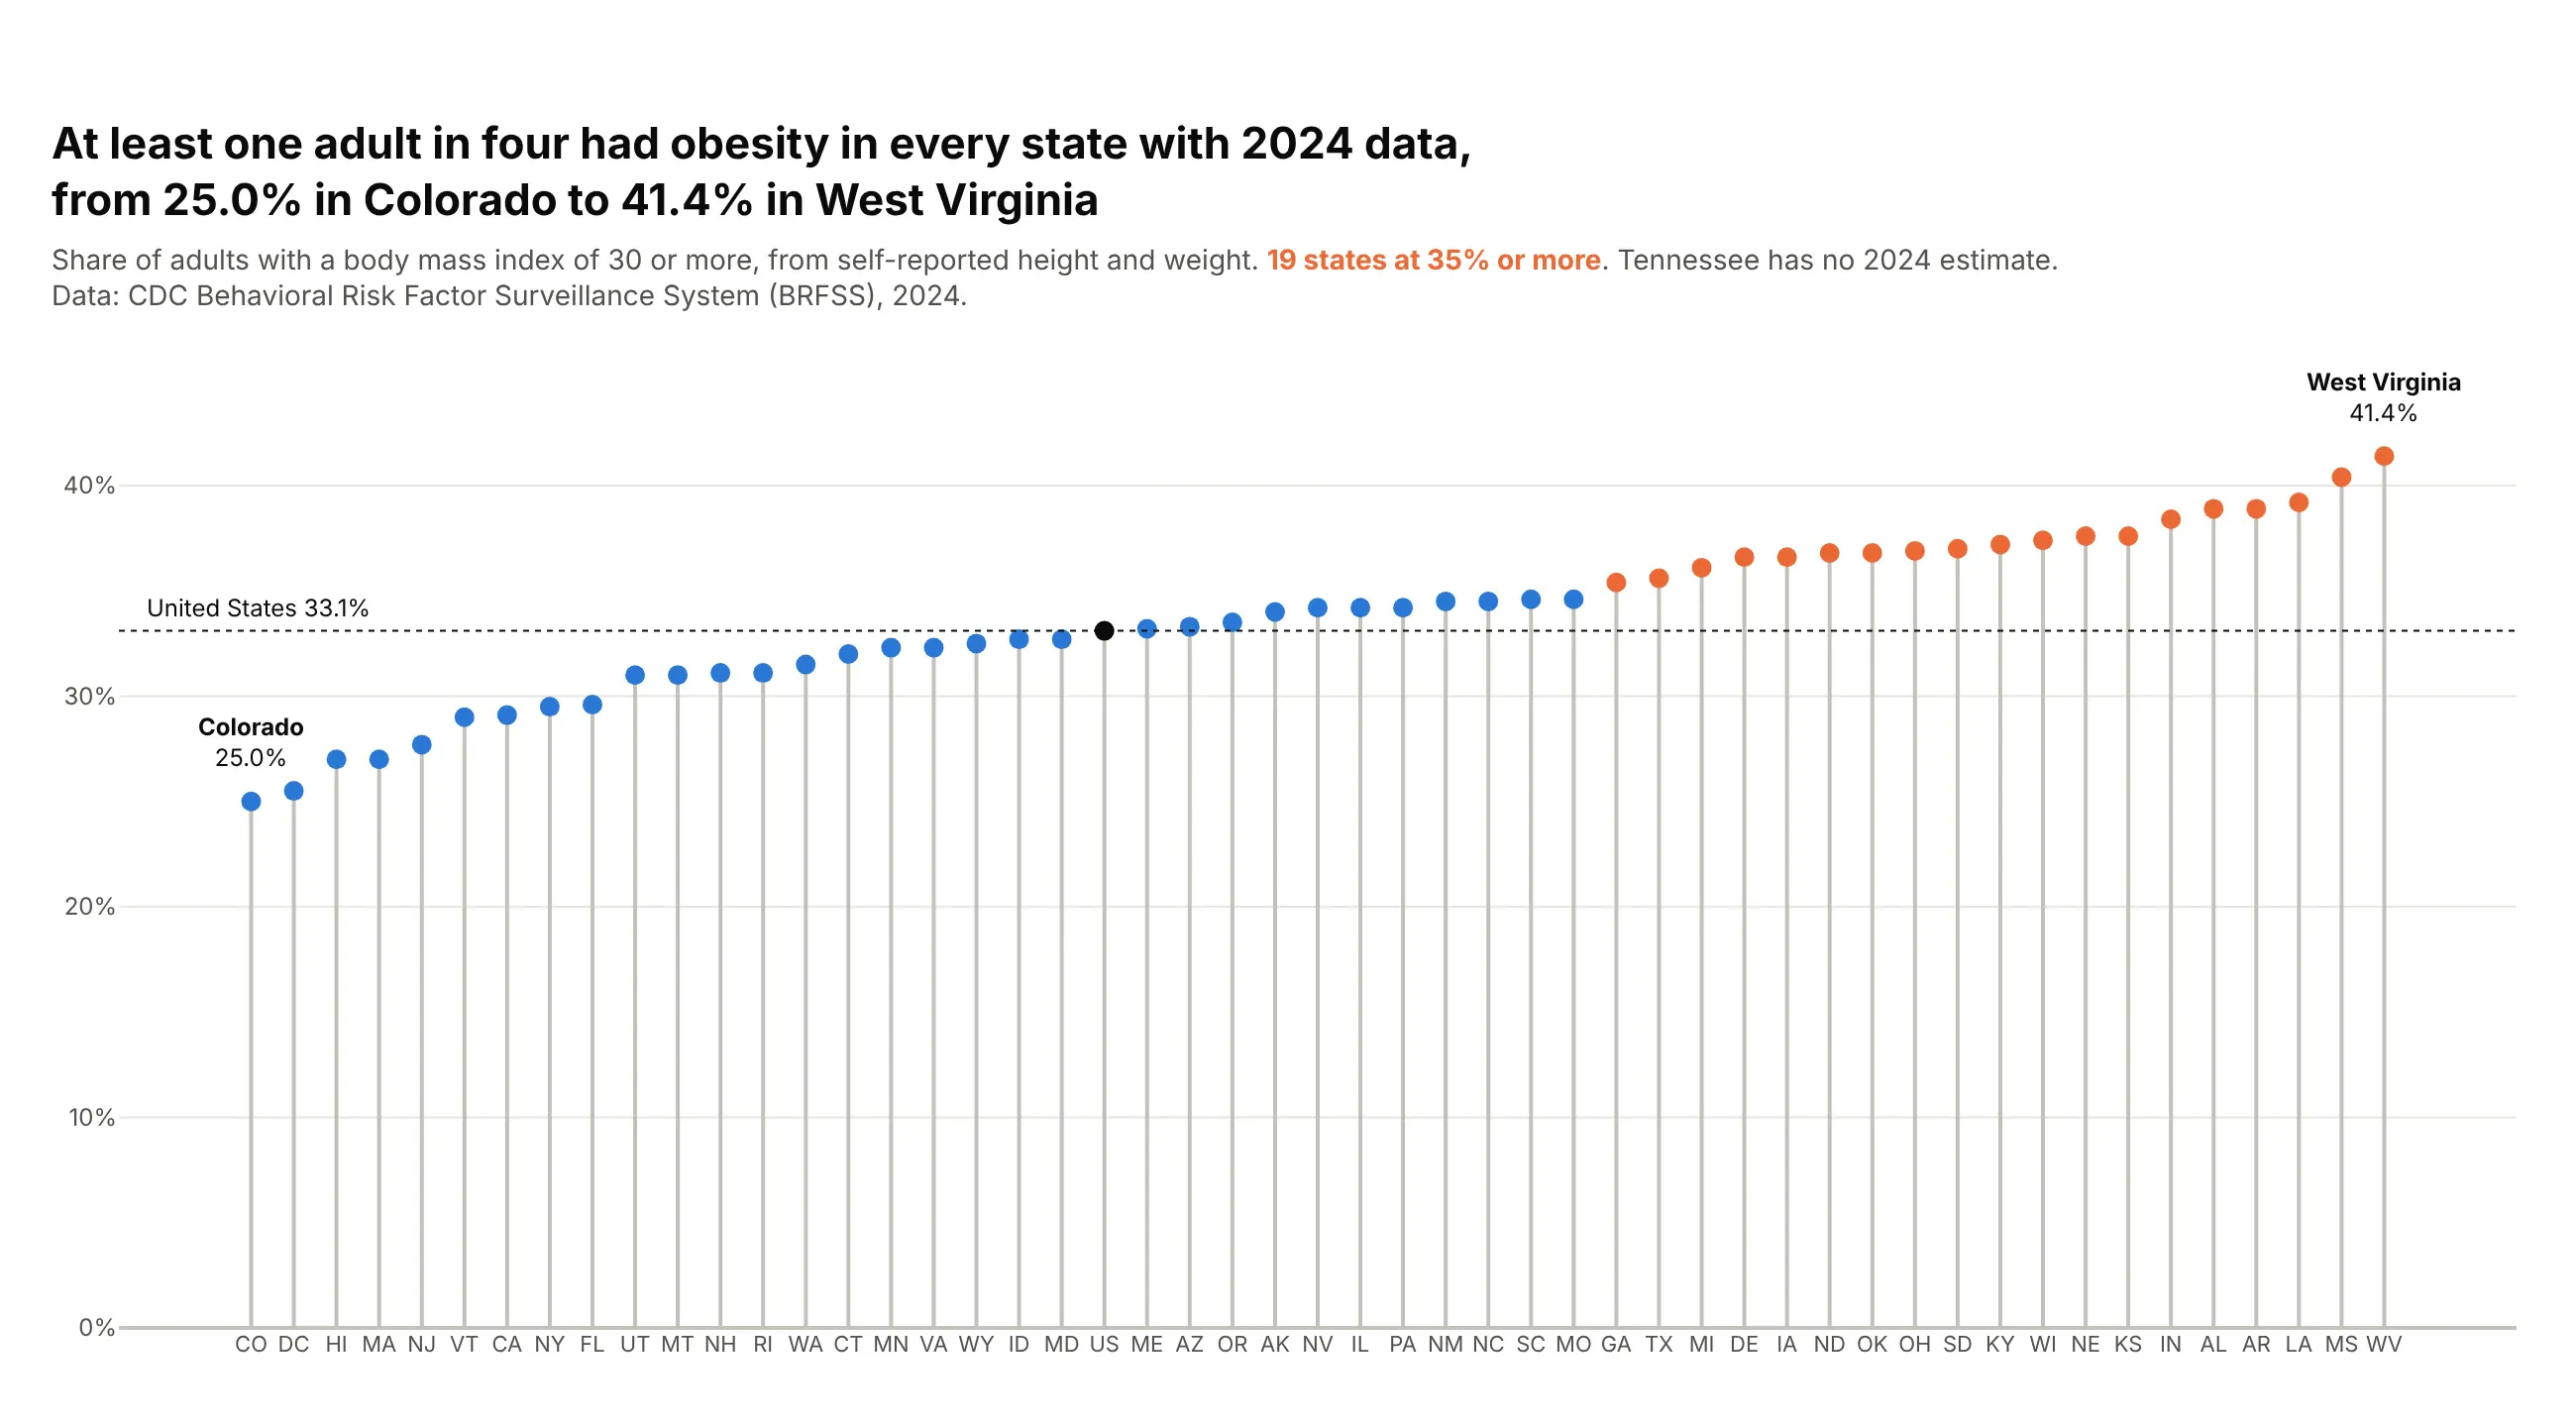
At least one adult in four had obesity in every state with 2024 data, from 25.0% in Colorado to 41.4% in West Virginia. Nineteen states were at 35% or more, and the national figure was 33.1%. Data: CDC Behavioral Risk Factor Surveillance System (BRFSS).
Tip: with 50 values between 24% and 42%, thin vertical stems with state codes avoid the striped block that 50 bars make.
Get the data from CDC's "Nutrition, Physical Activity, and Obesity - Behavioral Risk FactorSurveillance System" dataset on data.cdc.gov (hn4x-zwk7), question Q036, overall stratum, 2024and shape it into a table (columns: state, code, pct, low, high), states, DC and the national row.Build a vertical plotly lollipop chart: state codes on x, sorted by pct, stems from 0.- Orange heads at 35% or more, blue below, the national value in black with a dotted line.- Label the lowest and highest states above their heads.
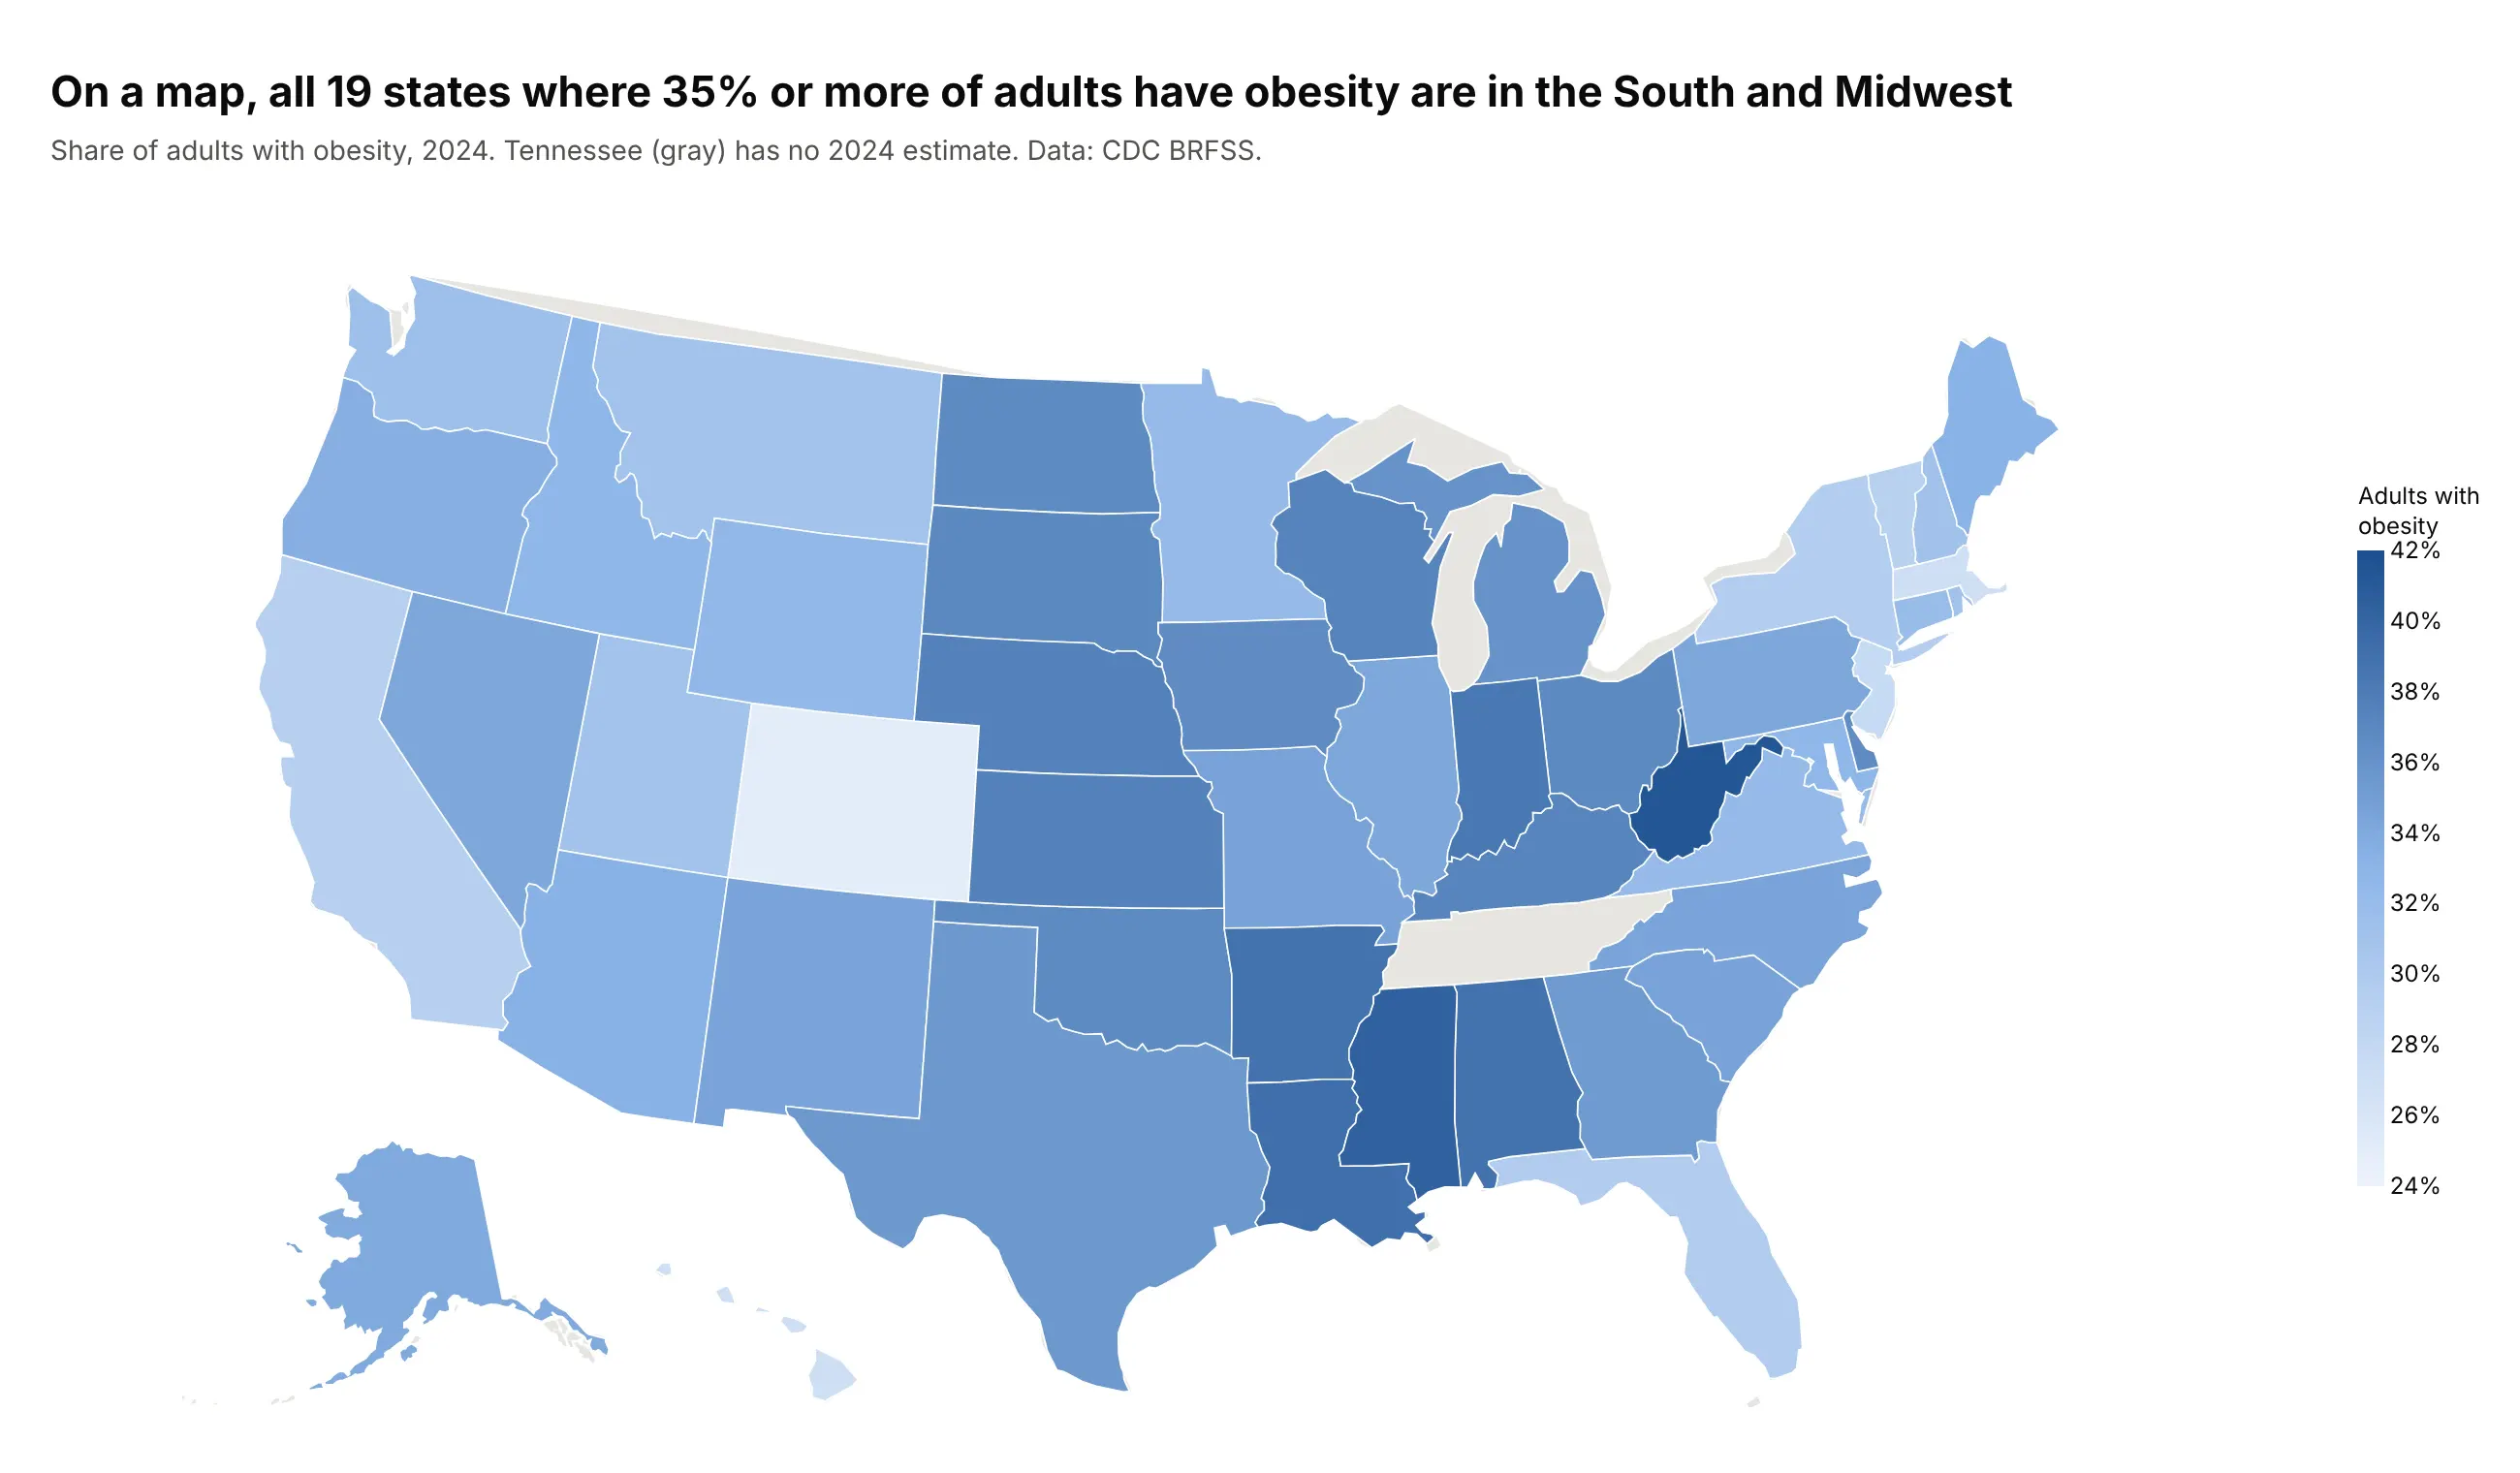
Another way to see it: a choropleth map shows that all 19 states at 35% or more are in the South and Midwest, but it hides how close most states are to each other.
3. The 2026 returns of the S&P 500 sectors
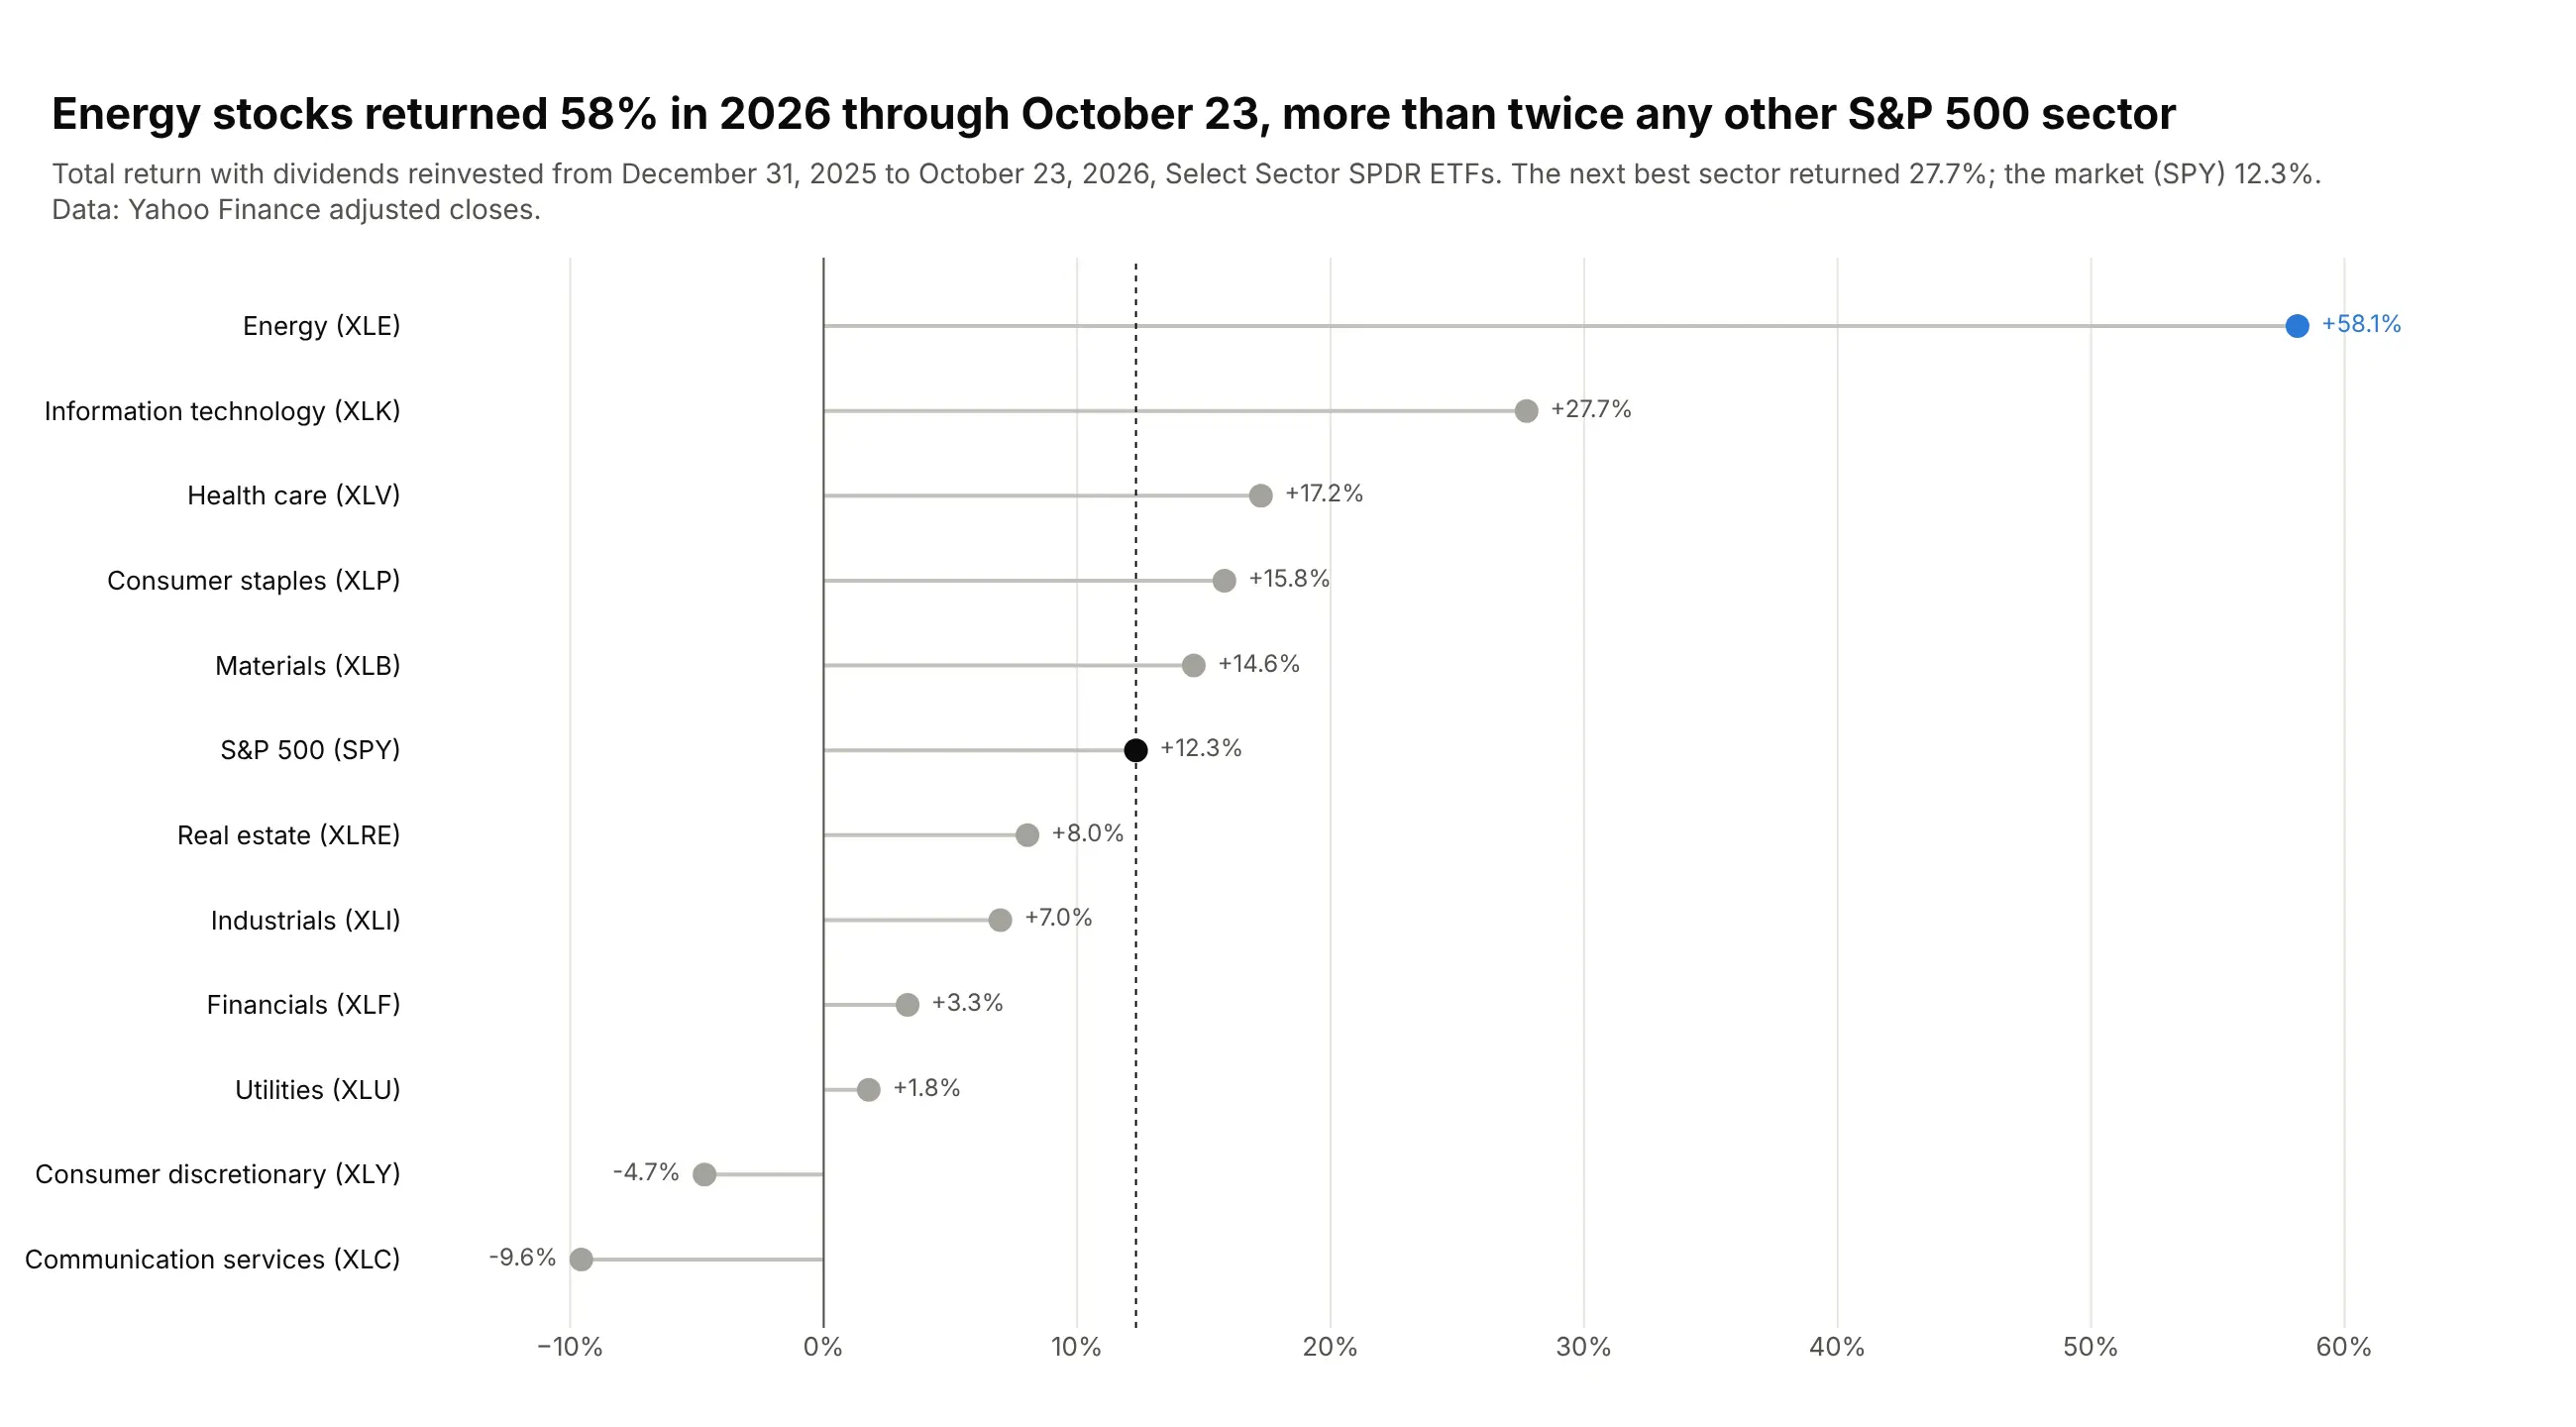
Energy stocks returned 58% in 2026 through October 23, more than twice the next best sector, information technology (27.7%). The market as a whole (SPY) returned 12.3%, and communication services lost 9.6%. Data: Yahoo Finance adjusted closes of the Select Sector SPDR ETFs.
Tip: when the chart is about one row, gray out the rest and give the reference row its own color.
Get the data from Yahoo Finance's chart API: daily adjusted closes for XLE, XLB, XLI, XLY, XLP,XLV, XLF, XLK, XLC, XLU, XLRE and SPYand shape it into a table (columns: sector, ticker, start_date, end_date, return_pct)with the total return from 2025-12-31 to the latest close.Build a horizontal plotly lollipop chart sorted by return, stems from 0.- Energy in blue, SPY in black with a dotted line at its value, everything else gray.- Print "+58.1%" on the outer side of each head.
4. The carbon intensity of electricity
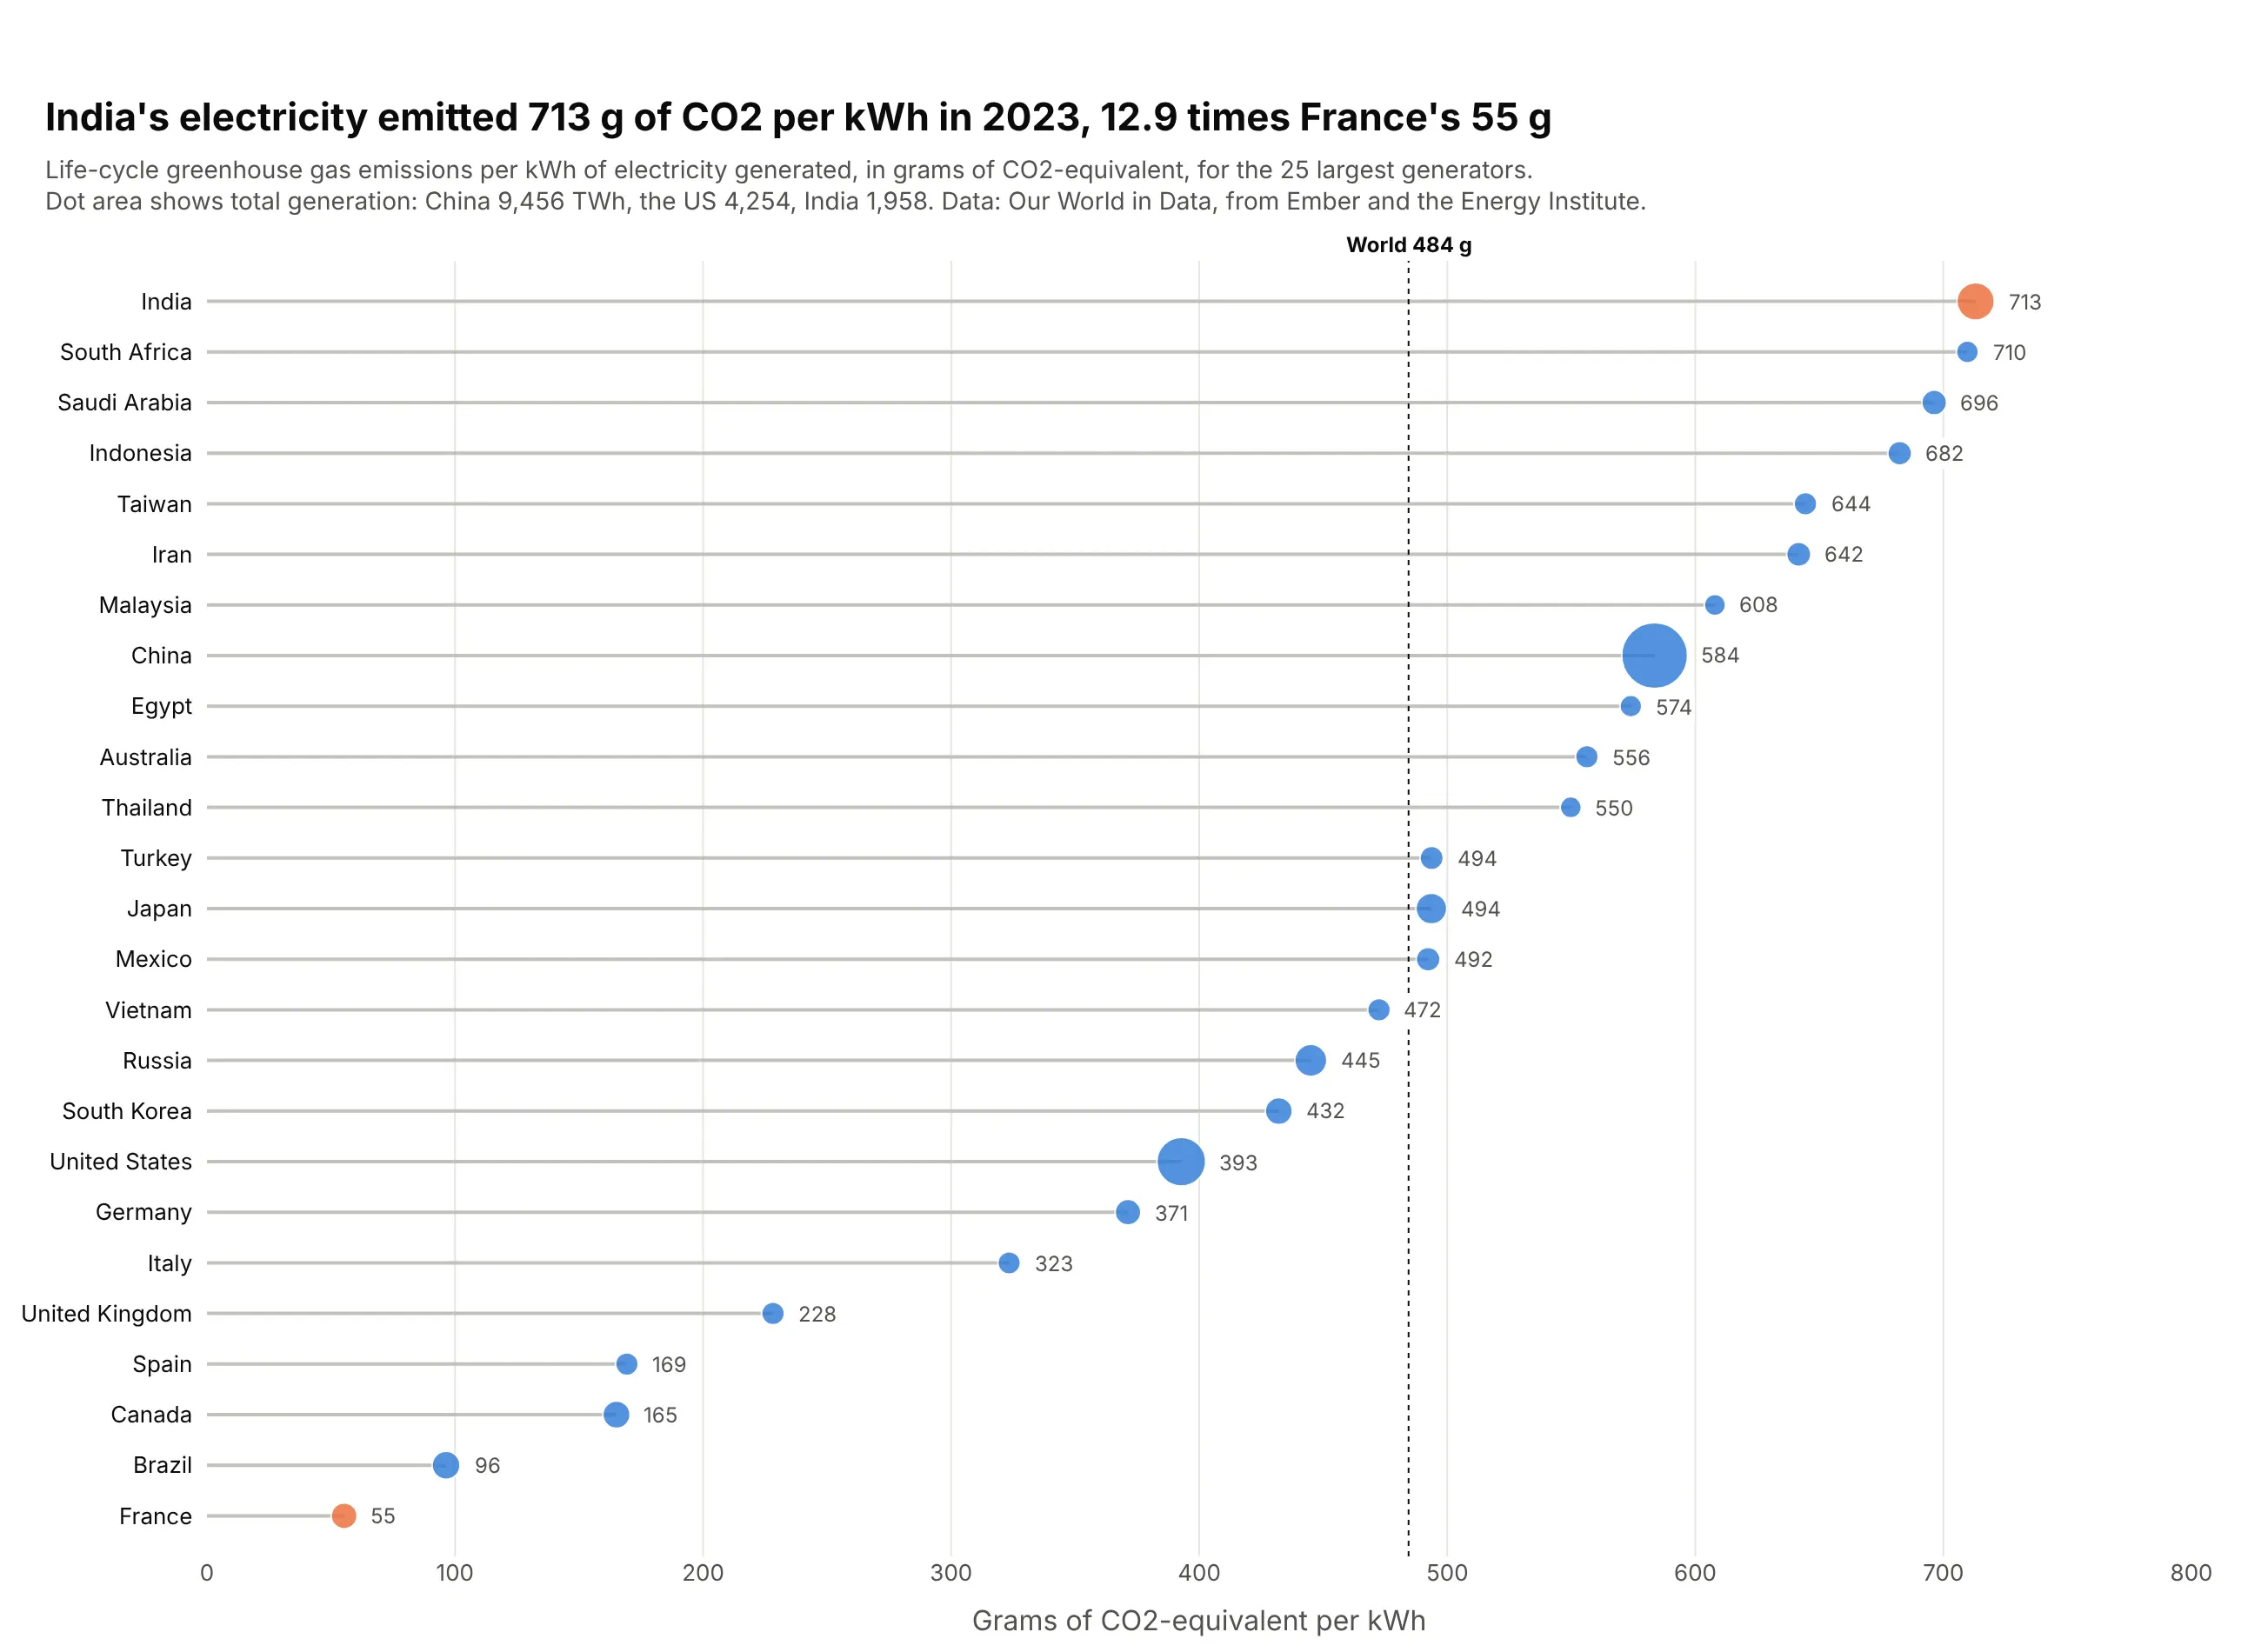
Each kWh of India's electricity came with 713 g of CO2-equivalent in 2023, 12.9 times France's 55 g. China, which generates the most electricity by far (9,456 TWh), was at 584 g, above the world's 484 g. Data: Our World in Data, from Ember and the Energy Institute.
Tip: size the heads by a second variable (generation) with area proportional to the value, and keep the stems the same for every row.
Get the data from Our World in Data's energy dataset (owid-energy-data.csv), carbon_intensity_elecand electricity_generation, 2023, countries onlyand shape it into a table (columns: country, iso_code, generation_twh, intensity_g_kwh, year).Keep the 25 largest generators.Build a horizontal plotly lollipop chart sorted by intensity.- Head area proportional to generation (size = a + b * sqrt(twh / max)); India and France in orange.- Print the value beyond each head; dotted line at the world value, 484 g/kWh.
5. How US electricity generation changed since 2016
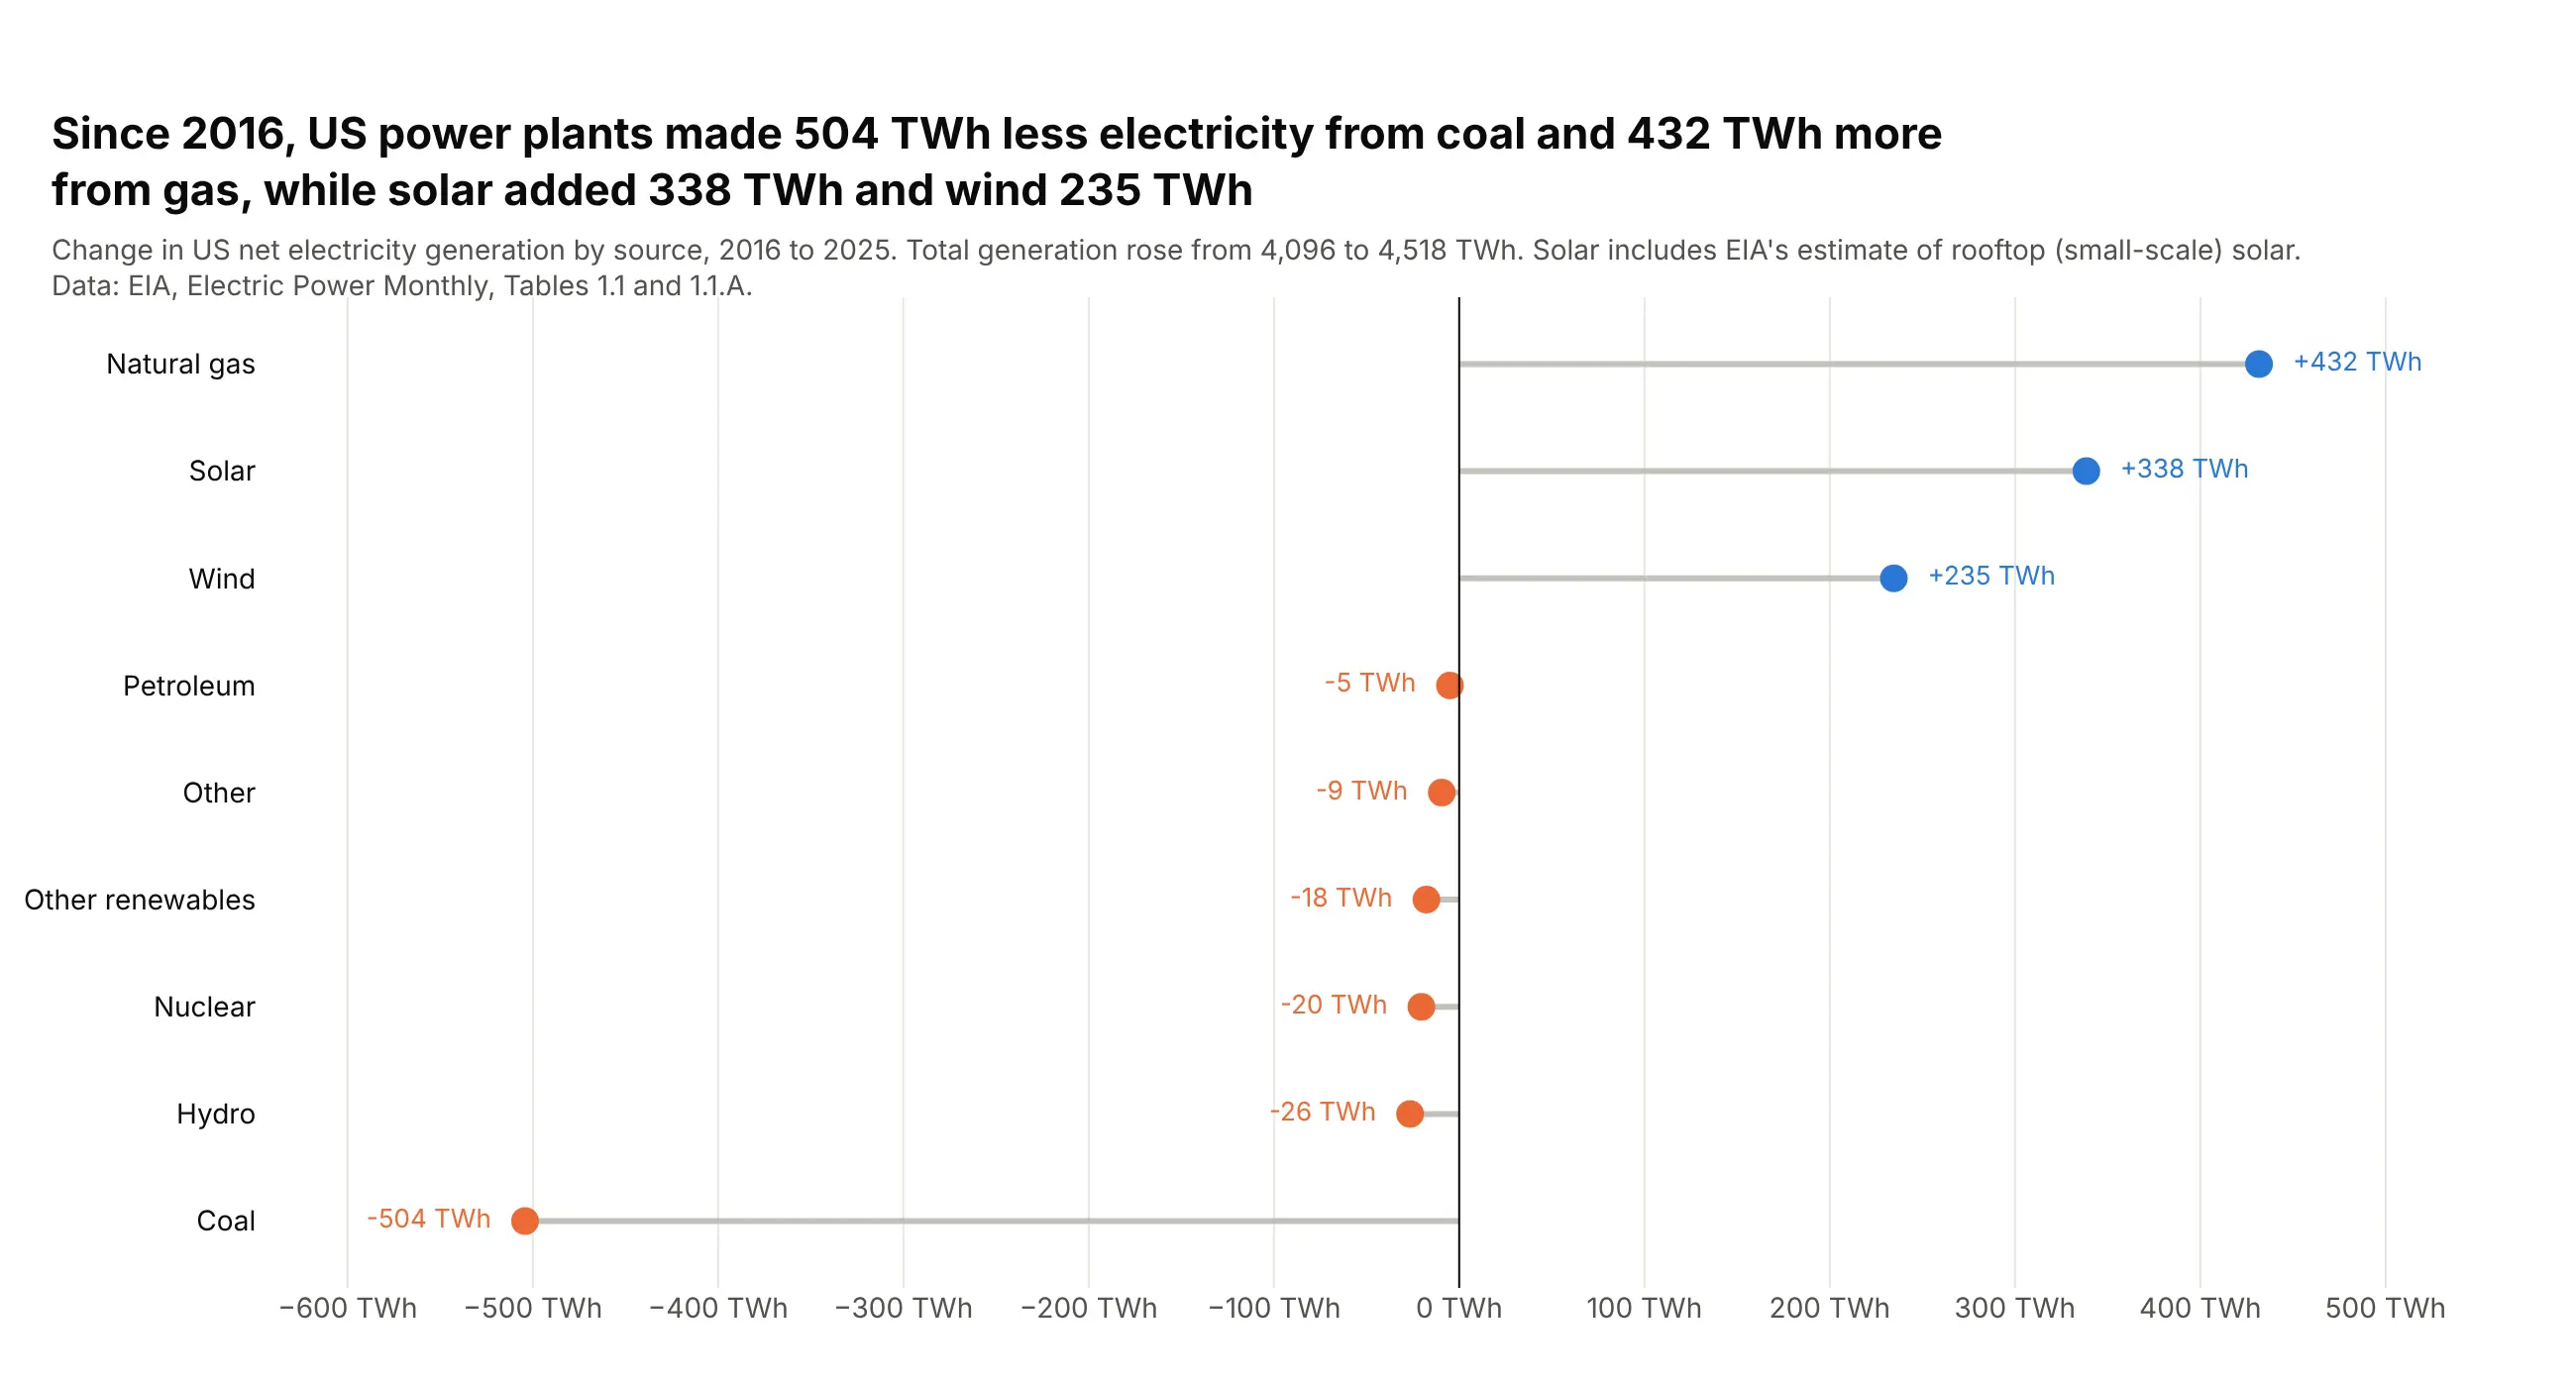
US power plants made 504 TWh less electricity from coal in 2025 than in 2016, and 432 TWh more from natural gas. Solar added 338 TWh and wind 235, while total generation rose from 4,096 to 4,518 TWh. Data: EIA, Electric Power Monthly, Tables 1.1 and 1.1.A.
Tip: for a diverging lollipop, put each label on the side the stem points to and color by sign.
Get the data from EIA's Electric Power Monthly, Table 1.1 (net generation by energy source) andTable 1.1.A (renewable sources), annual totals for 2016 and 2025, thousand MWh converted to TWhand shape it into a table (columns: source, twh_2016, twh_2025, change_twh) with coal, natural gas,nuclear, hydro, wind, solar (including small-scale), petroleum, other renewables and other.Build a horizontal plotly lollipop chart of change_twh sorted by change, stems from 0.- Blue heads for gains, orange for losses; print "+432 TWh" on the outer side.
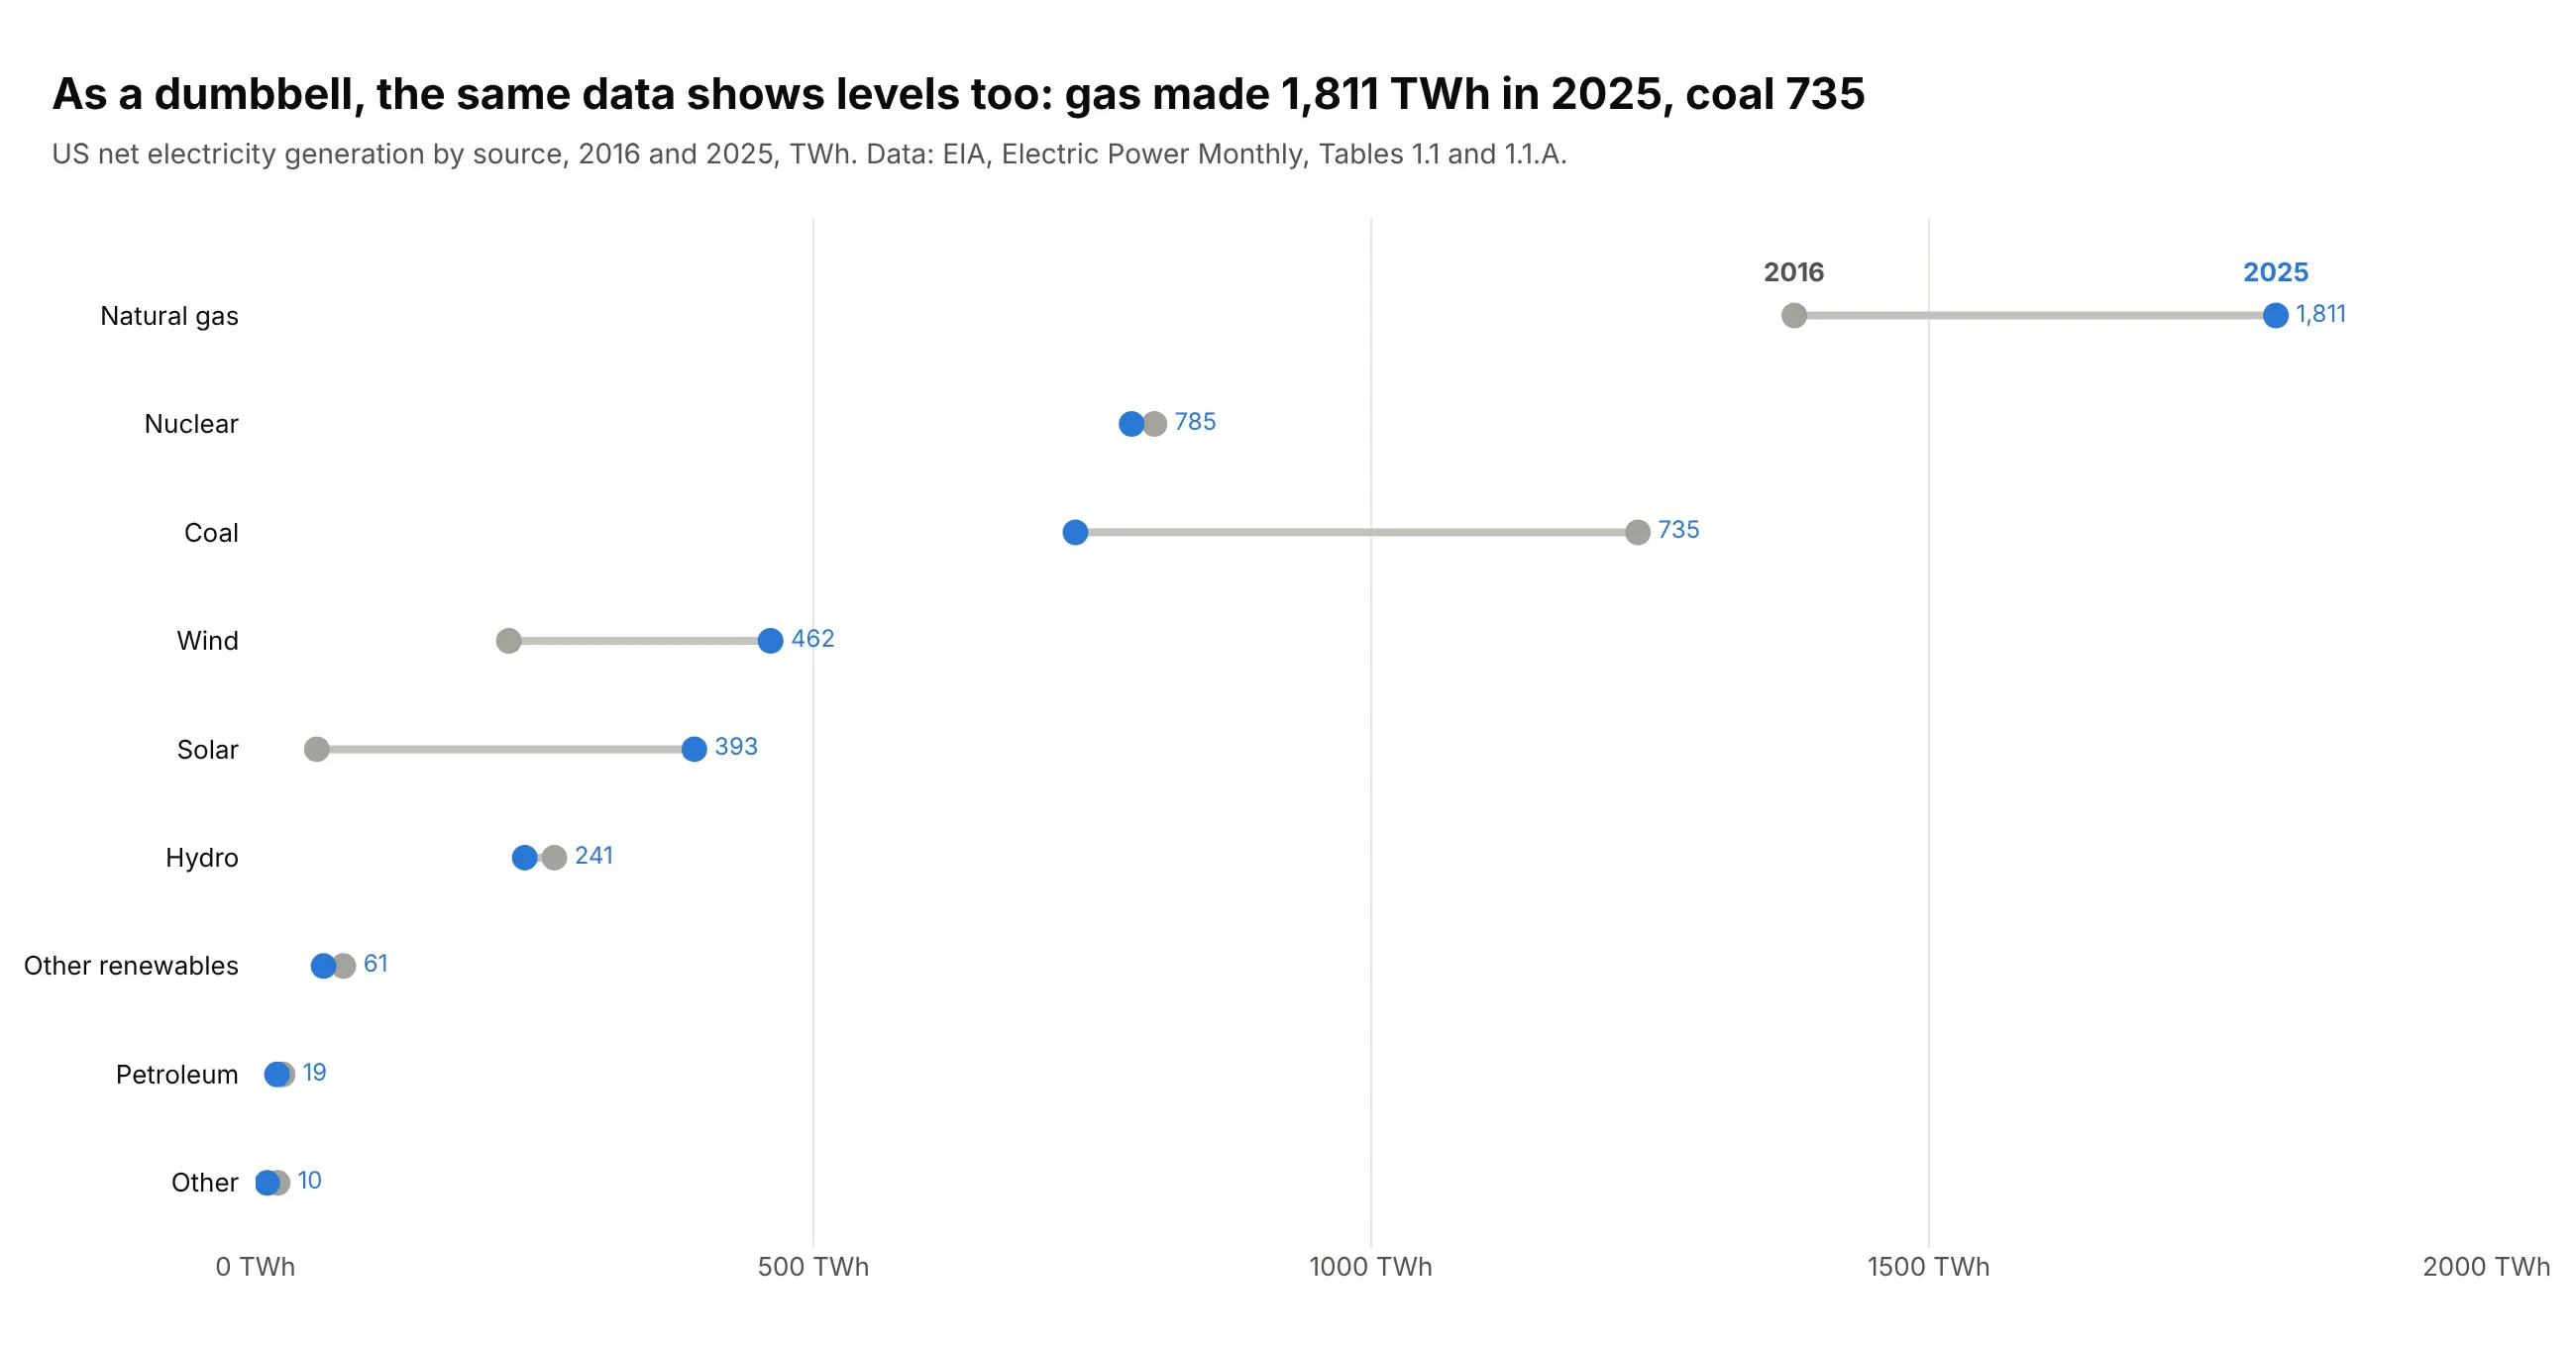
Another way to see it: a dumbbell chart of the two years shows the levels too, with gas at 1,811 TWh and coal at 735 TWh in 2025, but small changes such as nuclear's collapse into one dot.
6. How hard each kind of power plant runs
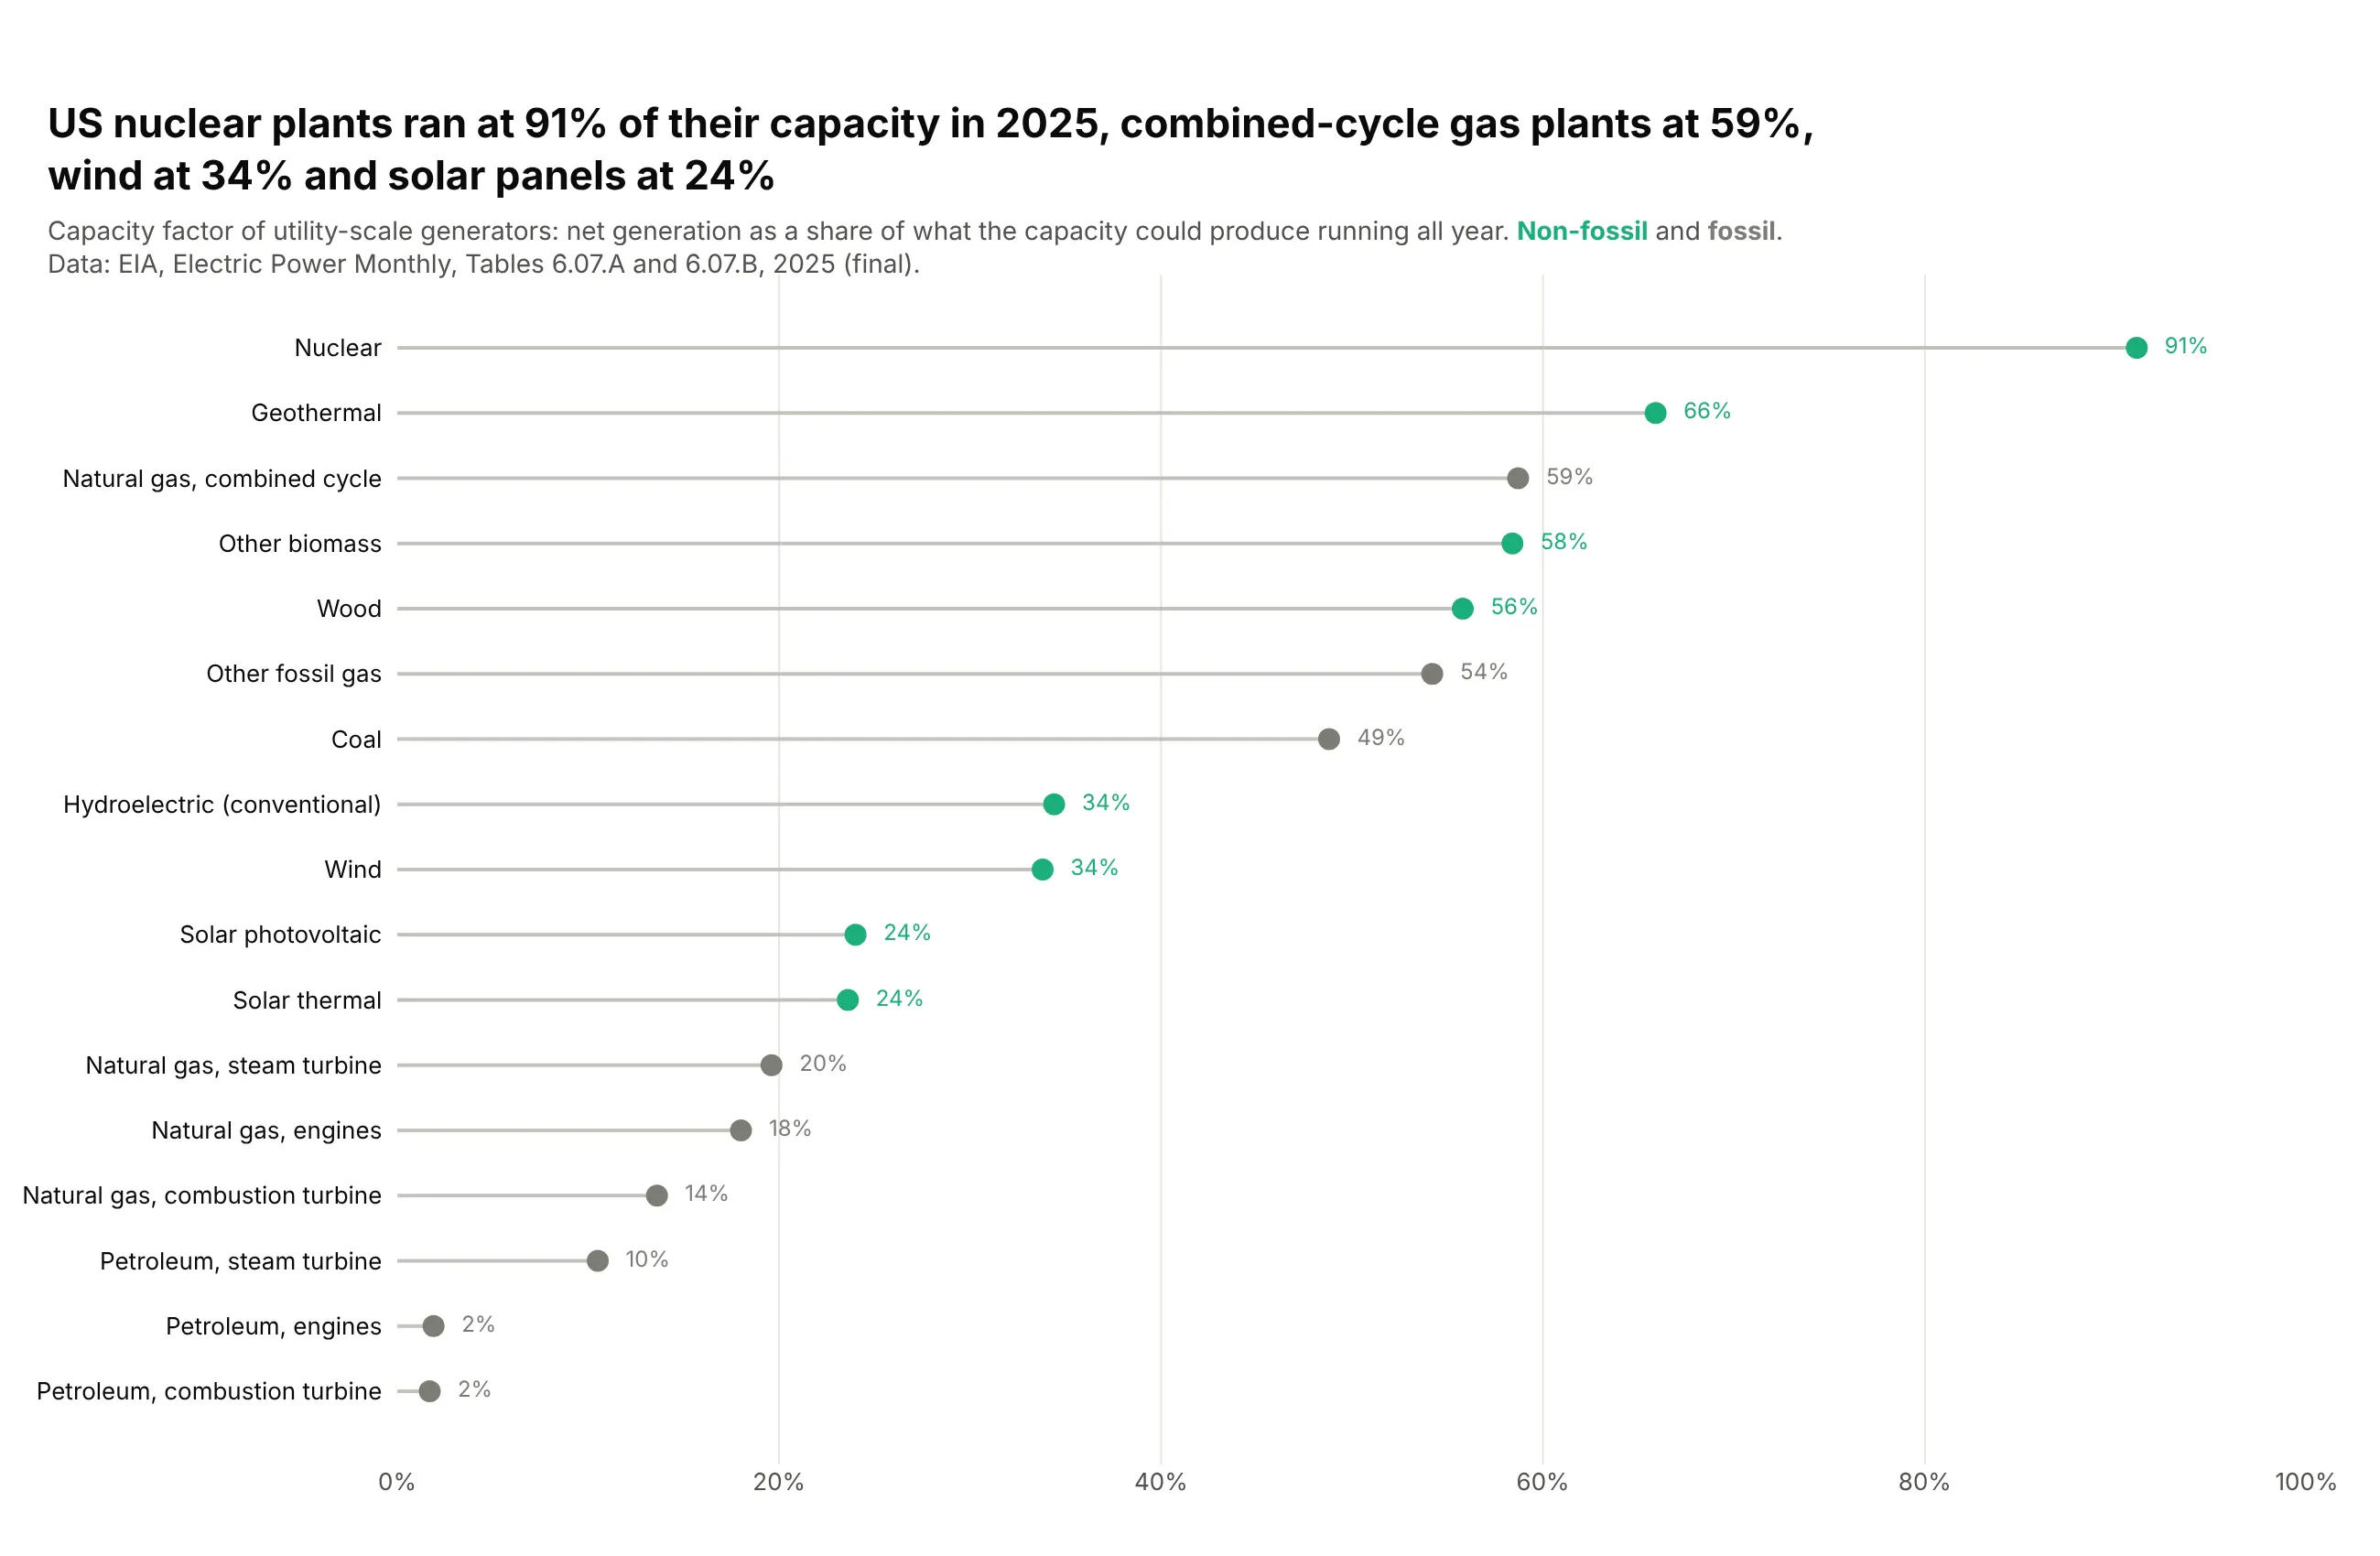
US nuclear plants produced 91% of what their capacity could make running all year in 2025, combined-cycle gas plants 59%, wind 34% and solar panels 24%. Gas and oil peaking turbines ran at 2% to 14%. Data: EIA, Electric Power Monthly, Tables 6.07.A and 6.07.B.
Tip: for a bounded rate, fix the axis at 0 to 100% so every stem is read against the same ceiling.
Get the data from EIA's Electric Power Monthly, Tables 6.07.A and 6.07.B (capacity factors ofutility-scale generators), the 2025 annual rowand shape it into a table (columns: technology, fuel_group, capacity_mw, capacity_factor_pct).Build a horizontal plotly lollipop chart sorted by capacity factor, x axis fixed at 0-100%.- Green heads for non-fossil, gray for fossil; print the percentage in the head's color.
7. Population change by state, grouped by region
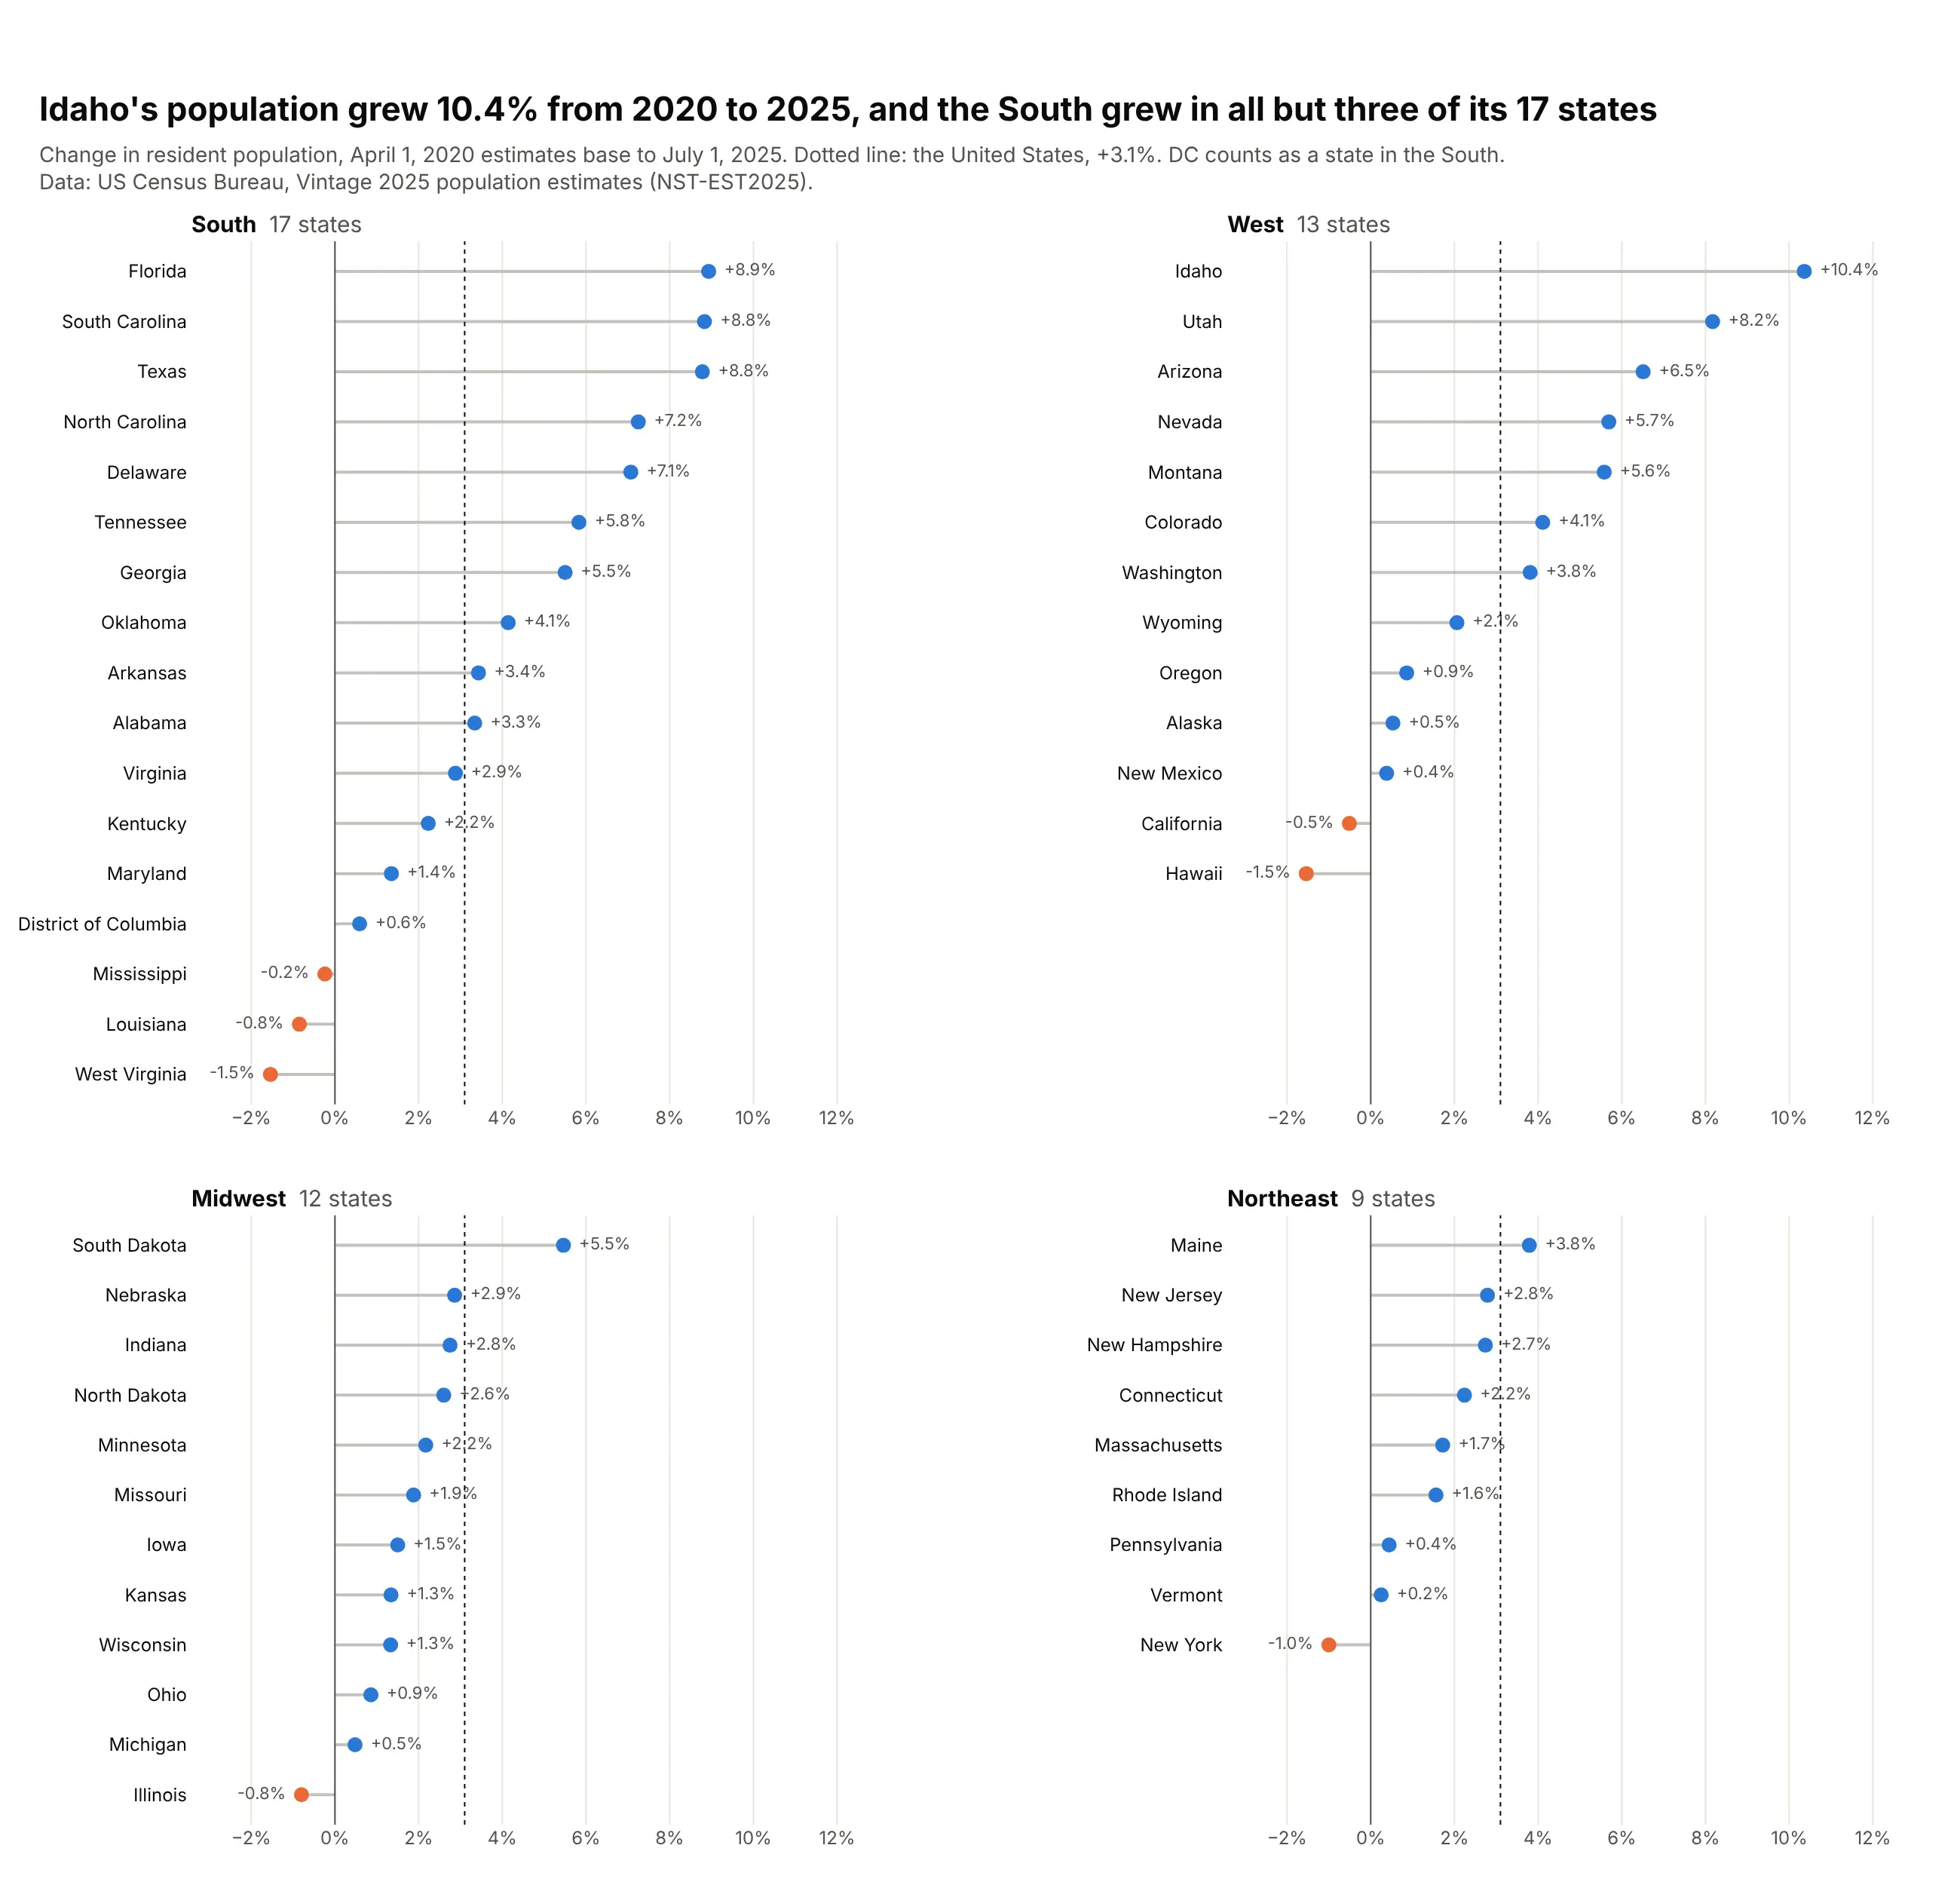
Idaho's population grew 10.4% from 2020 to 2025, the most of any state, and the South grew in 14 of its 17 states. Seven states shrank, led by West Virginia and Hawaii (-1.5% each); the US grew 3.1%. Data: US Census Bureau, Vintage 2025 population estimates.
Tip: split long lists into panels by a natural group and repeat the national reference line in each.
Get the data from the Census Bureau's Vintage 2025 state population estimates(NST-EST2025-ALLDATA.csv), ESTIMATESBASE2020, POPESTIMATE2025 and REGIONand shape it into a table (columns: state, region, base_2020, pop_2025, change_pct), plus a US row.Build a 2x2 plotly lollipop chart, one panel per Census region, sorted within each panel.- Blue heads for growth, orange for decline; values on the outer side; shared x axis.- Dotted line at the US change in every panel; panels aligned to the top.
8. Premier League goal difference in table order
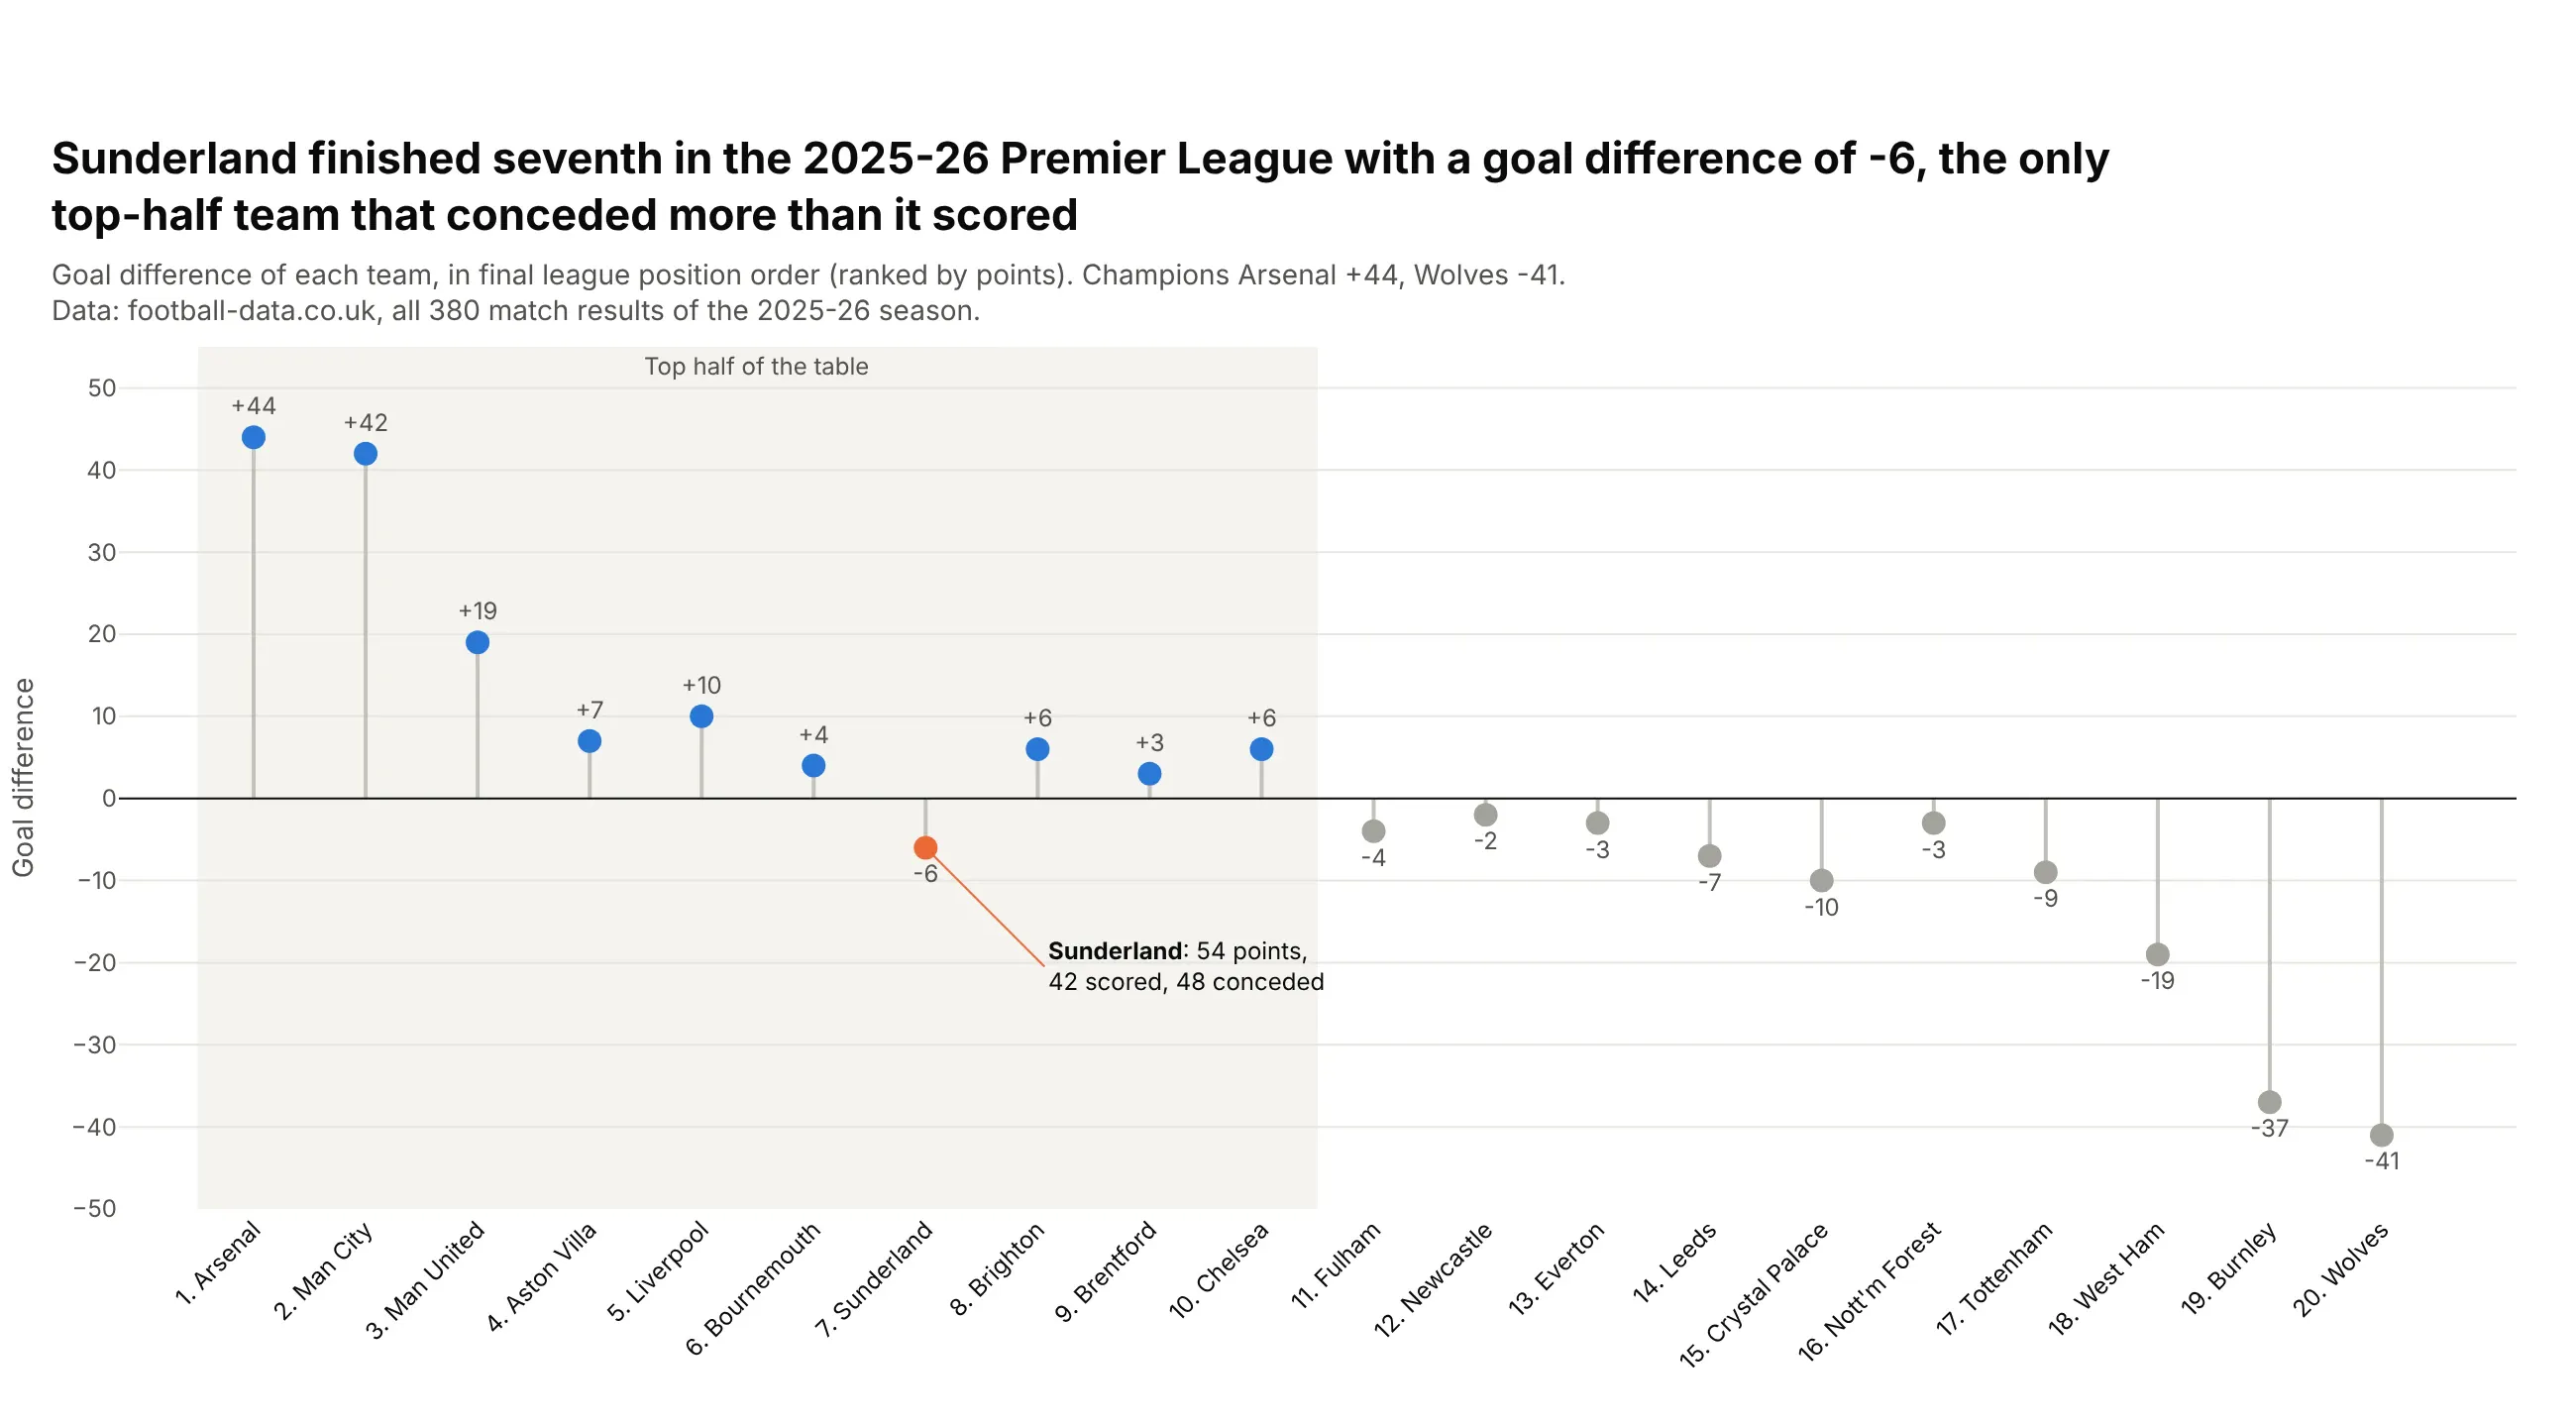
Sunderland finished seventh in the 2025-26 Premier League with a goal difference of -6, the only top-half team that conceded more than it scored. Champions Arsenal had +44 and Wolves -41. Data: football-data.co.uk, all 380 match results.
Tip: keep the table order instead of sorting by value, and draw the stems as error bars on one marker trace.
Get the data from football-data.co.uk, English Premier League 2025-26 results (E0.csv, FTHG and FTAG)and shape it into a final table (columns: pos, team, played, won, drawn, lost, gf, ga, gd, points),ranked by points, then goal difference, then goals scored.Build a vertical plotly lollipop chart with teams on x in table order.- One marker trace; stems from error_y with array/arrayminus back to 0 and width=0.- Shade the top half; Sunderland in orange with an annotation of points, scored and conceded.