
Chris Parmer
October 24, 2026
Marimekko Charts - A Complete Guide
TL;DR
- A Marimekko chart is a 100% stacked bar chart where each bar is as wide as its share of the total, so every segment's area is its share of the whole.
- Marimekko charts are also known as Mekko charts, mosaic plots and percent stacked bar plots, and are similar to 100% stacked bar charts and treemaps.
- Use one when the data has two categorical dimensions and both shares matter, such as market share by region and company or spending by type of care and payer.
- Use grouped bars instead when readers need exact values, and fold bars thinner than about 1% of the width into an "Other" bar.
- You can make a Marimekko chart with Plotly from go.Bar, with a width and offset=0 for each bar and barmode="stack", and any coding agent can build one in a minute.
What is a Marimekko chart?
Marimekko charts look like this:
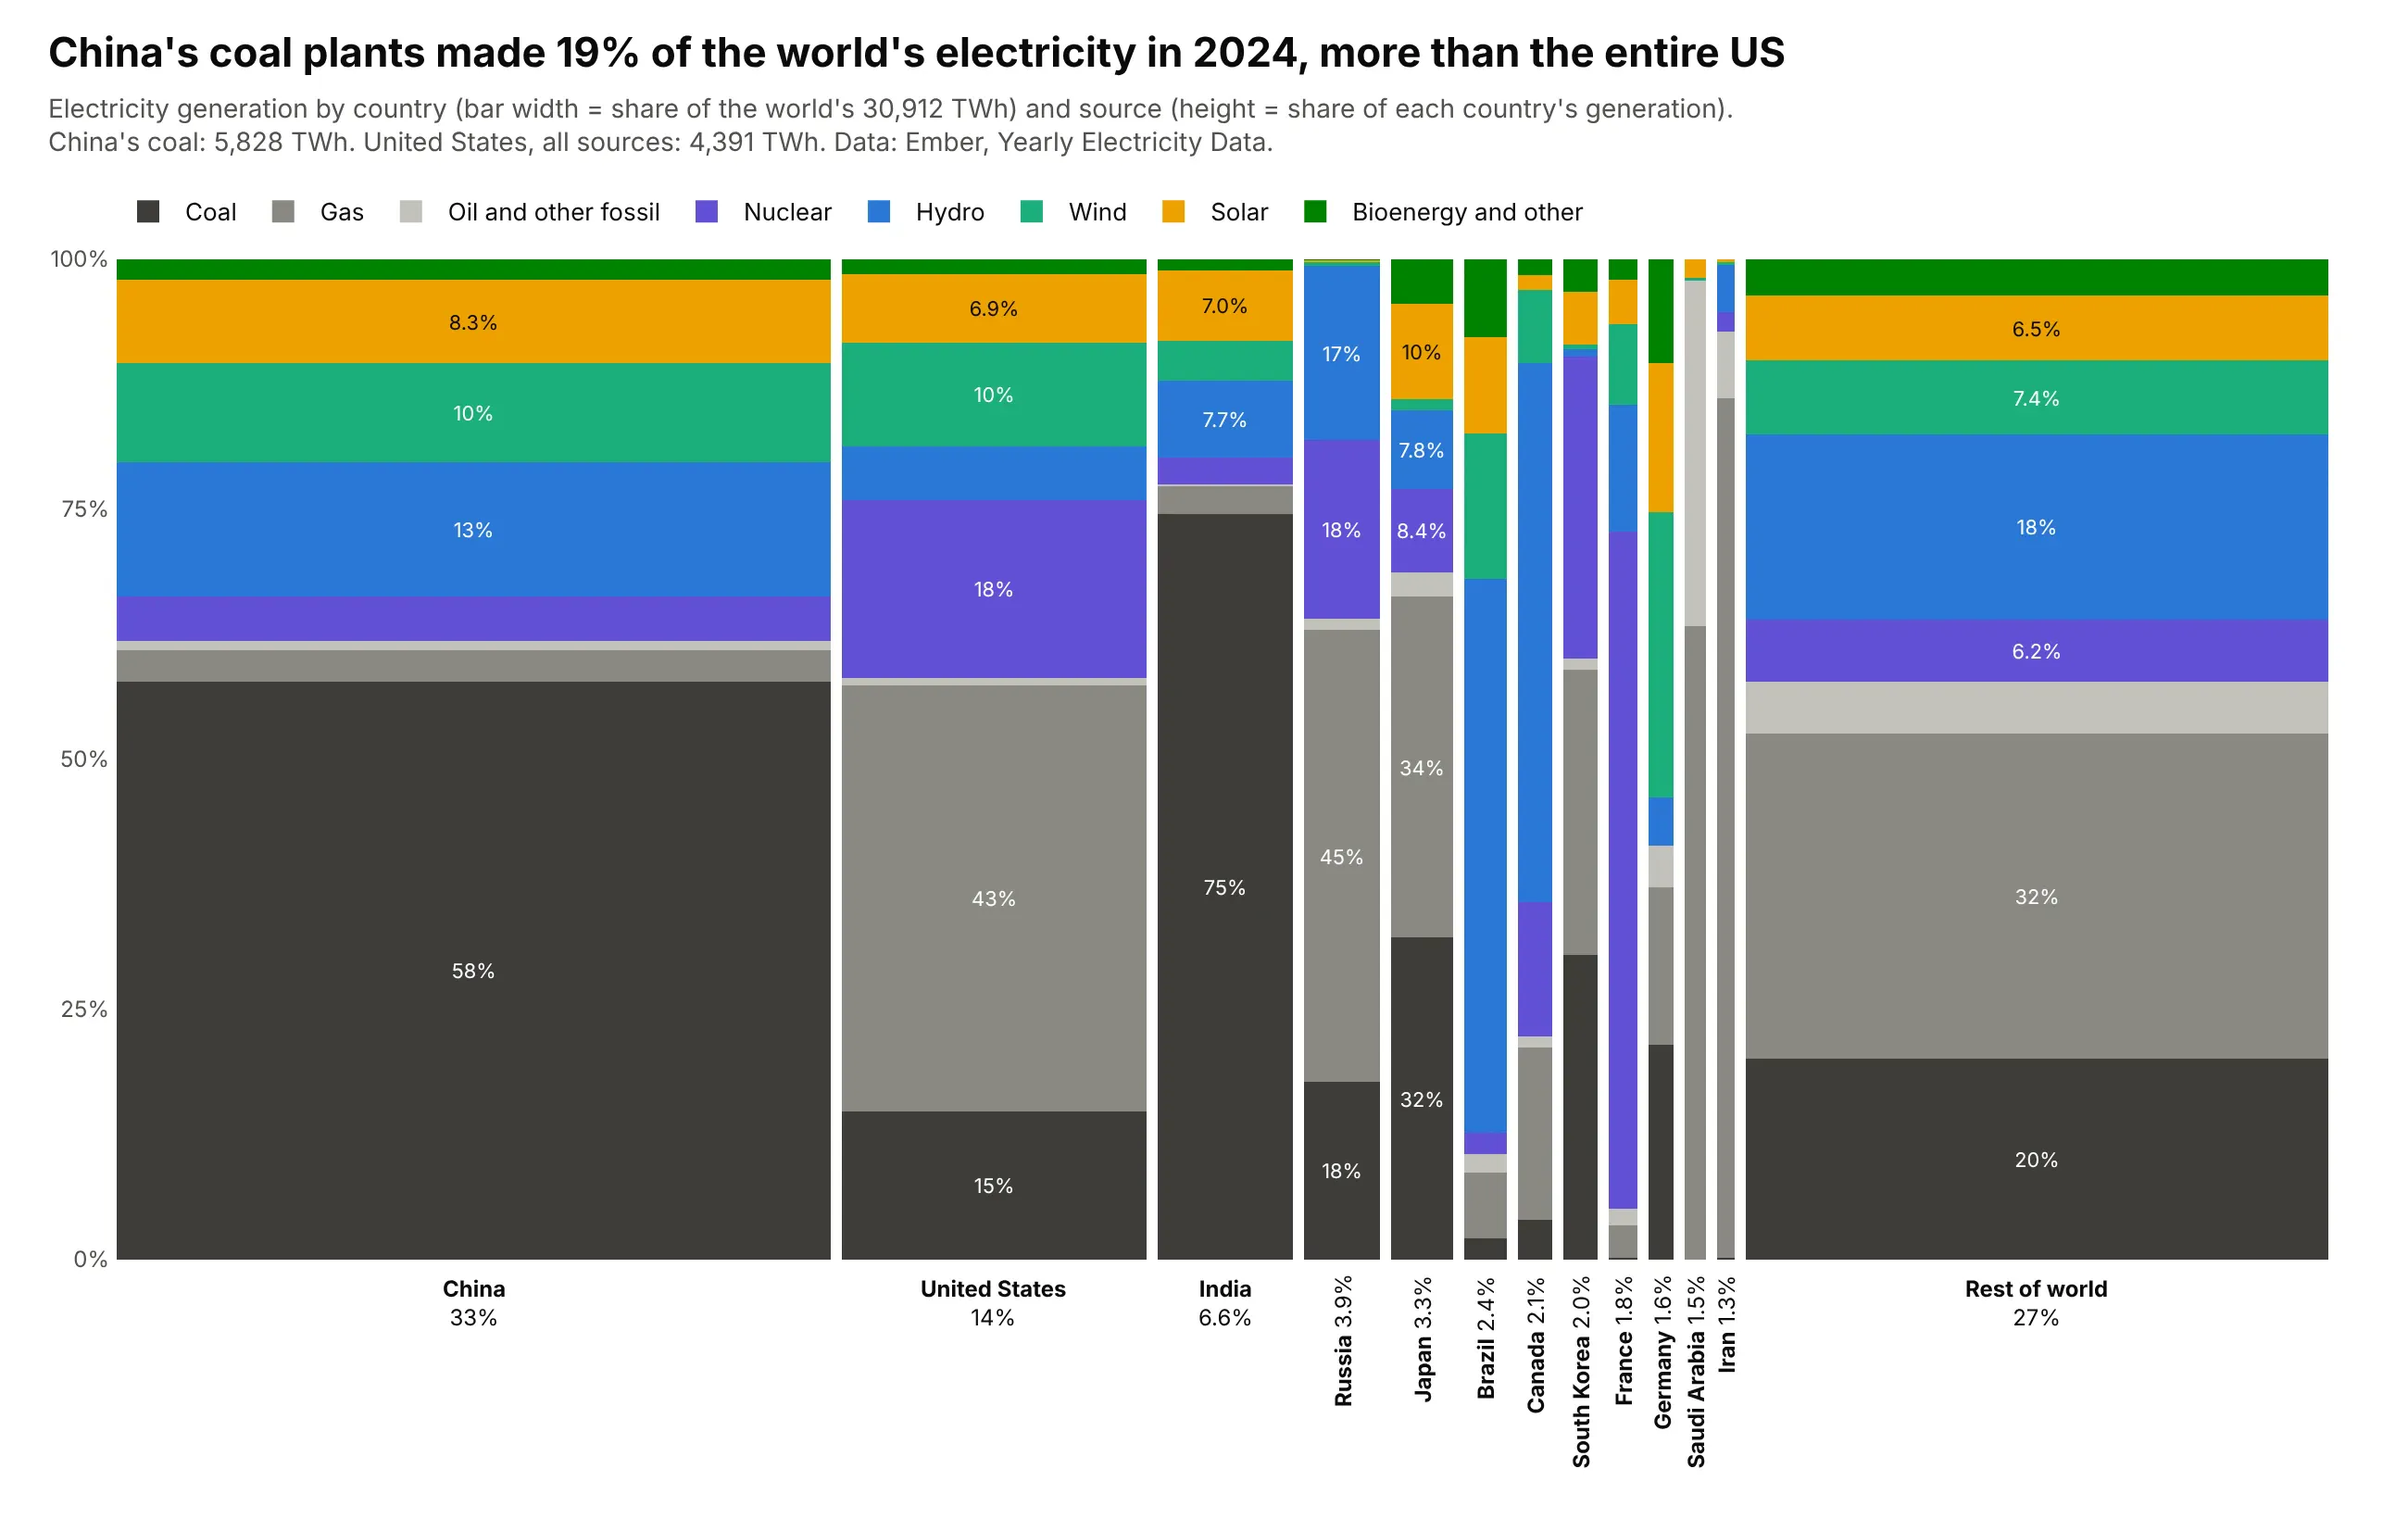
Data: Ember, Yearly Electricity Data, 2024.
How do you read a Marimekko chart? In the example above, notice these things:
- Each bar is one country, and its width is that country's share of the world's electricity in 2024. China's bar takes about a third of the chart, the bars get narrower from left to right, and every other country is grouped into the wide Rest of world bar at the end.
- Each bar is split by source and always reaches 100%, so the heights show a country's mix. France's bar is mostly purple nuclear, Brazil's is mostly blue hydro, and India's is mostly dark gray coal.
- Width times height is area, so the size of a segment is the actual amount of electricity. That's why China's dark coal block is bigger than the whole United States bar next to it.
- The sources are stacked in the same order in every bar, with the fossil fuels in grays at the bottom and nuclear and renewables above them, so you can compare how much of each bar is gray. Germany's wind segment is the tallest of any country.
- Only the coal segments share a baseline at 0%, so they are easier to compare across countries than the segments floating in the middle. The narrowest bars, such as Saudi Arabia and Iran, are too thin to label, and you hover over them to read the numbers.
It's often used for charts like these:
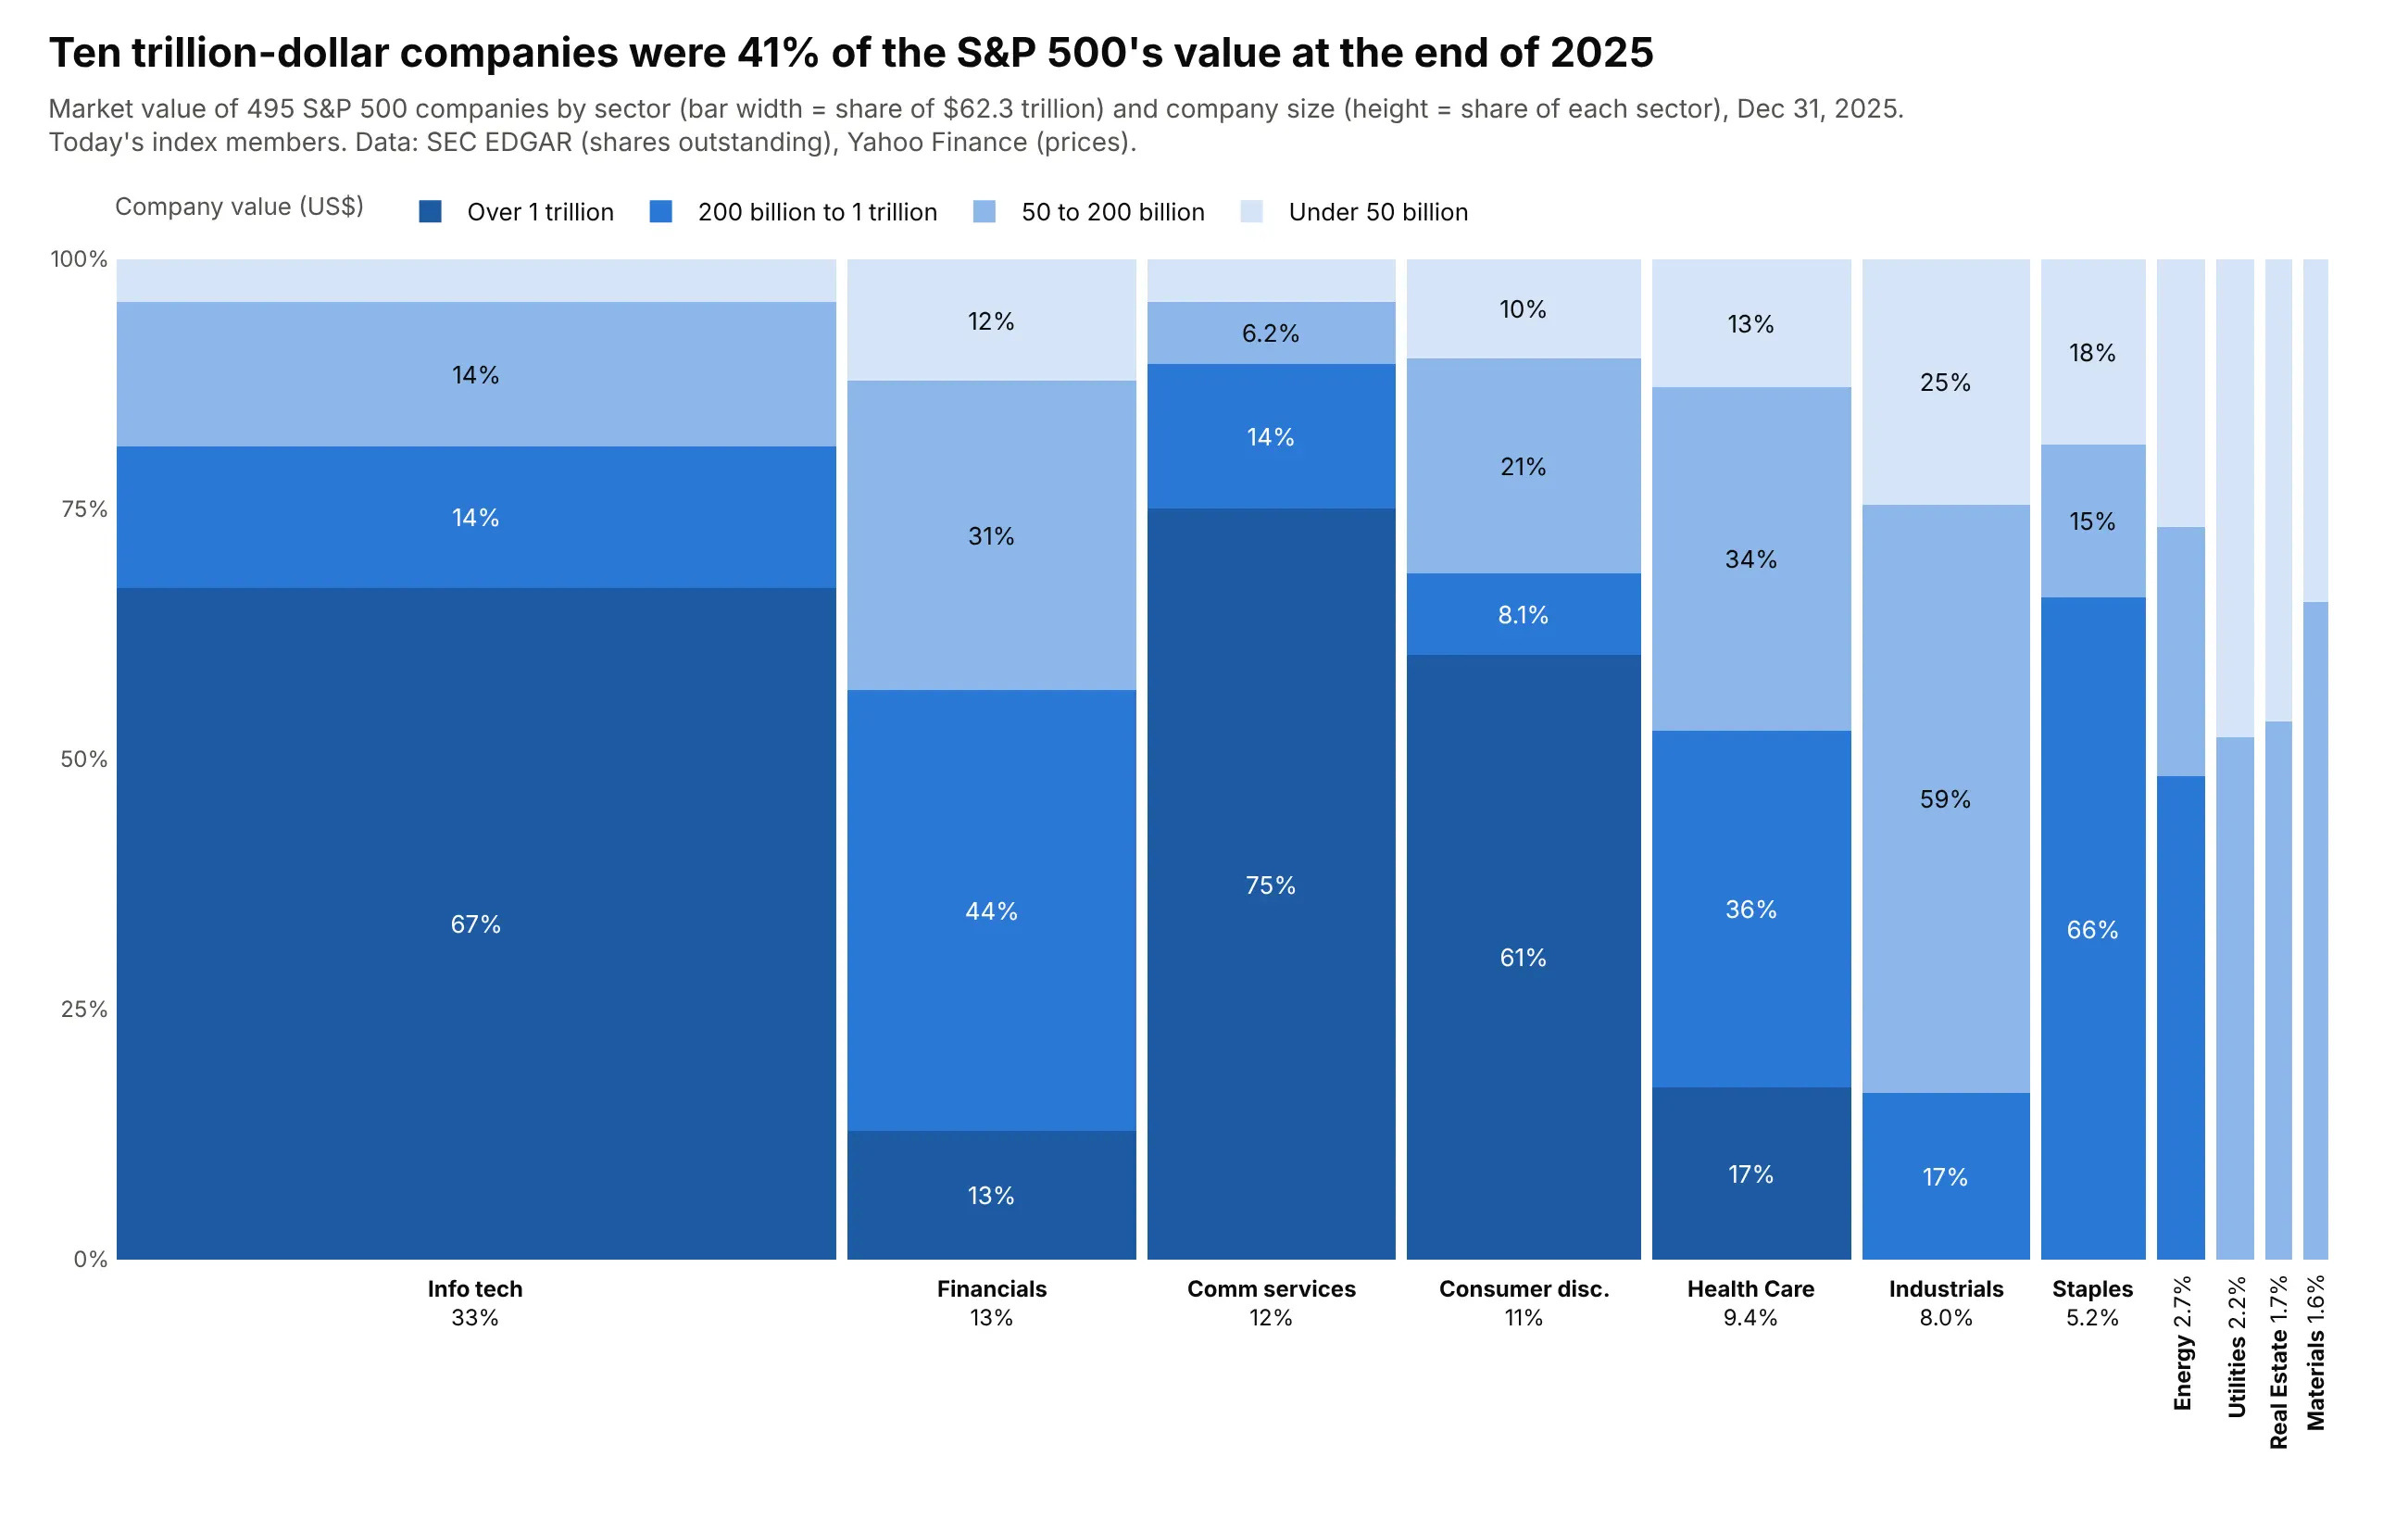
A market map. Ten companies worth over $1 trillion each were 41% of the S&P 500's $62.3 trillion at the end of 2025, and 67% of the technology sector. Data: SEC EDGAR (shares) and Yahoo Finance (prices), index members as of October 2026.
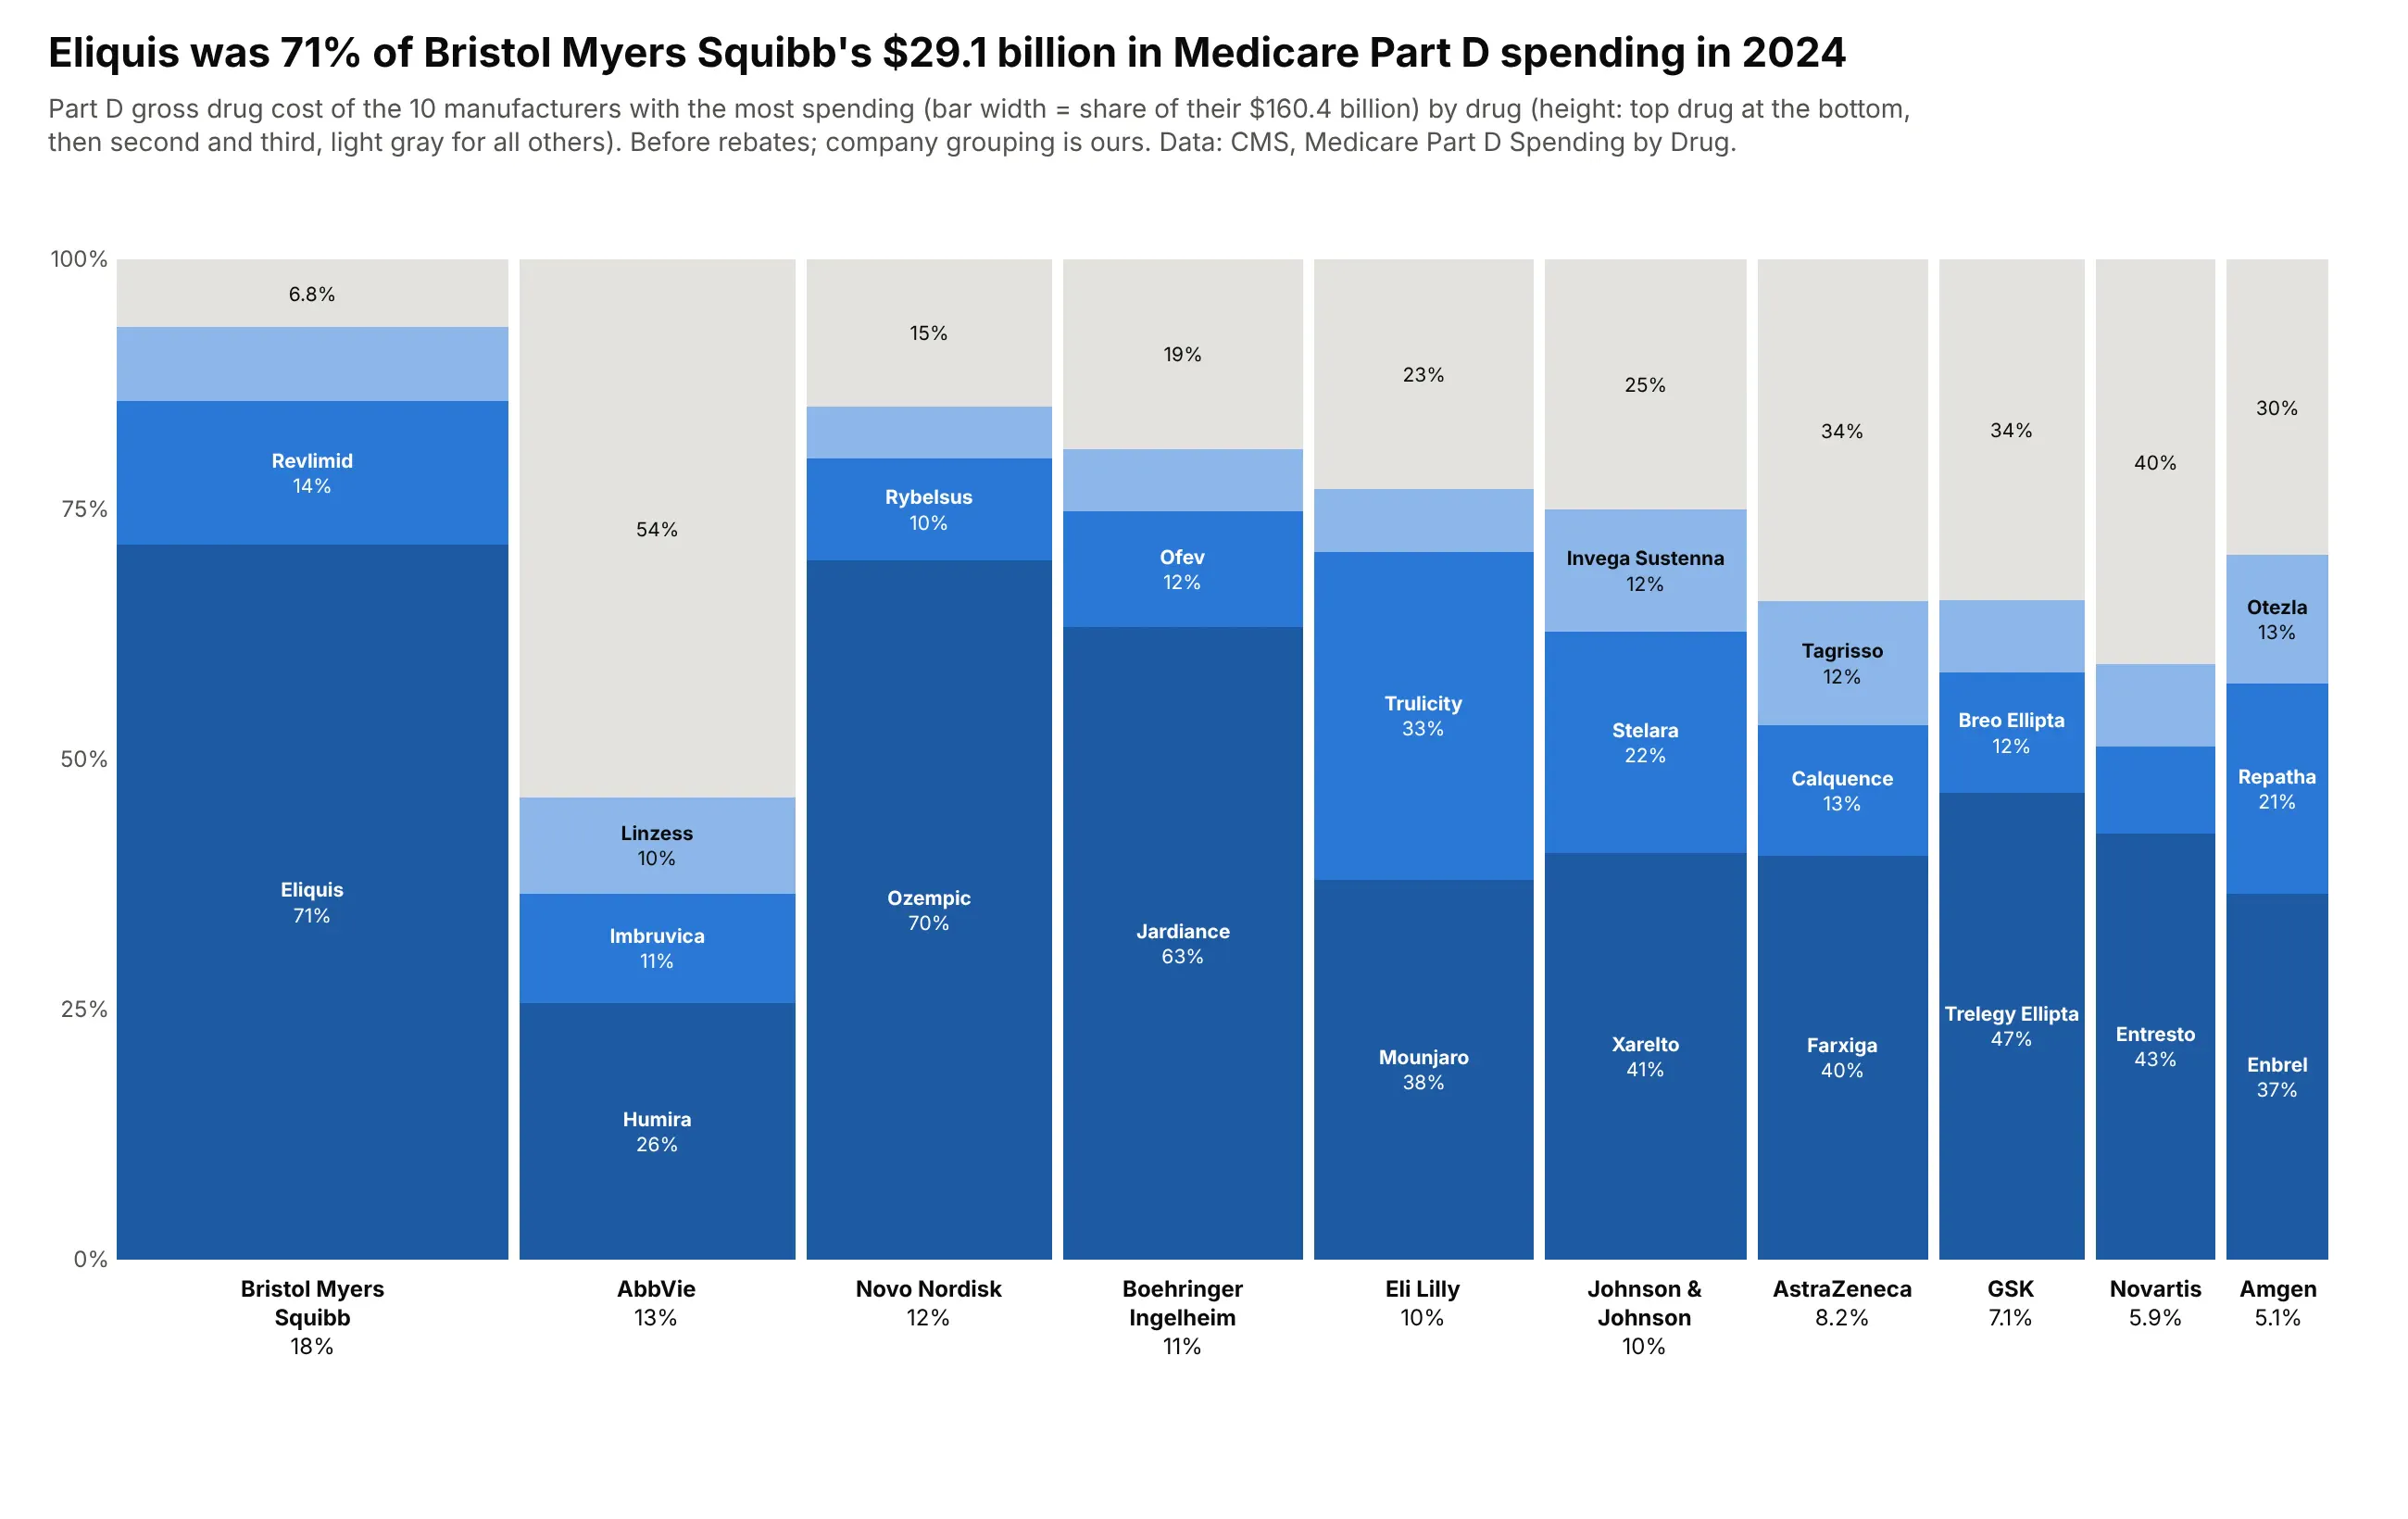
Revenue by company and product. Eliquis was 71% of Bristol Myers Squibb's $29.1 billion of Medicare Part D spending in 2024, while Humira was 26% of AbbVie's. Data: CMS, Medicare Part D Spending by Drug, 2024.
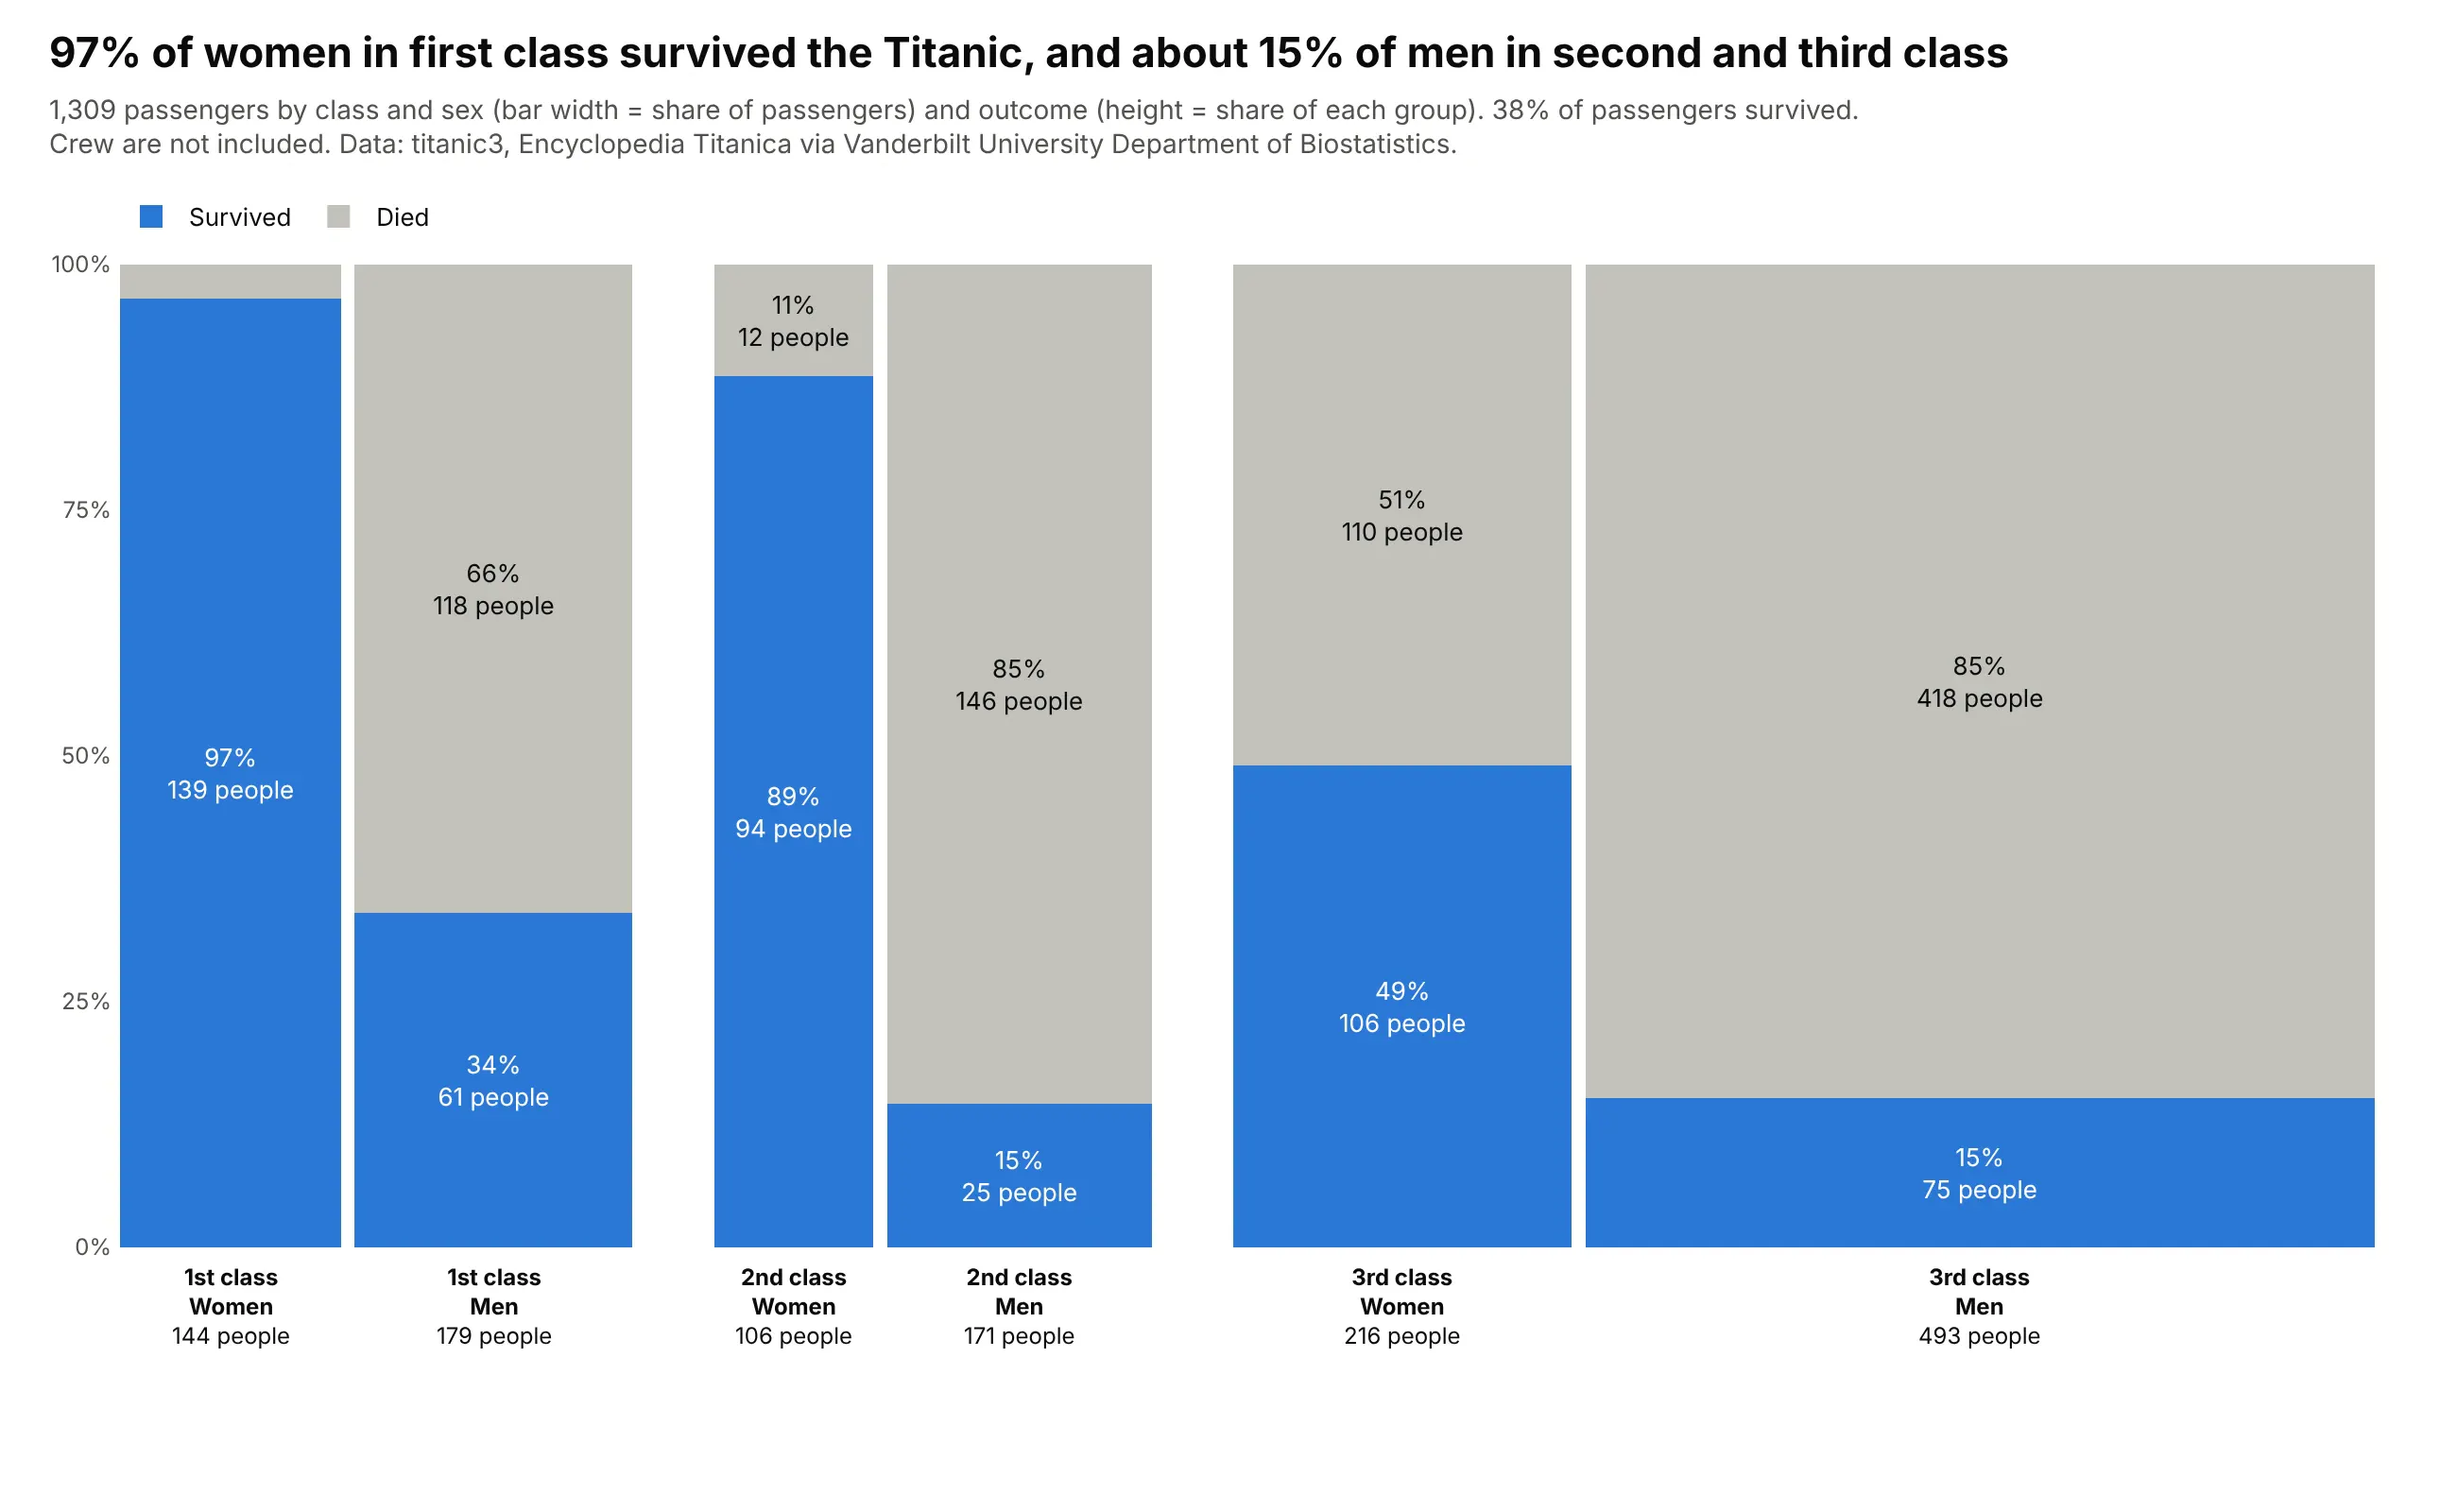
A contingency table of counts. 97% of first-class women on the Titanic survived, against about 15% of men in second and third class, and third-class men were the largest group at 493 of 1,309 passengers. Data: titanic3, Encyclopedia Titanica via Vanderbilt Biostatistics.
A short history
Statisticians call this chart a mosaic plot. John Hartigan and Beat Kleiner introduced it in 1981 to show contingency tables (Mosaics for contingency tables), and Michael Friendly extended it to tables with many variables in 1994 (Mosaic displays for multi-way contingency tables), using a table of hair and eye color of 592 students that became the standard example:
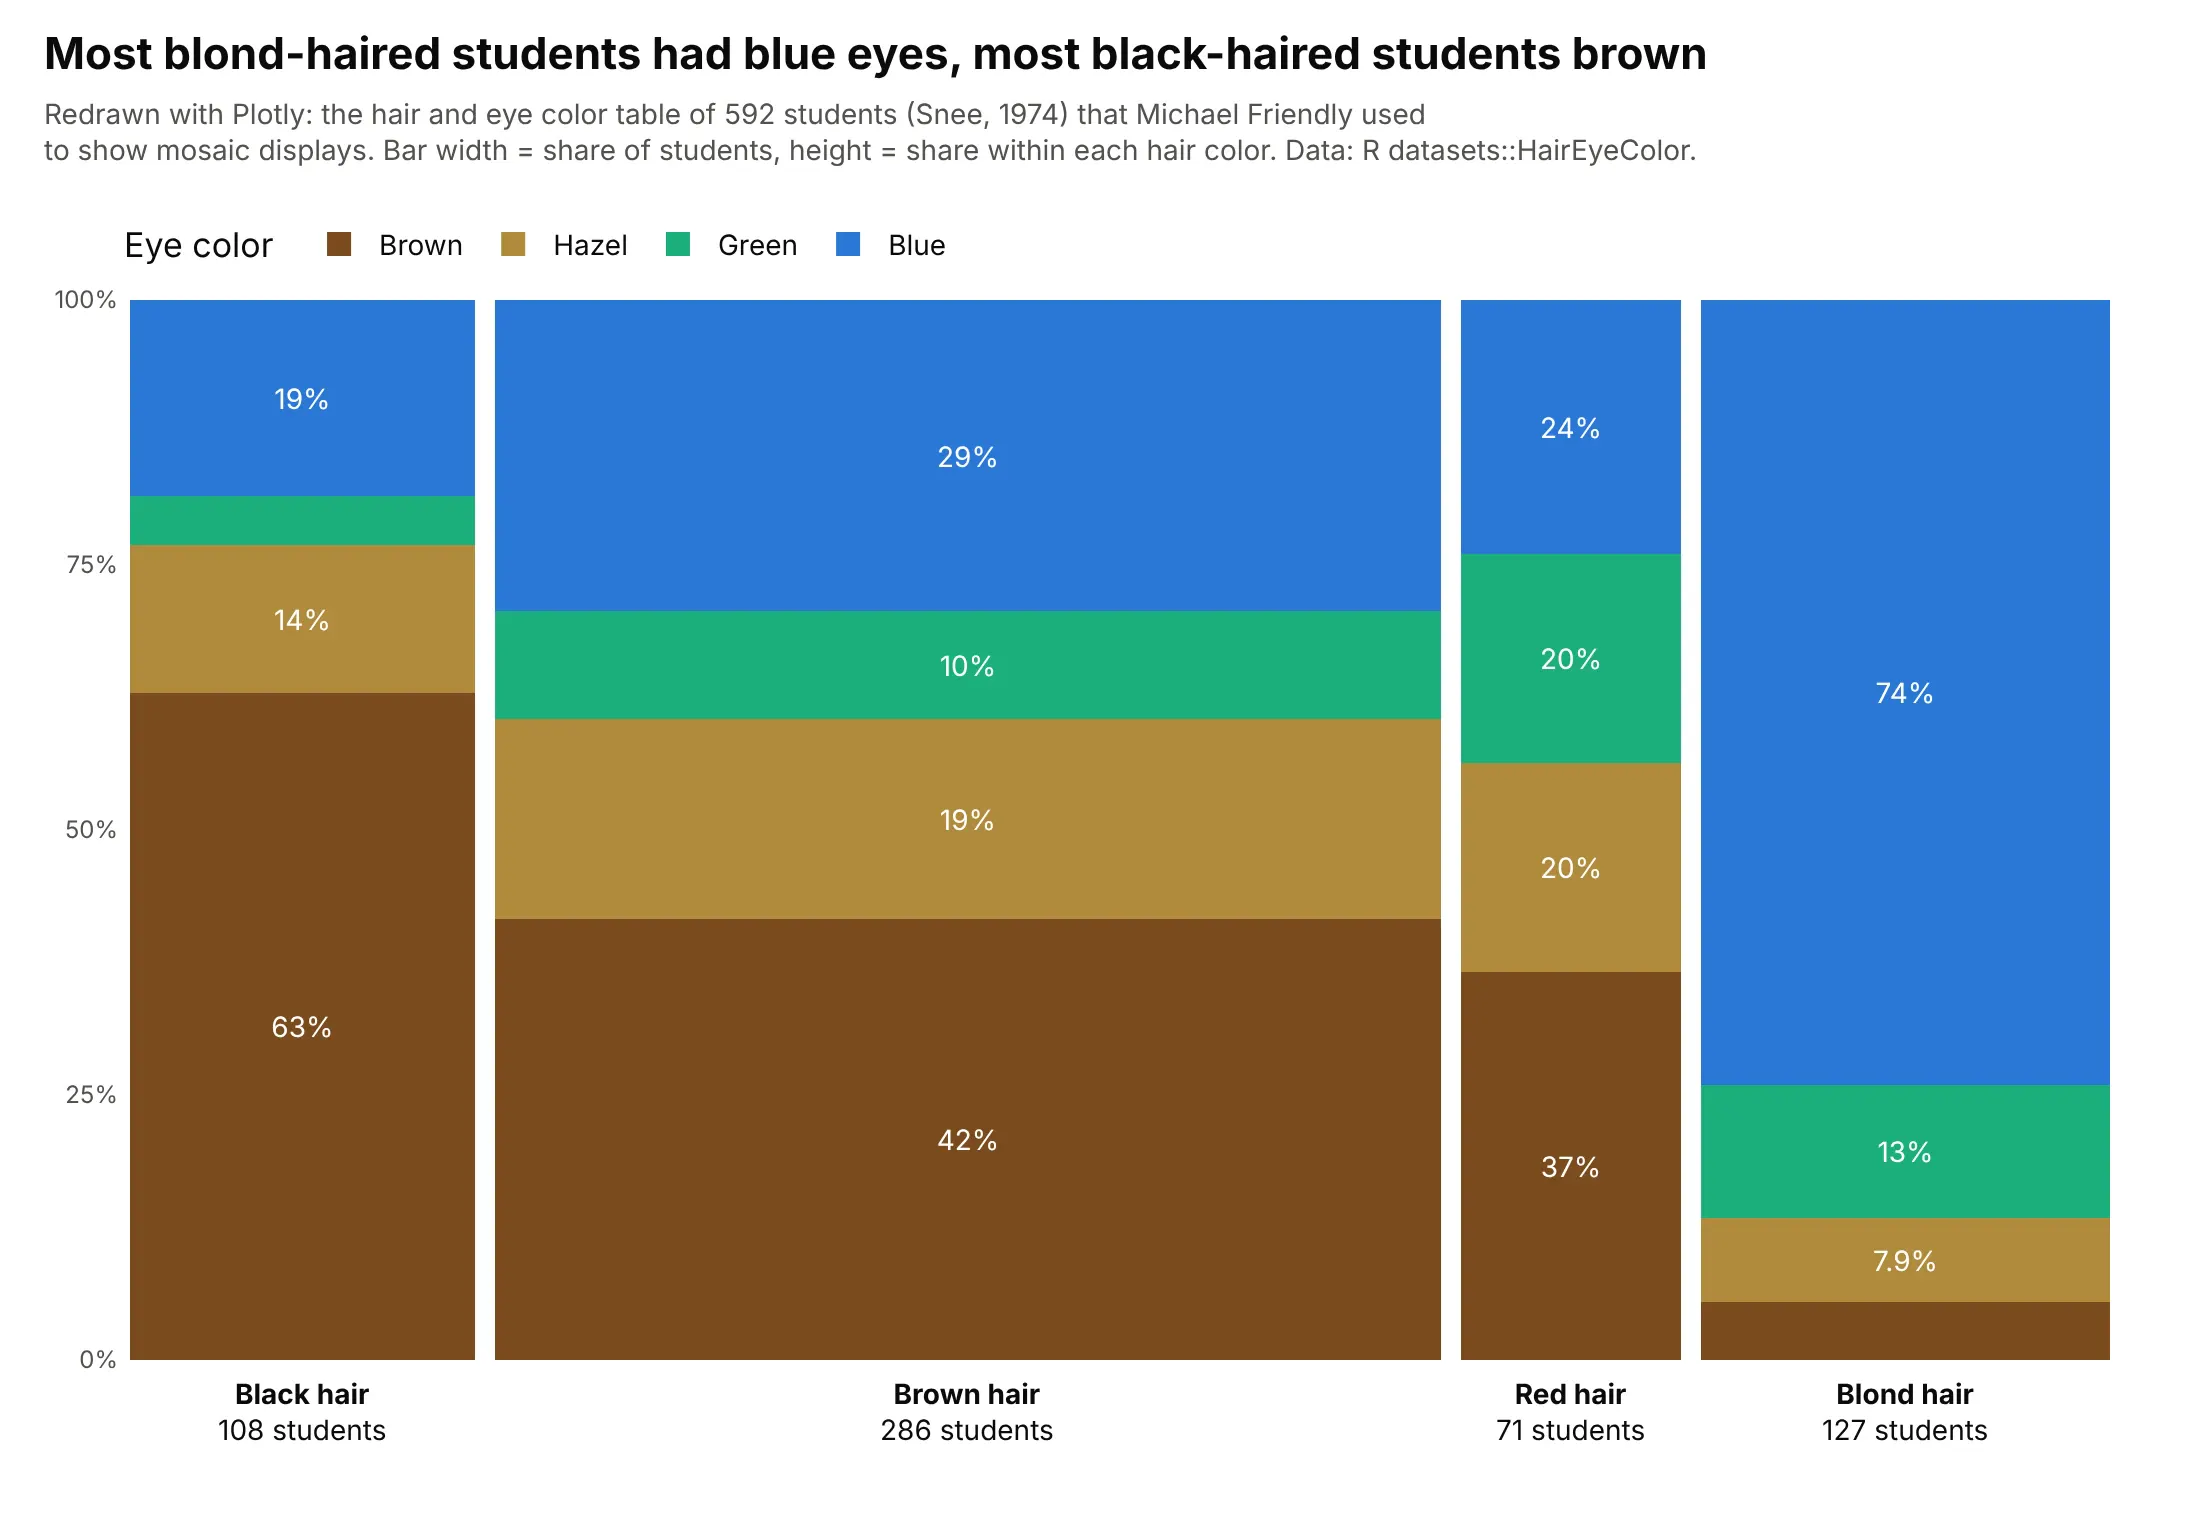
In business strategy work the same chart is used as a "market map" and is usually called a Marimekko or mekko chart, a name commonly attributed to its resemblance to the prints of the Finnish design company Marimekko. Friendly traces the idea back to earlier area-proportional displays in A brief history of the mosaic display (2002).
Alternatives to a Marimekko chart
Here's the same table of US health care spending drawn six ways. Some are better for the question, some worse, some just different:
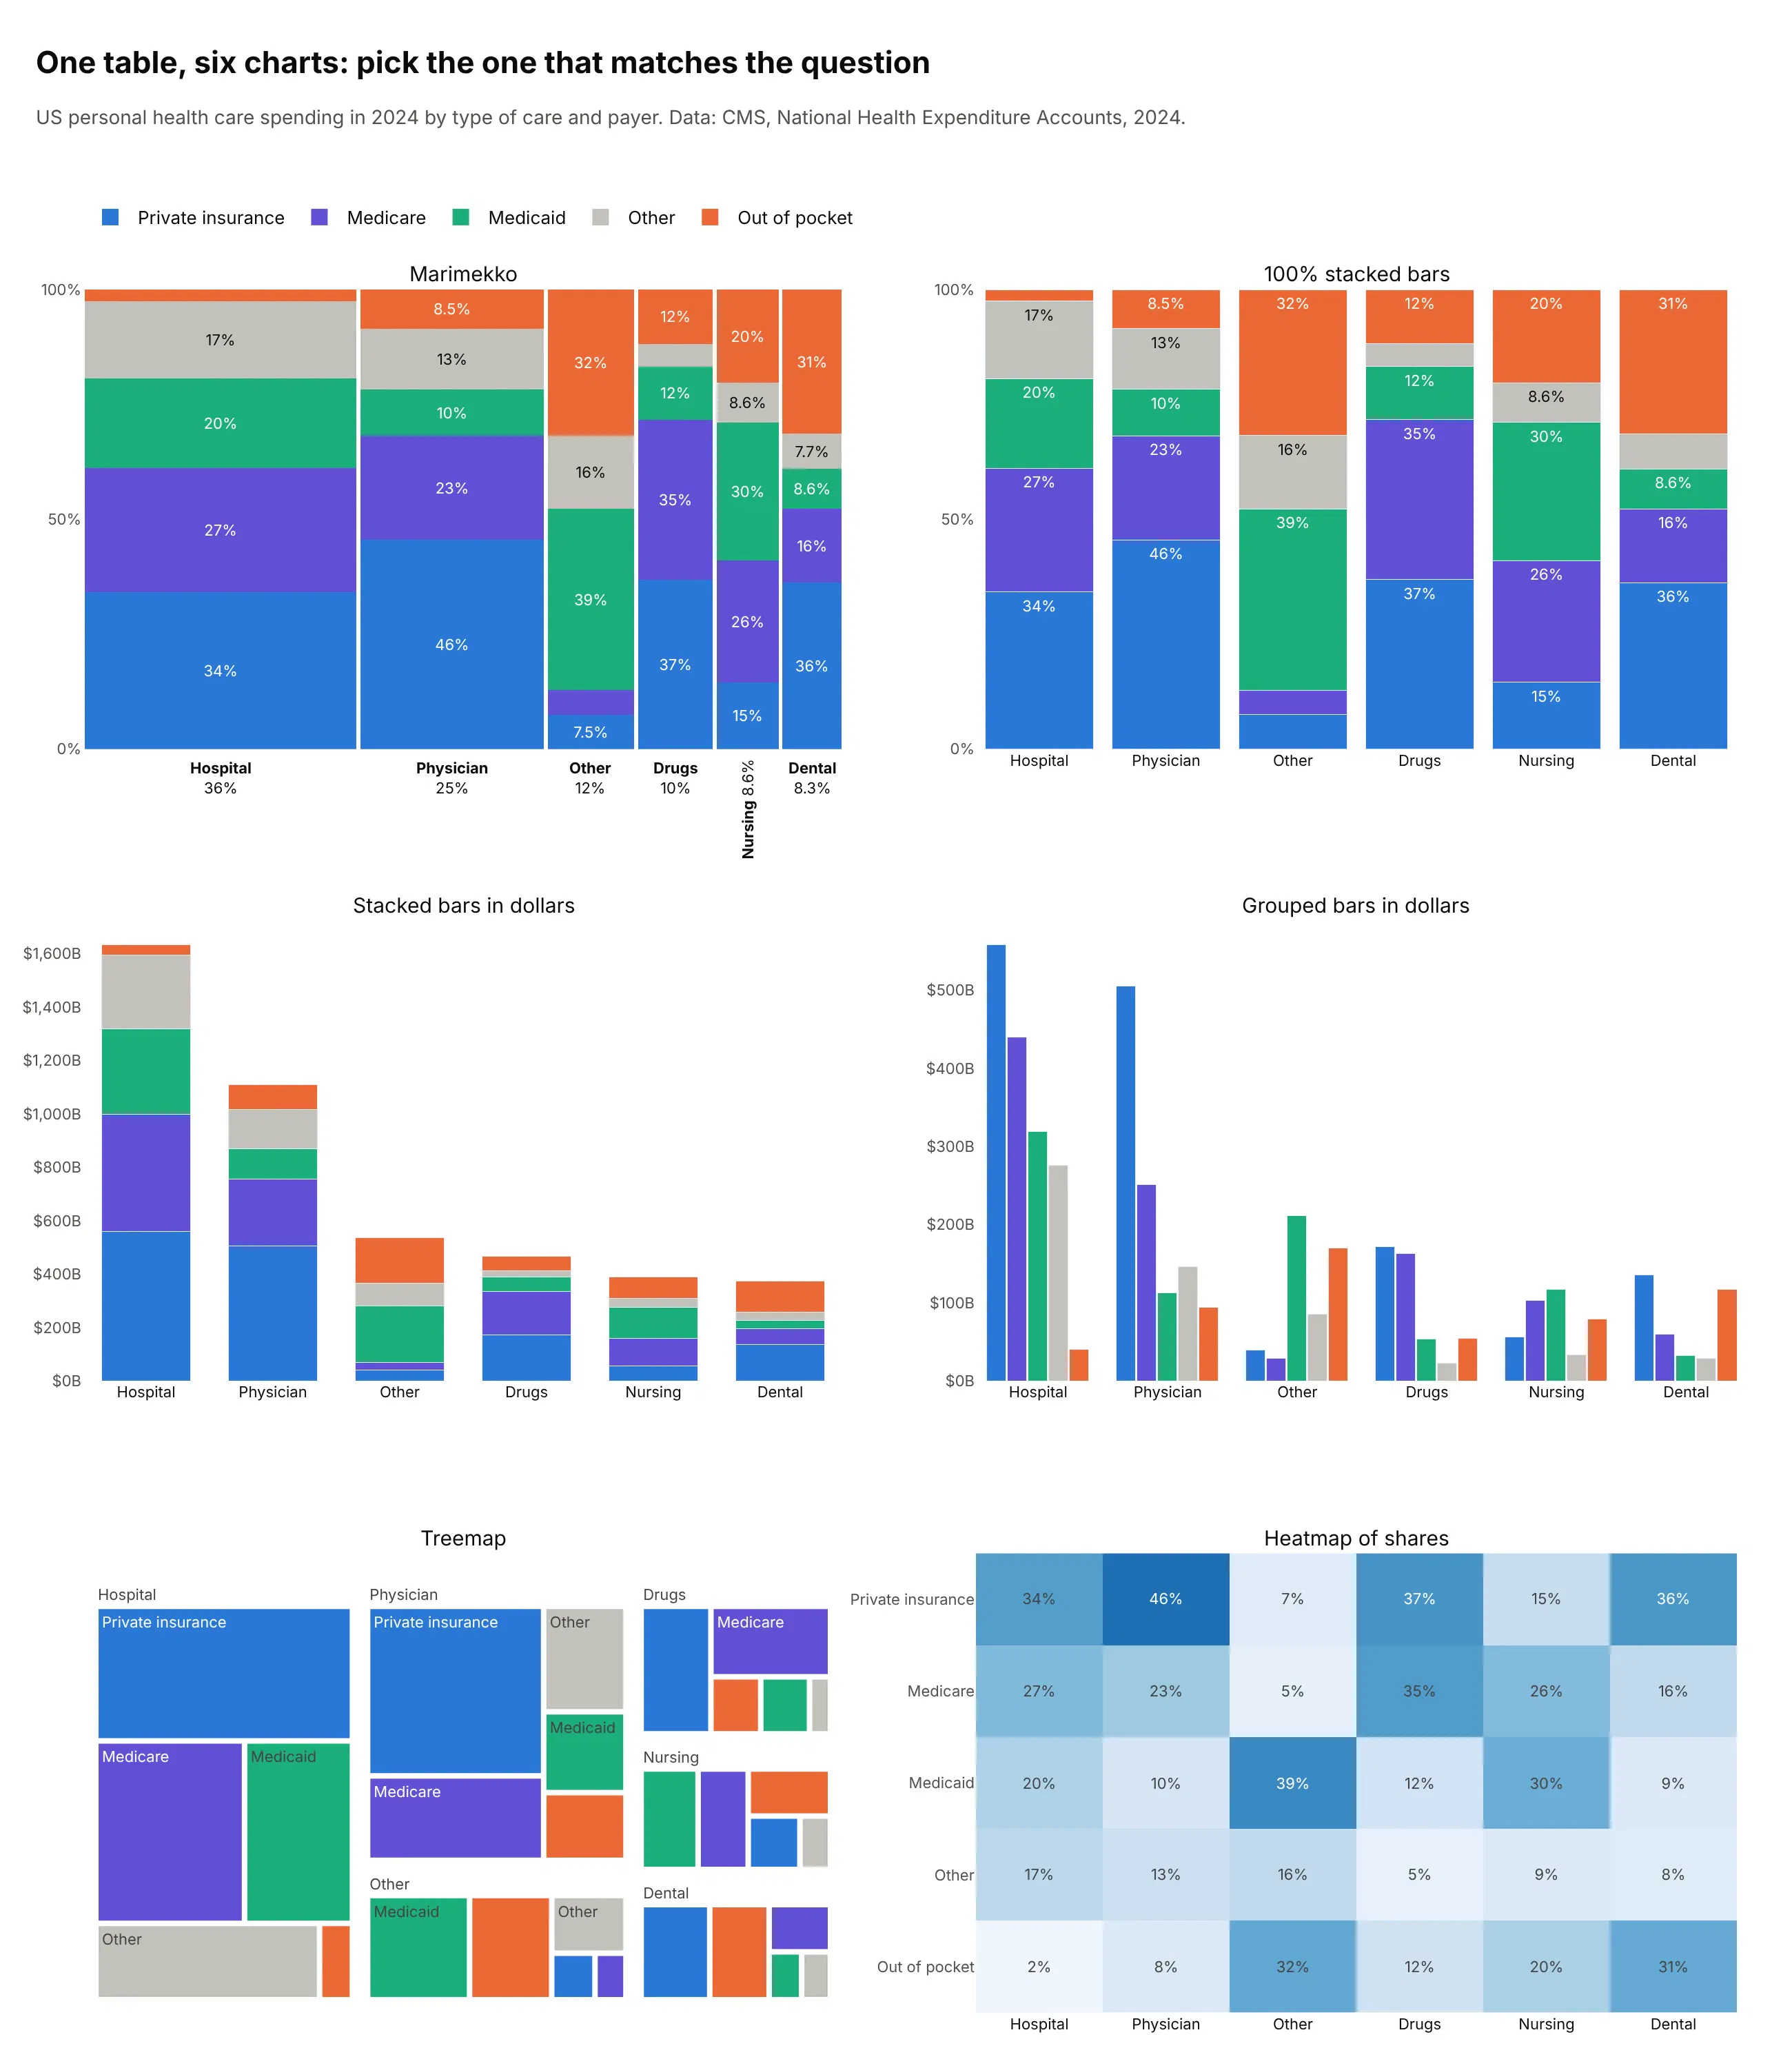
- Grouped bars (better for exact amounts). Every bar sits on a shared baseline, so you can see that private insurance paid $559 billion of hospital care and $505 billion of physician care, which a Marimekko only shows as areas. You lose the part-to-whole.
- 100% stacked bars (worse when sizes differ). The mix of each type of care is the same as in the Marimekko, but hospital care ($1,635 billion) gets the same width as dental care ($374 billion), so the size of each one is lost.
- Stacked bars in dollars (works too, for totals). The heights show the totals, but the mixes of the small bars become hard to read and compare.
- Treemap (different). Shows sizes and nesting with more room for labels, but its rectangles share no baseline, so mixes are hard to compare across groups. See our treemap guide.
- Heatmap of shares (better for comparing mixes). Each cell is a share, so it compares every payer across every type of care exactly (out of pocket is 32% of other care and 2.5% of hospital care), but it drops the size of each type. See our heatmap guide.
How to make a Marimekko chart
With AI
ChatGPT, Claude Code, GitHub Copilot, Cursor and other AI tools are excellent at writing Plotly code. Name Plotly in the prompt, name the construction (because "marimekko" alone sometimes gets you a treemap), say what width and height mean, and list the checks you want:
Make a plotly Marimekko chart from sales.csv (columns: region, product, revenue_usd).- One bar per region, width = region's share of total revenue; x = running sum of widths, offset=0.- Segments = products, height = share of the region's revenue; one go.Bar trace per product,barmode="stack", bargap=0, a 0.5% gap between bars.- Sort regions by revenue; fold regions under 1% into "Other regions", drawn last.- Same product order and color in every bar.- Label each bar under the axis with name and share; label segments only where they fit.- Hover: region, product, revenue and share.- A title that states the takeaway and a subtitle that says what width and height mean.- Assert the table sums to the total before plotting.
With Plotly Studio
Plotly Studio is a desktop app where you point an AI at a dataset and it builds charts and a Dash app around your questions. Ask for a Marimekko chart and say what the width and the height should mean:
Show a Marimekko chart of electricity generation with one bar per country, as wide as its share of world generation, split into sources by their share of that country's generation. Use one fixed color per source, sort the countries by size, and add a dropdown to switch the year.
Make a Marimekko chart in Python or JavaScript
This is the code AI tools write under the hood. In Python, this helper takes a long table with one row per pair, computes each bar's width and left edge, and stacks one go.Bar per sub-category. Here it is on the Titanic's 1,309 passengers by class:
import pandas as pdimport plotly.graph_objects as godef make_marimekko(df, x, color, value, gap=0.005):t = df.pivot_table(index=x, columns=color, values=value, aggfunc="sum", fill_value=0)t = t.loc[t.sum(axis=1).sort_values(ascending=False).index] # widest bar firstwidths = t.sum(axis=1) / t.values.sum() # bar width = share of the grand totallefts = widths.cumsum() - widths # left edge of each barshares = t.div(t.sum(axis=1), axis=0) # segment height = share within the barfig = go.Figure()for c in t.columns:fig.add_bar(name=c, x=lefts + gap / 2, width=widths - gap, offset=0, y=shares[c],text=[f"{s:.0%}" for s in shares[c]], customdata=list(zip(t.index, t[c])),hovertemplate=f"%{{customdata[0]}}, {c}: %{{customdata[1]:,}} (%{{y:.0%}})<extra></extra>")fig.update_layout(barmode="stack", bargap=0, uniformtext=dict(minsize=10, mode="hide"))fig.update_xaxes(range=[0, 1], tickvals=lefts + widths / 2,ticktext=[f"{i}<br>{w:.0%}" for i, w in widths.items()])fig.update_yaxes(range=[0, 1], tickformat=".0%")return figdf = pd.DataFrame({"pclass": ["1st class"] * 2 + ["2nd class"] * 2 + ["3rd class"] * 2,"survived": ["Survived", "Died"] * 3,"passengers": [200, 123, 119, 158, 181, 528],})fig = make_marimekko(df, x="pclass", color="survived", value="passengers")fig.show()
In JavaScript, plotly.js builds the same chart from bar traces with a width and an offset for each bar:
<div id="chart"></div><script src="https://cdn.plot.ly/plotly-4.1.1.min.js"></script><script>const classes = ["3rd class", "1st class", "2nd class"];const counts = {Survived: [181, 200, 119], Died: [528, 123, 158]};const totals = classes.map((_, i) => counts.Survived[i] + counts.Died[i]);const all = totals.reduce((a, b) => a + b);const widths = totals.map(n => n / all); // bar width = share of all passengersconst lefts = widths.map((_, i) => widths.slice(0, i).reduce((a, b) => a + b, 0));const traces = Object.keys(counts).map(name => ({type: "bar", name, x: lefts, width: widths.map(w => w - 0.005), offset: 0,y: counts[name].map((n, i) => n / totals[i]), // height = share within the bartexttemplate: "%{y:.0%}"}));Plotly.newPlot("chart", traces, {barmode: "stack", bargap: 0,xaxis: {range: [0, 1], tickvals: lefts.map((l, i) => l + widths[i] / 2), ticktext: classes},yaxis: {range: [0, 1], tickformat: ".0%"}});</script>
Without offset: 0, Plotly centers each bar on its x value and the bars overlap, so set it on every trace.
Share it
Every Plotly chart has a Share chart button (the cloud icon in its toolbar) that uploads it to Plotly Cloud and gives you a link. Only you can see it until you change its visibility.
For a live app, put the chart in a Dash app and publish it with the Plotly Cloud CLI. Coding agents can run these commands for you:
pip install "dash[cloud]"plotly user loginplotly app publish
If your data has to stay in your own cloud or data center, publish to Dash Enterprise instead.
Dos and don'ts
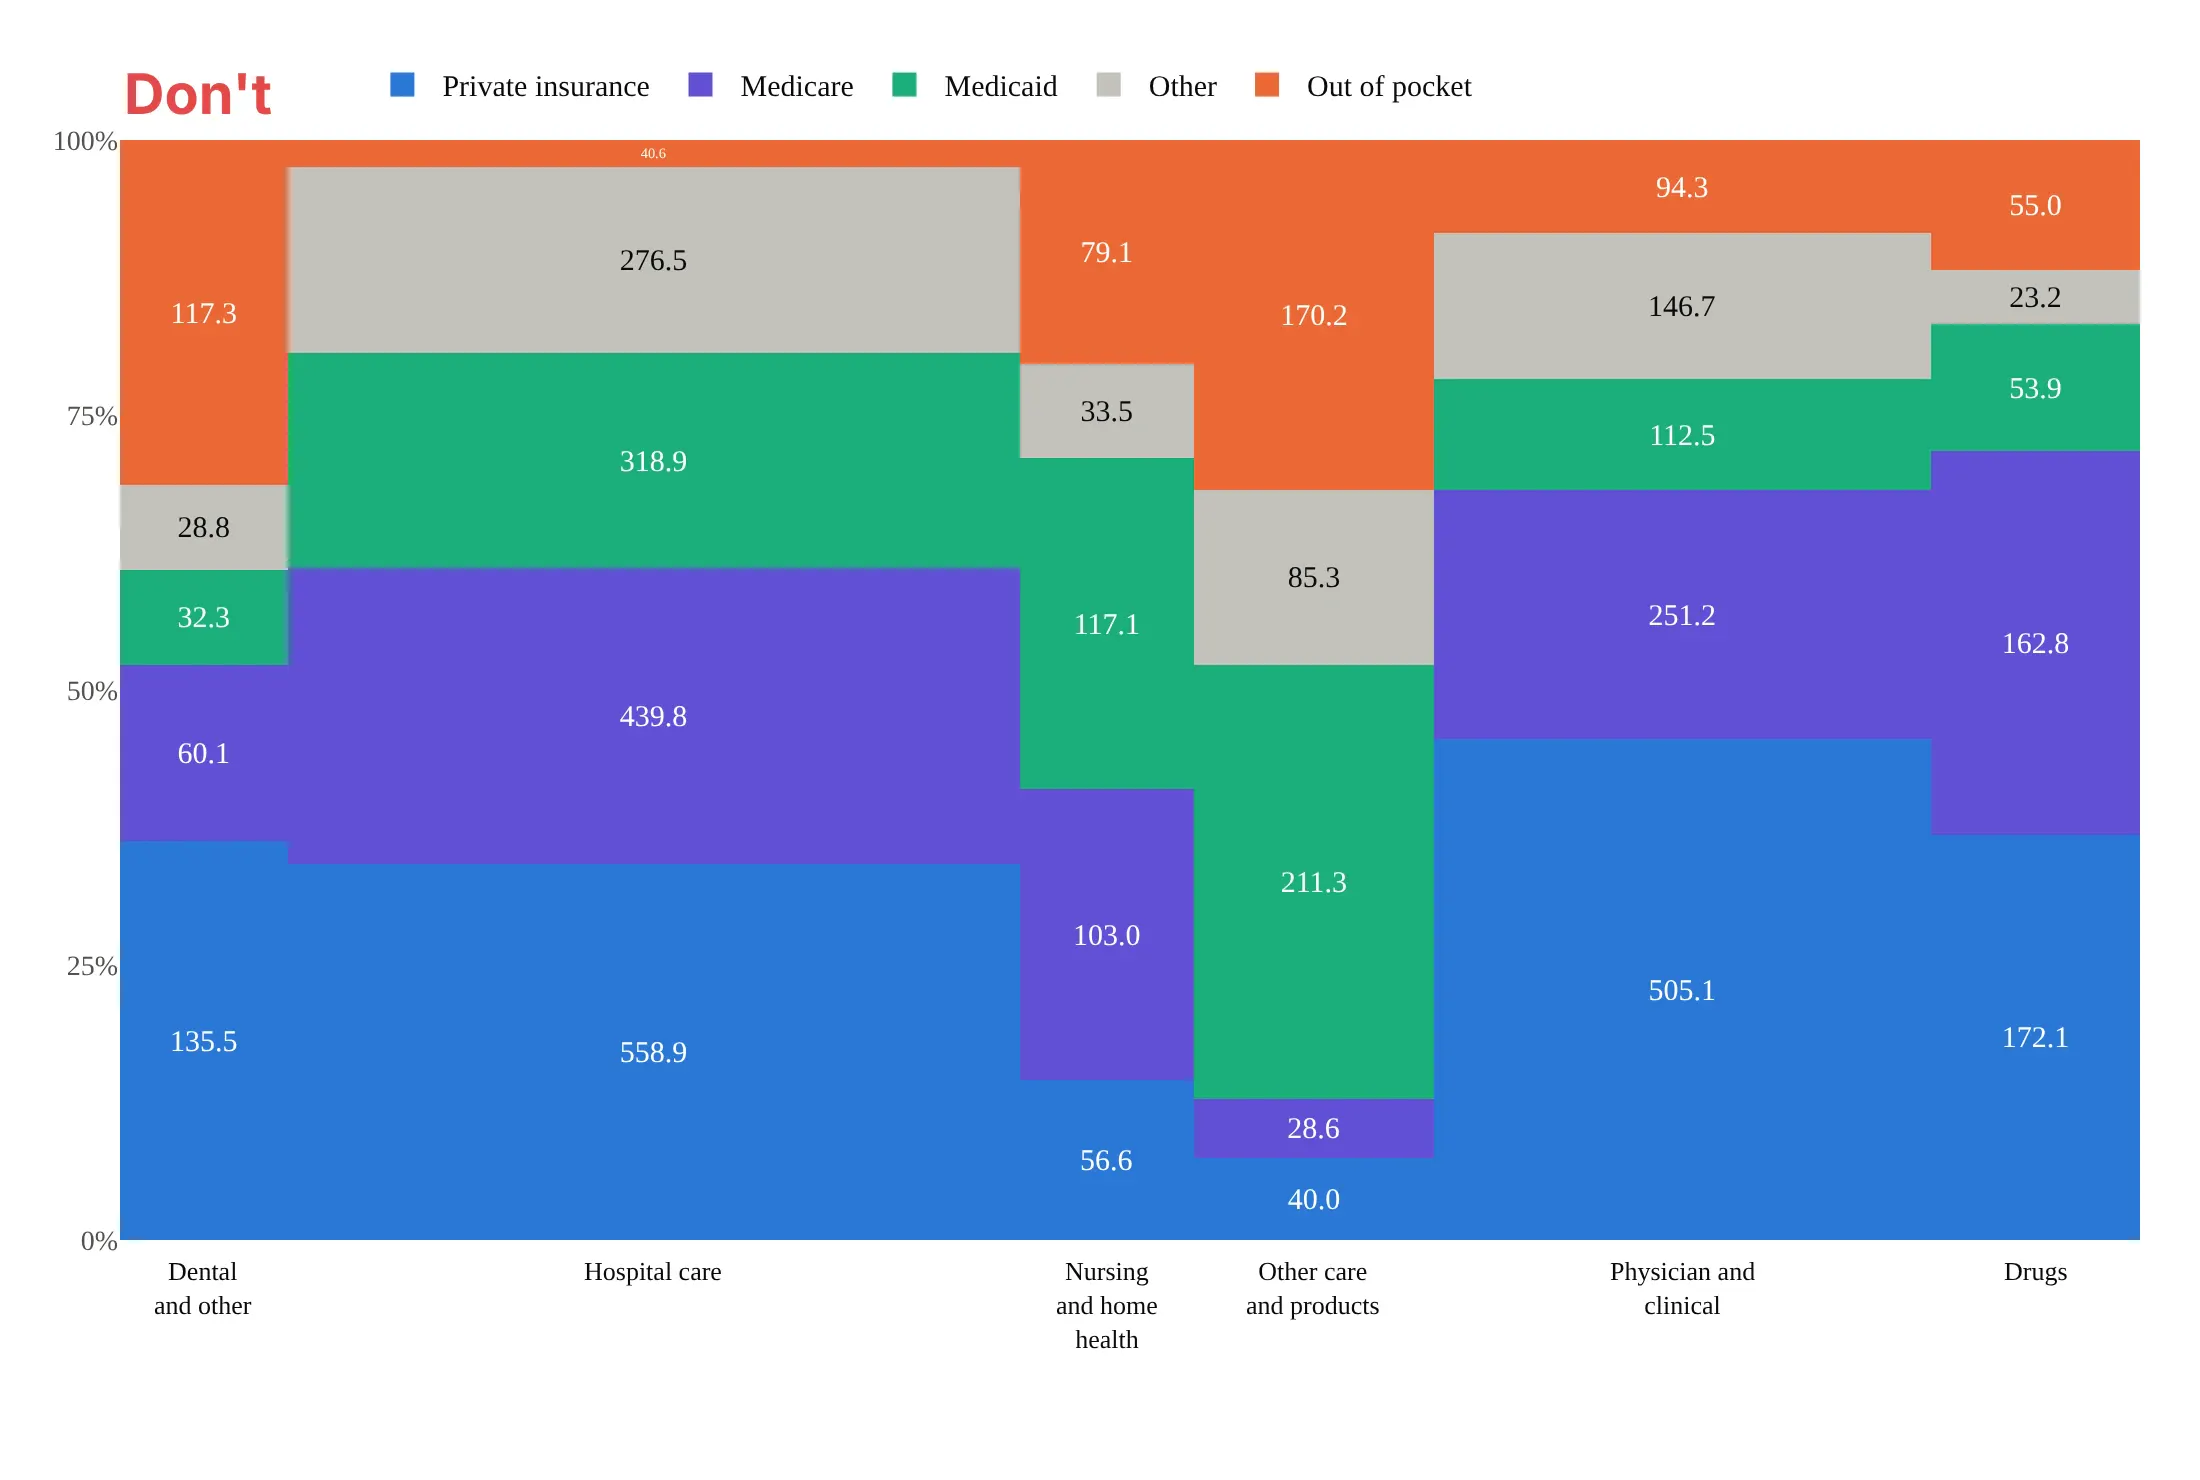
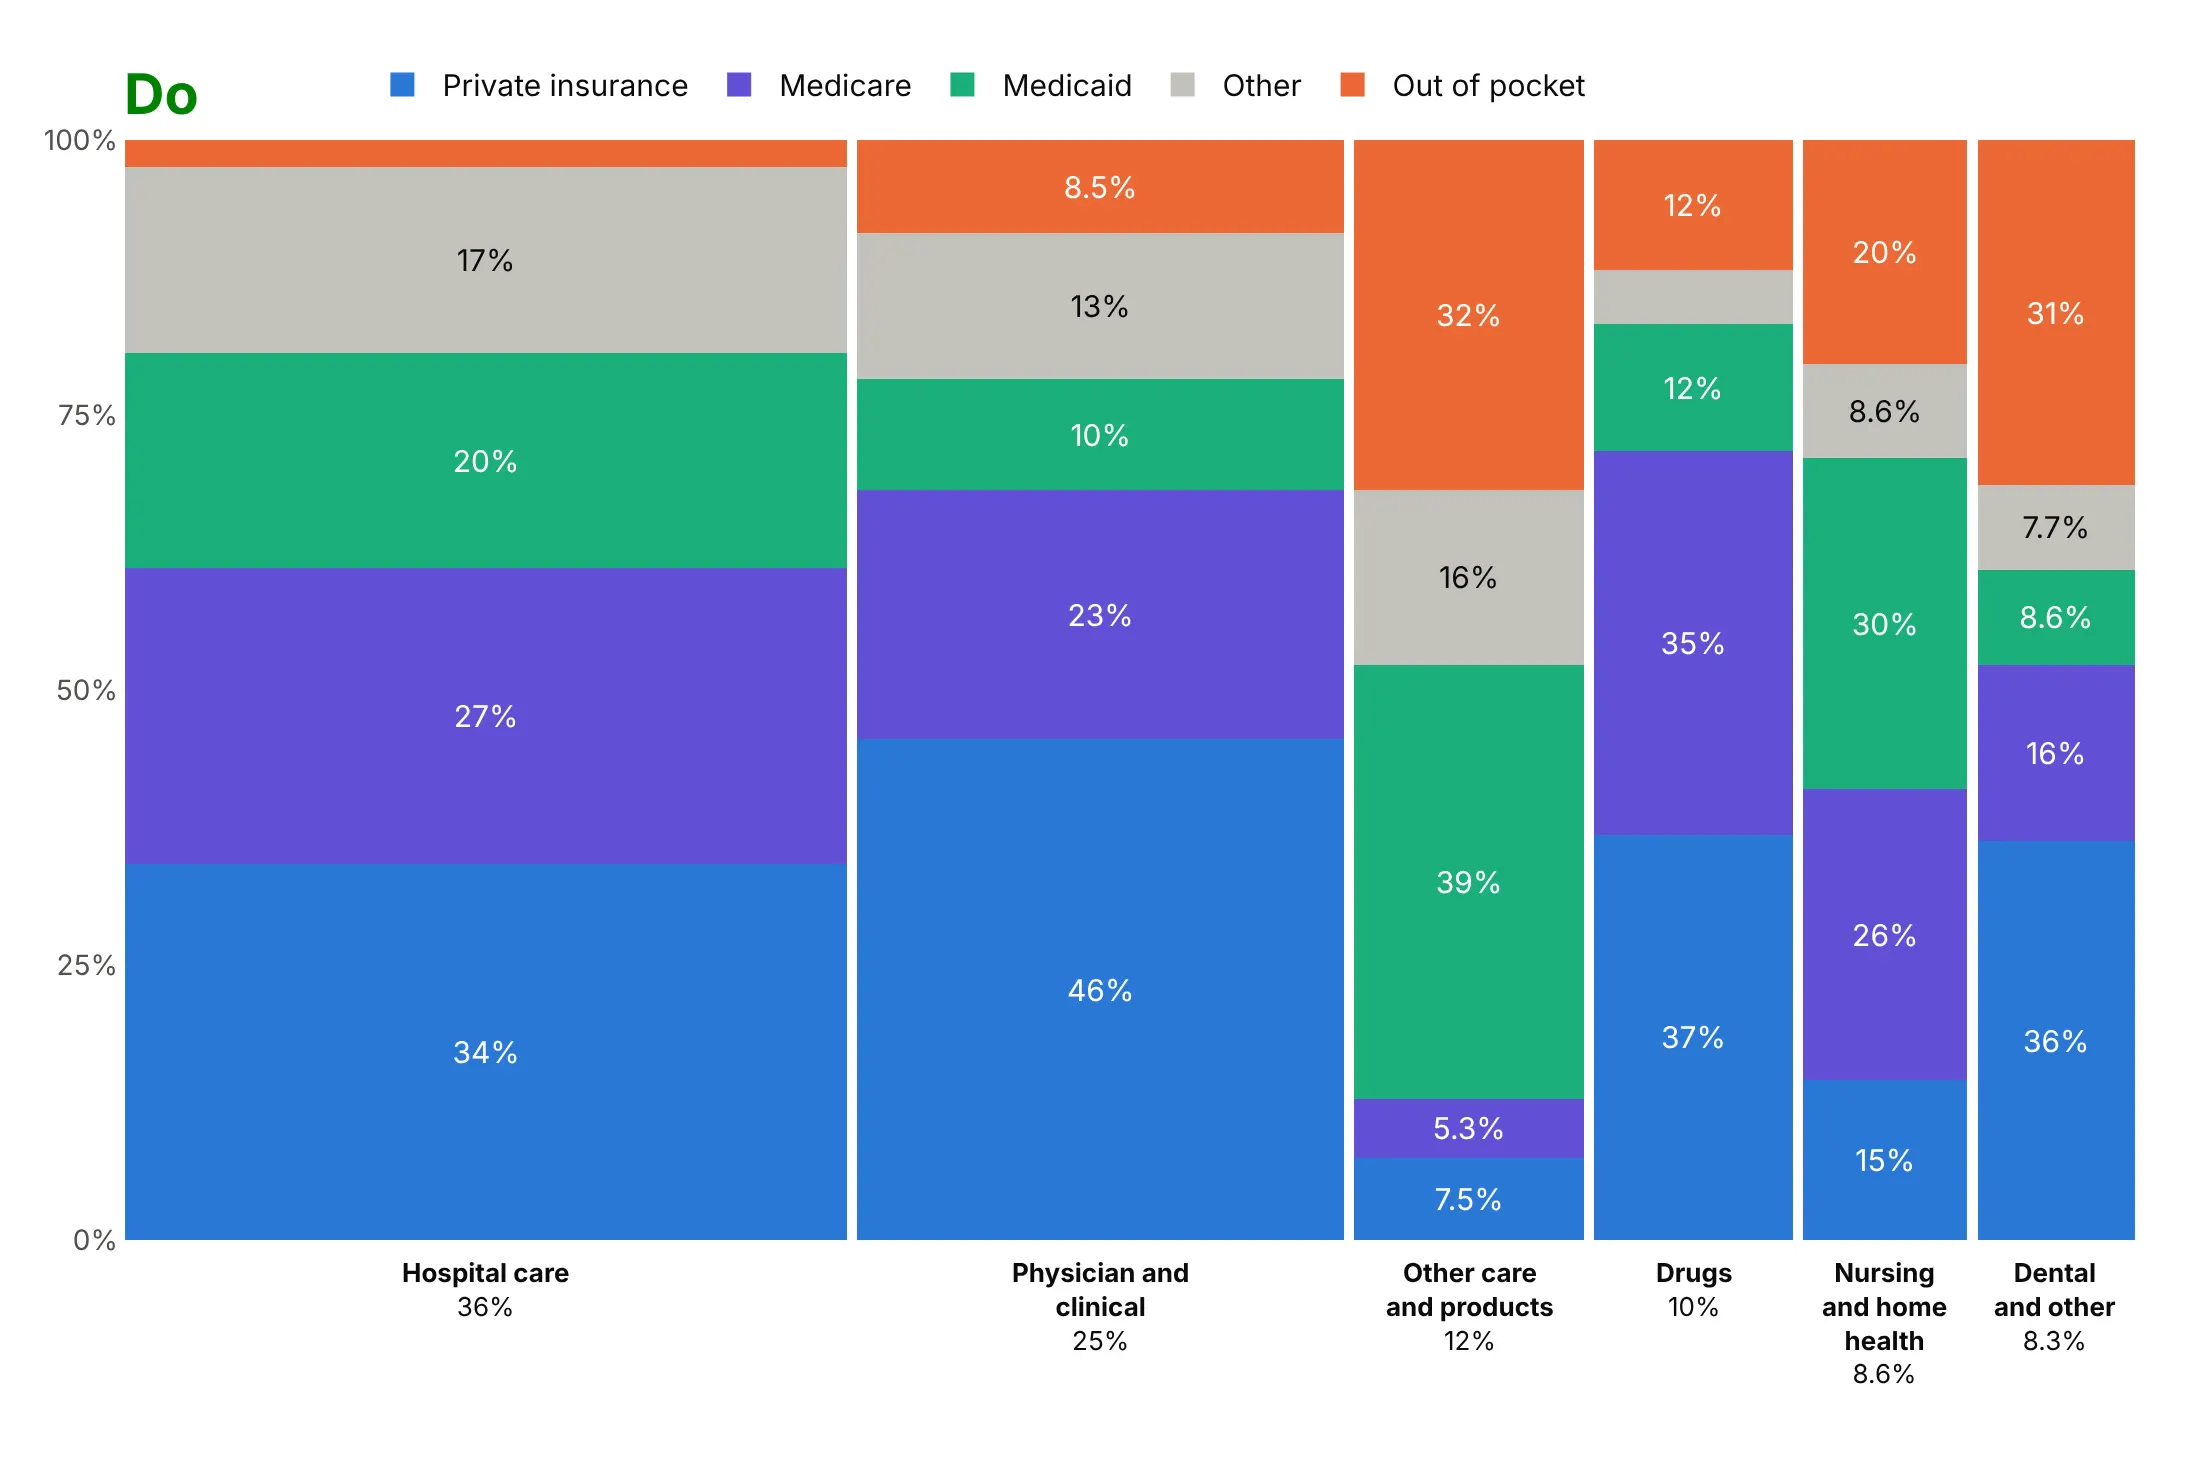
Most of the work in a Marimekko chart is in the order of the bars and segments, the gaps and the colors. Here is the same health spending table both ways.
Don't sort the bars alphabetically, drop the gaps (so segments of the same color run together across bars), force raw numbers with no unit onto every segment, or leave out the width shares that are the point of the chart:
Do use the same colors with the bars sorted by width, small gaps, each bar's share under it, and shares on the segments only where they fit:
Use color for one story
Width and height already carry two numbers, so color decides what the reader sees first. Here are four options on the same data.
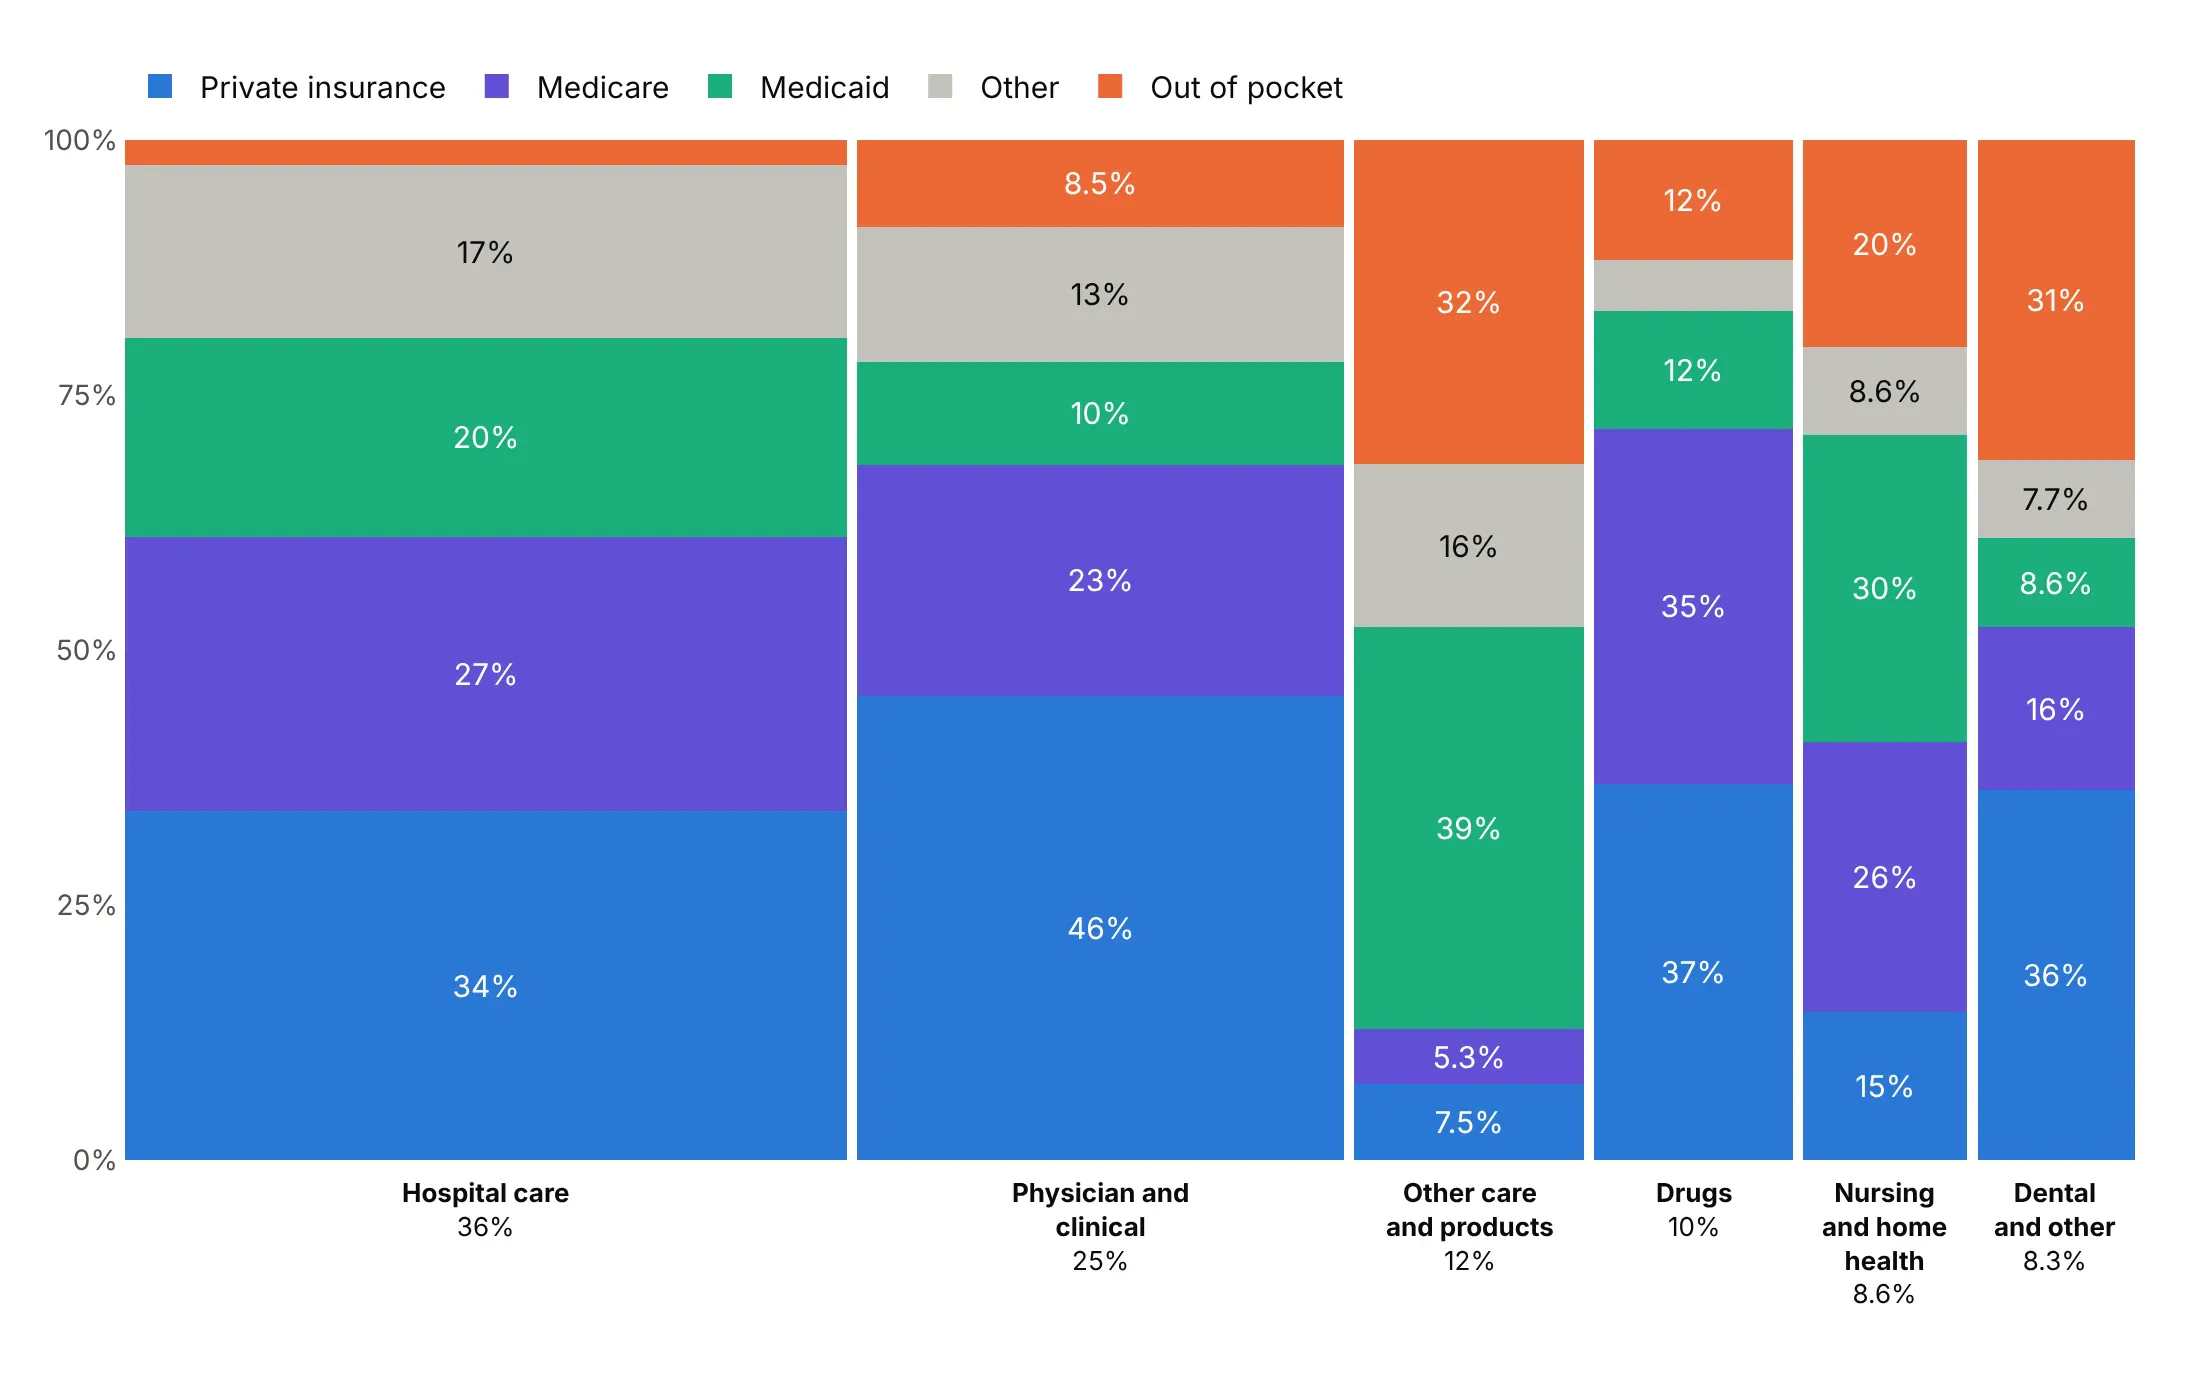
One color per payer. A good default when the whole mix is the story.
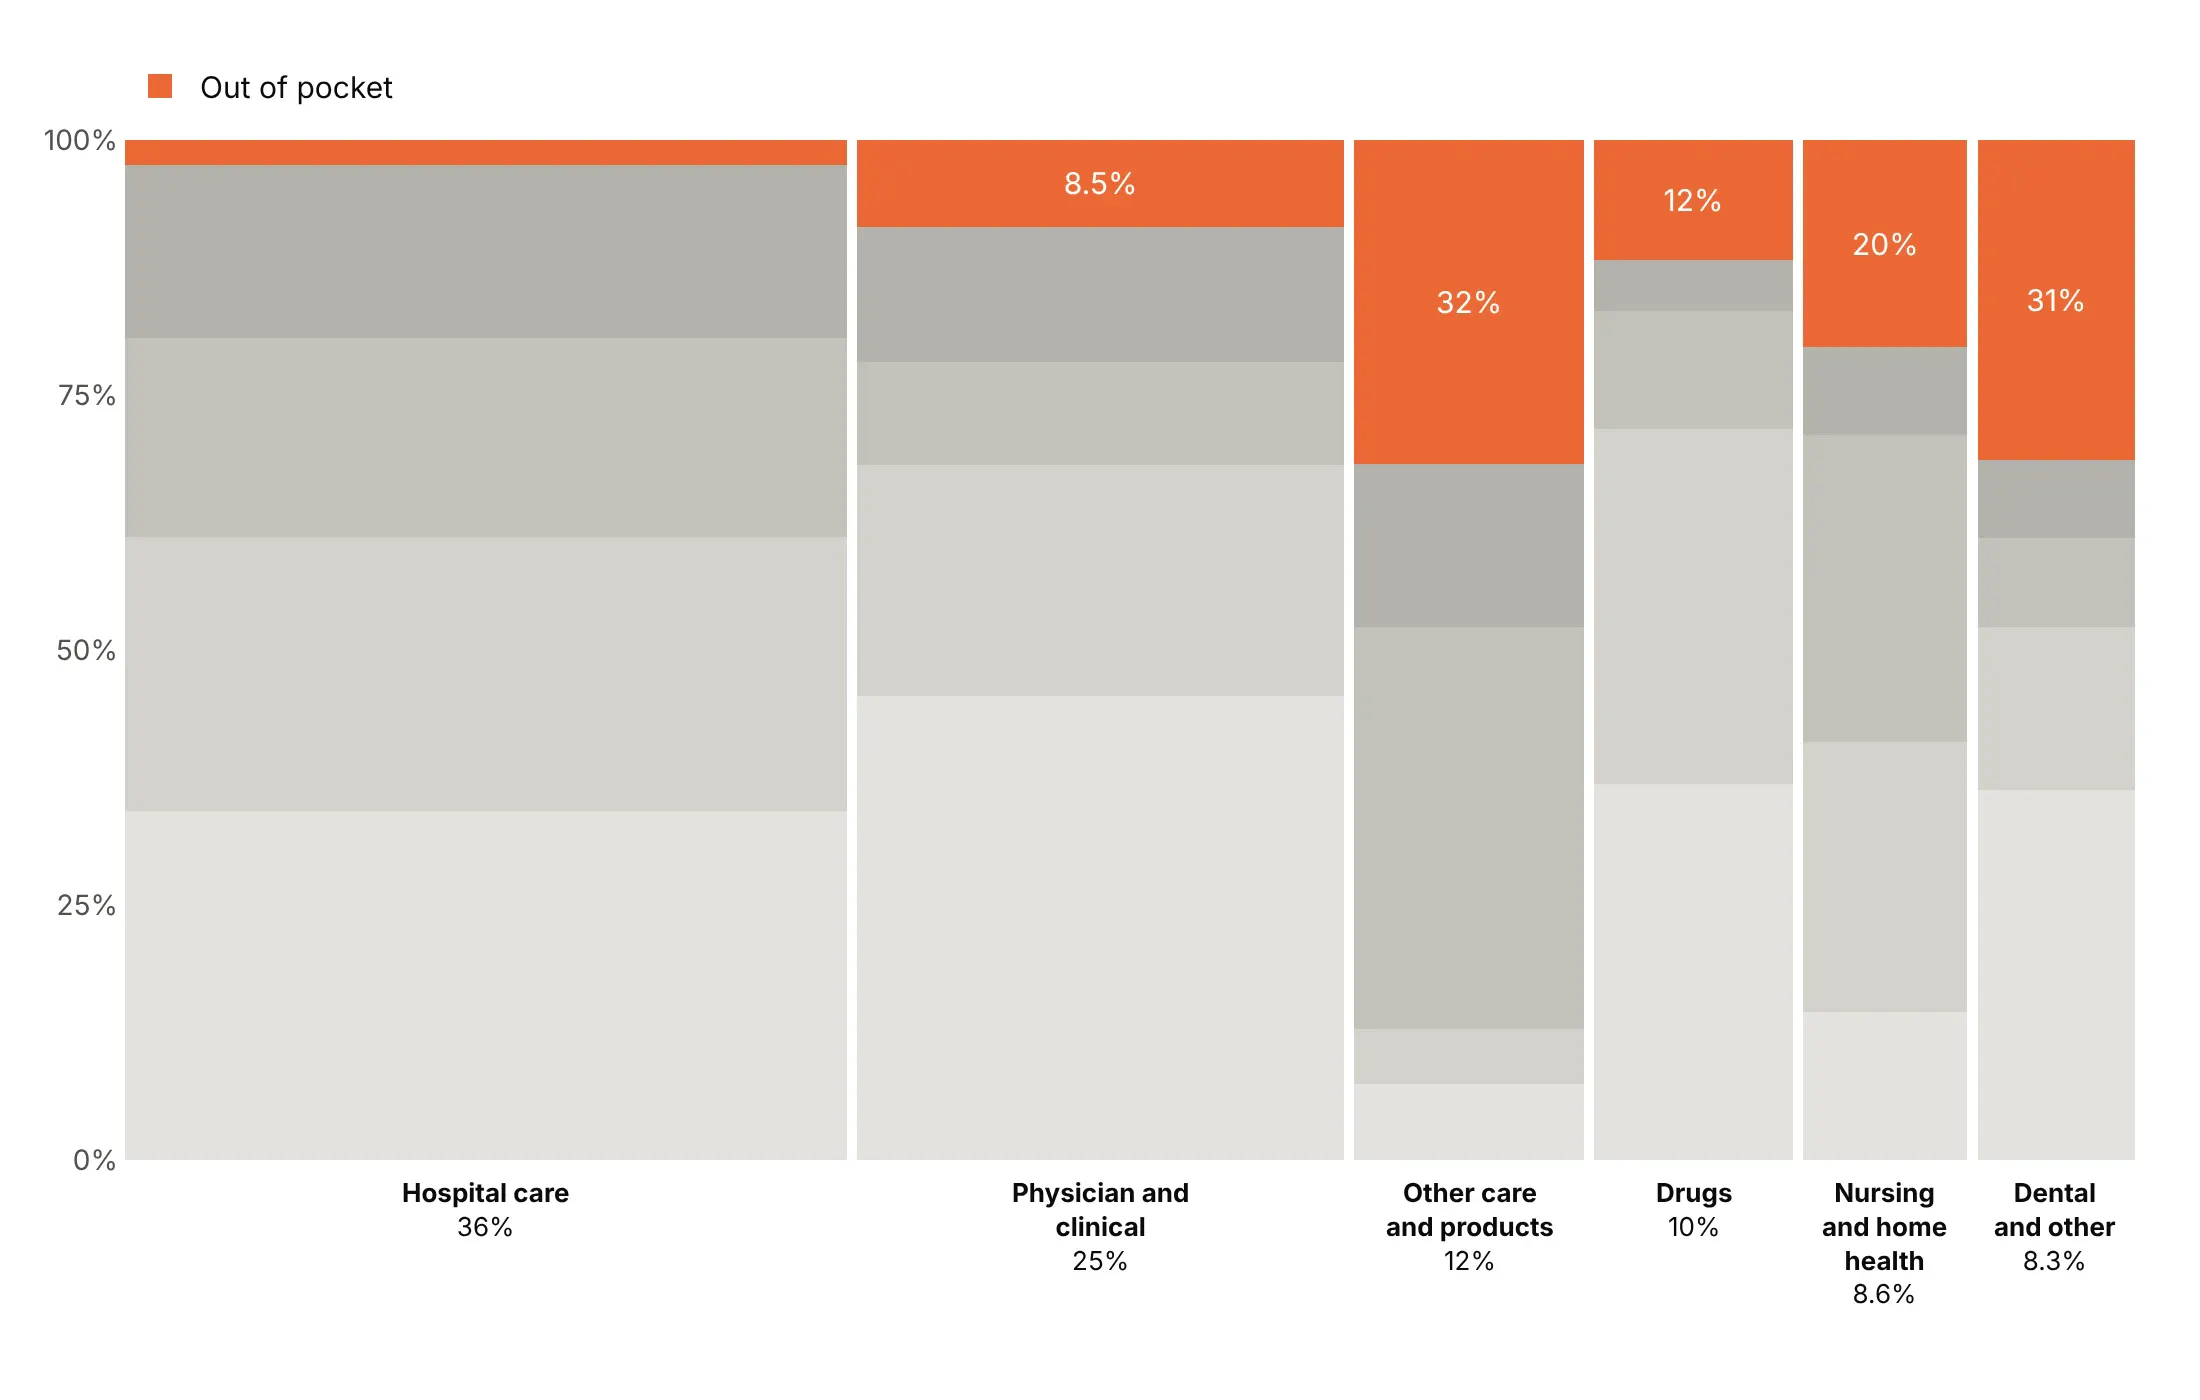
Highlight one payer. Out of pocket is the only color and everything else is gray, so the chart is about what patients pay.
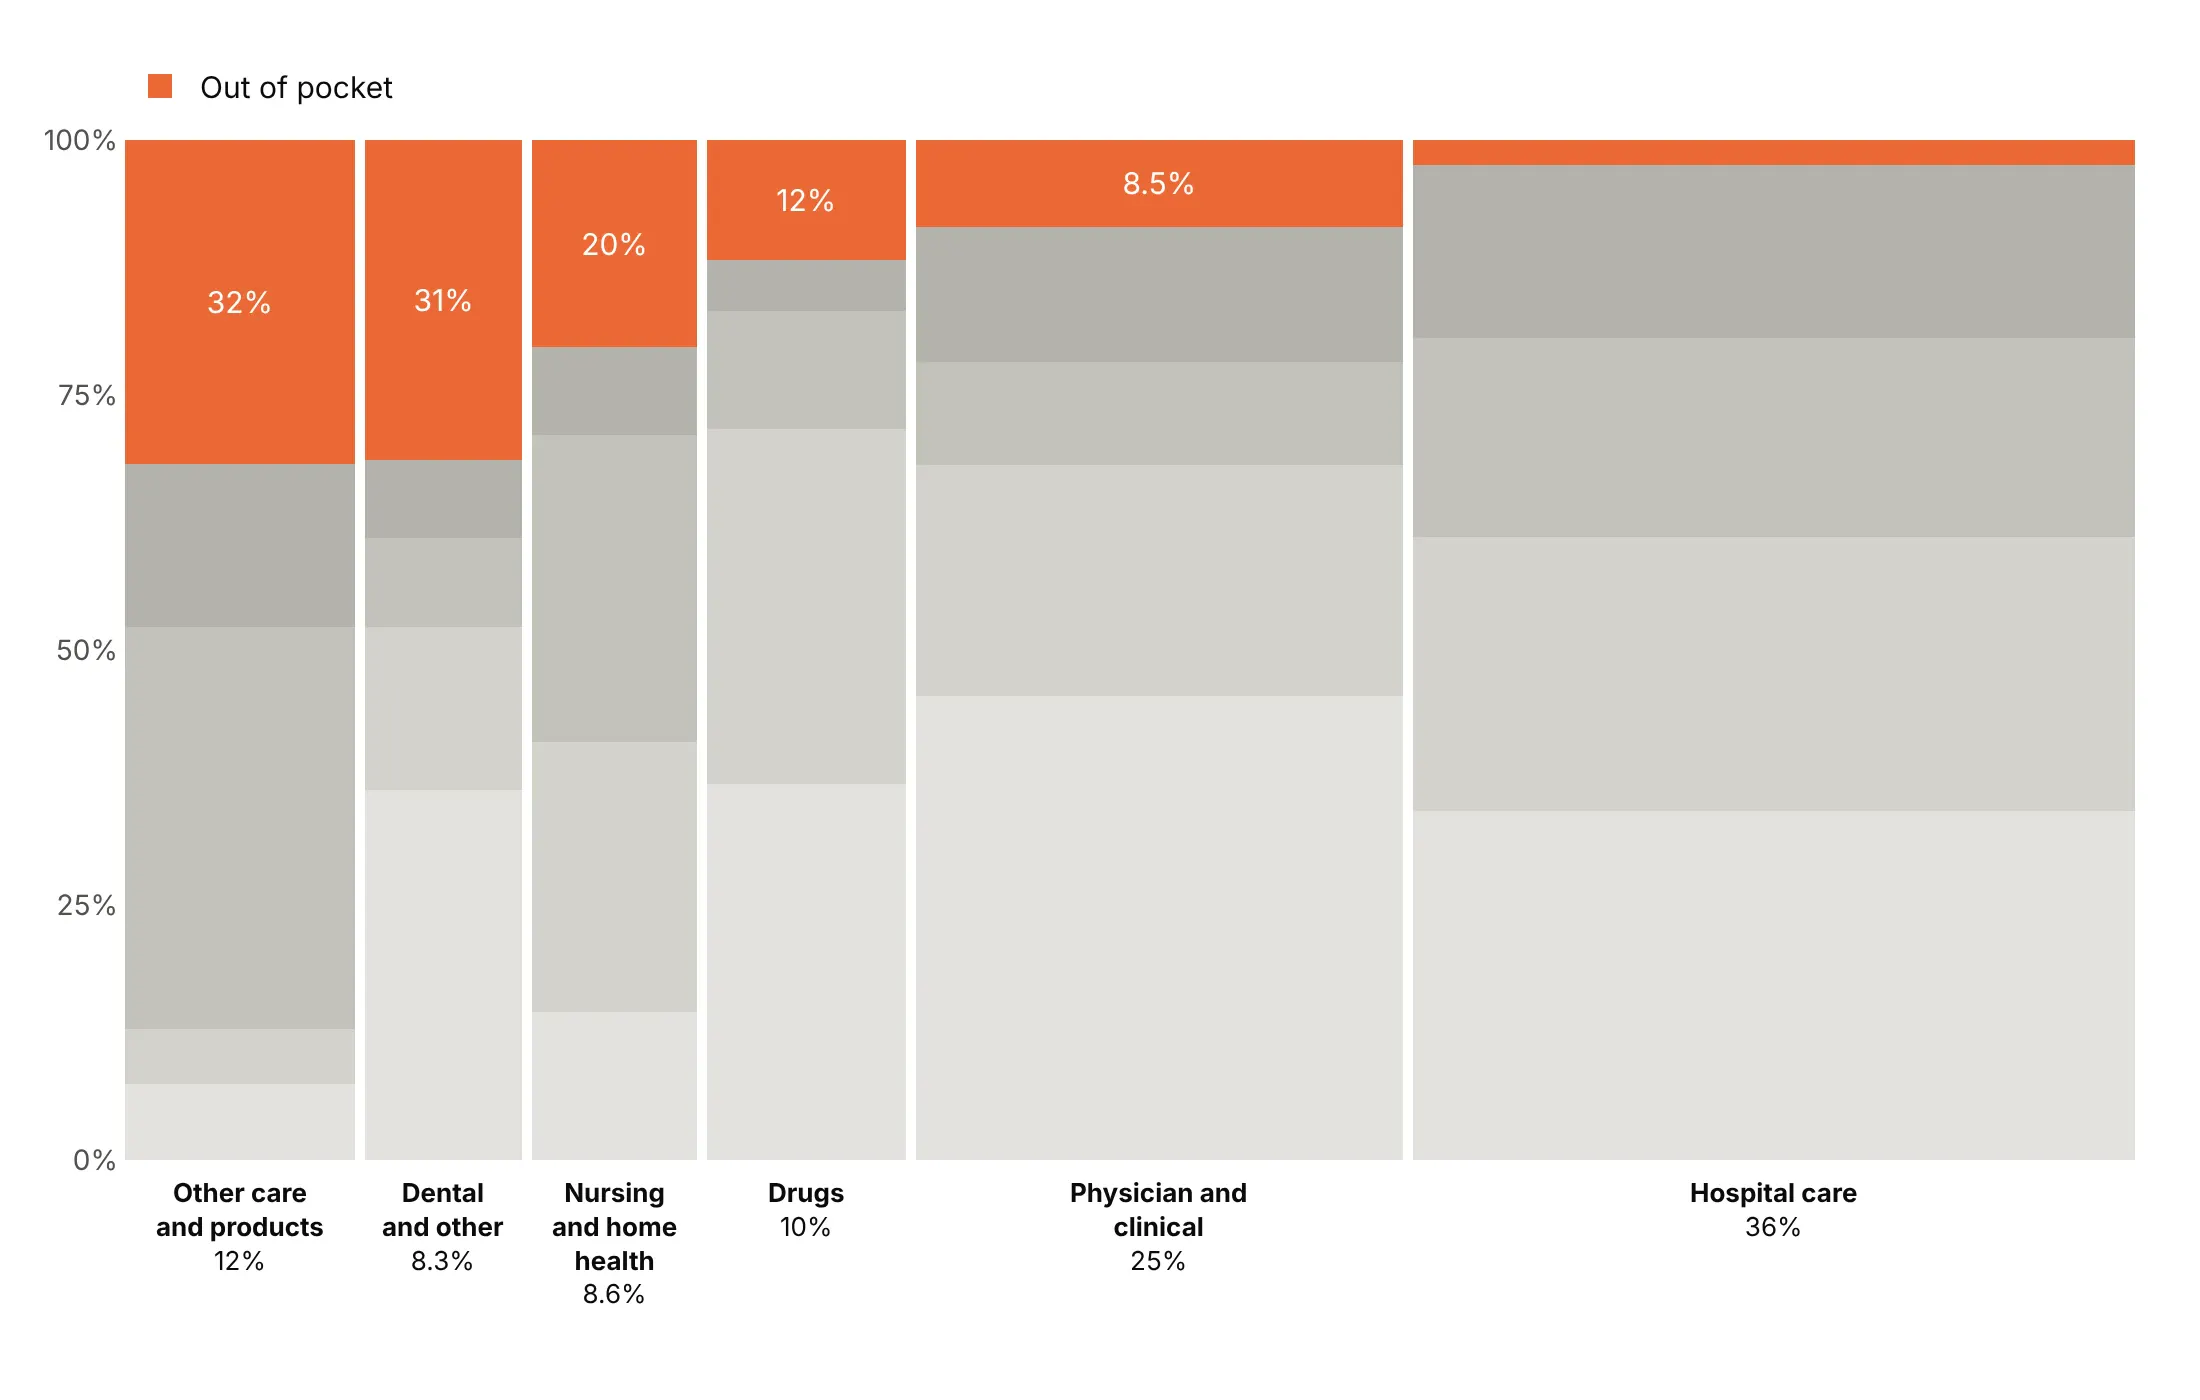
Sort by the highlighted share. Ordering the bars by out-of-pocket share turns the chart into a ranking, from 32% of other care to 2.5% of hospital care.
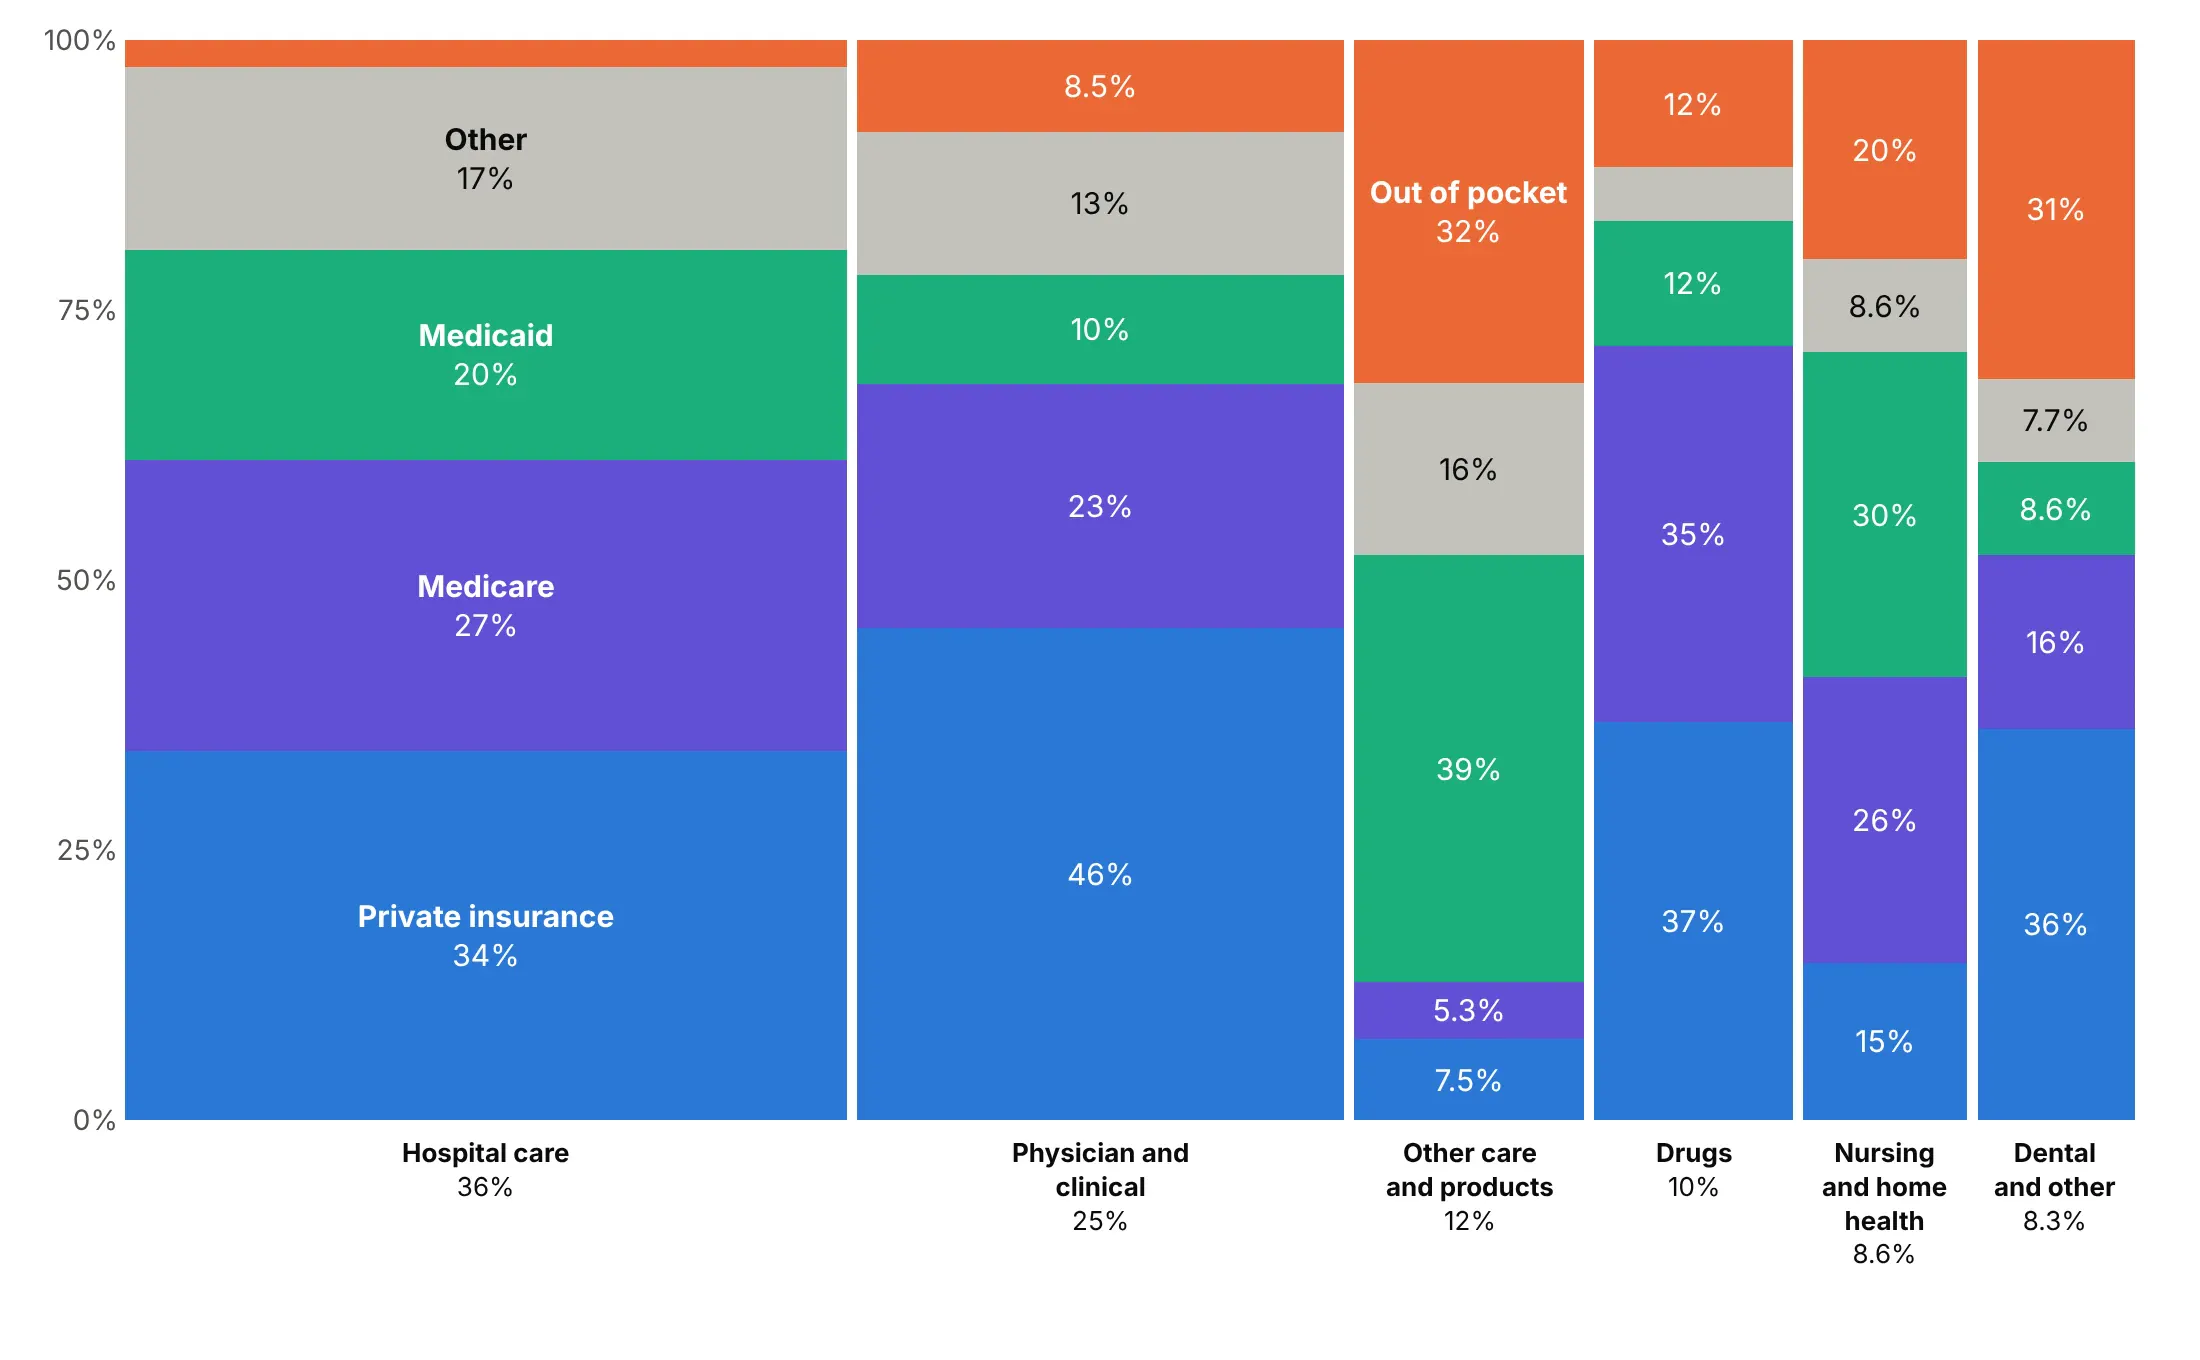
Label the segments directly. Writing the payer names on the widest bar replaces the legend, so readers don't look back and forth.
Checklist
Do
- Write a title with the takeaway and a number, and say in the subtitle what width and height mean.
- Sort the bars by width, or keep a natural order (phases, age bands, wealth groups).
- Keep one segment order and one color per category in every bar, with the segment the story is about at the bottom or the top.
- Leave small gaps between bars (about 0.5% of the width) instead of borders.
- Label the bars under the axis, turning narrow labels vertical, and label segments only where they fit.
- Fold the tail of small bars into one "Other" bar at the end.
Don't
- Sort the bars alphabetically or let the segment order change from bar to bar.
- Use a rainbow for unordered categories, or more than about eight segment colors.
- Let bars get thinner than about 1% of the width.
- Print absolute values on segments without the shares.
- Rely on hover in a static image.
Options to customize
These are the go.Bar and layout options that build a Marimekko chart. The full list is in the Plotly bar chart documentation.
- x: each bar's left edge, the running sum of the widths before it. Use with offset=0.
- width: each bar's width in x units (its share of the total). Subtract a small gap.
- offset: shift of the bar from x; 0 starts the bar at x instead of centering it.
- y: segment height, the share within the bar.
- layout.barmode: "stack" piles the traces into one bar.
- layout.barnorm: "fraction" or "percent" normalizes each stack, when you pass raw values instead of shares.
- layout.bargap: set to 0 and control the gaps through width.
- marker.color: one fixed color per sub-category, or grays plus one highlight.
- text, texttemplate: segment labels, usually the share.
- insidetextanchor, textangle: center the labels and keep them horizontal.
- layout.uniformtext: a minimum font size; mode="hide" drops labels that don't fit.
- customdata, hovertemplate: absolute values and both shares in the hover.
- xaxis.tickvals, ticktext: bar names and width shares at the bar centers.
- layout.annotations: free text, such as vertical labels for bars under about 4% wide.
- layout.legend.traceorder: "normal" keeps the legend in the segment order.
- xaxis.range, yaxis.range, tickformat: [0, 1] and ".0%".
More Marimekko chart examples
Ten more Marimekko charts built from real public data, each with its source, the technique that makes it work and a prompt to rebuild it.
1. US energy by sector and fuel
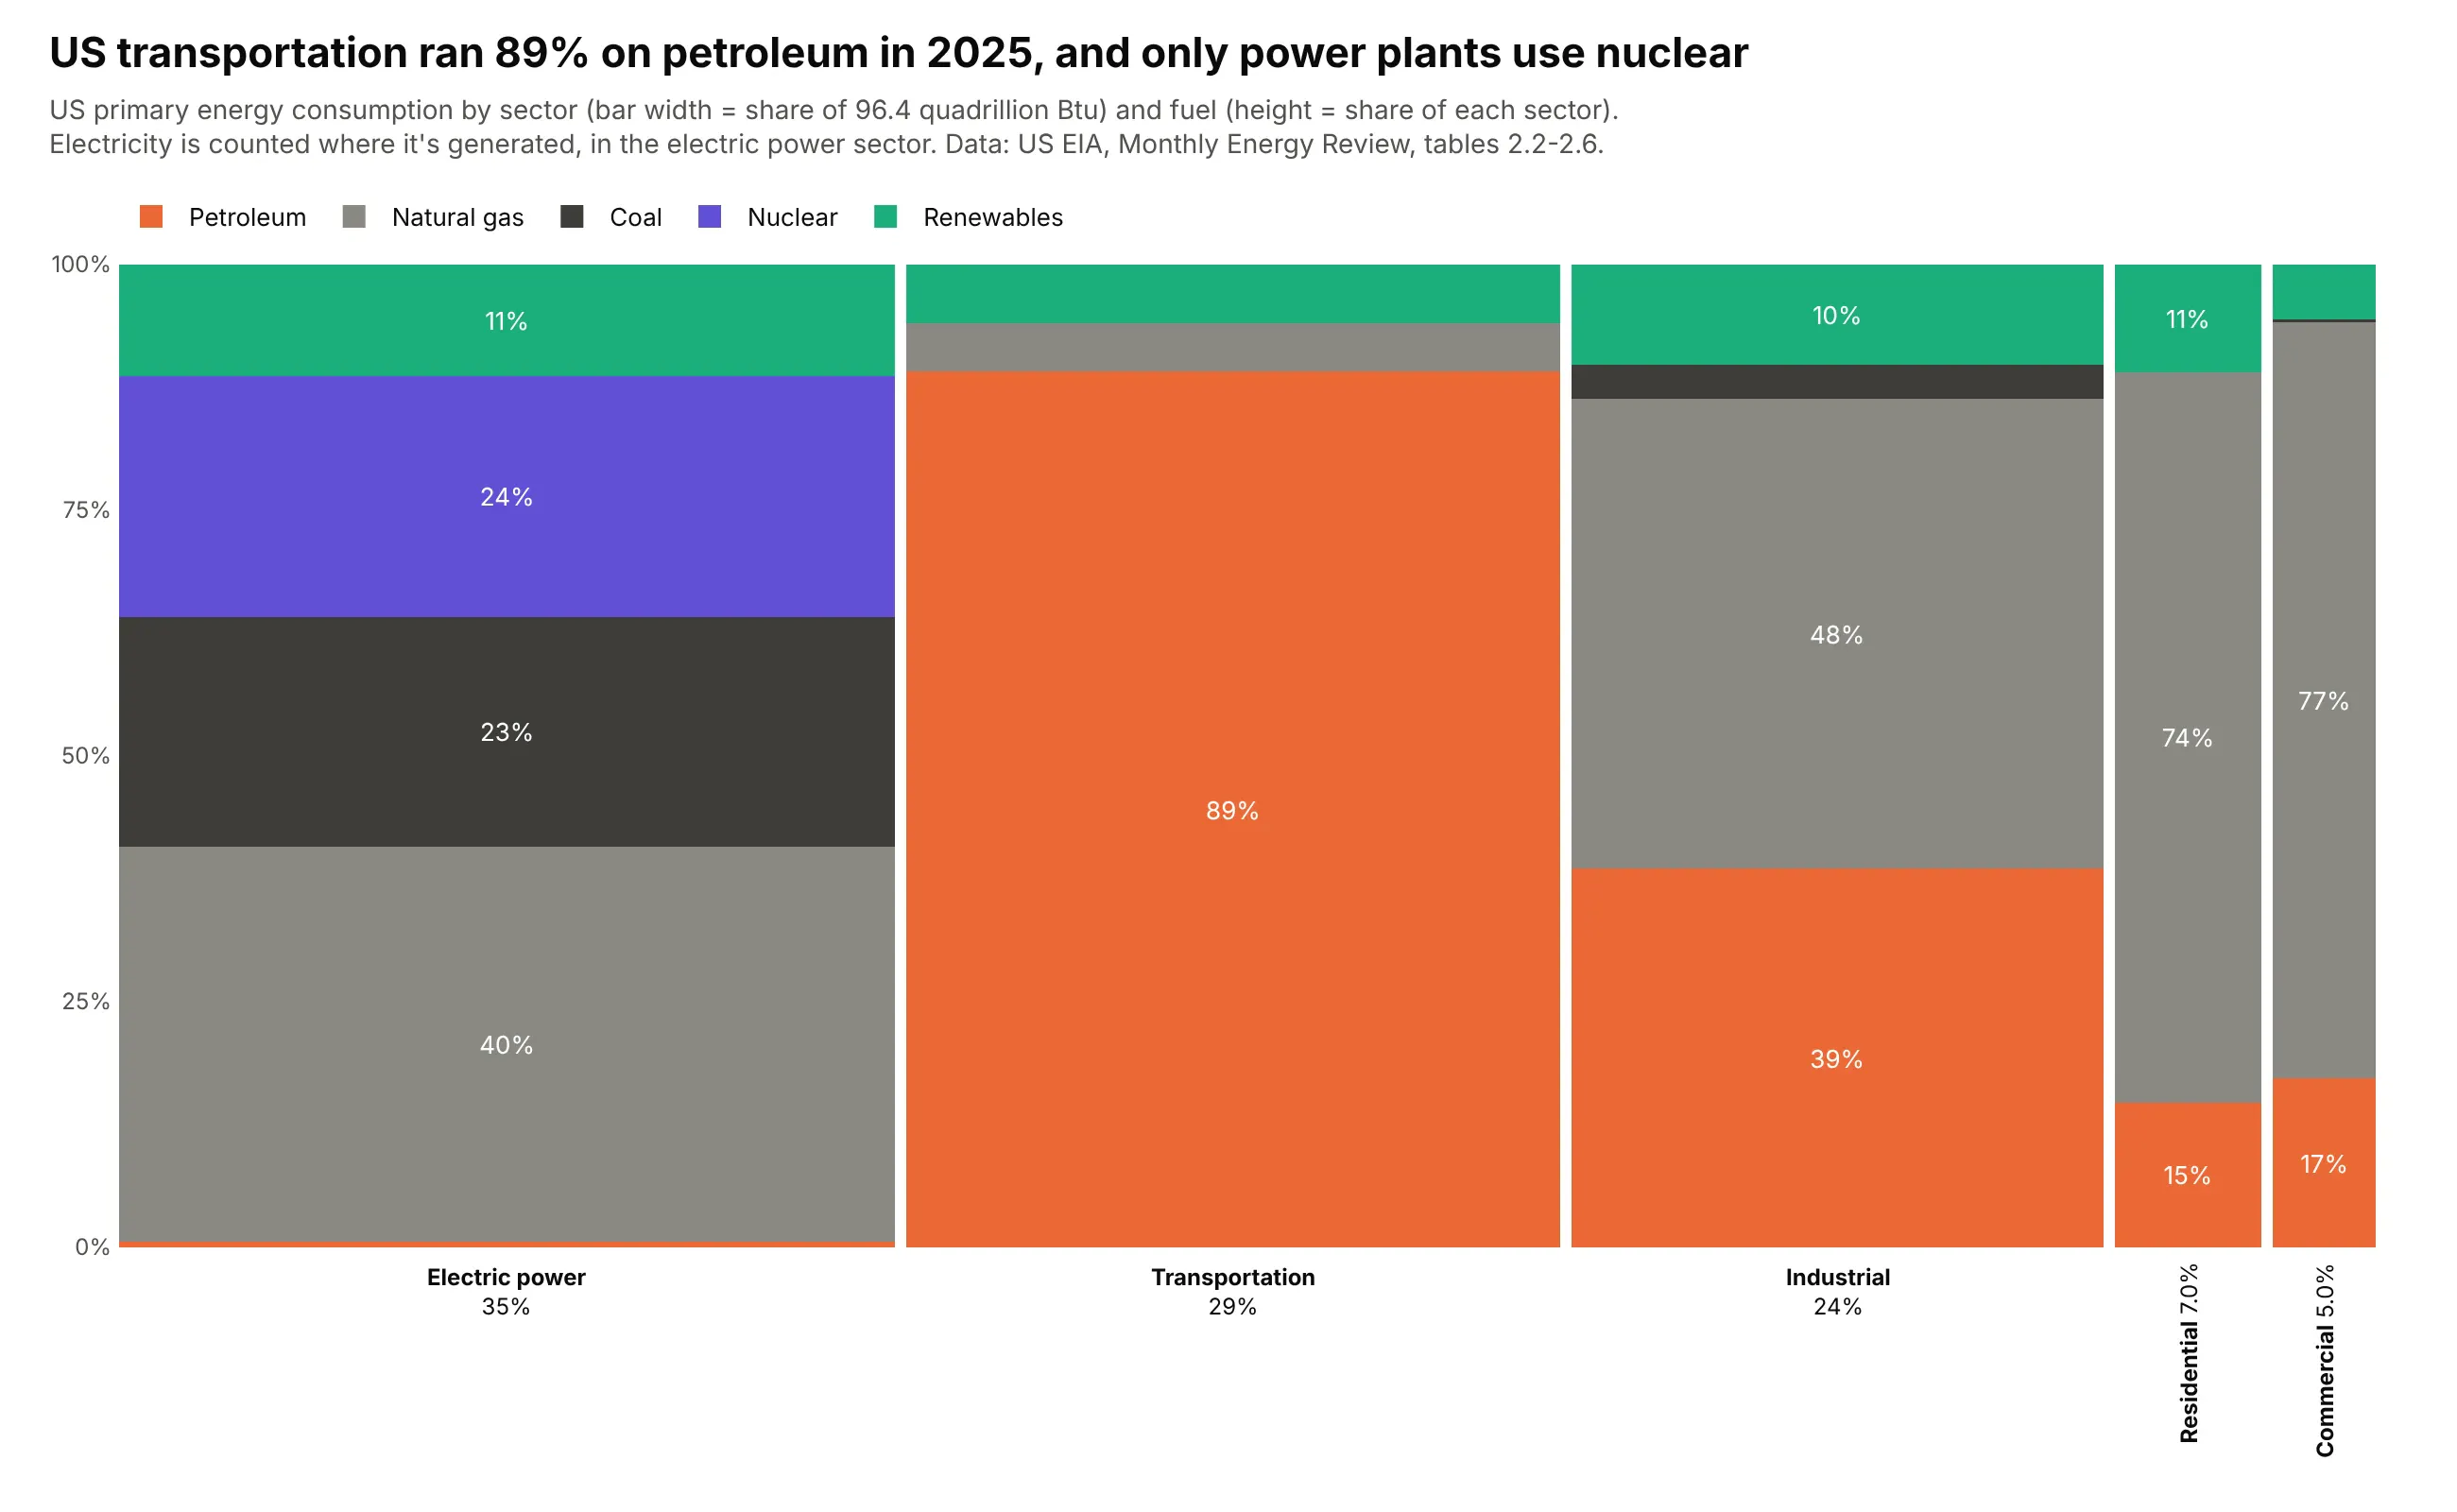
The US used 96.4 quadrillion Btu of primary energy in 2025. Transportation is 29% of it and runs 89% on petroleum, while the electric power sector, the widest bar at 35%, is the only one that uses nuclear (24% of its energy). Data: US EIA, Monthly Energy Review, tables 2.2 to 2.6.
Tip: keep the sectors in a meaningful order and count electricity once, where it's generated, so the widths add up to primary energy.
Get the data from the US EIA Monthly Energy Review, tables 2.2-2.6 (eia.gov/totalenergy), annual 2025,primary energy consumed by sector and fuel, and shape it into a table(columns: year, sector, fuel, tbtu; sectors residential, commercial, industrial, transportation,electric power; fuels coal, natural gas, petroleum, nuclear, renewables).Build a plotly Marimekko chart with sectors as bars and fuels as segments.- Petroleum orange, gas and coal grays, nuclear purple, renewables green.- Title with transportation's petroleum share; subtitle says electricity is counted where generated.
2. Fossil CO2 by country and fuel
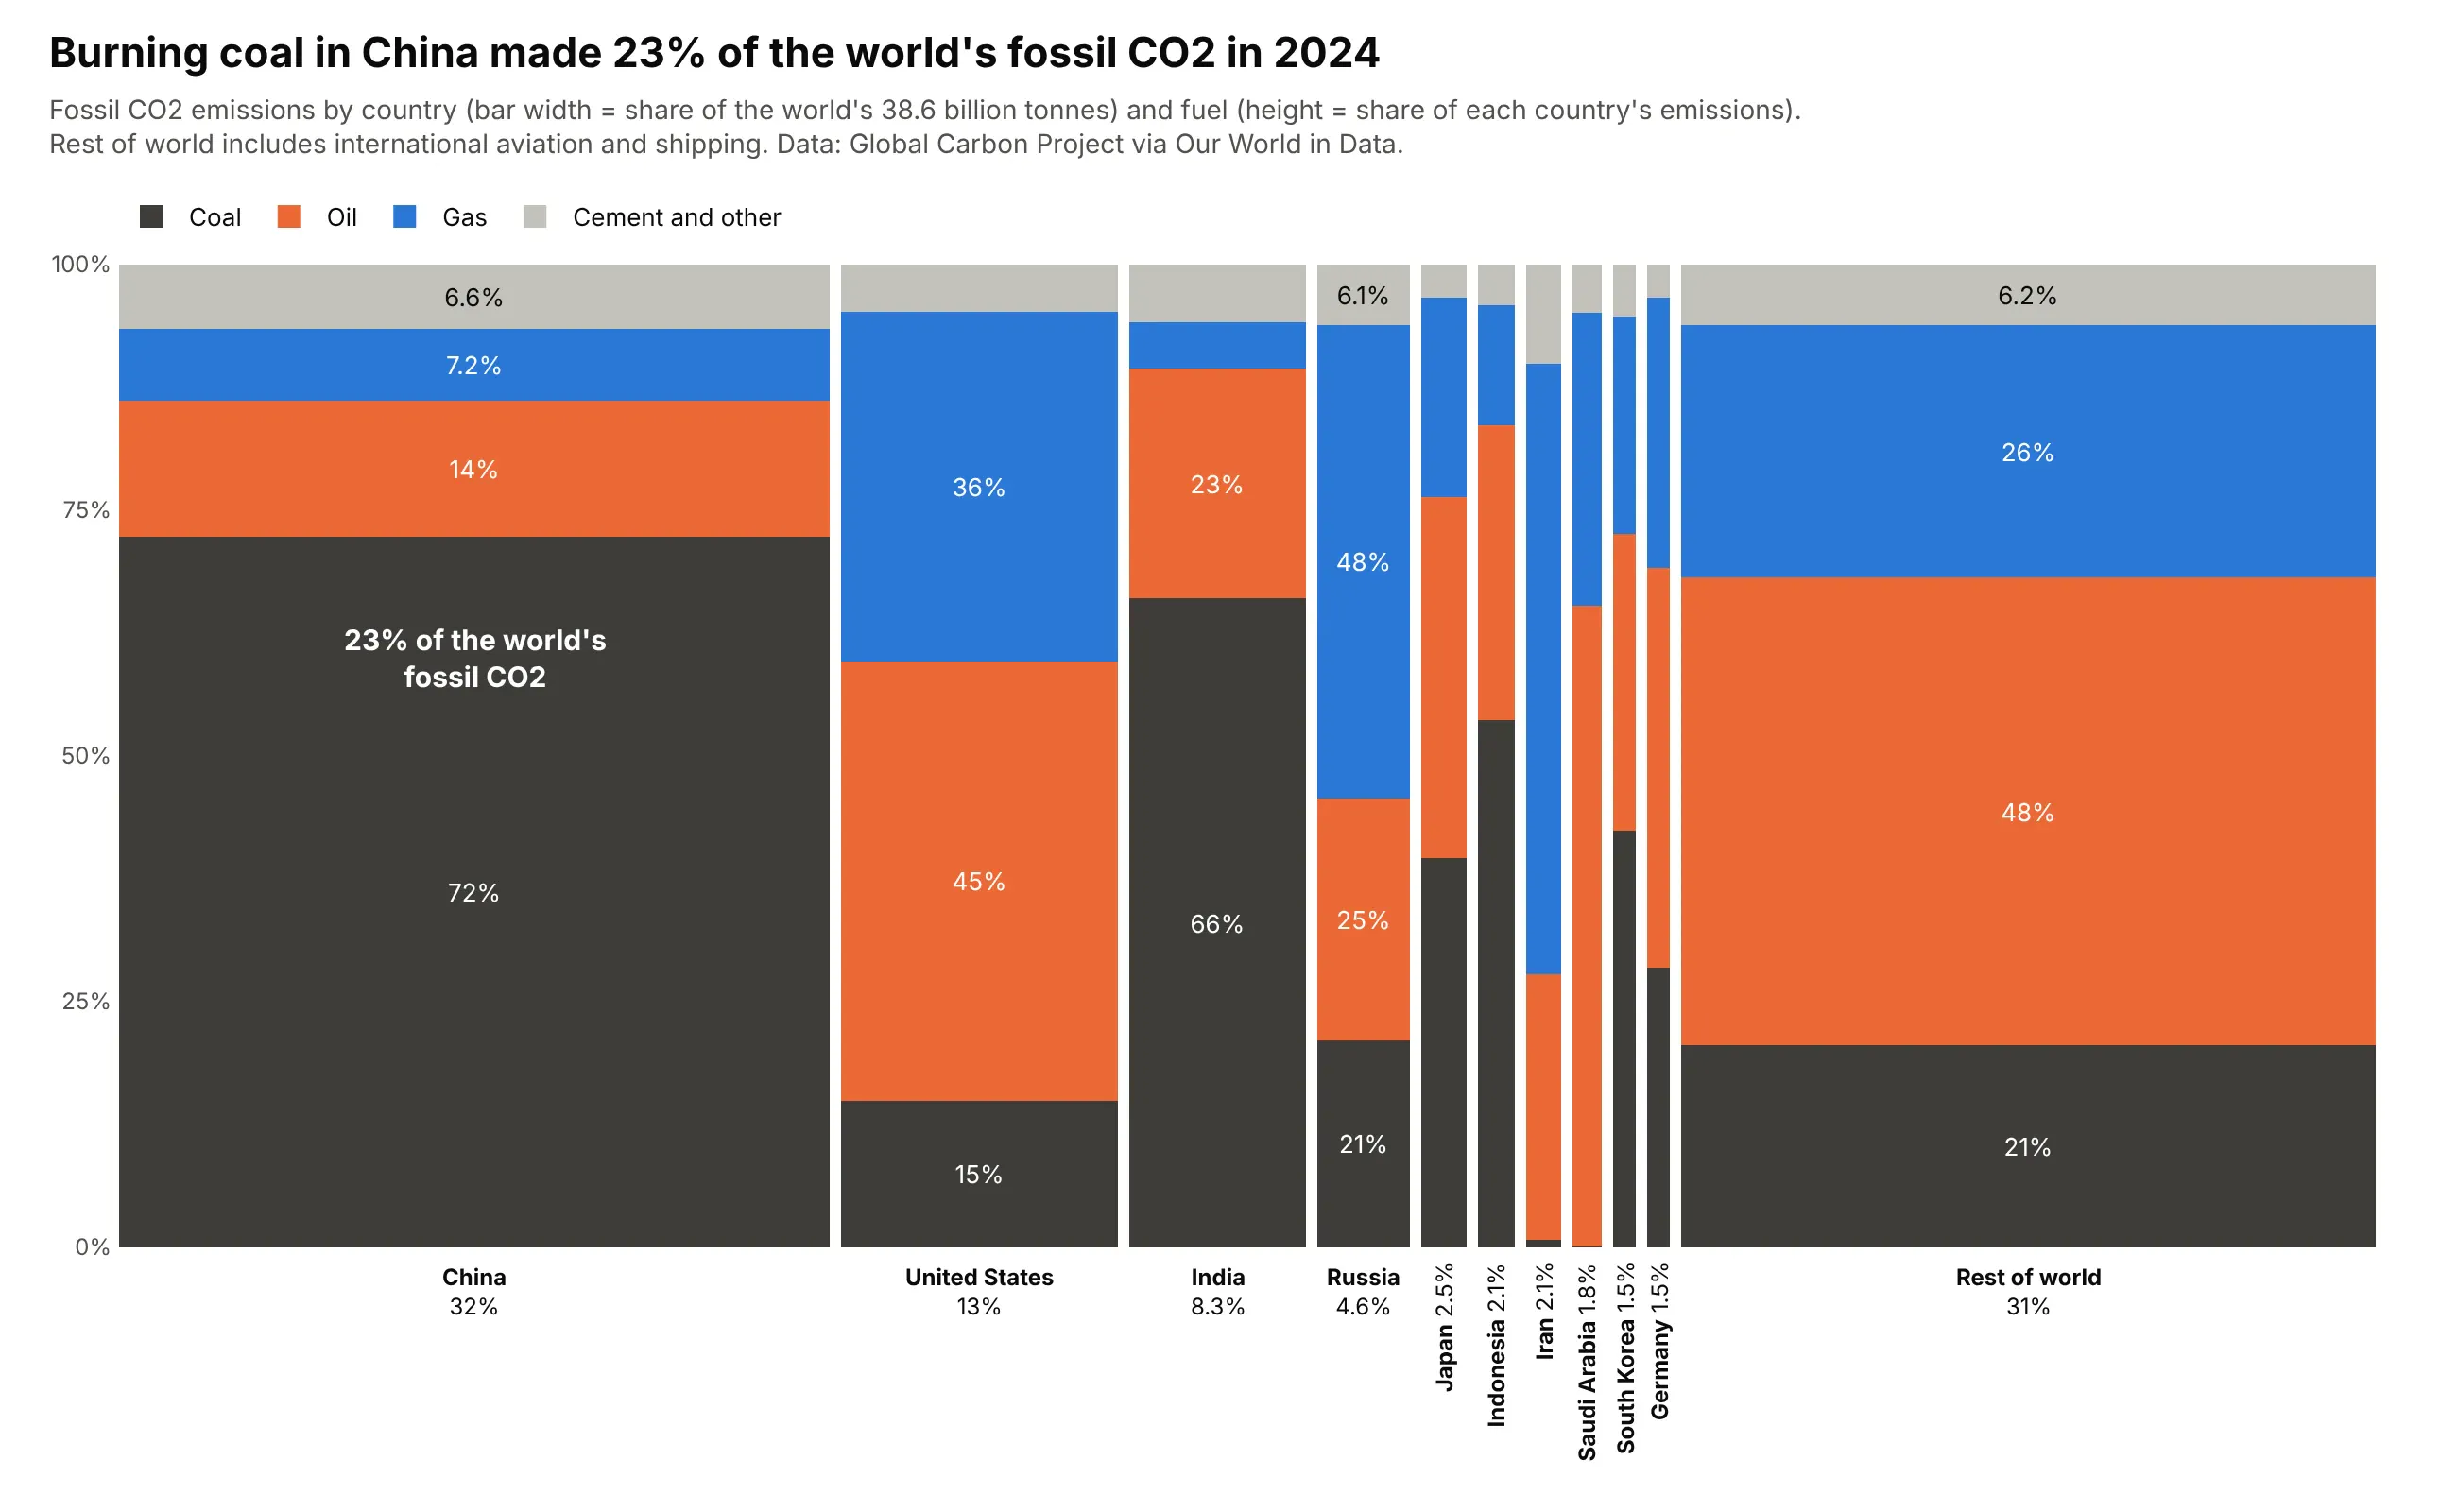
The world emitted 38.6 billion tonnes of fossil CO2 in 2024. China is 32% of the width and 72% of its emissions come from coal, so coal burned in China is 23% of the global total, written on the segment itself. Data: Global Carbon Project via Our World in Data, 2024.
Tip: when one segment is the story, write its share of the whole chart (width times height) on it.
Get the data from the Global Carbon Project via Our World in Data's CO2 dataset (github.com/owid/co2-data), 2024and shape it into a table(columns: year, country, fuel, mt; fuels coal, oil, gas, cement and other; the 10 largest emitters plus"Rest of world" = World minus them, including international aviation and shipping).Build a plotly Marimekko chart: countries as bars, fuels as segments, coal near-black at the bottom.- Annotate China's coal segment with its share of the world total.
3. US electricity by state and source
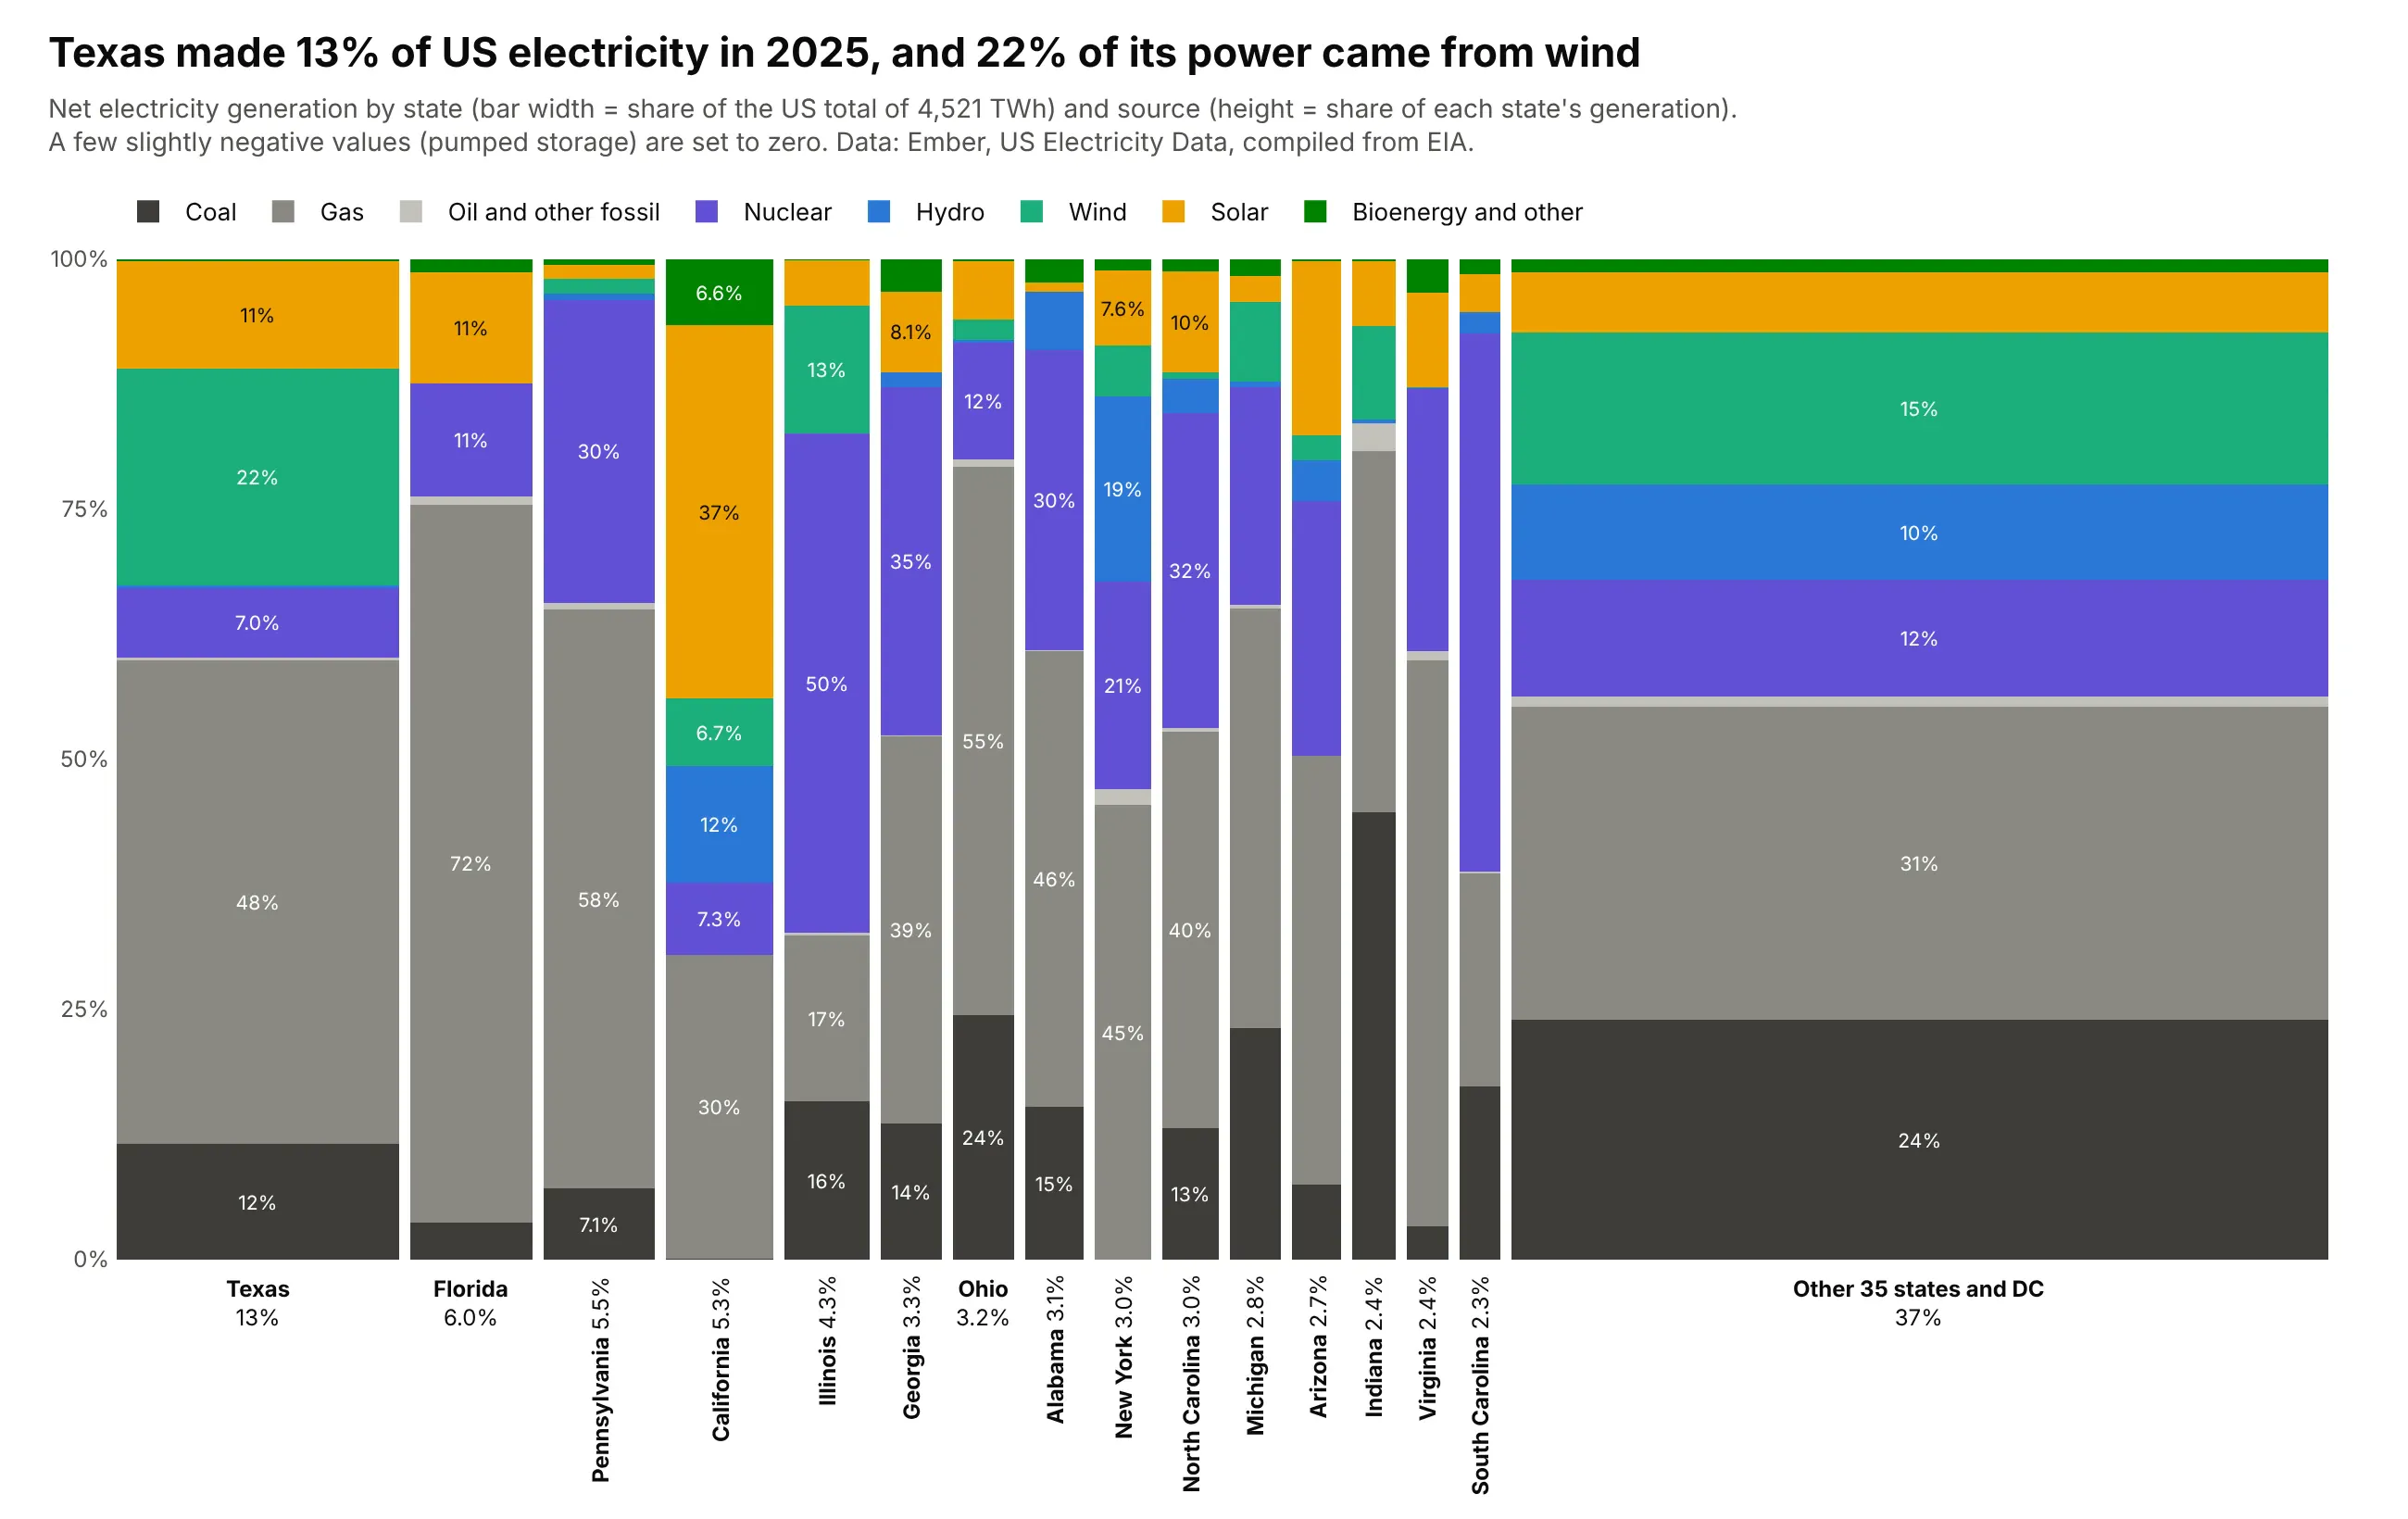
Texas made 13% of US electricity in 2025 and got 22% of its power from wind. The mixes differ a lot: California is 37% solar, Illinois 50% nuclear, Florida 72% gas. Data: Ember, US Electricity Data (compiled from EIA), 2025.
Tip: give the 15 largest states their own bars and fold the rest into one bar at the end, so nothing is too thin to label.
Get the data from Ember's US Electricity Data (ember-energy.org), yearly 2025, generation by state and fuel,and shape it into a table (columns: year, state, source, twh; 50 states and DC).Build a plotly Marimekko chart of states and sources, using the same source colors as a world chart.- Keep the 15 largest states; fold the others into "Other 35 states and DC", drawn last.- Set slightly negative net generation to zero and say so in the subtitle.
4. What the 12 largest US banks hold
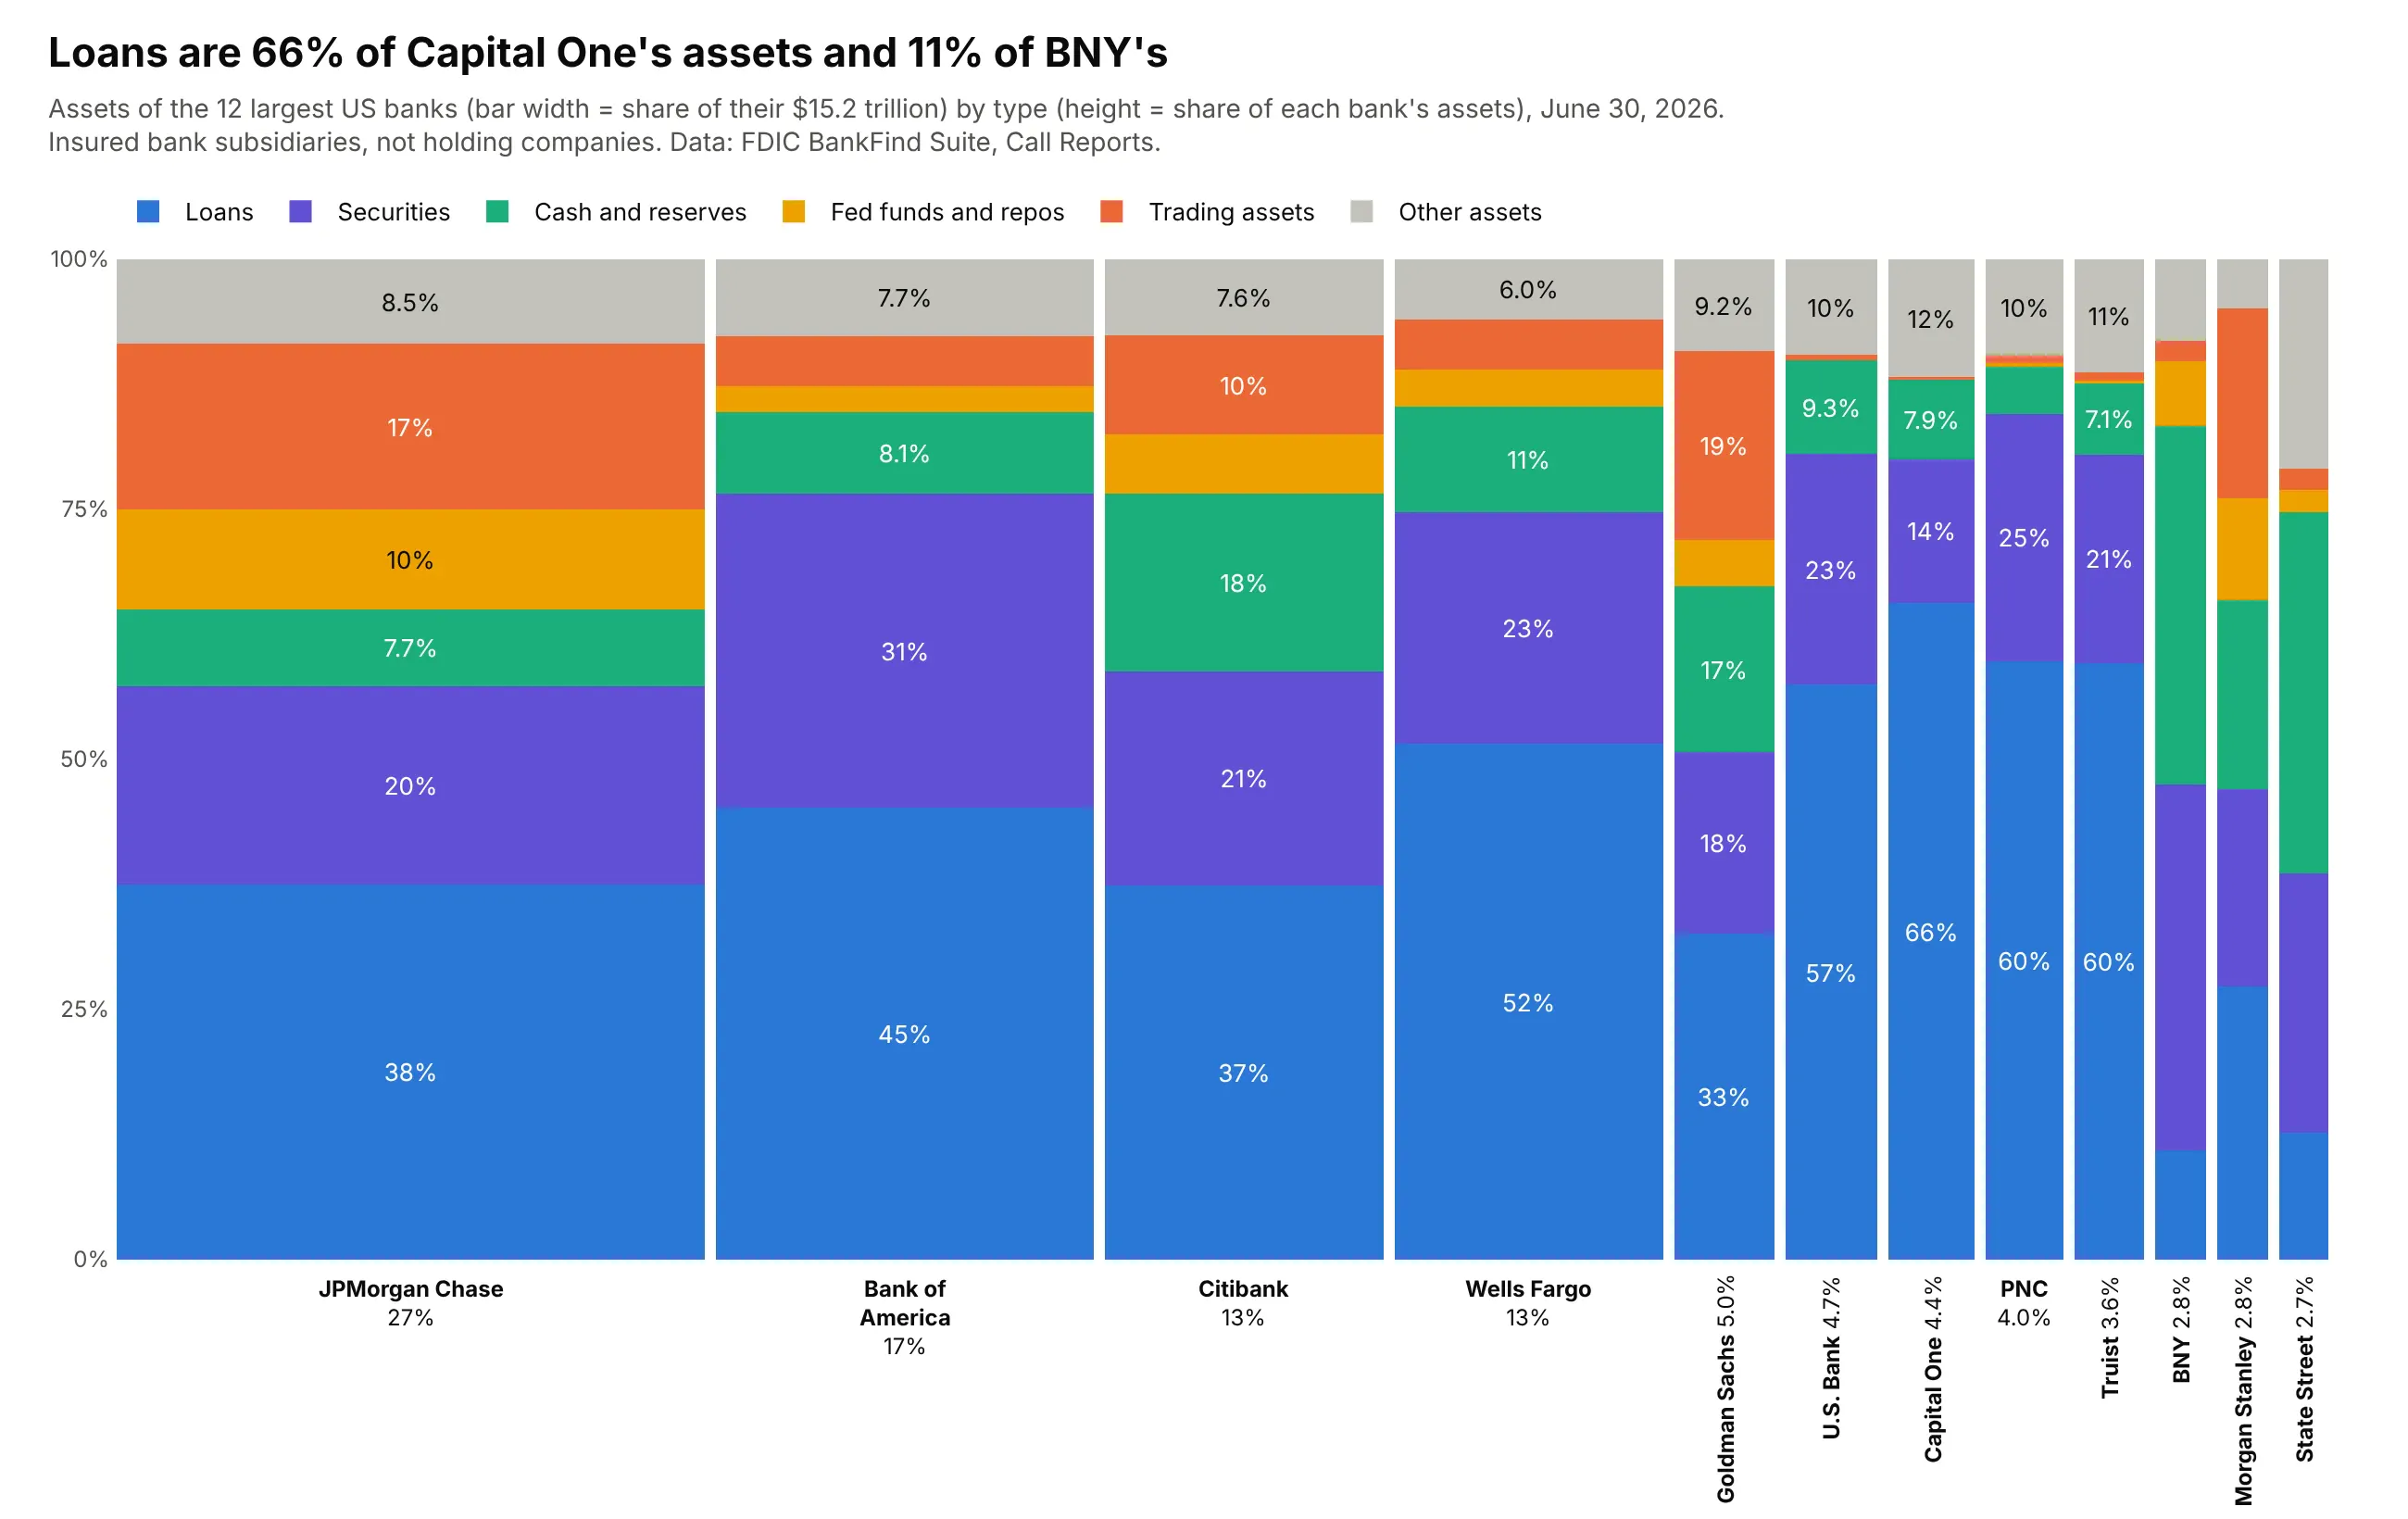
The 12 largest US banks held $15.2 trillion on June 30, 2026, 57% of all FDIC-insured bank assets. Loans are 66% of Capital One's assets and 11% of BNY's, because custody banks hold cash and securities instead. Data: FDIC BankFind Suite (Call Reports), June 30, 2026.
Tip: put the defining asset, loans, at the bottom so every bank's loan share starts at zero.
Get the data from the FDIC BankFind Suite API (banks.data.fdic.gov), latest quarter, fields ASSET, LNLSNET, SC,CHBAL, FREPO, TRADE, and shape it into a table(columns: report_date, bank, asset_type, usd_bn; 12 largest banks; other assets = ASSET minus the rest).Build a plotly Marimekko chart of banks and asset types, loans blue at the bottom, other assets gray on top.
5. What US households own, by wealth group
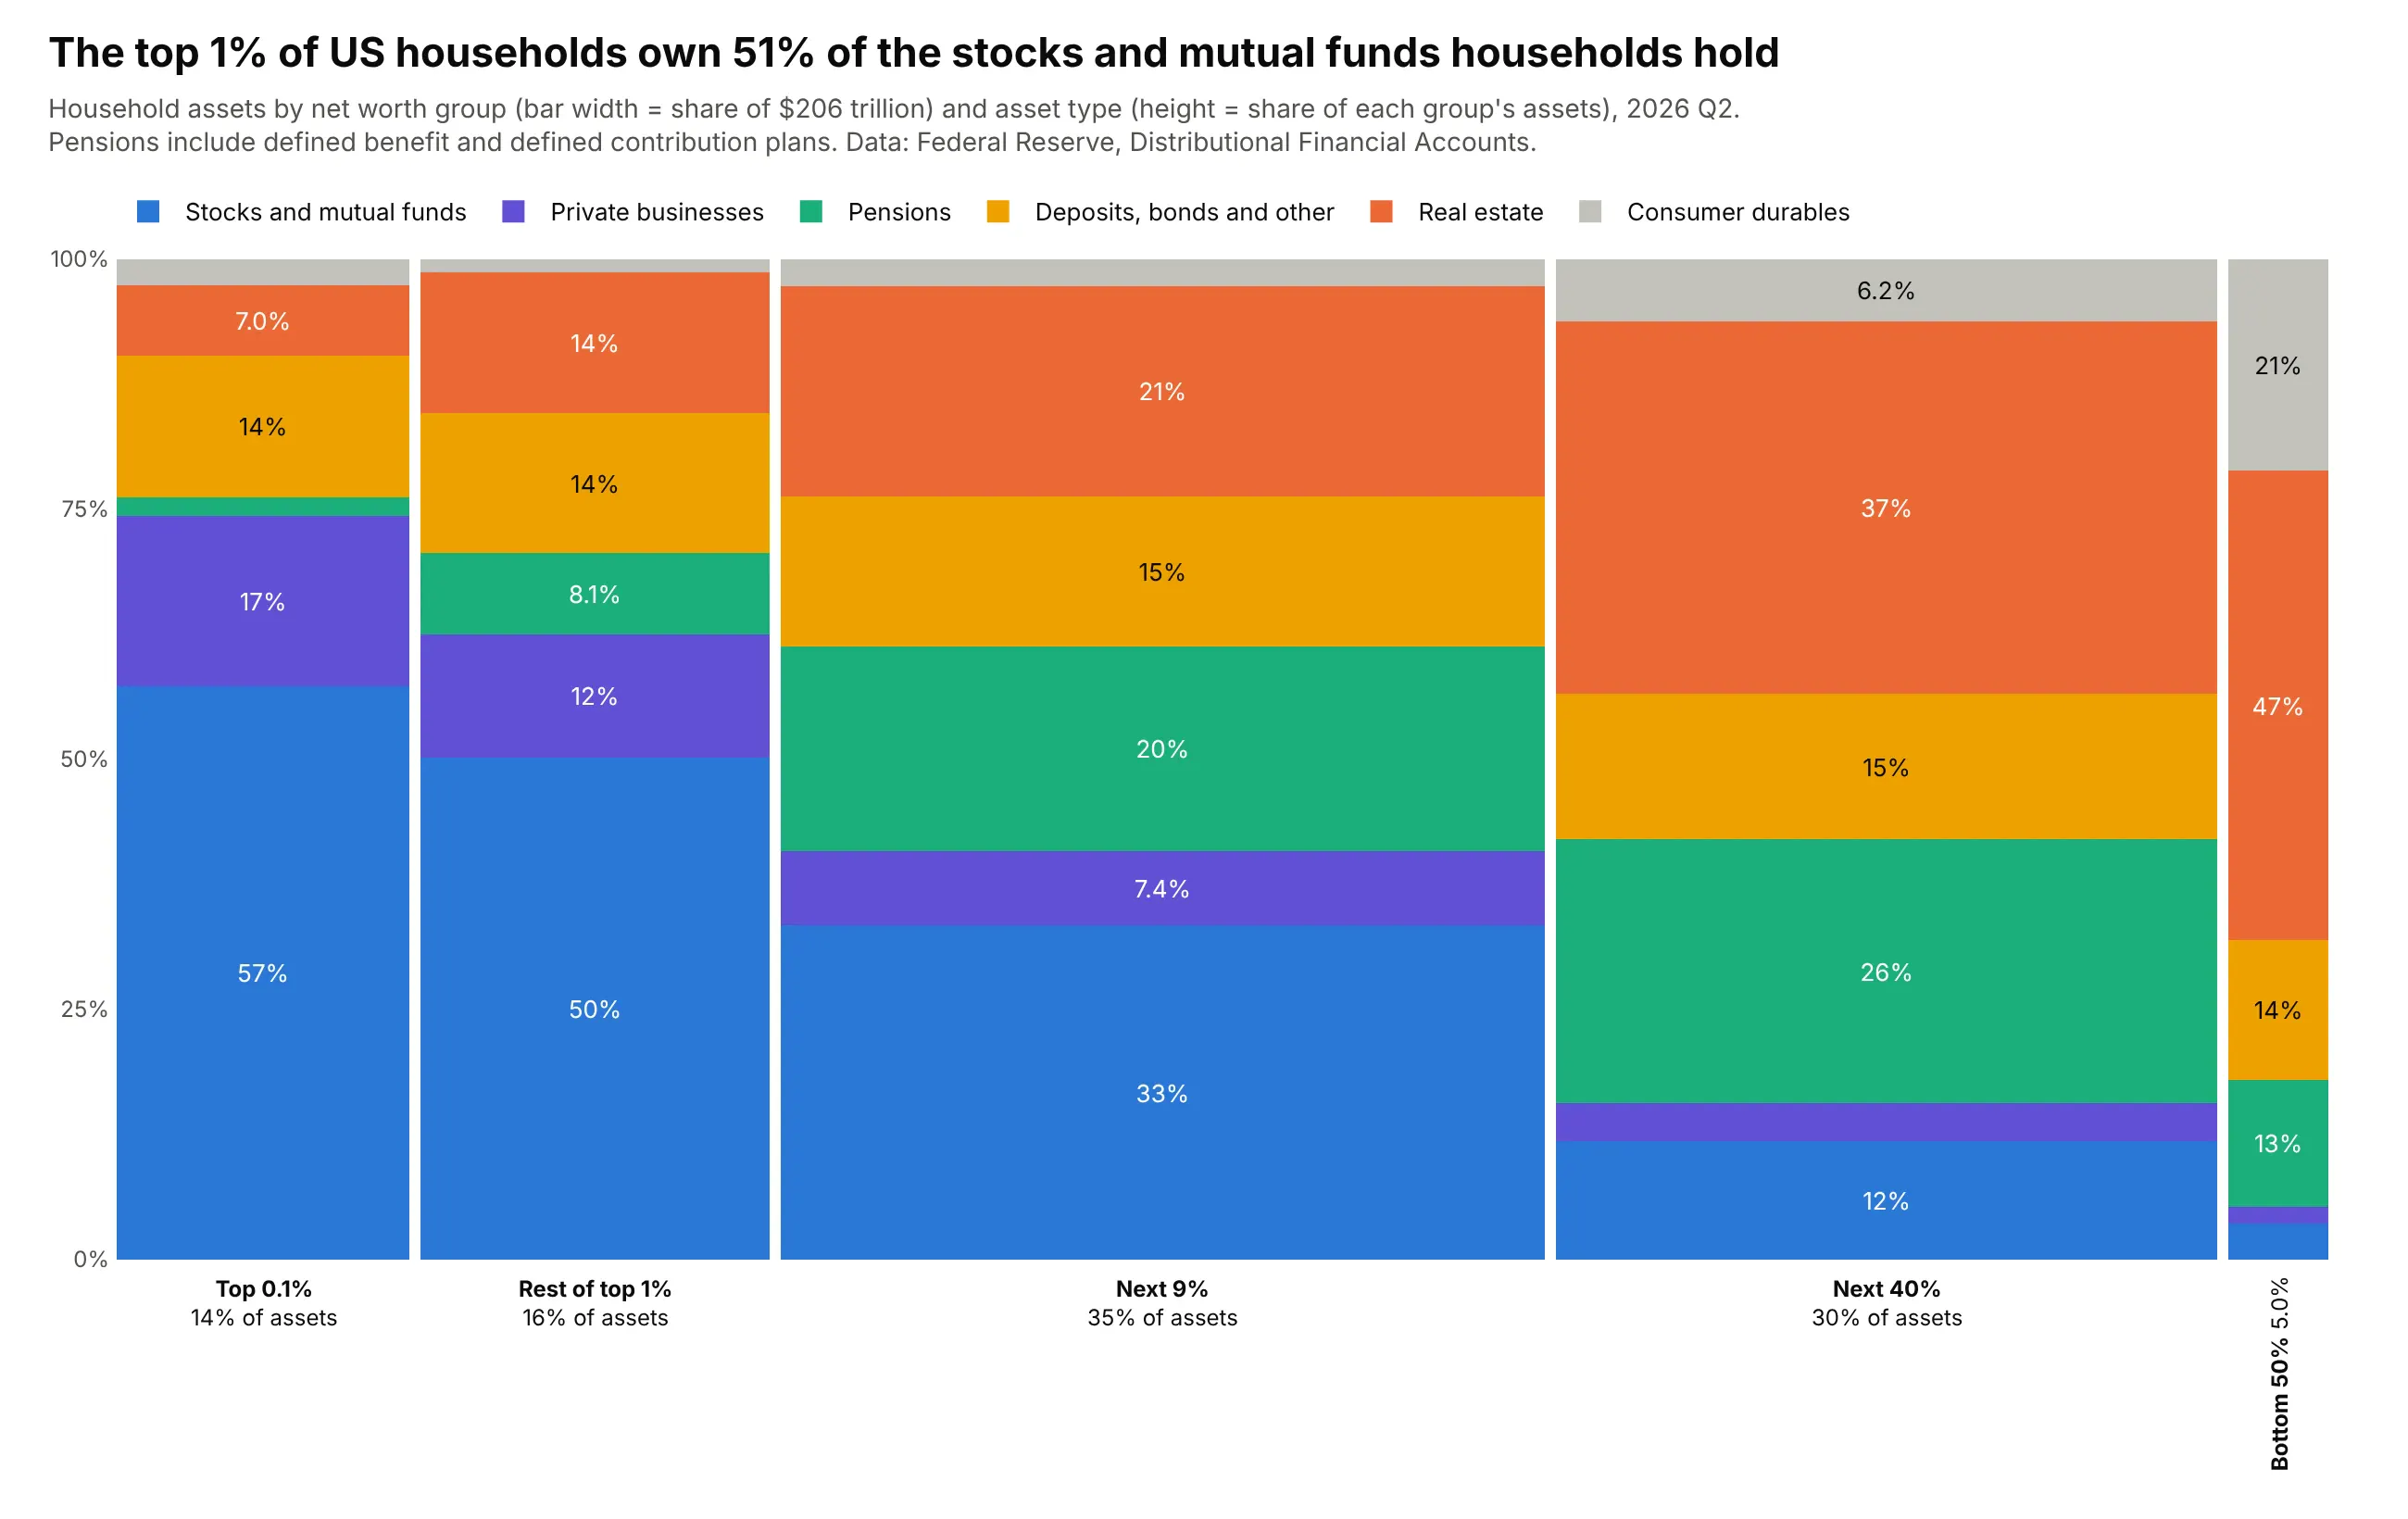
US households held $206 trillion of assets in mid-2026. The top 1% own 51% of the stocks and mutual funds households hold, while the bottom half of households holds 5% of all assets, mostly homes and cars. Data: Federal Reserve, Distributional Financial Accounts, 2026 Q2.
Tip: keep the groups in their natural order, richest to poorest, rather than sorting by width.
Get the data from the Federal Reserve's Distributional Financial Accounts (federalreserve.gov/releases/z1/dataviz/dfa),levels by net worth group, latest quarter, and shape it into a table(columns: date, group, asset_type, usd_bn; groups top 0.1%, rest of top 1%, next 9%, next 40%, bottom 50%).Build a plotly Marimekko chart with groups in that order and stocks blue at the bottom of each bar.- Title with the top 1%'s share of household stocks.
6. What the US imports from its largest suppliers
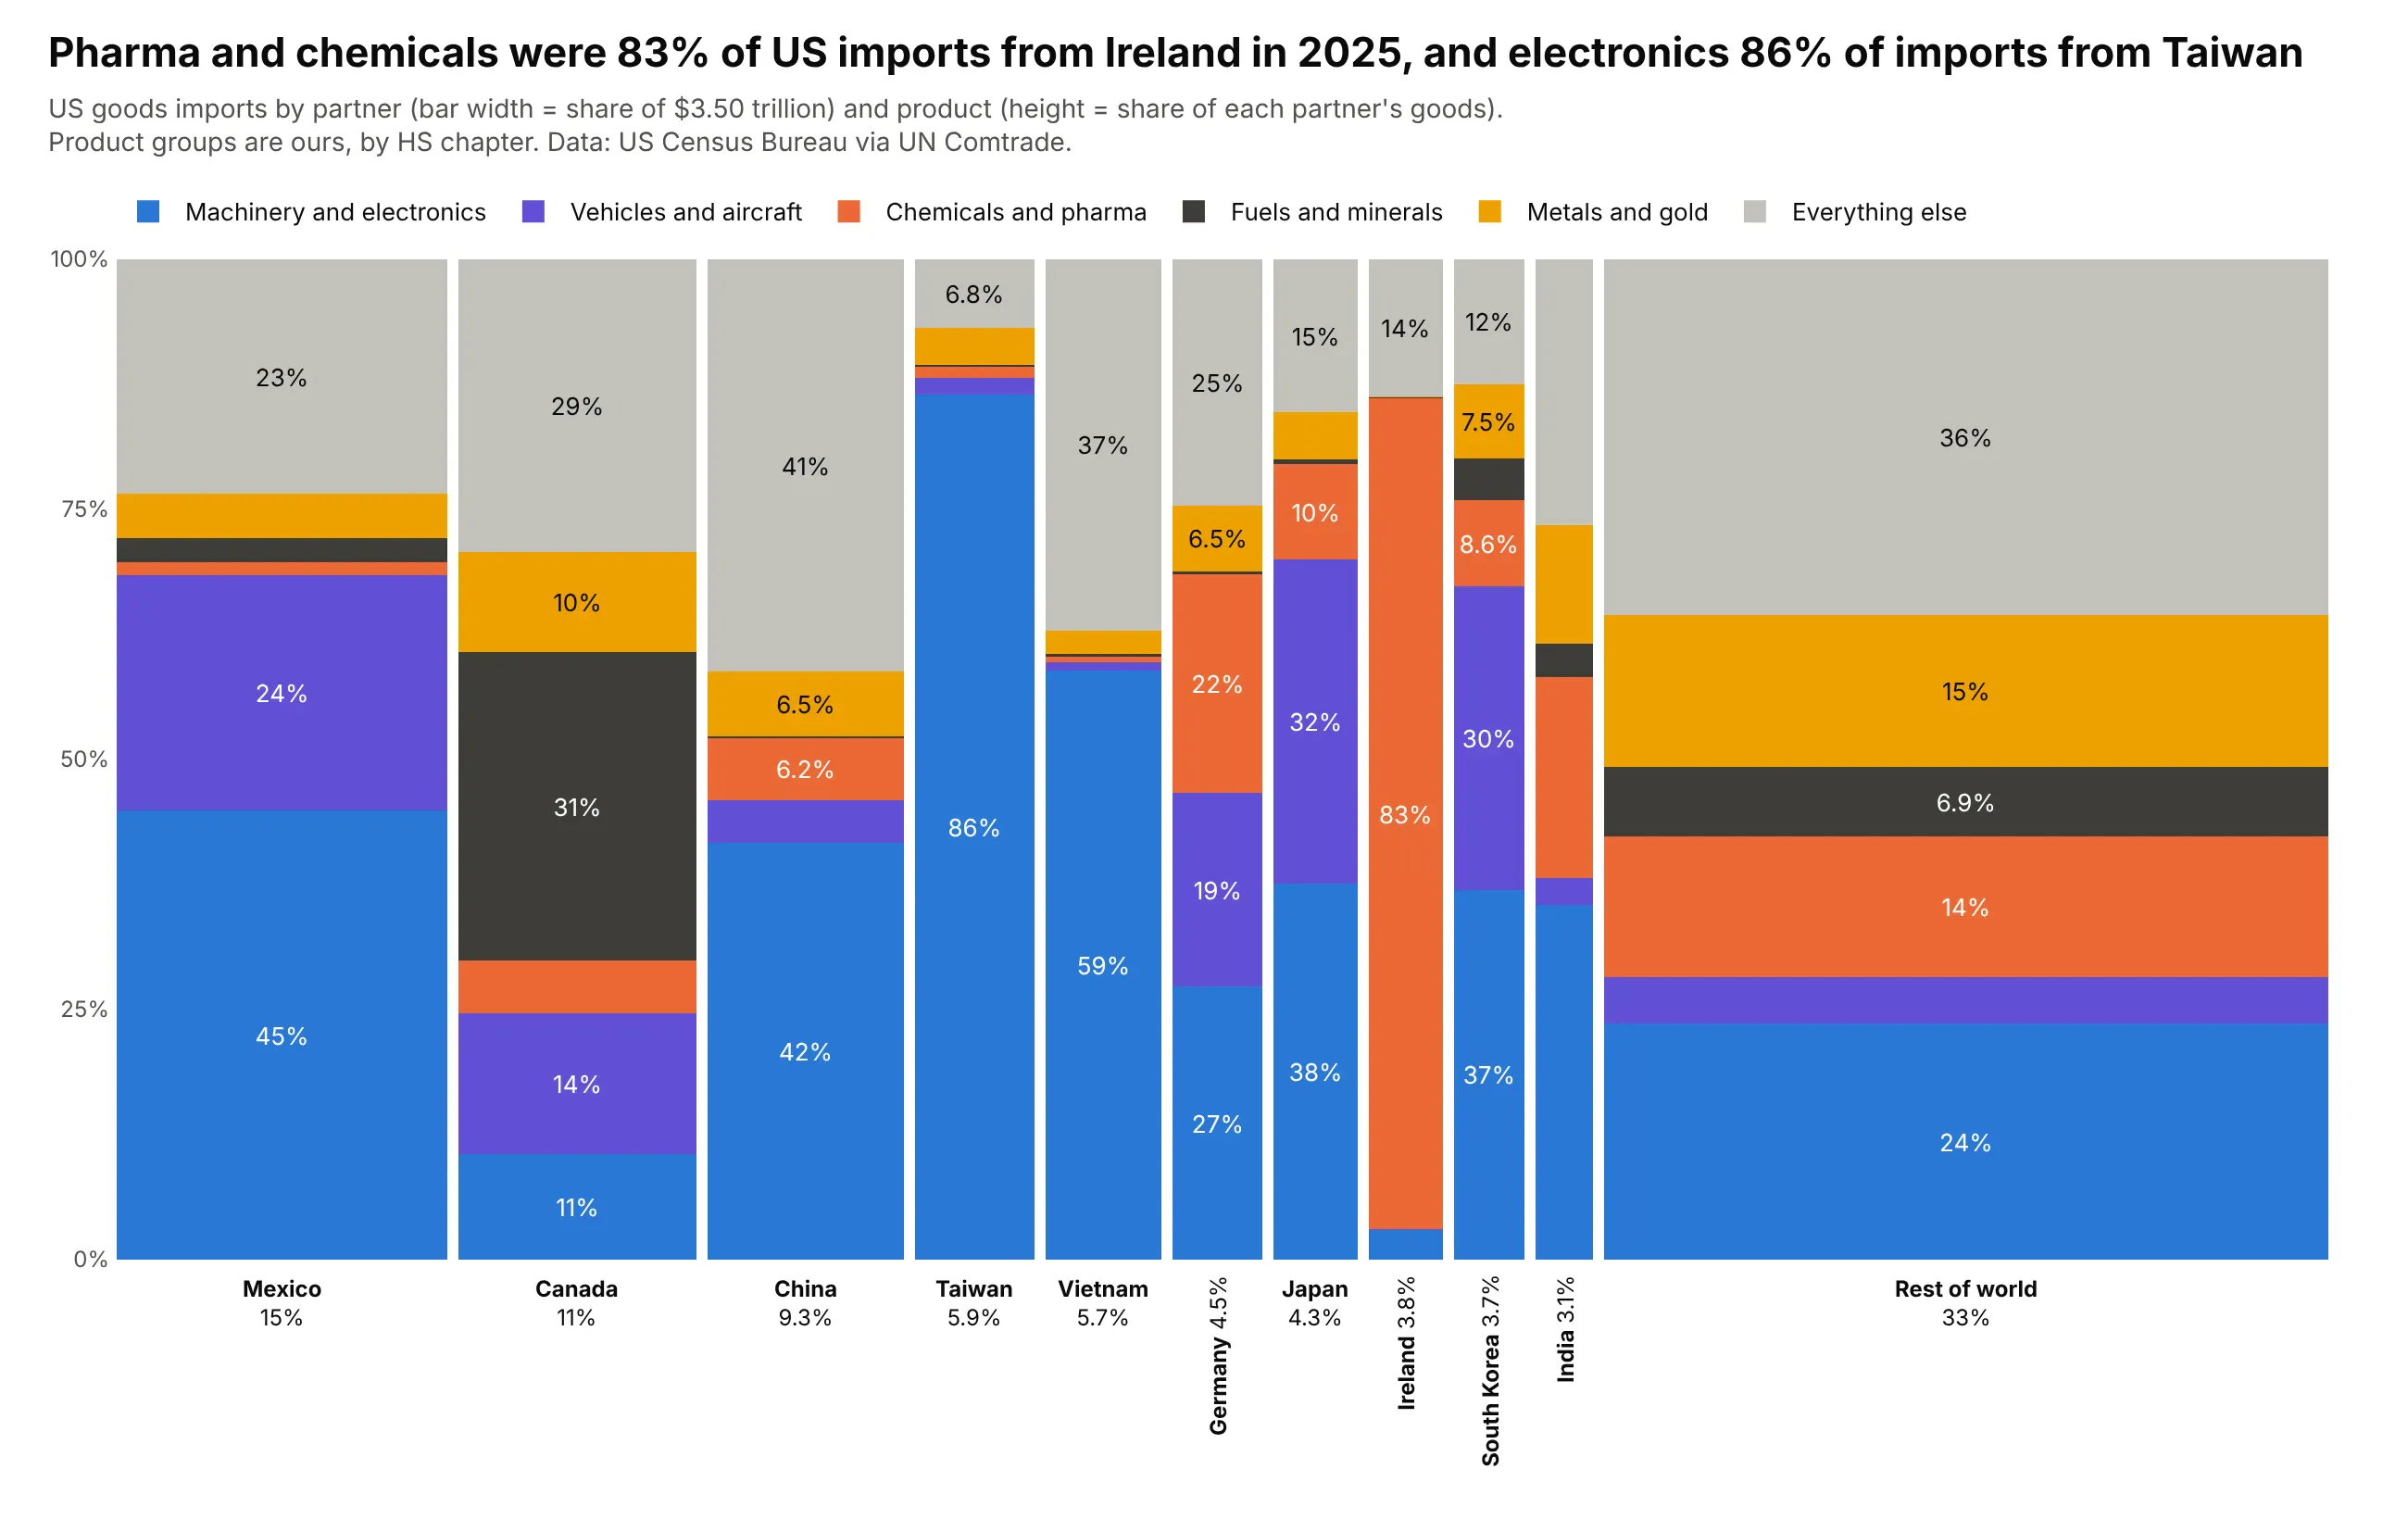
The US imported $3.50 trillion of goods in 2025. Ireland is a narrow bar that is 83% pharma and chemicals, Taiwan is 86% machinery and electronics, and 31% of imports from Canada are fuels. Data: US Census Bureau via UN Comtrade, 2025.
Tip: give the two product groups in the story strong colors and the rest quieter ones.
Get the data from UN Comtrade (comtradeplus.un.org), US imports in 2025 by partner and HS chapter,and shape it into a table(columns: year, partner, product_group, usd_bn; 10 largest partners plus "Rest of world"; groups from HS chapters).Build a plotly Marimekko chart of partners and product groups, Rest of world last.
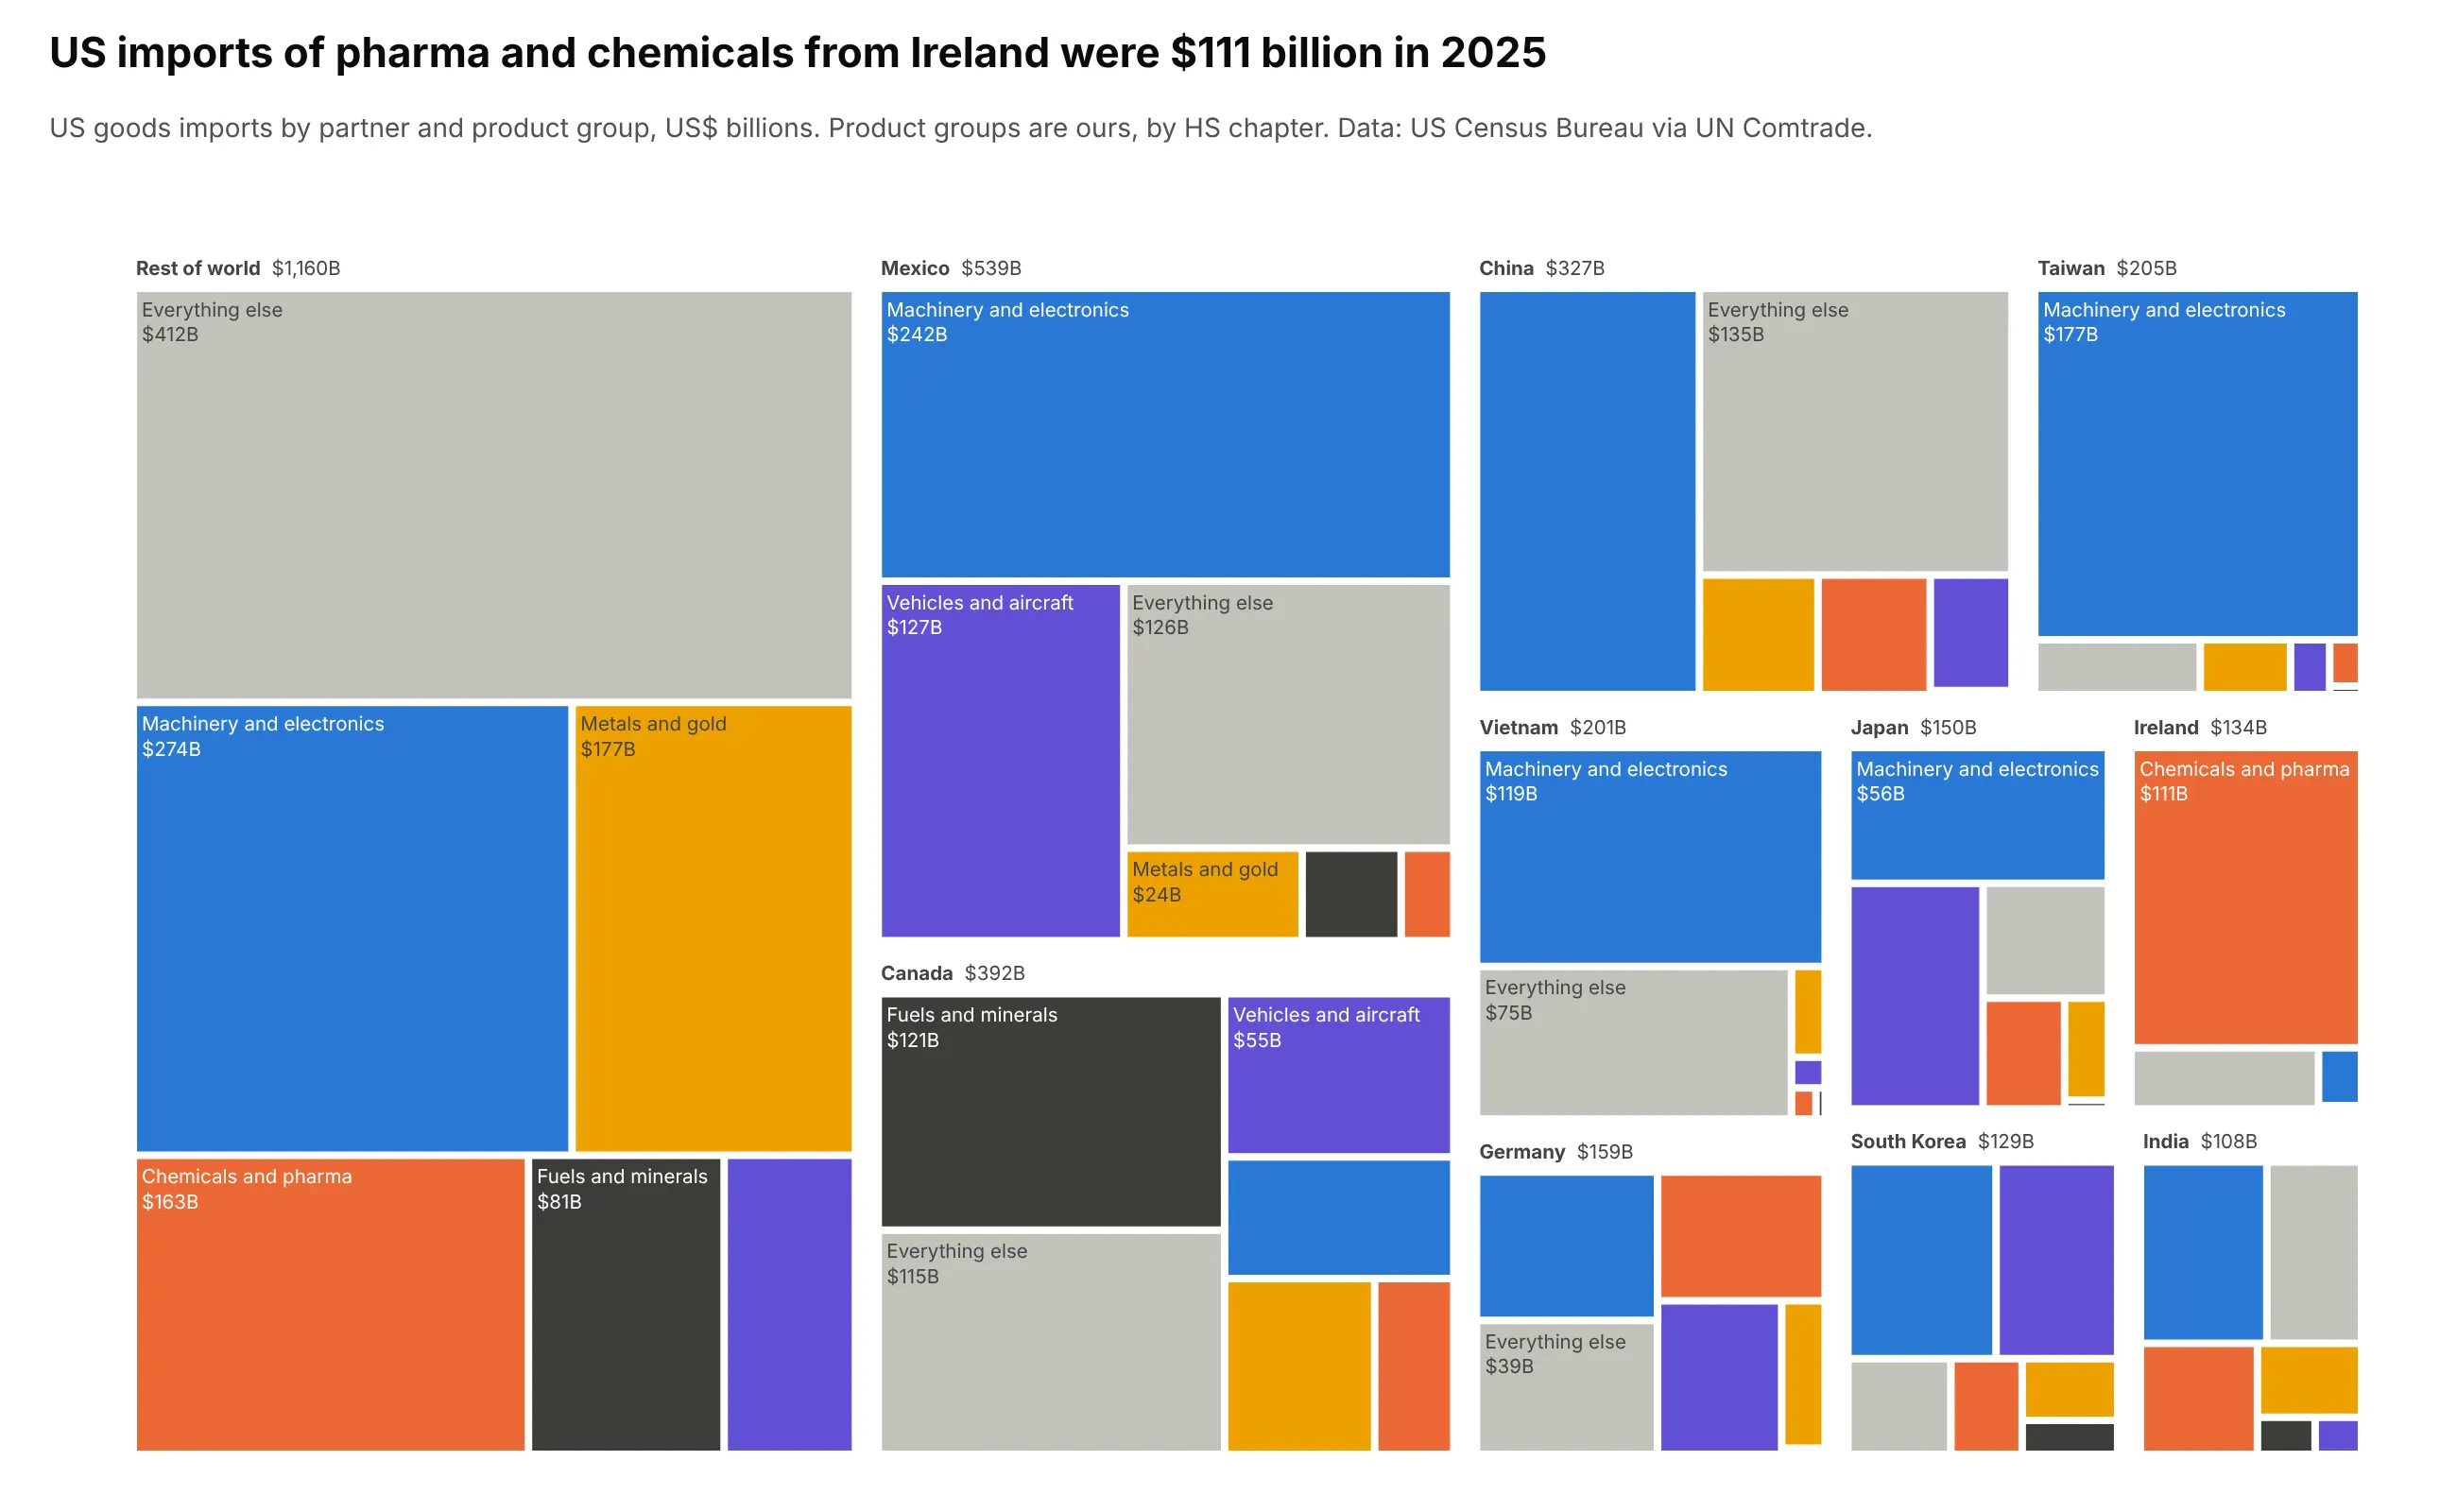
Another way to see it: a treemap of partner and product shows the same dollars as nested areas, with Ireland's $111 billion of pharma and chemicals as one tile, but the mixes no longer line up for comparison.
7. Where the world's workers work
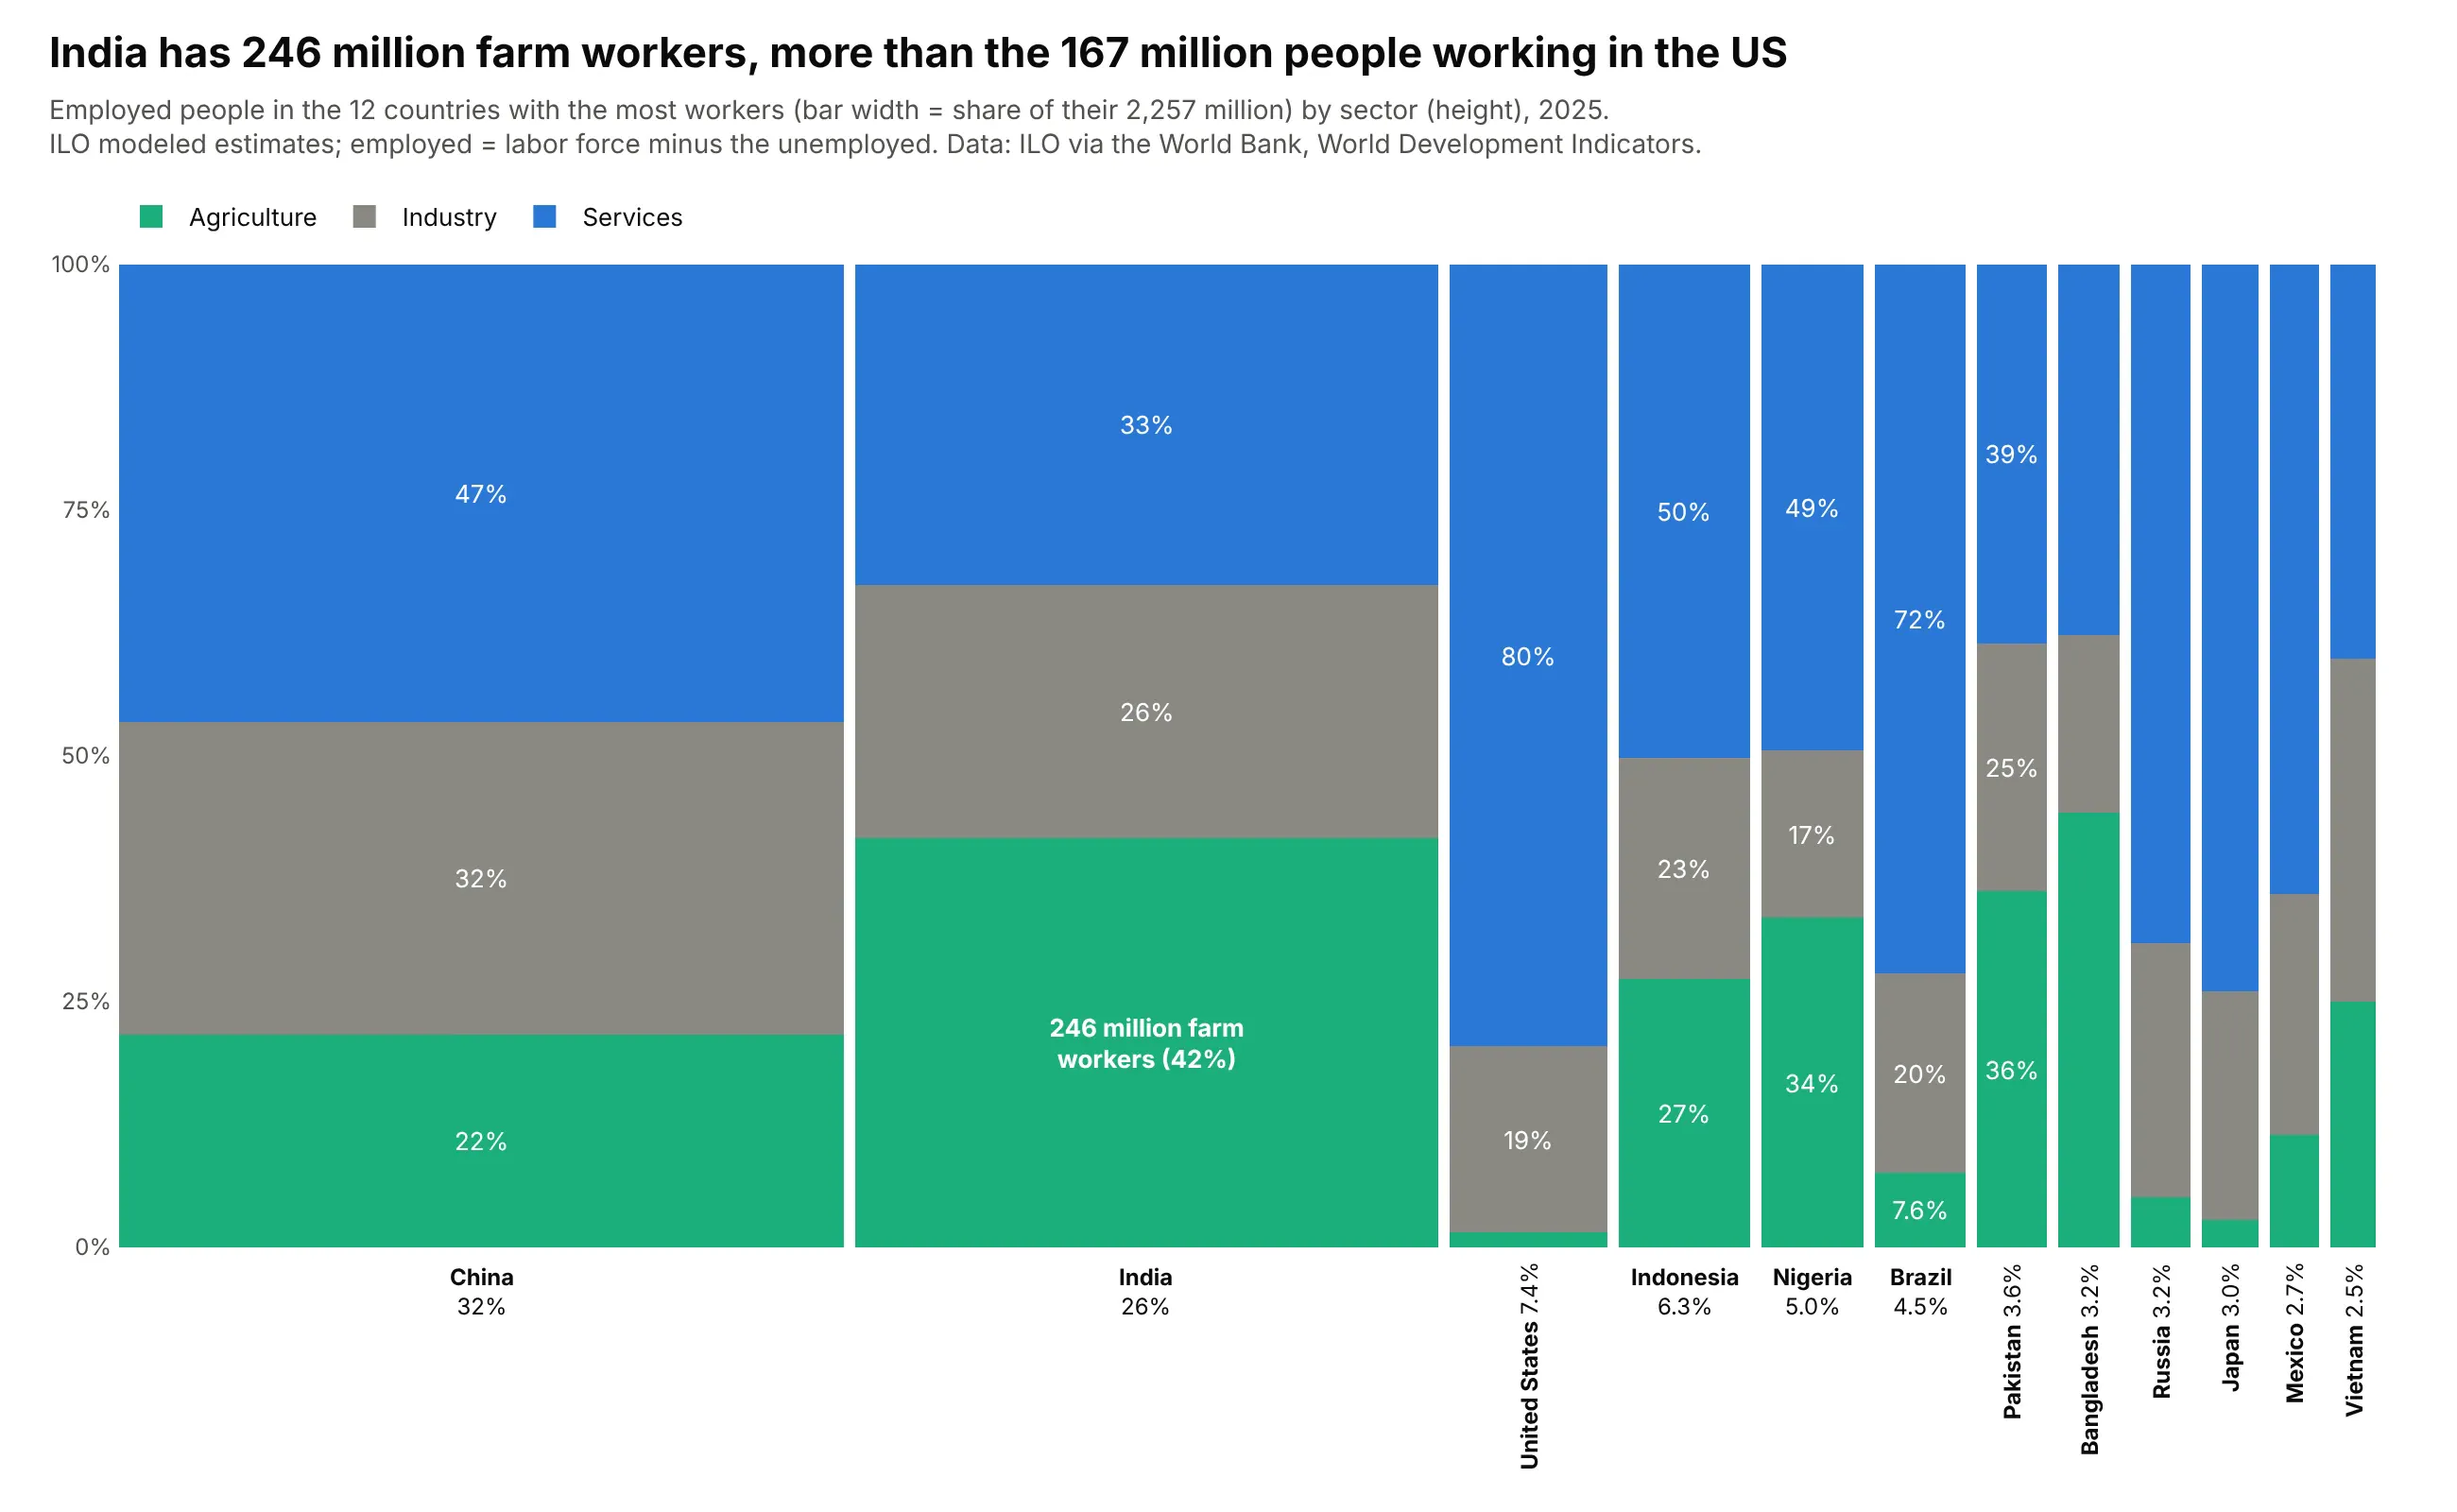
India has 246 million farm workers, more than the 167 million people working in the US. Agriculture is 42% of India's workforce and 1.5% of America's. Data: ILO modeled estimates via the World Bank, World Development Indicators, 2025.
Tip: replace one segment's percentage with its head count when the absolute number is the story.
Get the data from the World Bank's World Development Indicators (ILO modeled estimates: SL.TLF.TOTL.IN,SL.UEM.TOTL.ZS, SL.AGR.EMPL.ZS, SL.IND.EMPL.ZS, SL.SRV.EMPL.ZS), 2025, and shape it into a table(columns: year, country, sector, workers_mn; employed = labor force x (1 - unemployment rate)).Build a plotly Marimekko chart of the 12 countries with the most workers by sector.
8. Who sponsors clinical trials at each phase
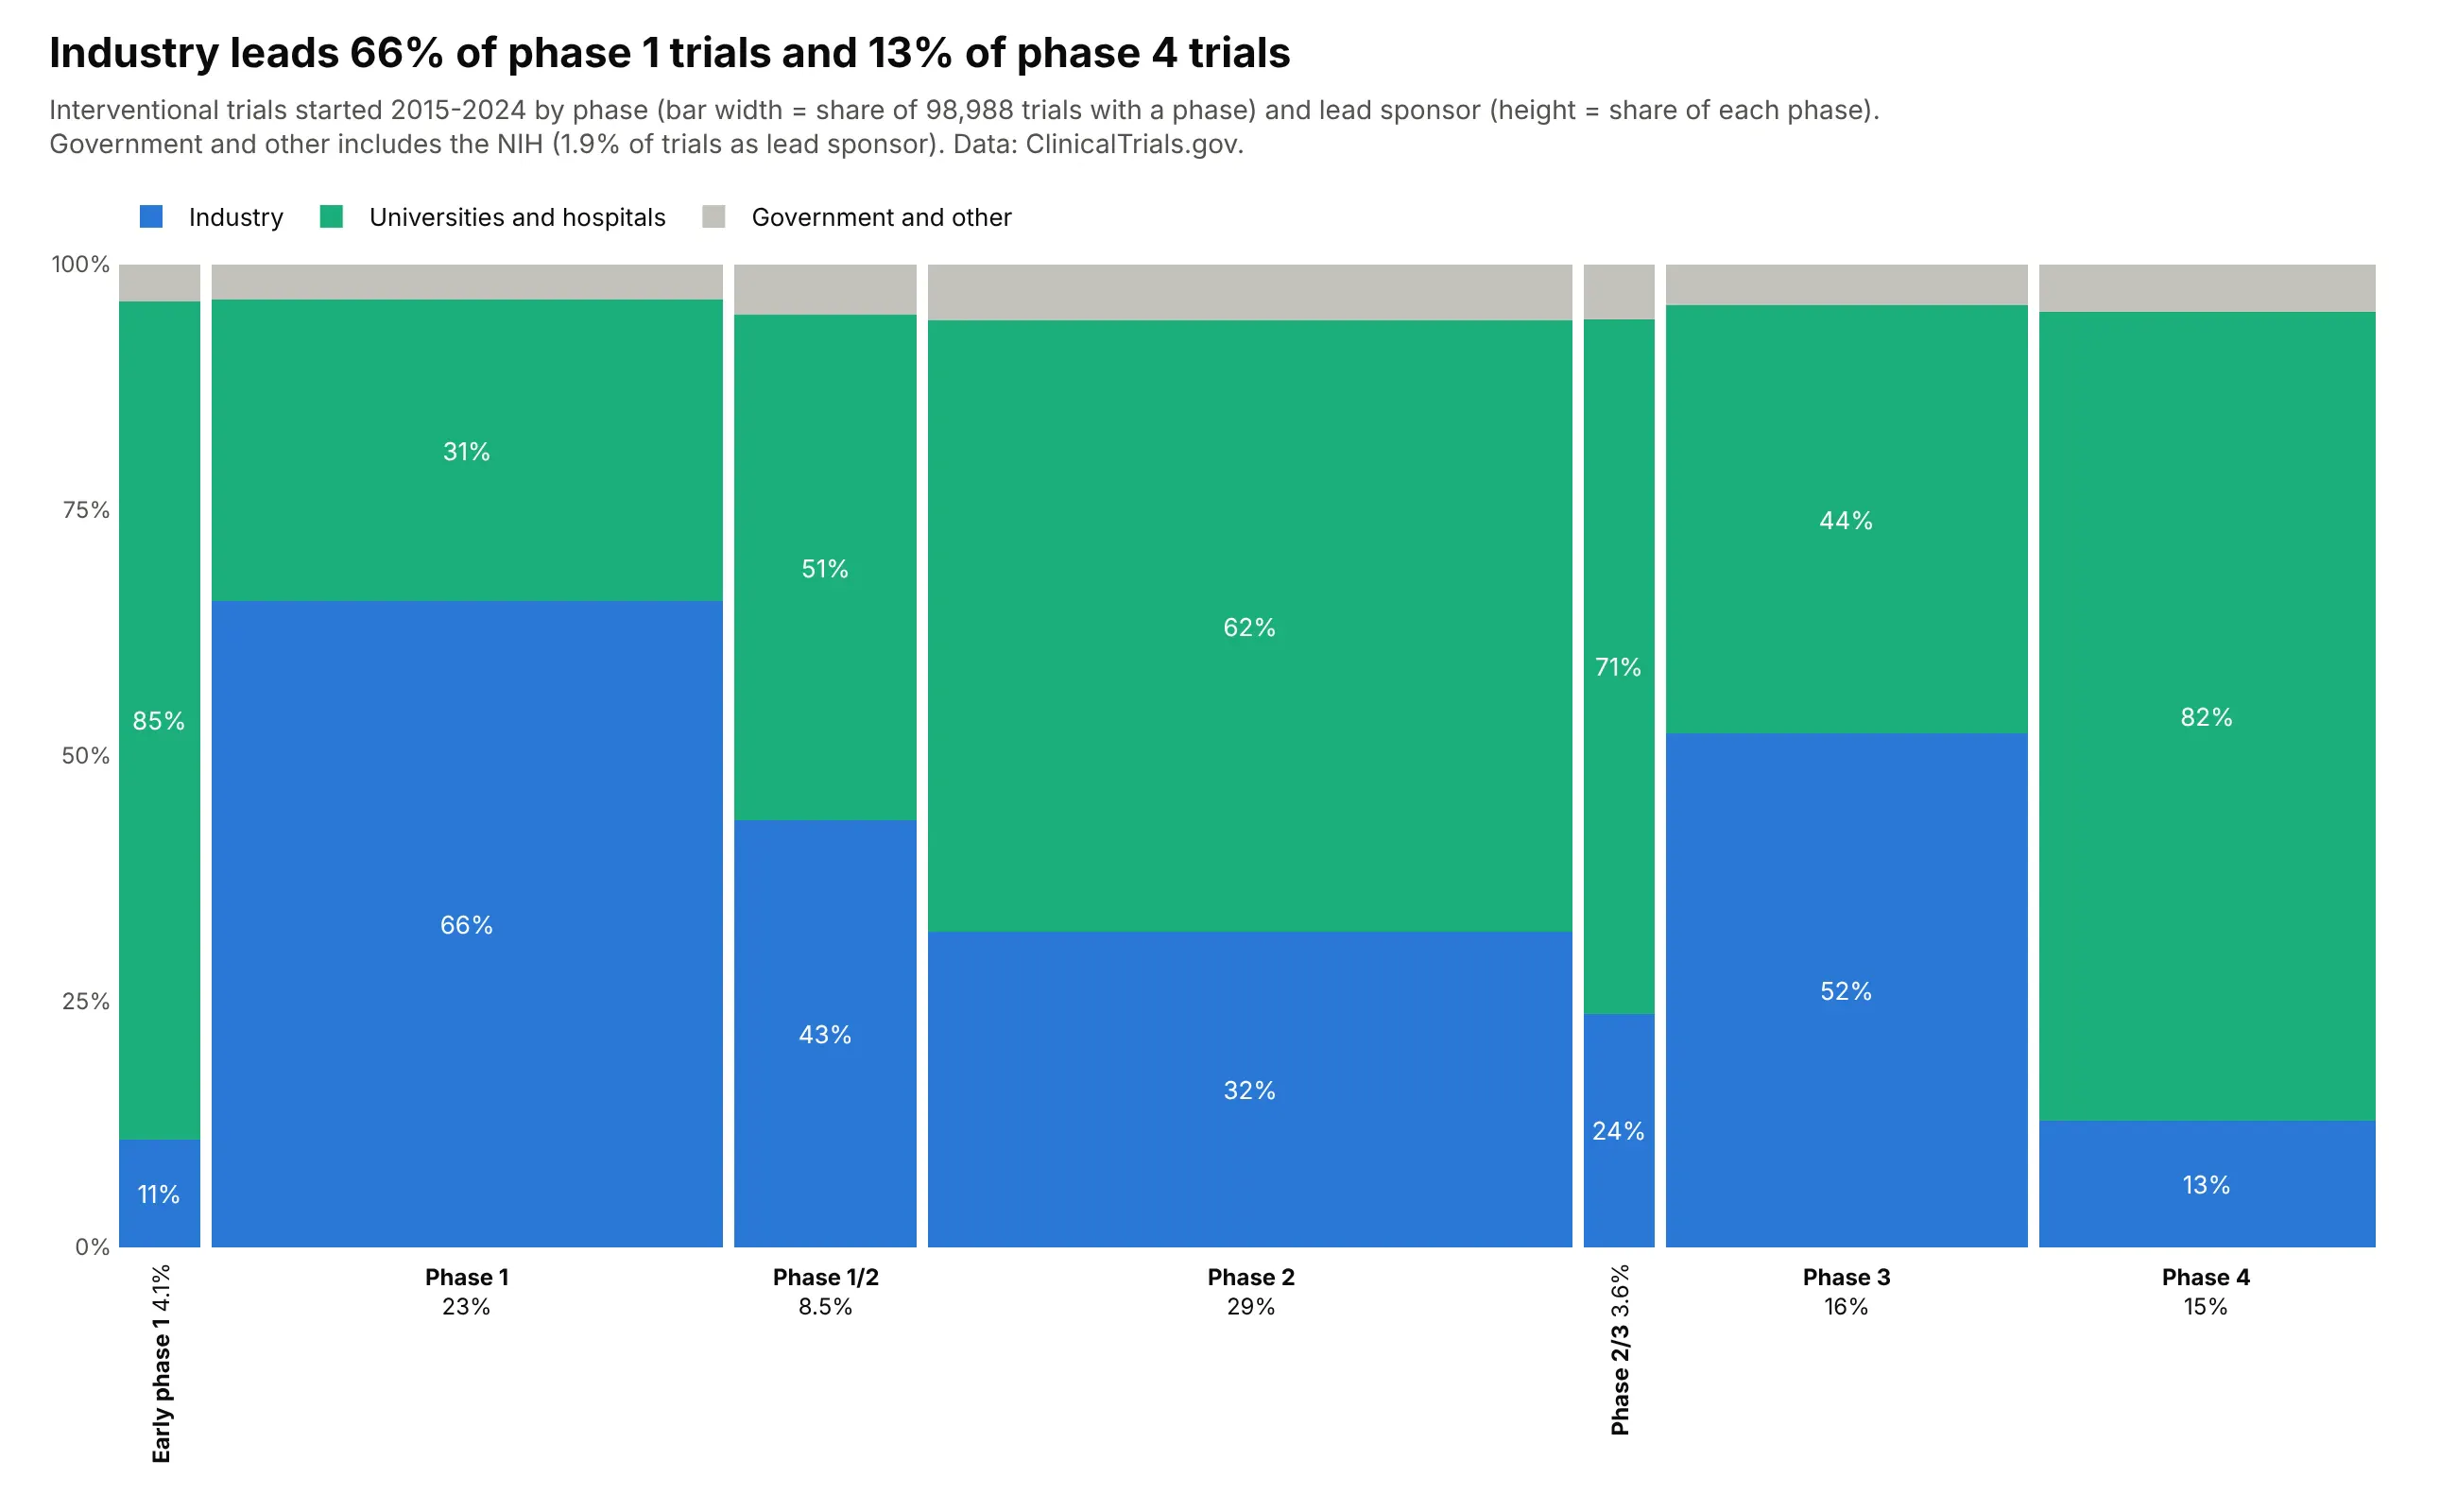
Of 98,988 trials started in 2015-2024 with a phase, industry leads 66% of phase 1 and 52% of phase 3 trials but only 13% of phase 4. Universities and hospitals lead the rest. Data: ClinicalTrials.gov API, interventional trials.
Tip: keep the phases in pipeline order, not sorted by width.
Get the data from the ClinicalTrials.gov API v2 (count queries), interventional trials started 2015-2024,and shape it into a table(columns: phase, sponsor, trials; phases early 1, 1, 1/2, 2, 2/3, 3, 4 made exclusive; sponsor from LeadSponsorClass).Build a plotly Marimekko chart with phases in pipeline order and industry blue at the bottom.
9. At what age people die in each WHO region
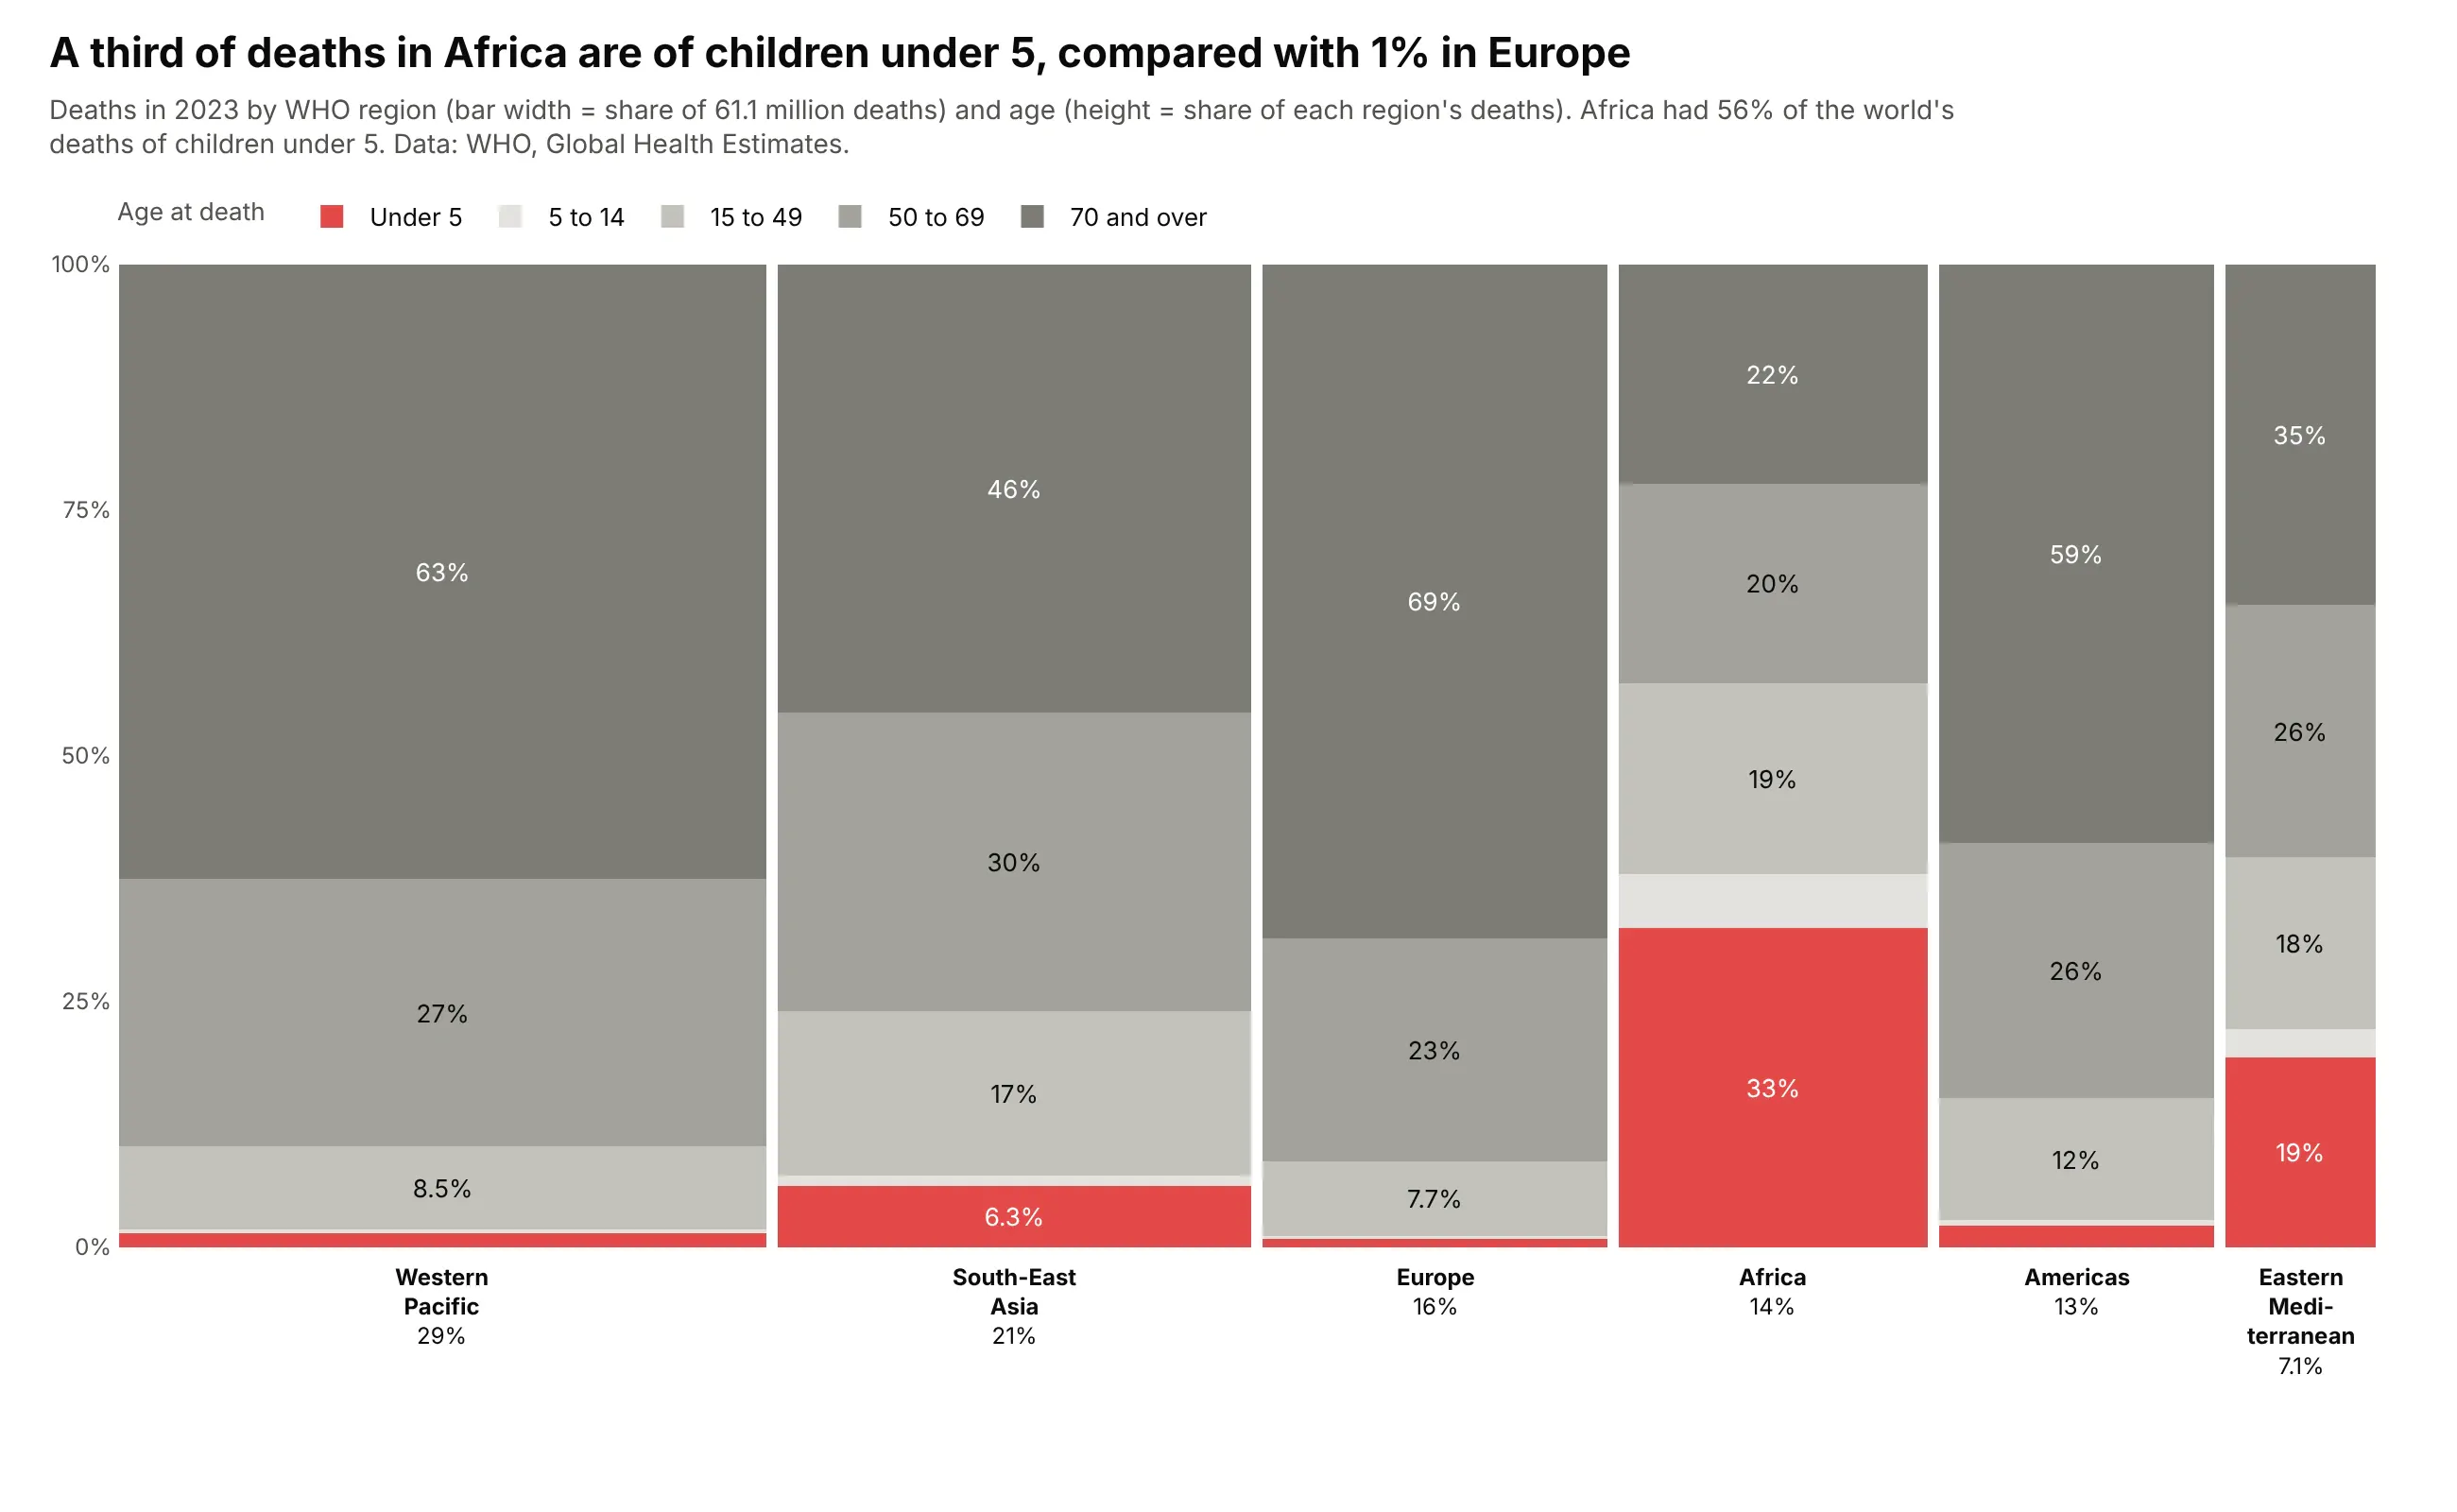
A third of deaths in Africa in 2023 were children under 5, against 1% in Europe, where 69% of people died at 70 or older. Africa had 56% of the world's under-5 deaths. Data: WHO, Global Health Estimates 2023.
Tip: one red highlight and every other band in grays gives the chart a single story.
Get the data from the WHO Global Health Estimates (xmart-api-public.who.int, GHE_REGIONS), 2023, all causes,and shape it into a table (columns: year, region, age_group, deaths; under 5, 5-14, 15-49, 50-69, 70+).Build a plotly Marimekko chart of WHO regions and age groups, under 5 red at the bottom, others gray.
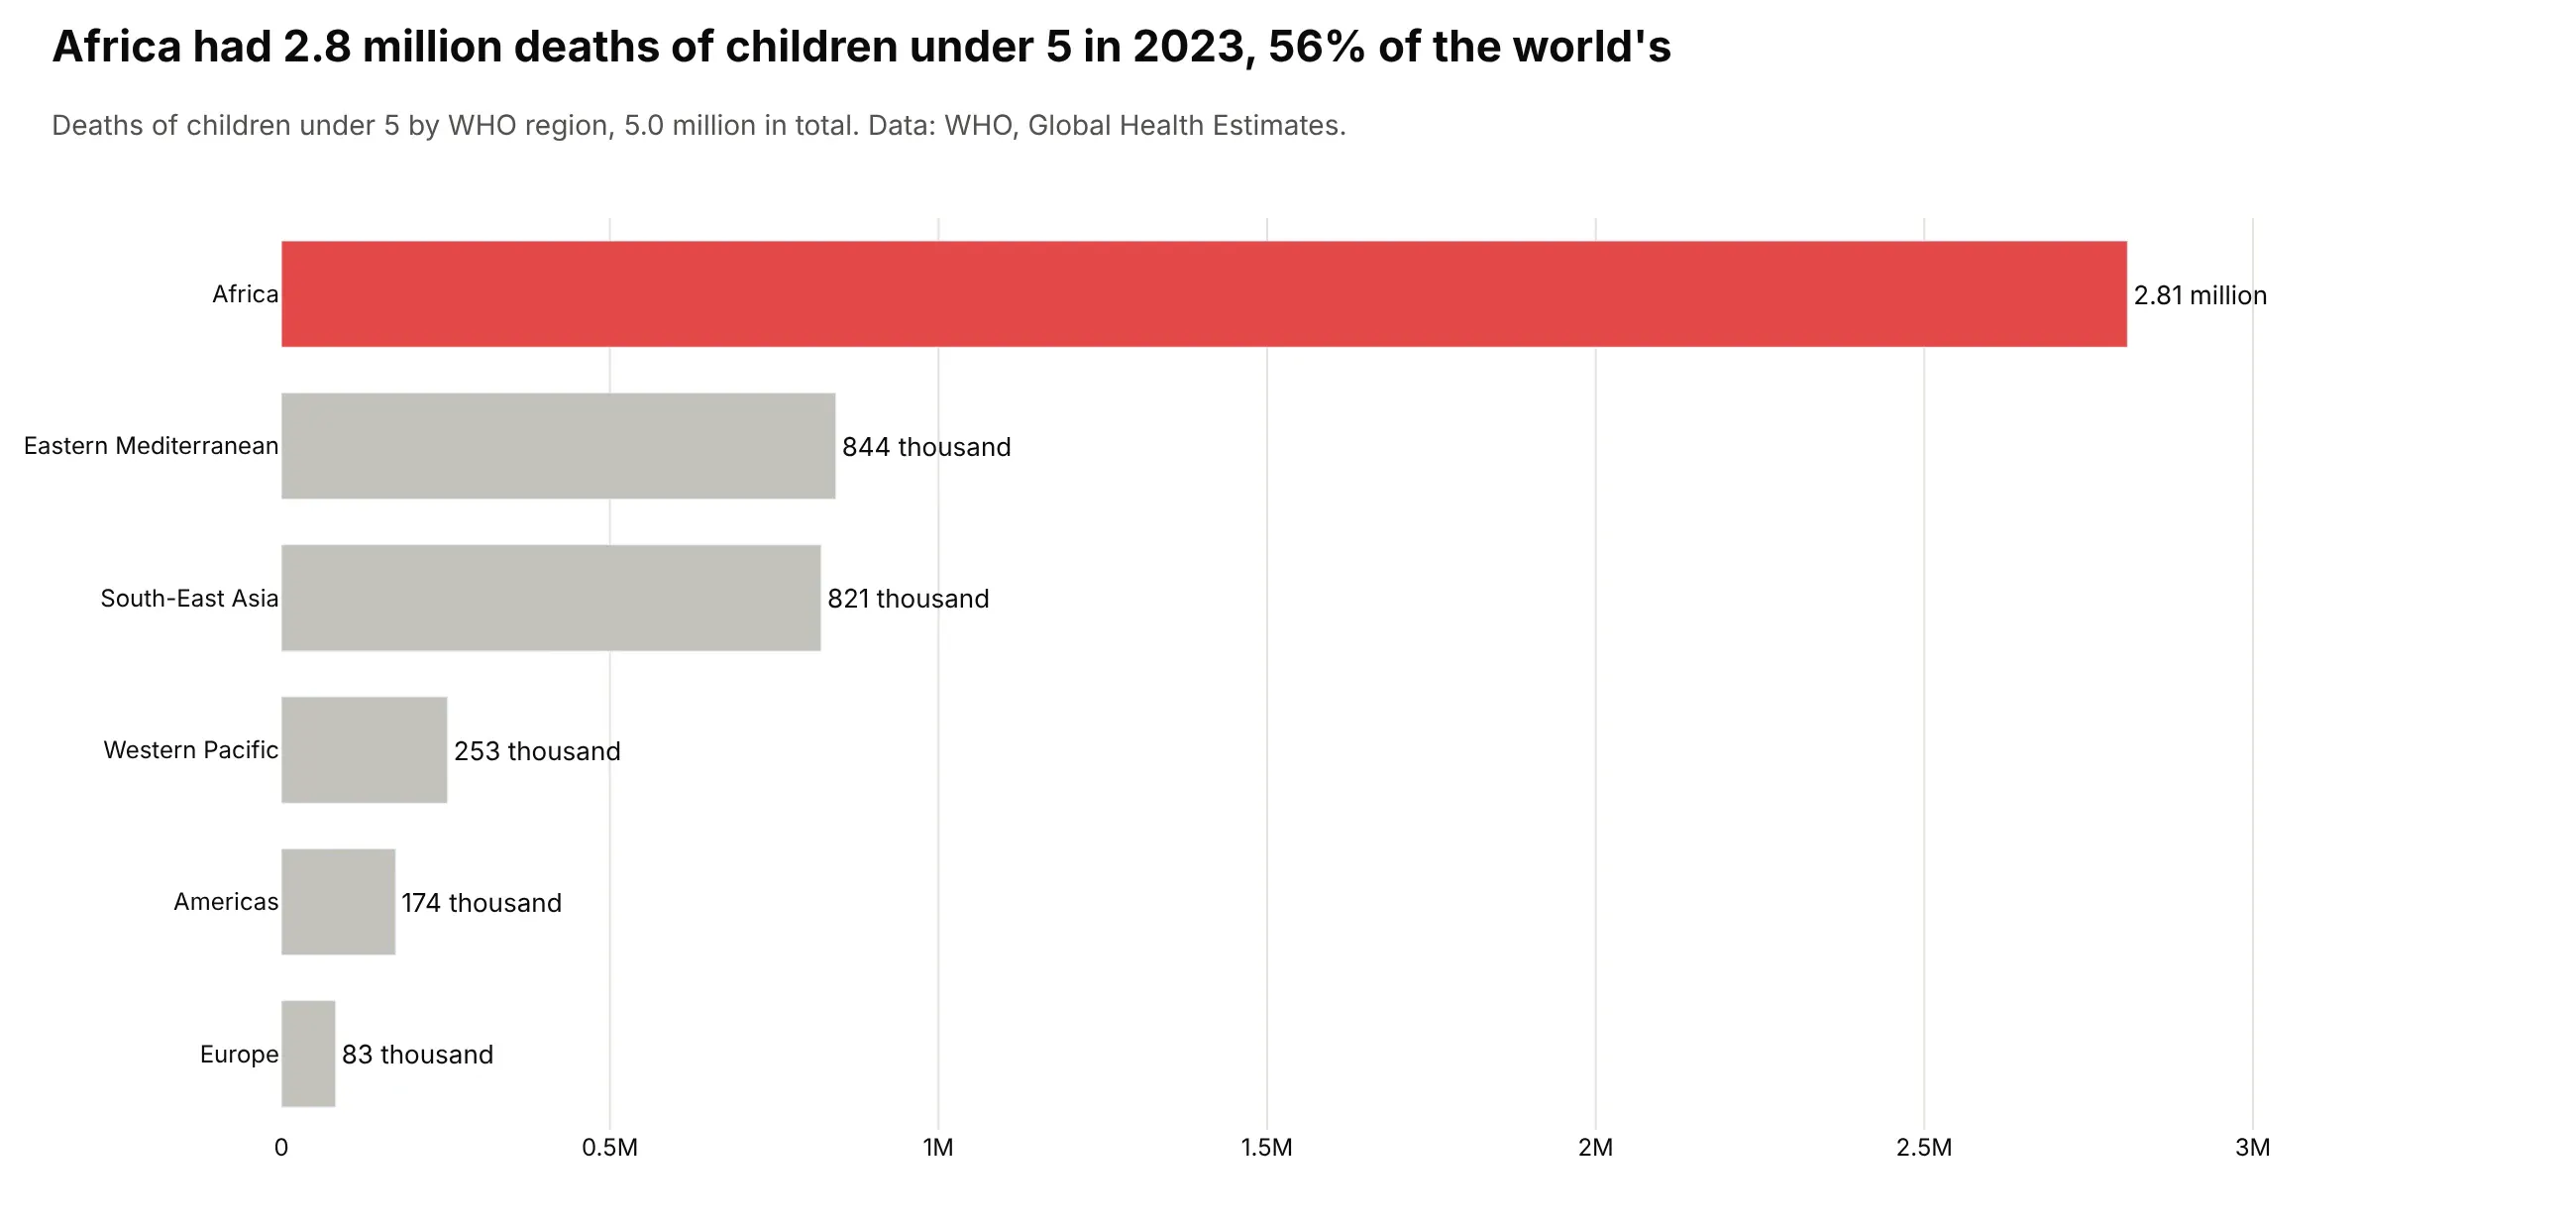
Another way to see it: a bar chart of under-5 deaths in each region gives the counts directly, 2.81 million in Africa, which the Marimekko only shows as an area.
10. The world's population by continent and age
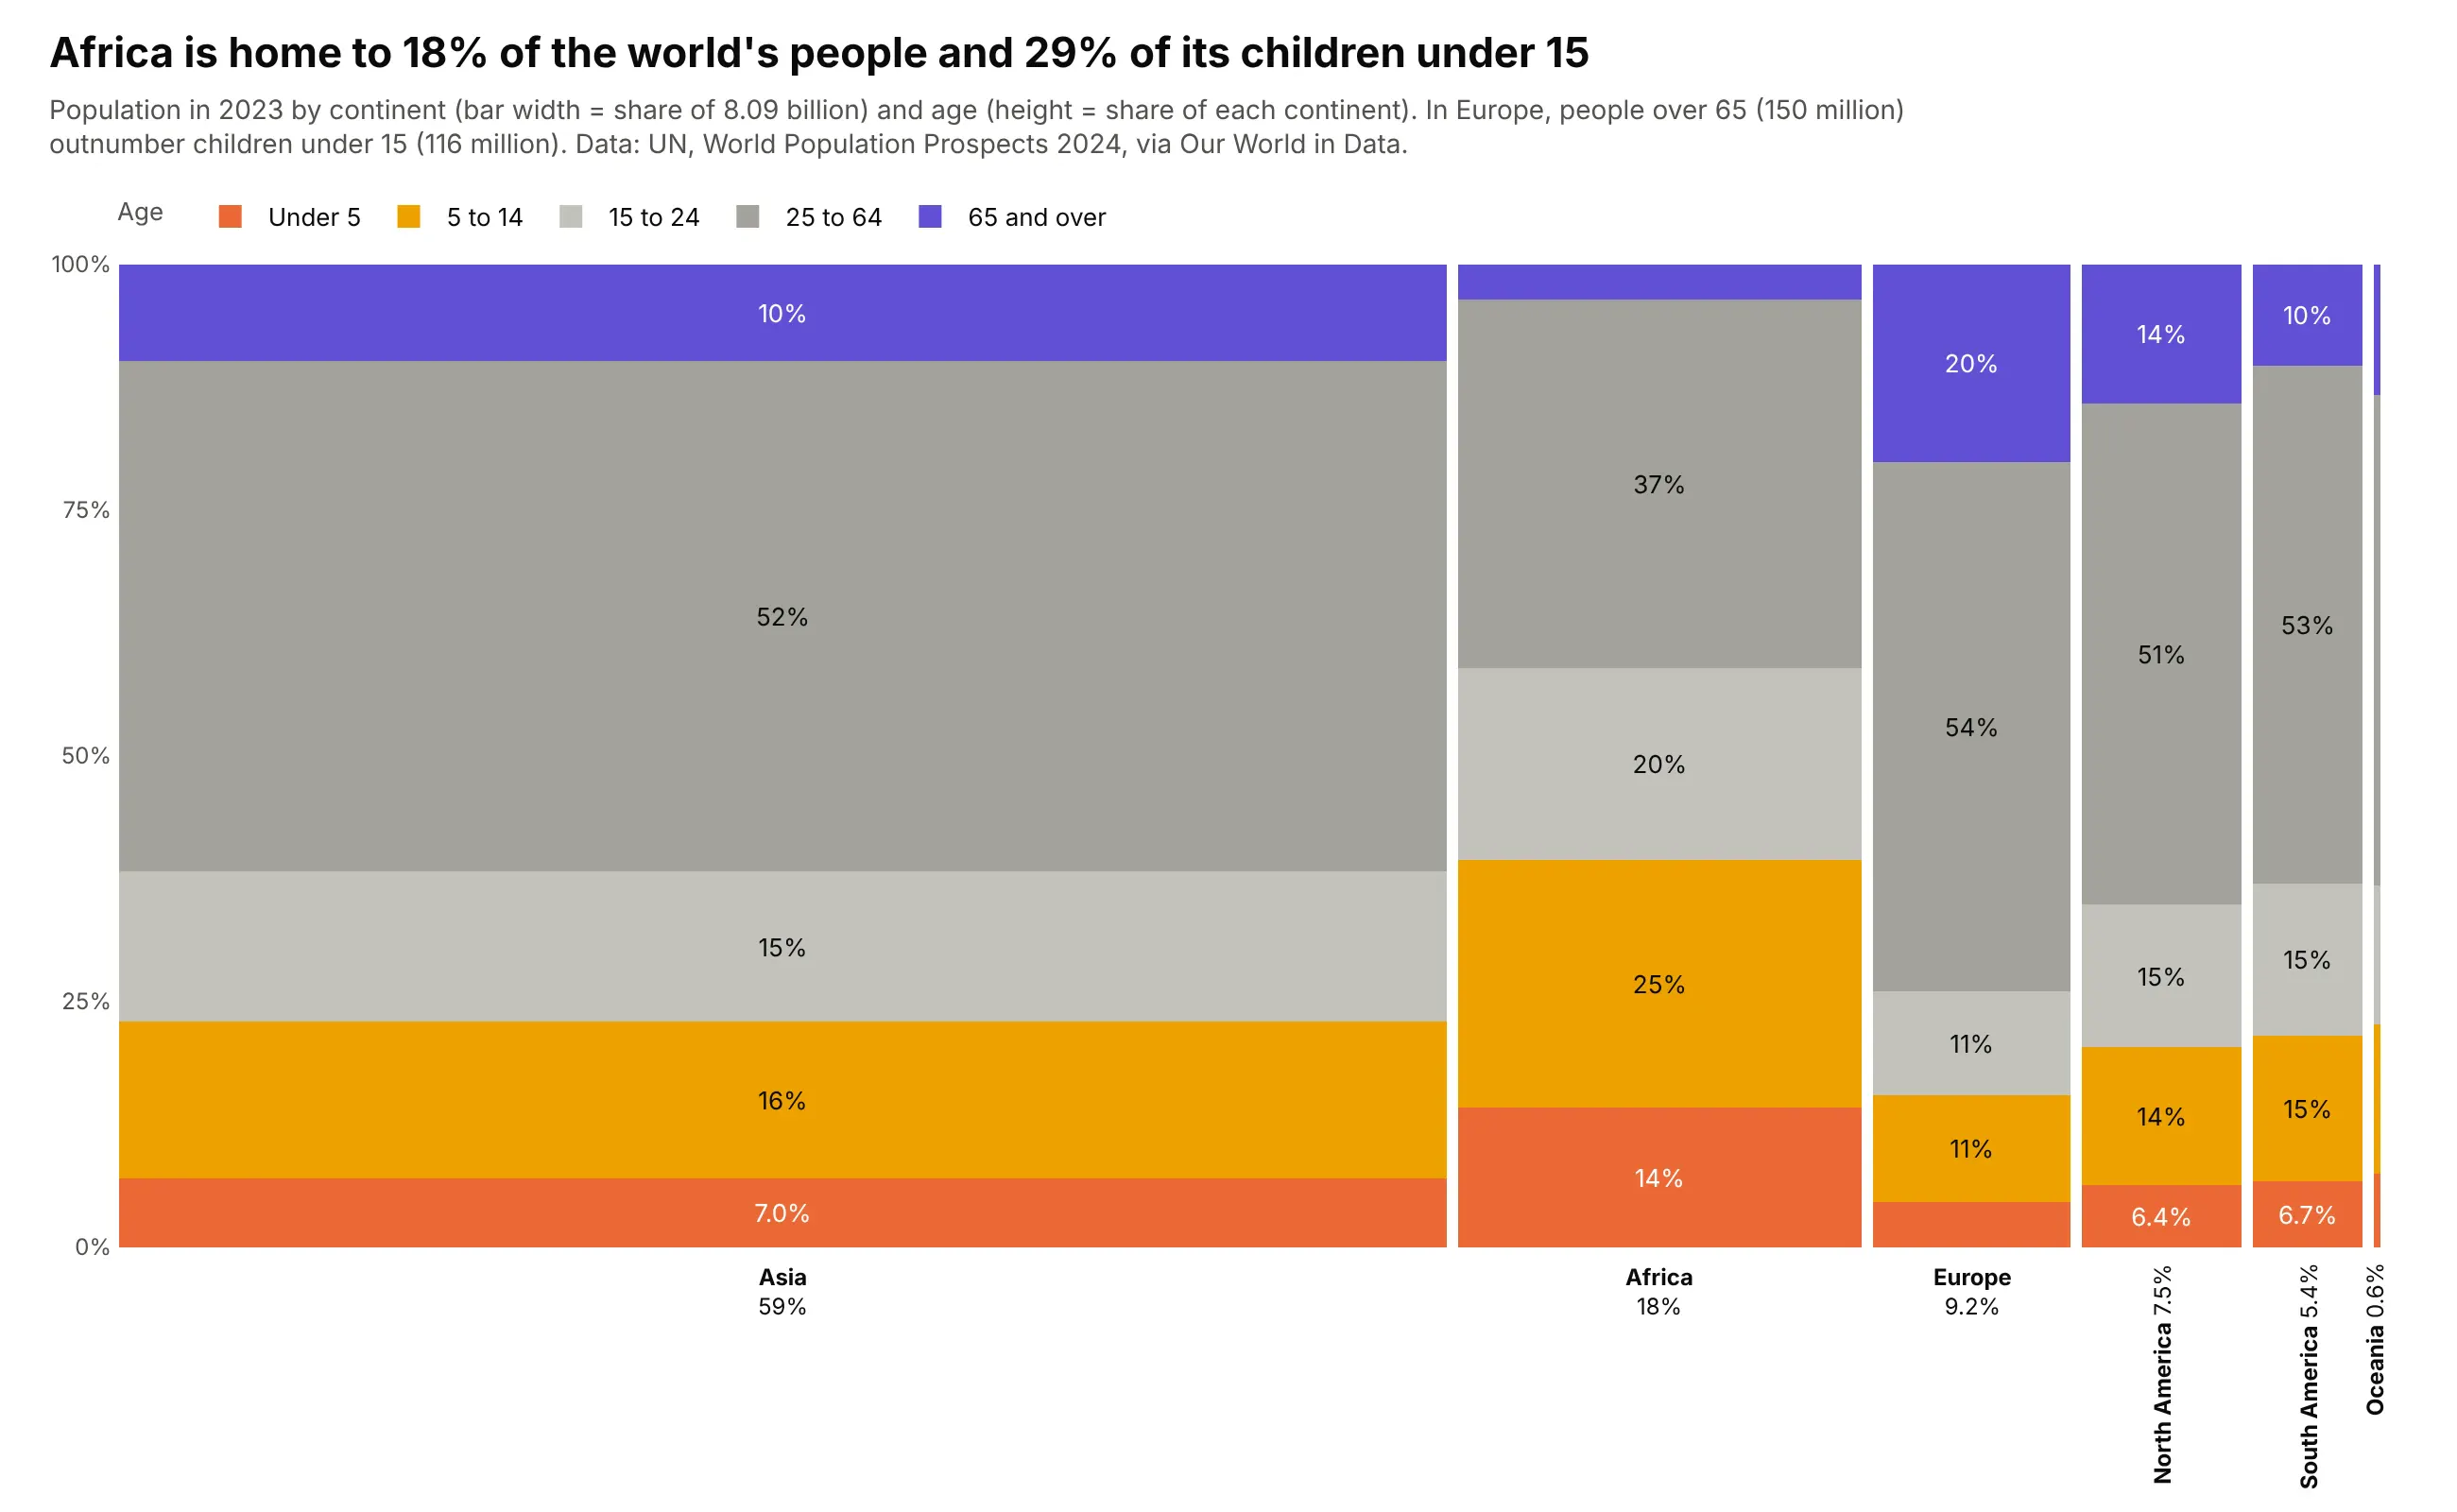
Africa has 18% of the world's 8.09 billion people and 29% of its children under 15. In Europe, people over 65 (150 million) outnumber children under 15 (116 million). Data: UN World Population Prospects 2024 via Our World in Data.
Tip: a 0.6% bar like Oceania's is fine to keep when it's labeled vertically, because it shows how small it is.
Get the data from the UN World Population Prospects 2024 via Our World in Data (population-by-age-group), 2023,and shape it into a table (columns: year, continent, age_group, people).Build a plotly Marimekko chart of continents and age groups, children warm colors at the bottom,over-65s purple on top.