
Chris Parmer
November 3, 2026
Bar Charts - A Complete Guide
TL;DR
- A bar chart draws one rectangle per category, with its length proportional to a value, so you compare categories by comparing lengths that start at the same zero baseline.
- Bar charts are also known as bar graphs, bar plots and, when the bars are vertical, column charts, and are similar to lollipop charts, dot plots and histograms.
- With several series, the bars can sit side by side (a grouped bar chart), on top of each other (a stacked bar chart), scaled to 100% (a percentage bar chart), stacked up and down around zero (relative), or on top of each other in the same place (overlay).
- You can make every one of these with Plotly in one line of code: px.bar in Python, a bar trace in JavaScript, and barmode plus barnorm choose the layout.
- See 13 ways to draw a bar chart below, from sorted horizontal bars and error bars to diverging, grouped and stacked, overlay and animated bars, all on the same G20 economic data.
What is a bar chart?
Bar charts look like this:
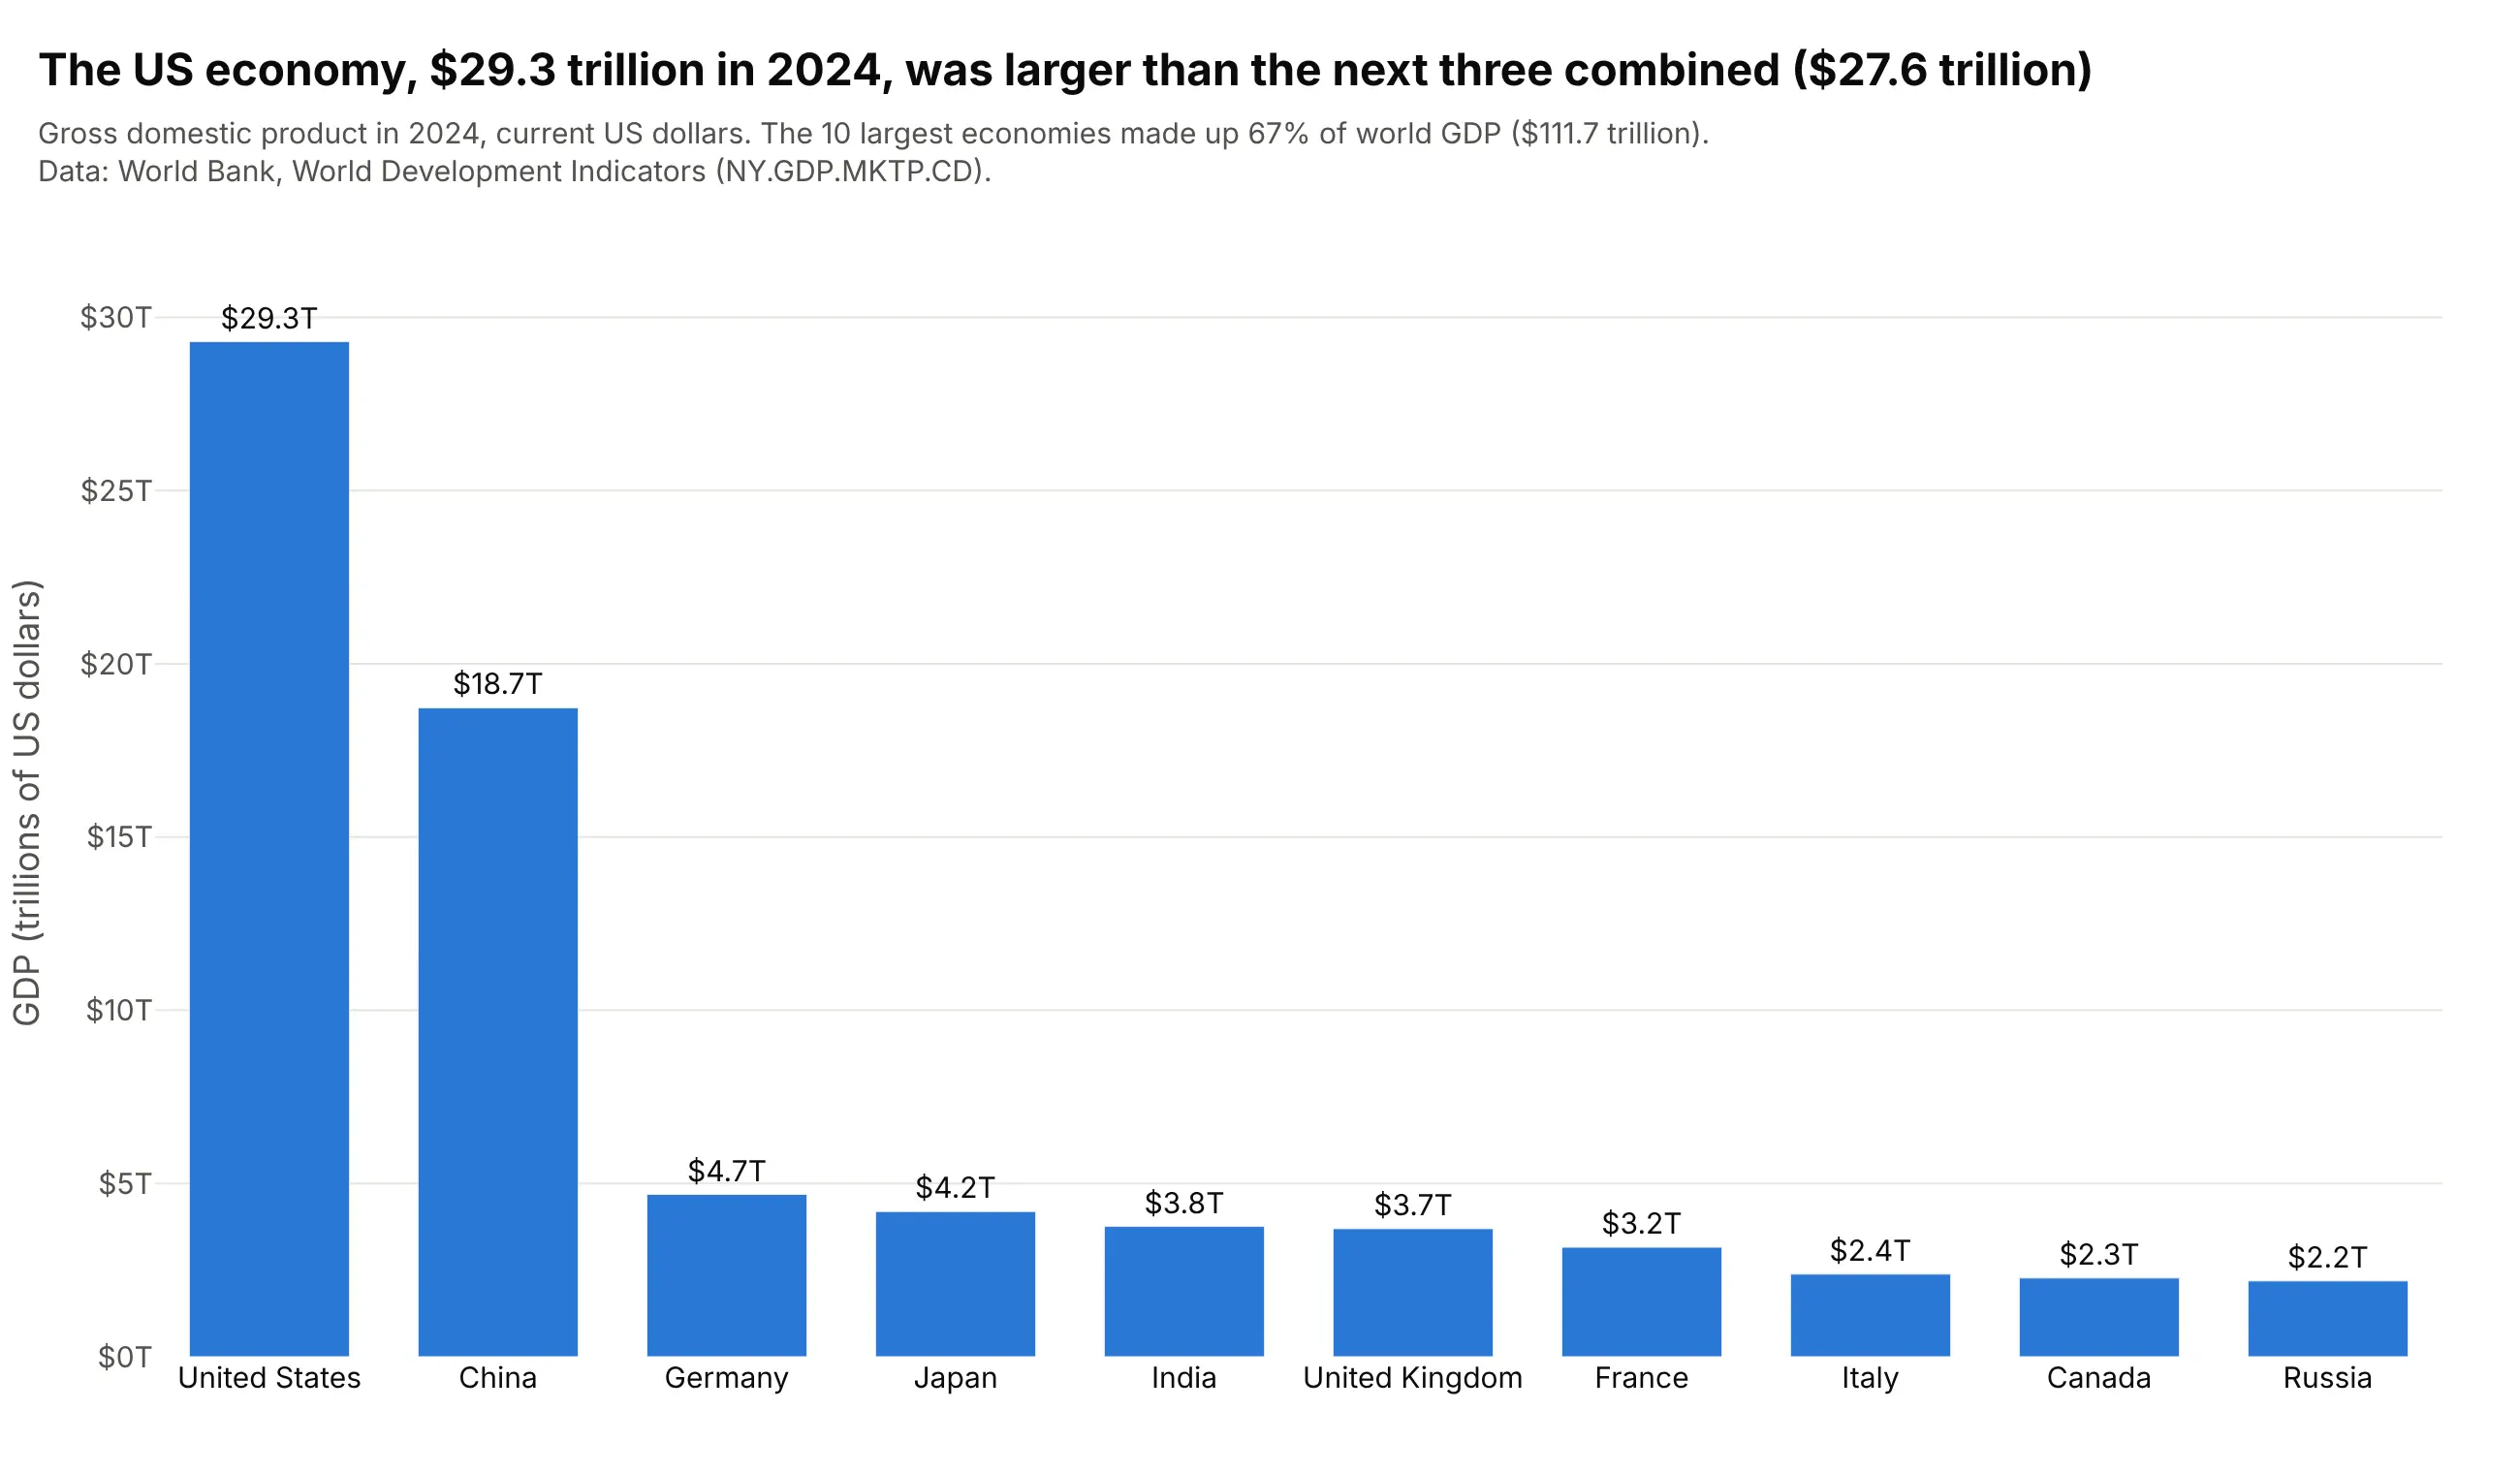
Data: World Bank, World Development Indicators (NY.GDP.MKTP.CD).
How do you read a bar chart? In the example above, notice these things:
- Each bar is one country, and its height is the country's GDP in 2024. Every bar starts at $0, so a bar twice as tall means an economy twice as large.
- The bars are sorted, which turns the chart into a ranking: the United States at $29.3 trillion, then China at $18.7 trillion, then a long step down to Germany at $4.7 trillion.
- Comparing heights answers questions a table makes you compute. The US bar is taller than China, Germany and Japan stacked together ($27.6 trillion), and about 13 times Russia's.
- The labels give the exact values, so the axis is only there for scale. Together the 10 bars add up to 67% of world GDP of $111.7 trillion.
It's often used for charts like these:
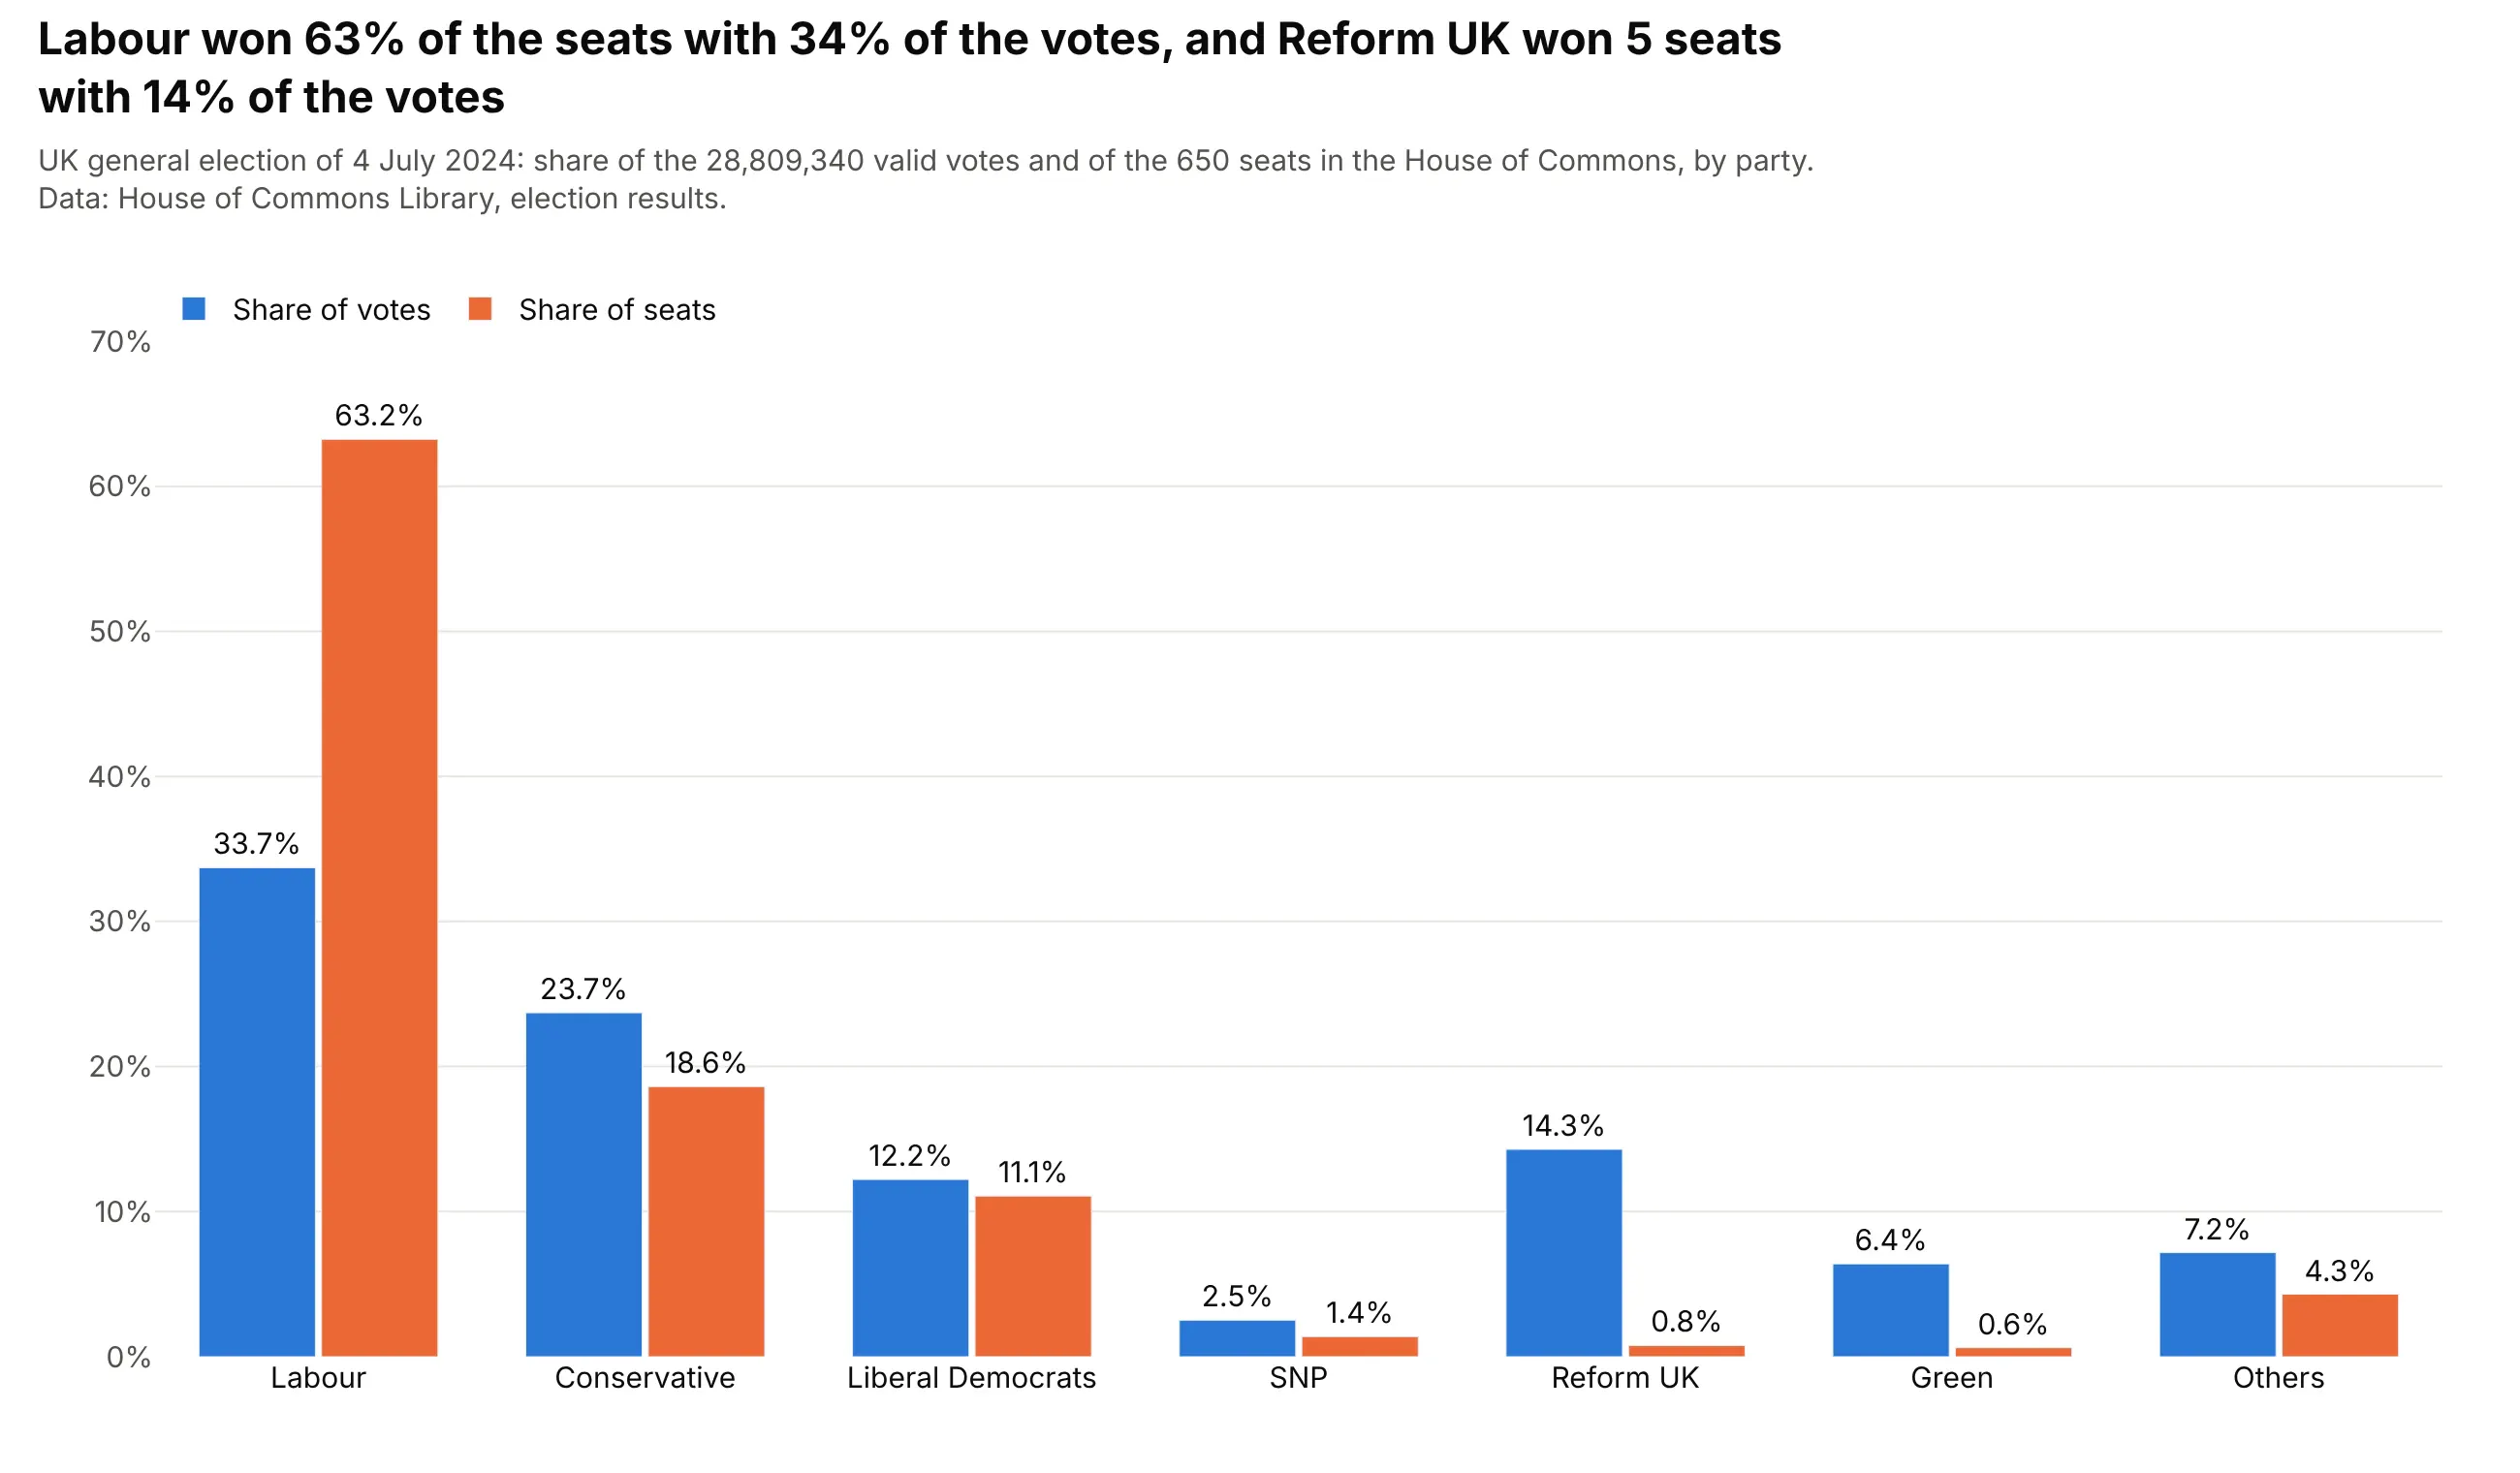
Election results. Labour won 411 of 650 seats (63%) in the 2024 UK general election with 34% of the votes, while Reform UK's 14% of the votes won 5 seats, which a grouped bar chart shows as a tall orange bar next to a short blue one and the reverse. Data: House of Commons Library, election results.
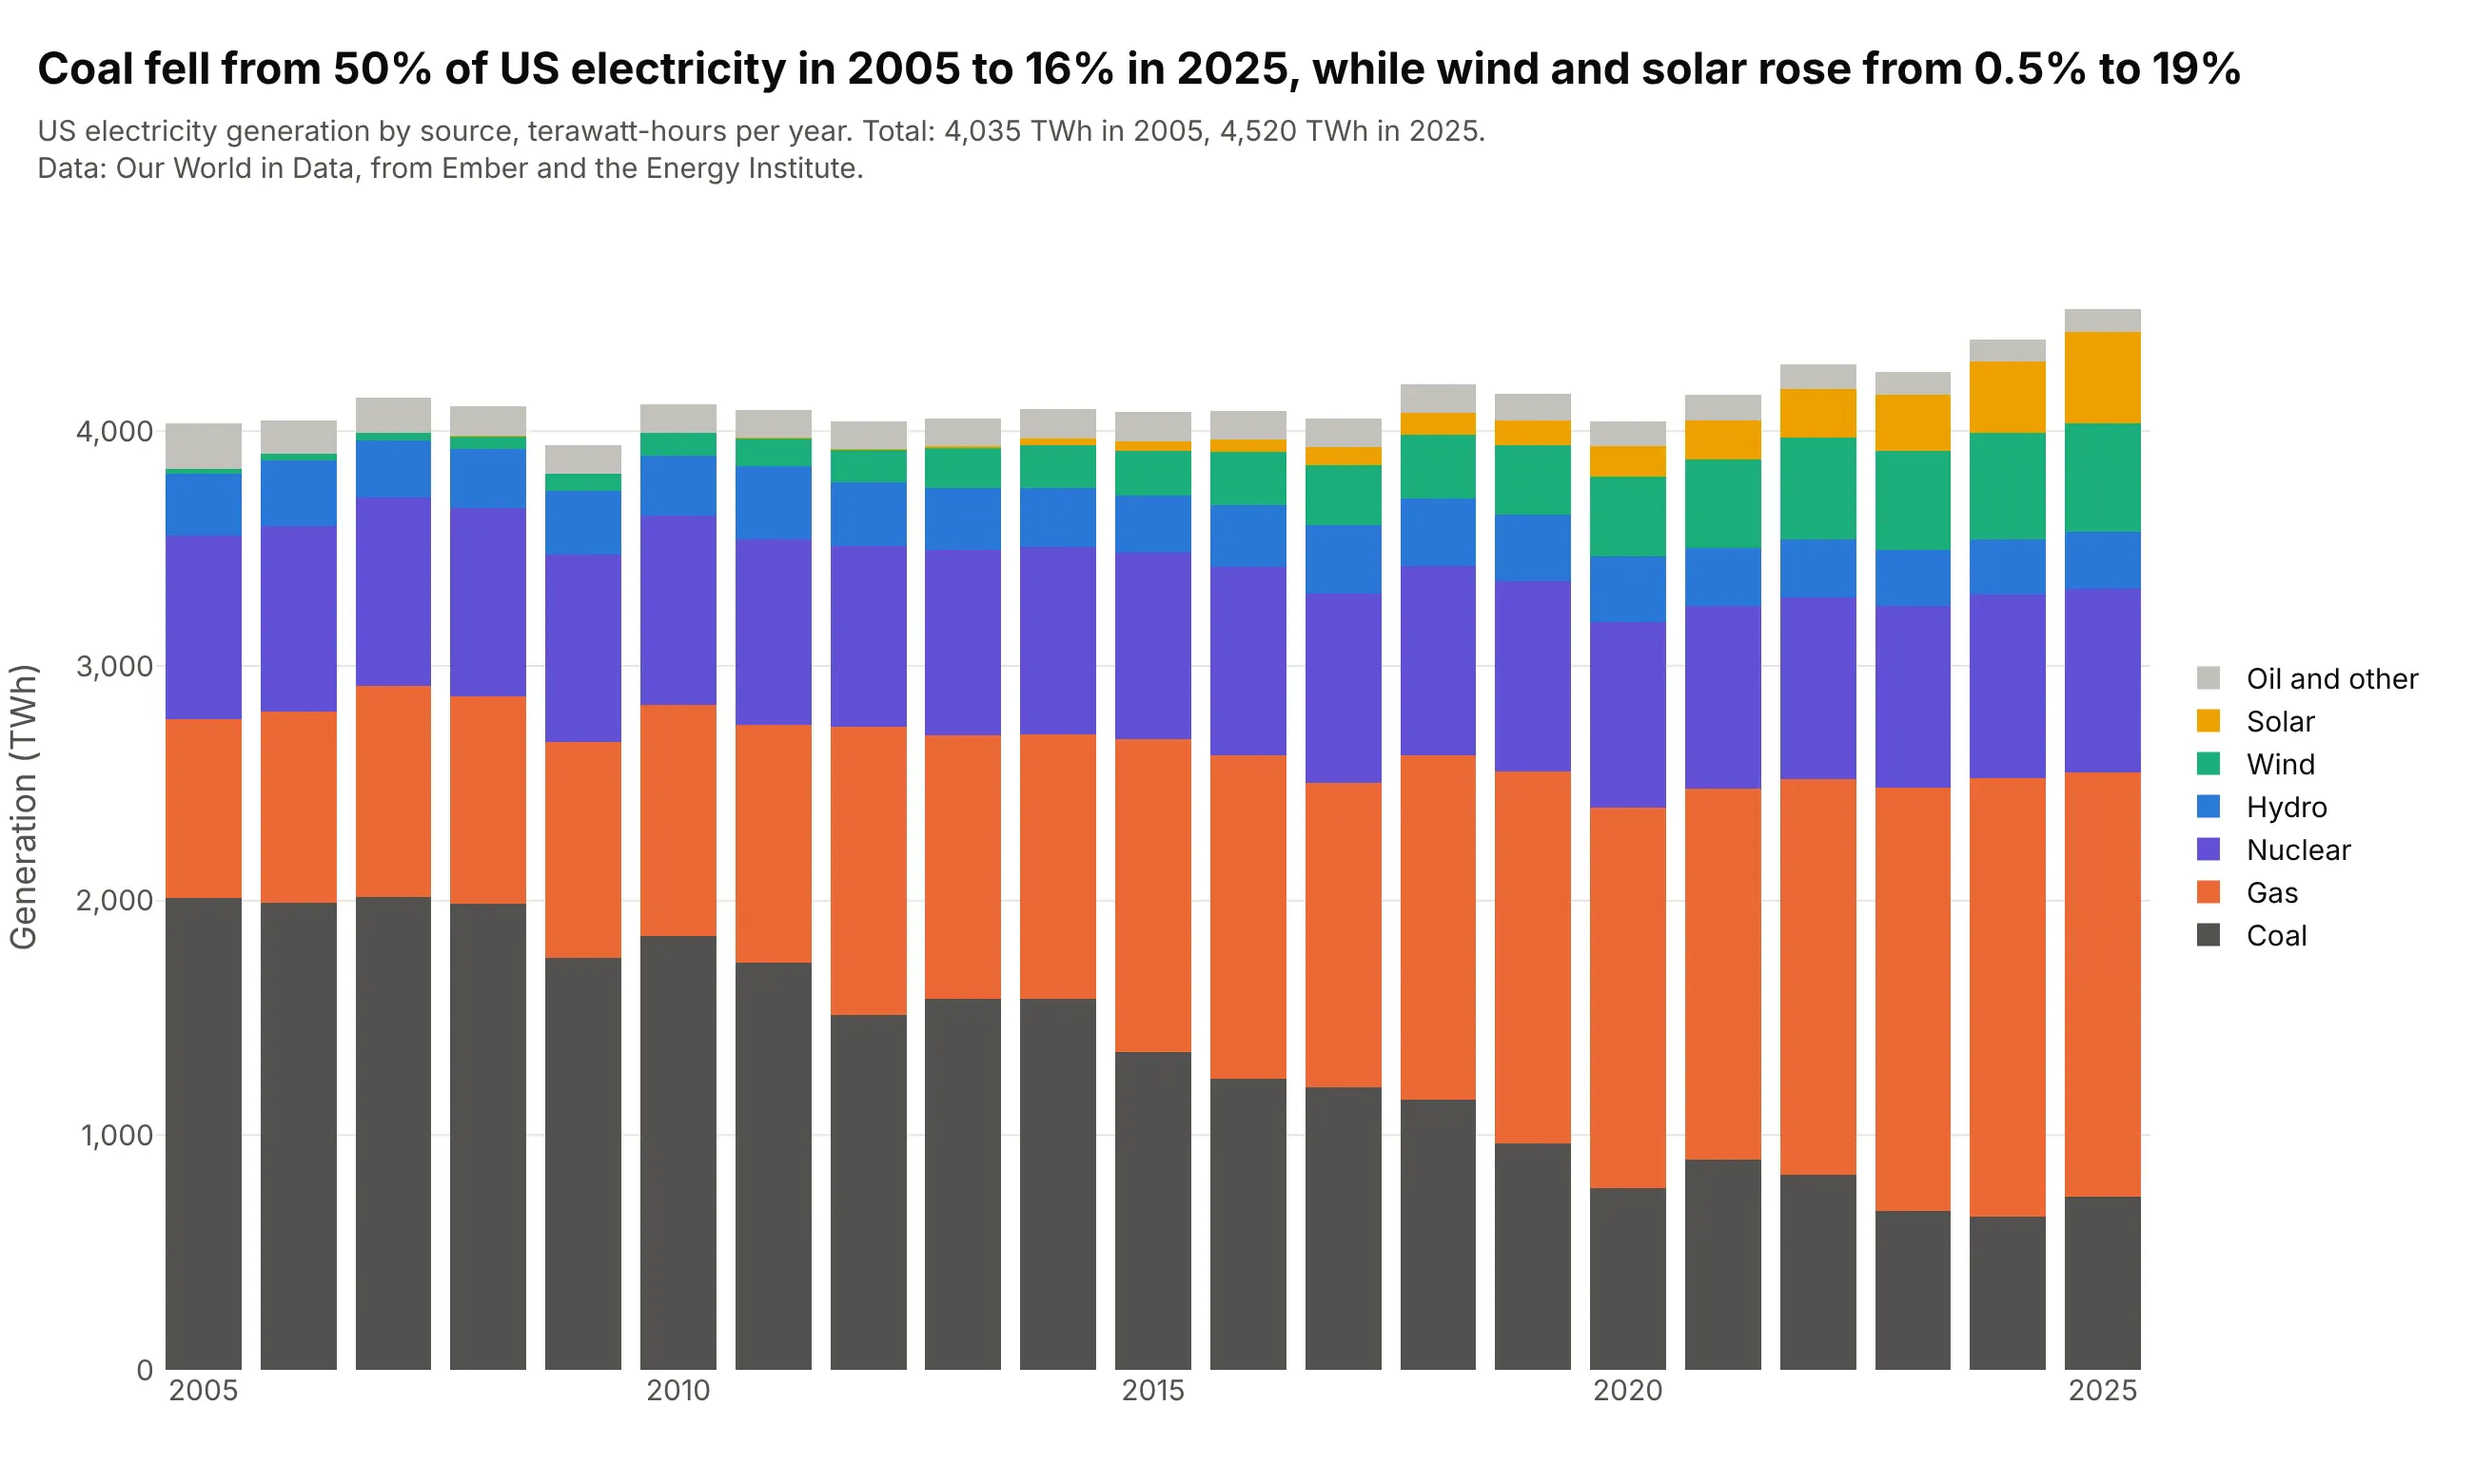
A total and its parts over time. Coal made 50% of US electricity in 2005 and 16% in 2025, while wind and solar went from 0.5% to 19%, and the stacked bars show that total generation grew from 4,035 to 4,520 TWh at the same time. Data: Our World in Data, from Ember and the Energy Institute.
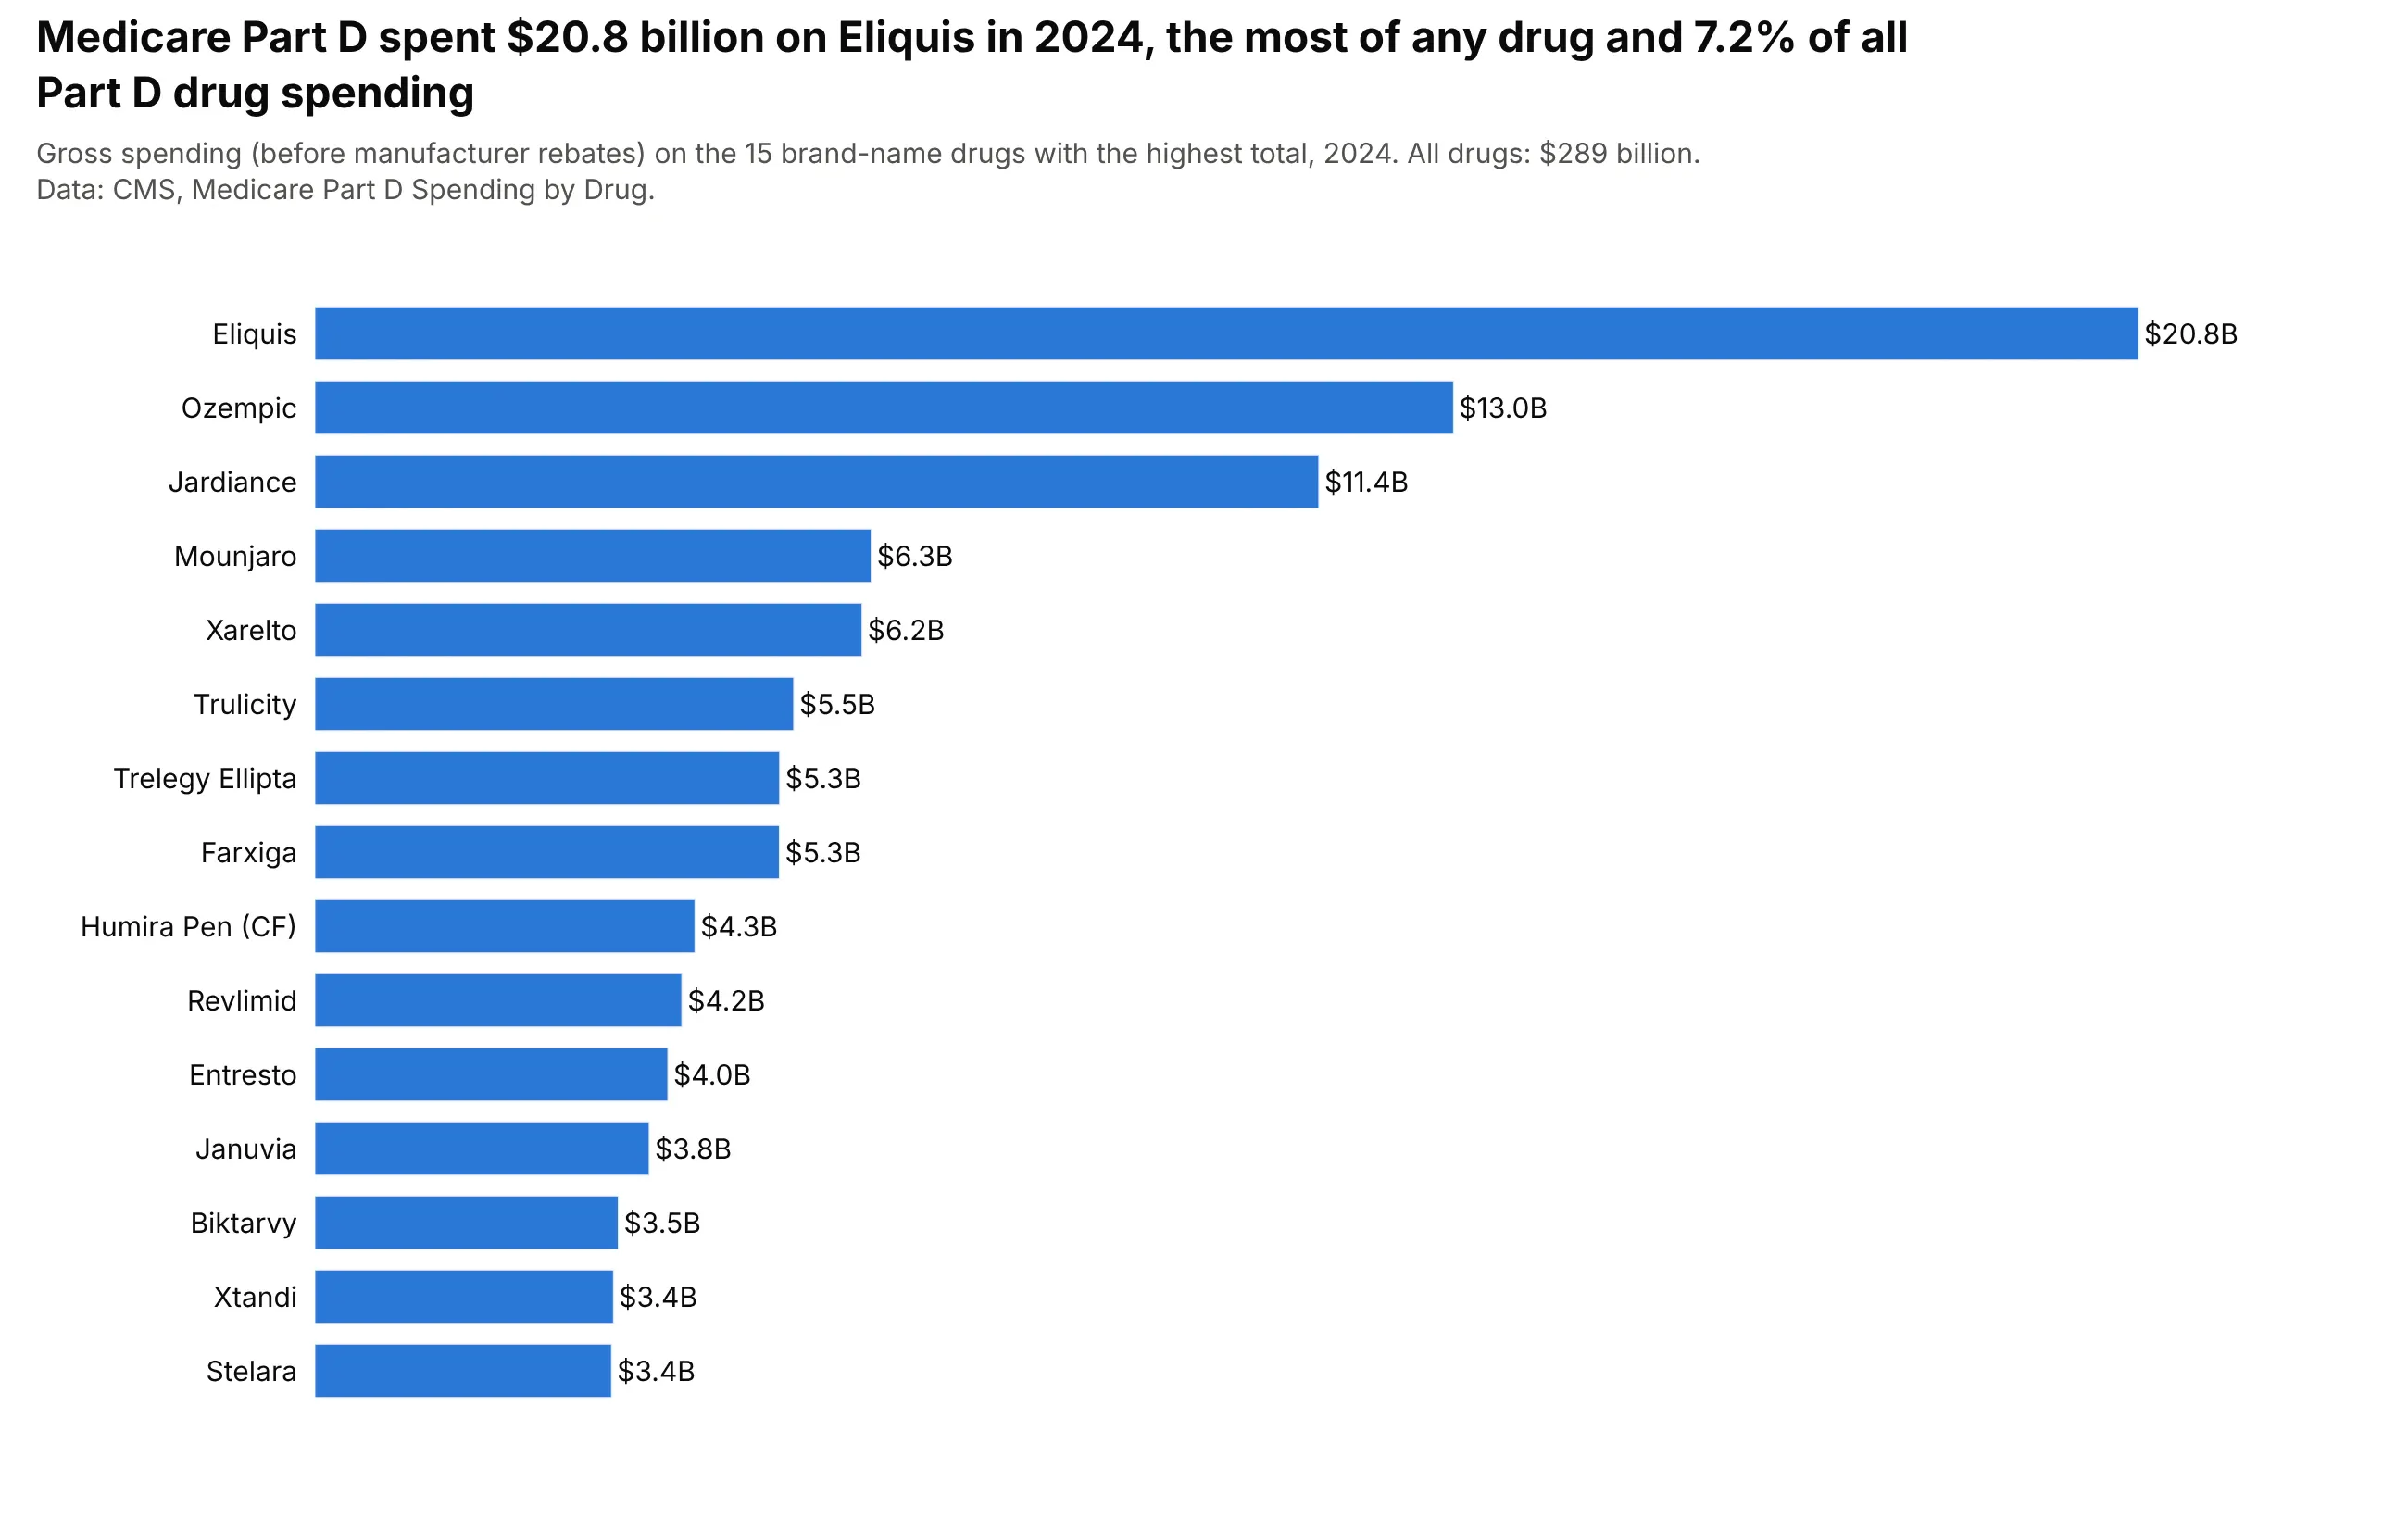
Rankings with long names. Medicare Part D spent $20.8 billion on Eliquis in 2024, 7.2% of its $289 billion in gross drug spending, and horizontal bars leave room for the drug names. Data: CMS, Medicare Part D Spending by Drug.
A short history
Many sources consider William Playfair the inventor of the bar chart. His Commercial and Political Atlas of 1786 has 43 time-series charts of trade and one bar chart: Playfair lacked a time series for Scotland, so he drew one year of its trade as a pair of bars for each of 17 trading partners (Wikipedia, after Beniger and Robyn 1978). Playfair printed no numbers on the plate, only a scale of £10,000 per division, so this redraw reads each bar against that scale:
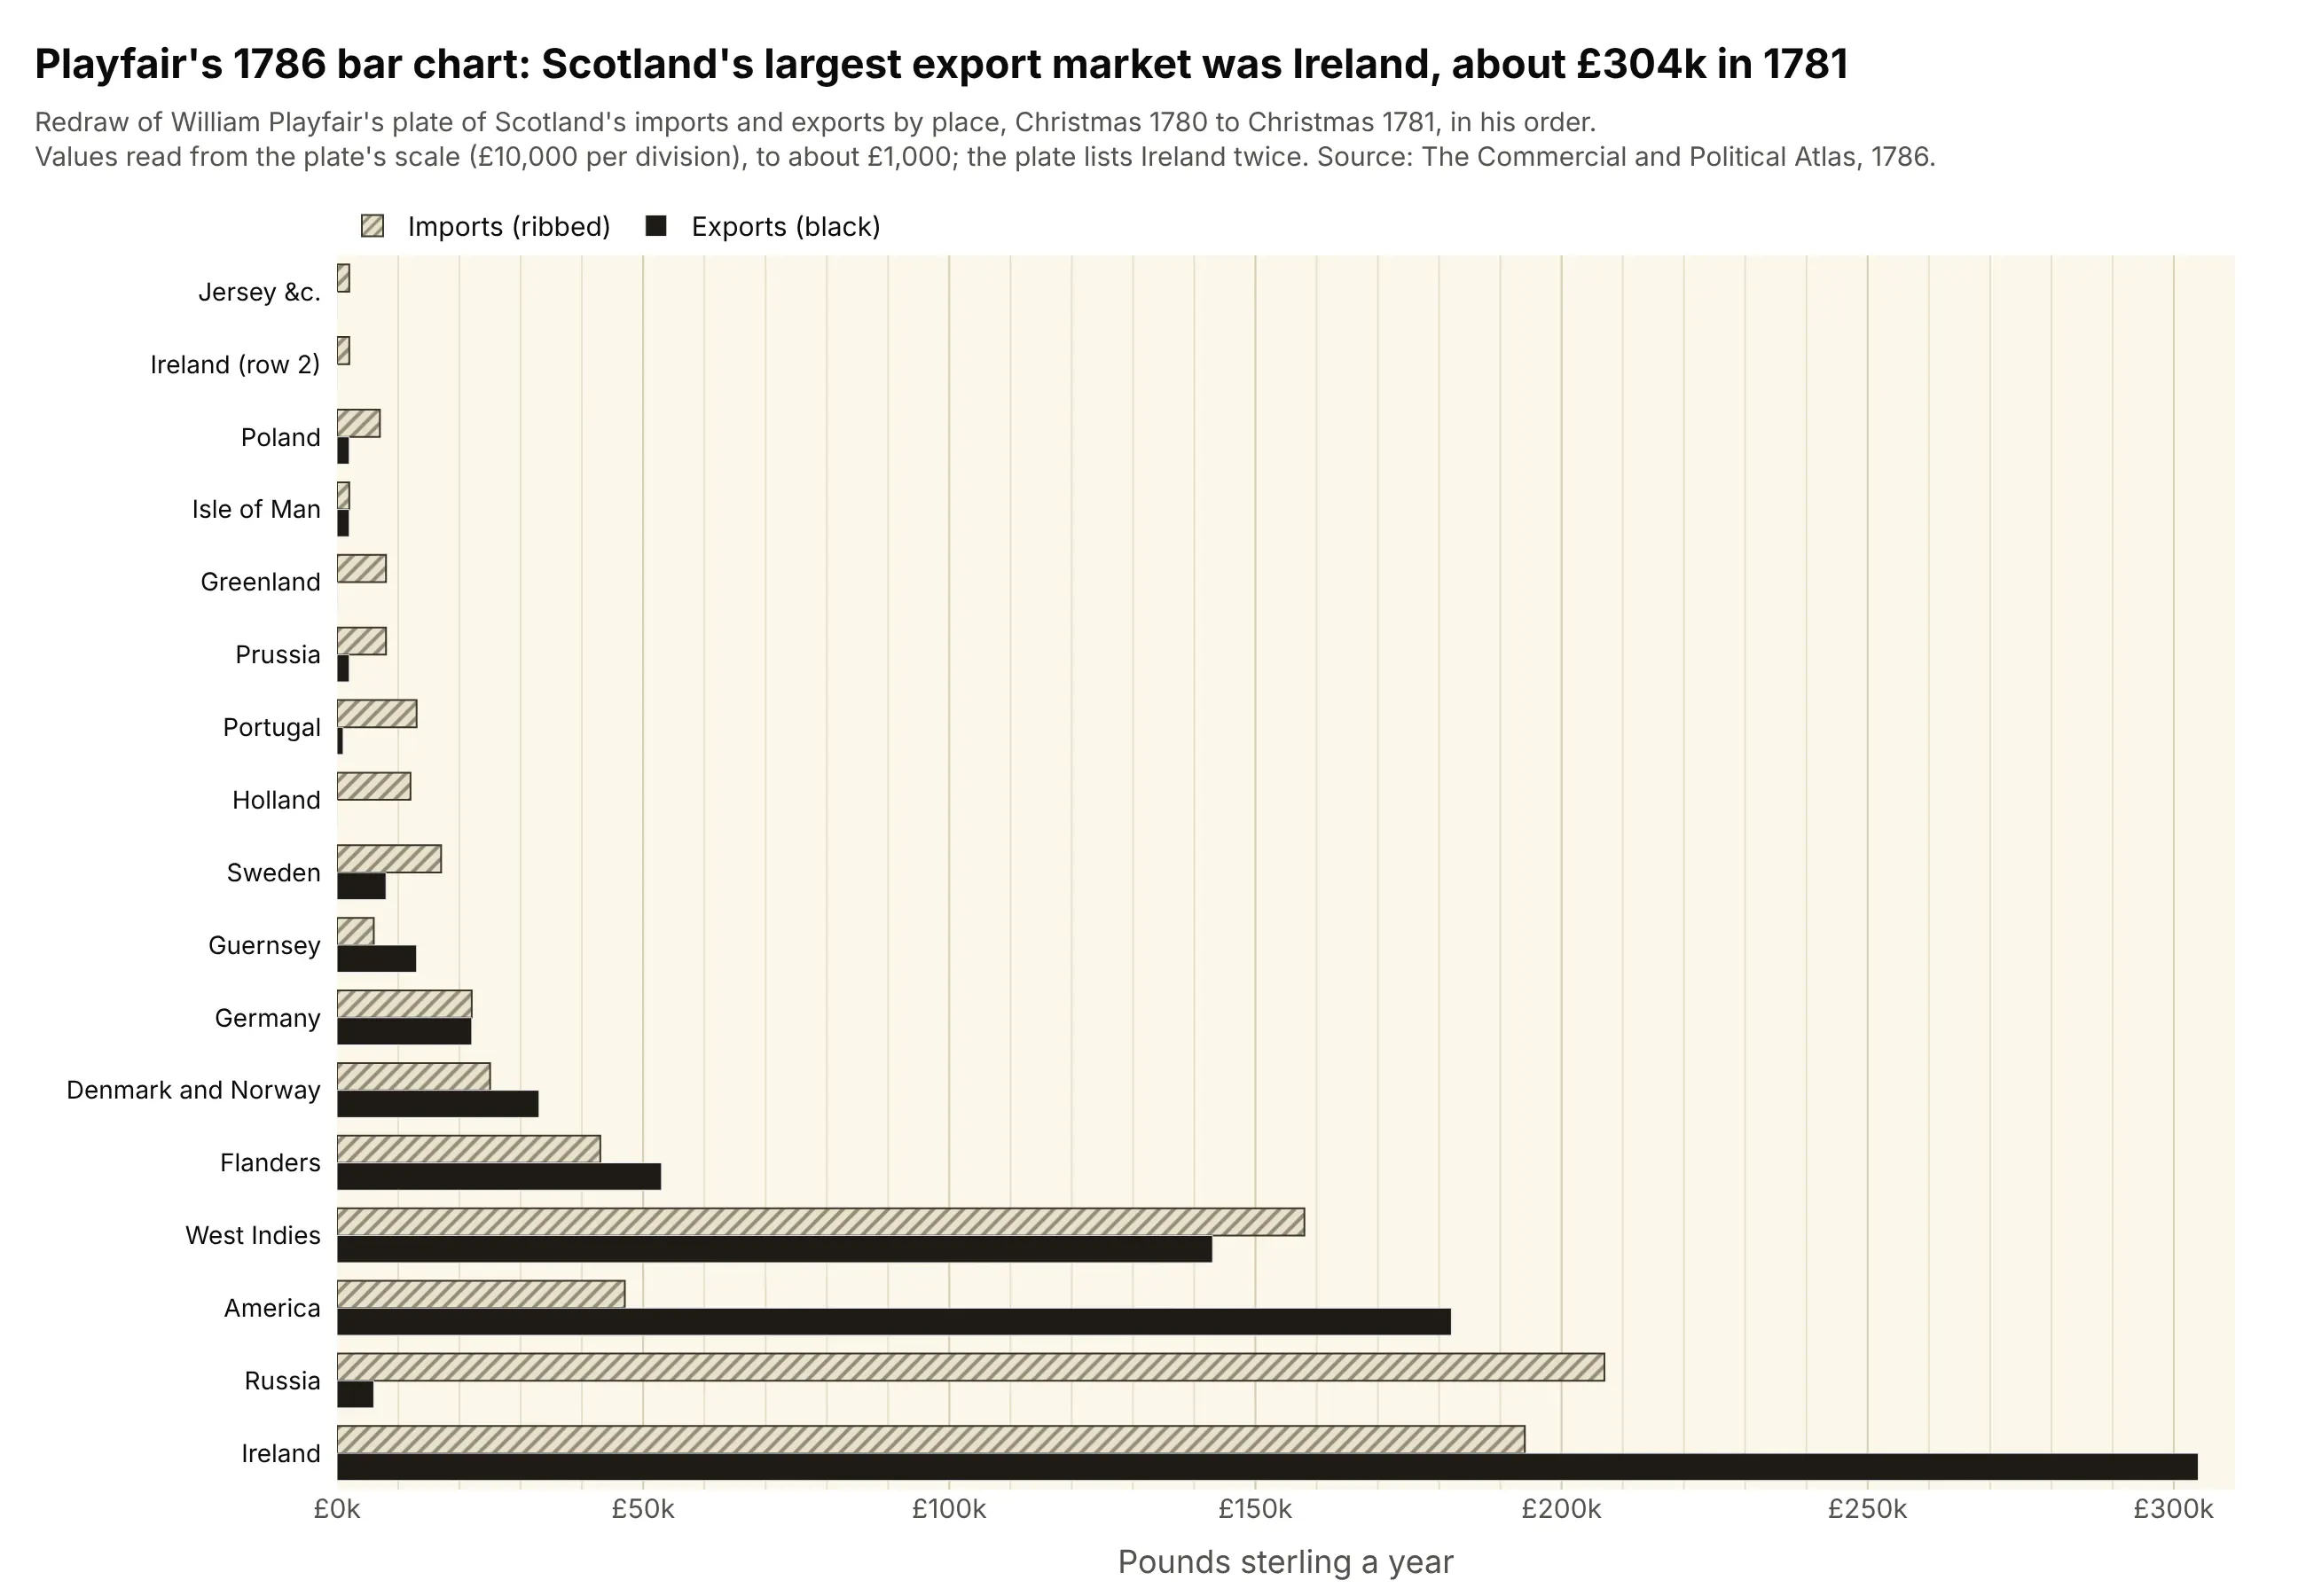
Data: values read from the plate in a public-domain scan on Wikimedia Commons, to about £1,000.

The bar chart has lasted because it encodes values as positions along a common scale, which Cleveland and McGill found people judge more accurately than angles, areas or color (1984).
Alternatives to a bar chart
Here's the same GDP data drawn six ways. Some are better for the question, some worse, some just different:
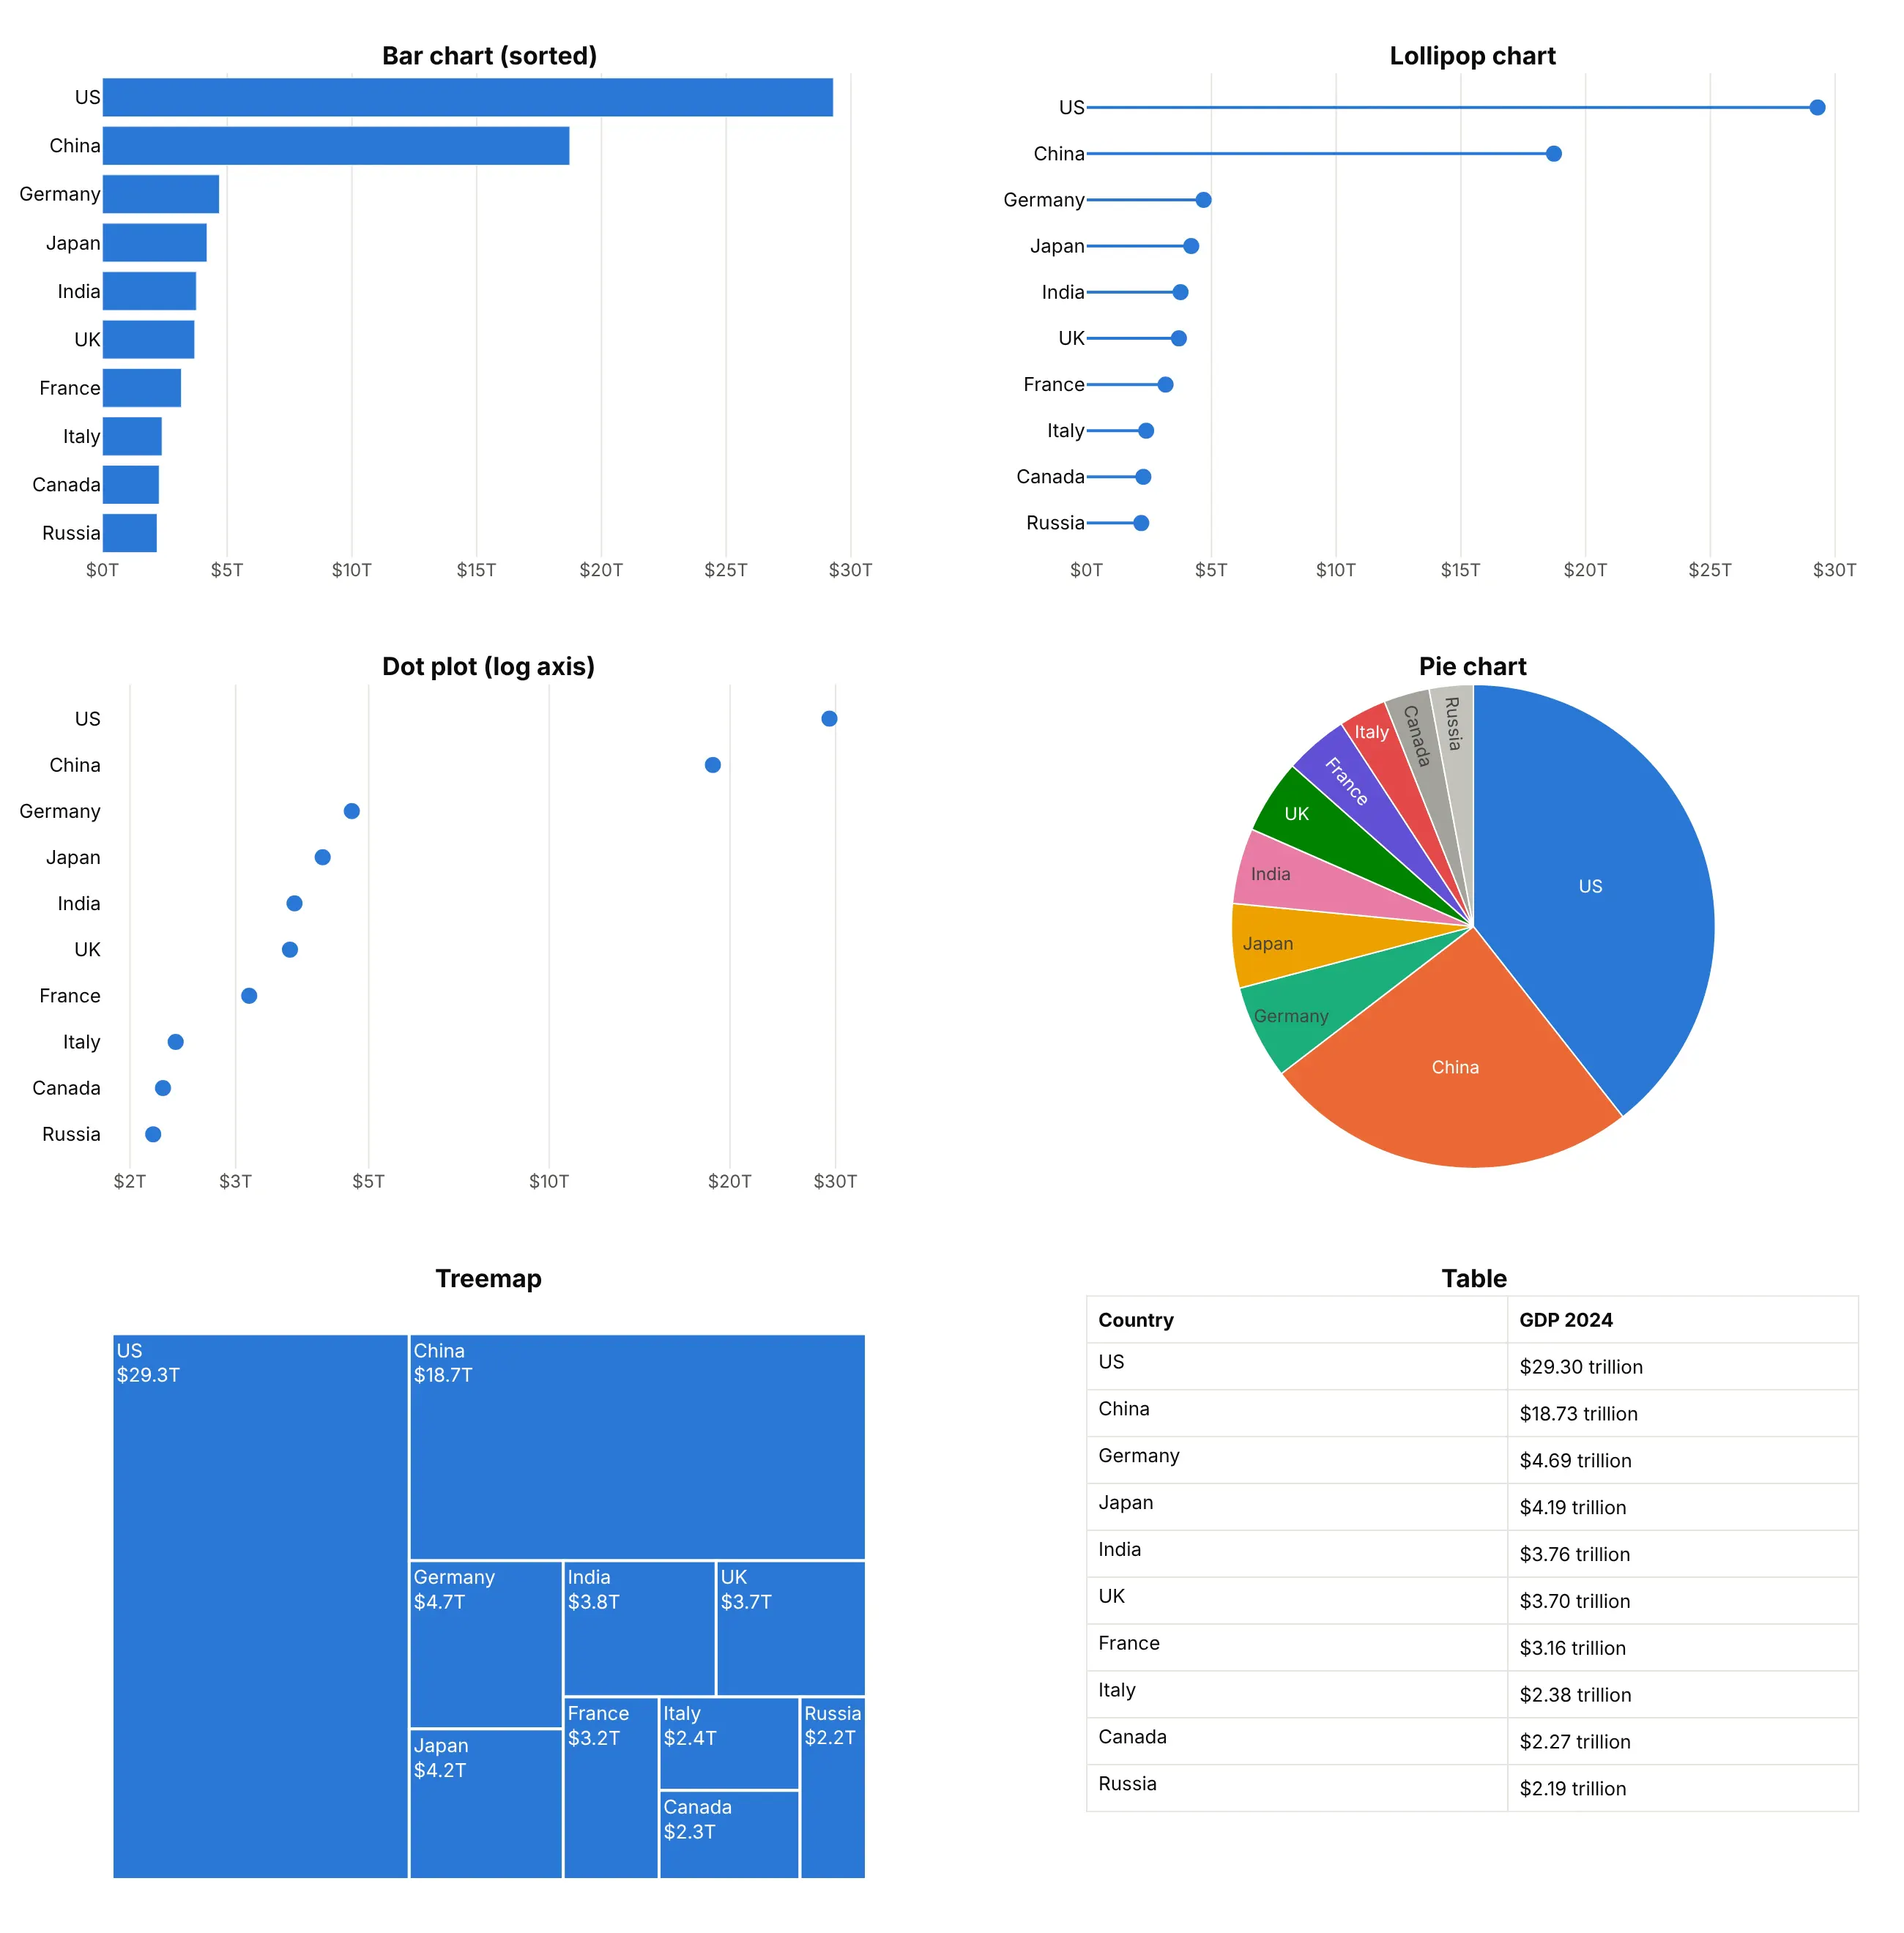
- Lollipop chart (works too). A thin line and a dot carry the same lengths with less ink, which helps when there are 30 or more categories, though a single short value is harder to see.
- Dot plot (better for a log axis). A dot doesn't need a zero baseline, so it can sit on a log scale, where the eight smaller economies spread out instead of all looking small next to the US. Bars on a log axis would mislead, because their lengths no longer mean anything.
- Pie chart (worse here). Angles are harder to compare than lengths, and with 10 slices India and the UK look the same.
- Treemap (different). Areas show each country's share of the 10 at a glance and scale to hundreds of items, but precise comparisons are harder.
- Table (better for exact values). When readers will look up one number, a sorted table does that better than any chart.
For data with more structure, other guides cover the variants of the bar chart: a waterfall chart for a total built from positive and negative steps, a Marimekko chart for 100% stacked bars whose widths also carry a value, and a Likert chart for survey answers stacked around a neutral middle.
How to make a bar chart
With AI
ChatGPT, Claude Code, GitHub Copilot, Cursor and other AI tools are excellent at writing Plotly code. Name Plotly in the prompt, and say how the bars should be laid out (grouped, stacked or 100%) and sorted:
Make a plotly bar chart from gdp_2024.csv (columns: country, gdp_trillion).- Use px.bar with the 10 largest countries, sorted largest first, one color.- Print each value above its bar as "$29.3T", and start the y axis at 0.- Fixed width and height, Inter font, and a title that states the takeaway.- Check: print the 10 values and their sum.
With Plotly Studio
Plotly Studio is a desktop app where you point an AI at a dataset and it builds charts and a Dash app around your questions, so it also works as a grouped bar chart maker. Ask for a bar chart the same way:
Show a grouped bar chart of each party's share of the votes and share of the seats in the 2024 UK general election, parties in order of seats won, with the values on the bars.
Make a bar chart in Python or JavaScript
This is the code AI tools write under the hood. In Python, Plotly Express makes a bar chart from a DataFrame in one line of code with px.bar, and the Plotly bar chart documentation covers every layout:
import pandas as pdimport plotly.express as pxdf = pd.read_csv("gdp_2024.csv") # one row per country: country, gdp_trilliontop = df.nlargest(10, "gdp_trillion")fig = px.bar(top, x="country", y="gdp_trillion", text_auto=".1f",labels={"country": "", "gdp_trillion": "GDP (trillions of US dollars)"})fig.update_traces(textposition="outside")fig.show()
For a horizontal bar chart, swap x and y and add orientation="h". With a column for the series in long format, color adds one bar per series, and barmode and barnorm choose how they sit:
df = pd.read_csv("electricity_2024.csv") # long format: country, source, twhfig = px.bar(df, x="country", y="twh", color="source", barmode="group") # groupedfig = px.bar(df, x="country", y="twh", color="source") # stackedfig = px.bar(df, y="country", x="twh", color="source", orientation="h") # horizontal stackedfig.update_layout(barnorm="percent") # 100% stacked
In JavaScript, plotly.js draws the same thing from bar traces, and the plotly.js bar chart documentation has more examples:
<div id="chart"></div><script src="https://cdn.plot.ly/plotly-4.1.1.min.js"></script><script>// UK general election, 4 July 2024 (House of Commons Library)const parties = ["Labour", "Conservative", "Liberal Democrats", "Reform UK", "Green", "SNP", "Others"];const votes = [33.7, 23.7, 12.2, 14.3, 6.4, 2.5, 7.2]; // % of valid votesconst seats = [63.2, 18.6, 11.1, 0.8, 0.6, 1.4, 4.3]; // % of the 650 seatsPlotly.newPlot("chart", [{type: "bar", x: parties, y: votes, name: "Share of votes", marker: {color: "#2a78d6"},text: votes.map(v => v + "%"), textposition: "outside"},{type: "bar", x: parties, y: seats, name: "Share of seats", marker: {color: "#eb6834"},text: seats.map(v => v + "%"), textposition: "outside"}], {barmode: "group", // "stack", "relative" or "overlay" for the other layoutswidth: 900, height: 450, margin: {t: 30},yaxis: {ticksuffix: "%", range: [0, 70]},legend: {orientation: "h", x: 0, y: 1.1}});</script>
In a React app, the Plot component from react-plotly.js takes the same traces and layout as props: <Plot data={[{type: "bar", x: parties, y: votes}]} layout={{barmode: "group"}} />.
Share it
Every Plotly chart has a Share chart button (the cloud icon in its toolbar) that uploads it to Plotly Cloud and gives you a link. Only you can see it until you change its visibility.
For a live app, put the chart in a Dash app and publish it with the Plotly Cloud CLI. Coding agents can run these commands for you:
pip install "dash[cloud]"plotly user loginplotly app publish
If your data has to stay in your own cloud or data center, publish to Dash Enterprise instead.
Dos and don'ts
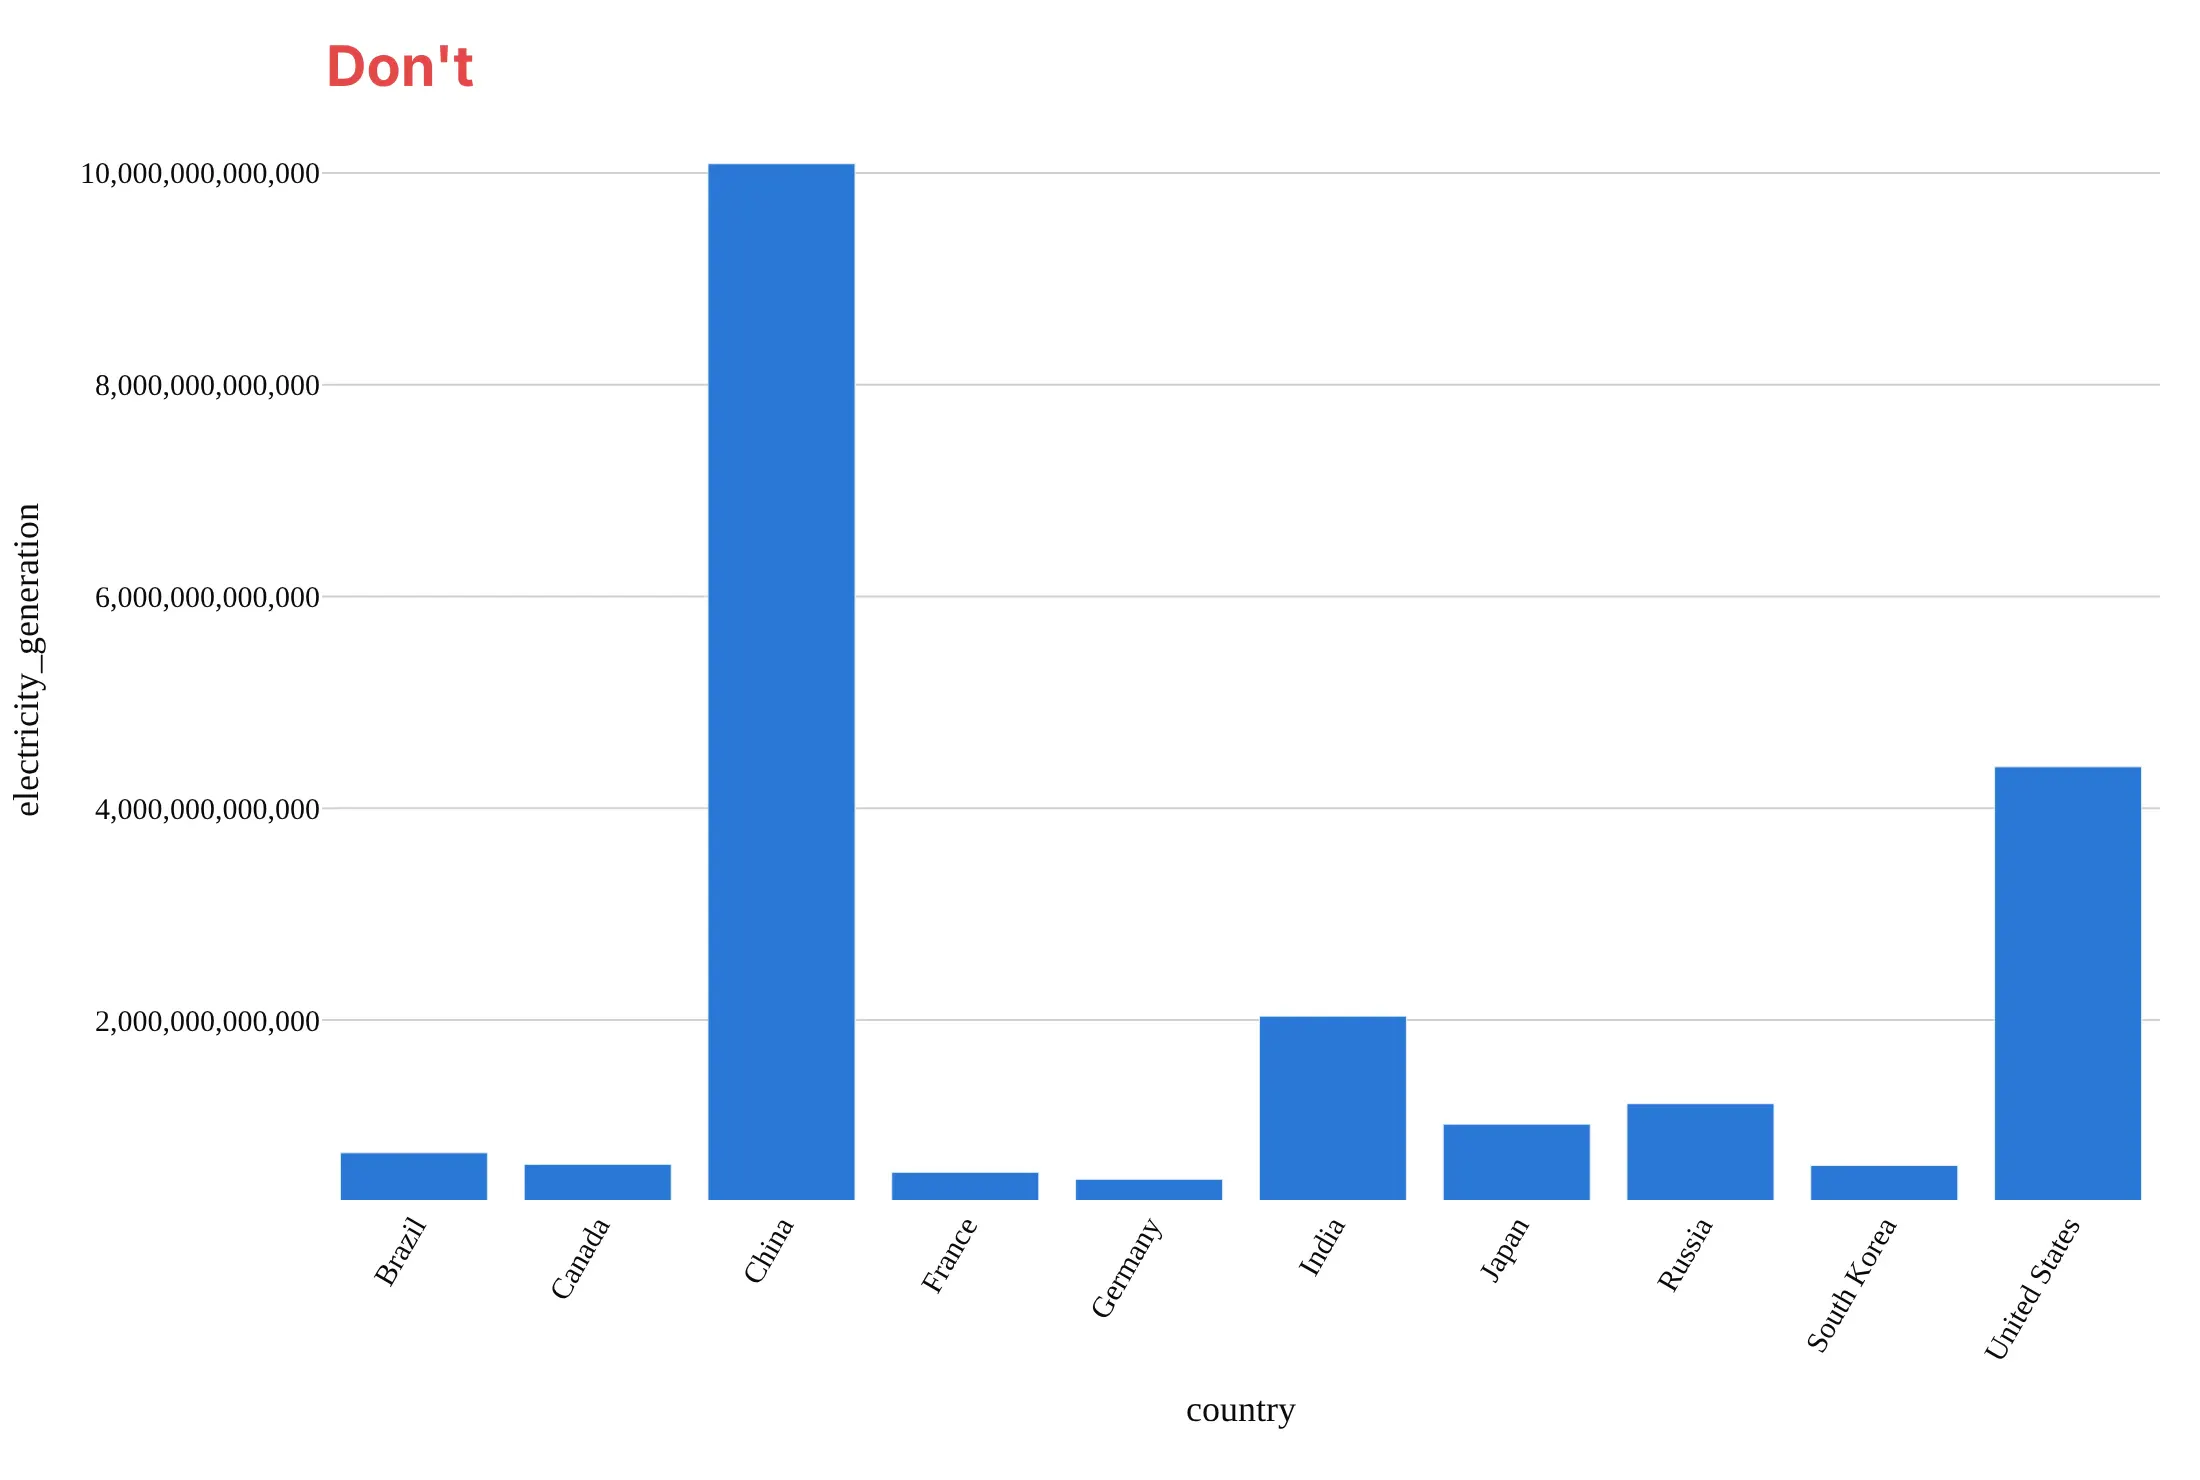
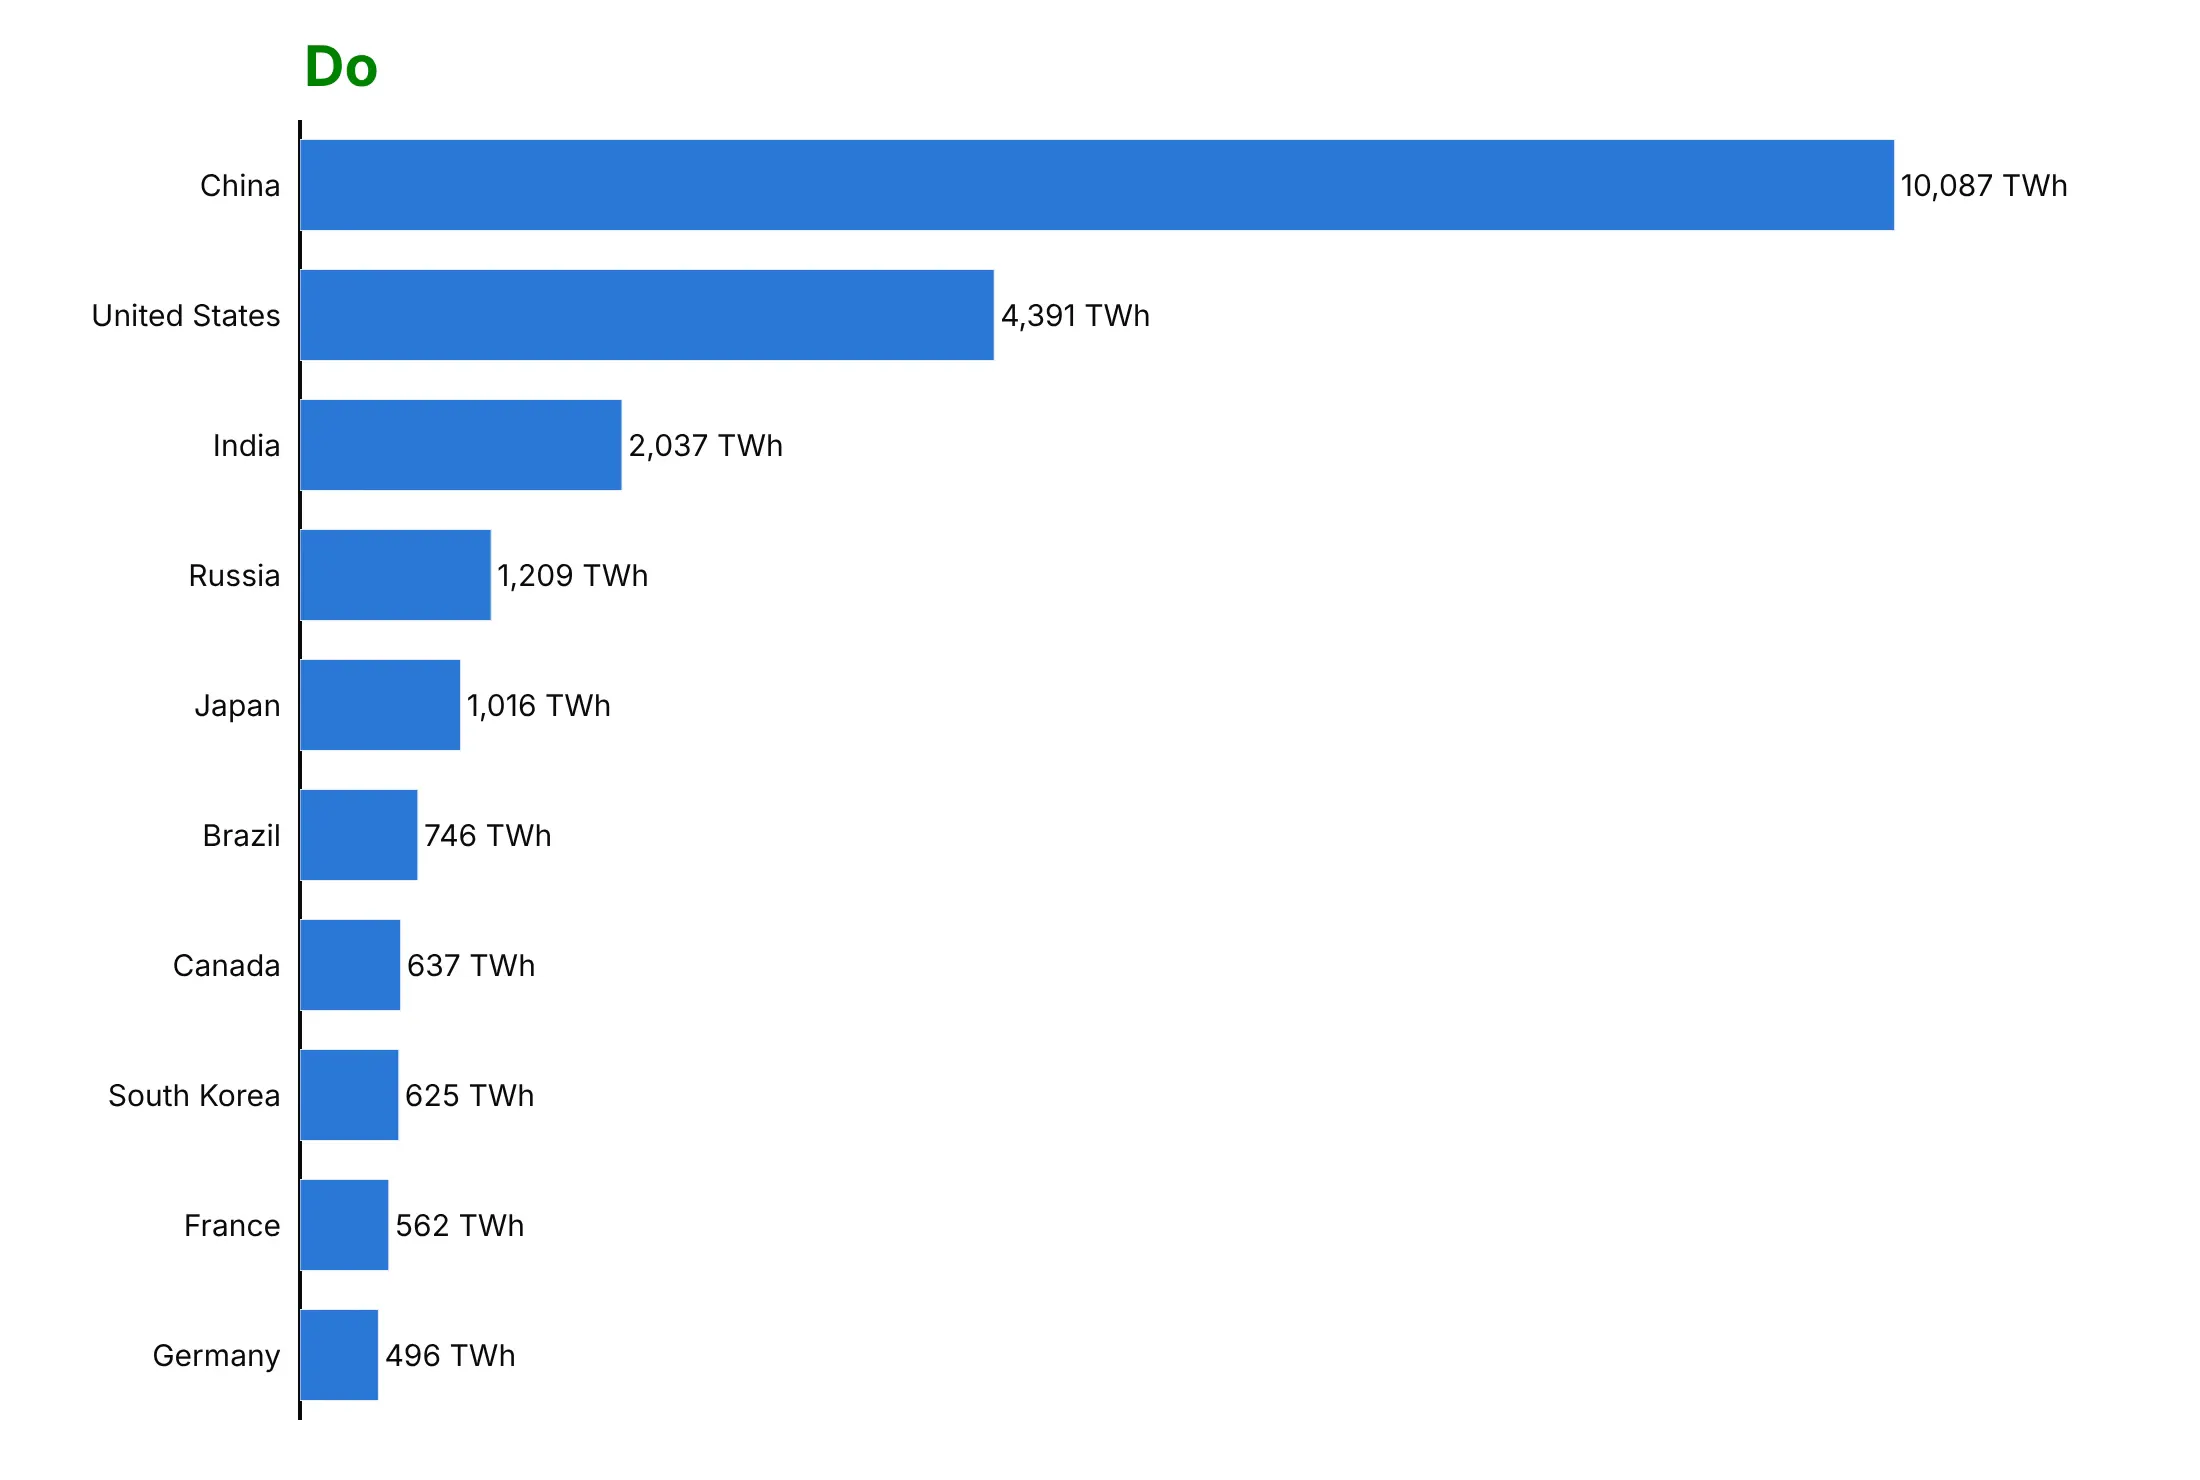
Most of what makes a bar chart honest is the baseline and the order. Here are the 10 countries that generated the most electricity in 2024 both ways, in the same color.
Don't start the value axis above zero, which makes China's bar 50 times Germany's when it generated 20 times as much, or sort the bars alphabetically, rotate the labels, print raw numbers like 10,000,000,000,000 kWh, use a raw column name as the axis title or keep a default serif font:
Do start at zero, sort the bars, turn them horizontal so the names read left to right, and print the formatted value at the end of each bar:
Choose group, stack or percent
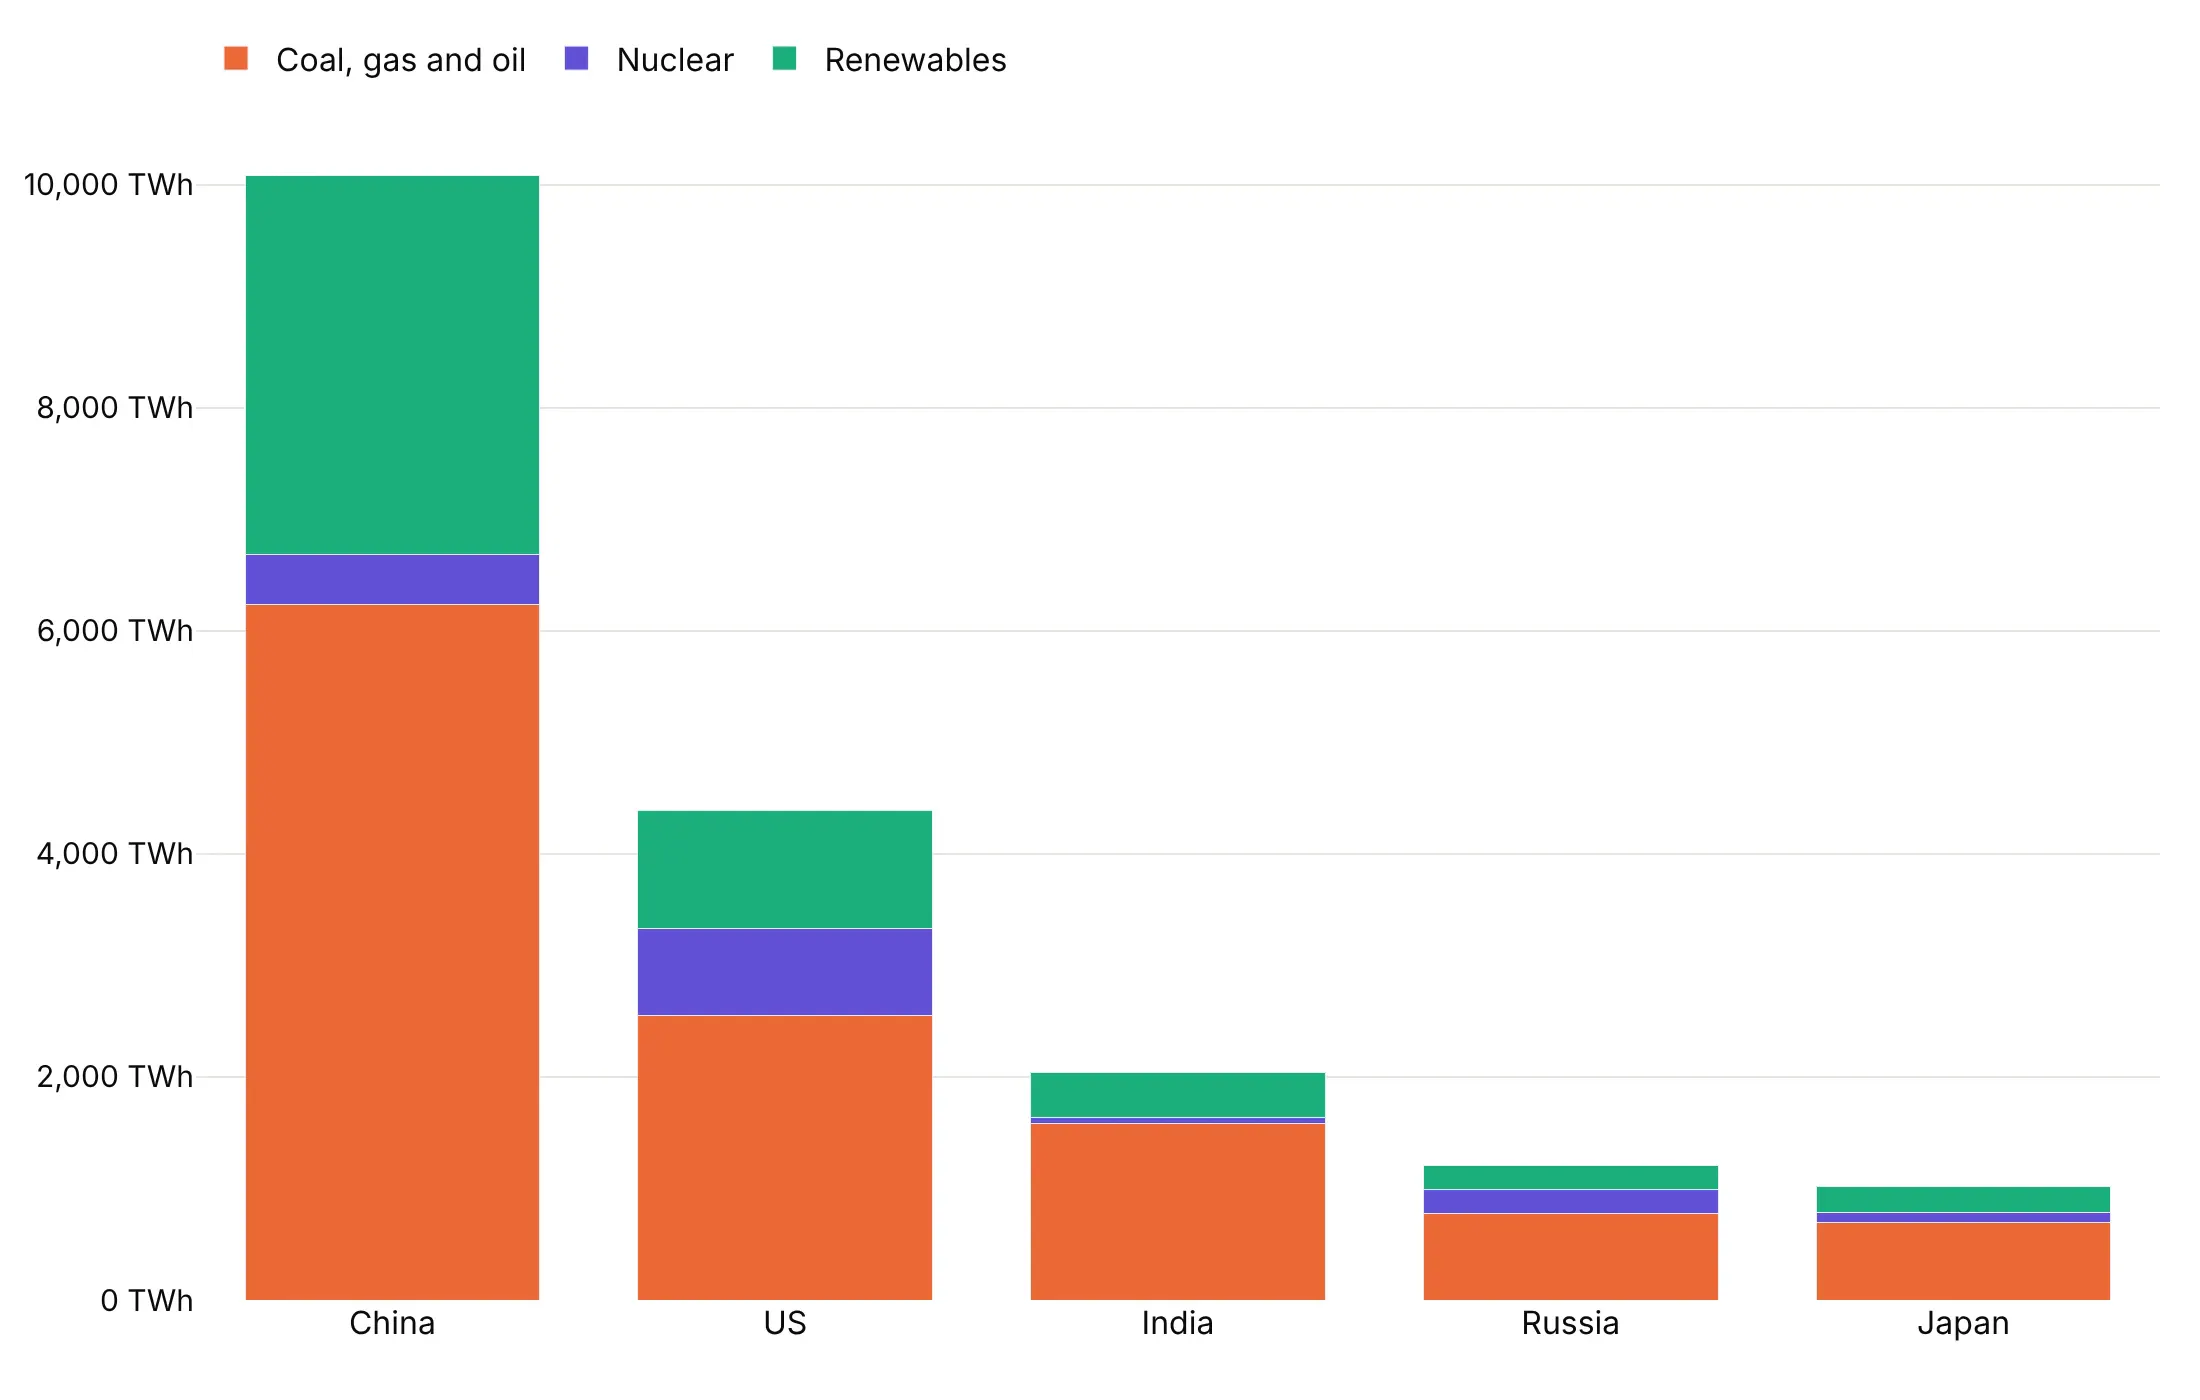
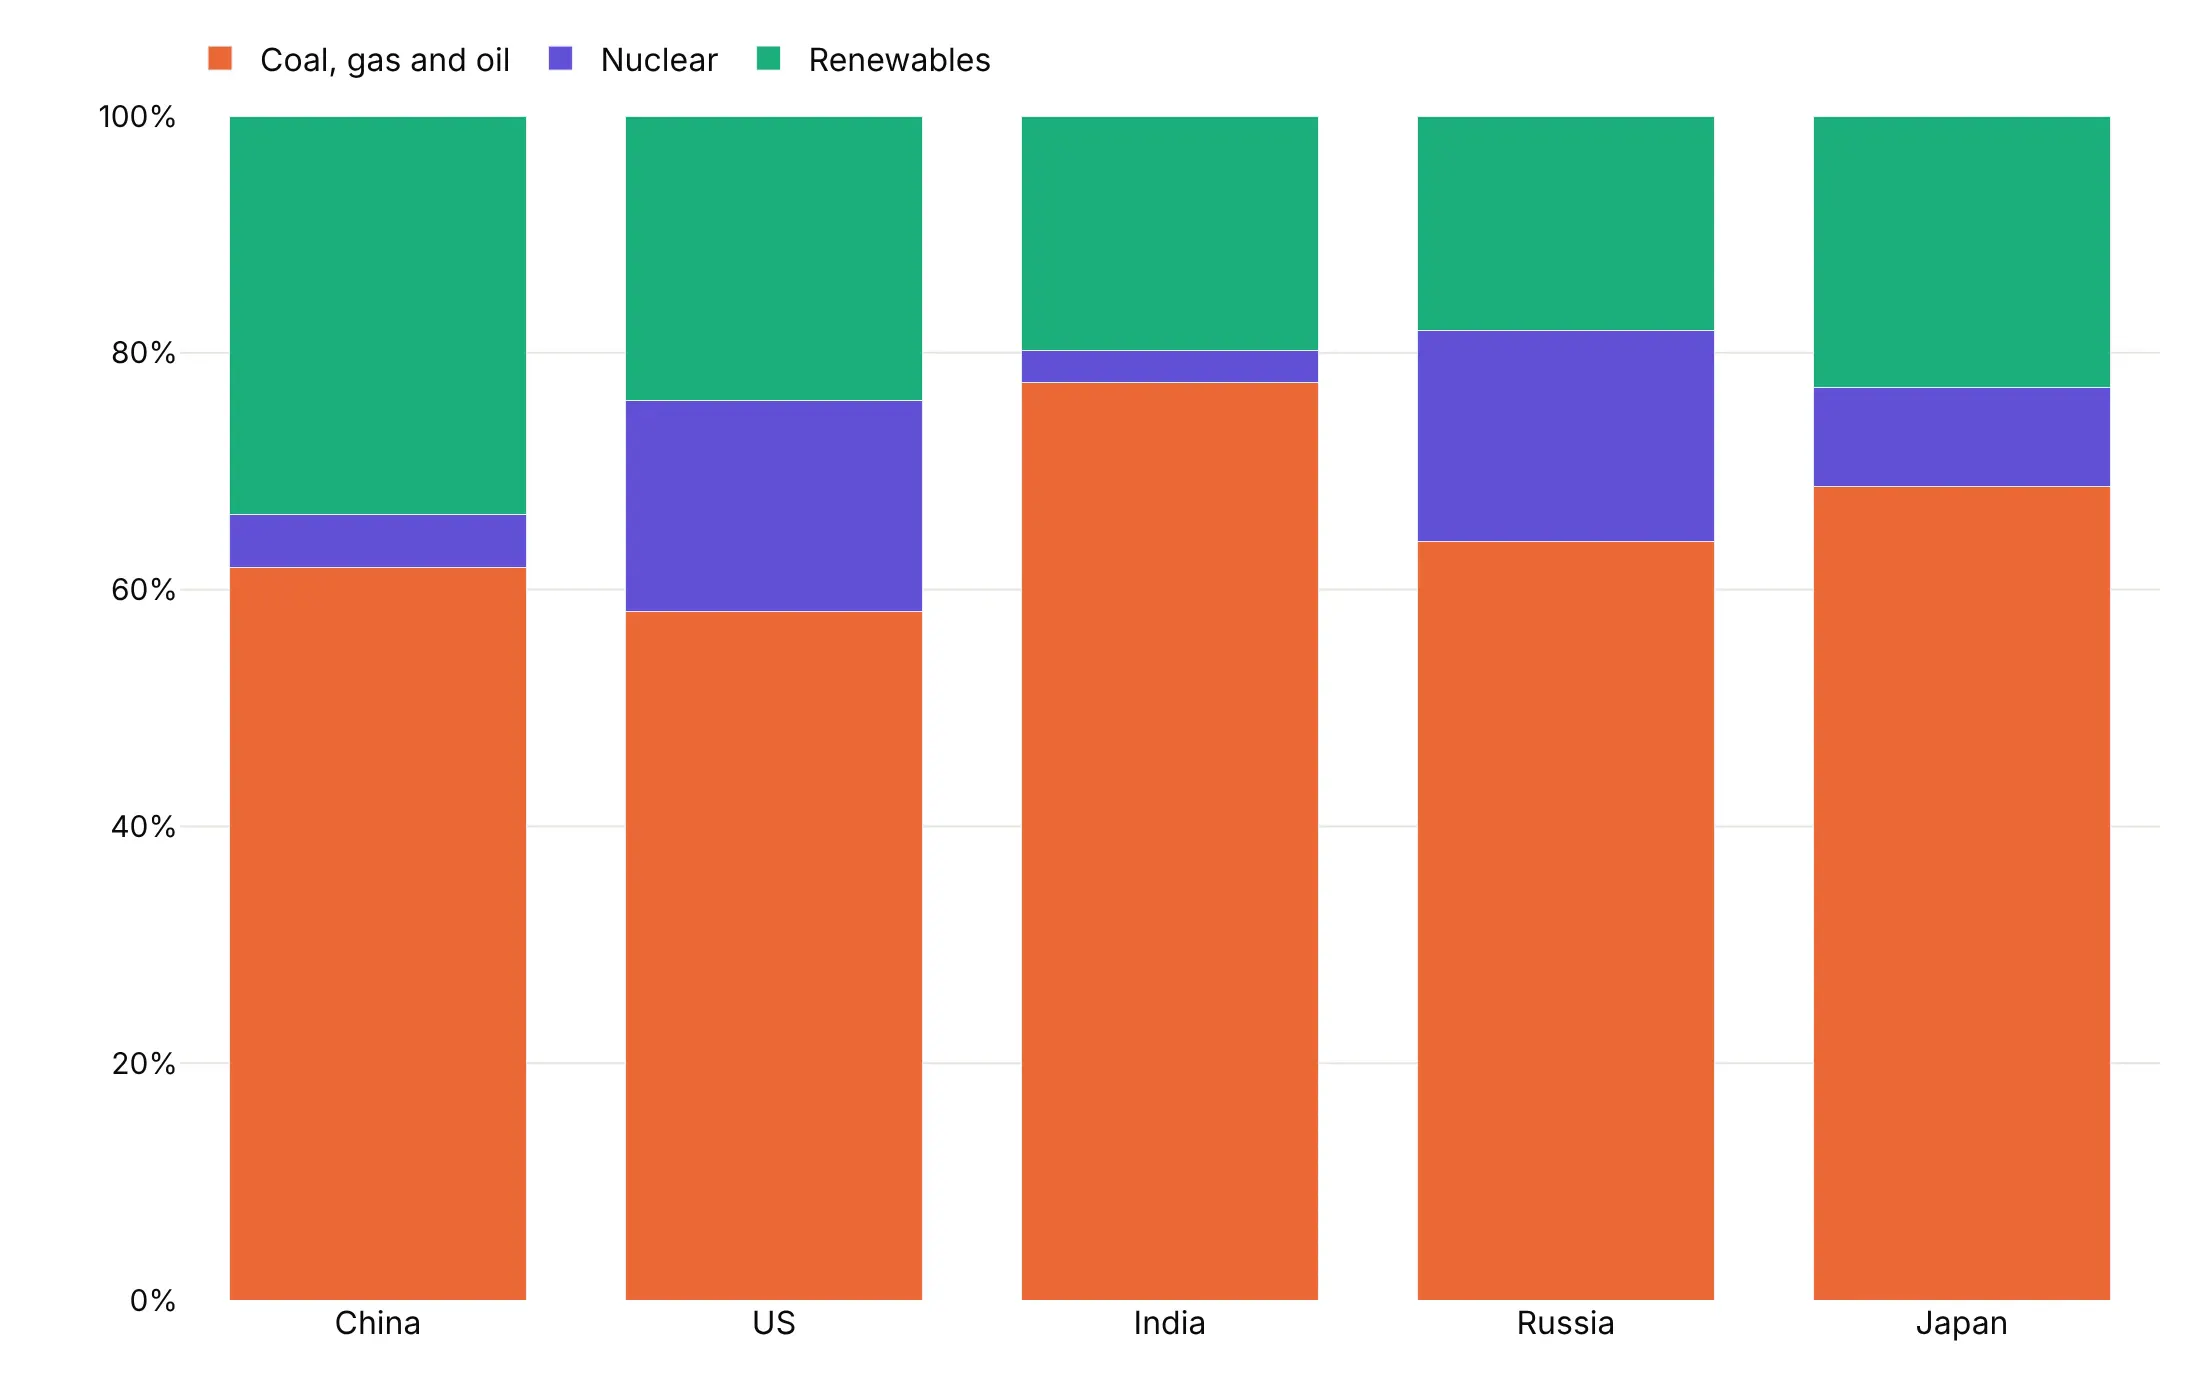
The same data answers different questions depending on barmode and barnorm. These show 2024 electricity generation by fossil fuels, nuclear and renewables in the five countries that generated the most.
Grouped (barmode="group") puts the series side by side, so you compare sources within and across countries: China's renewables (3,399 TWh) alone exceed all of US fossil generation (2,553 TWh).
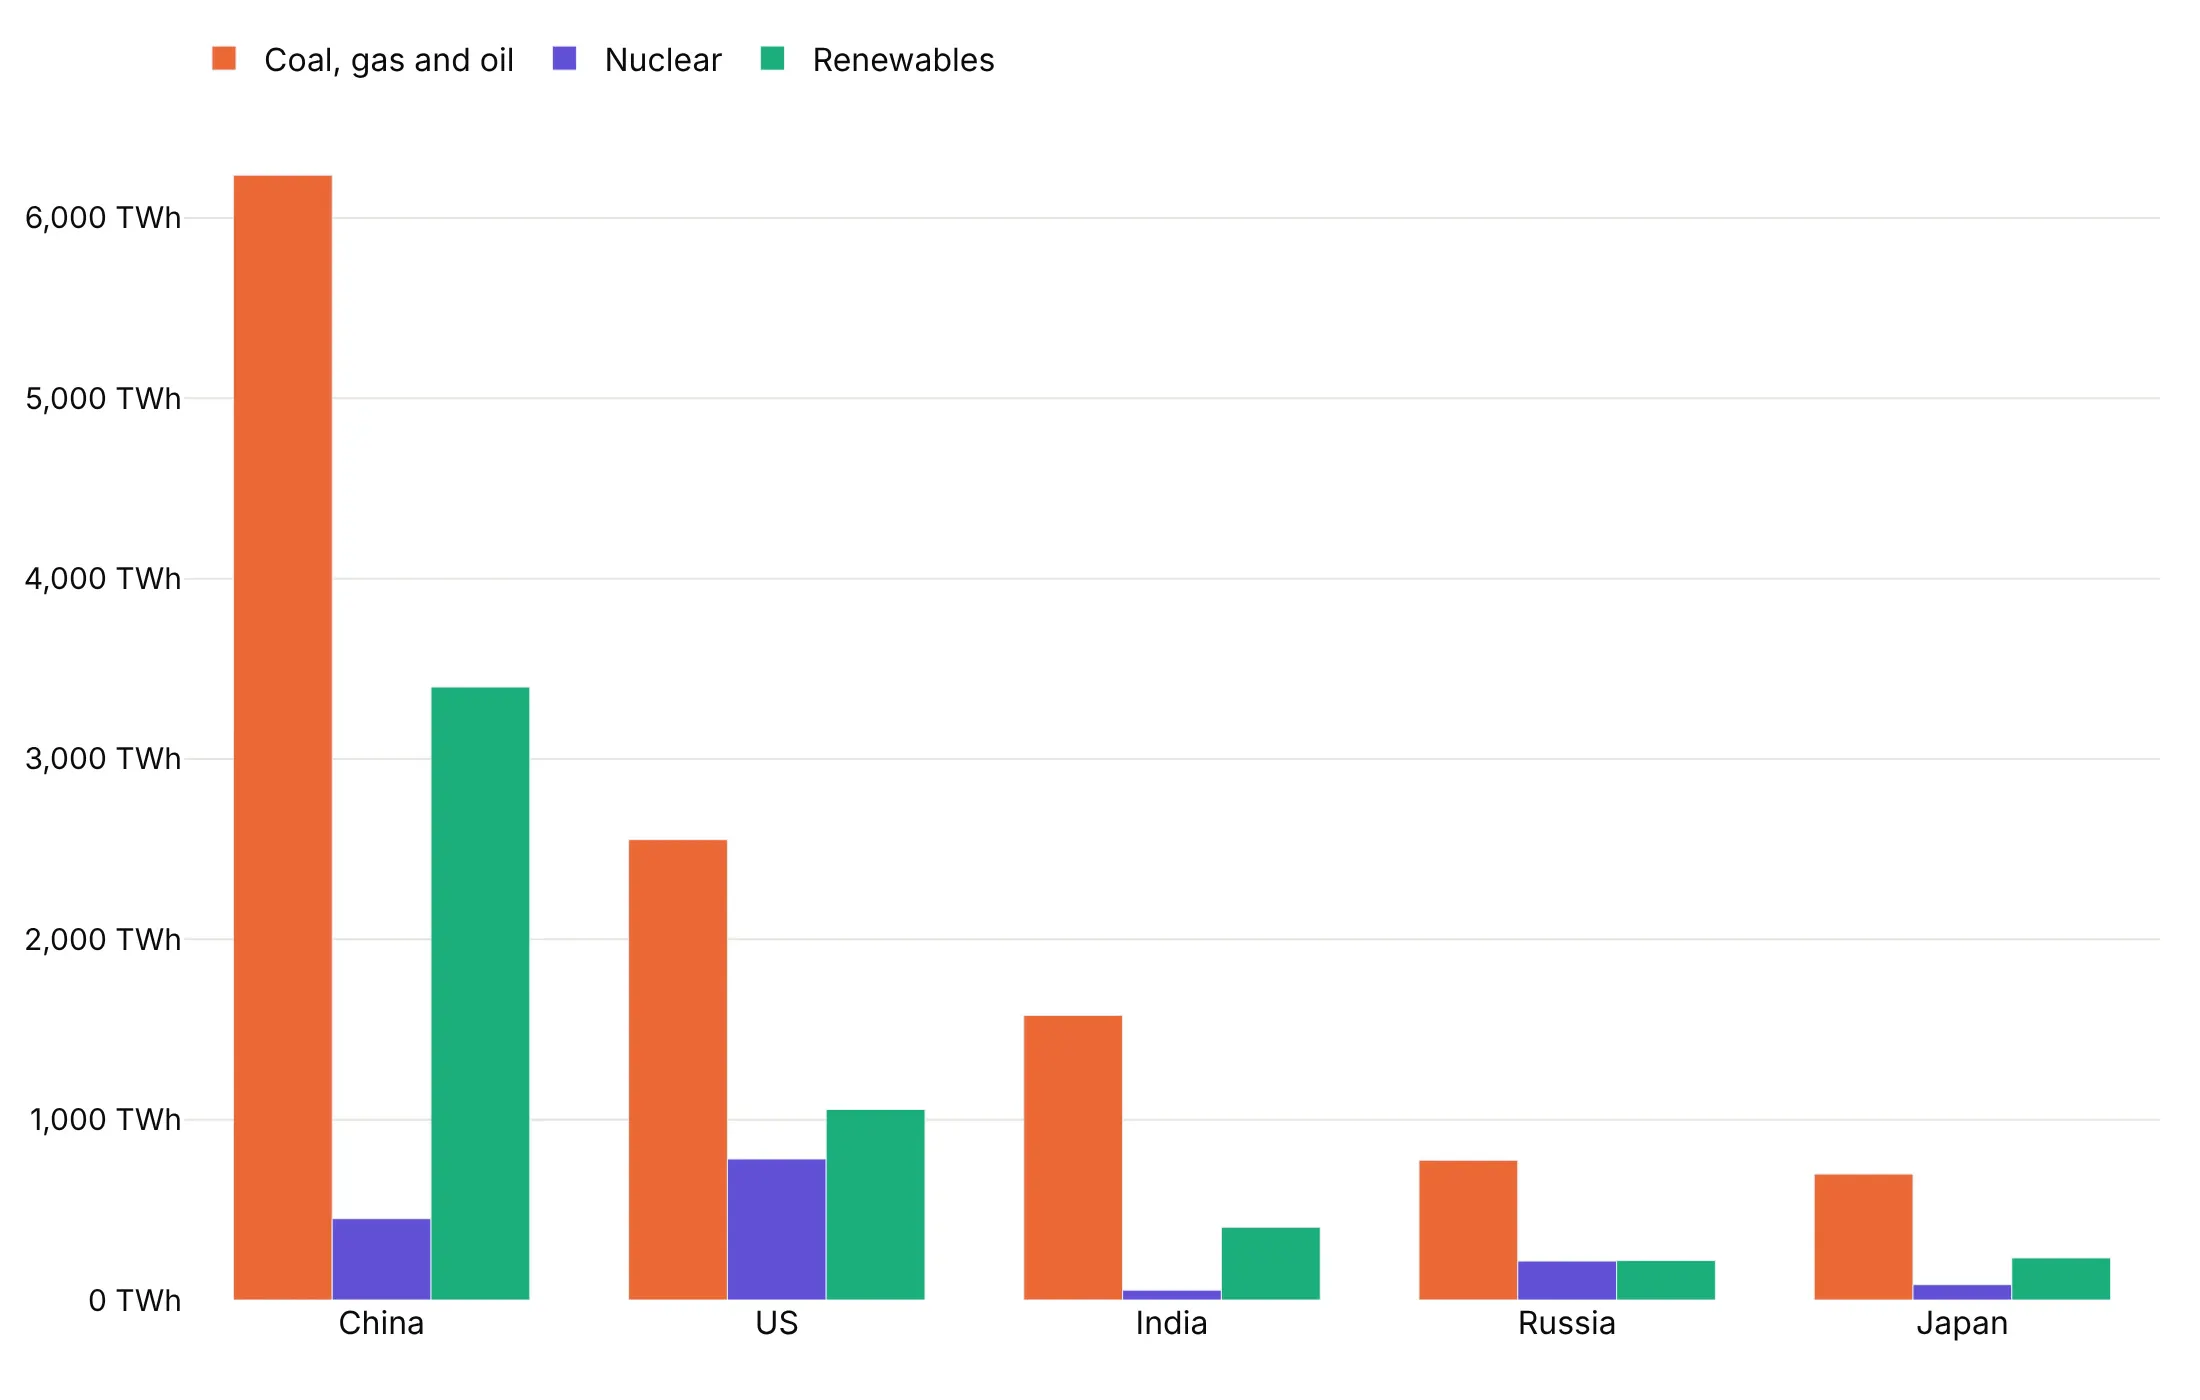
Stacked (barmode="stack") puts them on top of each other, so the bar height is the country's total and the first segment is easy to compare. The upper segments are harder to compare because they don't share a baseline.
100% stacked (barnorm="percent") scales every bar to 100%, so you compare shares instead of sizes: Russia and the US both made 17.8% of their electricity from nuclear, India 2.7%.
Two more modes appear in the 13 ways below: barmode="relative" stacks positive values up and negative values down from zero (way 9), and barmode="overlay" draws the bars of each series in the same place, one in front of another (way 10).
Checklist
Do
- Start bars at zero. If the differences you care about are small, show the change itself or use a dot plot.
- Sort bars by value unless the categories have a natural order (years, age groups, a scale).
- Use horizontal bars for long category names and for more than about 12 categories.
- Print values on the bars when readers need them, and drop the axis if every bar is labeled.
- Use one color for one series, and a second color only to highlight what the title talks about.
- Write a title that states the takeaway.
Don't
- Use a log axis for bars, or 3D bars.
- Stack more than four or five series; past that, the middle segments can't be compared.
- Use a grouped bar chart with so many series that each group becomes a blur; facet it or use small multiples.
- Draw thousands of bars when a line or a histogram shows the same thing.
Options to customize
A bar chart in Plotly is px.bar or one or more go.Bar traces, so these are the options that matter most. The full lists are in the px.bar reference and the bar trace reference.
- px.bar(x=..., y=...): the category column on one axis and the value column on the other; a DataFrame in long format works directly.
- orientation="h": horizontal bars, with the categories on the y axis.
- color: one series per value of a column, drawn with the current barmode.
- barmode: "group" (side by side), "stack" (on top of each other), "relative" (positives up, negatives down; the px.bar default) or "overlay" (in the same place).
- barnorm: "percent" or "fraction" scales each stack to 100% or 1.
- offsetgroup: with barmode="stack", traces with the same offsetgroup stack together and different groups sit side by side, which makes a grouped and stacked bar chart (way 11).
- text_auto, texttemplate, textposition: values on the bars, formatted, "outside" or "inside".
- bargap, bargroupgap, width: the space between bars and groups, or a fixed bar width (way 10).
- marker.color: one color, or a list with one color per bar to highlight some of them (ways 3 and 5).
- marker.pattern: hatching, to tell series apart without more colors (Playfair's ribbed bars, way 11).
- category_orders, yaxis.categoryorder="total ascending": the order of the bars.
- error_y, error_x: error bars from a column of values (way 6).
- animation_frame: one frame per value of a column, with a play button and slider (way 13).
- base: where each bar starts, for floating bars and ranges.
13 ways to draw a bar chart
A bar chart comes in many variations, and choosing among them is most of the design work. We took one dataset, the World Bank's national accounts for the 19 countries of the G20 from 2000 to 2024, and drew it 13 ways. Each one answers a different question about the same economies.
1. Vertical bars over time
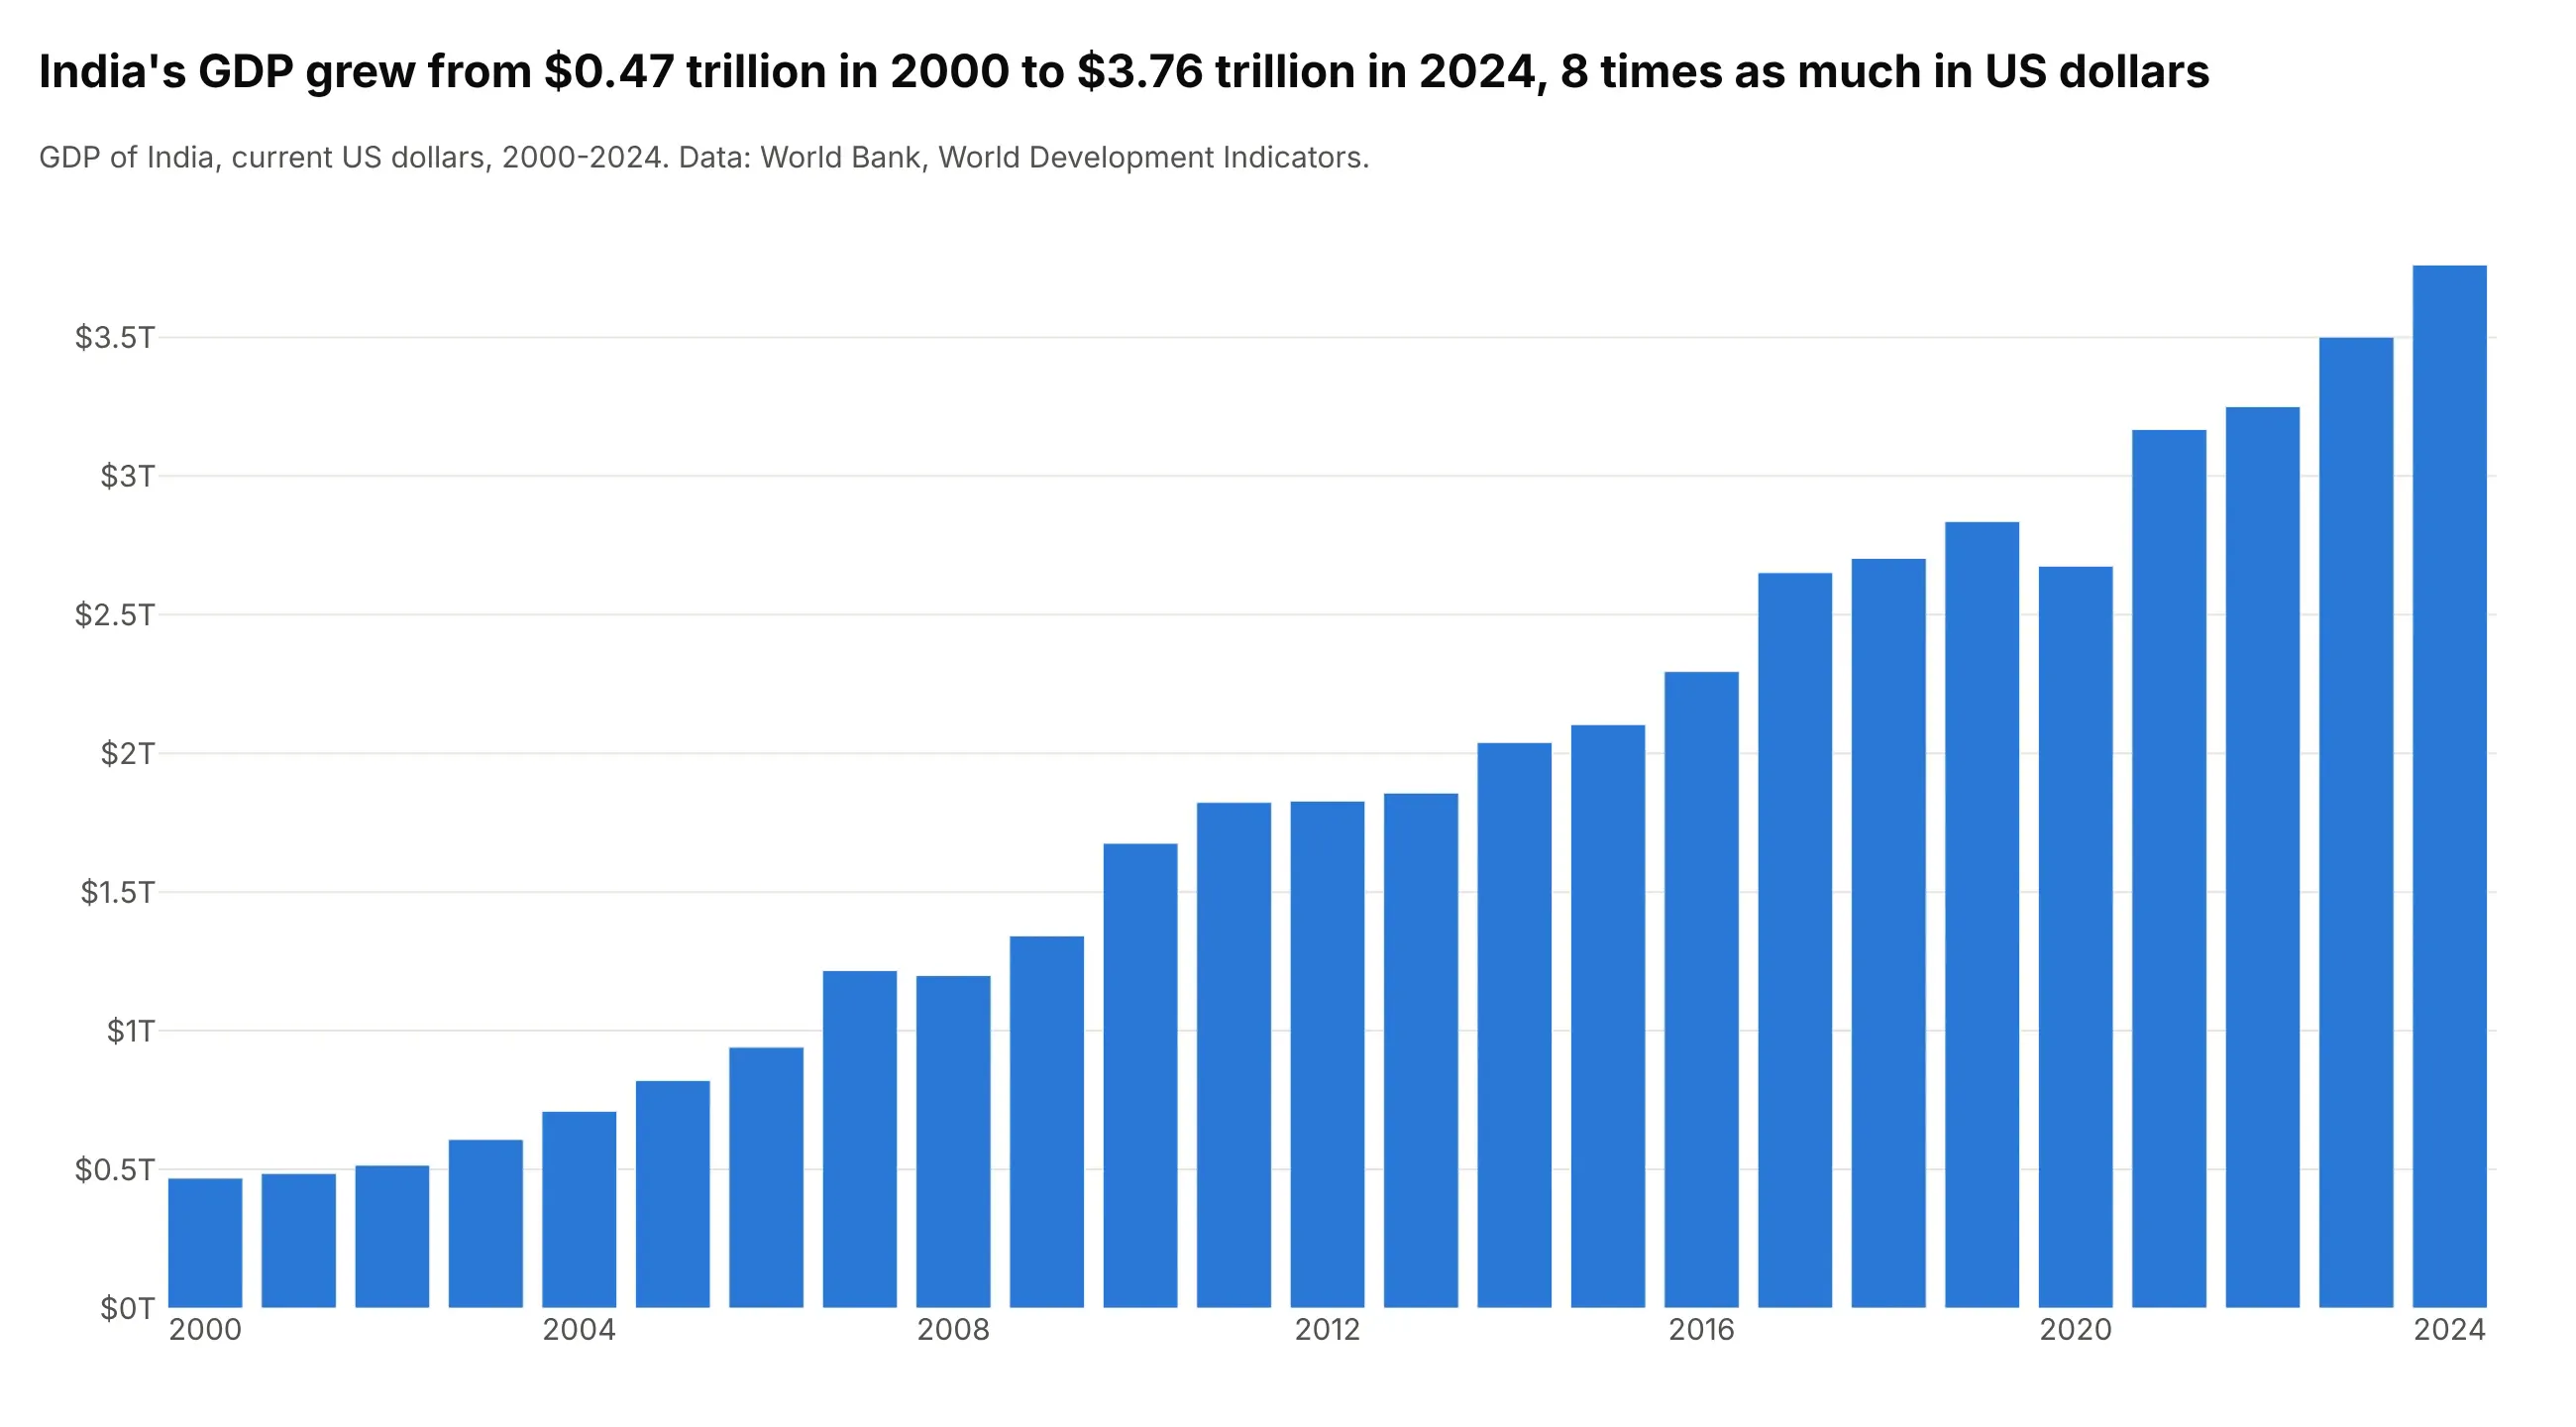
India's GDP grew from $0.47 trillion in 2000 to $3.76 trillion in 2024, 8 times as much in US dollars. One vertical bar per year reads as a time series where each year's total matters on its own, and the dips in 2008 and 2020 stand out as shorter bars. For more than about 40 periods a line chart is easier to read. This is px.bar(df, x="year", y="gdp").
Prompt: Get the data from the World Bank API (World Development Indicators, indicator NY.GDP.MKTP.CD, GDP in current US dollars) for India, 2000 to 2024. Make a plotly vertical bar chart with px.bar, one bar per year, the y axis in trillions of dollars from zero, and a title that states how many times larger GDP was in 2024 than in 2000.
2. Horizontal bars, sorted, with values
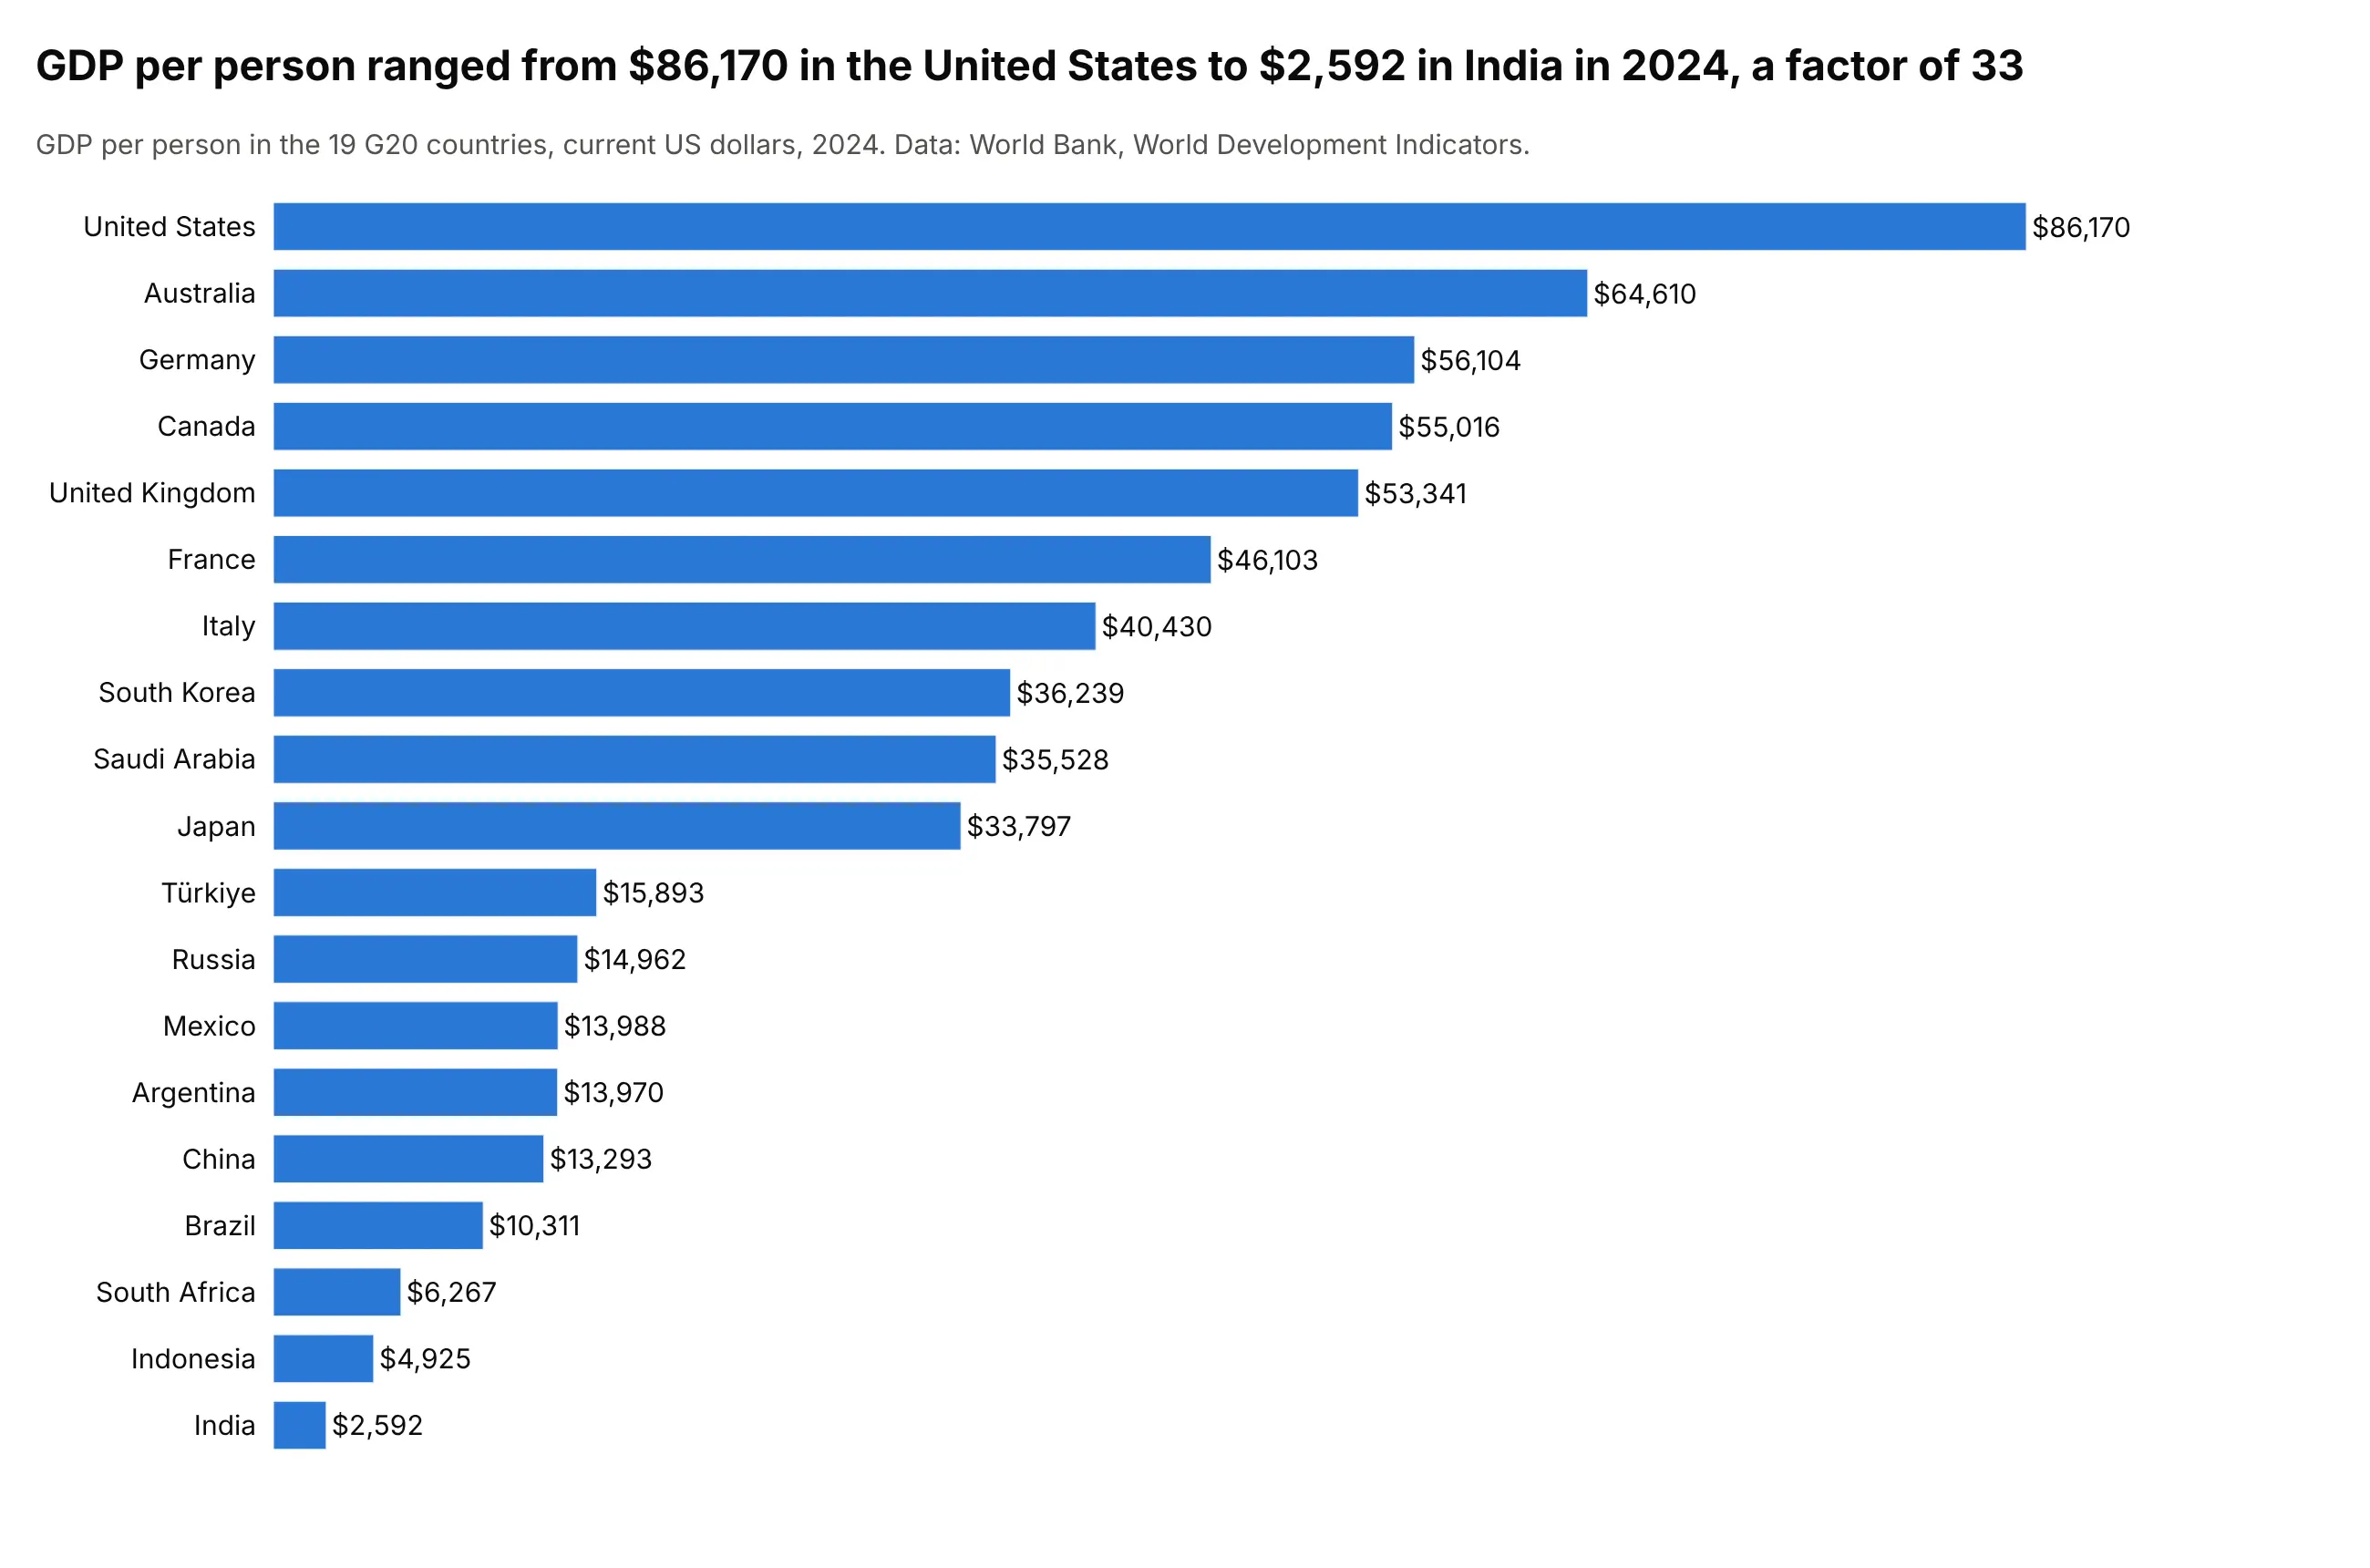
GDP per person ranged from $86,170 in the United States to $2,592 in India in 2024, a factor of 33. A horizontal bar graph sorted by value is the clearest way to rank categories with long names, and printing each value at the end of its bar removes the need for an axis. Use orientation="h", text_auto=",.0f" and yaxis.categoryorder="total ascending".
Prompt: Get the data from the World Bank API (World Development Indicators, NY.GDP.PCAP.CD, GDP per person in current US dollars) for the 19 G20 countries in 2024. Make a plotly horizontal bar chart sorted with the largest on top, each value printed outside its bar as a dollar amount, no x axis, and a title that states the gap between the highest and lowest.
3. Bars with a reference line and highlight colors
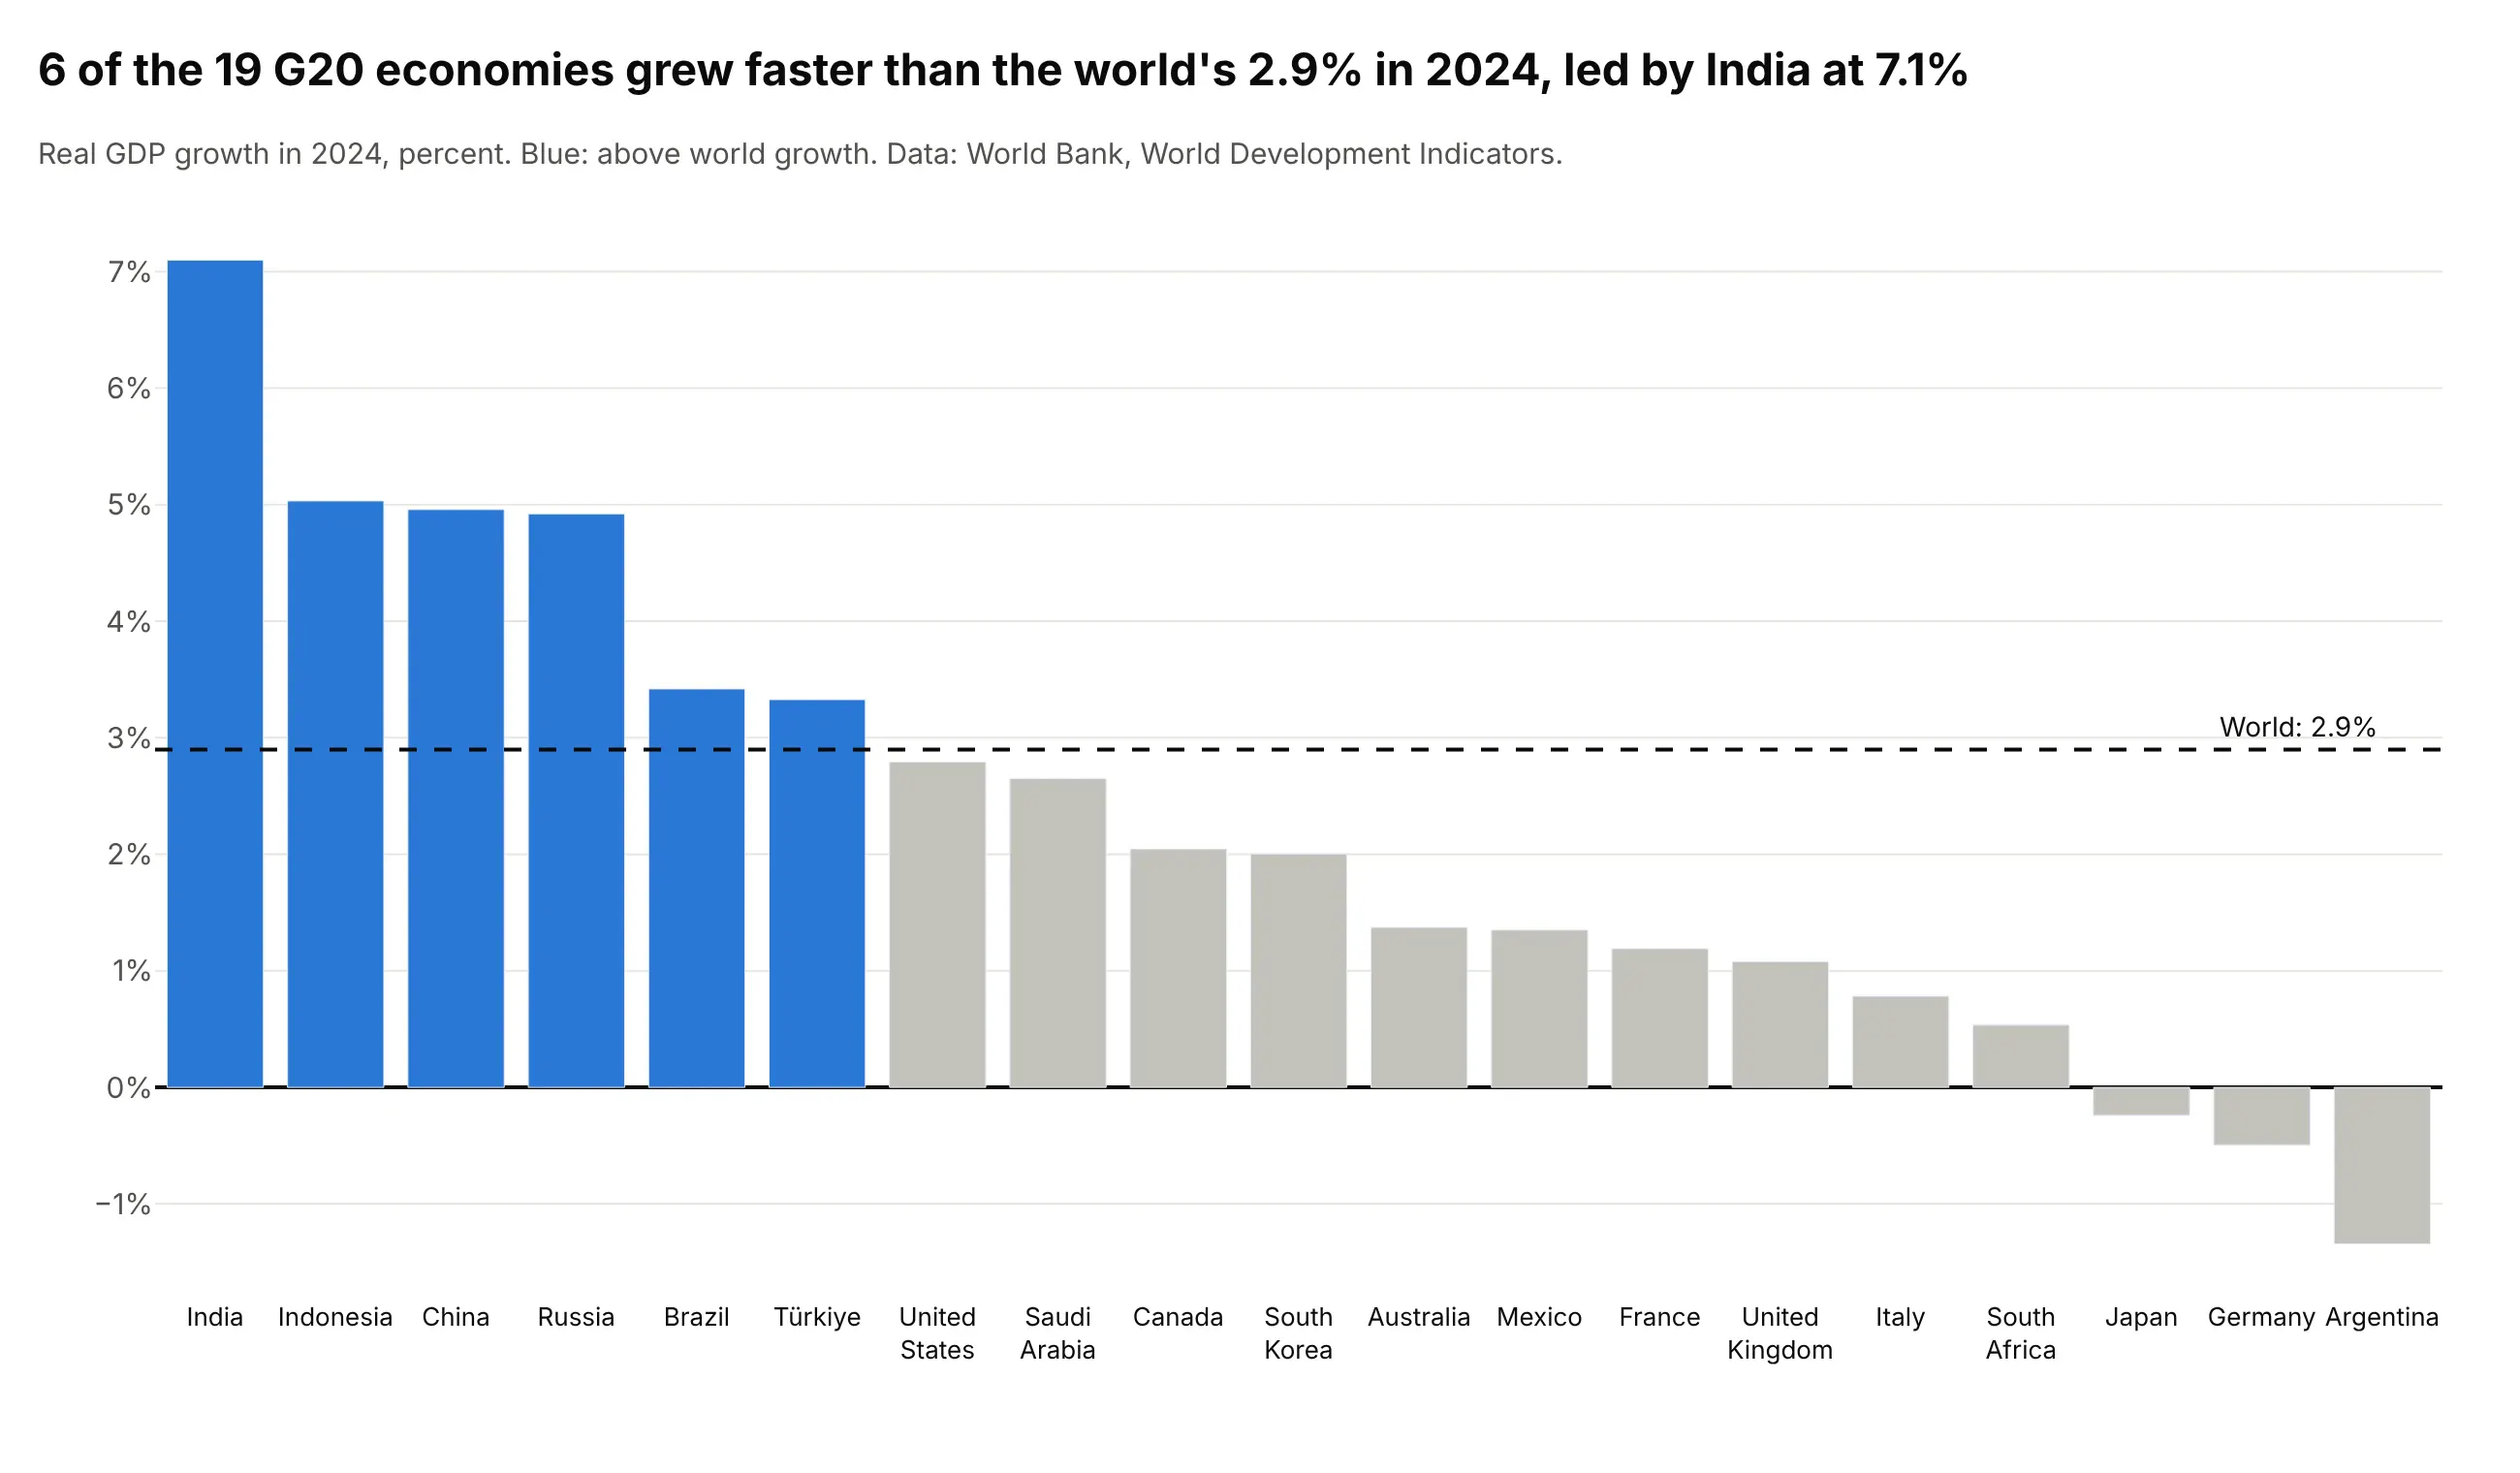
6 of the 19 G20 economies grew faster than the world's 2.9% in 2024, led by India at 7.1%. A dashed reference line gives each bar something to be compared with, and bar chart colors do the rest: blue for the bars above the line, gray for the others. Add the line with fig.add_hline(y=2.9) and pass a list of colors to marker_color.
Prompt: Get the data from the World Bank API (World Development Indicators, NY.GDP.MKTP.KD.ZG, real GDP growth) for the 19 G20 countries and the world (WLD) in 2024. Make a plotly bar chart sorted by growth, a dashed horizontal line at world growth with add_hline, the bars above it in blue and the rest in gray, and a zero line.
4. Grouped bars
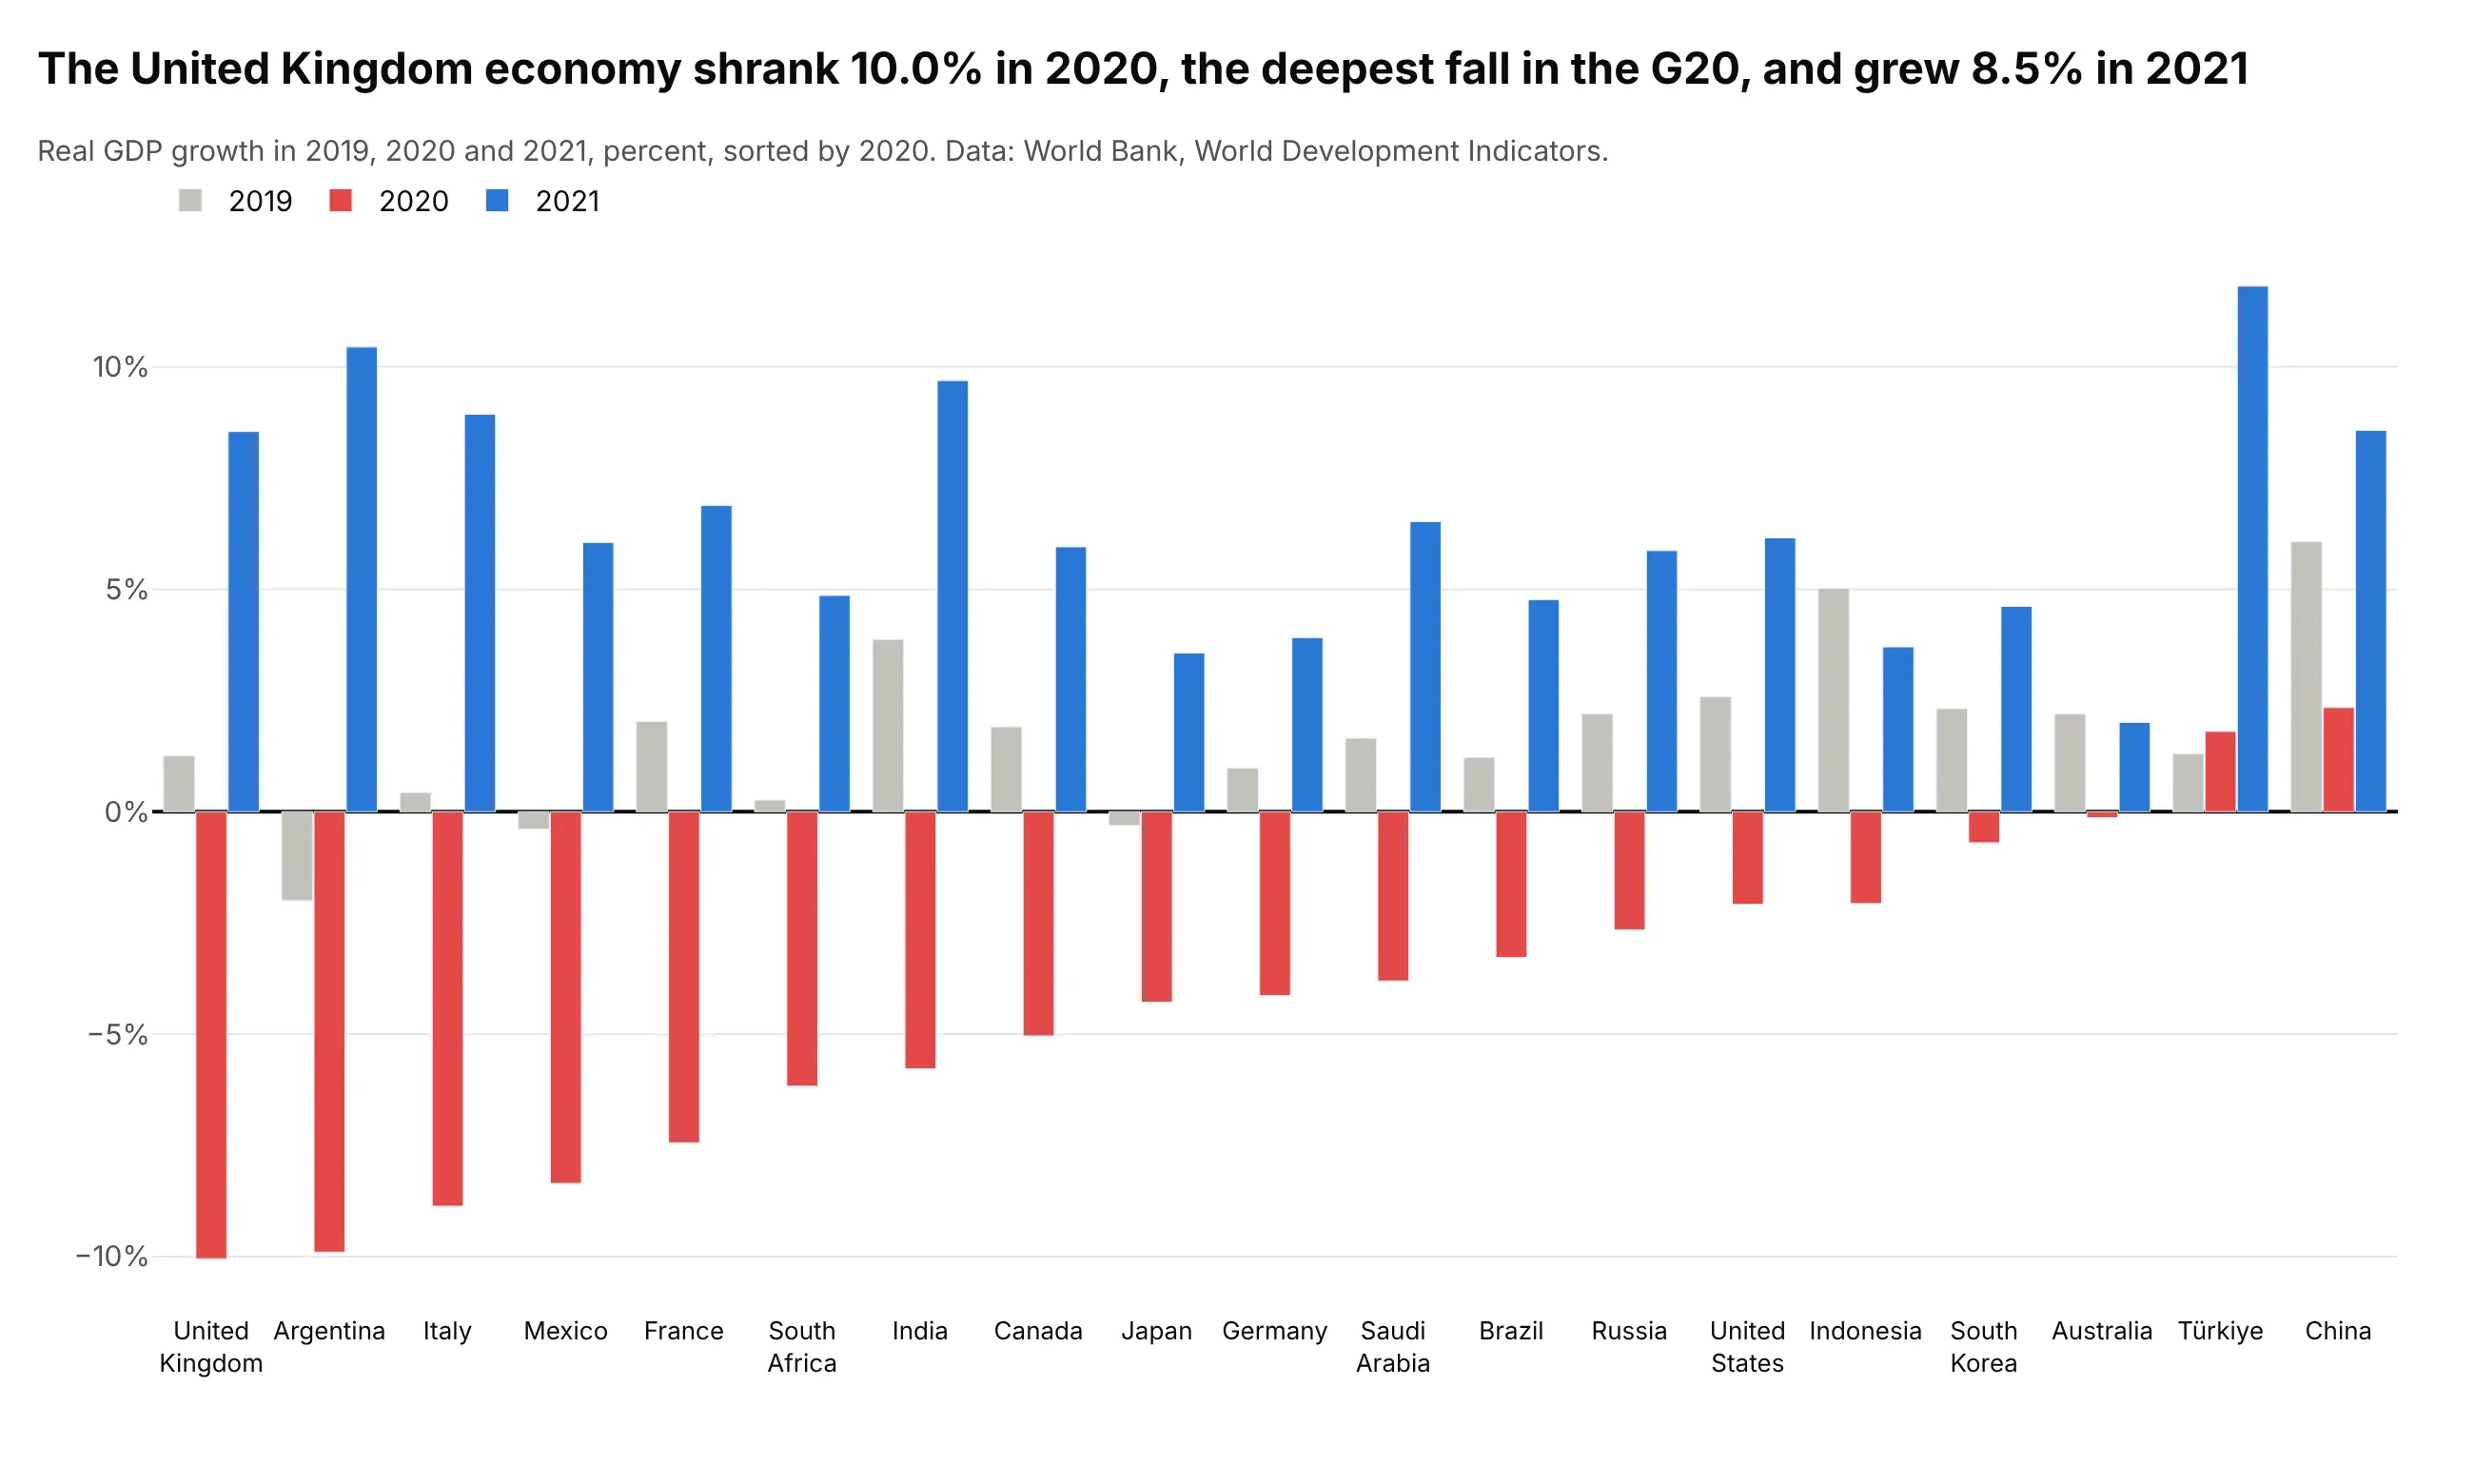
The United Kingdom's economy shrank 10.0% in 2020, the deepest fall in the G20, and grew 8.5% in 2021. A grouped bar chart puts the three years side by side within each country, so you can compare the fall and the rebound for each country and across countries. Use one trace per year with barmode="group".
Prompt: Get the data from the World Bank API (World Development Indicators, NY.GDP.MKTP.KD.ZG, real GDP growth) for the 19 G20 countries in 2019, 2020 and 2021. Make a plotly grouped bar chart with barmode="group", one trace per year (2019 gray, 2020 red, 2021 blue), countries sorted by 2020 growth, and a zero line.
5. Diverging bars
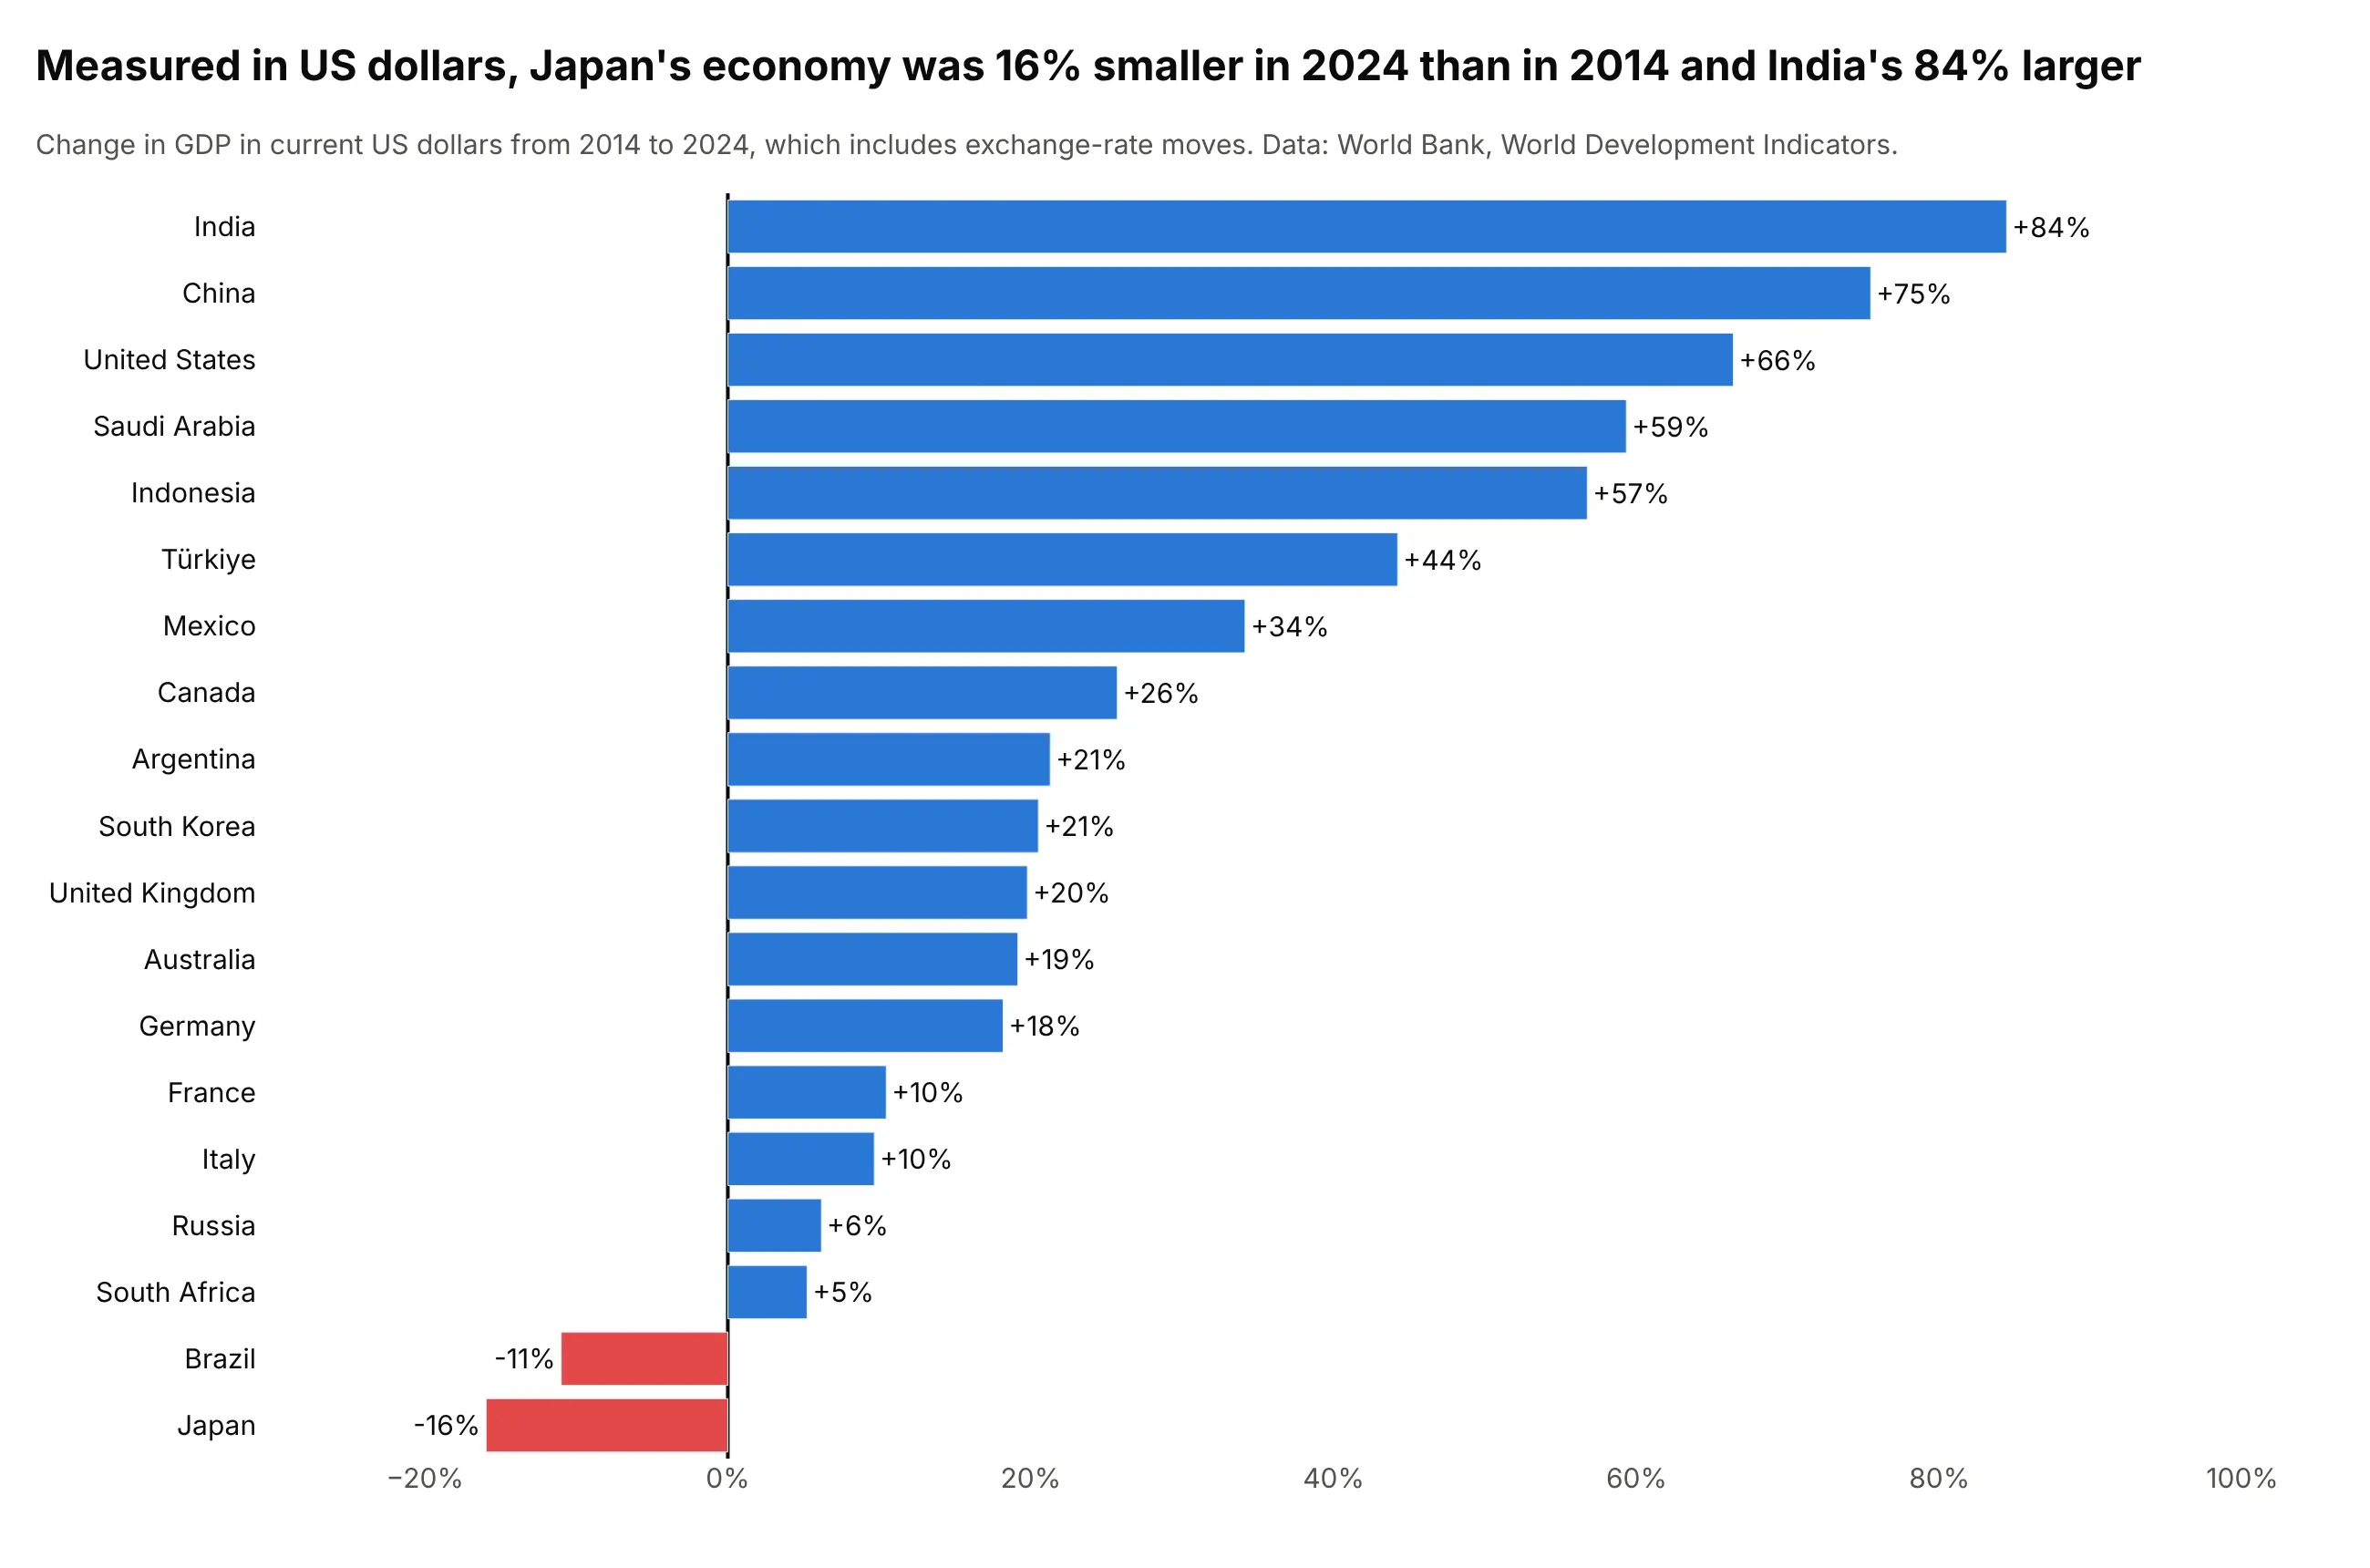
Measured in US dollars, Japan's economy was 16% smaller in 2024 than in 2014 and India's 84% larger. Bars that start at zero and go left or right, colored by sign, make gains and losses read at a glance. The dollar figures include exchange-rate moves, which is why Japan's yen-denominated growth turns into a fall. Color each bar with a list in marker_color.
Prompt: Get the data from the World Bank API (World Development Indicators, NY.GDP.MKTP.CD, GDP in current US dollars) for the 19 G20 countries in 2014 and 2024, and compute the percent change. Make a plotly horizontal bar chart sorted by change, negative bars in red and positive in blue, the value at the end of each bar, and a line at zero.
6. Bars with error bars
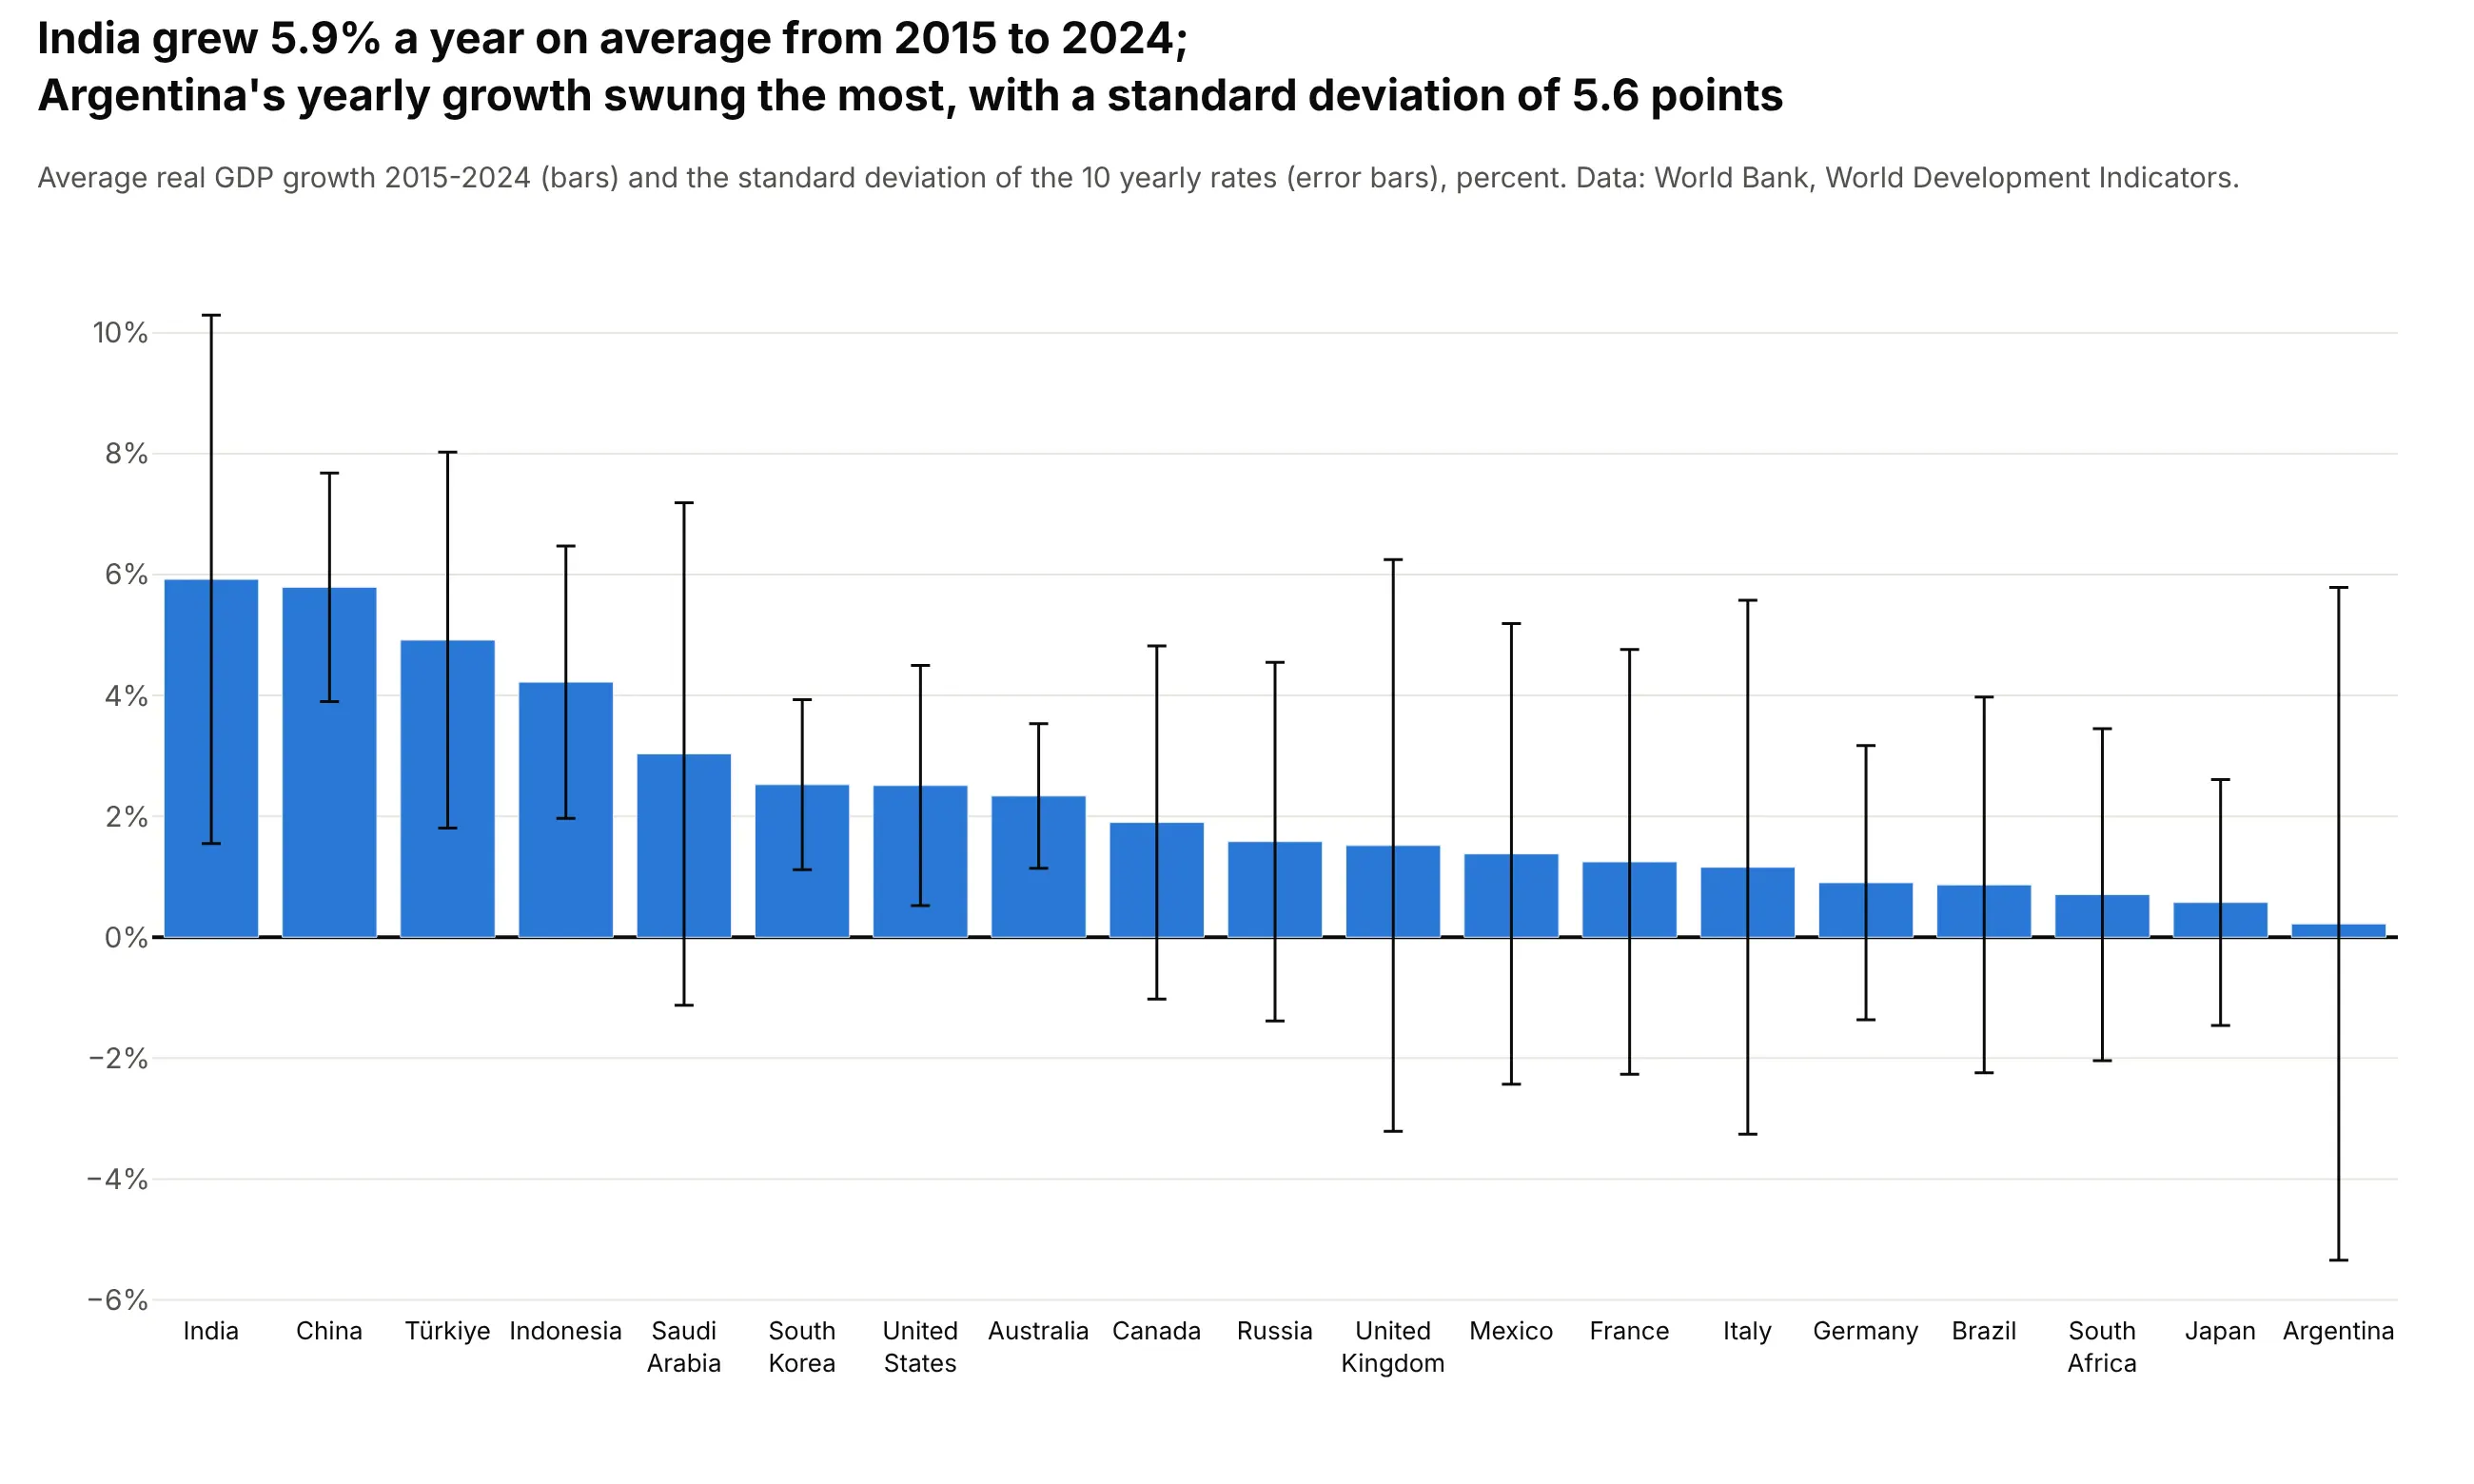
India grew 5.9% a year on average from 2015 to 2024, and Argentina's yearly growth swung the most, with a standard deviation of 5.6 points. Error bars show how much a value varies or how uncertain it is, so a bar is not read as more precise than it is. Here they show that the UK's average of 1.5% hides years from -10.0% to +8.5%. Set error_y=dict(type="data", array=...) on the bar trace.
Prompt: Get the data from the World Bank API (World Development Indicators, NY.GDP.MKTP.KD.ZG, real GDP growth) for the 19 G20 countries, 2015 to 2024. Compute each country's mean and standard deviation of the 10 yearly rates. Make a plotly bar chart of the means sorted from highest, with error_y set to the standard deviation, and say what the error bars mean in the subtitle.
7. Stacked bars
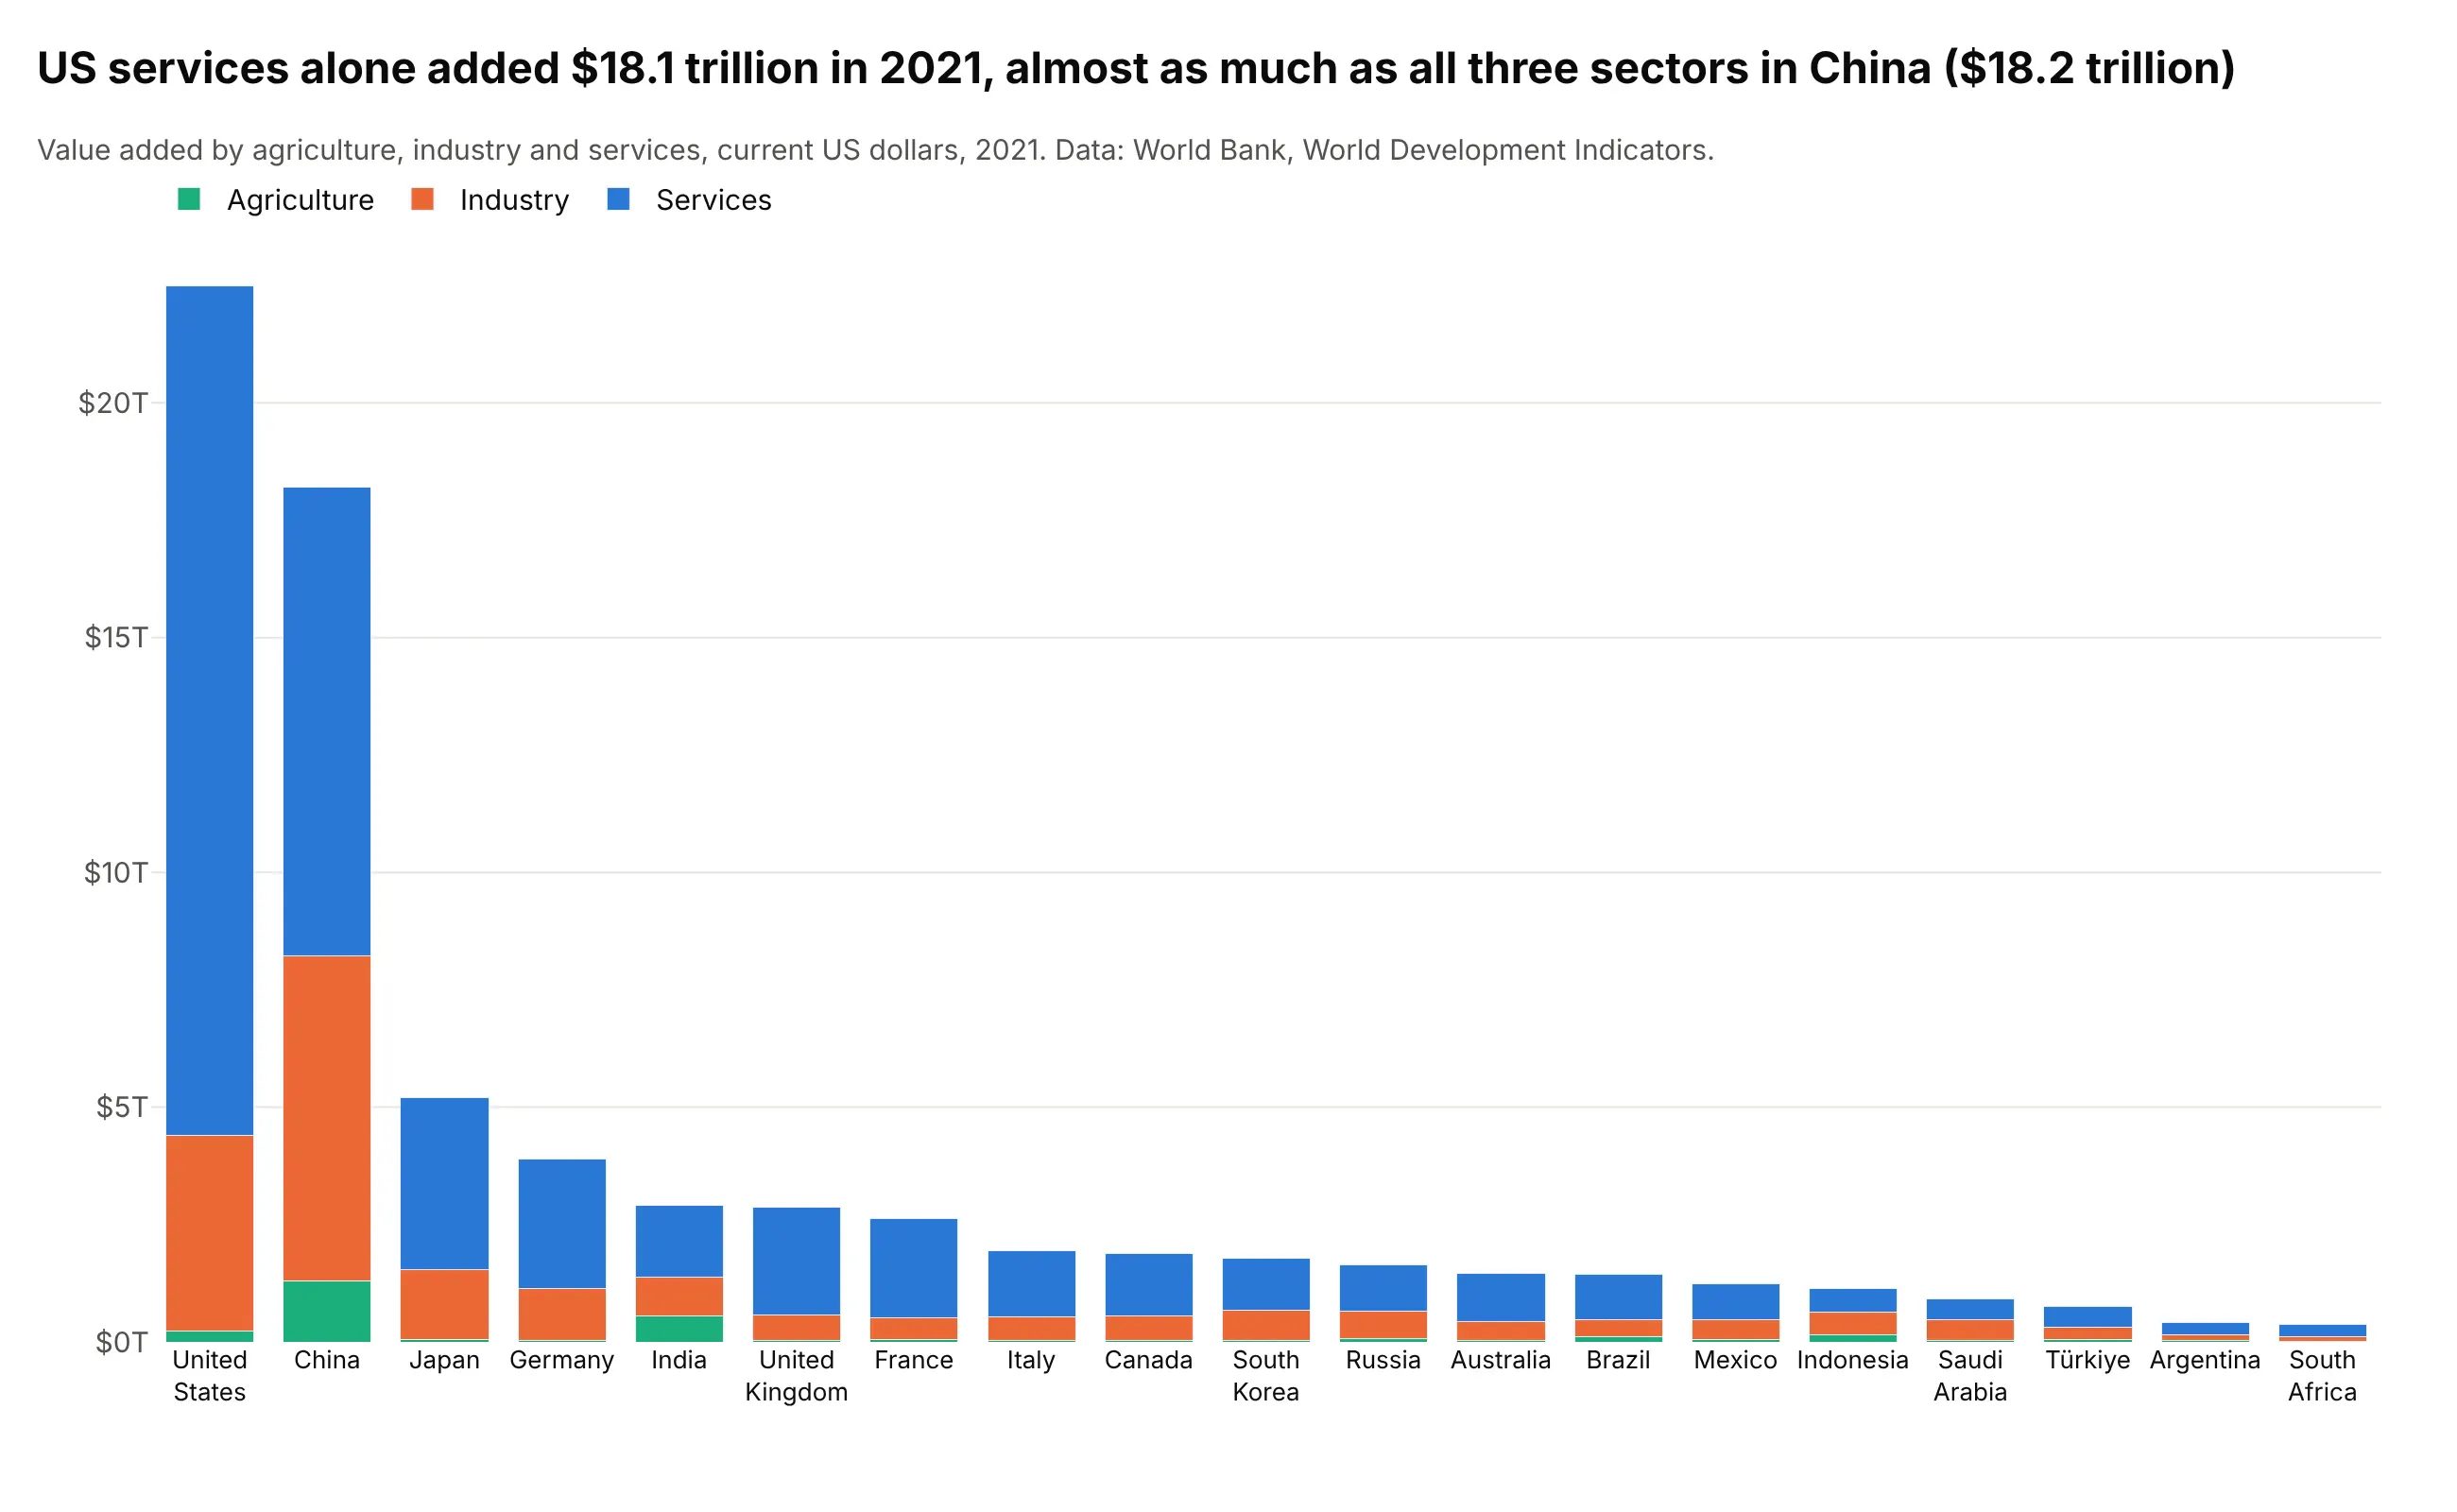
US services alone added $18.1 trillion in 2021, almost as much as all three sectors in China ($18.2 trillion). A stacked bar chart shows each total and how it splits, and the bottom segment is easy to compare across bars. The upper segments are harder to compare because they don't start from the same baseline. Use one trace per sector with barmode="stack".
Prompt: Get the data from the World Bank API (World Development Indicators, NV.AGR.TOTL.CD, NV.IND.TOTL.CD and NV.SRV.TOTL.CD, value added by agriculture, industry and services in current US dollars) for the 19 G20 countries in 2021. Make a plotly stacked bar chart with barmode="stack", one trace per sector, countries sorted by total, and the legend above the plot.
8. 100% stacked horizontal bars
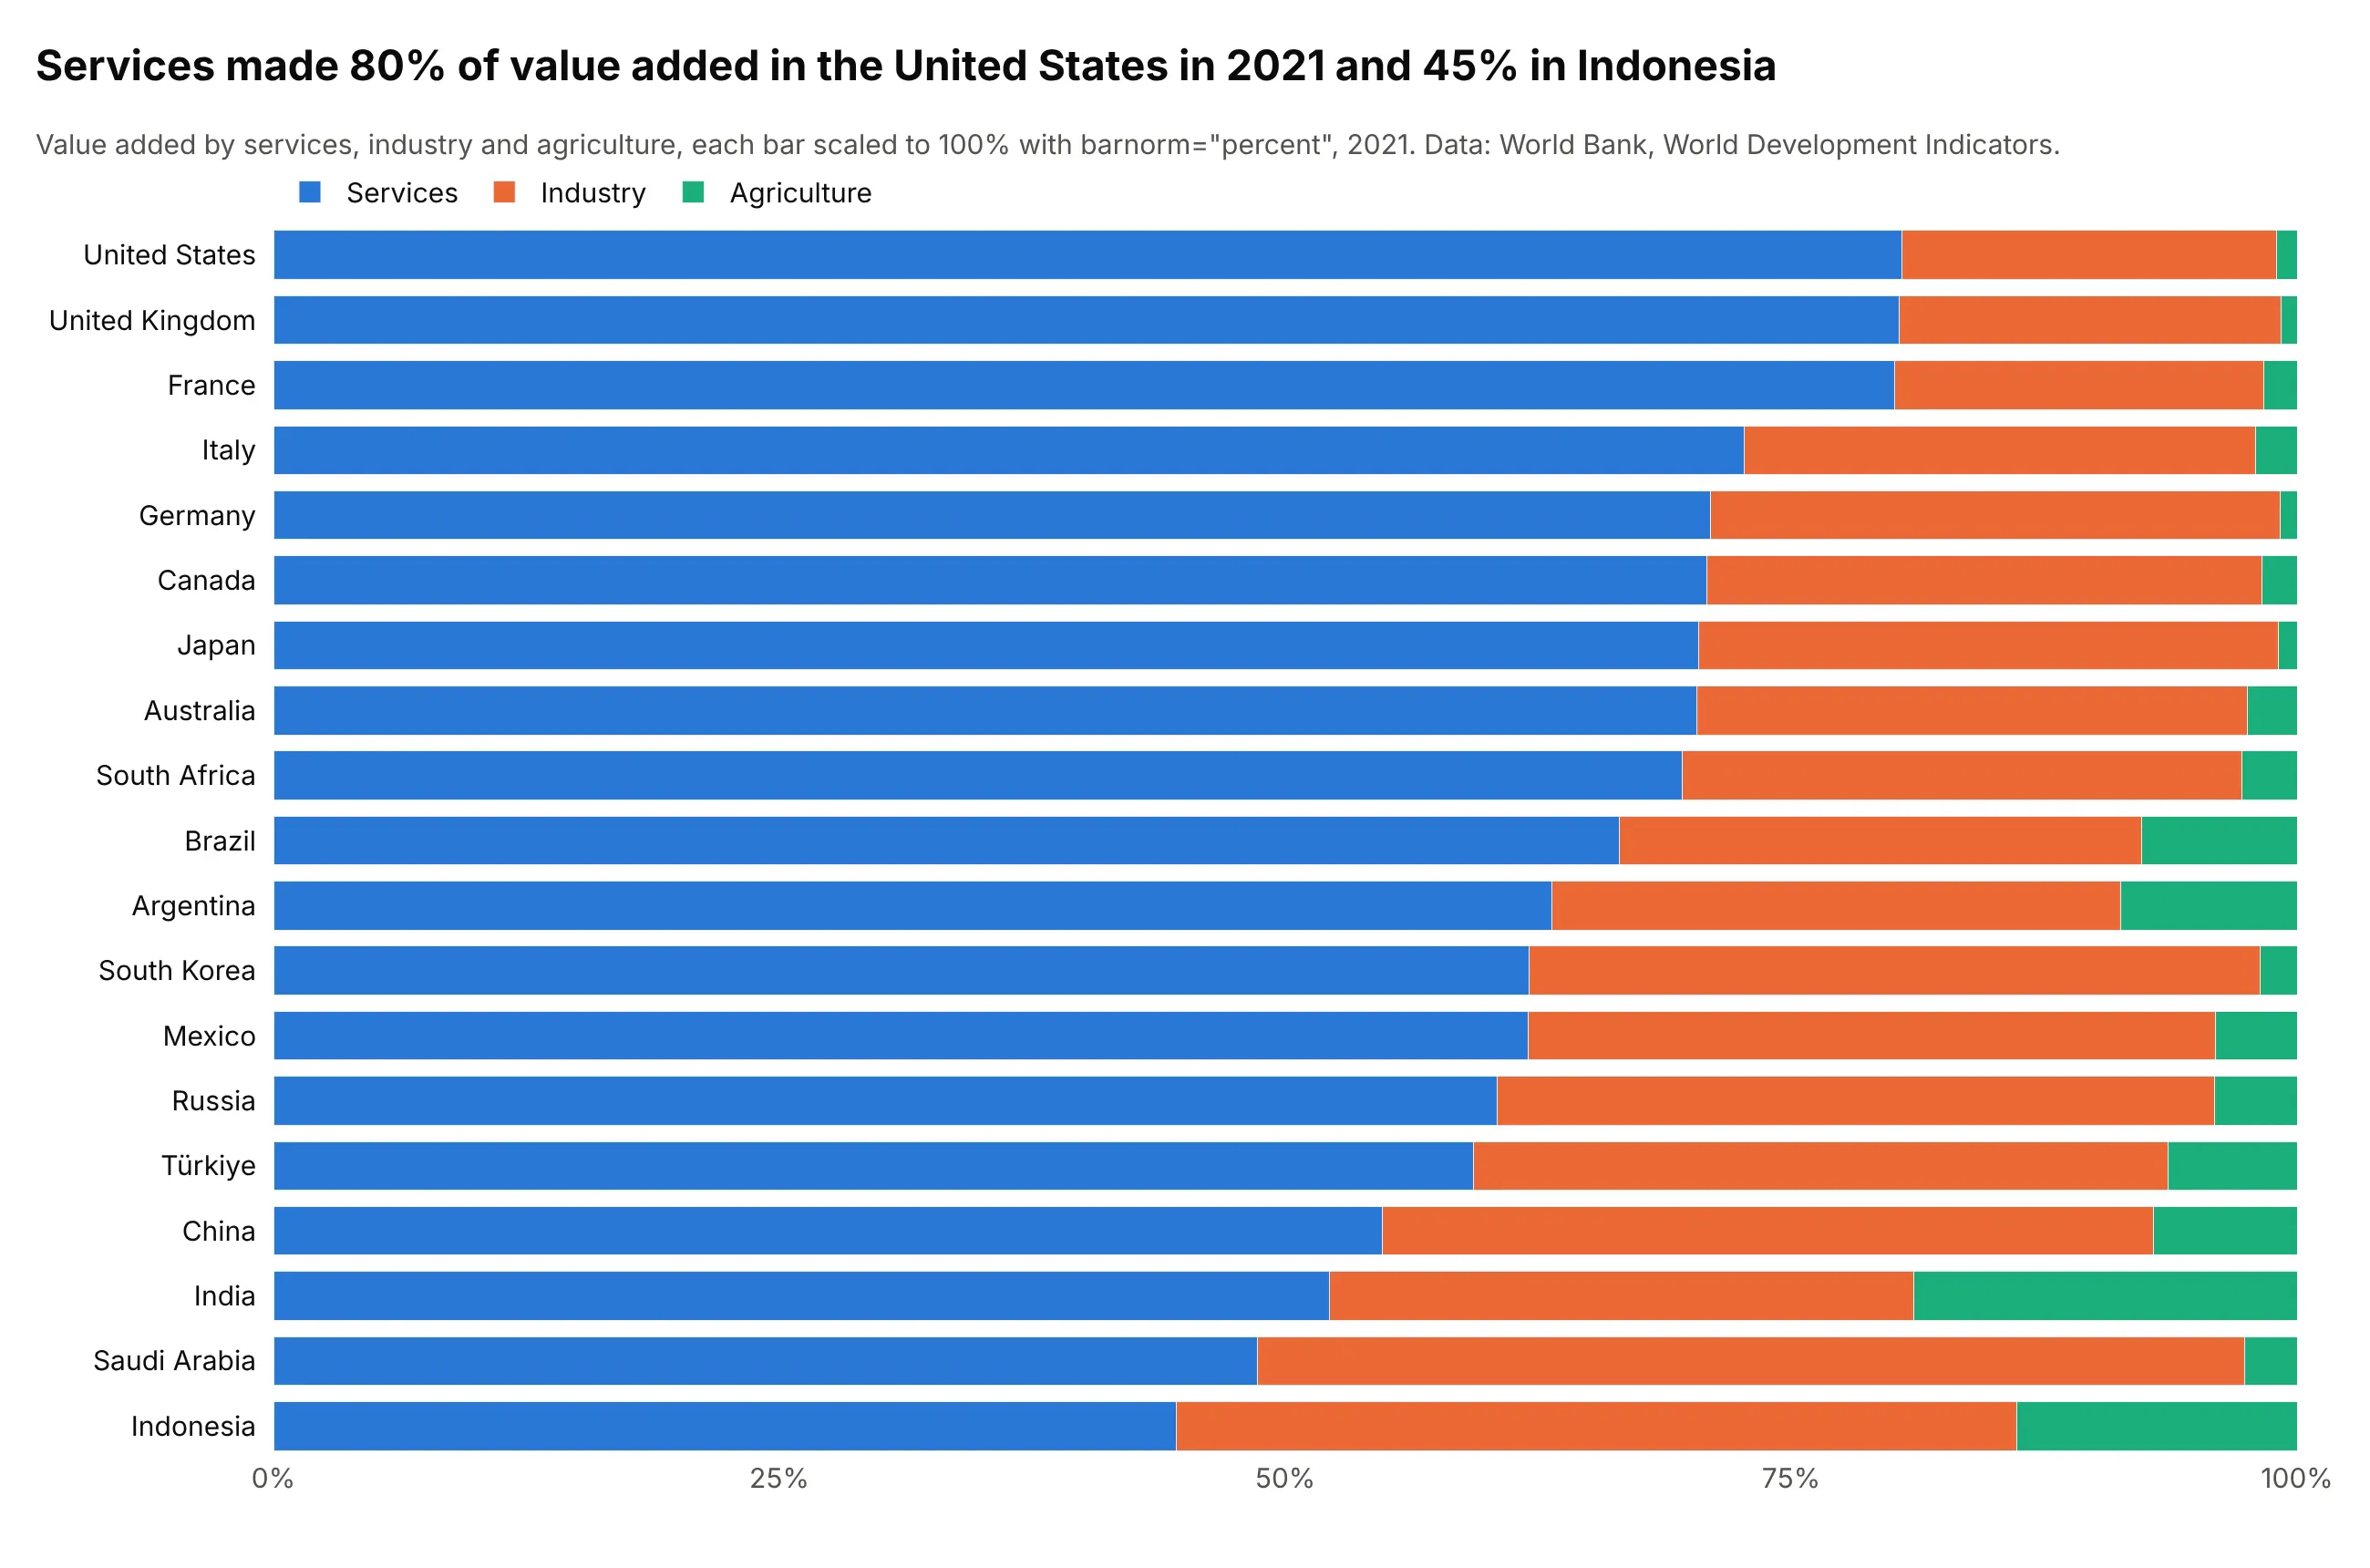
Services made 80% of value added in the United States in 2021 and 45% in Indonesia. A percentage bar chart scales every bar to 100%, so it compares the mix rather than the size, and a horizontal stacked bar chart leaves room for the names. Plotly does the scaling with barnorm="percent", so you pass the raw values.
Prompt: Get the data from the World Bank API (World Development Indicators, NV.SRV.TOTL.CD, NV.IND.TOTL.CD and NV.AGR.TOTL.CD in current US dollars) for the 19 G20 countries in 2021. Make a plotly horizontal stacked bar chart with barmode="stack" and barnorm="percent", services first, countries sorted by the services share, and the legend above the plot.
9. Relative bars: positive and negative parts
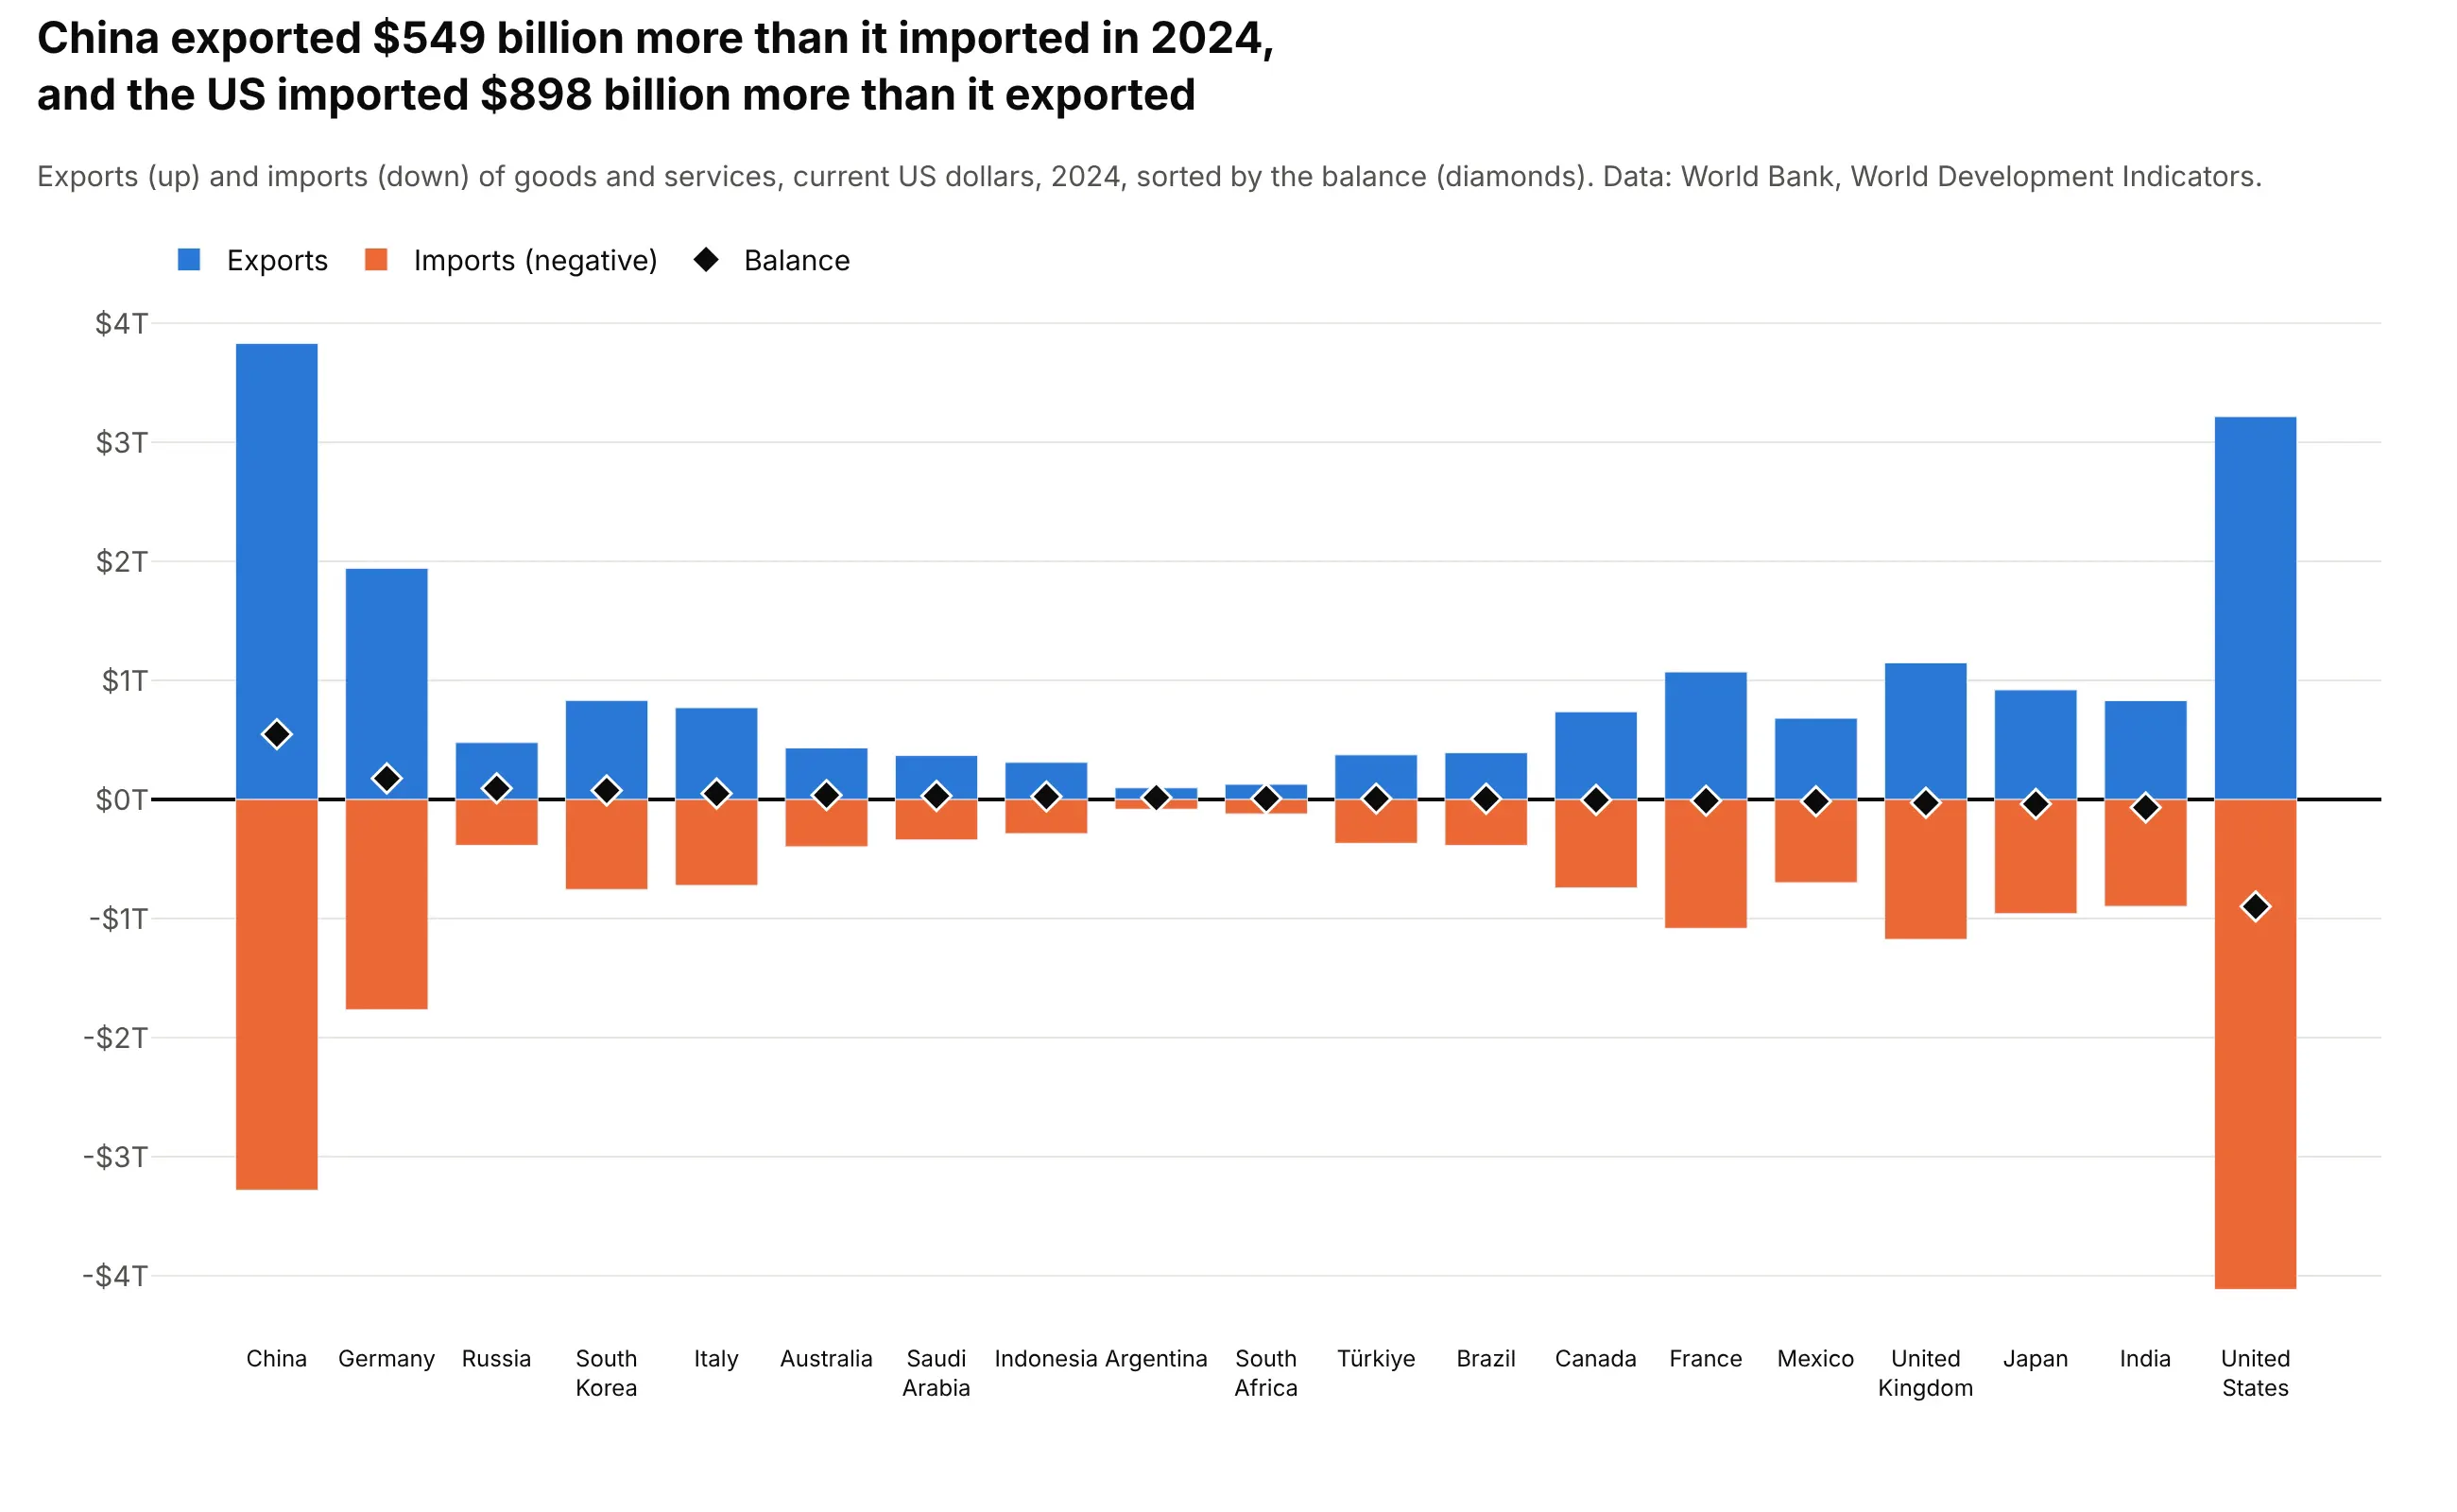
China exported $549 billion more than it imported in 2024, and the US imported $898 billion more than it exported. With barmode="relative", positive values stack up from zero and negative values stack down, so exports and imports share one bar and a marker shows the net balance. This is the layout for any total made of positive and negative parts, such as contributions to growth or a profit-and-loss statement; for one total built step by step, use a waterfall chart.
Prompt: Get the data from the World Bank API (World Development Indicators, NE.EXP.GNFS.CD and NE.IMP.GNFS.CD, exports and imports of goods and services in current US dollars) for the 19 G20 countries in 2024. Make a plotly bar chart with barmode="relative": exports as positive bars, imports as negative bars, the balance as black diamond markers, countries sorted by balance.
10. Overlay bars
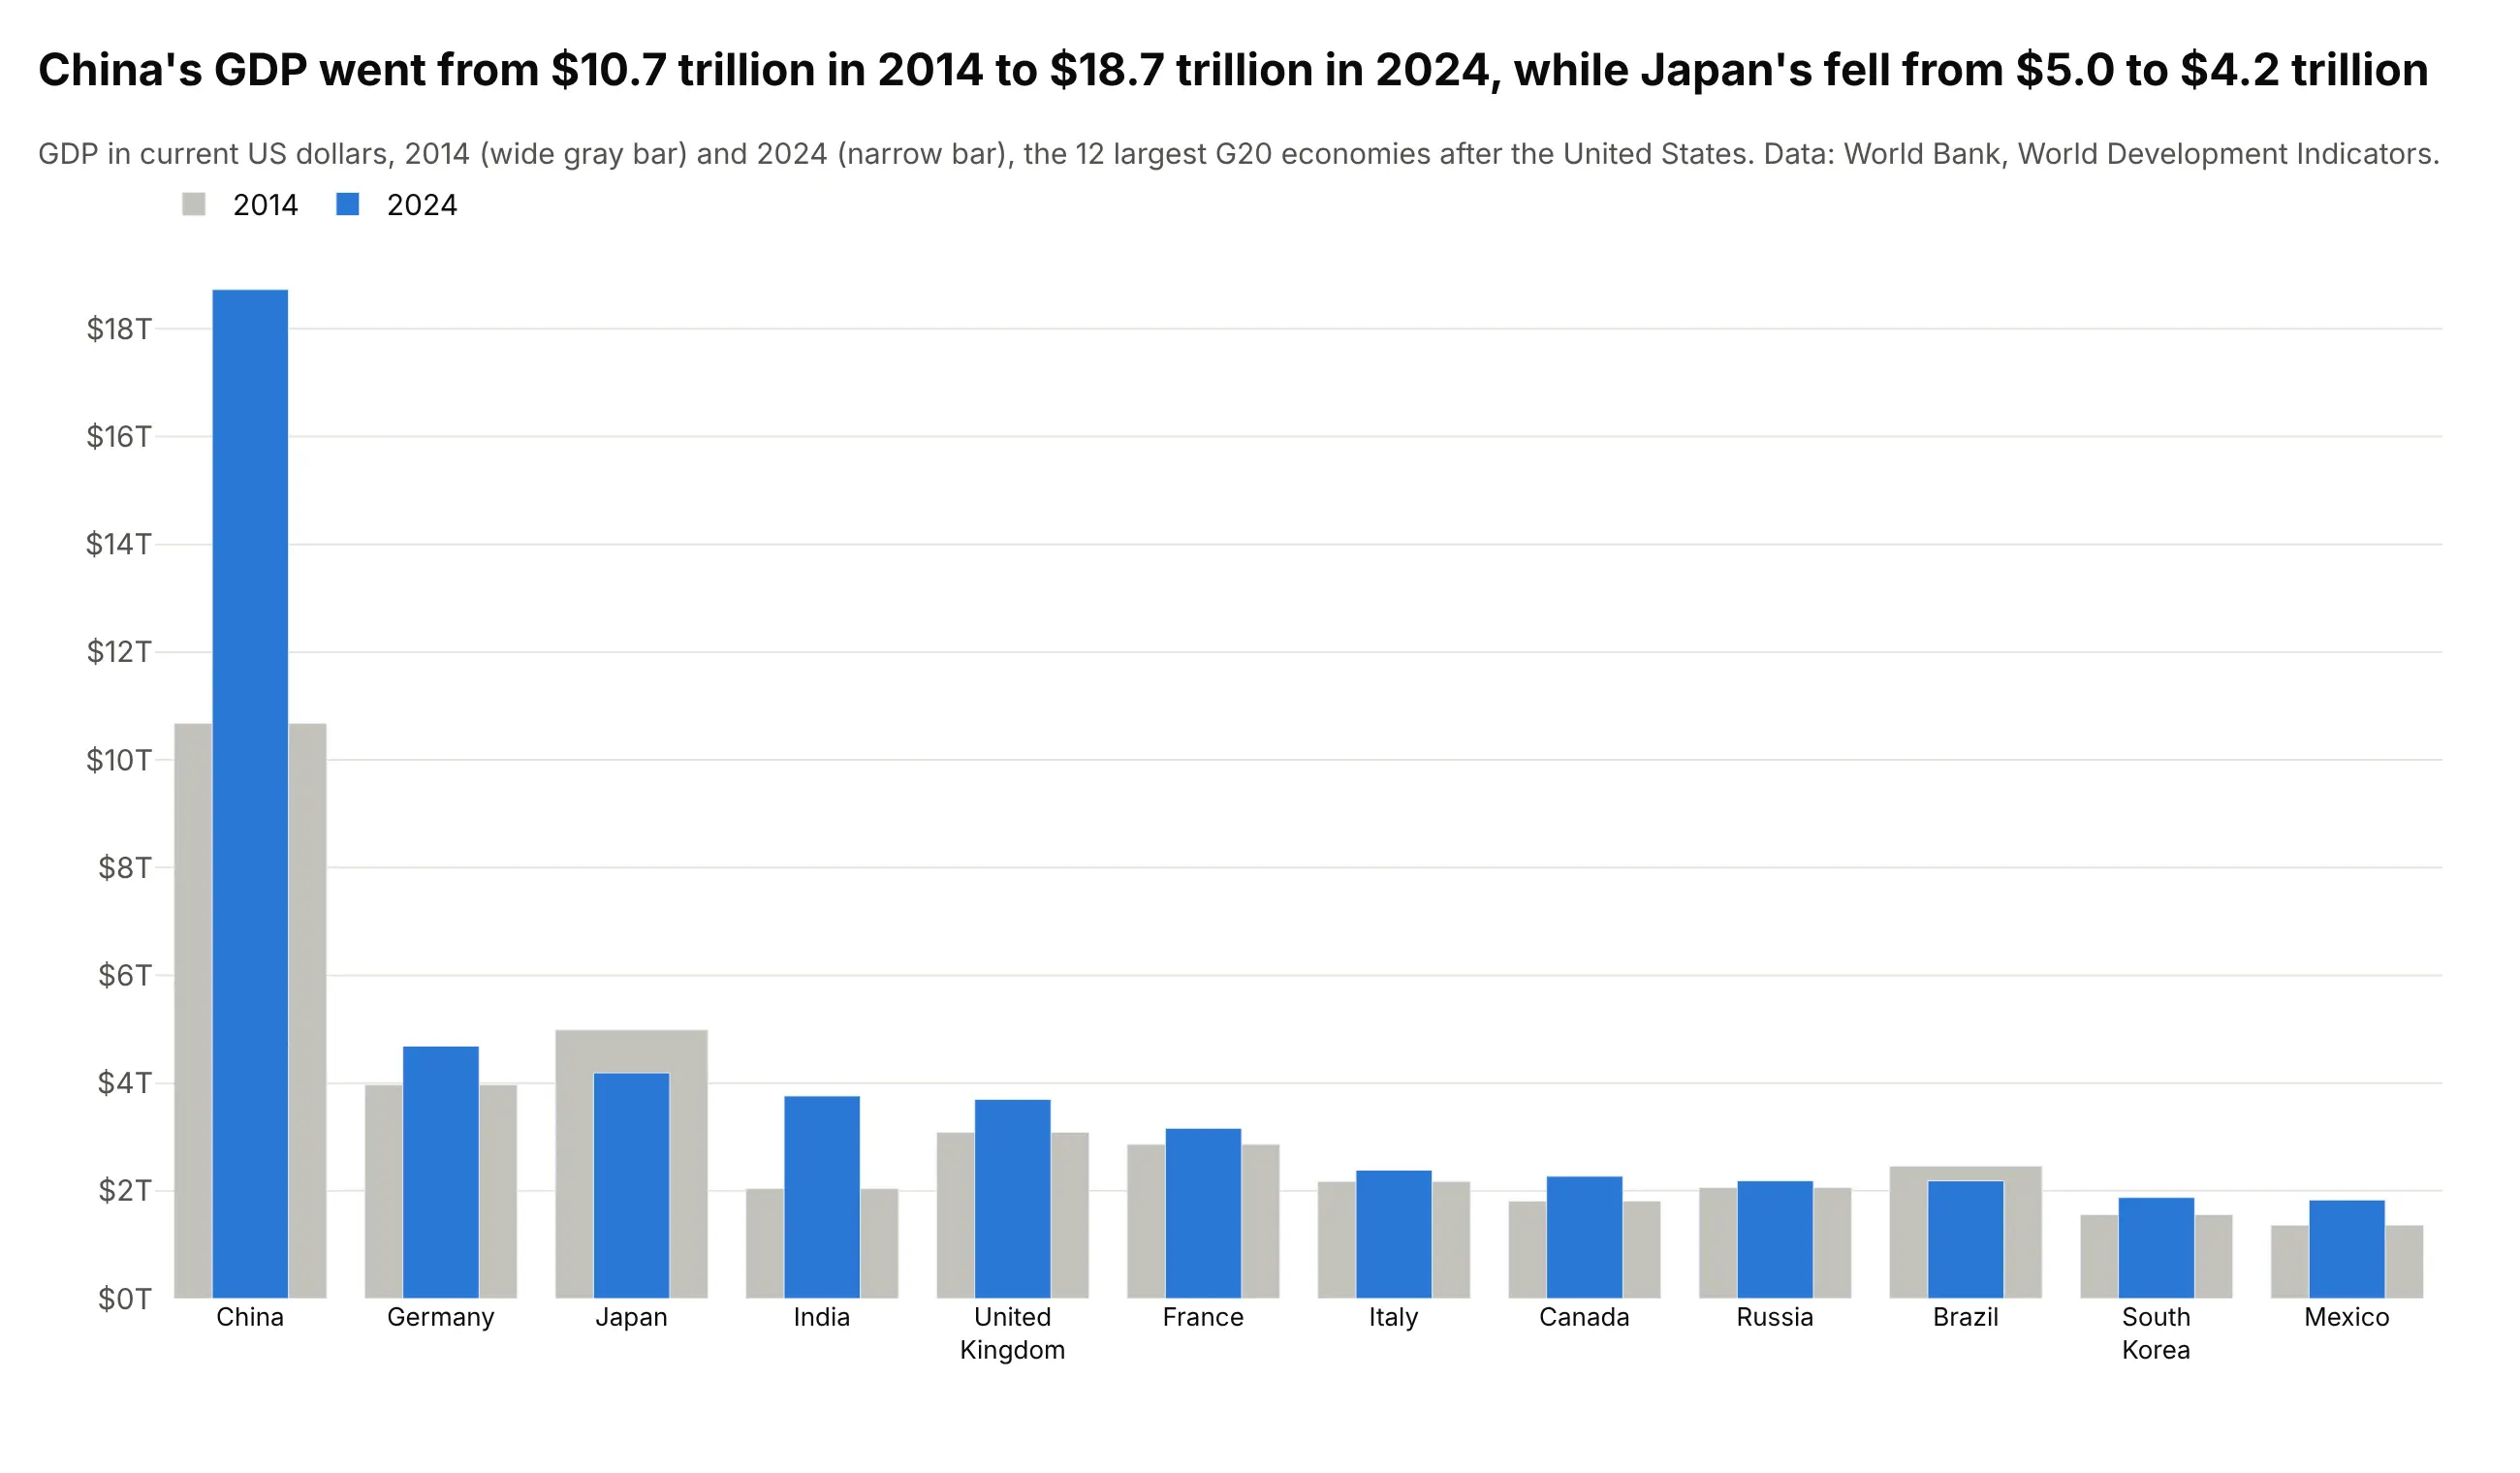
China's GDP went from $10.7 trillion in 2014 to $18.7 trillion in 2024, while Japan's fell from $5.0 to $4.2 trillion. Overlaying a narrow bar for the new value on a wide bar for the old one shows the change in a single column per country, with half the width of a grouped bar chart. Use barmode="overlay" and give the two traces different width values.
Prompt: Get the data from the World Bank API (World Development Indicators, NY.GDP.MKTP.CD, GDP in current US dollars) for the G20 countries in 2014 and 2024, leaving out the United States so the others are readable. Make a plotly bar chart with barmode="overlay": 2014 as wide light gray bars (width 0.8), 2024 as narrow blue bars (width 0.4) in front.
11. Grouped and stacked bars
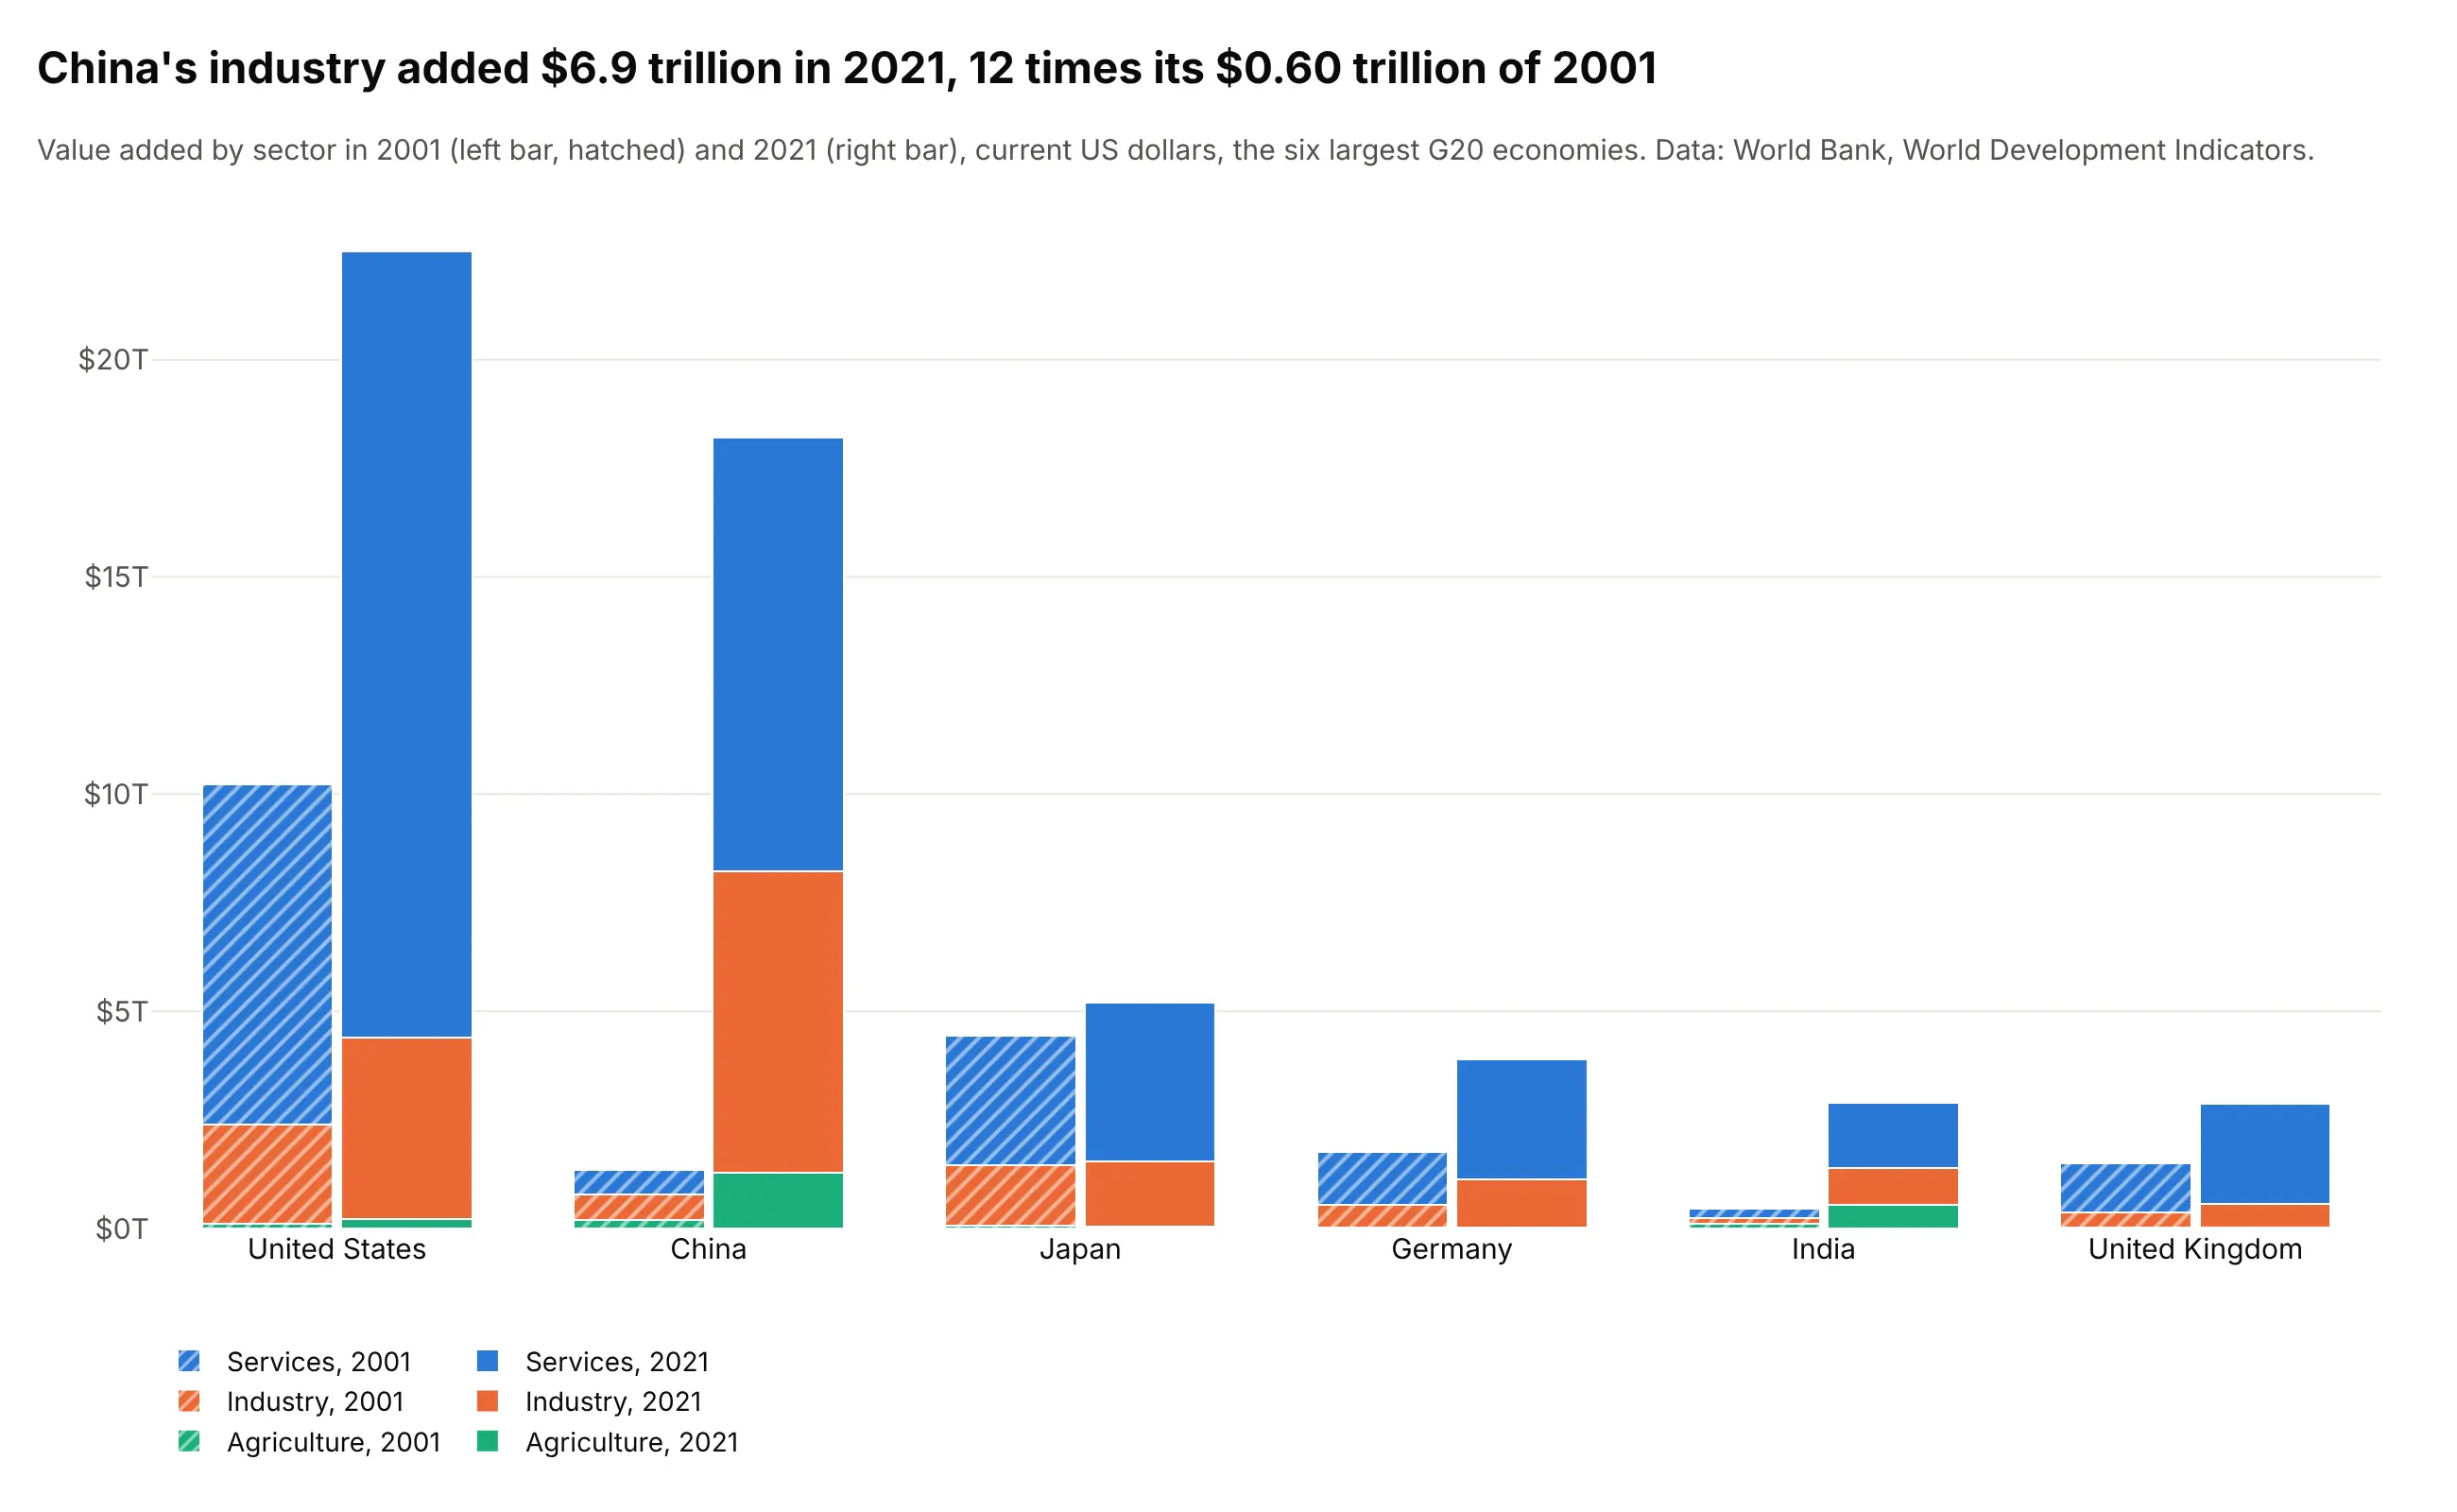
China's industry added $6.9 trillion in 2021, about 12 times its $0.60 trillion of 2001. A grouped stacked bar chart puts two stacked bars side by side for each country, one per year, so it compares the totals and the sector mix at once. In Plotly, set barmode="stack" and give each year's traces the same offsetgroup; a pattern on one year keeps the colors for the sectors.
Prompt: Get the data from the World Bank API (World Development Indicators, NV.AGR.TOTL.CD, NV.IND.TOTL.CD and NV.SRV.TOTL.CD in current US dollars) for the six largest G20 economies in 2001 and 2021. Make a plotly bar chart with barmode="stack" and offsetgroup set to the year, one color per sector, the 2001 bars hatched with marker.pattern, and the legend below.
12. Small multiples
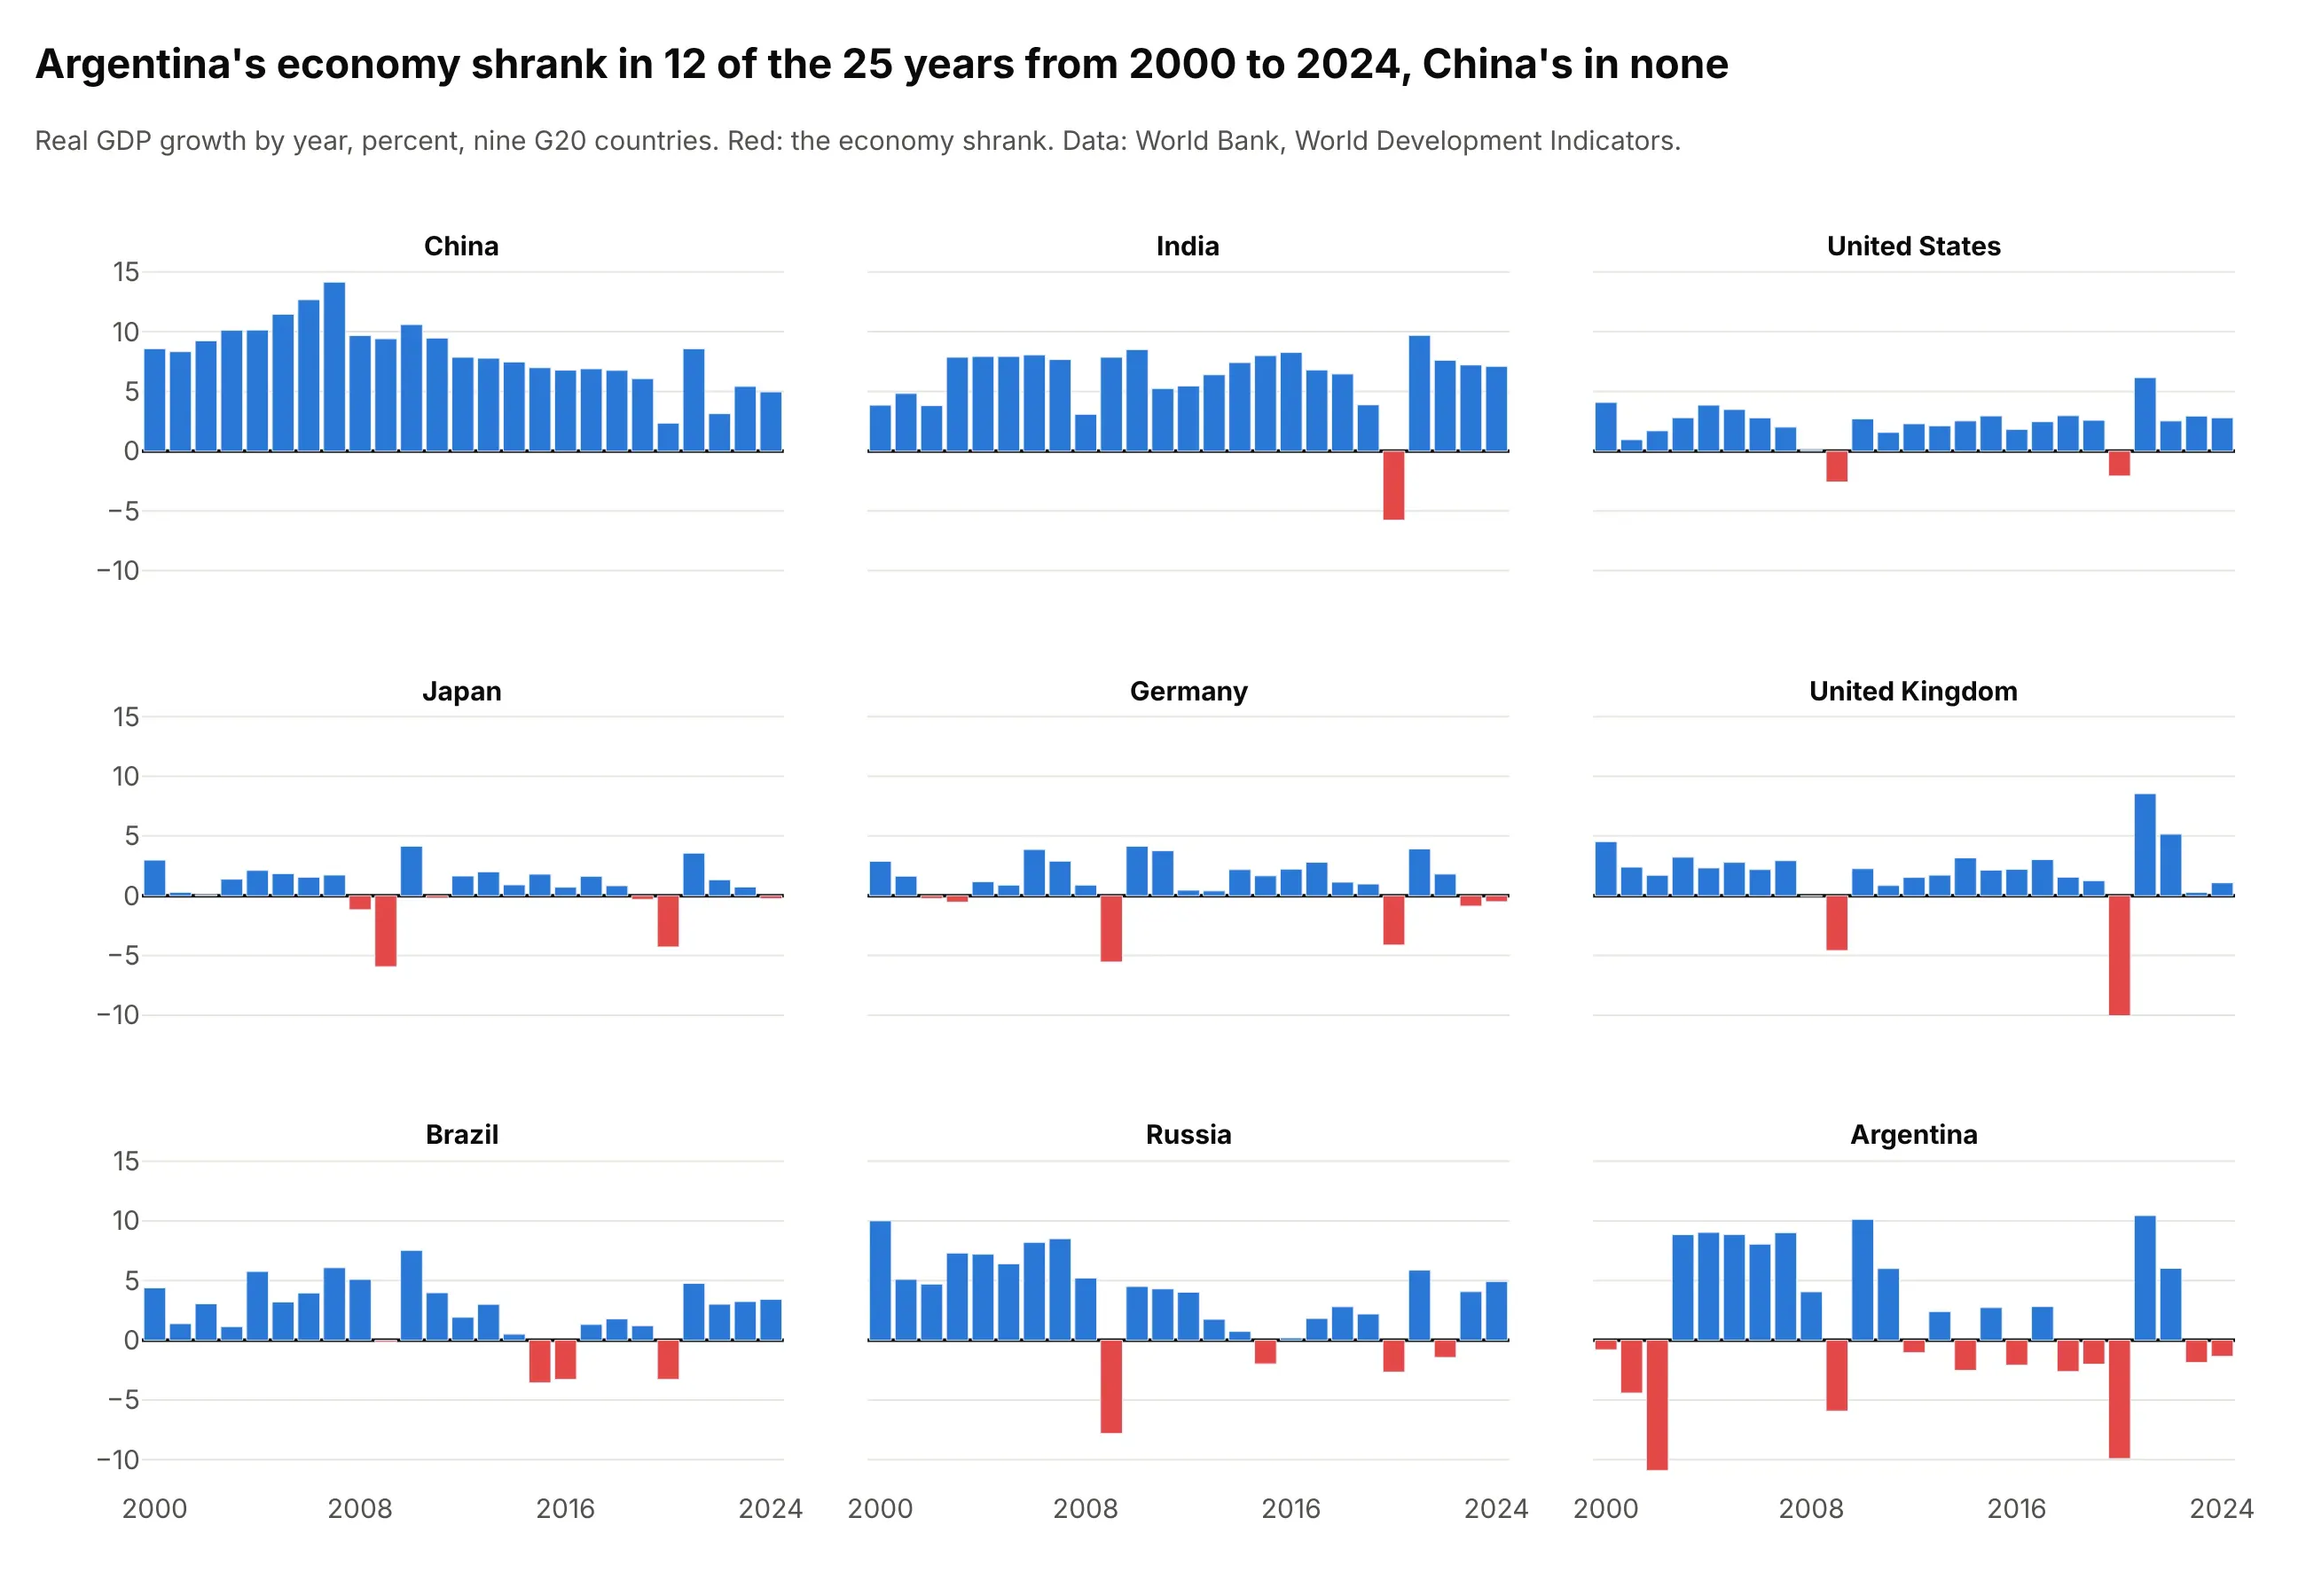
Argentina's economy shrank in 12 of the 25 years from 2000 to 2024, and China's in none. Small multiples give each country its own panel with the same axes, which compares the patterns over time without 225 bars crowding one chart. Use facet_col="country" with facet_col_wrap=3 in px.bar; the small multiples guide covers the layout.
Prompt: Get the data from the World Bank API (World Development Indicators, NY.GDP.MKTP.KD.ZG, real GDP growth) for China, India, the United States, Japan, Germany, the United Kingdom, Brazil, Russia and Argentina, 2000 to 2024. Make a plotly bar chart with px.bar, facet_col="country" and facet_col_wrap=3, shared y axes, and negative years colored red.
13. Animated bars
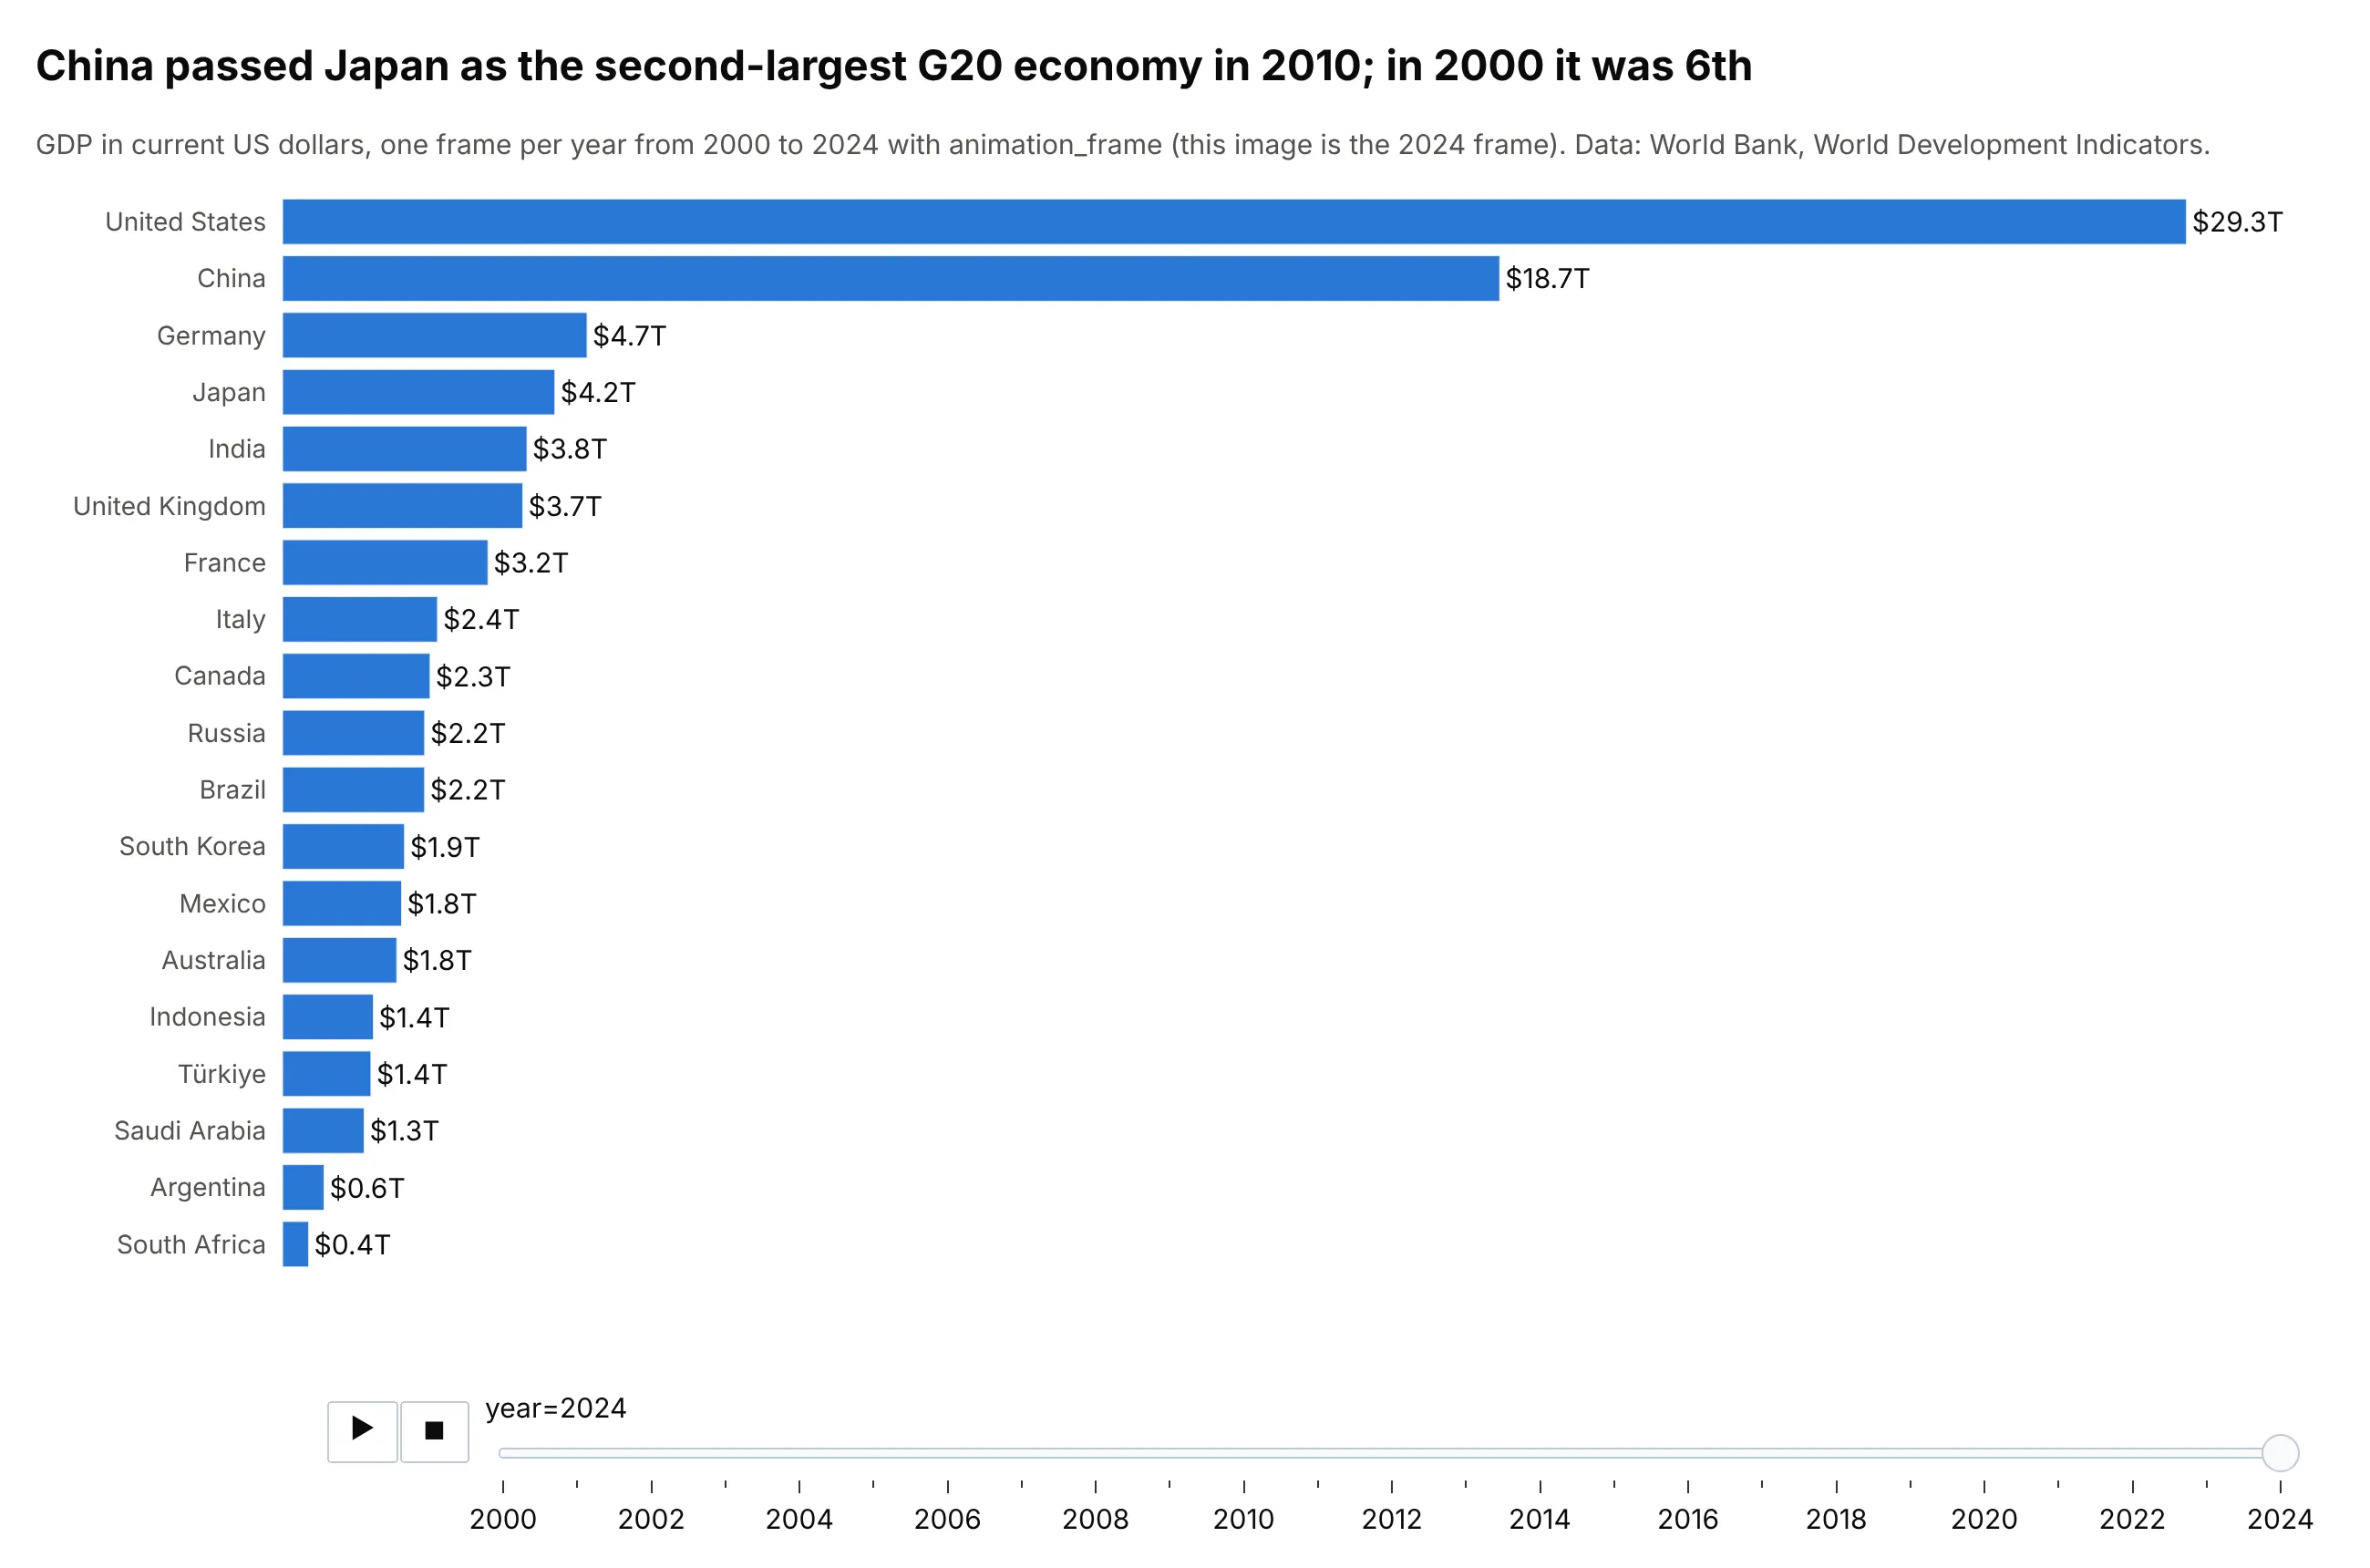
China passed Japan as the second-largest G20 economy in 2010, after ranking 6th in 2000. Adding animation_frame="year" to px.bar gives the chart a play button and a slider, so readers can watch the ranking change; the image above is the 2024 frame. Sorting the bars by value in every frame turns the chart into a bar chart race.
Prompt: Get the data from the World Bank API (World Development Indicators, NY.GDP.MKTP.CD, GDP in current US dollars) for the 19 G20 countries, 2000 to 2024. Make a plotly horizontal bar chart with px.bar and animation_frame="year", bars sorted by value in every frame, a fixed x range up to the largest value, and the value at the end of each bar.