
Chris Parmer
November 9, 2026
Parliament Charts - A Complete Guide
TL;DR
- A parliament chart draws one dot per seat on concentric half circles, with each party's seats in one wedge, so you can count seats, compare parties and see at a glance which groups together pass the majority line.
- Parliament charts are also known as hemicycle charts, parliament diagrams and election apportionment diagrams, and are similar to waffle charts, half donut charts (a pie chart with half the circle hidden) and stacked bar charts.
- The layout follows a few rules: rows are evenly spaced between an inner and an outer radius, each row holds seats in proportion to its length, and seats are handed out to parties by angle, left to right.
- They are the standard way to show election results for a legislature, and they work for any fixed set of equal units, such as reactors in a fleet, gigawatts of capacity or votes in a committee.
- You can make a parliament chart with Plotly in Python or JavaScript from a go.Scatter trace of markers at computed seat positions, about 40 lines with the helper below.
What is a parliament chart?
Parliament charts look like this:
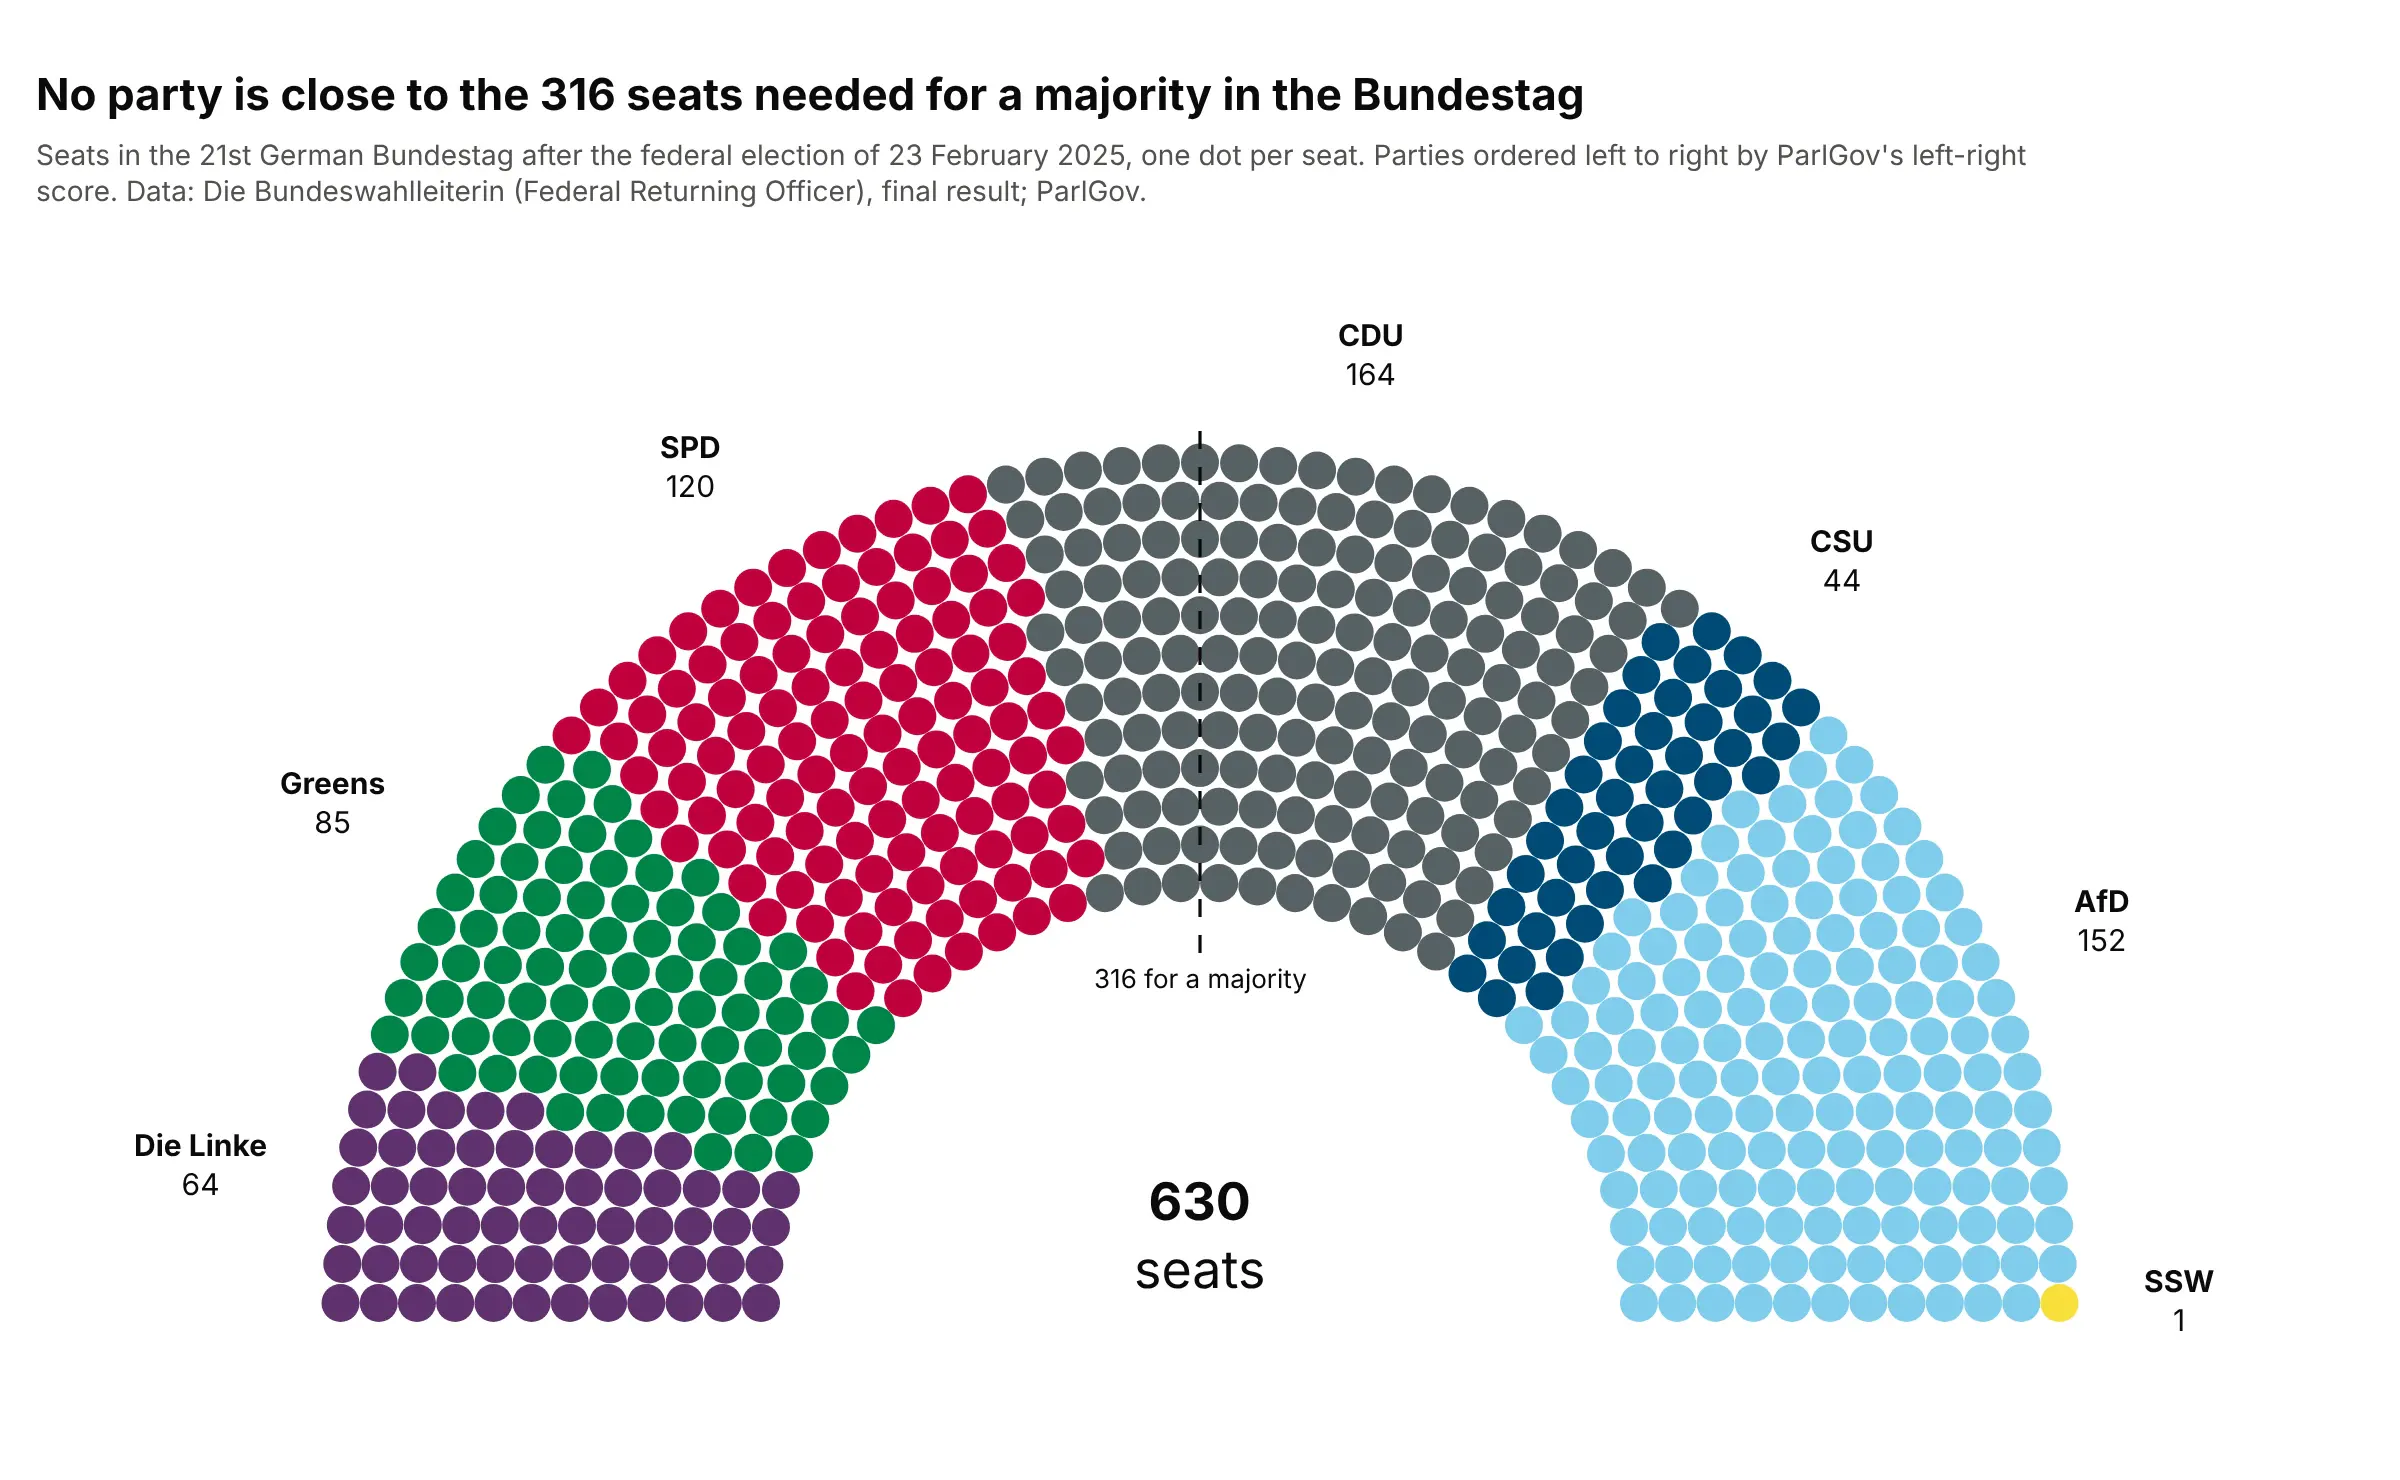
Data: Die Bundeswahlleiterin (Federal Returning Officer), final result of the 2025 federal election; party order from ParlGov's left-right scores.
How do you read a parliament chart? In the example above, notice these things:
- Each dot is one of the 630 seats in Germany's federal parliament, the Bundestag. The dots sit in 12 rows, from 36 seats in the inner row to 69 in the outer one, so every party's wedge is easy to count and compare.
- Parties are ordered from left to right by ParlGov's left-right score, a research database of parties and elections, with the one SSW seat (the South Schleswig Voters' Association, which ParlGov doesn't score) last, as on the Federal Returning Officer's own chart.
- The dashed line marks the 316th seat, the majority. No party comes close: the largest, the Christian Democratic Union (CDU), has 164, so a government needs parties that together cross the line.
- Neighbors on the spectrum sit next to each other, so possible coalitions read as one connected block. The CDU and its Bavarian sister party, the Christian Social Union (CSU), hold 208 seats together.
It's often used for charts like these:
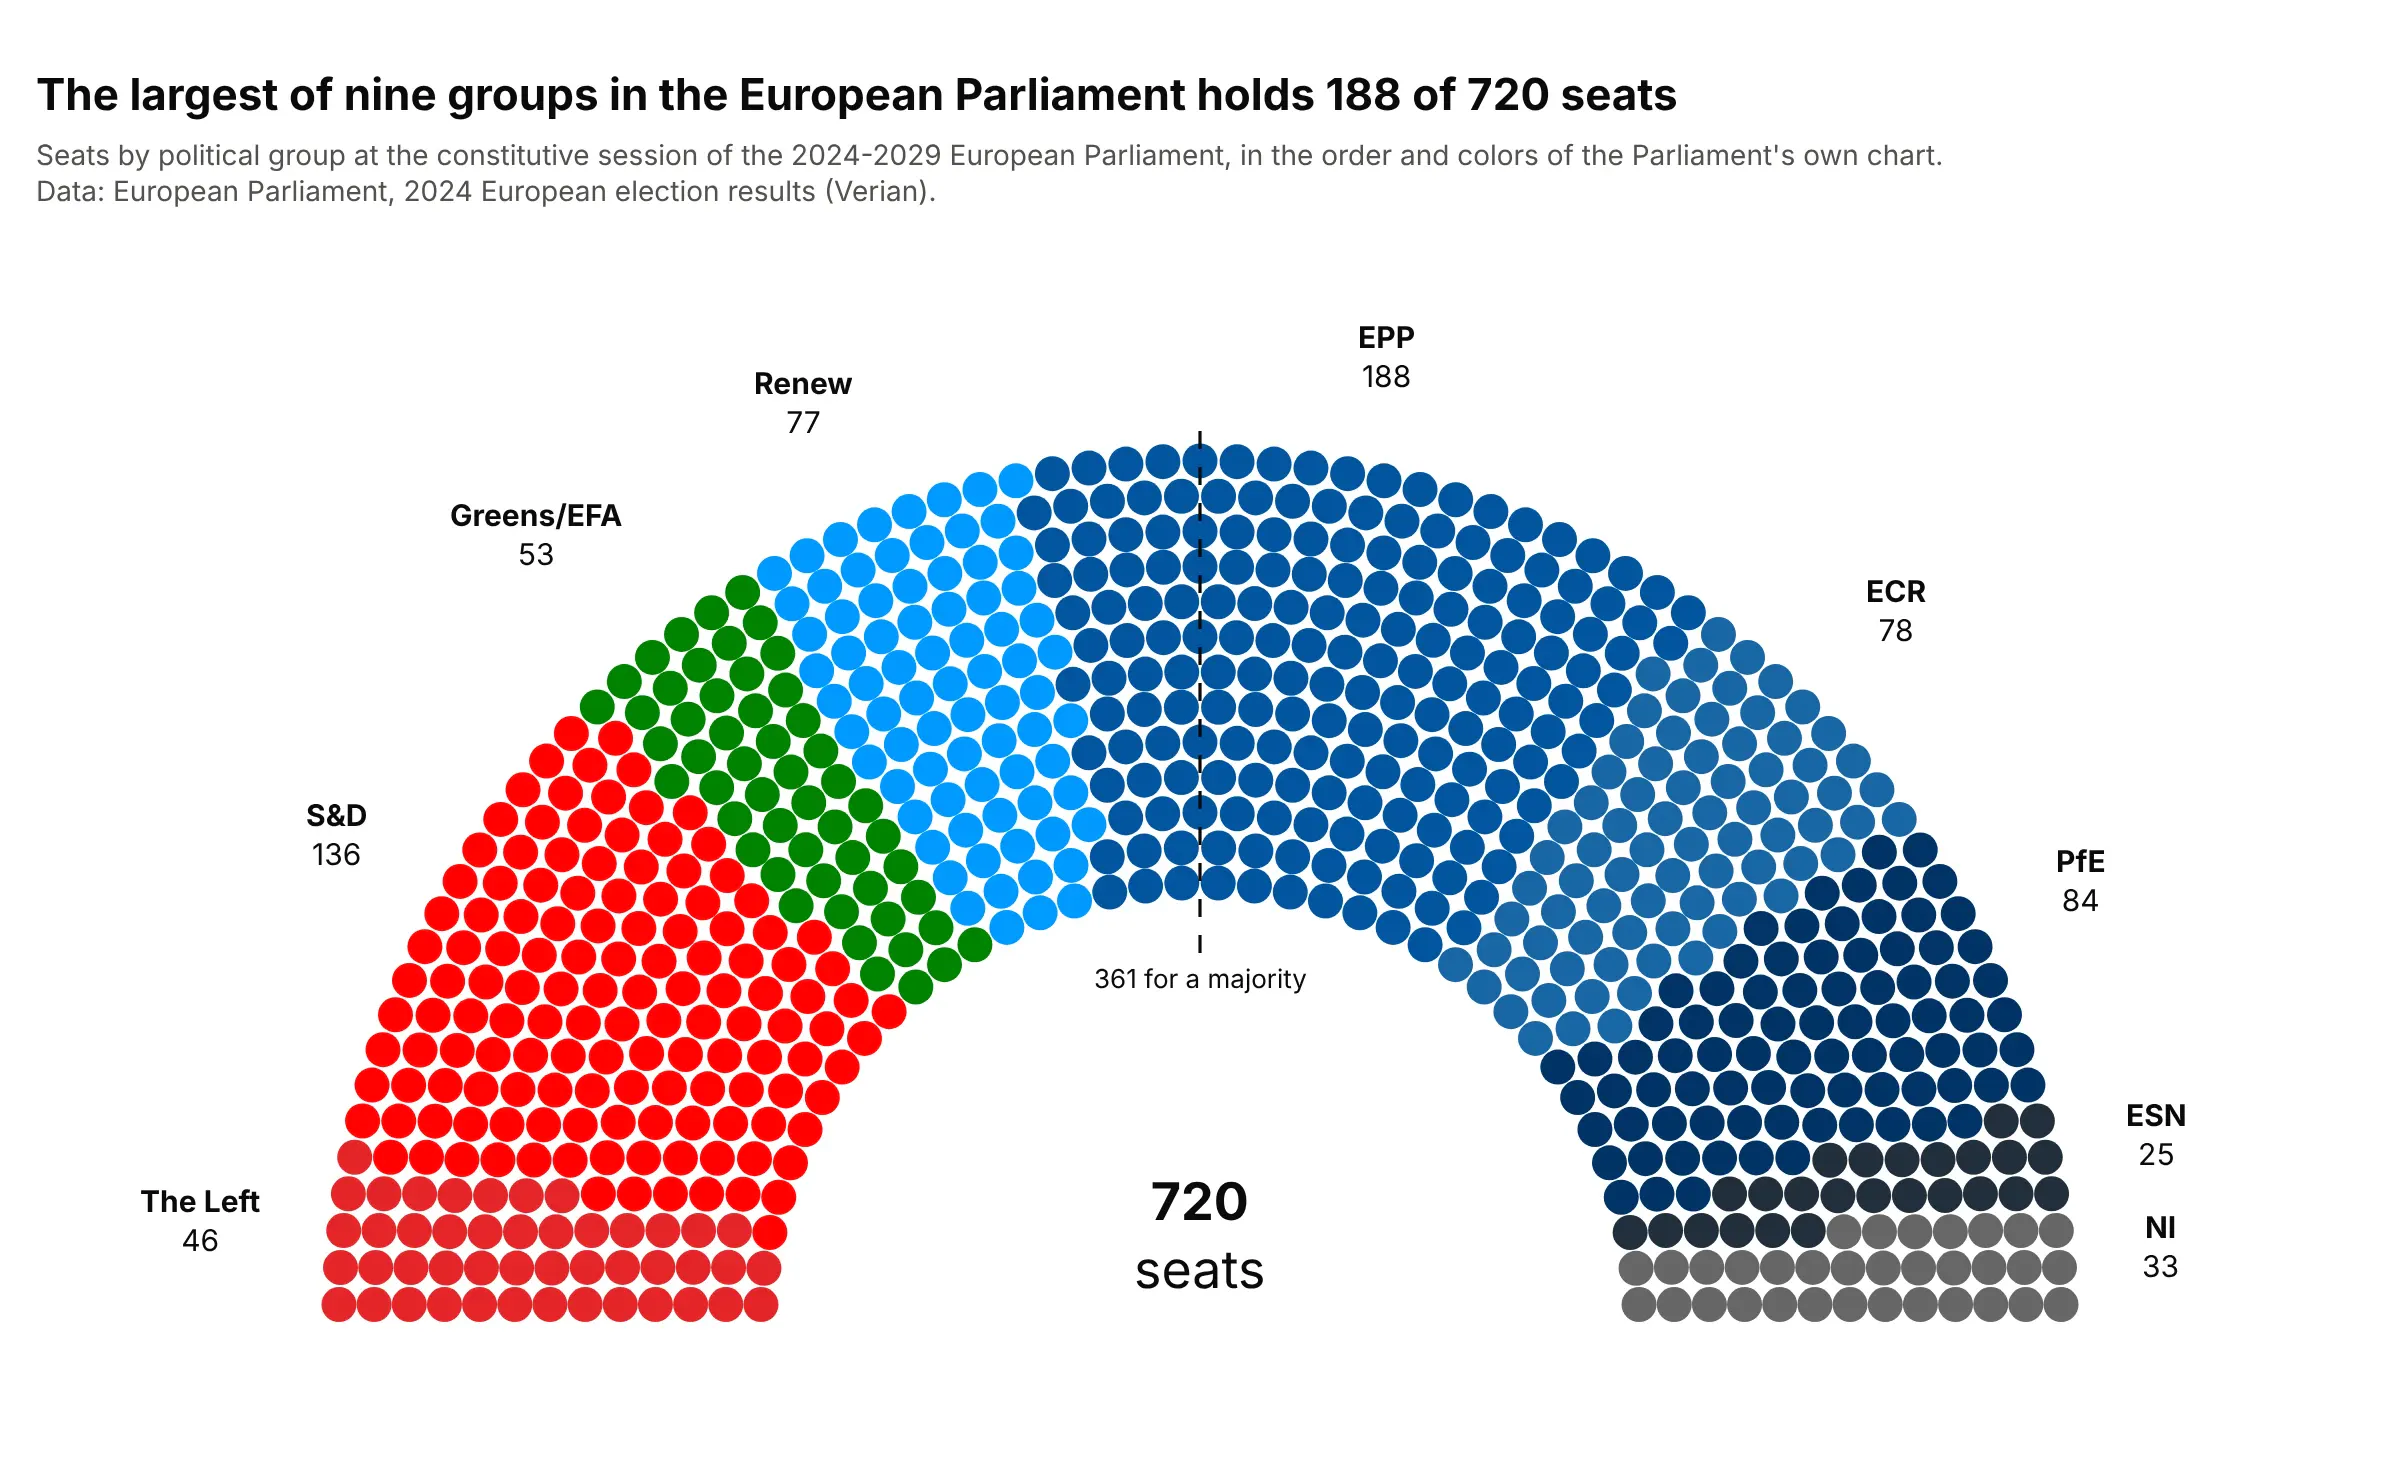
Election results. The European Parliament's own results site draws its 720 seats in this order, and the largest of its nine groups, the European People's Party (EPP), holds 188, well short of the 361 needed for a majority. Data: European Parliament, 2024 European election results (Verian), constitutive session.
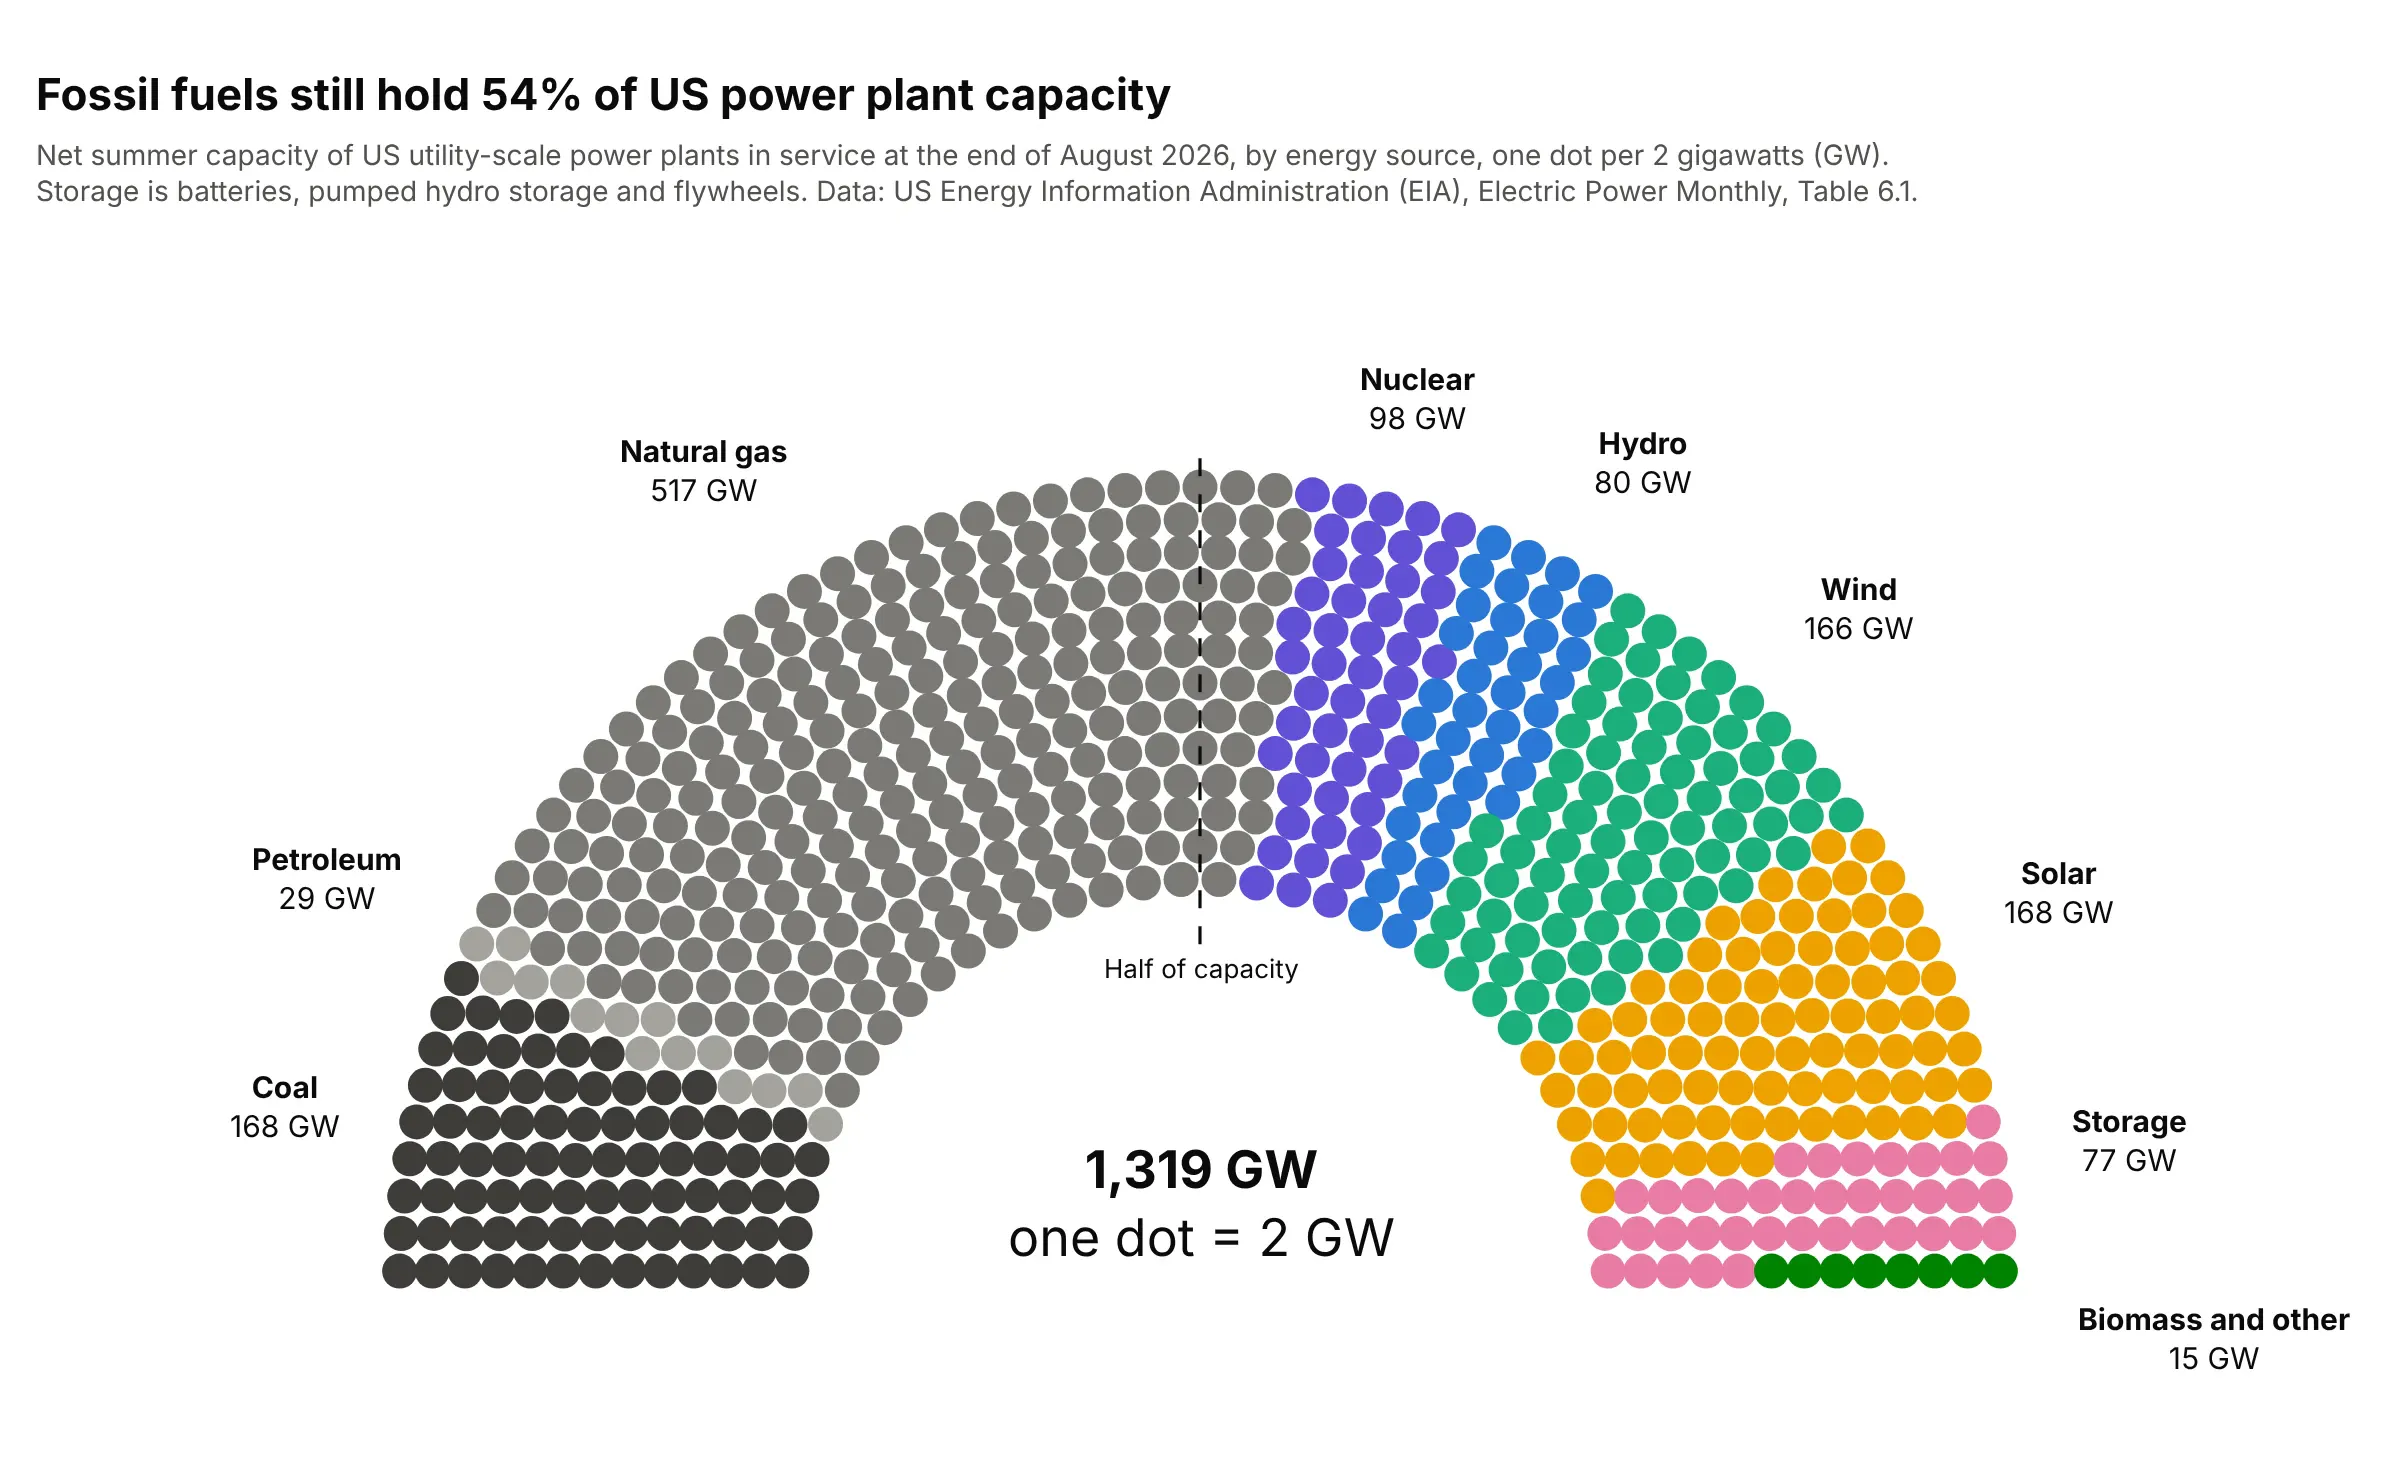
Units of anything. A seat can be any equal unit: here one dot is 2 gigawatts (GW), and the line at the half shows that fossil fuels still hold 54% of US utility-scale capacity. Data: US Energy Information Administration (EIA), Electric Power Monthly, Table 6.1, end of August 2026.
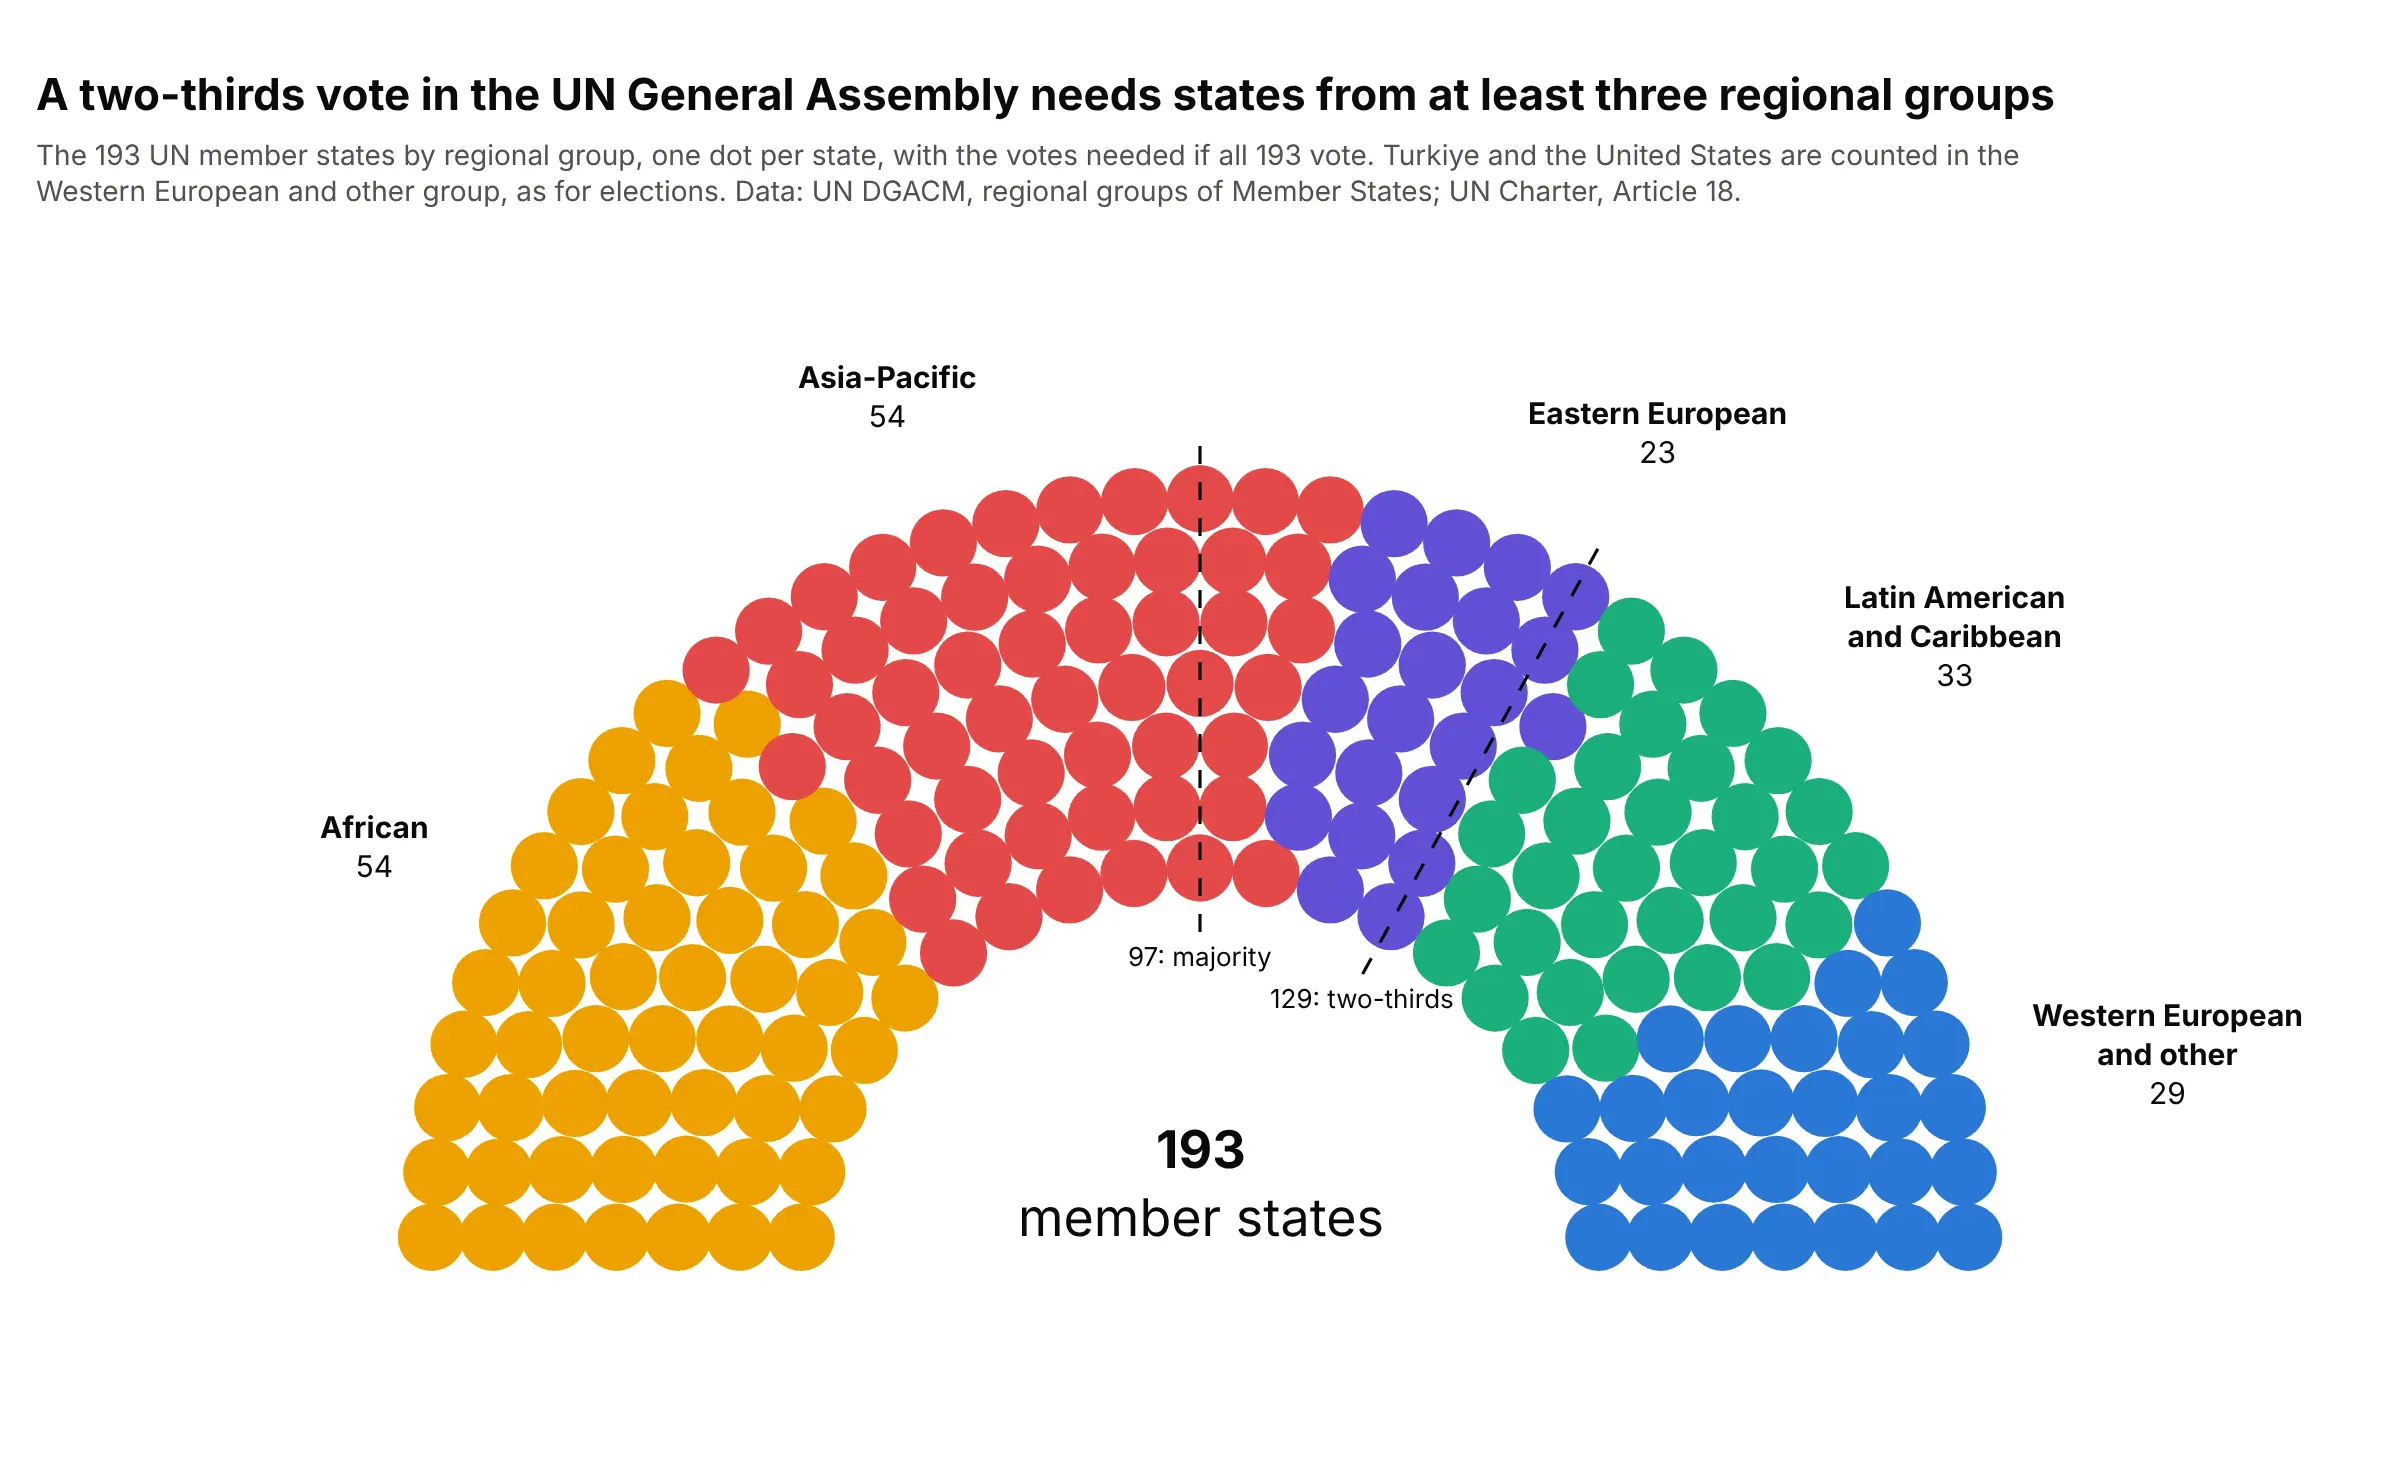
Voting thresholds. Two lines show the 97 votes for a simple majority and the 129 for a two-thirds majority in the UN General Assembly if all 193 members vote, which no two regional groups reach on their own. Data: UN Department for General Assembly and Conference Management (DGACM), regional groups of Member States; UN Charter, Article 18.
How the seats are laid out
A parliament chart looks hand-drawn, but it comes from a short calculation, and knowing it helps when a chart looks wrong. The rules below are the ones documented by parliamentarch, the Python module behind Wikipedia's parliament diagram tool, and our Plotly helper follows them:
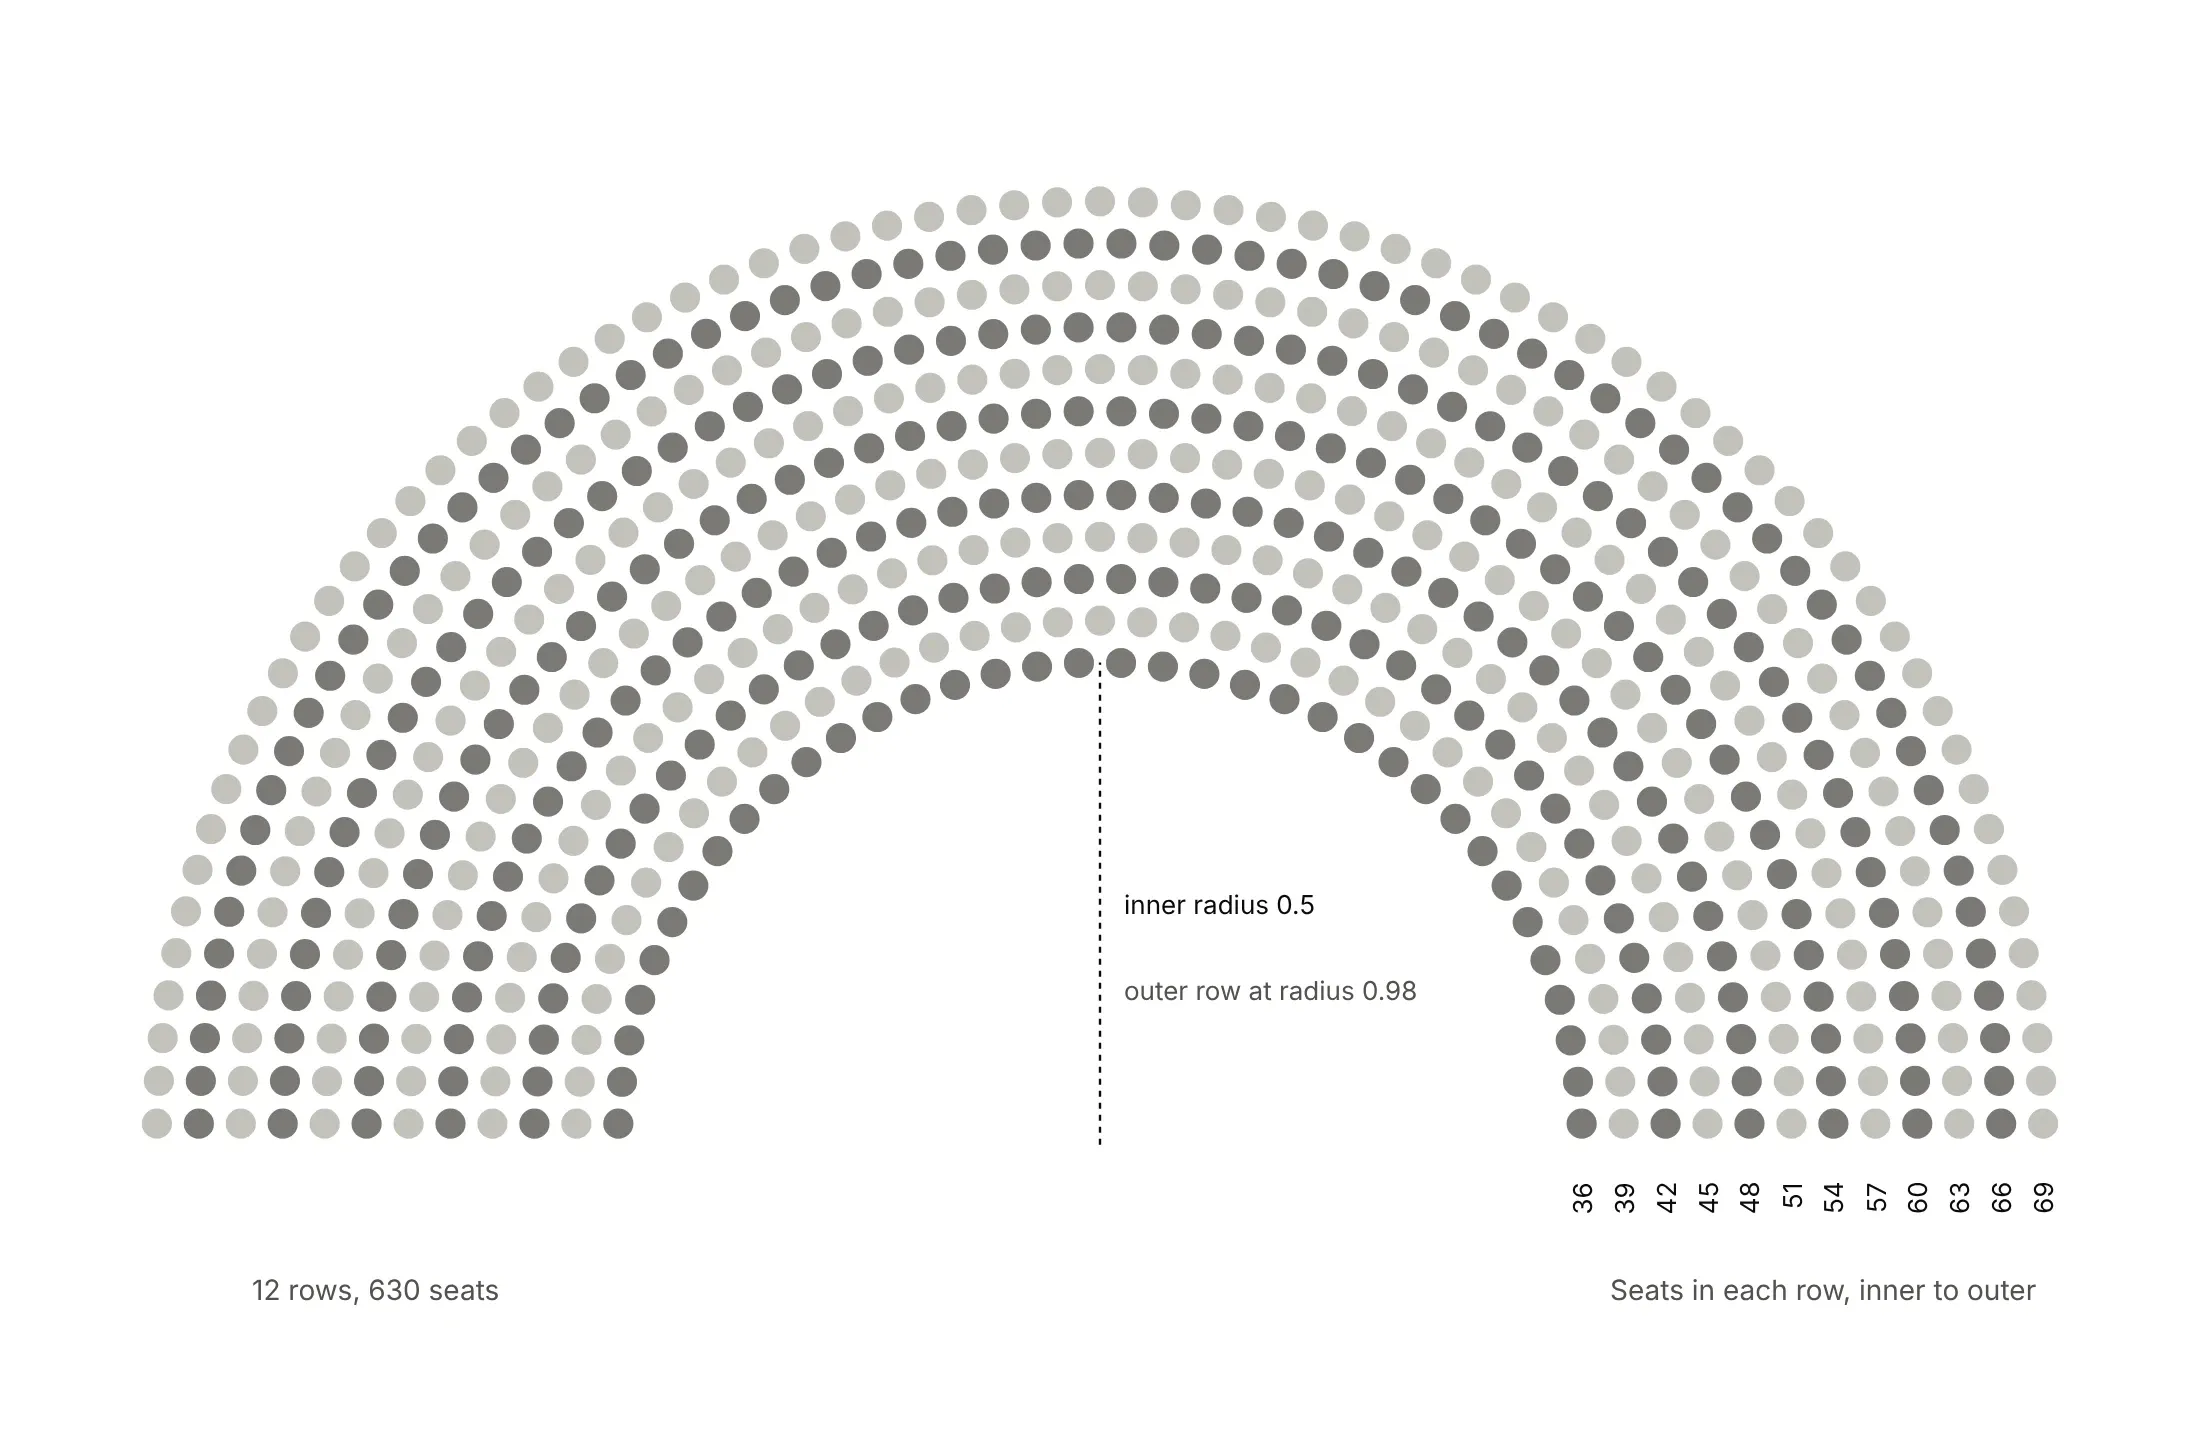
- The shape is half a ring. The seats fill the space between an inner half circle and an outer one twice its radius, so there's an empty middle, like the floor of a chamber.
- Rows are evenly spaced. With R rows, the distance between rows (the row thickness) is 0.5 / (R − 0.5) of the outer radius, so the outer row sits half a row inside the edge.
- Each row holds seats in proportion to its length. Seats in a row are one row thickness apart, so an outer row holds more: in the 2025 Bundestag, 36 seats in the inner row and 69 in the outer one.
- Use the fewest rows that fit. The number of rows grows with the square root of the seat count: 5 rows for 95 seats, 7 for 193, 12 for 630 and 13 for 720.
- Hand out seats by angle. Sort every seat from left to right by its angle and give the first 64 to the first party, the next 85 to the second, and so on. That's what turns parties into wedges instead of rings, and it puts the majority seat at the top of the arch.
A short history
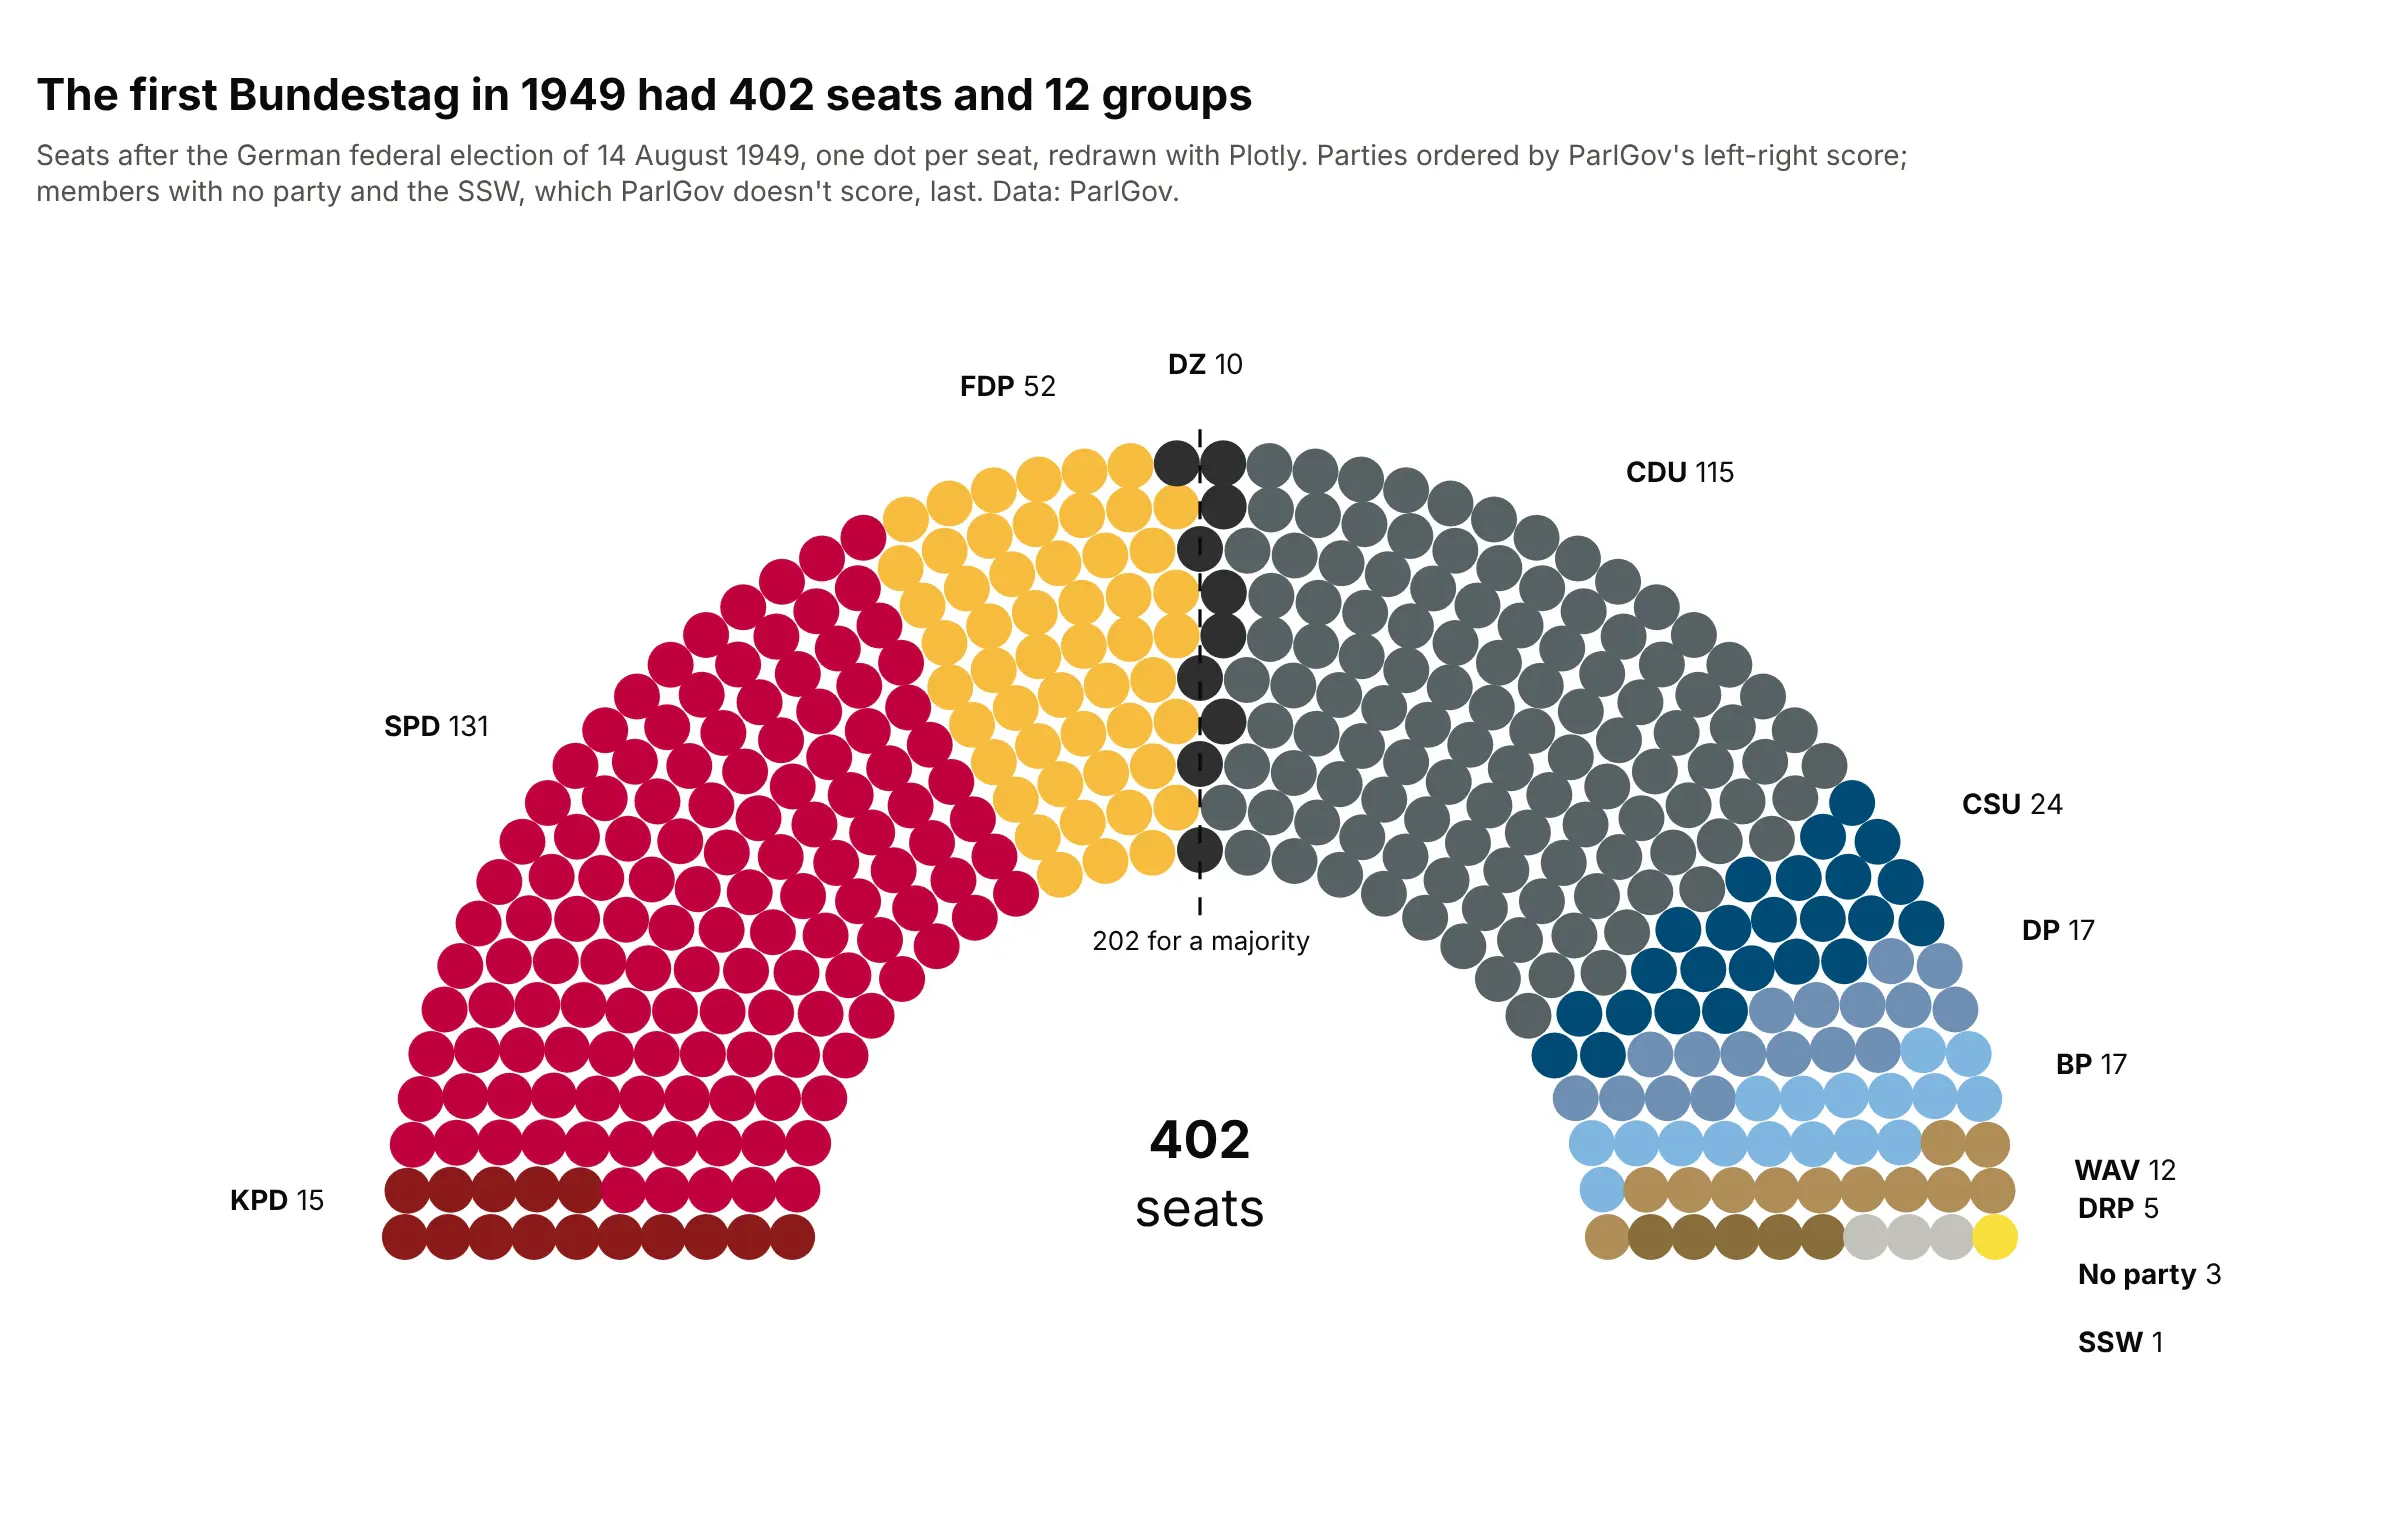
Semicircular debating chambers, or hemicycles, come from French politics, and the terms left and right come from where members of France's National Assembly sat in 1789: supporters of the old regime to the president's right and supporters of the revolution to his left. Most European parliaments and the European Parliament sit in a hemicycle, while the UK House of Commons sits on facing benches. Wikipedia's election articles draw seat charts in this shape with its parliament diagram tool, built by David Richfield and others, and charting libraries followed: ggparliament for R in 2019, Highcharts' item chart and Python's parliamentarch, first released in 2024. We couldn't find the first published seat chart, so here's the Bundestag's first election, redrawn with Plotly:
Alternatives to a parliament chart
Here's the same Bundestag drawn six ways. Some are better for the question, some worse, some just different:
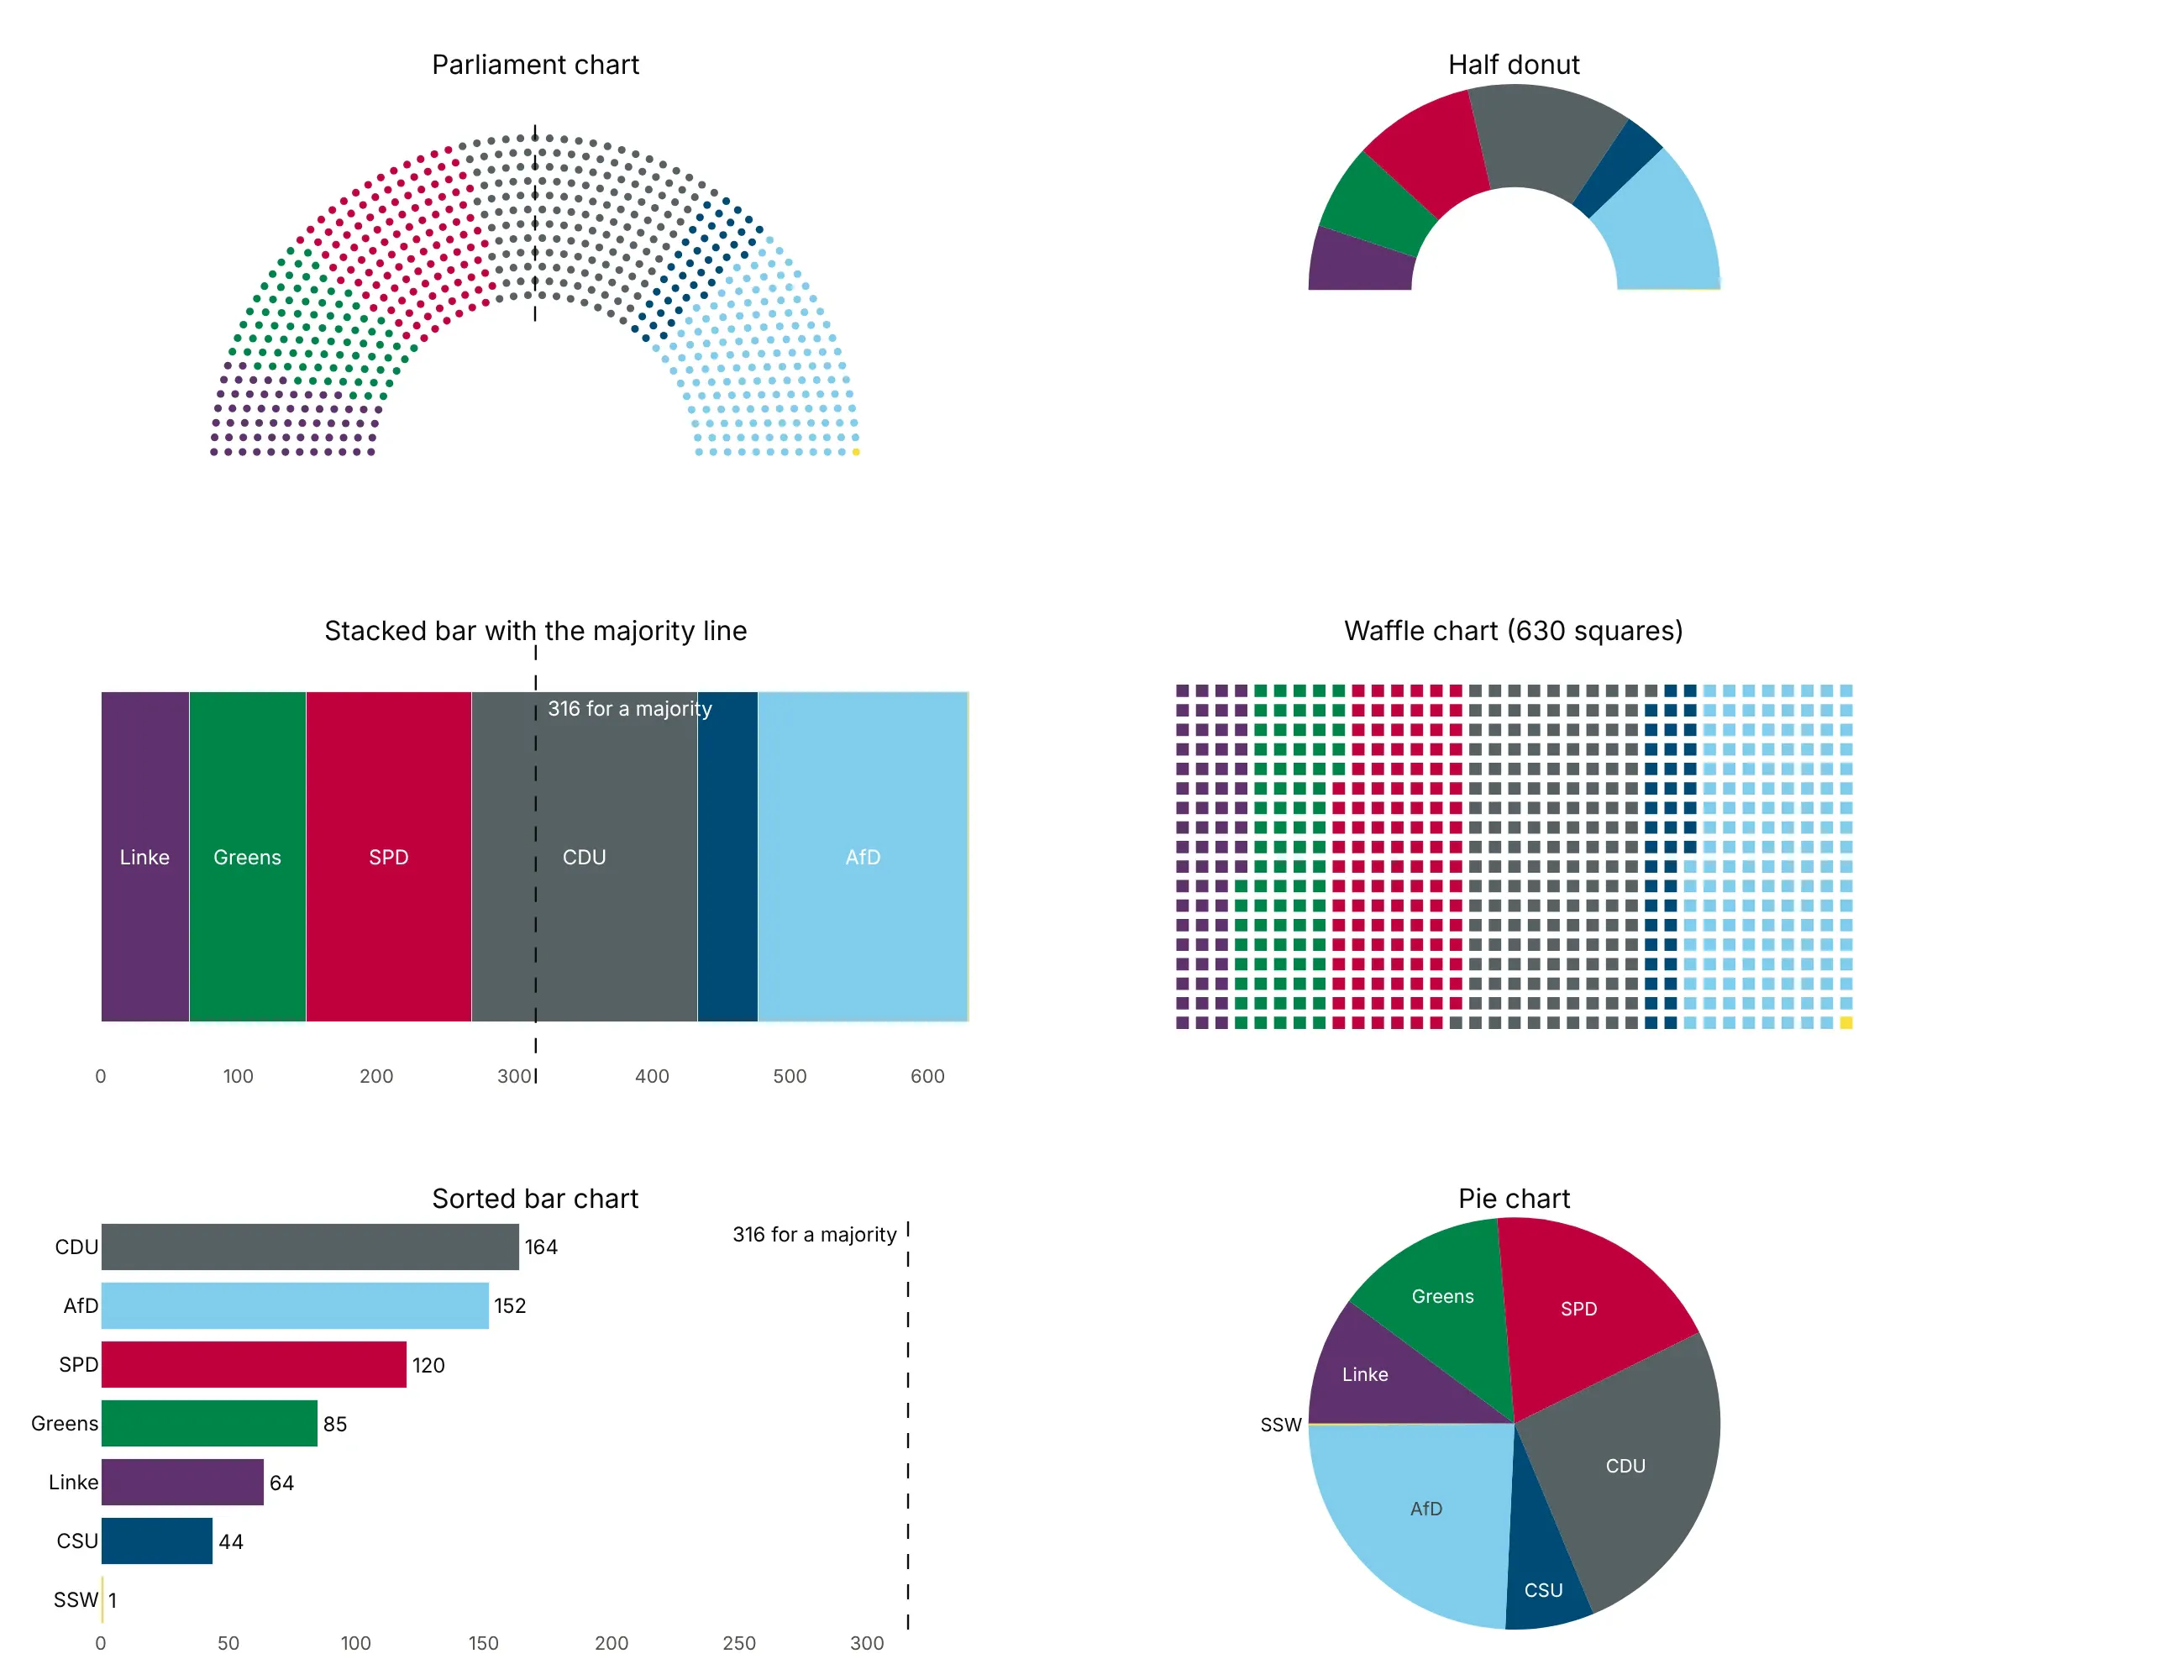
- Sorted bar chart (better for comparing parties). Bars on a common baseline are the most precise way to see that the CDU (164) has 12 more seats than the AfD (152), but they lose the chamber's left-to-right order and the feel of a whole.
- Stacked bar with a majority line (works too). It keeps the order and the whole, shows which neighbors cross 316, and fits in a narrow space, such as a table row or a phone screen.
- Waffle chart (works too). One square per seat in a grid makes counting even easier, but the grid has no middle, so the majority line is harder to draw.
- Half donut (different). A pie chart with its bottom half hidden is what Wikipedia calls an abstract version of a hemicycle. It shows shares and order but not individual seats.
- Pie chart (worse). Seven slices with no majority marker hide the question most readers have, which is who can form a majority.
How to make a parliament chart
With AI
ChatGPT, Claude Code, GitHub Copilot, Cursor and other AI tools are excellent at writing Plotly code. Name Plotly in the prompt, and say how to order the parties and where the majority line goes:
Make a plotly parliament chart (hemicycle) from seats.csv (columns: party, seats, color, order).- Compute seat positions on concentric half circles between radius 0.5 and 1: the fewest rows thatfit, rows evenly spaced, seats per row in proportion to row length, then sort all seats by angleand give each party a block of consecutive seats, so every party is one wedge.- One go.Scatter trace per party, ordered by the order column, markers sized to the row spacing,hover with party and seats.- Equal x and y scales (scaleanchor), no axes, a dashed radial line at the majority with its seat count,and labels with each party's seats outside the arch.- Check: print the number of rows, the seats in each row and the total, which must equal the sum of seats.
With Plotly Studio
Plotly Studio is a desktop app where you point an AI at a dataset and it builds charts and a Dash app around your questions. Ask for a parliament chart the same way:
Show the seats in the European Parliament by political group as a parliament chart in the Parliament's own group order and colors, with a majority line at 361 and a dropdown to switch between the 2019 and 2024 terms.
Make a parliament chart in Python or JavaScript
This is the code AI tools write under the hood. Plotly has no parliament trace, so a parliament chart is a go.Scatter of markers at computed positions. In Python, a short helper computes the seats and draws one trace per party:
import numpy as npimport plotly.graph_objects as godef seat_positions(n, inner=0.5):"""x, y of n seats on concentric half circles, sorted left to right."""def capacities(rows):t = (1 - inner) / (rows - 0.5) # row thicknessradii = inner + t * np.arange(rows)ends = np.arcsin(t / 2 / radii) # keep the end seats off the baselinereturn radii, np.floor(radii * (np.pi - 2 * ends) / t).astype(int) + 1, trows = next(r for r in range(1, 5000) if capacities(r)[1].sum() >= n)radii, cap, t = capacities(rows)quota = cap / cap.sum() * n # seats per row in proportion to its lengthper_row = np.floor(quota).astype(int)per_row[np.argsort(per_row - quota)[: n - per_row.sum()]] += 1angle = np.concatenate([np.linspace(np.pi - e, e, m) if m > 1 else [np.pi / 2]for e, m in zip(np.arcsin(t / 2 / radii), per_row)])radius = np.repeat(radii, per_row)order = np.lexsort((radius, -angle)) # by angle, so each party gets a wedgereturn radius[order] * np.cos(angle[order]), radius[order] * np.sin(angle[order]), tdef make_parliament(parties, seats, colors, width=900):n = sum(seats)x, y, t = seat_positions(n)fig = go.Figure()start = 0for party, s, color in zip(parties, seats, colors):fig.add_scatter(x=x[start:start + s], y=y[start:start + s], mode="markers", name=f"{party} ({s})",marker=dict(size=0.8 * t * width / 2.3, color=color),hovertemplate=f"{party}: {s} seats<extra></extra>")start += sfig.add_shape(type="line", x0=0, x1=0, y0=0.45, y1=1.03, line=dict(dash="dash", color="black"))fig.add_annotation(x=0, y=1.03, text=f"{n // 2 + 1} for a majority", showarrow=False, yanchor="bottom")fig.update_xaxes(visible=False)fig.update_yaxes(visible=False, scaleanchor="x")fig.update_layout(width=width, height=width * 0.6, plot_bgcolor="white",legend=dict(orientation="h", y=-0.05))return fig# German Bundestag after the 2025 election, ordered by ParlGov's left-right score (Die Bundeswahlleiterin)fig = make_parliament(["Die Linke", "Greens", "SPD", "CDU", "CSU", "AfD", "SSW"],[64, 85, 120, 164, 44, 152, 1],["#5f316e", "#008549", "#c0003d", "#576164", "#004b76", "#80cdec", "#f9df3a"])fig.show()
The marker size comes from the row thickness t, so dots touch neither their neighbors nor the next row at any seat count. scaleanchor="x" keeps the arch round when the figure is resized. For a one-dot-per-unit chart, such as gigawatts or planets, round each group to whole dots with the largest remainder method first, so the dots add up to the total.
In JavaScript, plotly.js draws the same chart from the same calculation:
<div id="chart"></div><script src="https://cdn.plot.ly/plotly-4.1.1.min.js"></script><script>// European Parliament 2024-2029 by political group, in the Parliament's own order (European Parliament, Verian)const groups = ["The Left", "S&D", "Greens/EFA", "Renew", "EPP", "ECR", "PfE", "ESN", "NI"];const seats = [46, 136, 53, 77, 188, 78, 84, 25, 33];const colors = ["#e42527", "#ff0000", "#008200", "#0099ff", "#0155a0", "#1866a5", "#003366", "#212f3c", "#666666"];const n = seats.reduce((a, b) => a + b, 0);// Rows: the fewest whose capacity holds n seats (inner radius 0.5, outer 1)const capacity = rows => {const t = 0.5 / (rows - 0.5), radii = [...Array(rows).keys()].map(k => 0.5 + t * k);return {t, radii, cap: radii.map(r => Math.floor(r * (Math.PI - 2 * Math.asin(t / 2 / r)) / t) + 1)};};let rows = 1;while (capacity(rows).cap.reduce((a, b) => a + b, 0) < n) rows++;const {t, radii, cap} = capacity(rows);const total = cap.reduce((a, b) => a + b, 0);const quota = cap.map(c => c / total * n), perRow = quota.map(Math.floor);quota.map((q, i) => [q - perRow[i], i]).sort((a, b) => b[0] - a[0]).slice(0, n - perRow.reduce((a, b) => a + b, 0)).forEach(([, i]) => perRow[i]++);// Every seat's angle and radius, then sorted left to right so each group gets a wedgeconst pts = [];radii.forEach((r, k) => {const e = Math.asin(t / 2 / r), m = perRow[k];for (let j = 0; j < m; j++) pts.push({r, a: m === 1 ? Math.PI / 2 : Math.PI - e - j * (Math.PI - 2 * e) / (m - 1)});});pts.sort((p, q) => q.a - p.a || p.r - q.r);let start = 0;const traces = groups.map((g, i) => {const p = pts.slice(start, start += seats[i]);return {x: p.map(s => s.r * Math.cos(s.a)), y: p.map(s => s.r * Math.sin(s.a)), mode: "markers",name: `${g} (${seats[i]})`, marker: {size: 9, color: colors[i]}, hovertemplate: `${g}: ${seats[i]} seats<extra></extra>`};});Plotly.newPlot("chart", traces, {width: 900, height: 560, plot_bgcolor: "white", legend: {orientation: "h"},xaxis: {visible: false}, yaxis: {visible: false, scaleanchor: "x"},shapes: [{type: "line", x0: 0, x1: 0, y0: 0.45, y1: 1.03, line: {dash: "dash"}}],annotations: [{x: 0, y: 1.03, text: `${Math.floor(n / 2) + 1} for a majority`, showarrow: false, yanchor: "bottom"}]});</script>
Share it
Every Plotly chart has a Share chart button (the cloud icon in its toolbar) that uploads it to Plotly Cloud and gives you a link. Only you can see it until you change its visibility.
For a live app, put the chart in a Dash app and publish it with the Plotly Cloud command-line interface (CLI). Coding agents can run these commands for you:
pip install "dash[cloud]"plotly user loginplotly app publish
If your data has to stay in your own cloud or data center, publish to Dash Enterprise instead.
Dos and don'ts
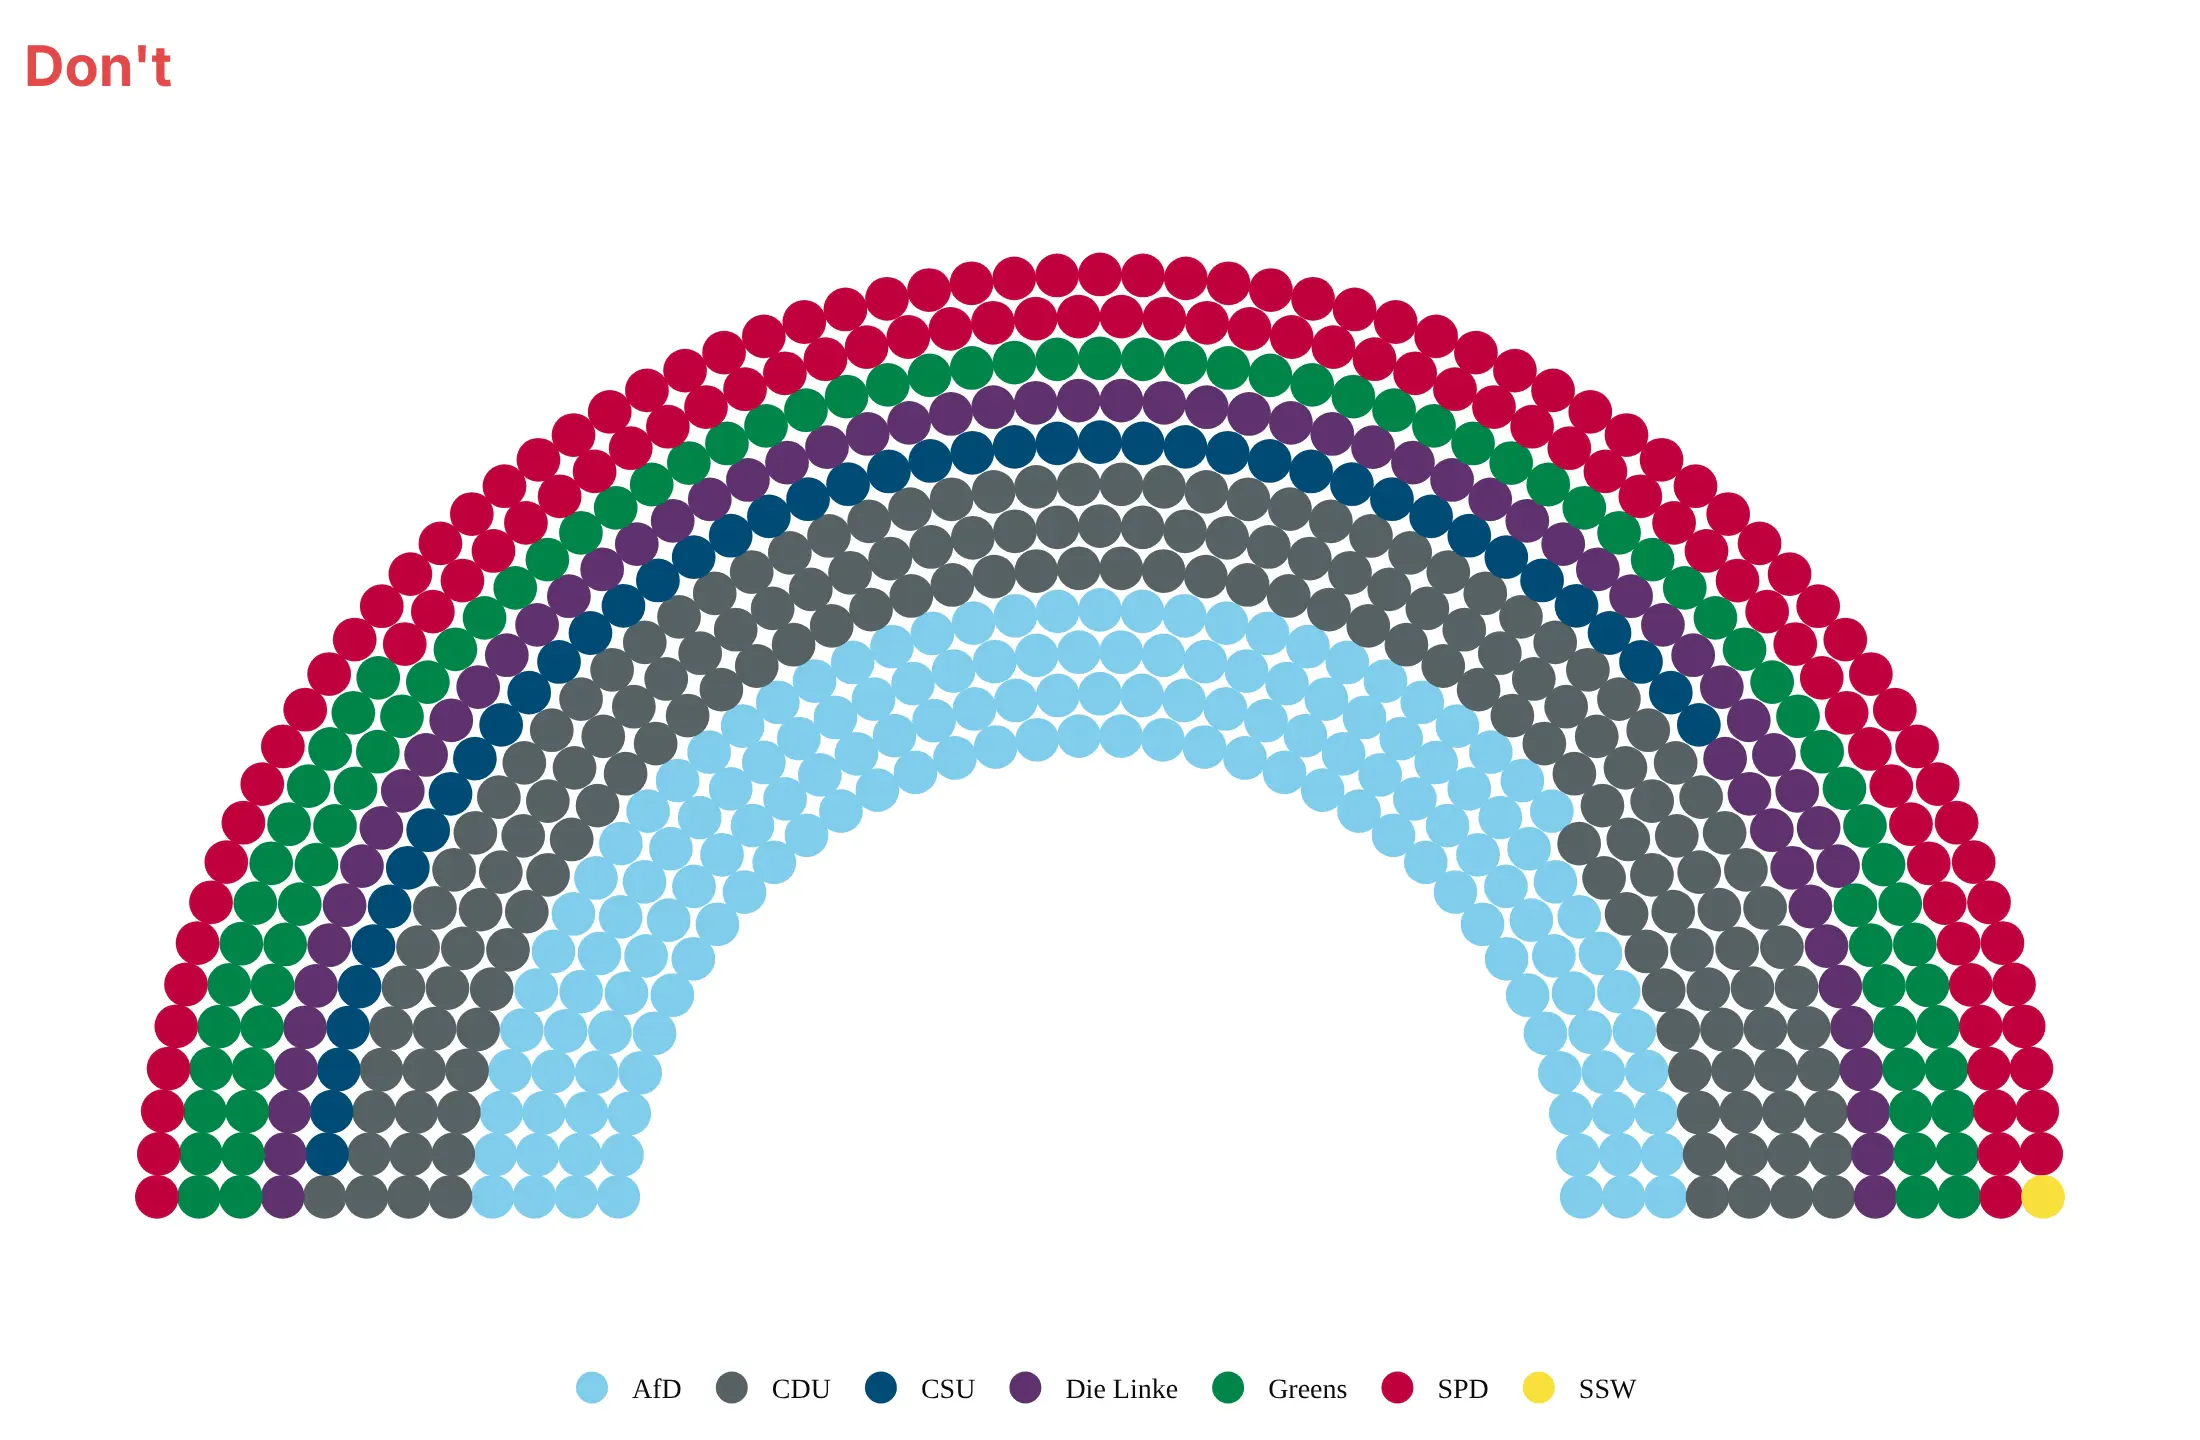
Most problems with parliament charts come from the order of the seats, not the colors. Here's the 2025 Bundestag both ways, in the same party colors.
Don't fill the seats row by row, which turns parties into rings so that whichever party lands in the outer rows looks bigger, sort the parties alphabetically, make the dots so big they overlap, leave out the majority line and the seat counts, or rely on a legend in a default serif font:
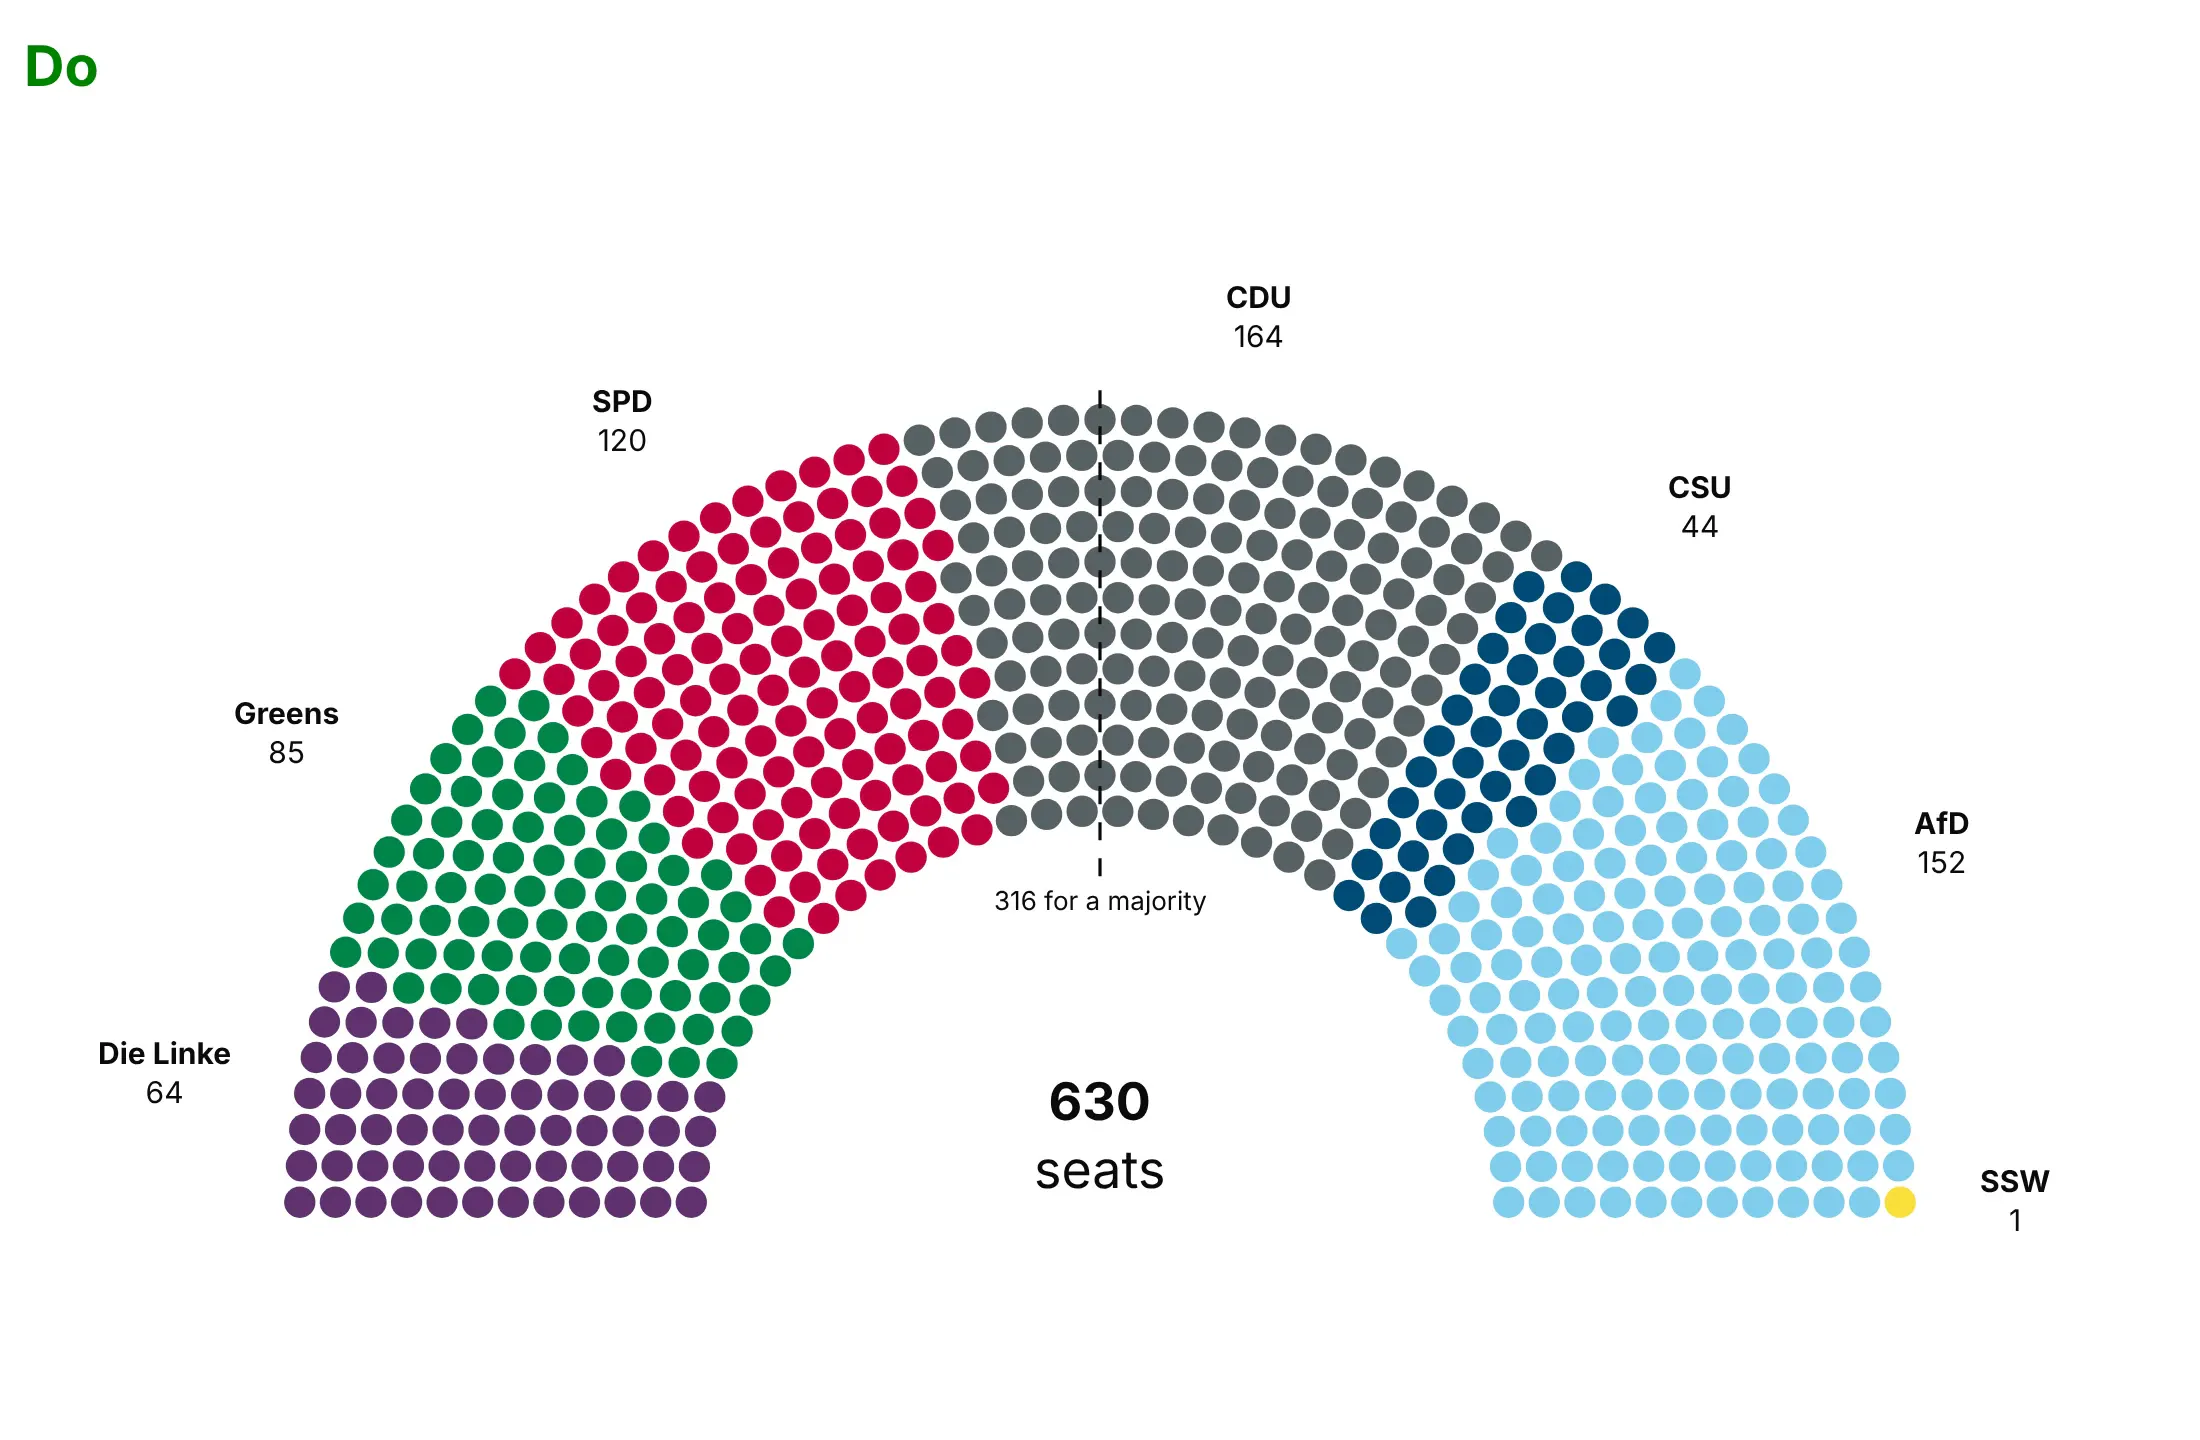
Do hand out seats by angle so every party is one wedge, order the parties on a scale you name in the subtitle, leave a small gap between dots, mark the majority with a dashed line and its seat count, and label each wedge with its seats:
Checklist
Do
- Say in the subtitle how the parties are ordered (a left-right score, the chamber's own seating, ballot order or size).
- Use the parliament's or the election authority's own party colors when they publish them, and label the wedges directly so readers don't depend on telling similar colors apart.
- Draw the majority, or the threshold that matters (two-thirds, a veto share), as a dashed line with its number.
- Put the total in the middle of the arch.
- Keep the dot size the same when you compare two chambers or two elections, so a smaller chamber looks smaller.
Don't
- Use a parliament chart for shares that don't add up to a fixed whole, or for thousands of units where no one would count dots; use a bar chart instead.
- Draw a majority line where there's no vote; for a fleet or a budget, a line at the half is only useful if the half means something.
- Comment on parties in the labels; the seats are the data.
Options to customize
A parliament chart in Plotly is a scatter trace of computed positions, so these are the options that matter most. The full lists are in the scatter trace reference and the layout reference.
- inner (in the helper): the radius of the inner row, 0.5 by default as in parliamentarch; a smaller value fits more rows and leaves less room for the total in the middle.
- rows (in the helper): more rows than the minimum give smaller dots and a deeper arch.
- Seat order: the order of parties sets the wedges from left to right; reverse it to start from the right.
- marker.size: about 80% of the row thickness in pixels leaves a visible gap; 100% makes neighbors touch.
- marker.symbol and marker.line: squares instead of circles, or an outline to mark a subset (re-elected members, women, a coalition).
- yaxis.scaleanchor="x": equal scales, so the half circle stays round at any figure size.
- hovertemplate with customdata: each seat's member, unit or country on hover, as in the nuclear fleet example.
- add_shape(type="line"): the majority or threshold line, drawn as a radius through the gap between two seats.
- add_annotation: party labels outside the arch at the middle angle of each wedge, and the total in the middle.
- go.Scattergl: WebGL markers for tens of thousands of dots, such as one dot per unit in a large inventory.
- go.Pie(hole=0.5, rotation=270) with a transparent slice equal to the total: the half donut alternative, or an inner ring of vote shares as in the UK example.
More parliament chart examples
Six more parliament charts built from real public data, each with its source, the technique that makes it work and a prompt to rebuild it.
1. The UK House of Commons: seats against votes
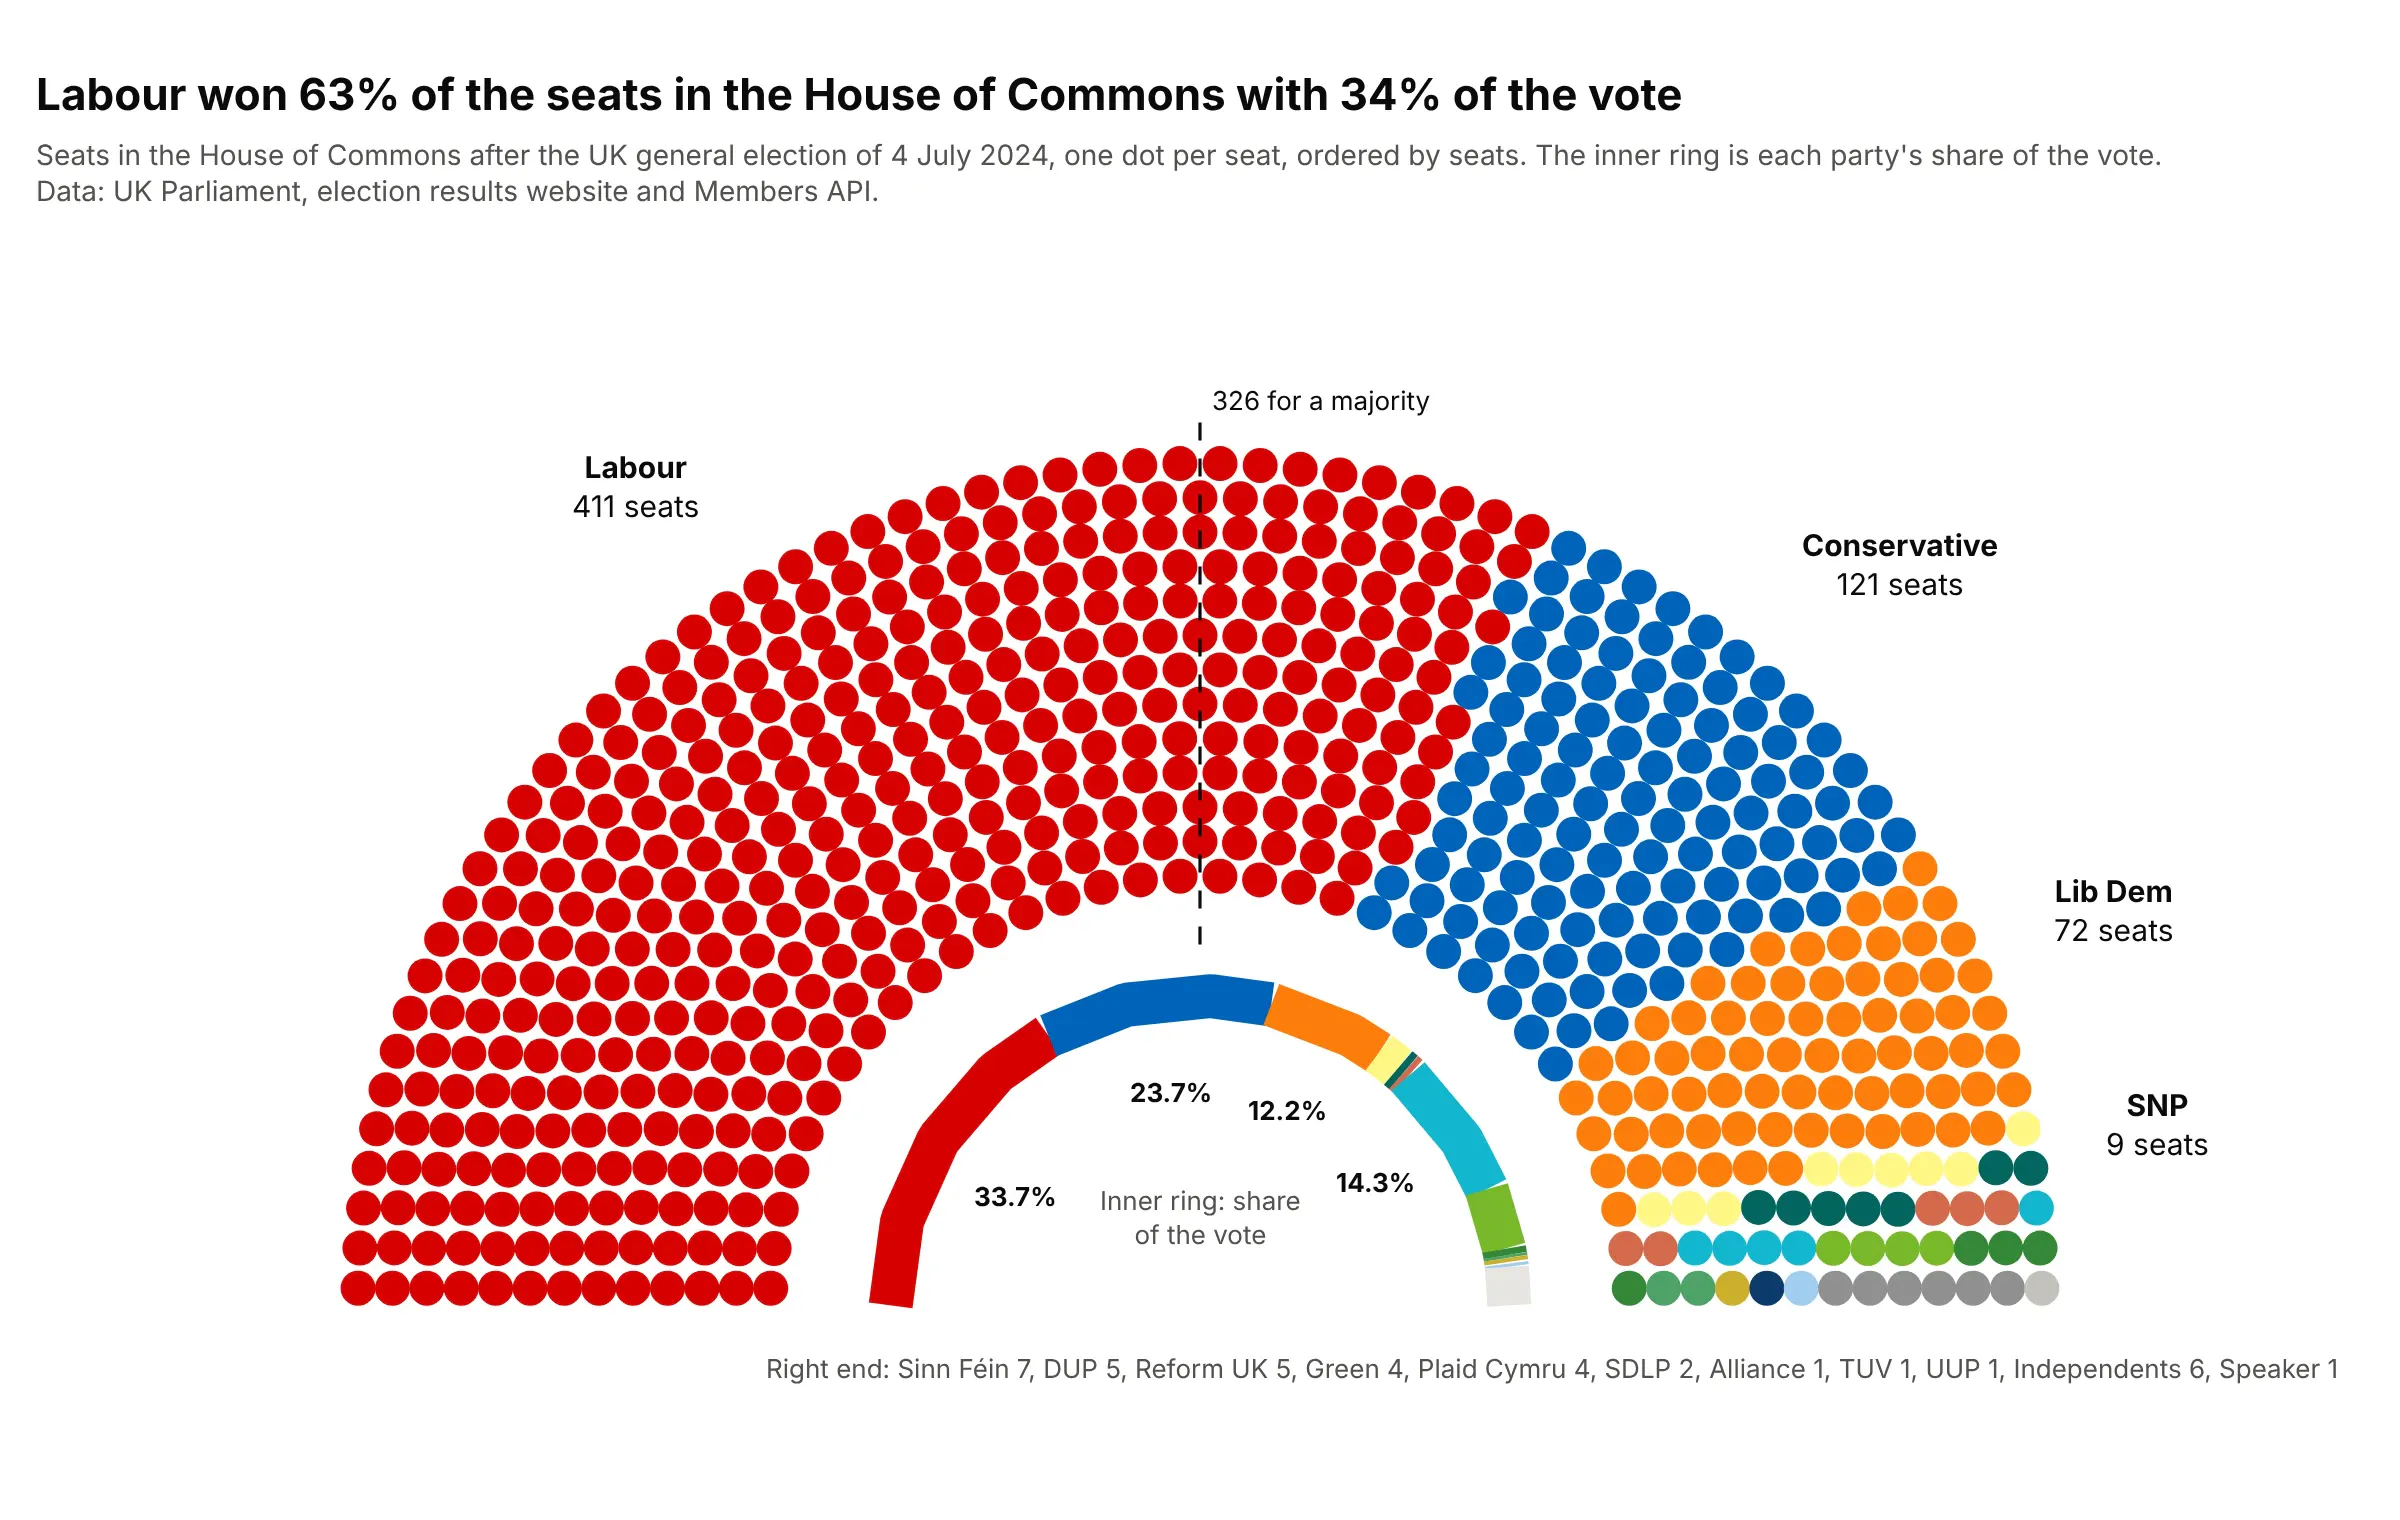
Labour won 411 of 650 seats (63%) with 33.7% of the vote, while Reform UK's 14.3% of the vote gave it 5 seats. The inner half ring, in the same colors and order, puts the vote shares right under the seats. Data: UK Parliament, election results website and Members API.
Tip: draw the vote shares as a thick line trace along a half circle inside the arch, so seats and votes share one picture.
Get the data from the UK Parliament election results website (2024 general election, political parties CSV:party, votes, vote share, constituencies won) and the Members API state of the parties on 2024-07-05(seats per party including independents and the Speaker, and party colors) (columns: party, seats, vote_share, color).Build a plotly parliament chart ordered by seats with independents and the Speaker last, a dashed line at 326,labels on the four largest parties, and an inner half ring of vote shares in the same order and colors.
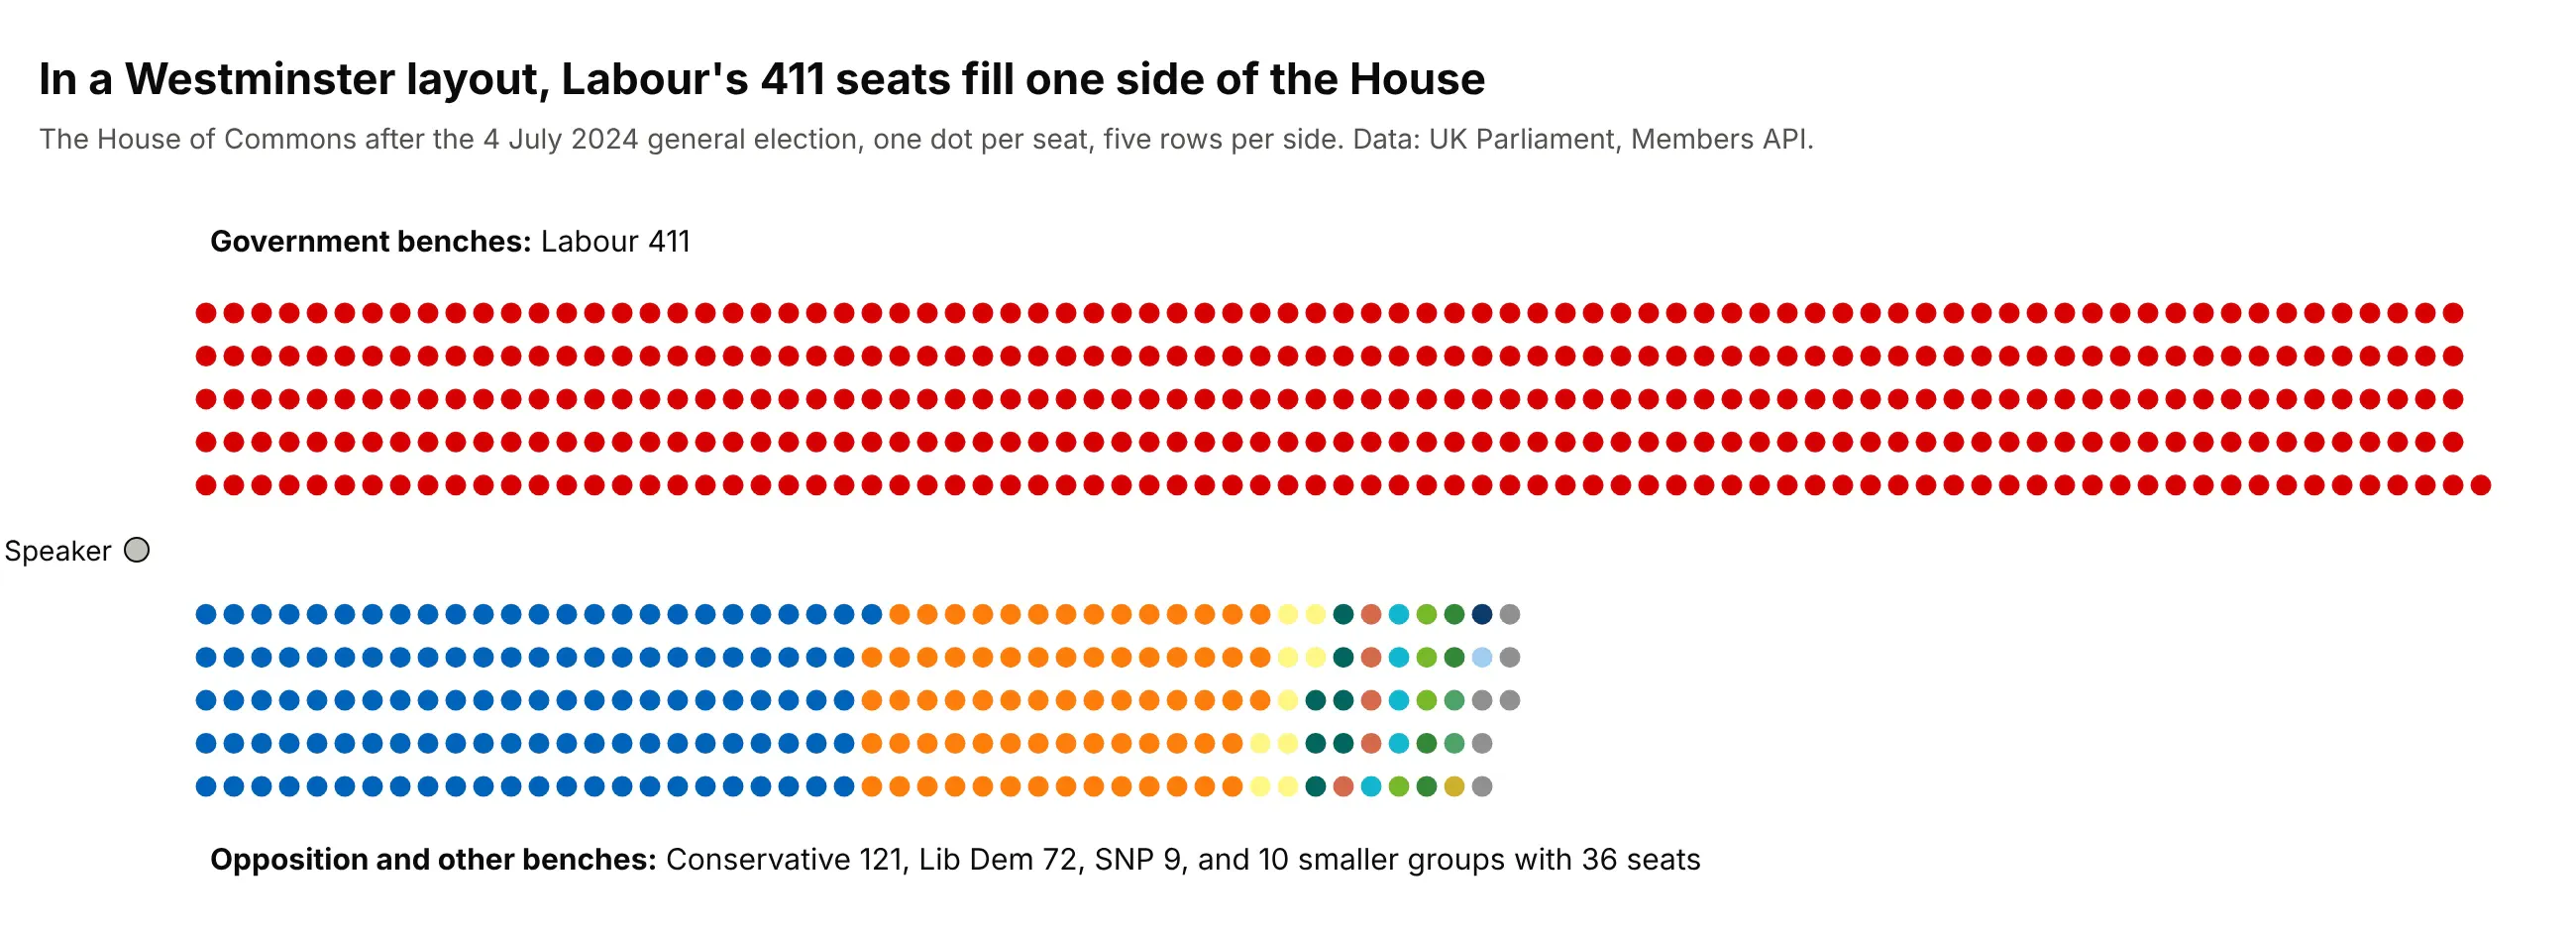
Another way to see it: the Commons doesn't sit in a hemicycle, so a Westminster layout, the government side facing the opposition with the Speaker at the end, is closer to the real room:
2. The Bundestag before and after it shrank
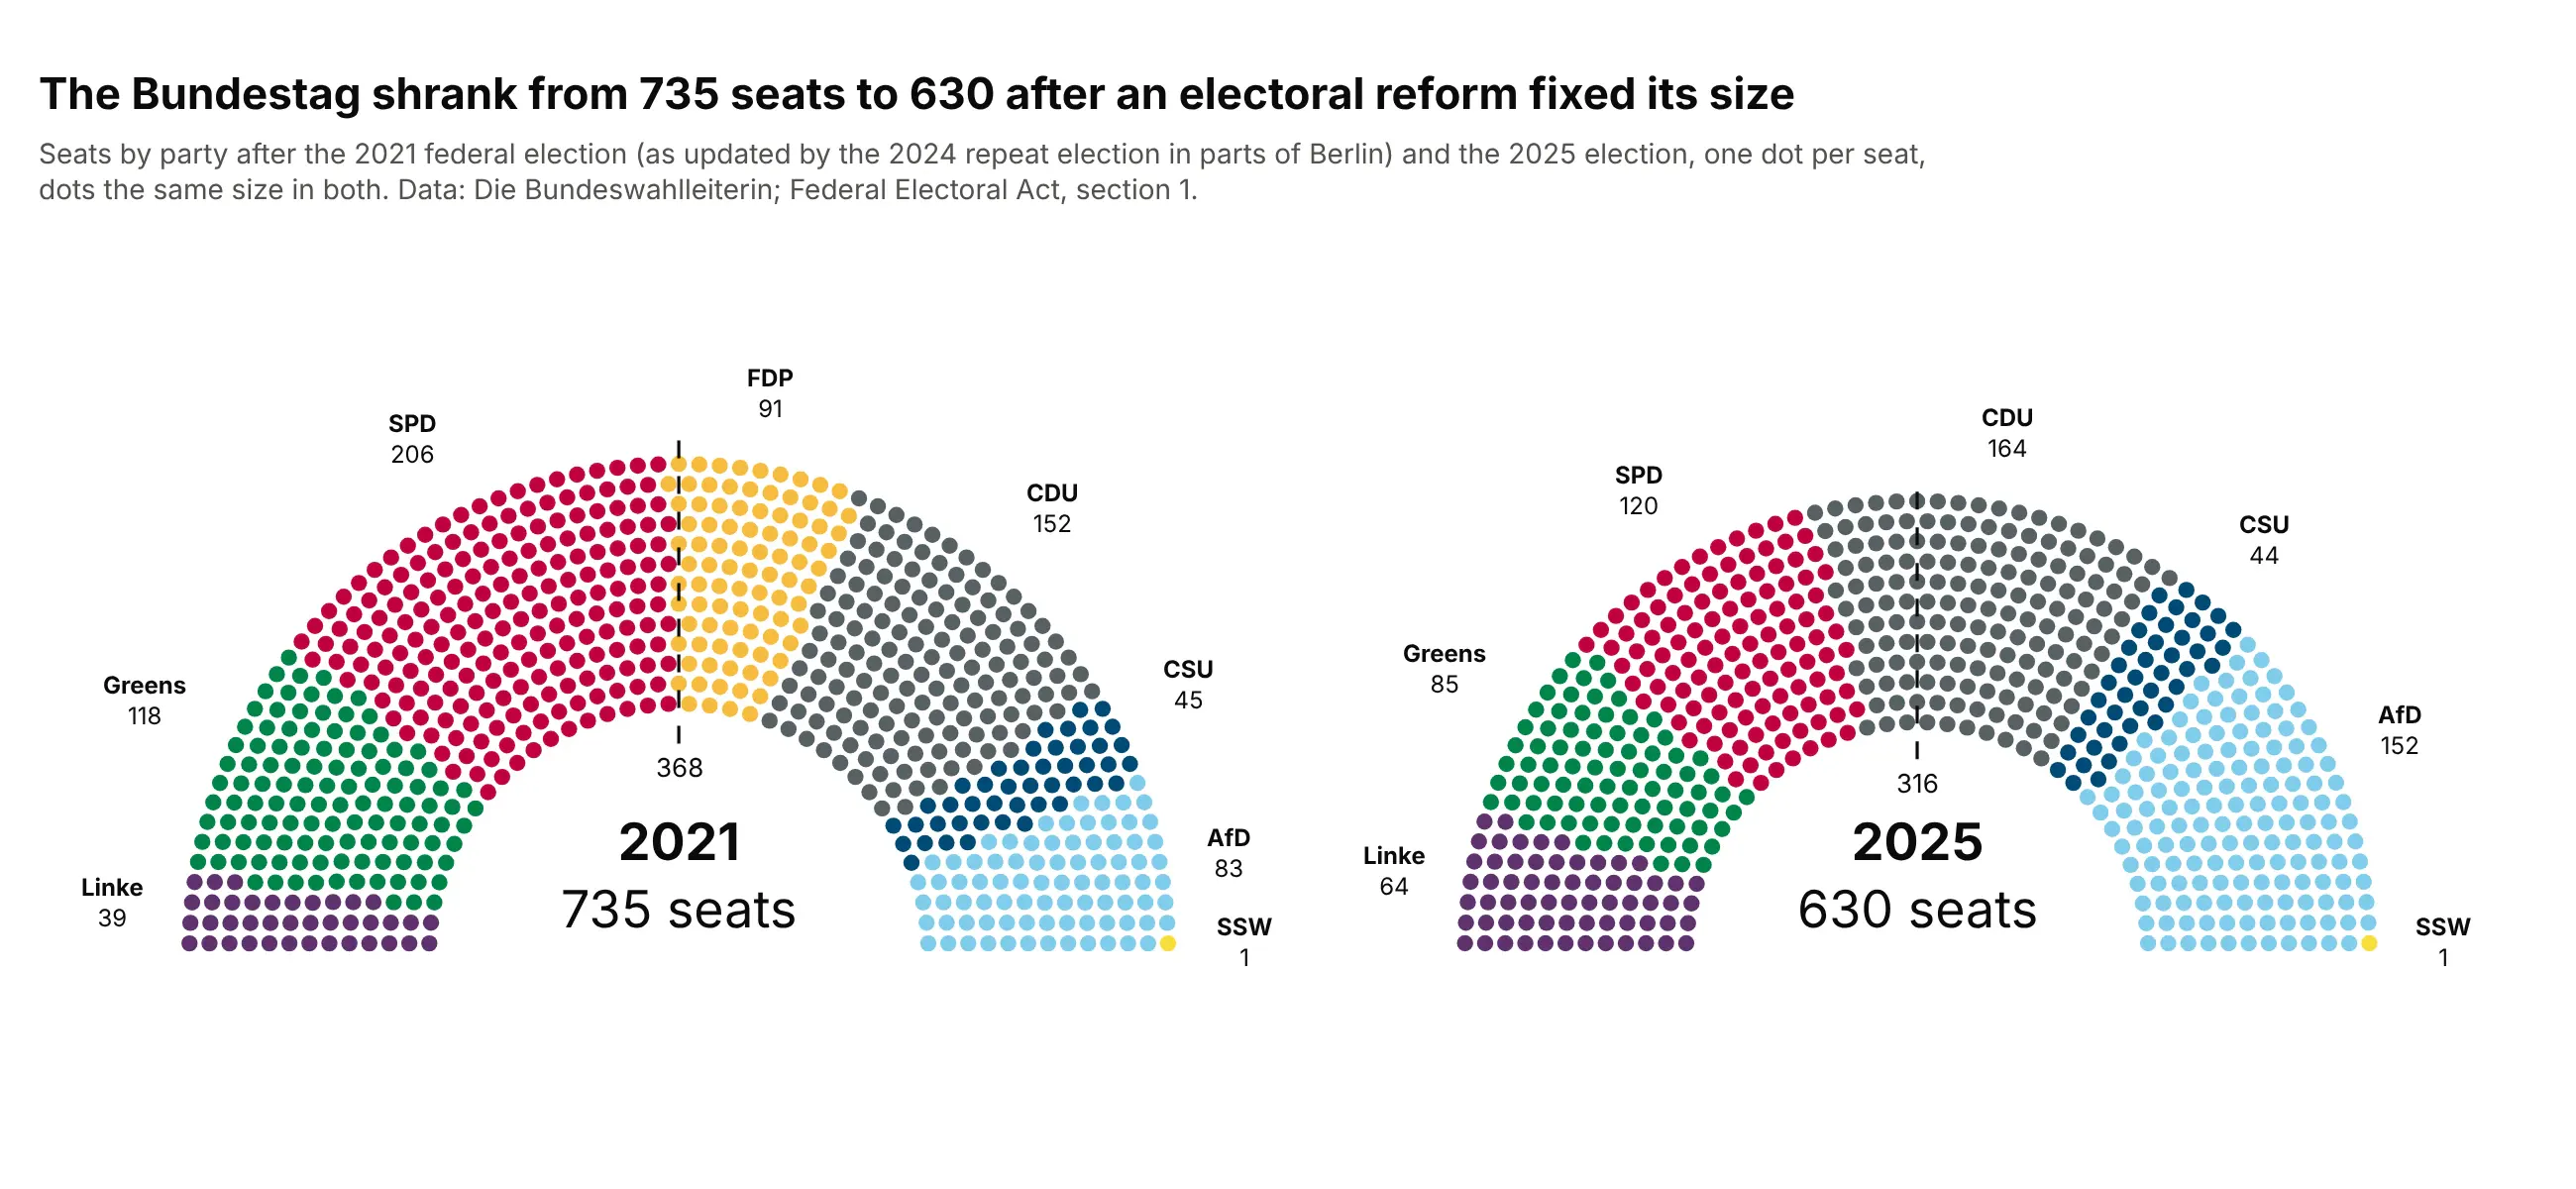
The Bundestag had 735 seats after the 2021 election and 630 after 2025, the size the Federal Electoral Act now fixes. With the arch radius scaled to the square root of the seat count, every dot is the same size and the newer chamber looks 105 seats smaller. Data: Die Bundeswahlleiterin, results for 2021 (after the 2024 Berlin repeat election) and 2025; Federal Electoral Act, section 1.
Tip: scale each arch by the square root of its seats and fix the marker size, so the two charts compare chamber sizes honestly.
Get the data from Die Bundeswahlleiterin (Federal Returning Officer), seat distribution for the 2021 Bundestag(after the 2024 repeat election in parts of Berlin) and the 2025 Bundestag (columns: party, seats_2021, seats_2025, color).Build two plotly parliament charts side by side in one figure, parties in the same order in both, the secondarch scaled by sqrt(630 / 735) with the same marker size, and a majority line and the year in each.
3. The US nuclear fleet on one day
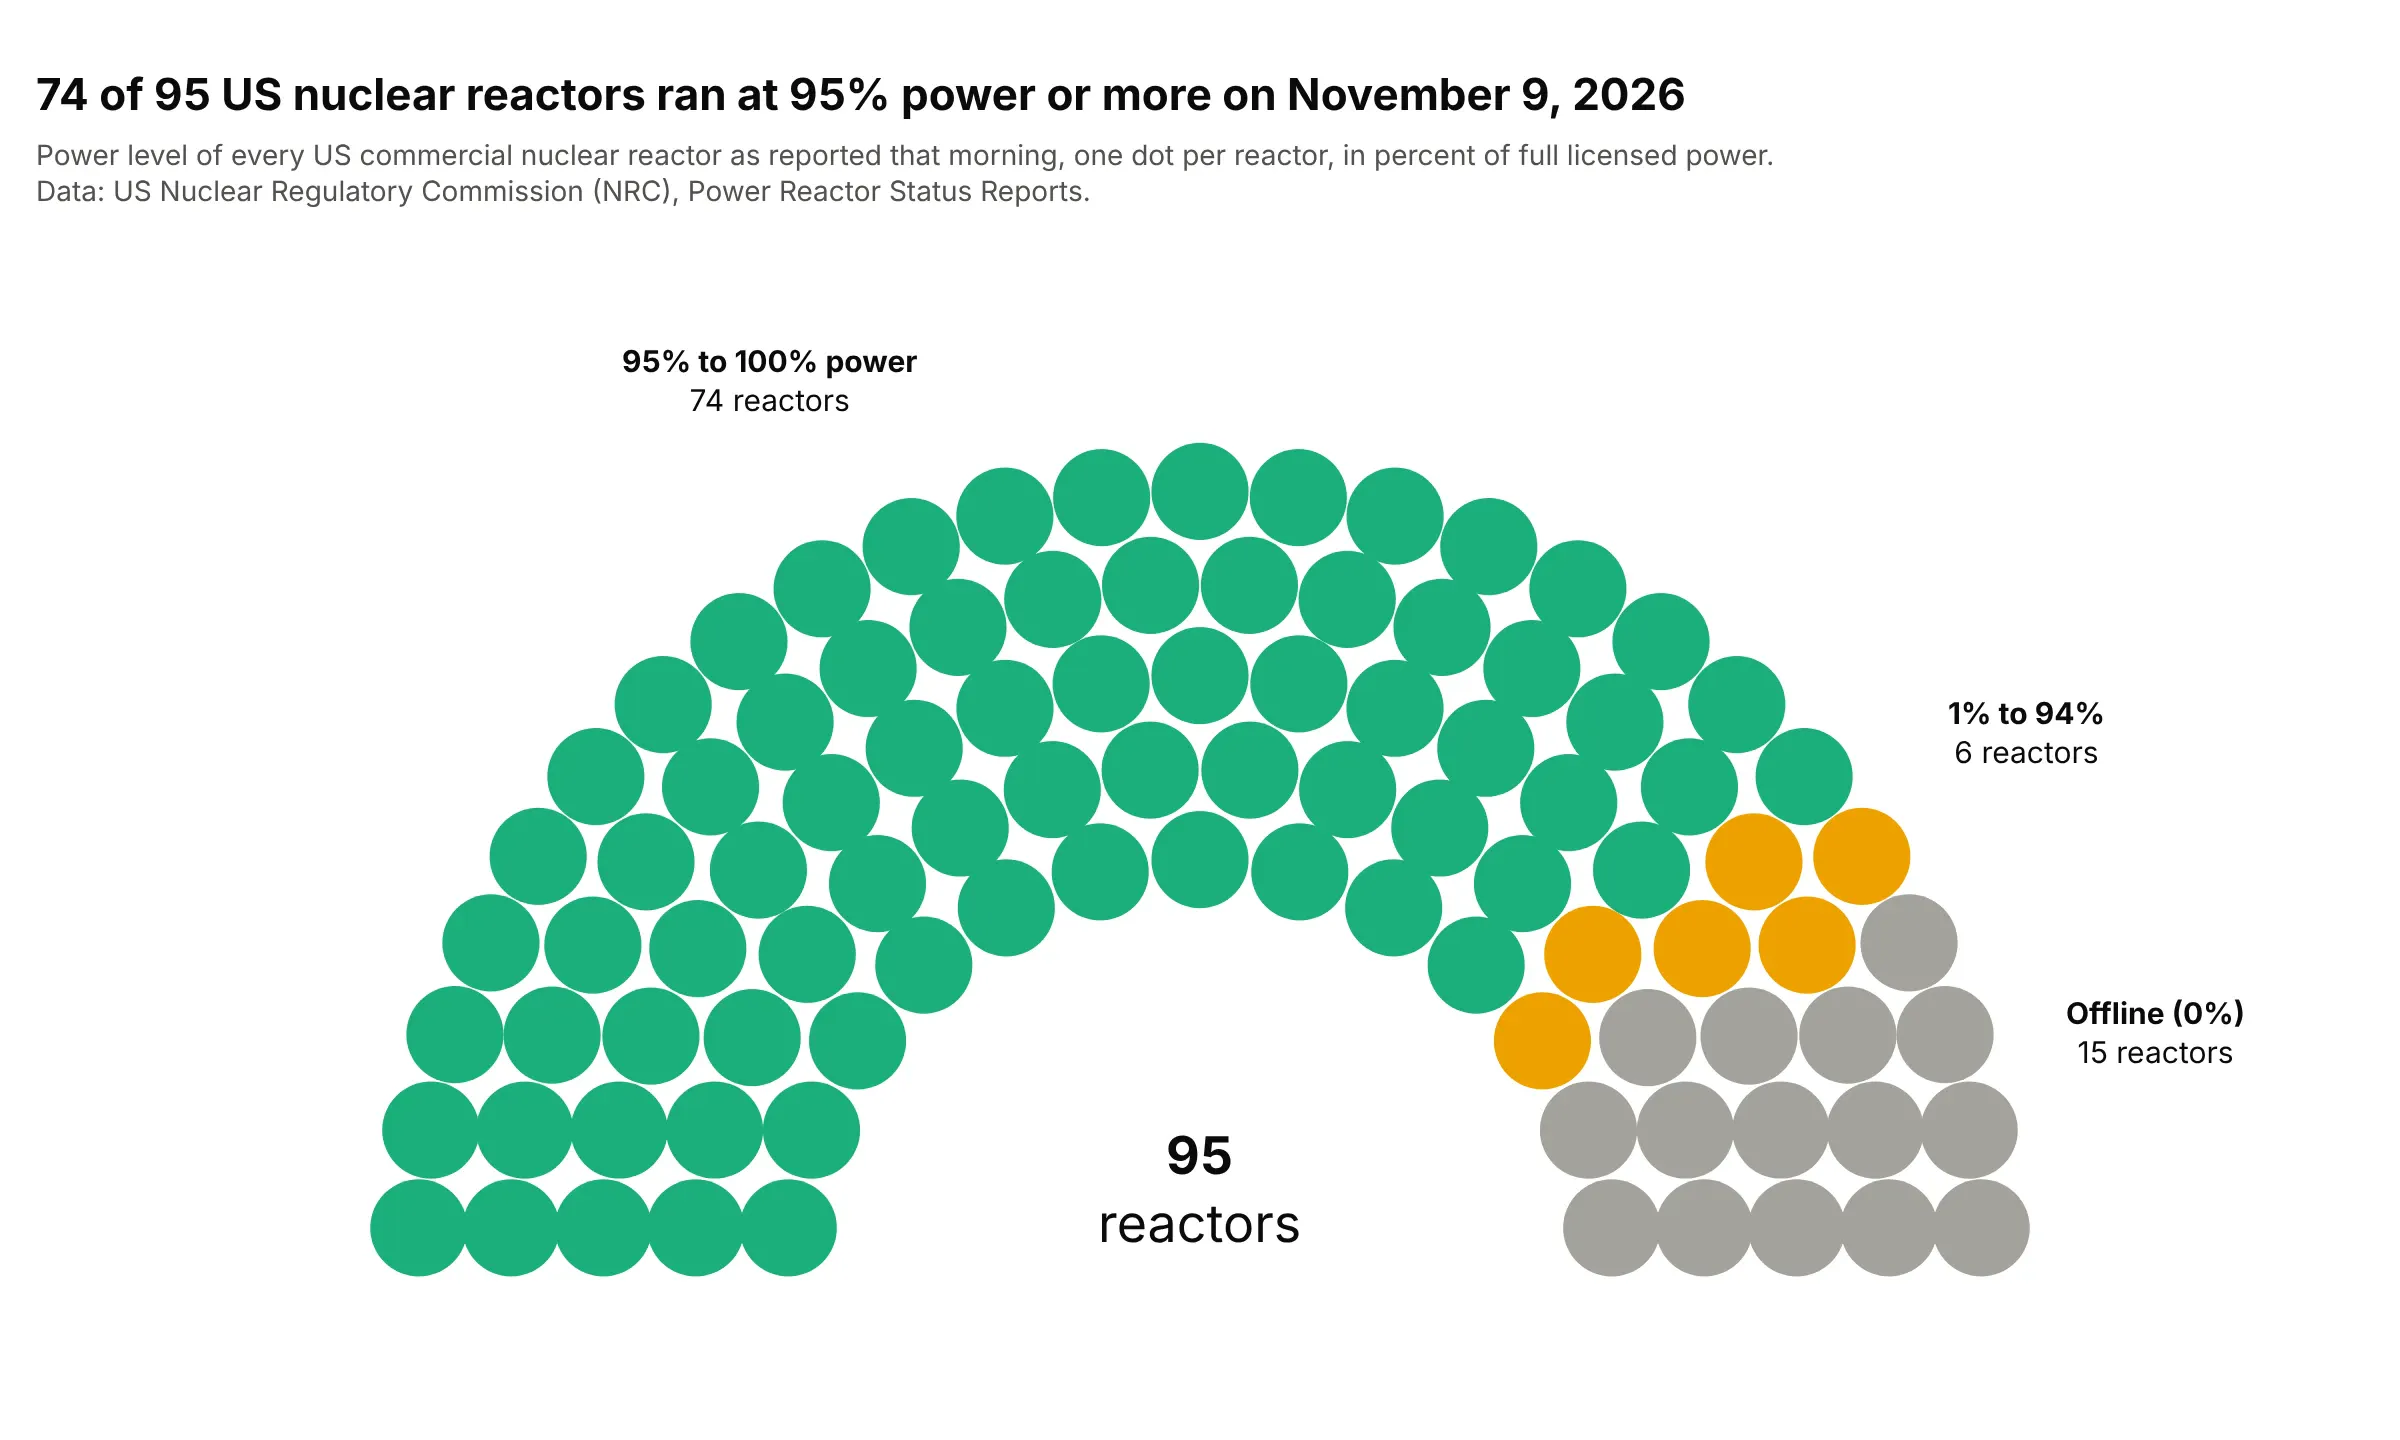
On November 9, 2026, 74 of the 95 US commercial reactors reported 95% power or more and 15 reported zero, for an average of 81.5%. Each "seat" is a reactor, so the chart reads like a status board, and there's no majority line because there's no vote. Data: US Nuclear Regulatory Commission (NRC), Power Reactor Status Reports.
Tip: sort the units by their value before handing out seats, so the bands form clean wedges, and put each unit's name in the hover.
Get the data from the US Nuclear Regulatory Commission Power Reactor Status Reports, 2026 file(pipe-separated: report date, unit, power in percent of full licensed power), for 2026-11-09 (columns: unit, power).Build a plotly parliament chart with one dot per reactor, sorted by power, colored in three bands(95% to 100%, 1% to 94%, 0%), the unit name and power on hover, and no majority line.
4. How exoplanets are found
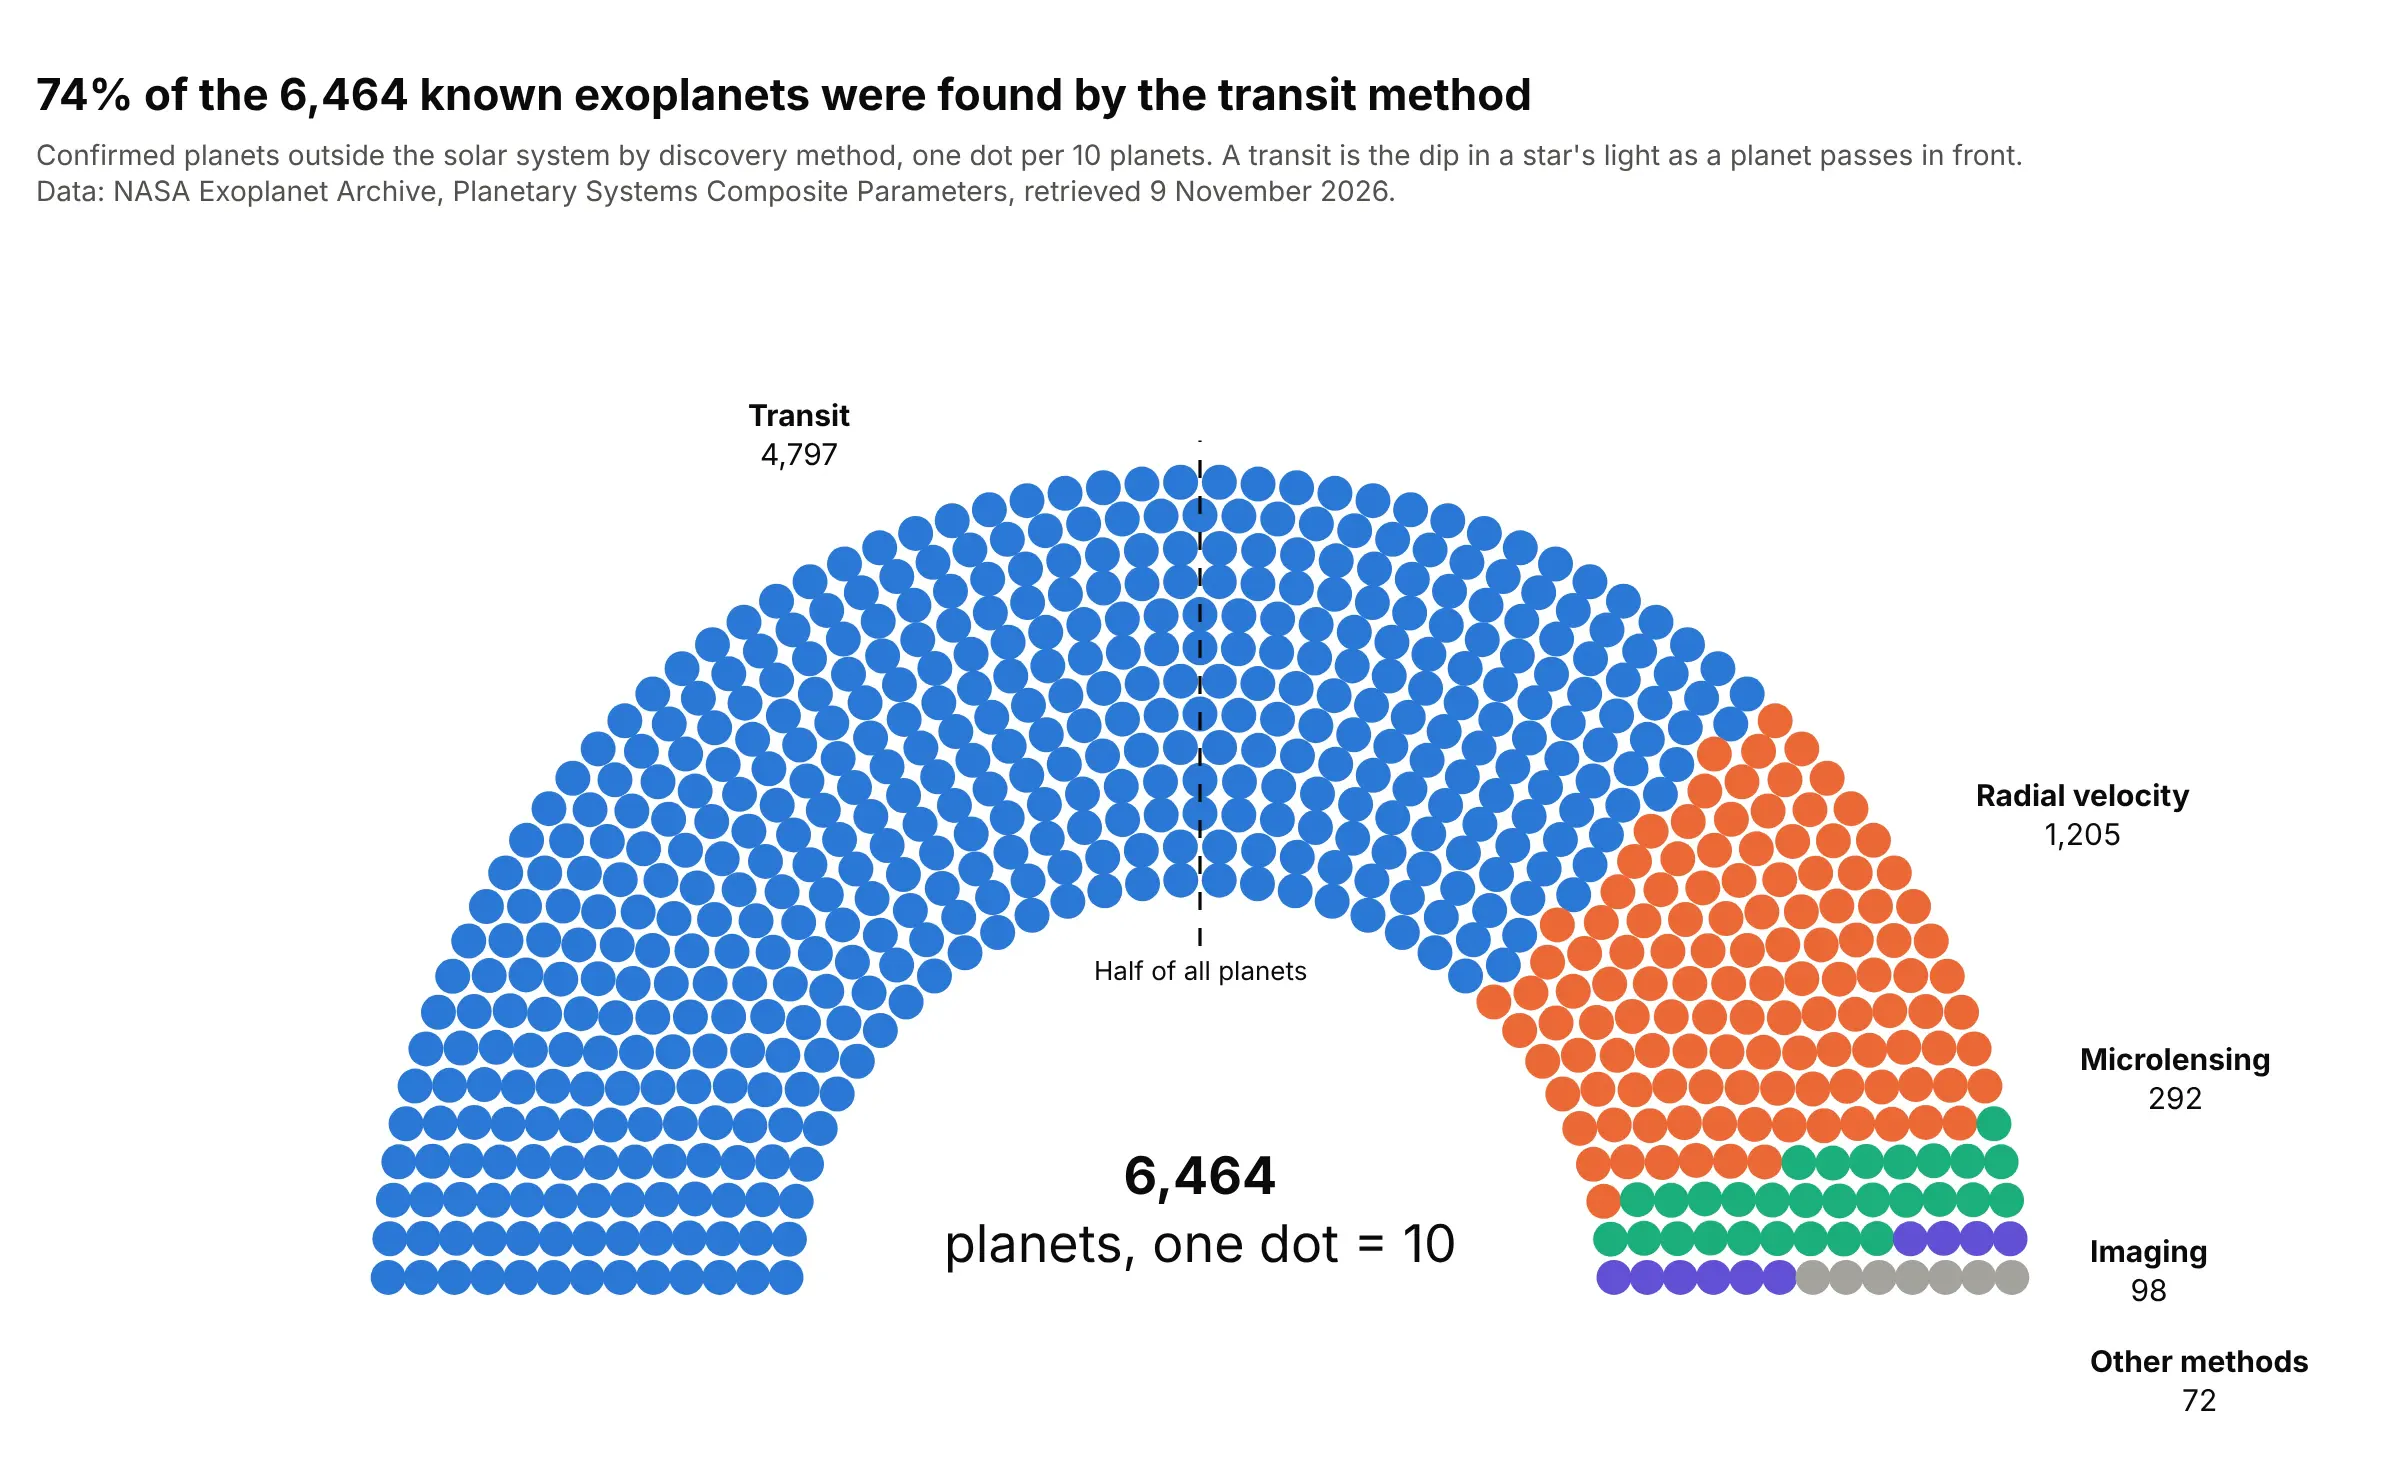
Of 6,464 confirmed planets outside the solar system, 4,797 (74%) were found by the transit method, the dip in a star's light as a planet passes in front of it. One dot per 10 planets keeps 646 dots, and the line at the half shows that one method alone holds a majority. Data: NASA Exoplanet Archive, Planetary Systems Composite Parameters table.
Tip: group the methods with fewer than 30 planets into one "Other methods" wedge and list them in its hover.
Get the data from the NASA Exoplanet Archive TAP service: count of confirmed planets in the pscomppars tablegrouped by discoverymethod (columns: method, planets).Build a plotly parliament chart with one dot per 10 planets rounded with the largest remainder method,methods under 30 planets grouped as "Other methods", and a dashed line at half the dots.
5. A vote, not a chamber: the WHO Pandemic Agreement
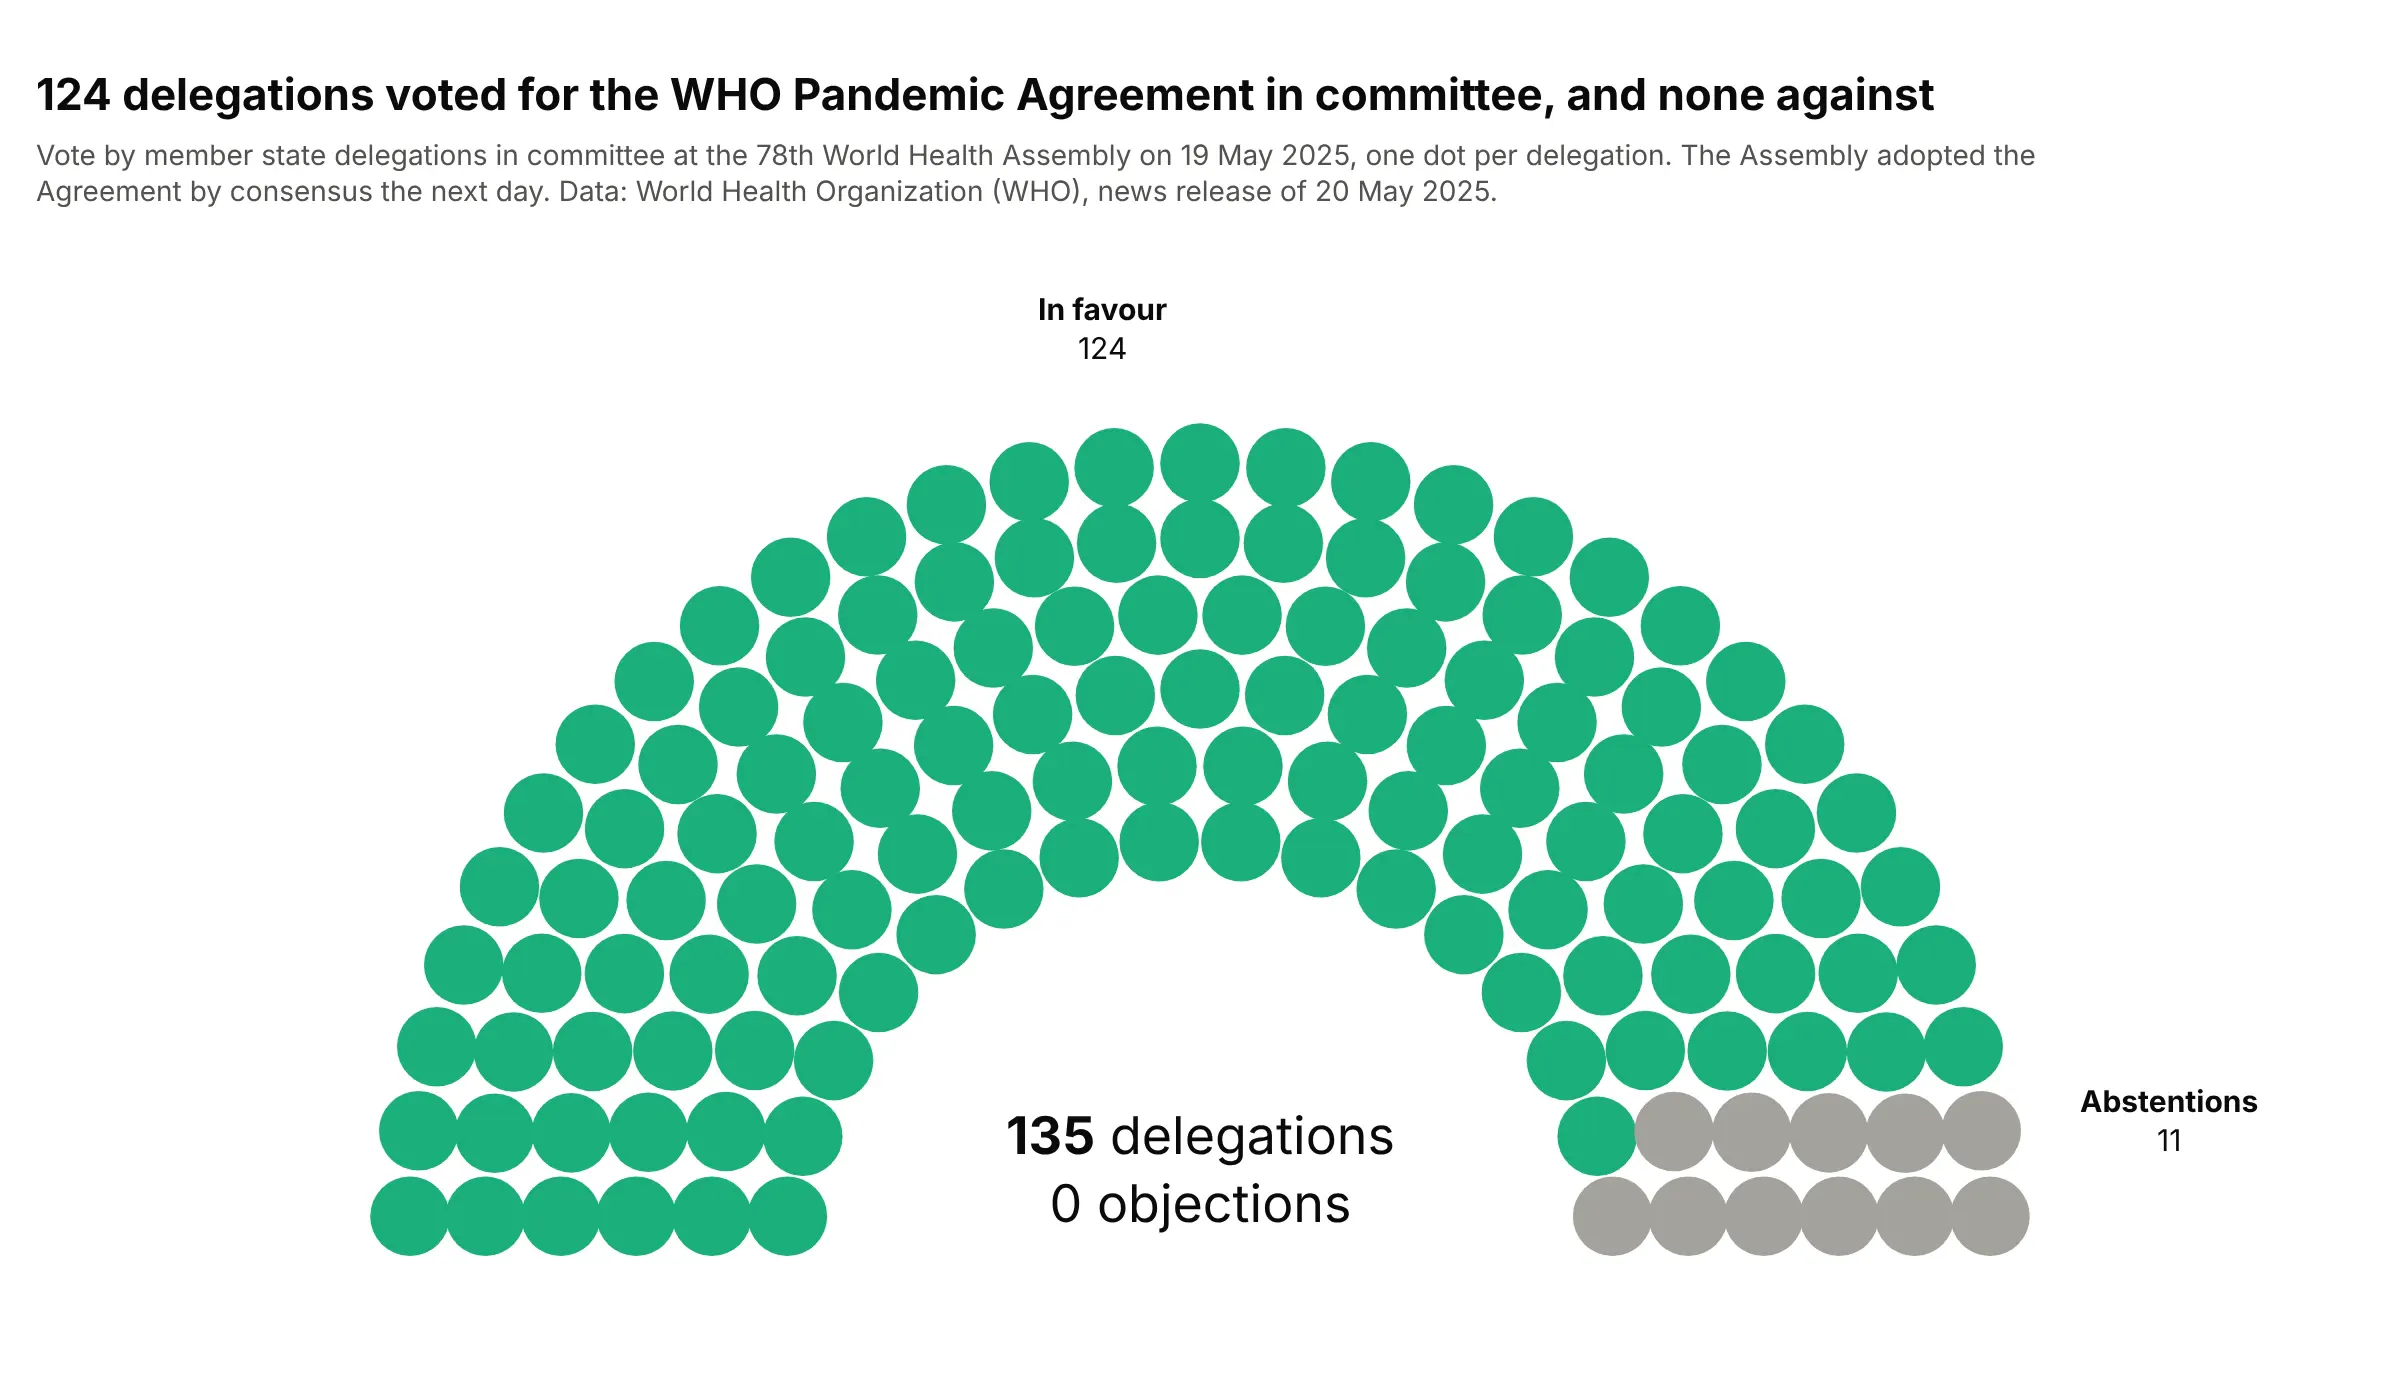
In committee at the World Health Assembly on 19 May 2025, 124 delegations voted for the WHO Pandemic Agreement, none objected and 11 abstained, and the Assembly adopted it by consensus the next day. One dot per vote shows how one-sided the result was. Data: World Health Organization (WHO), news release of 20 May 2025.
Tip: when a group is zero, say so in the middle of the arch rather than leaving it out silently.
Get the data from the WHO news release of 20 May 2025 on the Pandemic Agreement (the committee vote:in favour, objections, abstentions) (columns: vote, delegations).Build a plotly parliament chart with one dot per delegation, in favour in green and abstentions in gray,and the total and the number of objections written in the middle.
6. Women in the House of Commons
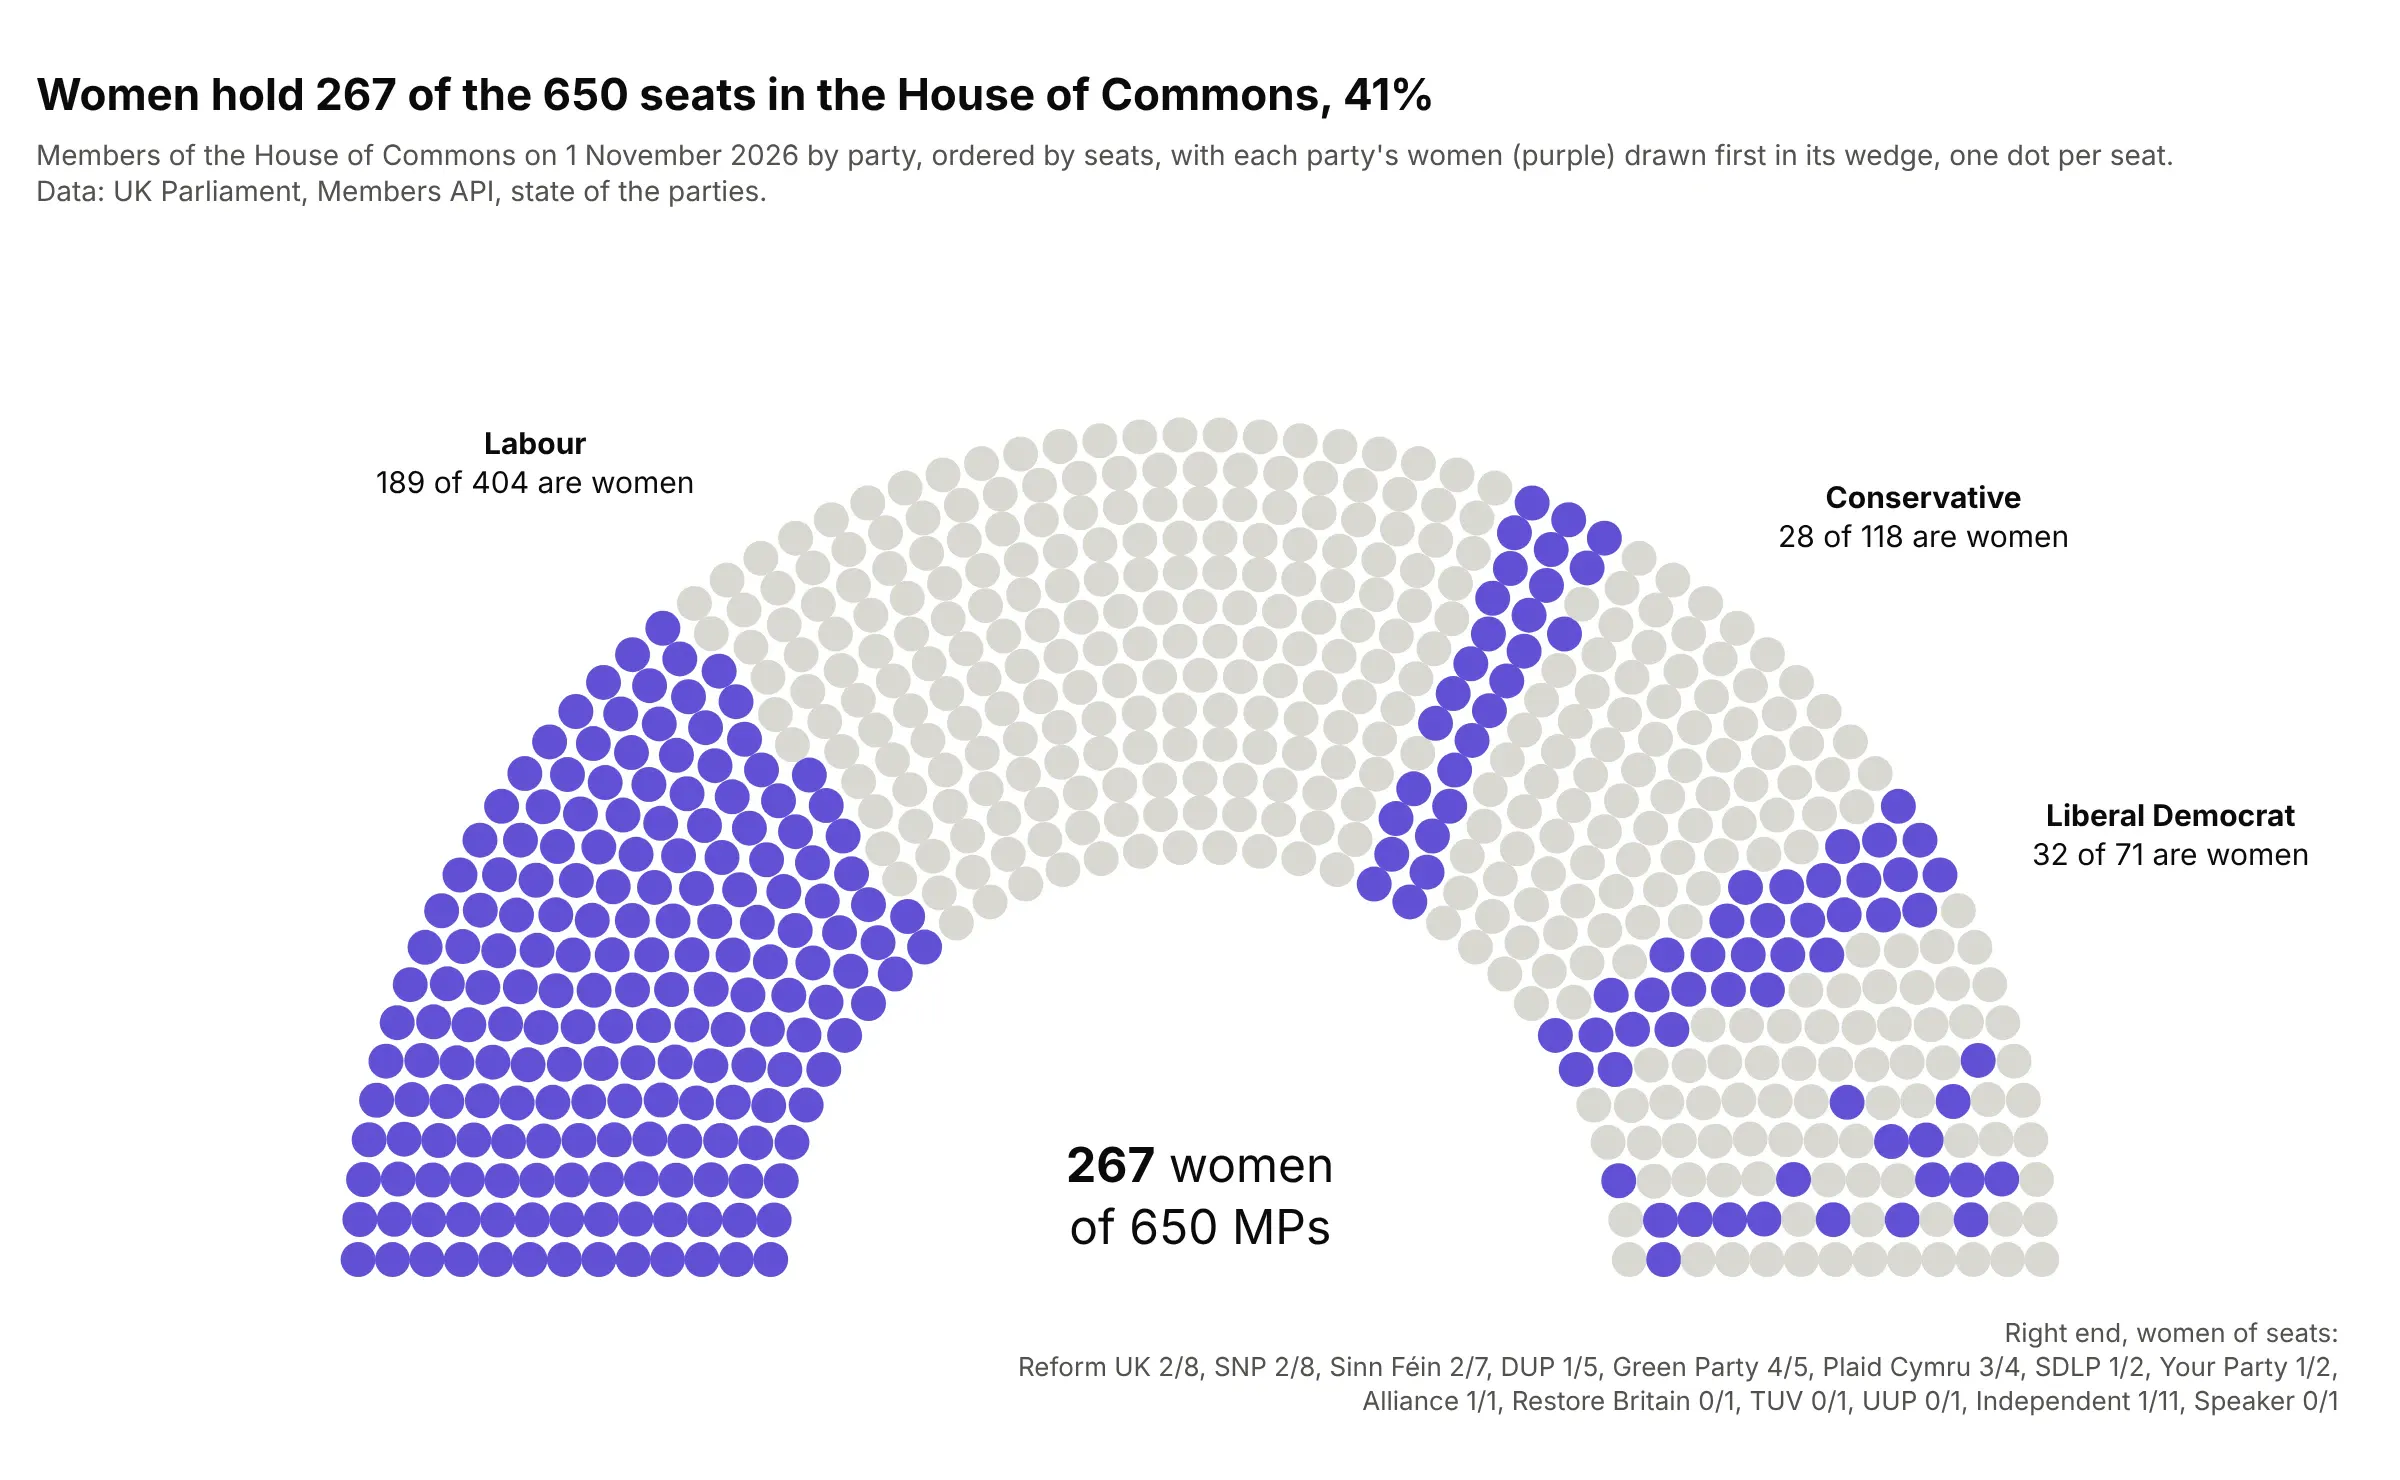
On November 1, 2026, 267 of the 650 MPs (41%) were women, including 189 of Labour's 404, 28 of the Conservatives' 118 and 32 of the Liberal Democrats' 71. Each party keeps its wedge, and the women are drawn first inside it. Data: UK Parliament, Members API, state of the parties.
Tip: split each wedge by a second variable and color by that variable only, so the party order still holds the chart together.
Get the data from the UK Parliament Members API, state of the parties in the House of Commons on 2026-11-01(seats per party with male, female and non-binary counts) (columns: party, seats, women, men).Build a plotly parliament chart ordered by seats, each party's women first in its wedge in purple and men inlight gray, labels with "women of seats" for the three largest parties, and the total number of women in the middle.