
Chris Parmer
November 12, 2026
ROC Curves - A Complete Guide
TL;DR
- A receiver operating characteristic (ROC) curve shows how well a test or a model separates two groups, such as patients with and without a disease, at every possible cutoff. Each point is one cutoff, drawn at its false positive rate (1 − specificity) on the x axis and its true positive rate (sensitivity) on the y axis.
- ROC curves are also known as receiver operating characteristic curves, relative operating characteristic curves and sensitivity vs (1 − specificity) plots. They are similar to precision-recall curves, detection error tradeoff (DET) curves and empirical cumulative distribution function (ECDF) plots of the two groups.
- The diagonal is chance, and the area under the curve (AUC) sums the curve up in one number: 0.5 is a coin flip, 1.0 is perfect, and it equals the chance that a random positive case scores higher than a random negative one.
- They started with radar receivers in World War II, moved into psychology and radiology, and are now the standard chart for diagnostic tests and for comparing machine learning classifiers. With rare positives, pair them with a precision-recall curve.
- You can make an ROC curve with Plotly in Python from scikit-learn's roc_curve, which returns the false and true positive rates at every cutoff, and a go.Scatter trace with a dashed diagonal.
What is an ROC curve?
ROC curves look like this:
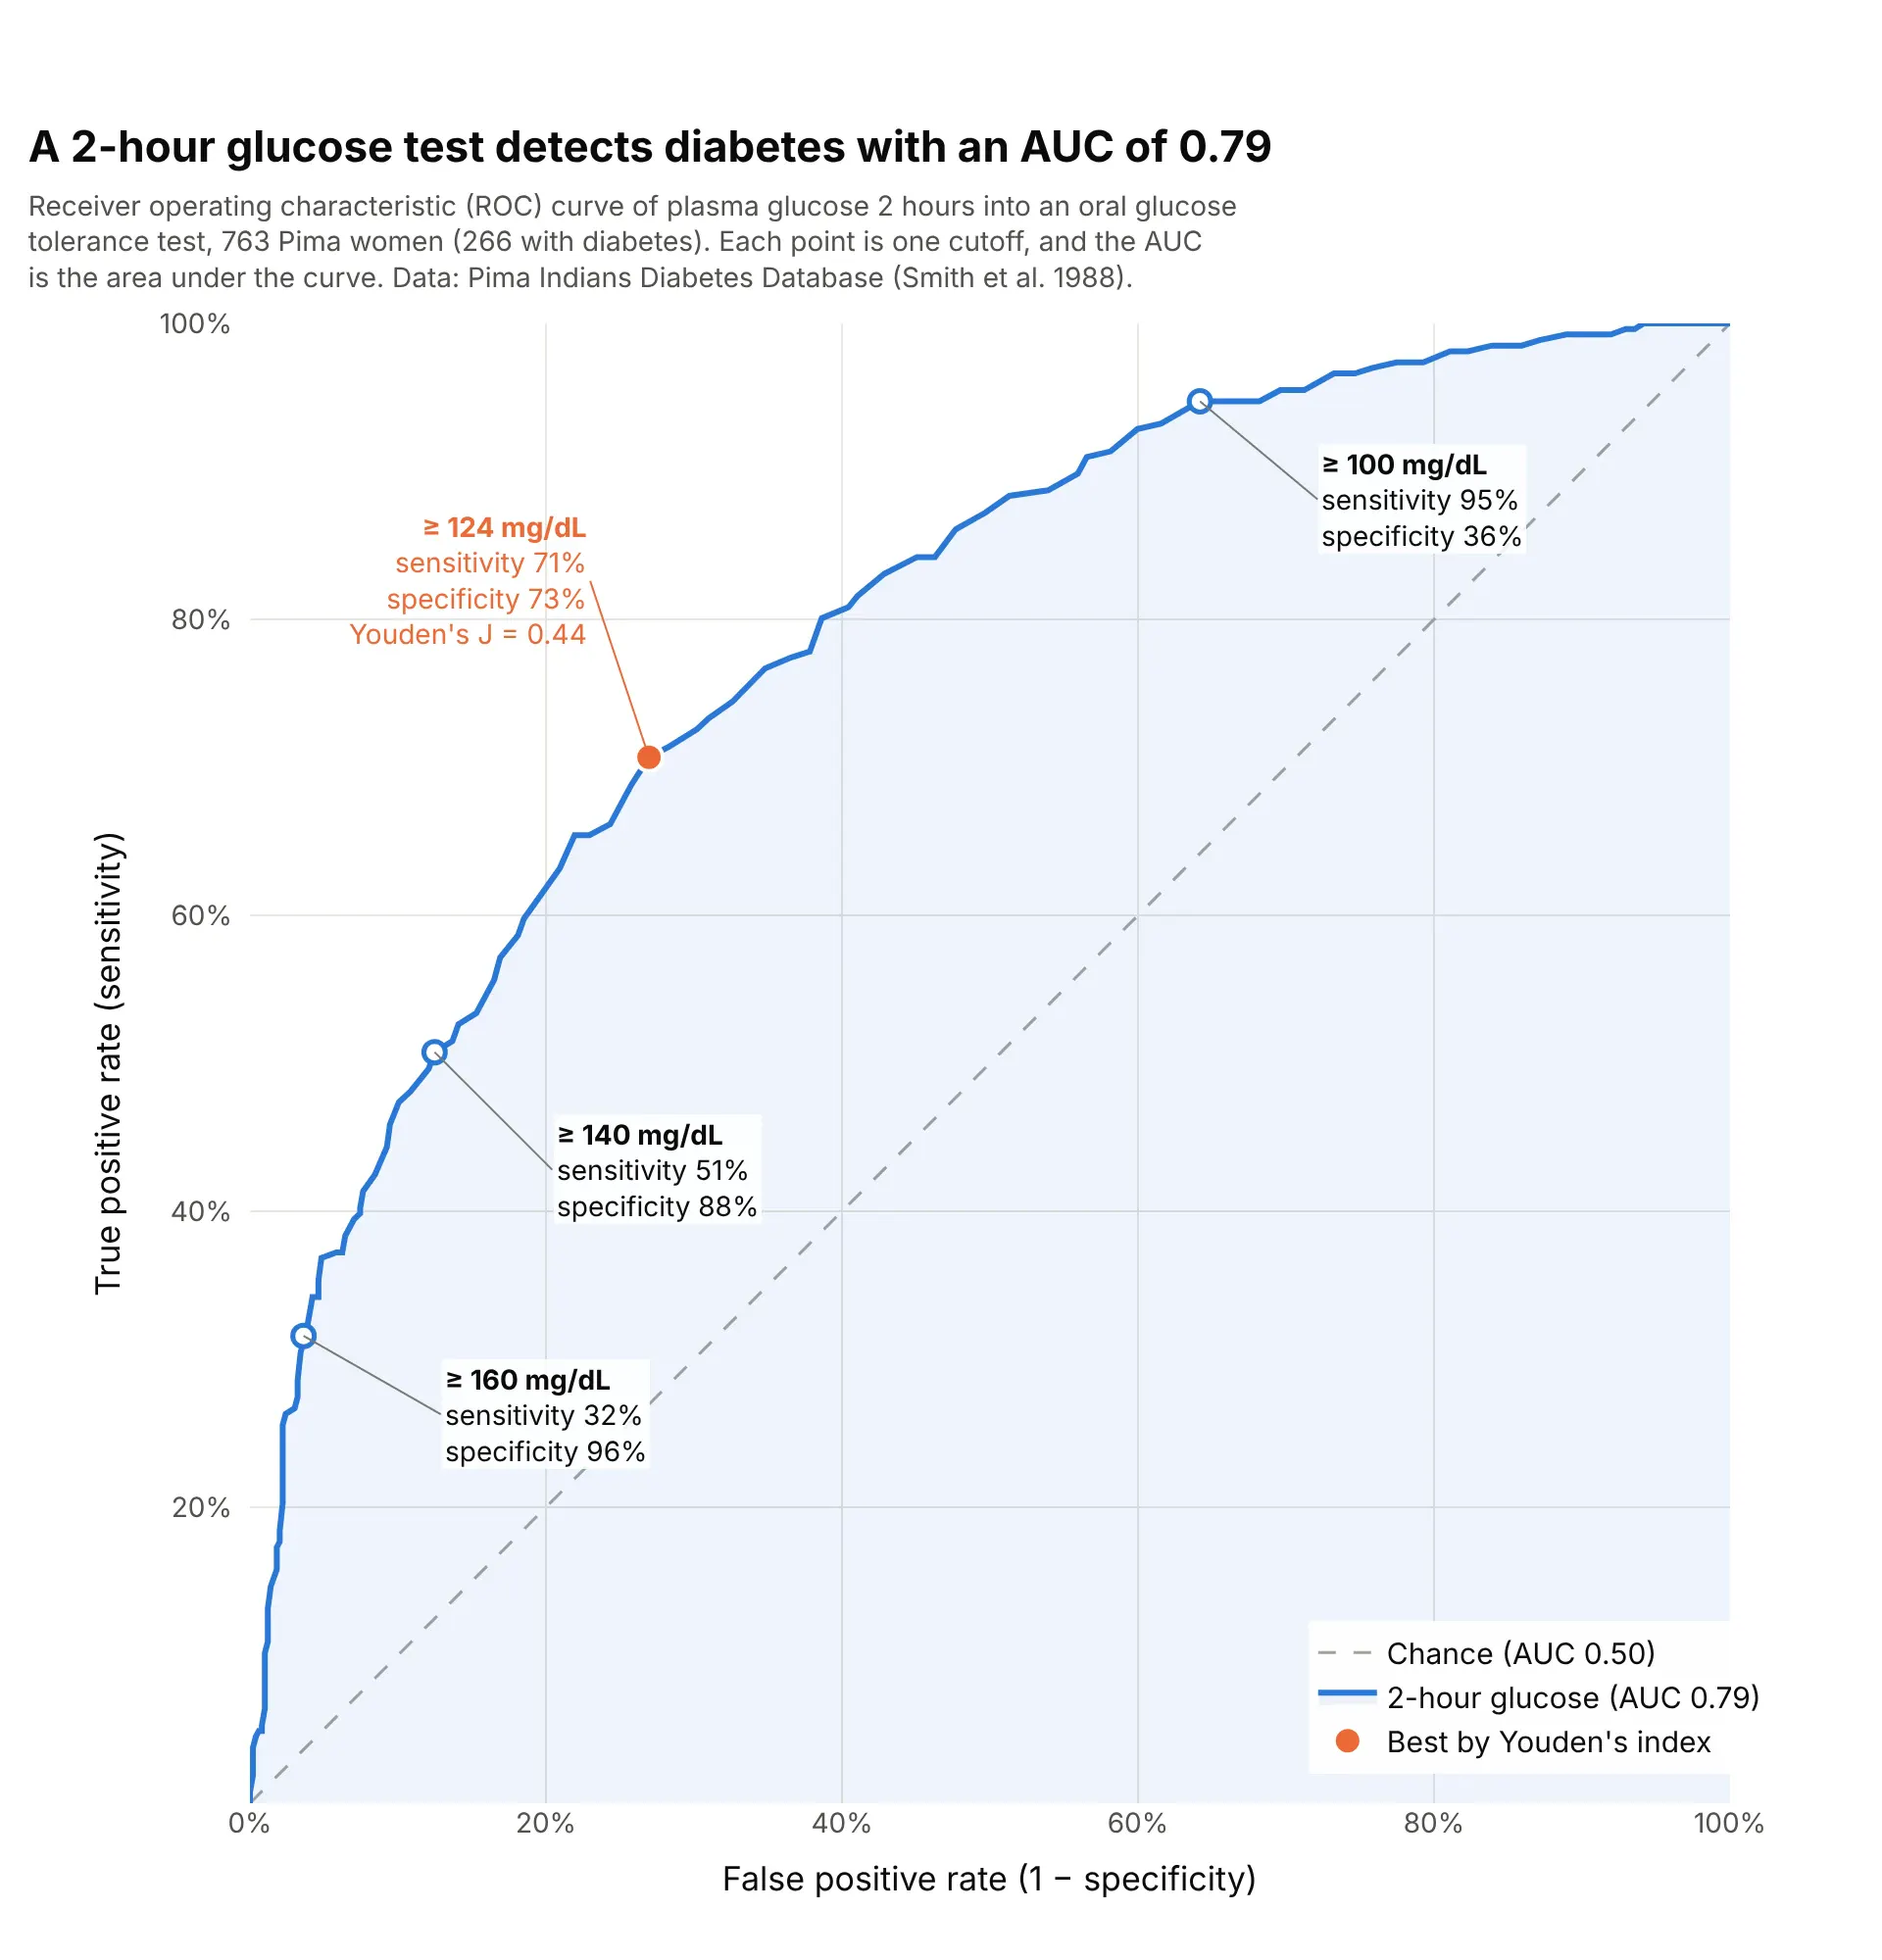
Data: Pima Indians Diabetes Database (National Institute of Diabetes and Digestive and Kidney Diseases; Smith et al. 1988), via the Plotly datasets repository.
How do you read an ROC curve? In the example above, notice these things:
- Each point on the curve is one cutoff for calling a test positive. At "glucose of 140 mg/dL or more", the test finds 51% of the 266 women with diabetes (sensitivity, on the y axis) and wrongly flags 12% of the 497 without it (the false positive rate, 1 − specificity, on the x axis).
- Lowering the cutoff moves you up and to the right along the curve: at 100 mg/dL the test catches 95% of the women with diabetes but flags 64% of those without, so specificity falls to 36%.
- The dashed diagonal is what a test with no information would give, such as flipping a coin. The further the curve bows toward the top-left corner, the better the test separates the groups.
- The area under the curve is 0.79, which means that a randomly chosen woman with diabetes has a higher glucose than a randomly chosen woman without it 79% of the time, counting ties as half. The orange point at 124 mg/dL has the highest Youden's index, sensitivity plus specificity minus 1, here 0.44.
It's often used for charts like these:
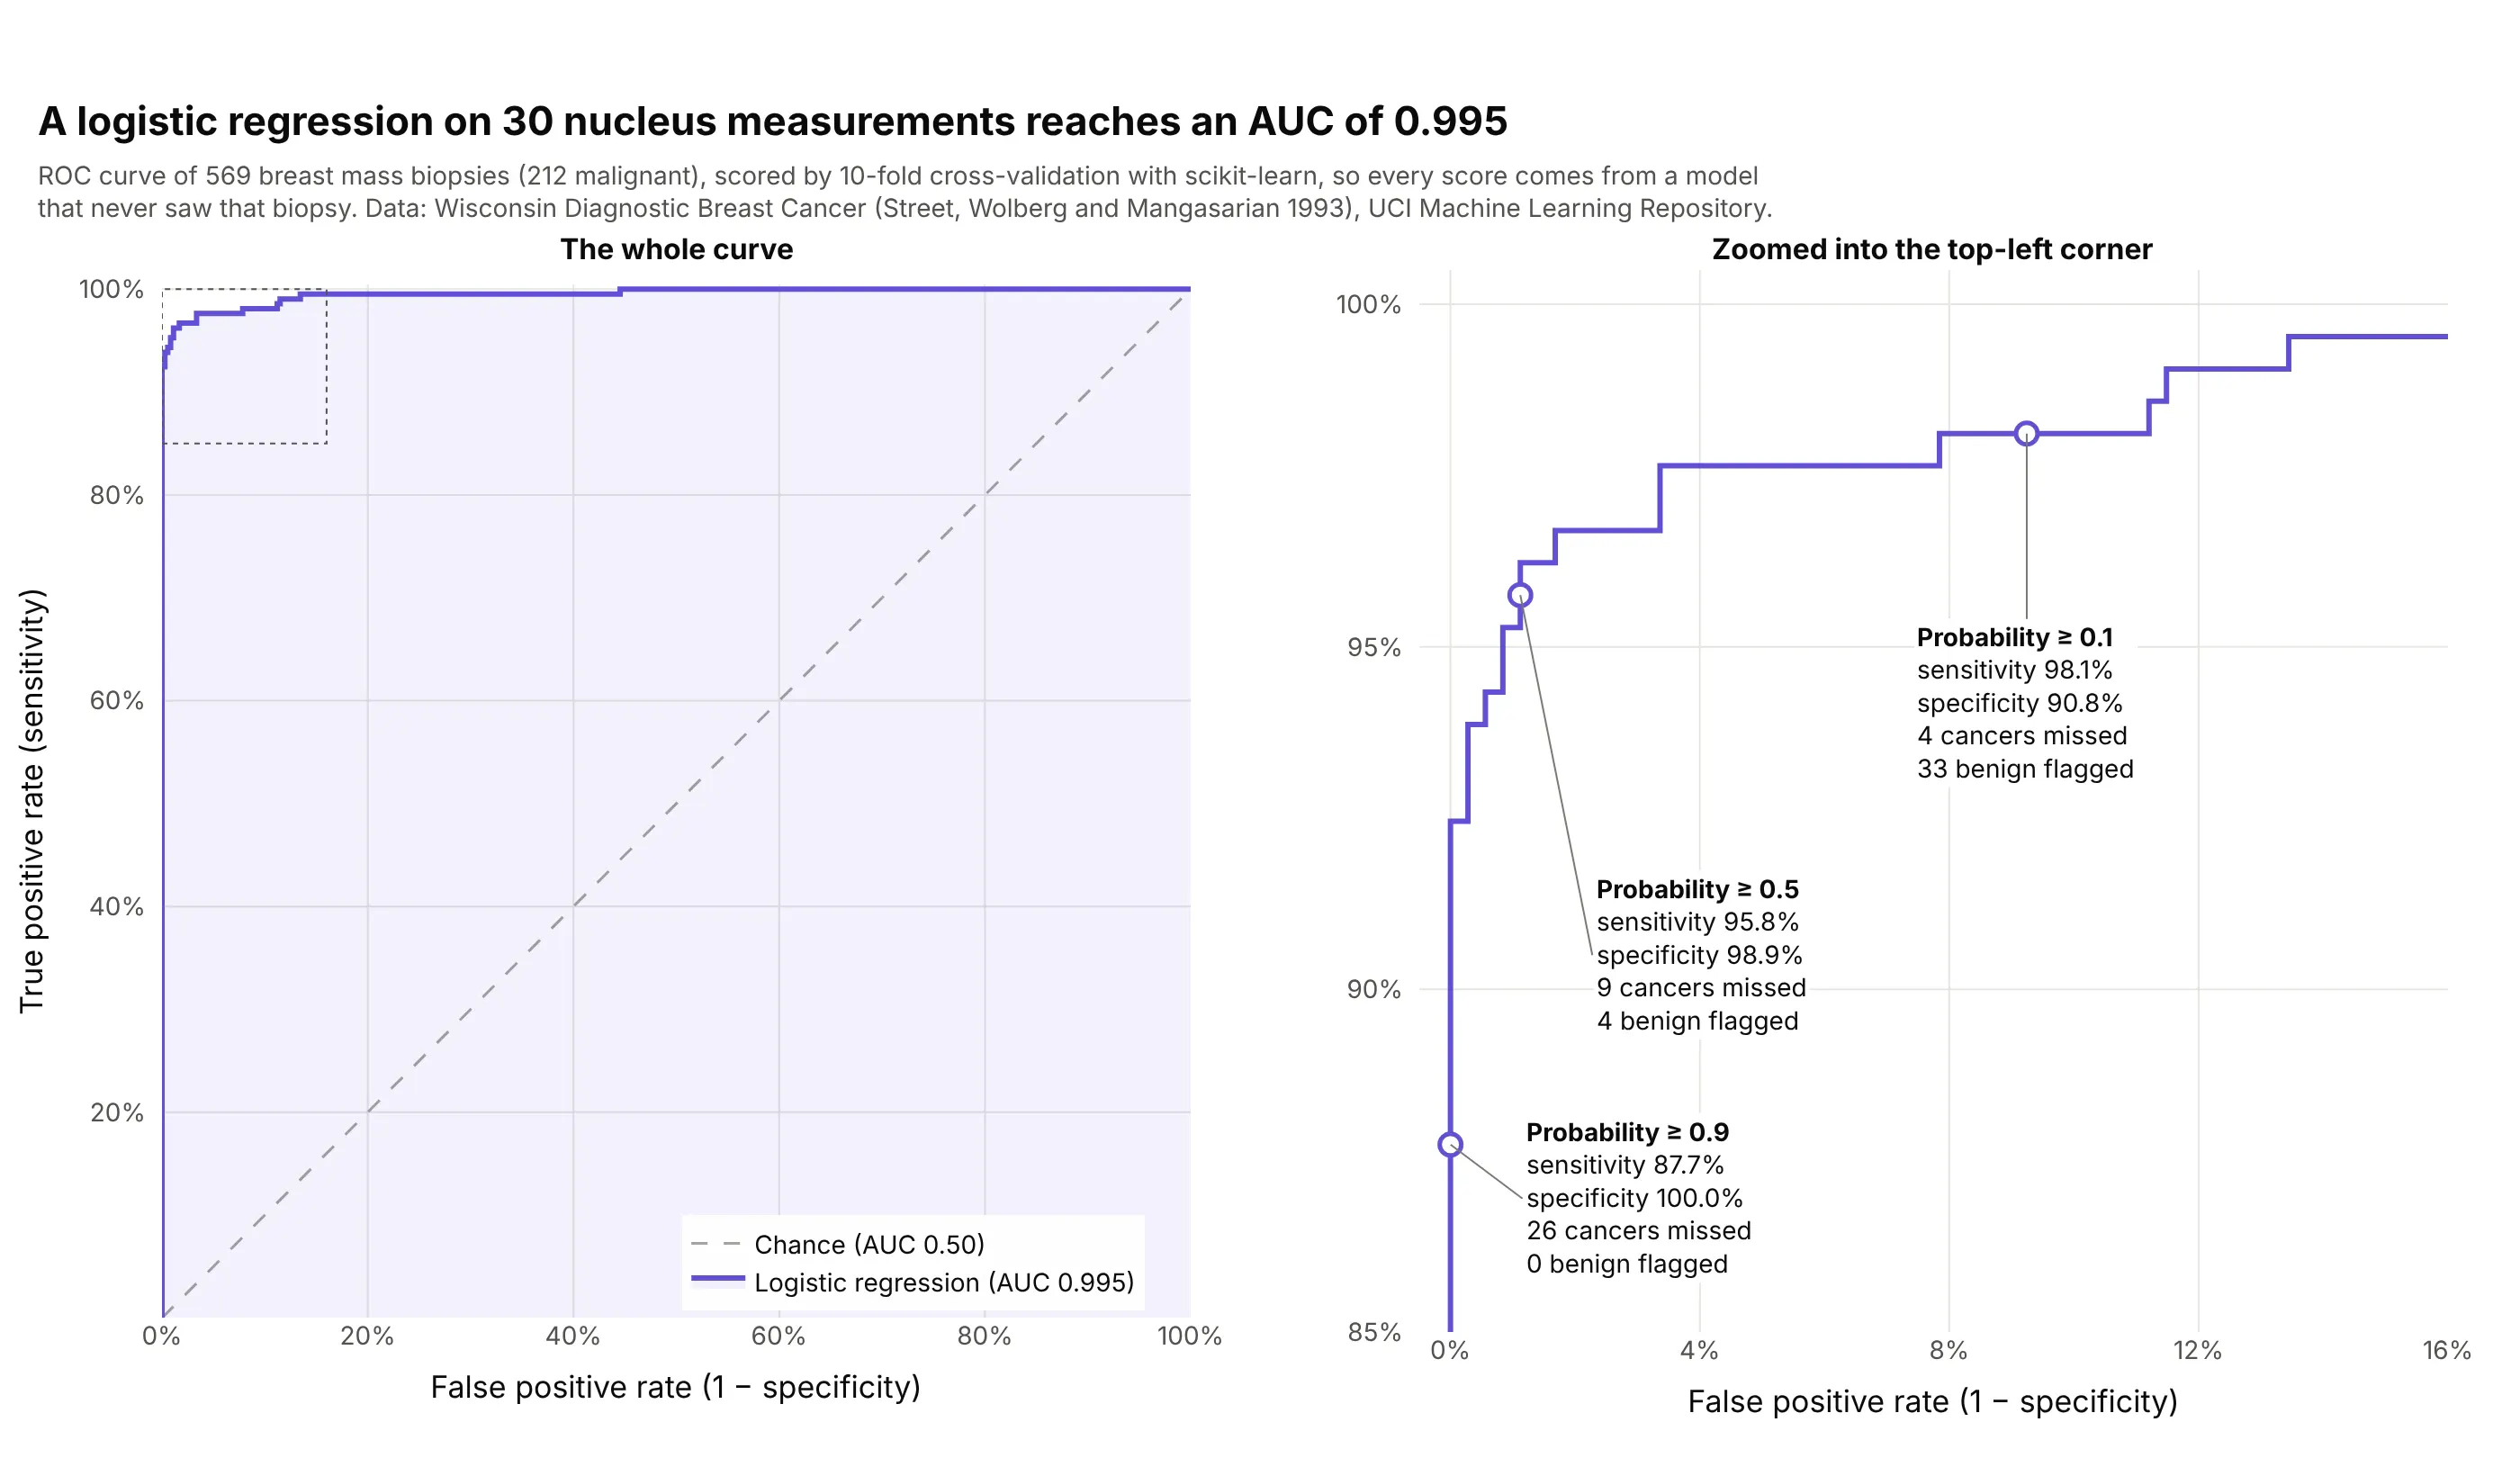
Evaluating a machine learning model. A logistic regression trained with scikit-learn on 30 measurements of cell nuclei separates 212 malignant from 357 benign breast biopsies with an AUC of 0.995, and its default cutoff of 0.5 misses 9 cancers. Data: Wisconsin Diagnostic Breast Cancer (Street, Wolberg and Mangasarian 1993), UCI Machine Learning Repository.
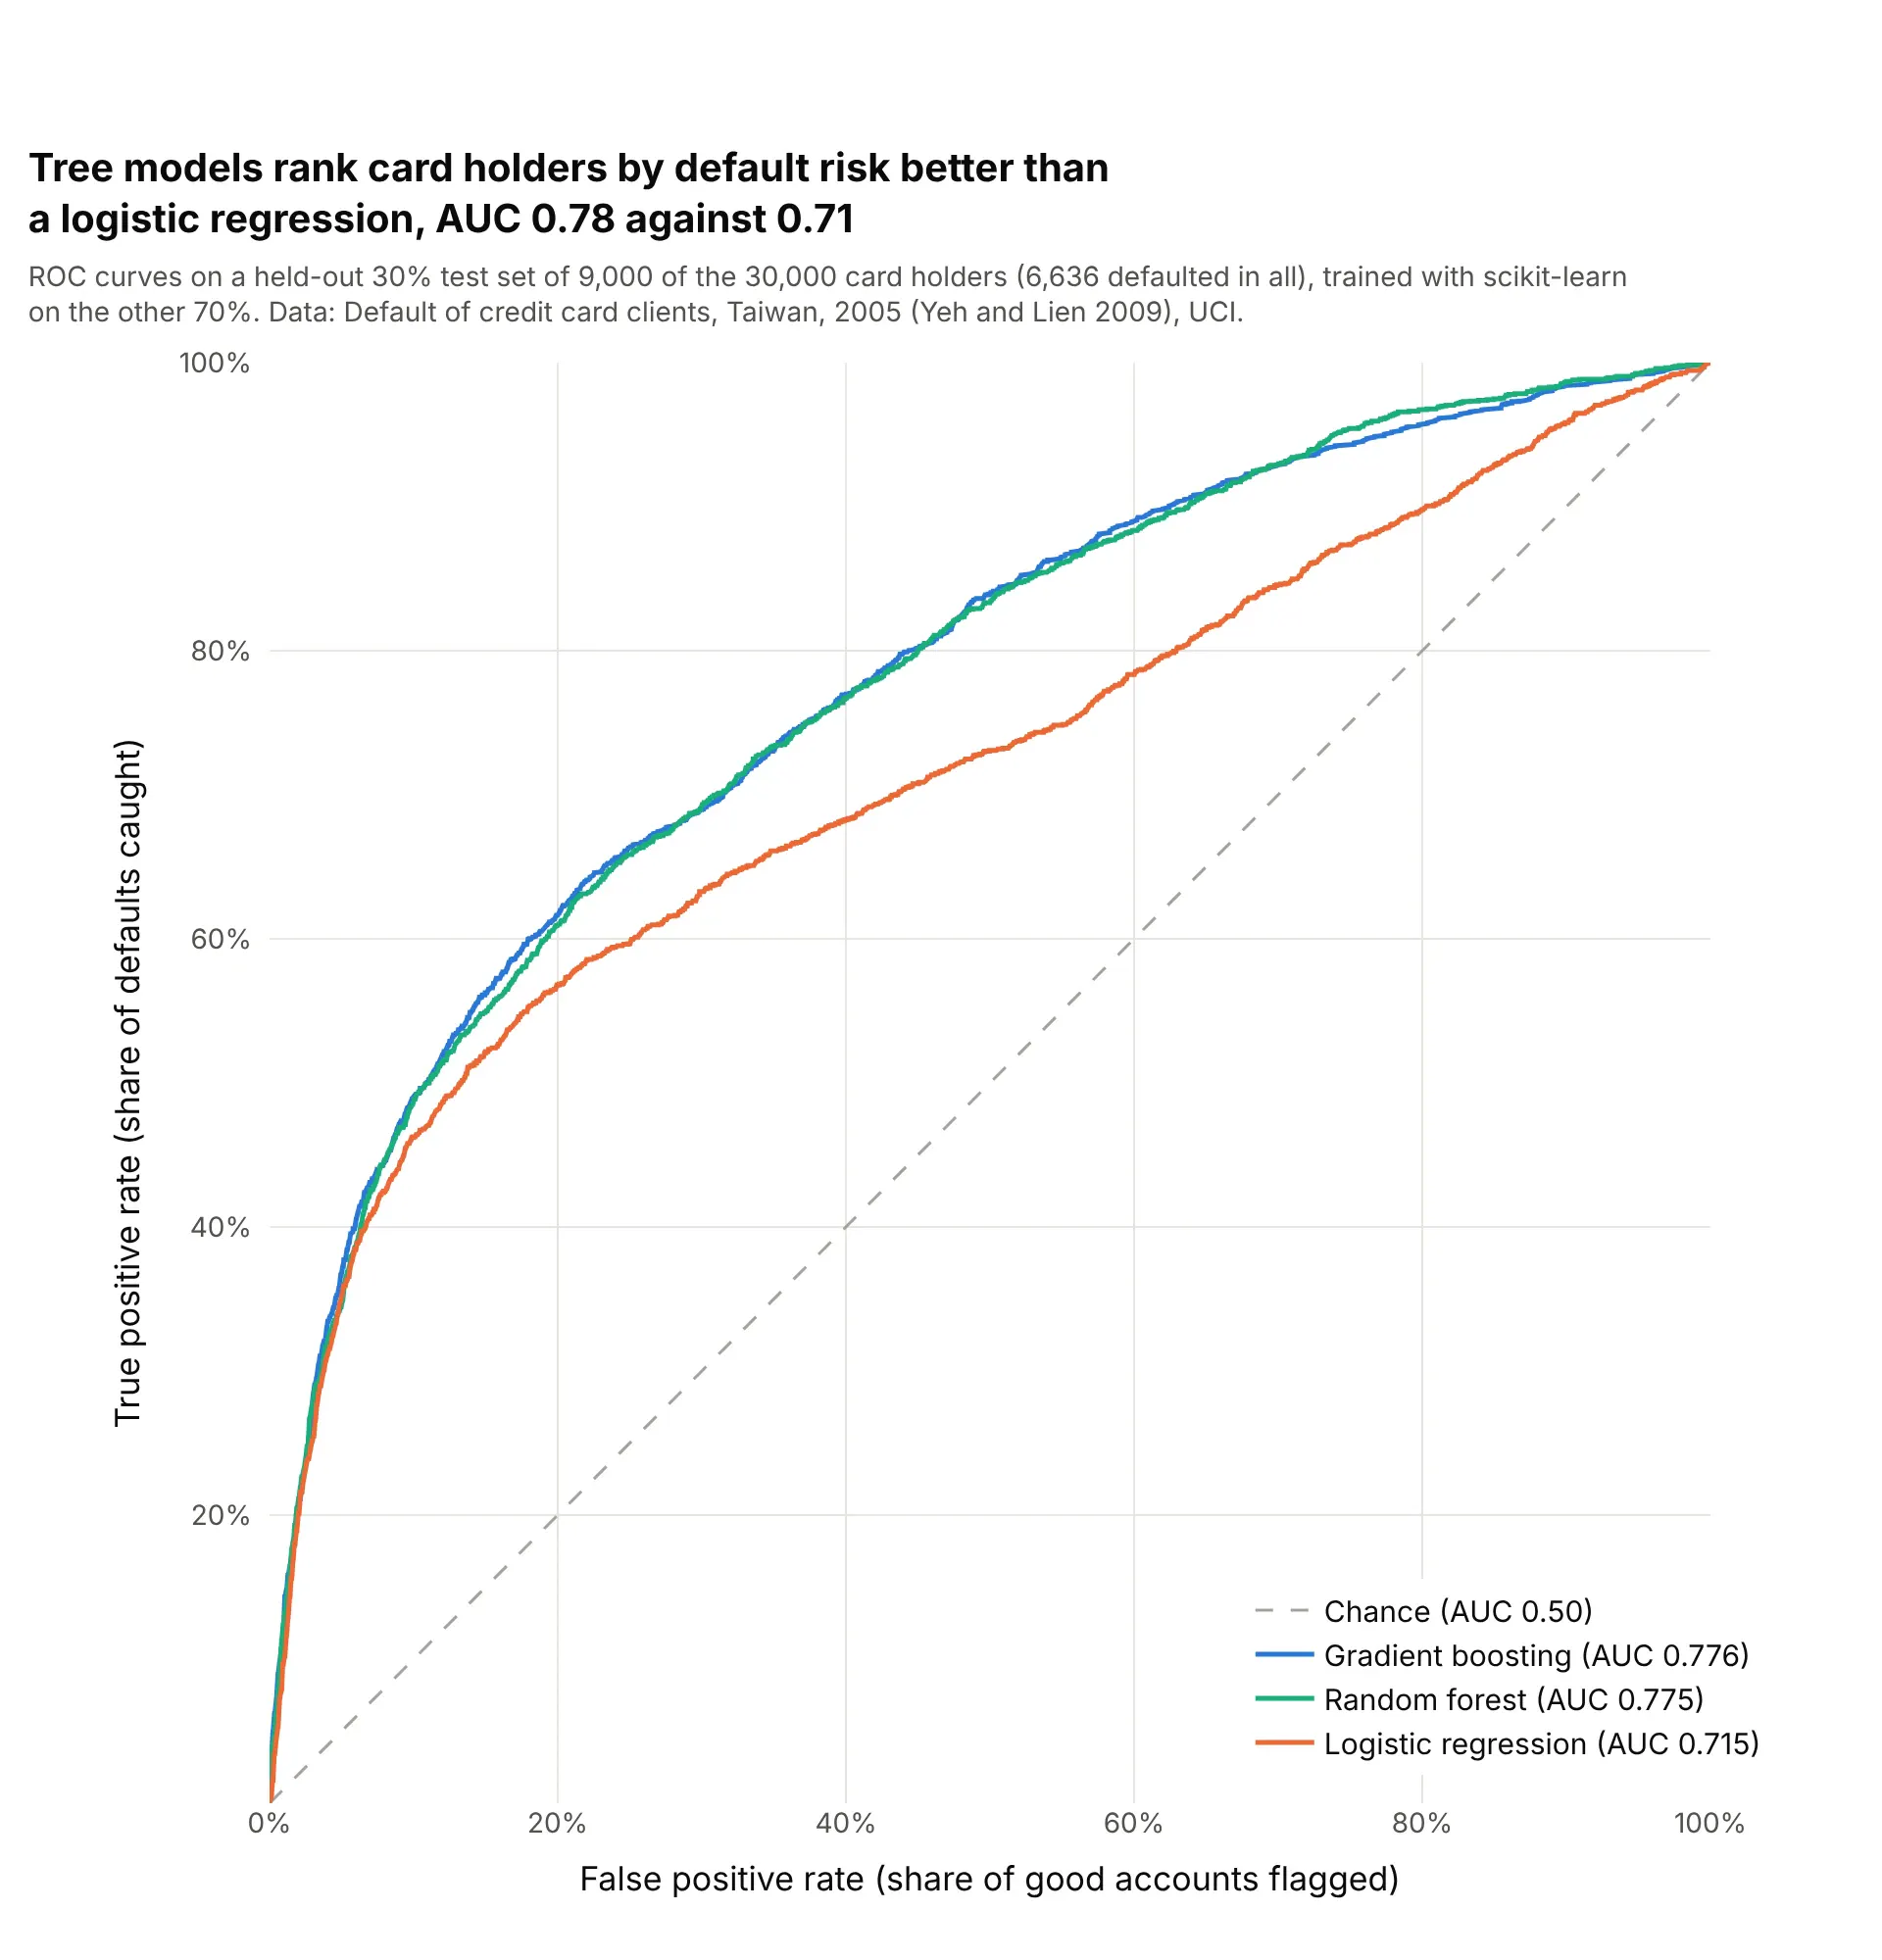
Comparing models in finance. On the same 9,000 held-out card holders, gradient boosting and a random forest rank defaulters above good accounts with an AUC of 0.78, against 0.71 for a logistic regression. Data: Default of credit card clients, Taiwan, 2005 (Yeh and Lien 2009), UCI.
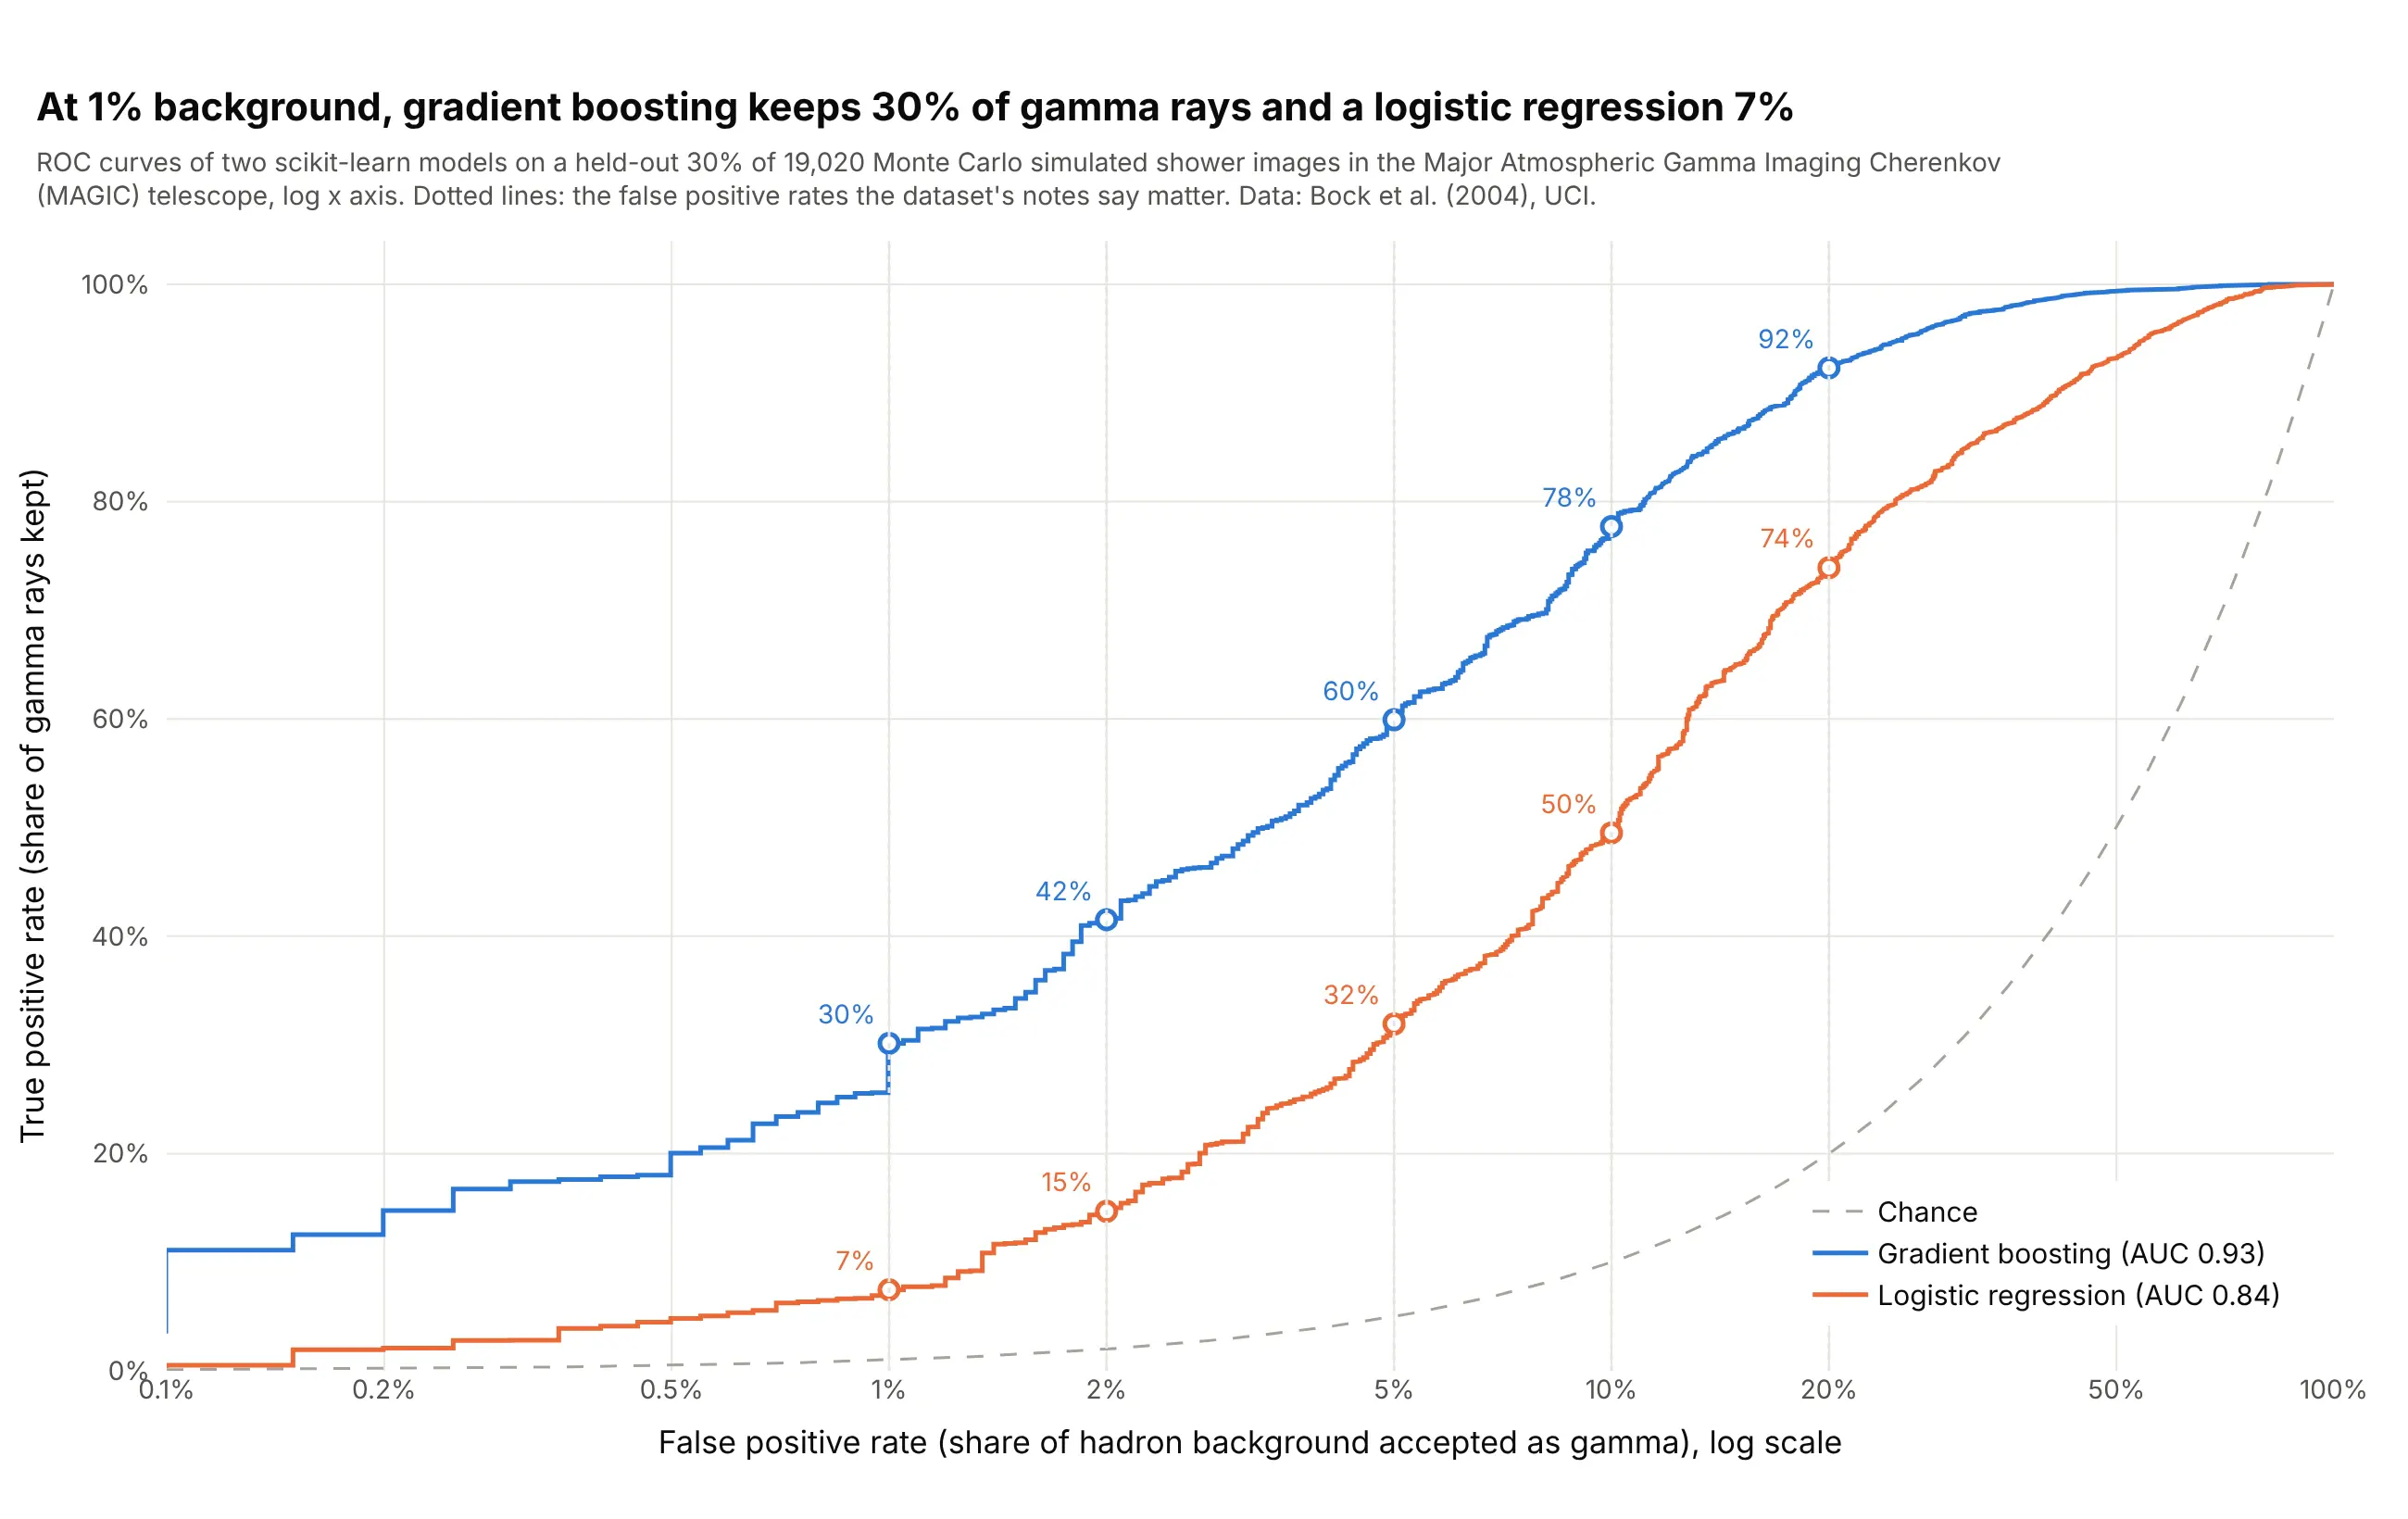
Signal detection in physics. Telescope teams read the curve at a fixed, small rate of background: at 1% of cosmic-ray showers accepted, gradient boosting keeps 30% of gamma rays and a logistic regression 7%, a difference the AUCs (0.93 and 0.84) understate. Data: gamma telescope data 2004 from the Major Atmospheric Gamma Imaging Cherenkov telescope (Bock et al. 2004), Monte Carlo simulated events, UCI.
ROC curves explained: sensitivity, specificity and thresholds
An ROC curve assumes a few ideas from diagnostic testing. Most tests and models don't say yes or no; they give a number, such as a glucose reading or a predicted probability, and somebody picks a cutoff (also called a threshold) above which the result counts as positive. Everything on the chart follows from that choice.
One cutoff makes four counts
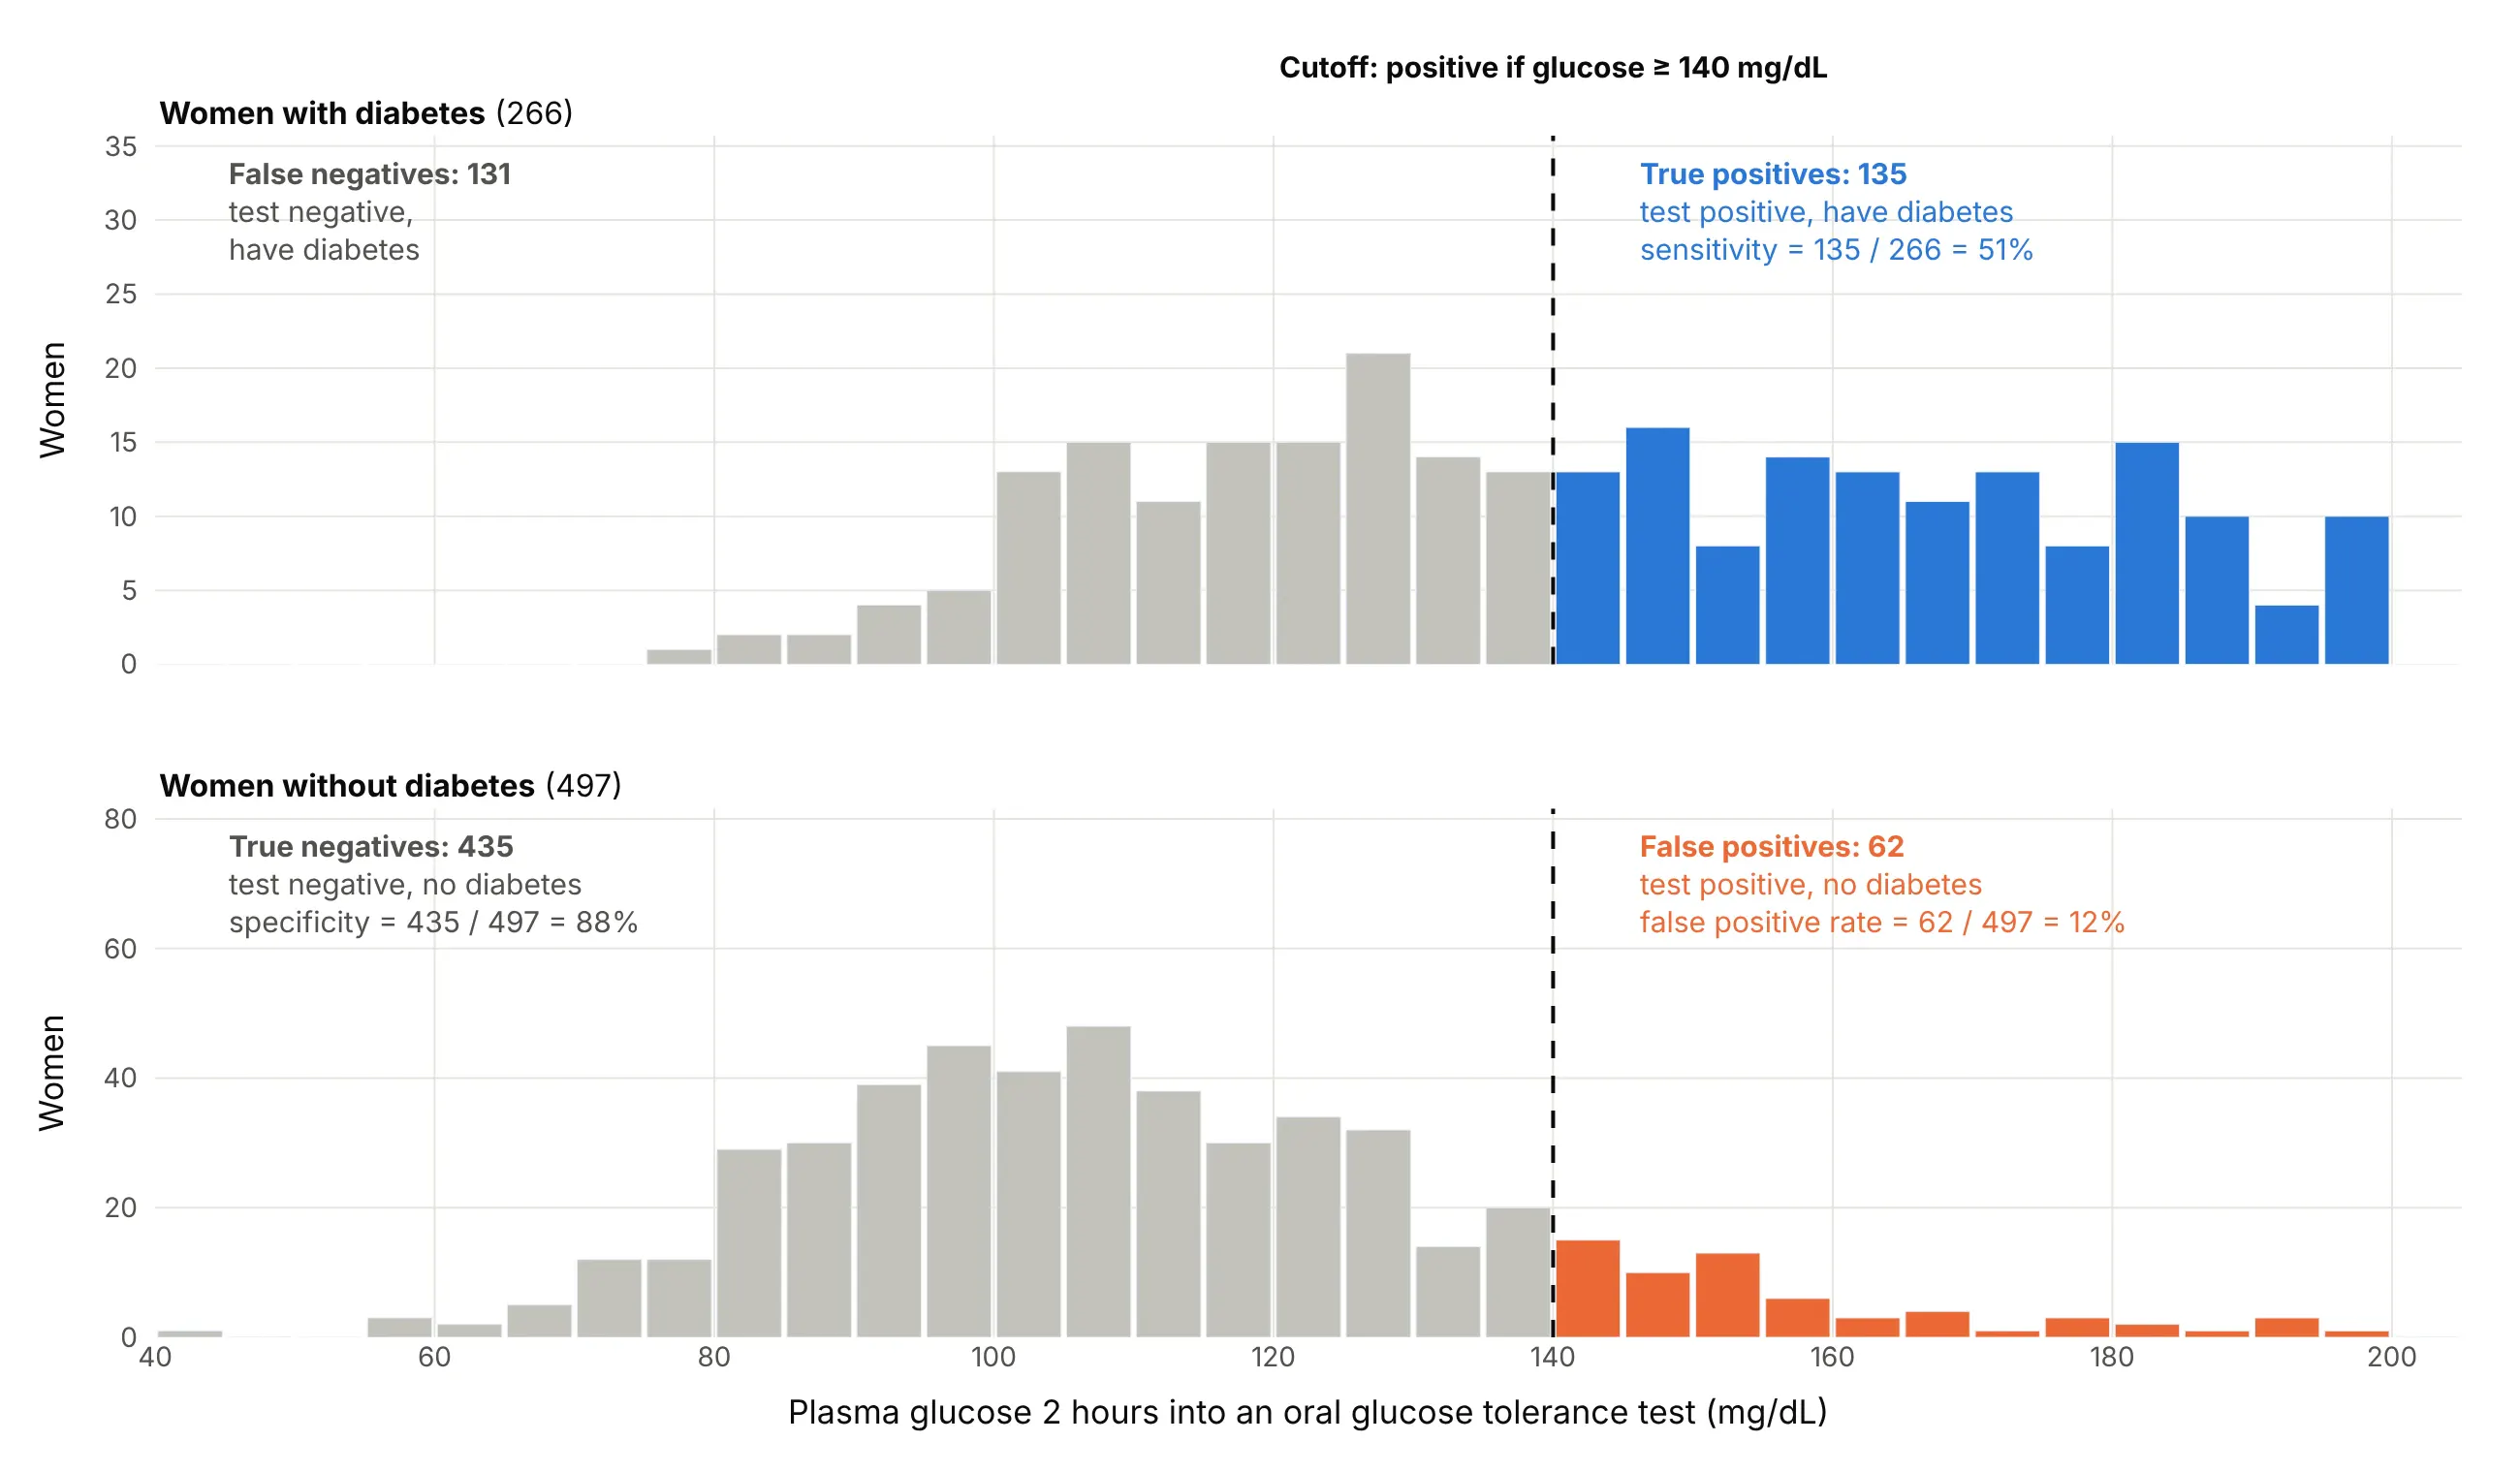
Take the glucose test and a cutoff of 140 mg/dL. The women with diabetes split into those above the cutoff, the true positives, and those below it, the false negatives, the cases the test misses. The women without diabetes split into false positives above the cutoff and true negatives below it:
Data: Pima Indians Diabetes Database (Smith et al. 1988).
Two rates describe the result, each computed within one group:
- Sensitivity, or the true positive rate, or recall, is the share of the sick who test positive: 135 of 266, or 51%.
- Specificity is the share of the healthy who test negative: 435 of 497, or 88%. Its complement, 1 − specificity, is the false positive rate: 62 of 497, or 12%.
That cutoff is the point (12%, 51%) on the ROC curve above.
Moving the cutoff trades one for the other
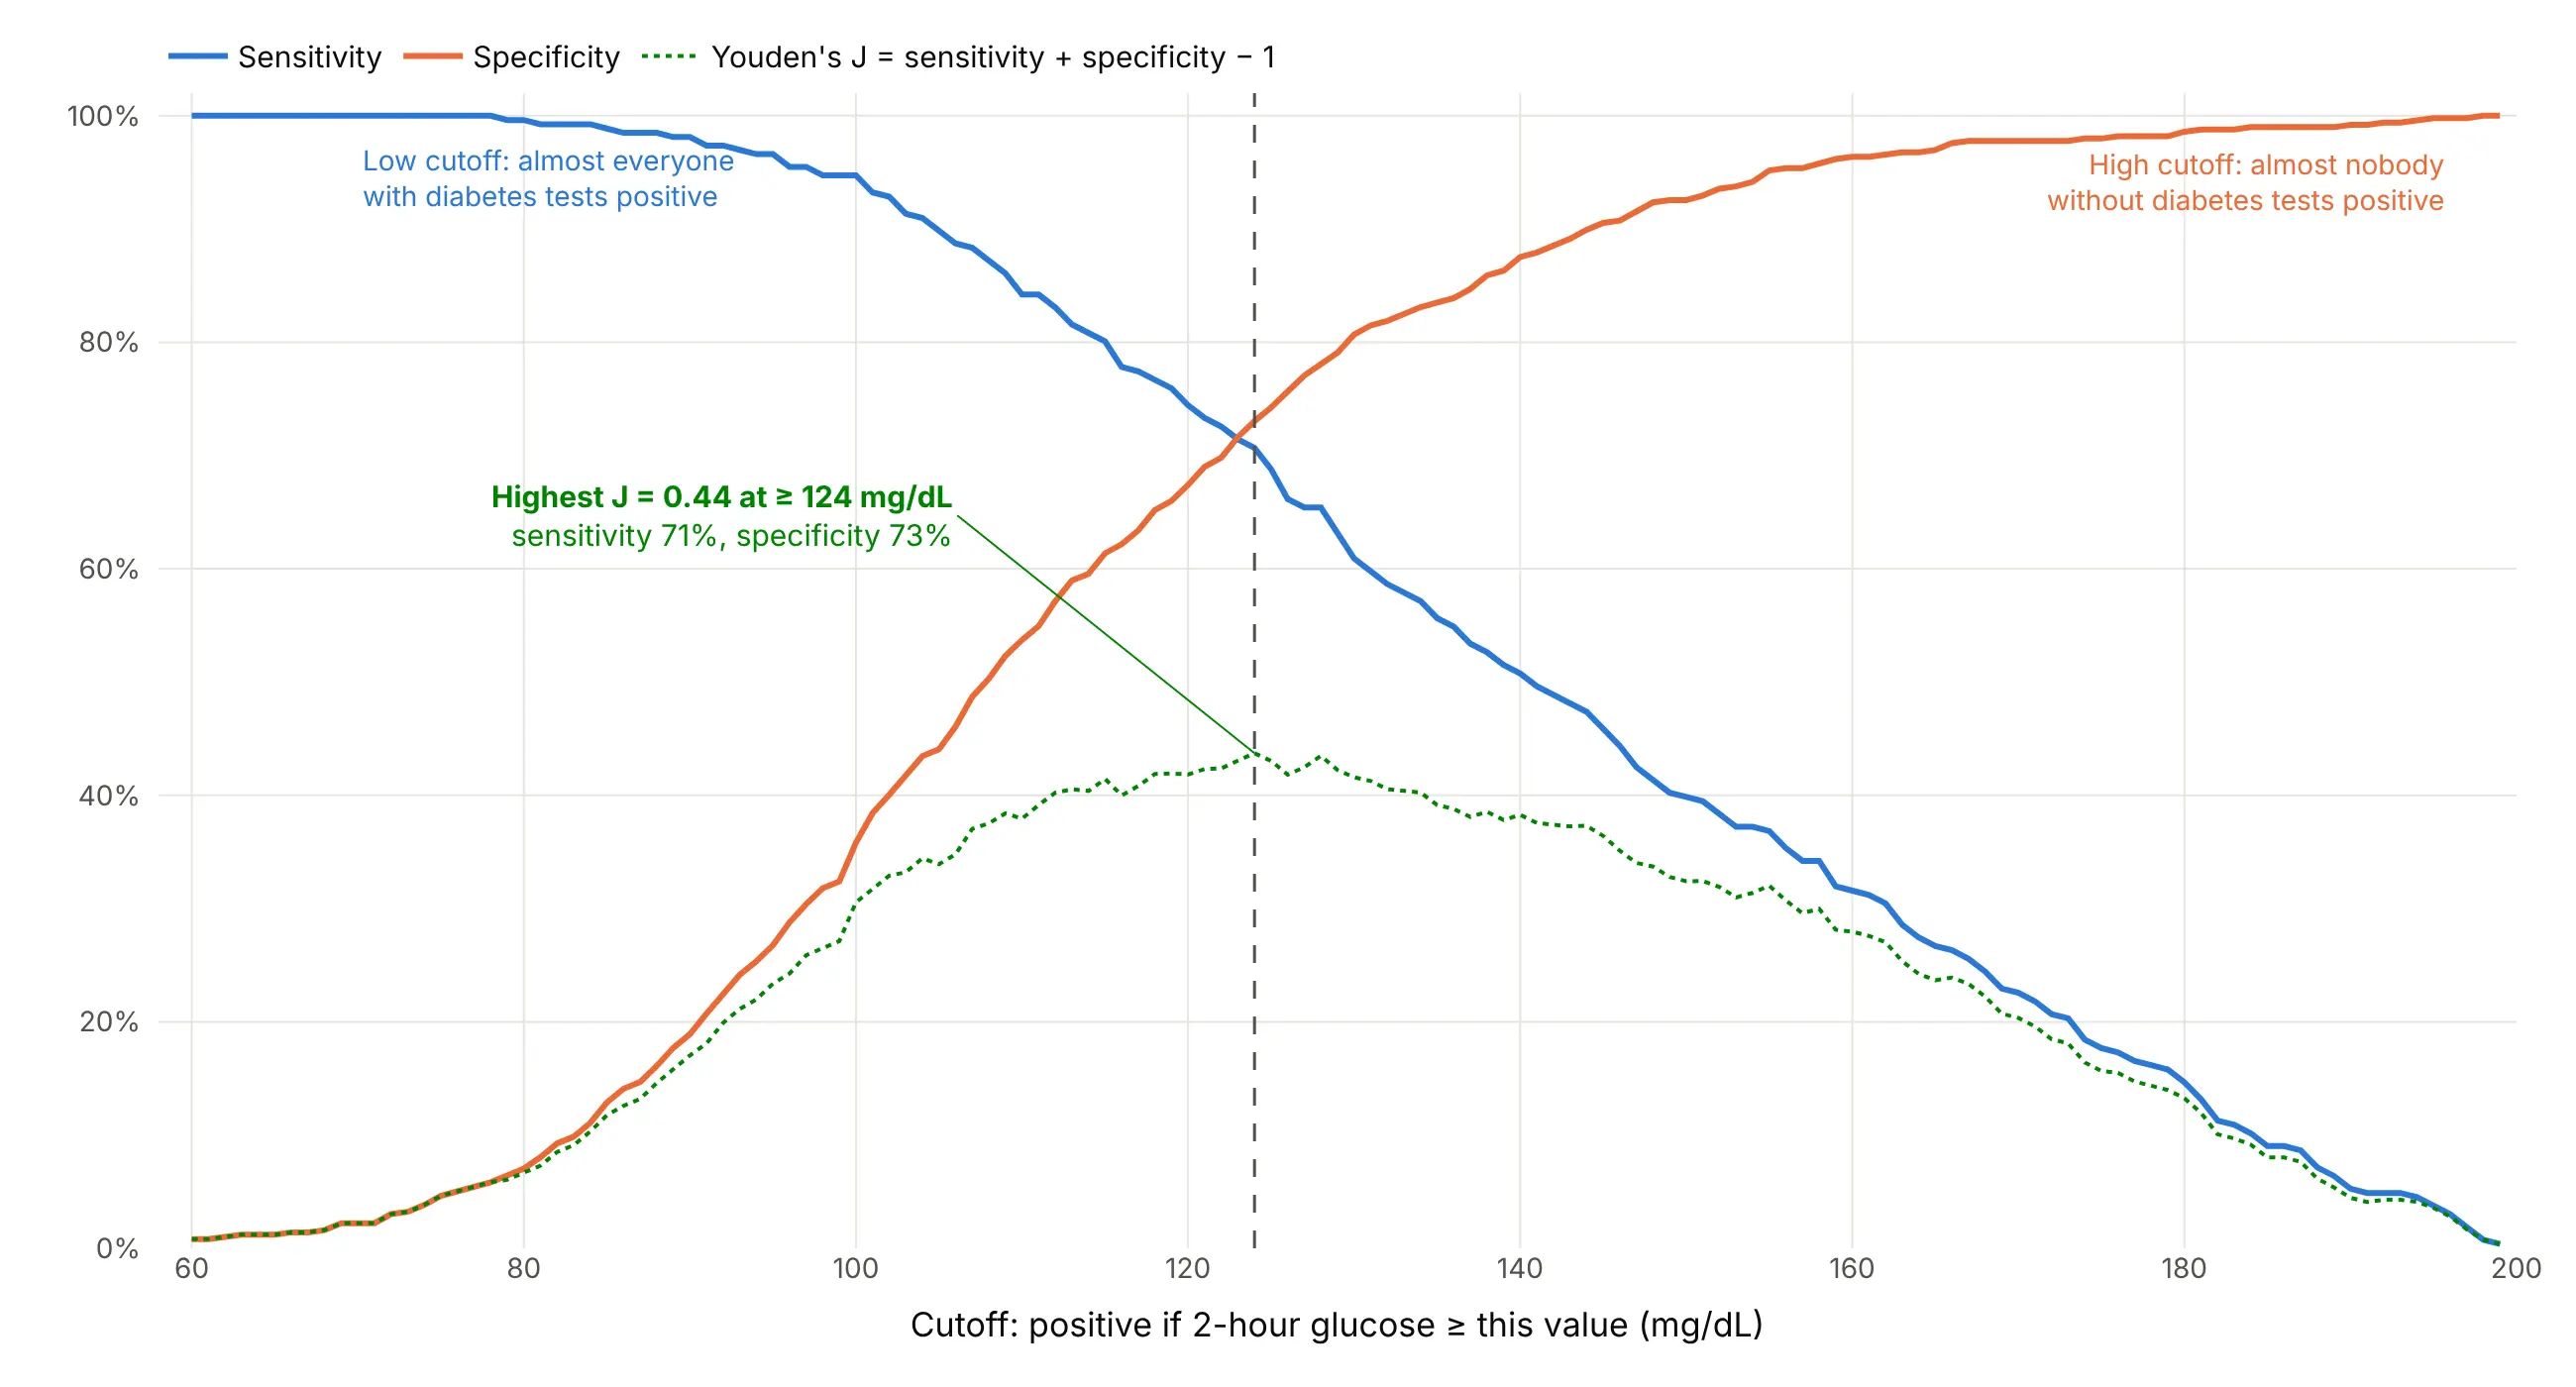
A lower cutoff catches more of the sick and flags more of the healthy, so sensitivity rises while specificity falls. Drawing both against every cutoff from 60 to 199 mg/dL shows the trade:
Data: Pima Indians Diabetes Database (Smith et al. 1988).
An ROC curve is this same chart with the cutoff axis taken away: each cutoff becomes one point, at its false positive rate and its sensitivity. That's why ROC curves compare tests measured in different units, such as glucose in mg/dL and a model's probability, on one chart.
Choosing a cutoff with Youden's index
If missing a case and raising a false alarm cost about the same, a common choice is the cutoff with the highest Youden's index (J), sensitivity + specificity − 1, proposed by W. J. Youden in 1950 (Youden 1950). On the ROC curve it is the point farthest above the diagonal. For glucose it is 124 mg/dL, with J = 0.44. When the costs differ, as in screening for a serious disease, pick a cutoff with high sensitivity instead, and accept more false positives.
What the area under the curve means
The AUC is the area under the curve, from 0.5 for the diagonal to 1 for a curve through the top-left corner. It has a plain meaning: it is the probability that a randomly chosen positive case gets a higher score than a randomly chosen negative case, which is the Mann-Whitney U (Wilcoxon) statistic scaled to 0 to 1 (Hanley and McNeil 1982). An AUC of 0.79 means that in 79% of pairs of a woman with diabetes and one without, the one with diabetes has the higher glucose, counting ties as half. It says nothing about any single cutoff, so a report should give both the AUC and the sensitivity and specificity at the cutoff that will be used.
What ROC curves look like
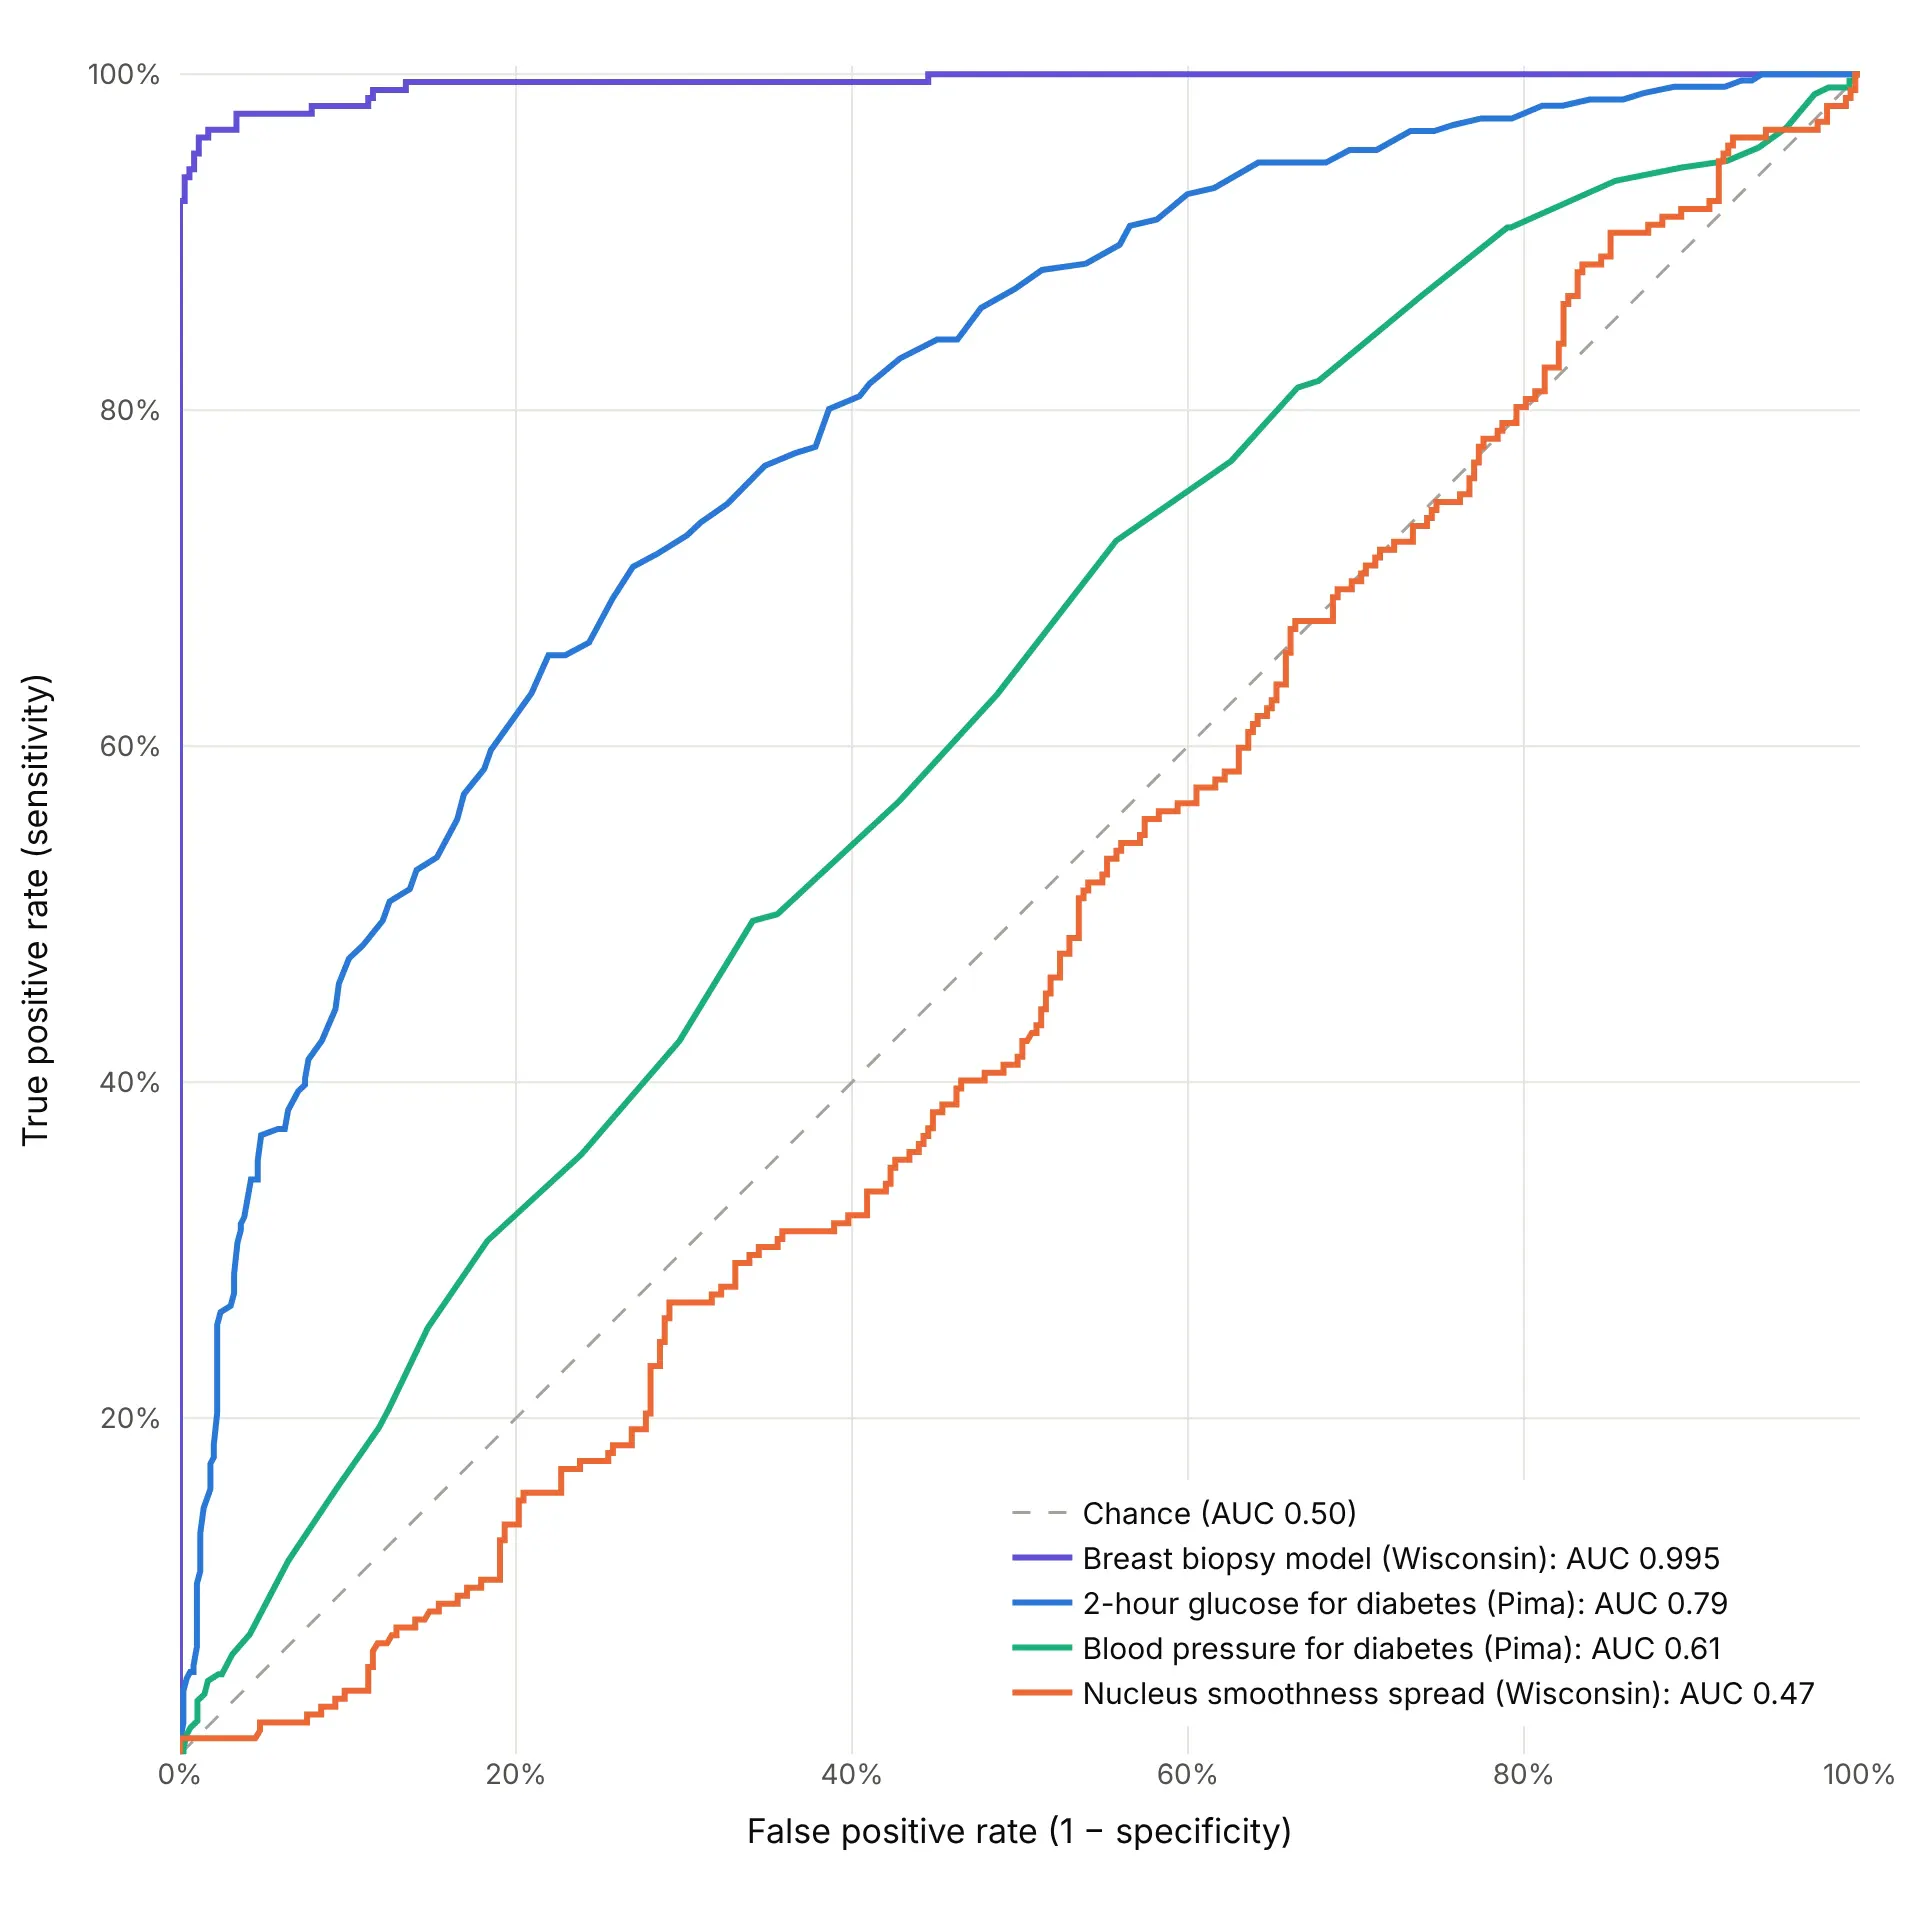
These four real scores range from almost perfect to no better than chance:
Data: Wisconsin Diagnostic Breast Cancer (Street, Wolberg and Mangasarian 1993) and Pima Indians Diabetes Database (Smith et al. 1988).
- Near the top-left corner (AUC above 0.95): almost every cutoff in the corner finds nearly all positives with few false alarms. Check that the model wasn't scored on its own training data (example 5 below).
- A smooth bow (0.7 to 0.9): a useful test with real overlap between the groups, the common case for lab values and credit models.
- Close to the diagonal (about 0.5 to 0.65): the score carries little information on its own, like blood pressure for diabetes.
- Below the diagonal (under 0.5): the score runs the wrong way for this question. Flipping its sign gives 1 − AUC, so a curve far below the diagonal is informative, just backwards.
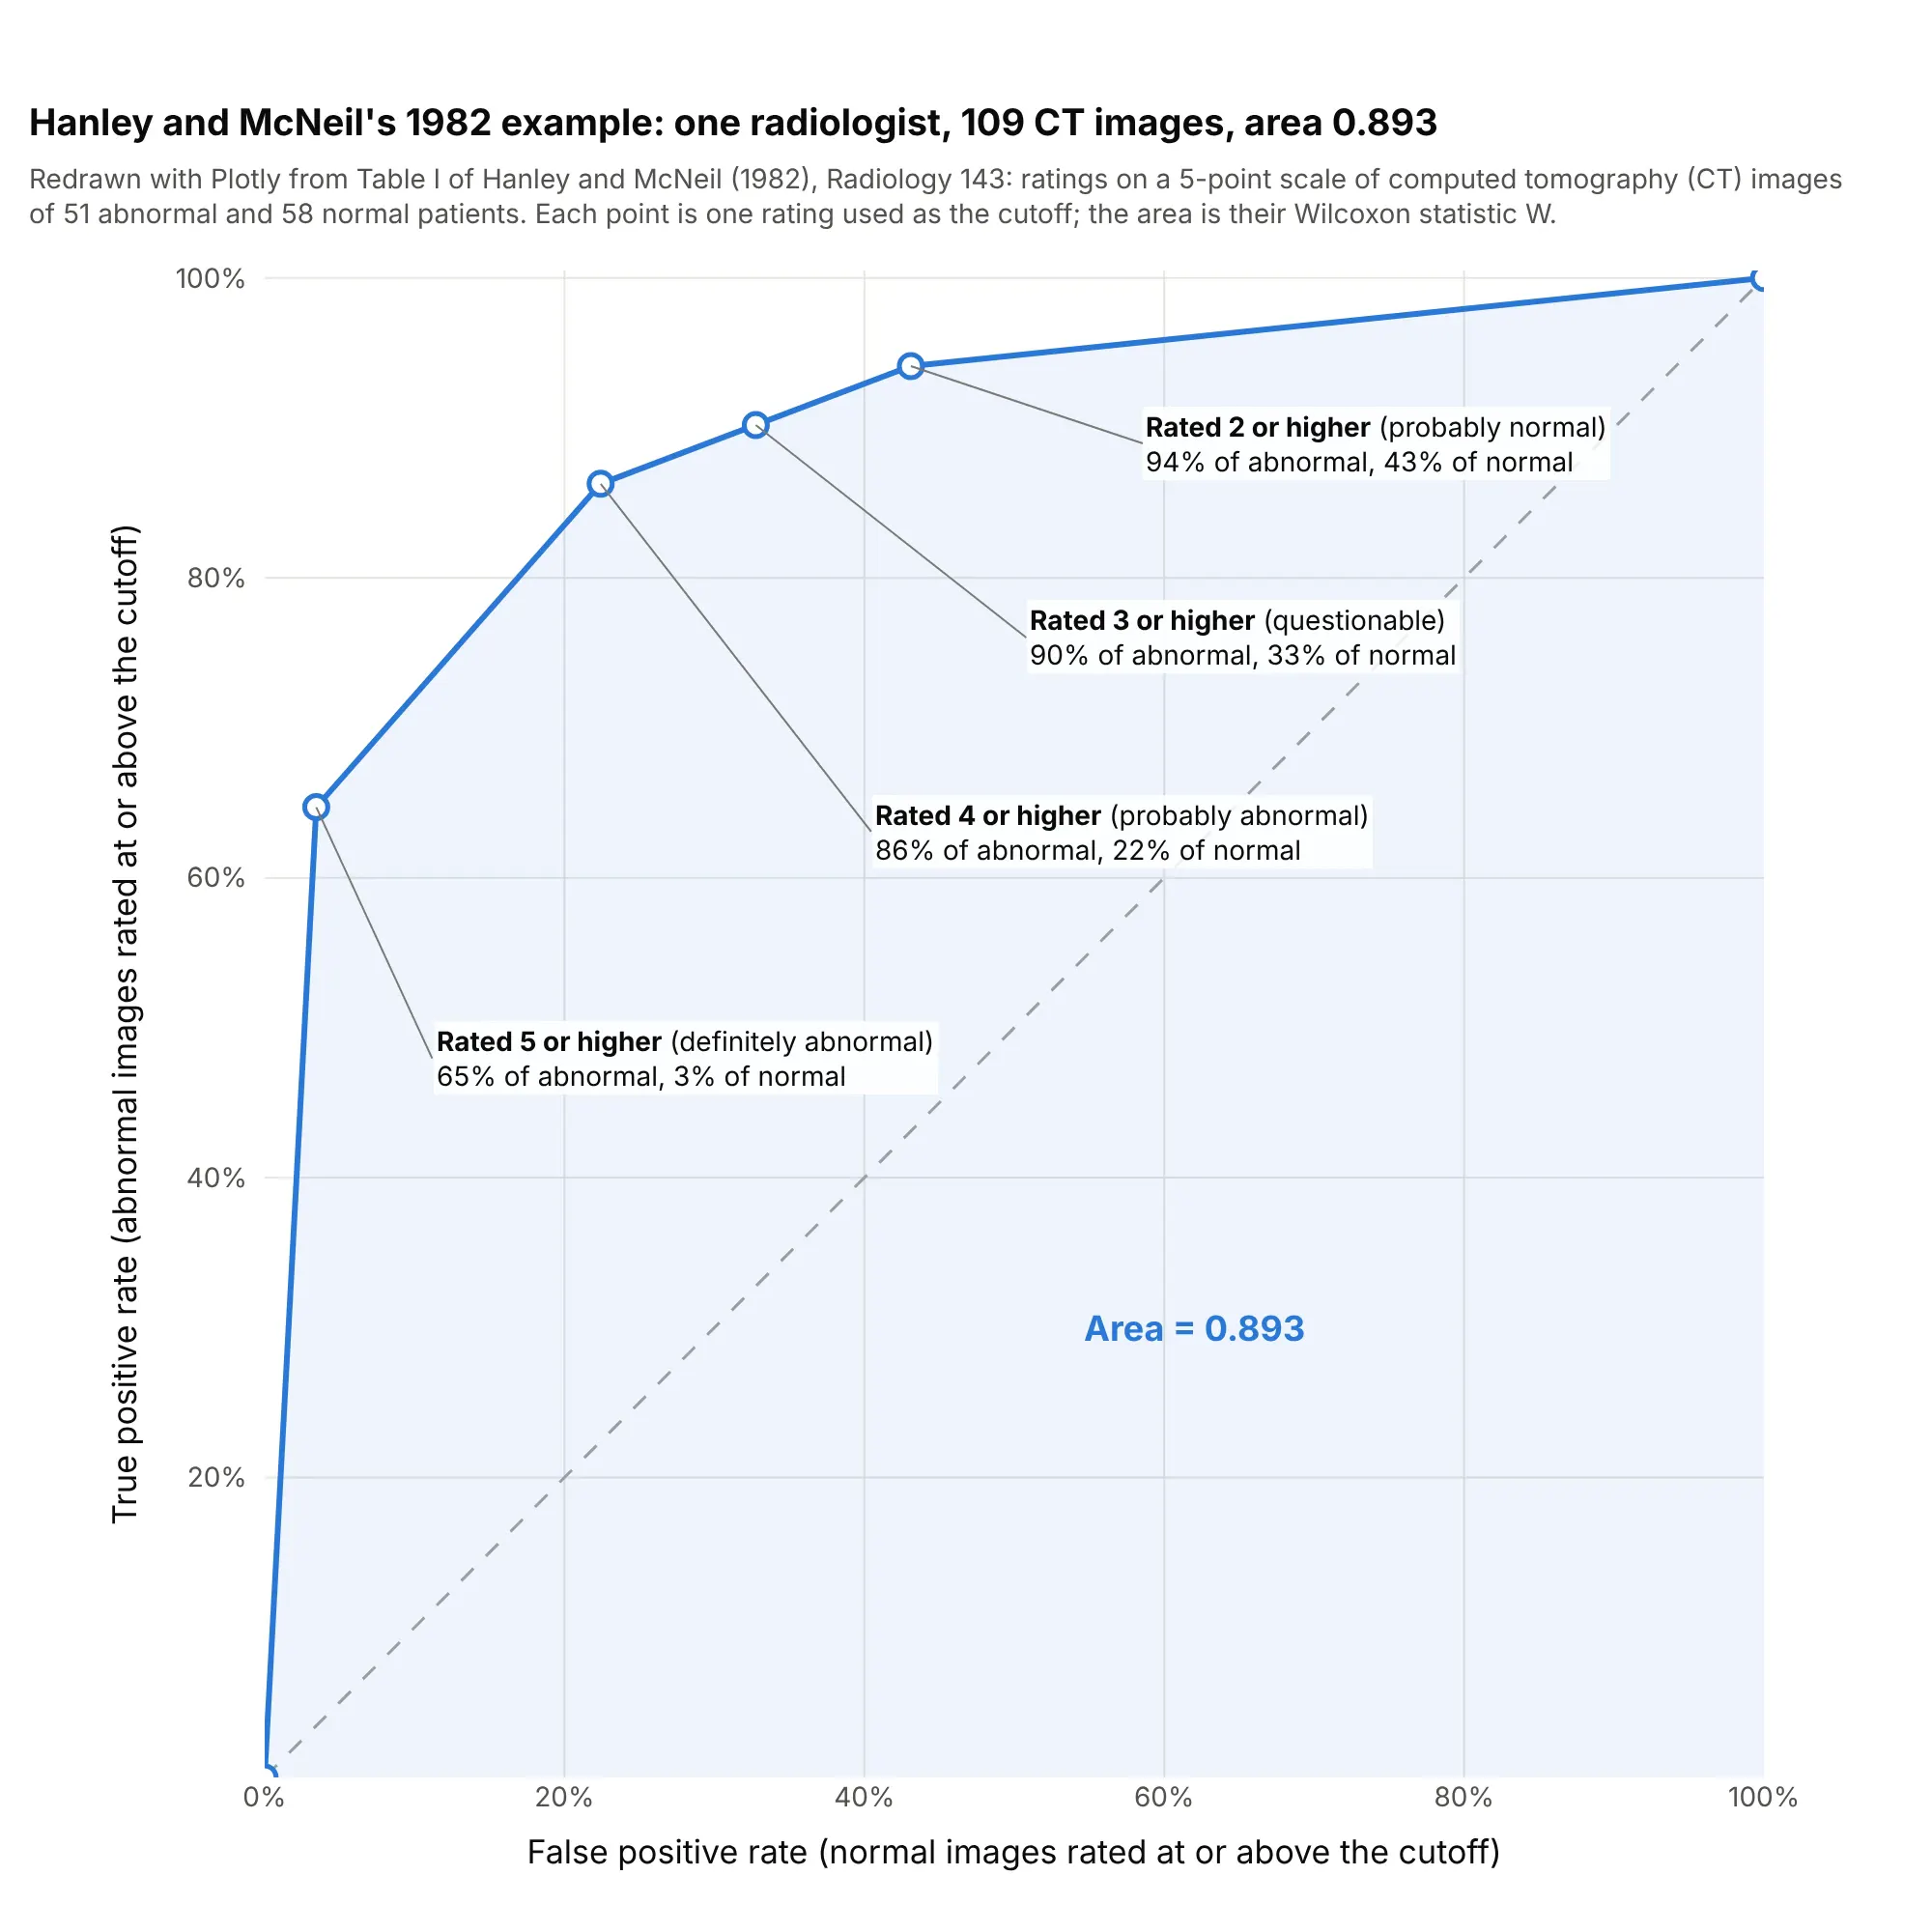
- Long straight segments come from ties: a 5-point rating scale or a rounded lab value gives only a handful of distinct cutoffs, joined by straight lines.
A short history
The name comes from radar. In World War II, engineers measured how well radar receiver operators told aircraft echoes from noise, and the "receiver operating characteristic" described that trade between hits and false alarms (Wikipedia, which cites Green and Swets's 1966 book Signal Detection Theory and Psychophysics). In 1954 Peterson, Birdsall and Fox set out the theory of signal detectability, and Tanner and Swets applied it to human visual detection the same year, which brought ROC curves into psychology. Lee Lusted's 1971 Science article, "Signal Detectability and Medical Decision-Making", carried the idea into medicine, and John Swets's 1988 Science article, "Measuring the Accuracy of Diagnostic Systems", applied it to diagnostic systems in general. Hanley and McNeil's 1982 Radiology paper showed that the area under the curve is the Wilcoxon statistic and how to compute its standard error, using one radiologist's ratings of 109 computed tomography (CT) images. Their table is public in the paper, so here it is redrawn:
Data: Hanley and McNeil (1982), Table I, typed from the paper.
Machine learning picked up ROC analysis in the 1990s (Bradley 1997), and Tom Fawcett's 2006 introduction is a widely cited guide to computing and averaging the curves.
Alternatives to an ROC curve
Here's the same glucose test drawn six ways. Some are better for the question, some worse, some just different:
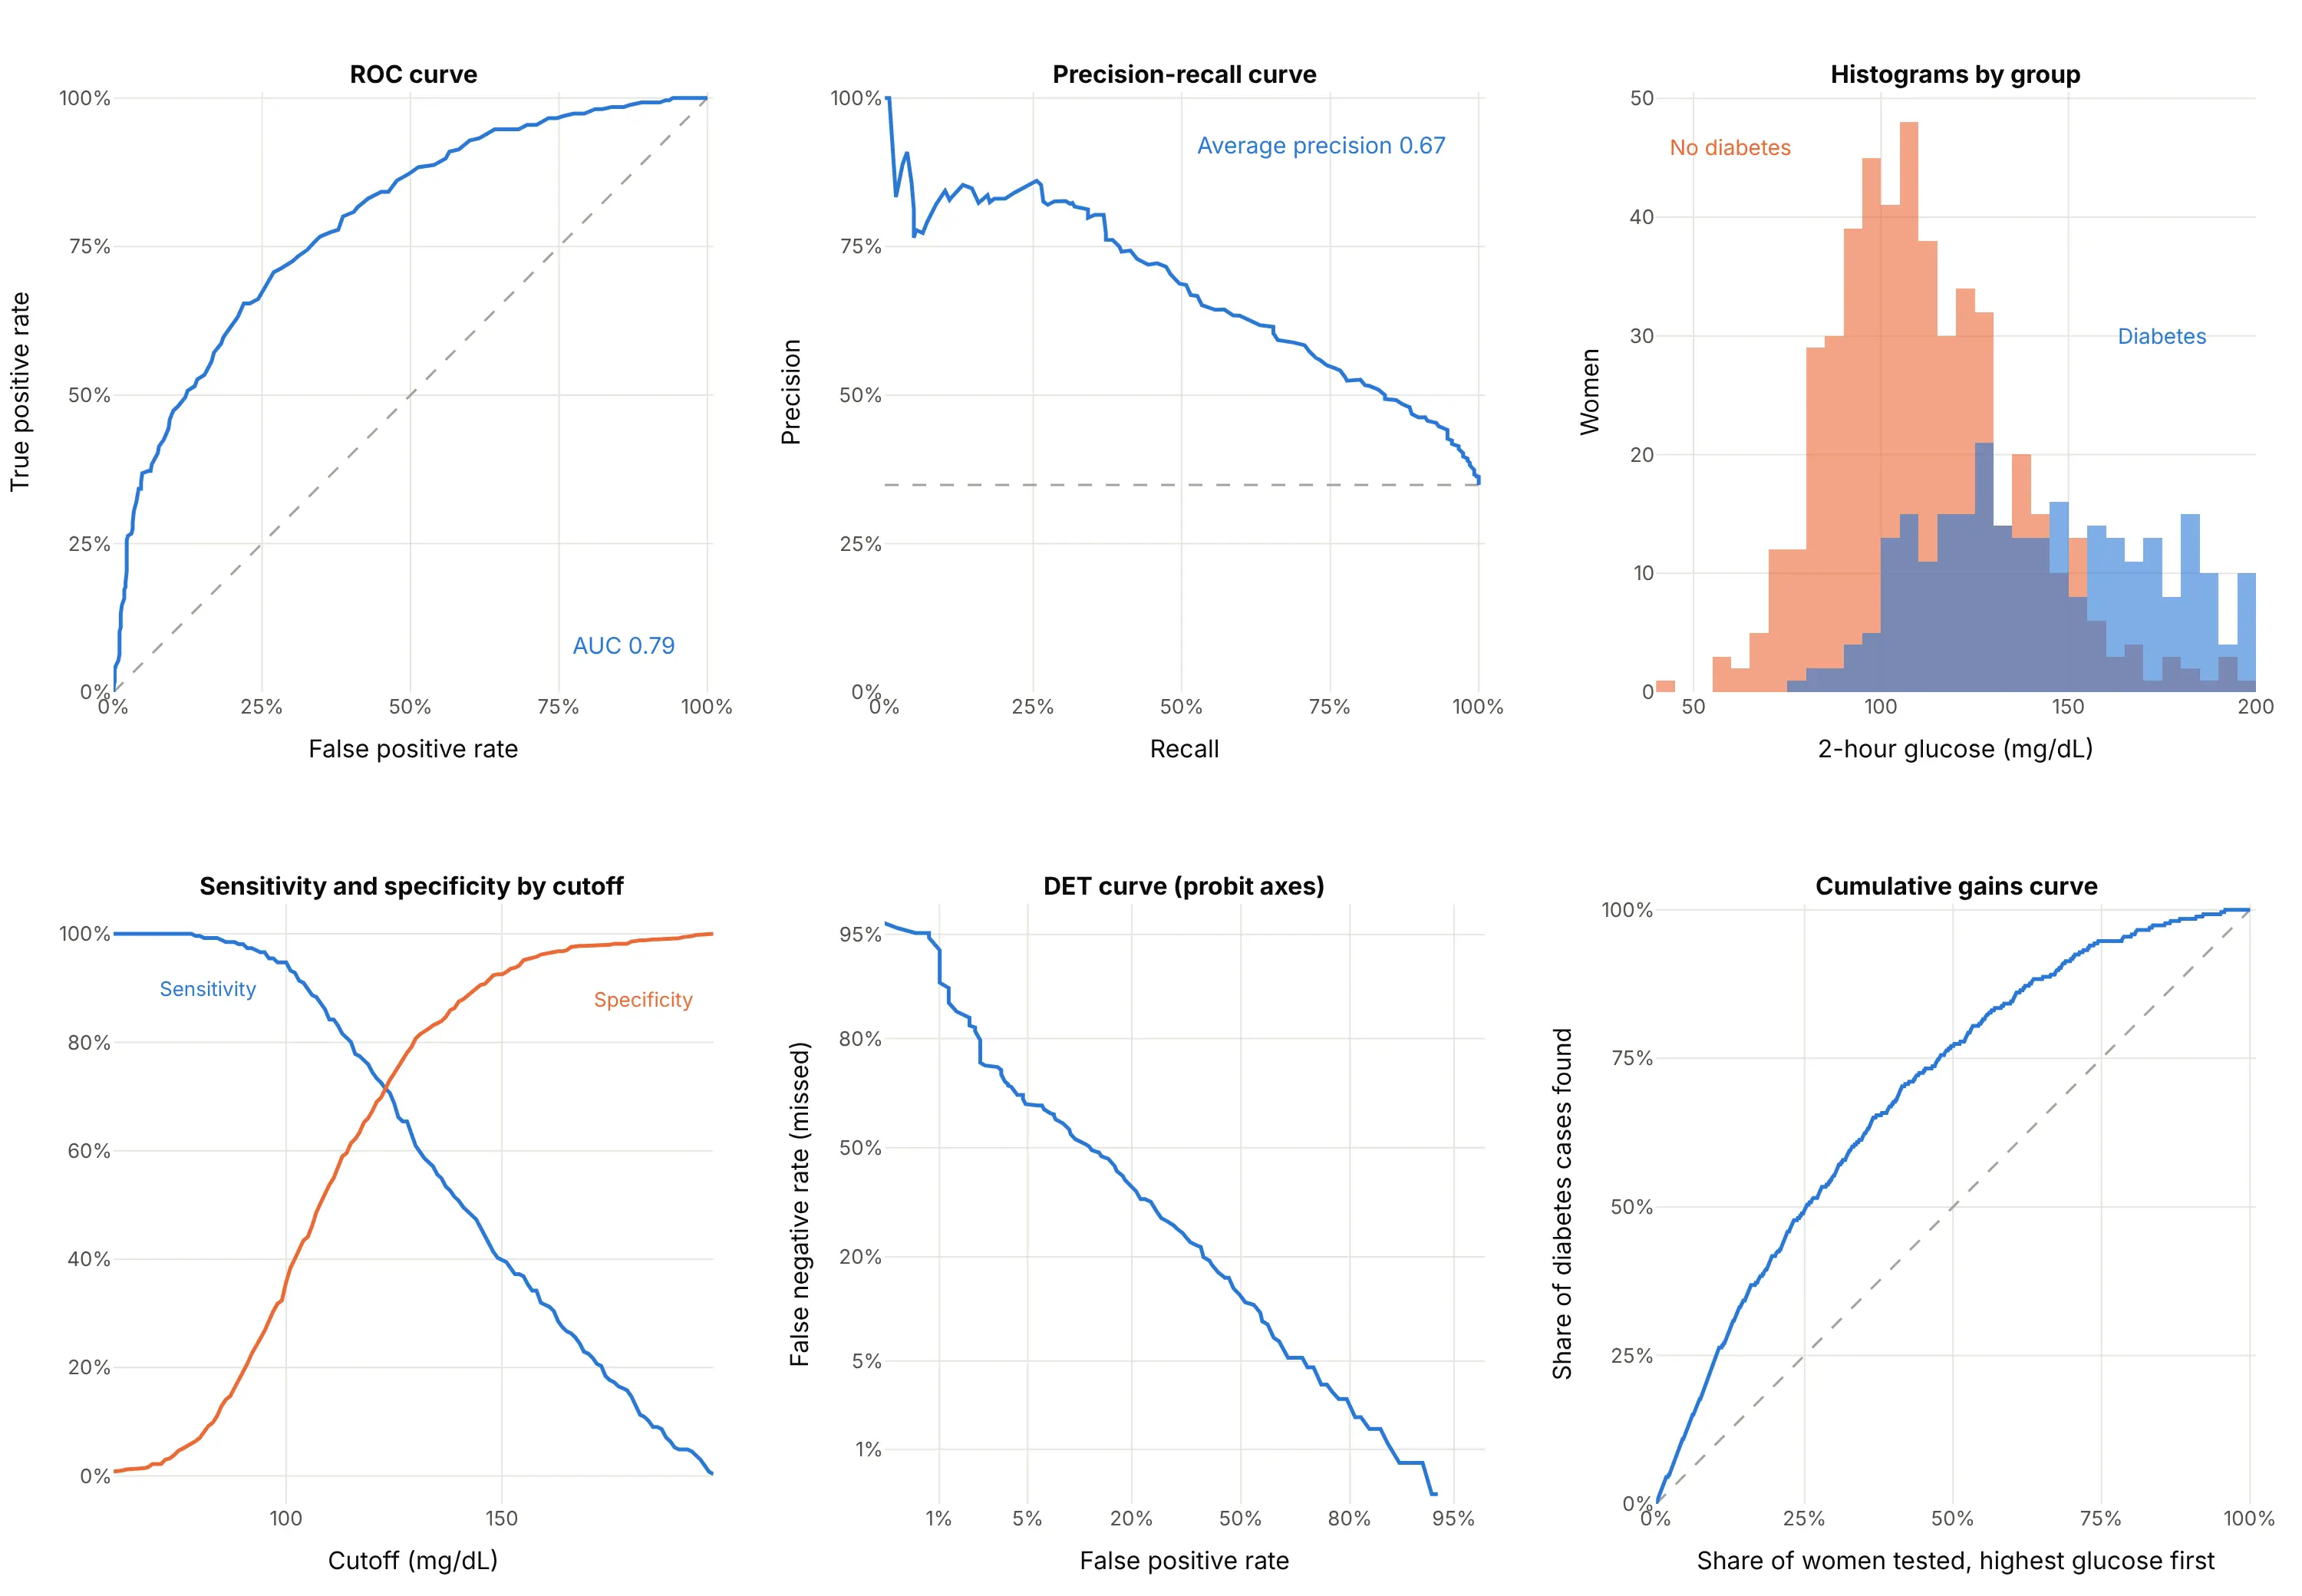
- Precision-recall curve (better when positives are rare). It plots the share of flagged cases that are real (precision) against sensitivity (recall). Because precision depends on how common the positives are, it shows what an ROC curve hides when they are rare (Saito and Rehmsmeier 2015); example 1 below draws both. Its no-skill line is the share of positives, here 35%, not a diagonal.
- Histograms of the score by group (works too, and better for explaining). They show the overlap that the ROC curve summarizes, and where a cutoff would fall, but comparing two tests needs two charts.
- Sensitivity and specificity by cutoff (better for picking a cutoff). The cutoff is on the x axis in the test's own units, so you can read the value to use. It can't compare tests measured in different units.
- Detection error tradeoff (DET) curve (different). It plots the miss rate against the false positive rate on probit (normal quantile) axes, which spreads out the low-error corners and turns a normal-shaped test into a straight line. It was introduced for evaluating speech technology at the Eurospeech 1997 conference.
- Cumulative gains or lift curve (different). It plots the share of positives found against the share of cases checked, highest score first, which answers "if we test the top 20%, how many cases do we find?"
- Confusion matrix (worse on its own). A 2 by 2 table of the four counts at one cutoff, such as the 135, 131, 62 and 435 above, gives exact numbers but no view of the other cutoffs.
How to make an ROC curve
With AI
ChatGPT, Claude Code, GitHub Copilot, Cursor and other AI tools are excellent at writing Plotly code. Name Plotly in the prompt, and say how the scores are computed so the curve isn't scored on training data:
Make a plotly ROC curve from scores.csv (columns: id, label with 1 for positive and 0 for negative,score from a model where higher means more likely positive).- Compute the curve with sklearn.metrics.roc_curve and the area with roc_auc_score.- Square plot area (yaxis scaleanchor="x"), both axes 0 to 1 as percentages, x titled"False positive rate (1 − specificity)" and y "True positive rate (sensitivity)".- A dashed diagonal for chance, the AUC to 3 decimals in the legend, and the cutoff in the hover text.- Mark the cutoff with the highest Youden's index (tpr − fpr) and label its sensitivity and specificity.- Check: print the AUC, the best cutoff and its sensitivity and specificity, and the number ofpositives and negatives.
With Plotly Studio
Plotly Studio is a desktop app where you point an AI at a dataset and it builds charts and a Dash app around your questions. Ask for an ROC curve the same way:
Train a logistic regression and a gradient boosting model to predict default from the other columns, and show their ROC curves on held-out data with the AUC of each in the legend, a slider for the cutoff that moves a marker along each curve, and a table of sensitivity, specificity and precision at that cutoff.
Make an ROC curve in Python or JavaScript
This is the code AI tools write under the hood. In Python, scikit-learn's roc_curve returns the false positive rate, the true positive rate and the cutoff at every point, and roc_auc_score the area. Plotly draws the curve as a scatter trace with a line. This example trains a model on the Wisconsin breast cancer data, which ships with scikit-learn:
import plotly.graph_objects as gofrom sklearn.datasets import load_breast_cancerfrom sklearn.linear_model import LogisticRegressionfrom sklearn.metrics import roc_auc_score, roc_curvefrom sklearn.model_selection import train_test_splitfrom sklearn.pipeline import make_pipelinefrom sklearn.preprocessing import StandardScalerX, y = load_breast_cancer(return_X_y=True) # the Wisconsin data; in scikit-learn, 1 = benigny = 1 - y # make malignant the positive classX_train, X_test, y_train, y_test = train_test_split(X, y, test_size=0.3, stratify=y, random_state=0)model = make_pipeline(StandardScaler(), LogisticRegression(max_iter=5000)).fit(X_train, y_train)scores = model.predict_proba(X_test)[:, 1] # probability of the positive classfpr, tpr, thresholds = roc_curve(y_test, scores)auc = roc_auc_score(y_test, scores)fig = go.Figure([go.Scatter(x=[0, 1], y=[0, 1], mode="lines", line=dict(dash="dash", color="gray"), name="Chance"),go.Scatter(x=fpr, y=tpr, mode="lines", name=f"Logistic regression (AUC {auc:.3f})",customdata=thresholds, hovertemplate="Cutoff %{customdata:.2f}<br>FPR %{x:.2f}<br>TPR %{y:.2f}"),])fig.update_layout(xaxis=dict(title="False positive rate (1 − specificity)", range=[0, 1], constrain="domain"),yaxis=dict(title="True positive rate (sensitivity)", range=[0, 1], scaleanchor="x", constrain="domain"),width=700, height=700,)fig.show()
On this 30% test split the AUC is 0.992. scaleanchor="x" keeps the plot square, so the diagonal is at 45°. Pass the scores, not the 0 or 1 predictions from model.predict: with predictions alone, the curve has a single cutoff and the AUC means little. For a single test such as a lab value, pass the measurement itself as the score. sklearn.metrics.RocCurveDisplay draws the same curve with matplotlib; using roc_curve and Plotly gives you hover labels with the cutoff, zoom into the corner and a chart that drops into a Dash app. For a precision-recall curve, swap in precision_recall_curve and average_precision_score.
In JavaScript, plotly.js draws an ROC curve from a scatter trace once you've counted the positives and negatives at each cutoff. This one uses the rating table from Hanley and McNeil's 1982 paper:
<div id="chart"></div><script src="https://cdn.plot.ly/plotly-4.1.1.min.js"></script><script>// One radiologist's ratings of 109 CT images (Hanley and McNeil 1982, Table I),// from 5 (definitely abnormal) down to 1 (definitely normal)const ratings = [5, 4, 3, 2, 1];const abnormal = [33, 11, 2, 2, 3]; // 51 patients with diseaseconst normal = [2, 11, 6, 6, 33]; // 58 patients without// Each rating used as a cutoff ("positive if rated this or higher") gives one pointconst total = a => a.reduce((s, v) => s + v, 0);let tp = 0, fp = 0;const x = [0], y = [0], text = [""];ratings.forEach((r, i) => {tp += abnormal[i]; fp += normal[i];x.push(fp / total(normal)); y.push(tp / total(abnormal)); text.push(`rated ${r} or higher`);});let auc = 0; // trapezoidal area, which equals the Wilcoxon statistic for ratingsfor (let i = 1; i < x.length; i++) auc += (x[i] - x[i - 1]) * (y[i] + y[i - 1]) / 2;Plotly.newPlot("chart", [{x: [0, 1], y: [0, 1], mode: "lines", line: {dash: "dash", color: "gray"}, name: "Chance"},{x, y, text, mode: "lines+markers", name: `Radiologist (AUC ${auc.toFixed(3)})`,hovertemplate: "%{text}<br>FPR %{x:.2f}<br>TPR %{y:.2f}<extra></extra>"}], {width: 650, height: 650,xaxis: {title: {text: "False positive rate (1 − specificity)"}, range: [0, 1], constrain: "domain"},yaxis: {title: {text: "True positive rate (sensitivity)"}, range: [0, 1], scaleanchor: "x", constrain: "domain"}});</script>
Share it
Every Plotly chart has a Share chart button (the cloud icon in its toolbar) that uploads it to Plotly Cloud and gives you a link. Only you can see it until you change its visibility.
For a live app, put the chart in a Dash app and publish it with the Plotly Cloud command-line interface (CLI). Coding agents can run these commands for you:
pip install "dash[cloud]"plotly user loginplotly app publish
If your data has to stay in your own cloud or data center, publish to Dash Enterprise instead.
Dos and don'ts
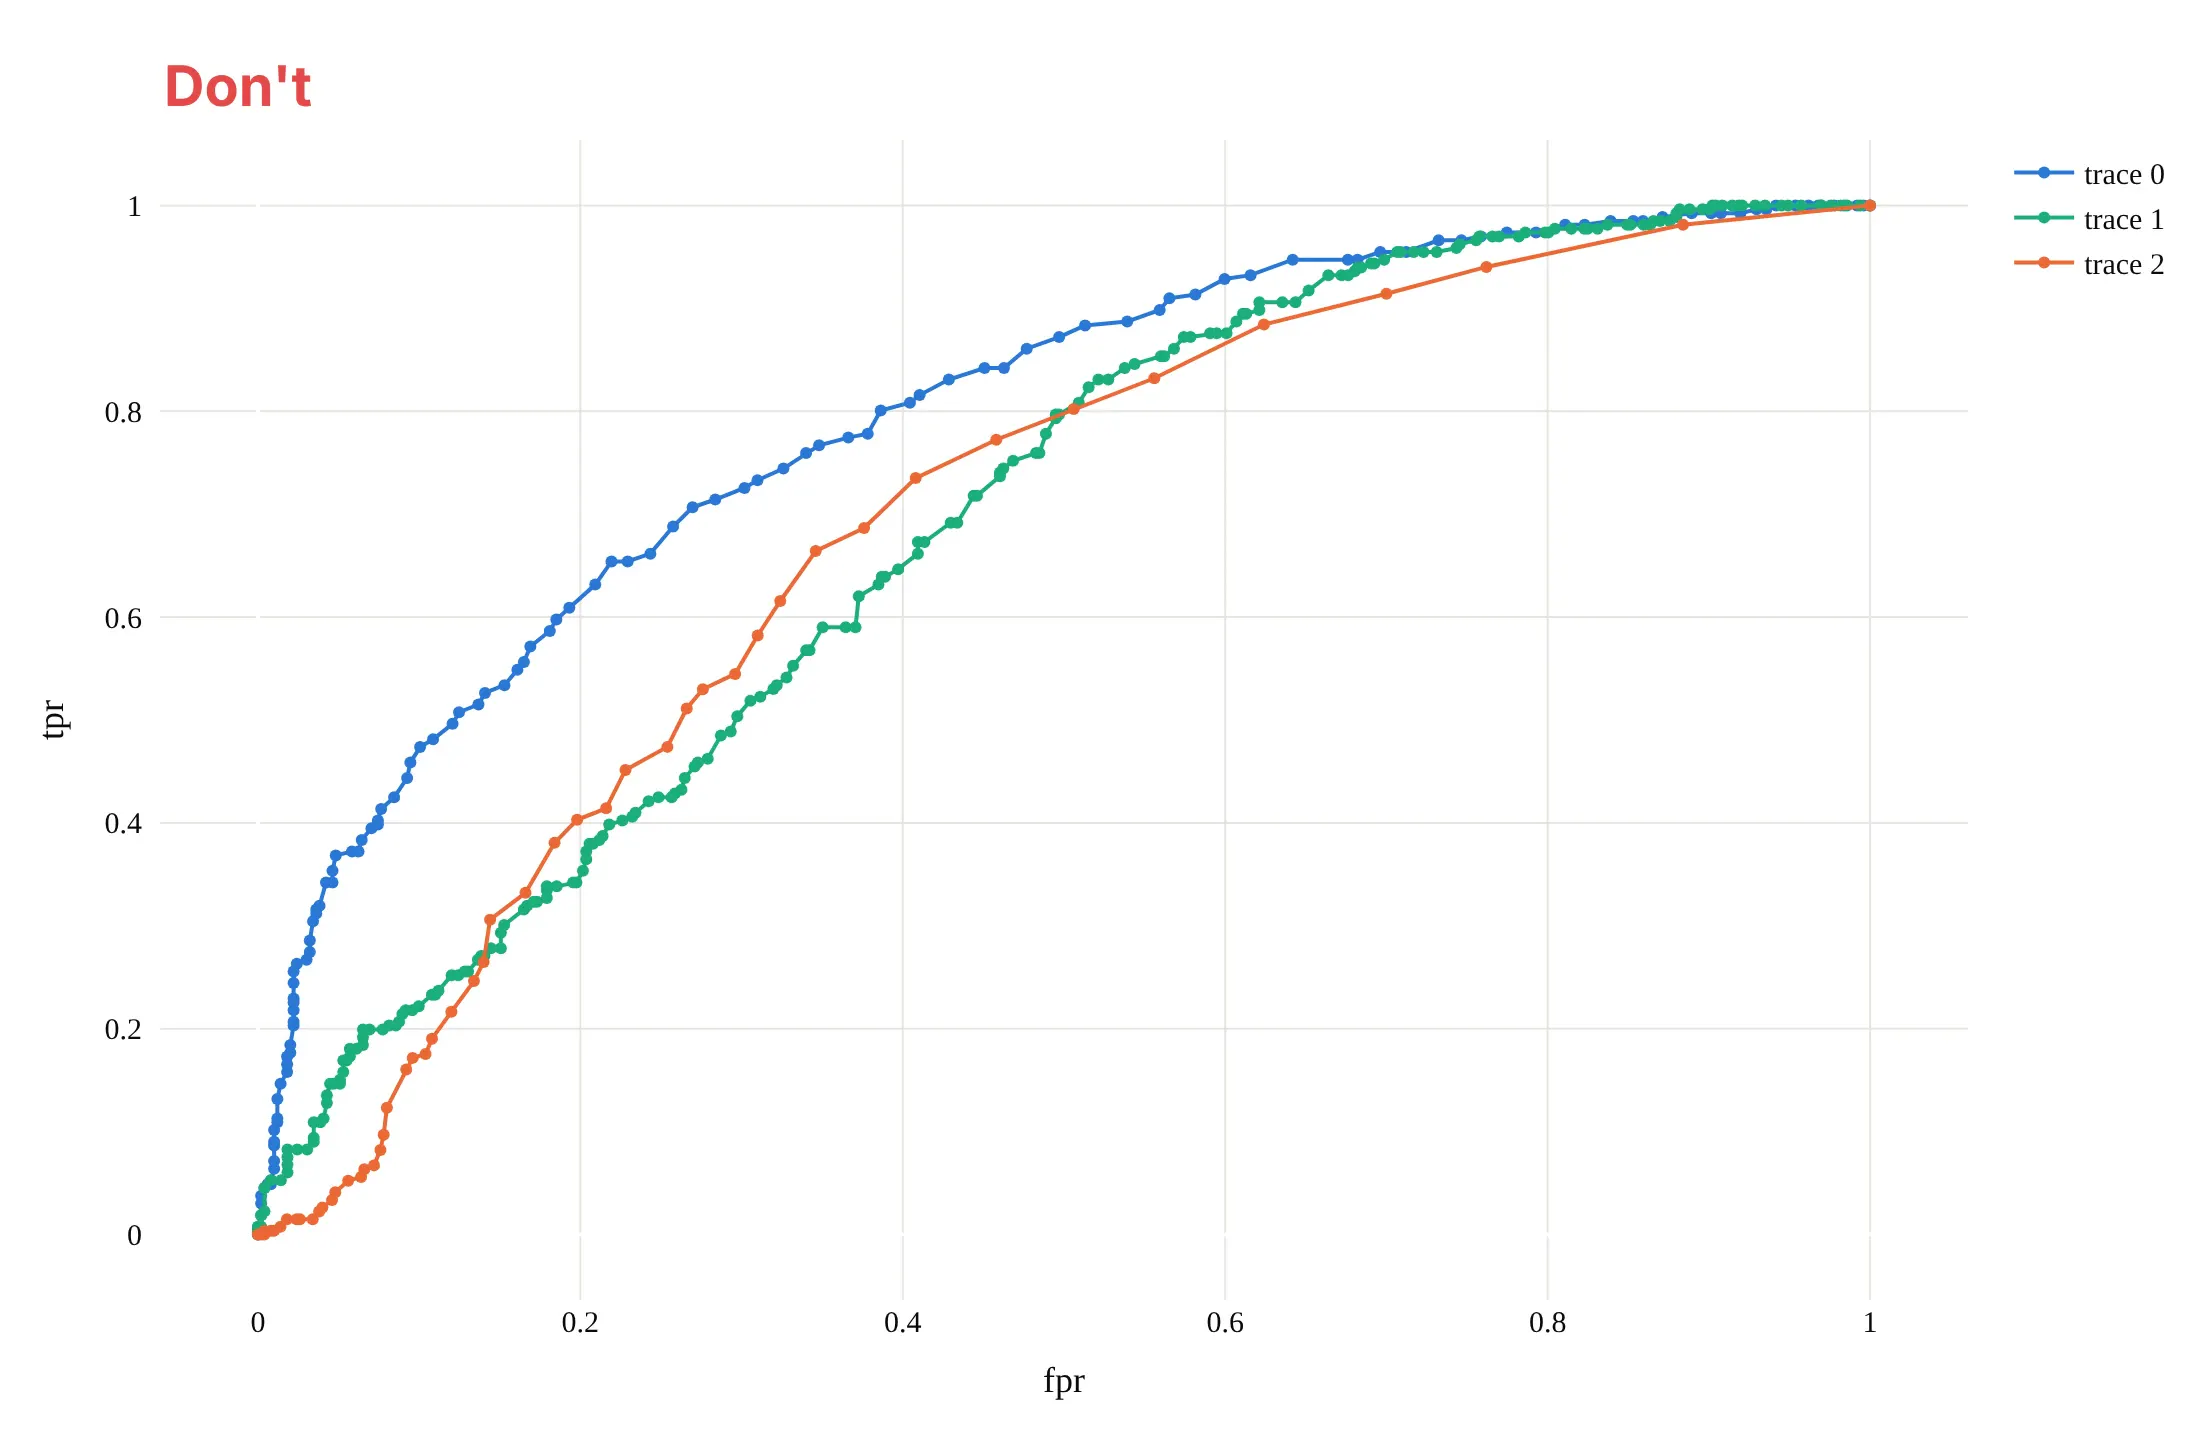
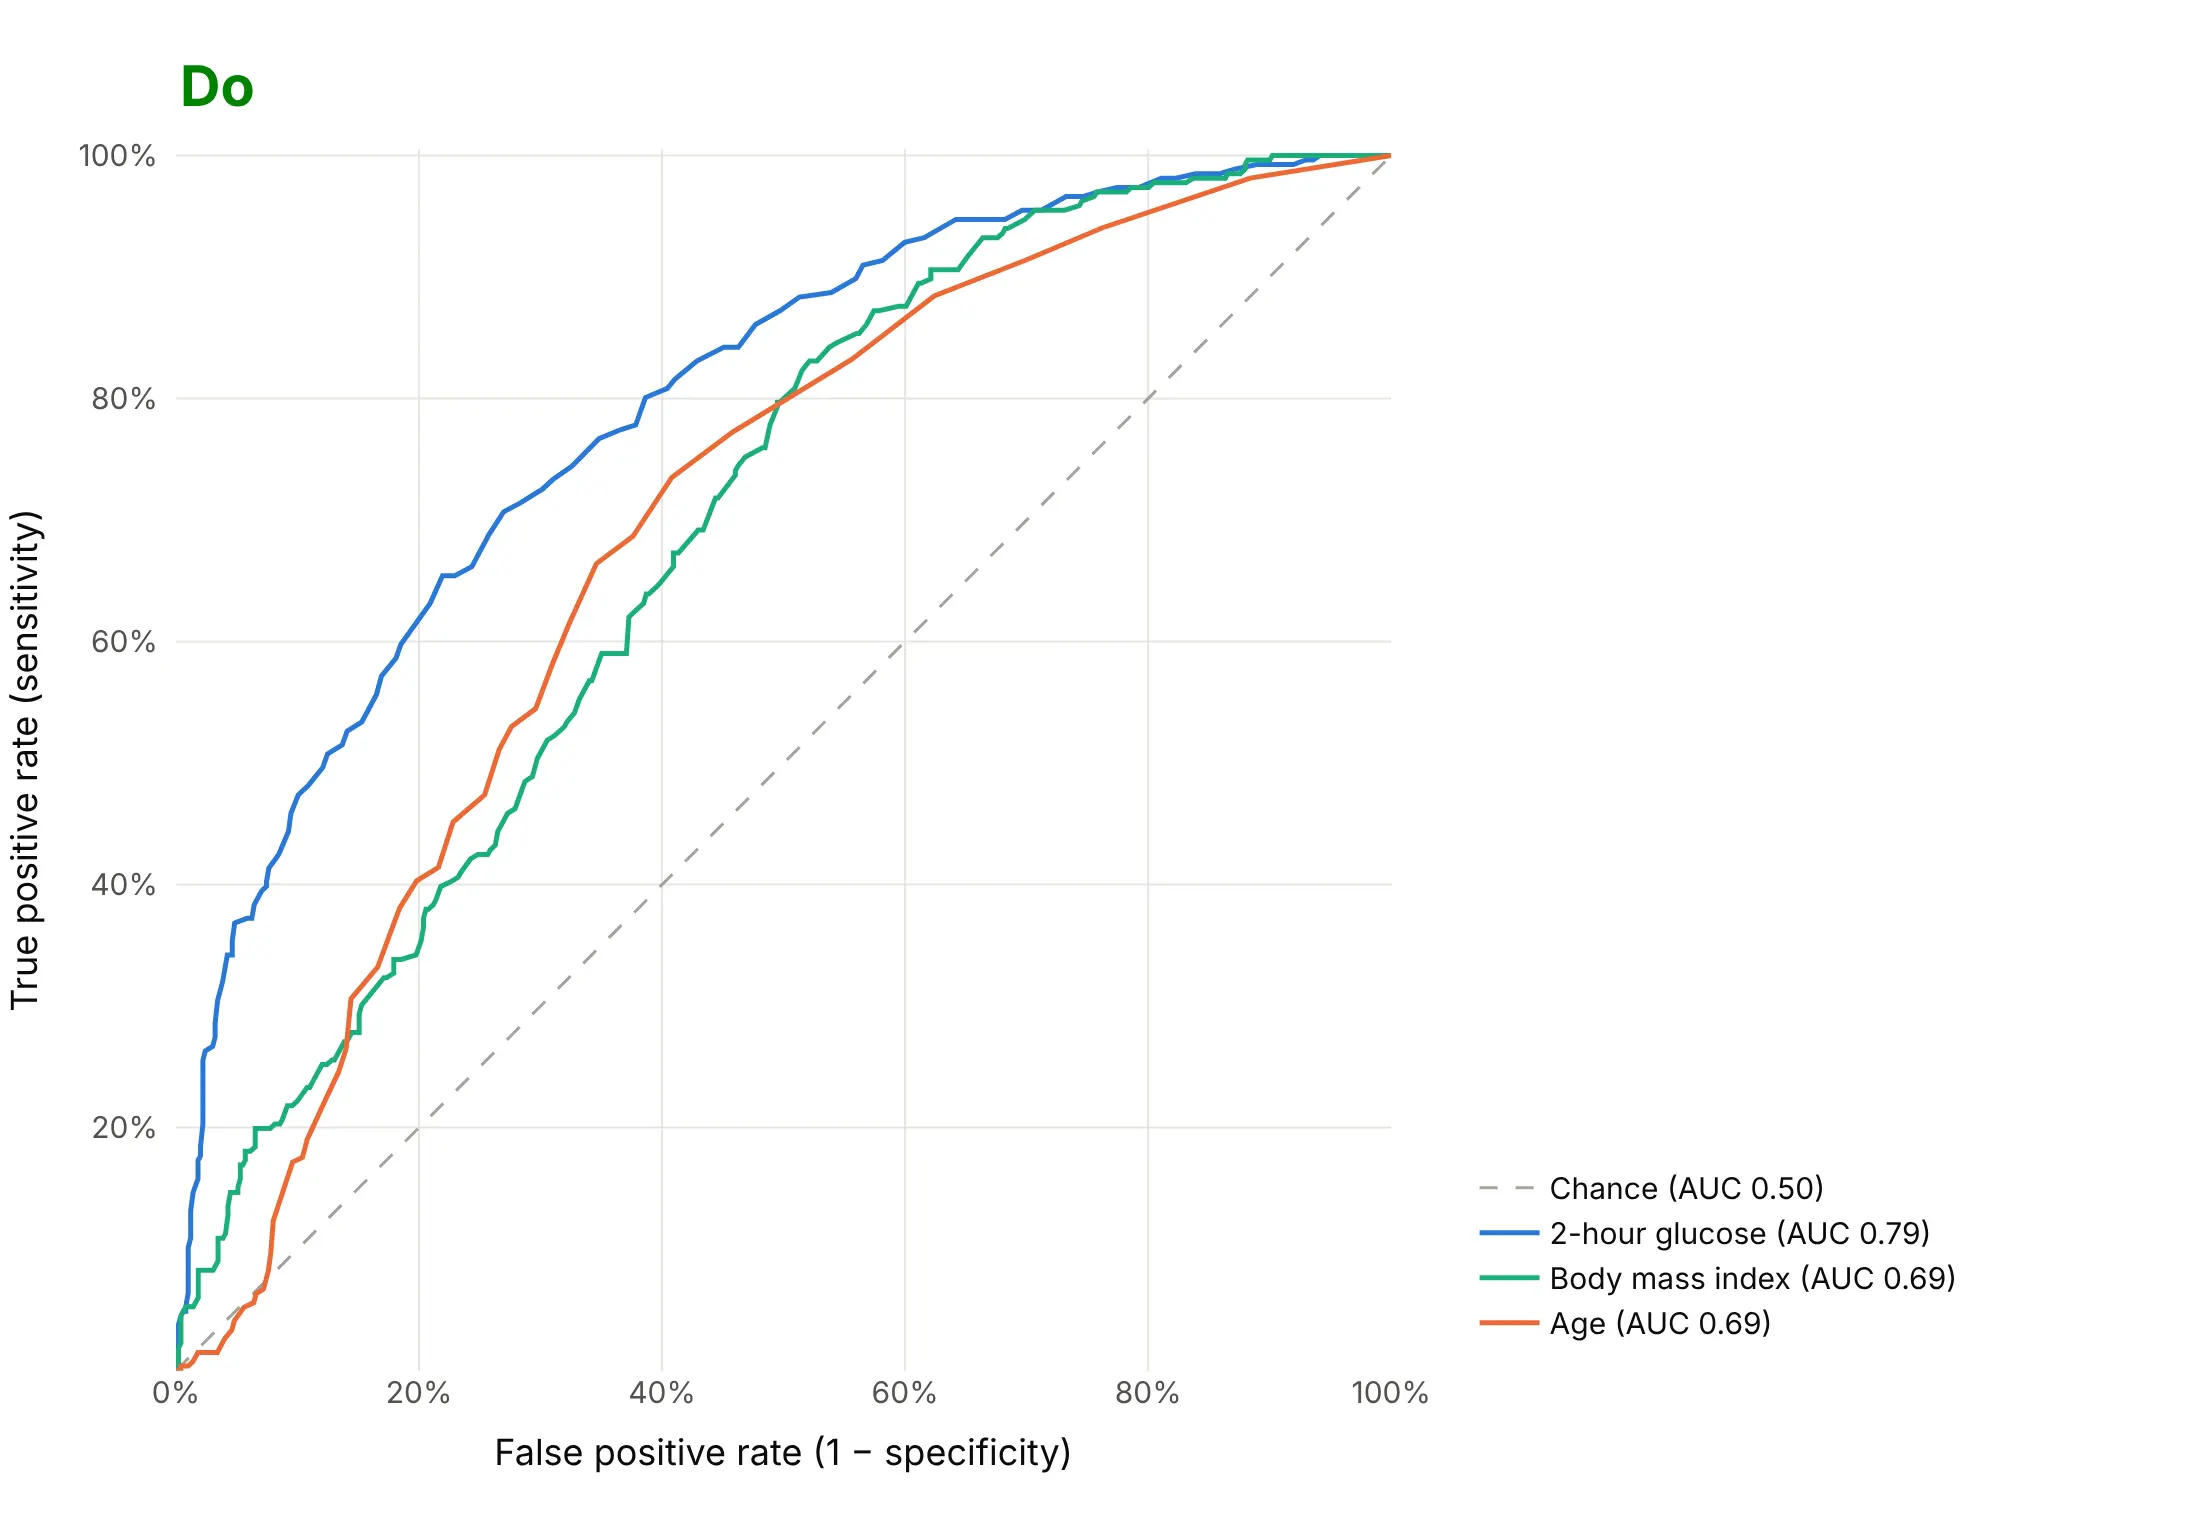
An ROC chart is read by comparing curves with the diagonal and with each other, so most of the work is keeping the geometry honest and the labels readable. Here are three single tests for diabetes, glucose, body mass index and age, both ways, in the same colors.
Don't stretch the plot into a wide rectangle, which bends the curves and hides the 45° diagonal, leave out the chance line, keep the raw names fpr, tpr and trace 0 as labels, draw a marker at every cutoff, or use a default serif font:
Do keep the plot square with both axes from 0% to 100%, draw the dashed diagonal, write the axis titles in words, and put each AUC in a legend sorted from best to worst:
Checklist
Do
- Score the curve on data the model never saw: a held-out test set, cross-validation or, for time series, later dates.
- Keep the axes square and from 0 to 1, with the dashed diagonal.
- Give the AUC, and the sensitivity and specificity at the cutoff you'll use, labeled in the test's own units.
- Report how many positives and negatives the curve is based on, and a confidence interval when there are only a few hundred.
- Add a precision-recall curve when positives are under about 10% of the data.
- Zoom in or use a log x axis when only low false positive rates matter.
Don't
- Compute the curve from 0 or 1 predictions; use the scores or probabilities.
- Rank models by AUC alone when their curves cross; say which part of the curve matters.
- Read a high AUC as good calibration: the AUC only checks ranking, not whether a predicted 20% risk is really 20%.
- Draw more than about seven curves on one chart; use small multiples instead.
Options to customize
An ROC curve in Plotly is a scatter trace of computed rates plus a line, so these are the options that matter most. The full lists are in the scatter trace reference, the layout axis reference and scikit-learn's roc_curve documentation.
- sklearn.metrics.roc_curve(y_true, y_score, drop_intermediate=True): false positive rates, true positive rates and cutoffs; drop_intermediate drops points that don't change the shape.
- roc_auc_score(..., multi_class="ovr", max_fpr=...): the area, one-vs-rest for several classes, or a standardized partial area up to max_fpr.
- precision_recall_curve and average_precision_score: the precision-recall curve and its summary for the same scores.
- yaxis.scaleanchor="x" with constrain="domain": a square plot area, so the diagonal is at 45° whatever the figure size.
- xaxis.range=[0, 1], tickformat=".0%": both axes from 0 to 1, shown as percentages.
- xaxis.type="log": a log false positive axis for detection problems where only rates under a few percent matter.
- A mode="lines" trace from (0, 0) to (1, 1) with line_dash="dash": the chance diagonal.
- customdata and hovertemplate: the cutoff of every point in the hover label, in the score's own units.
- add_annotation with ax, ay: labels with leader lines on the cutoffs that matter.
- fill="tozeroy": shades the area under one curve; fill="tonexty" between two traces draws a confidence band.
- make_subplots: the full curve next to a zoom of its top-left corner, or an ROC curve next to a precision-recall curve.
- legend entries with the AUC in the name, sorted from best to worst, so the order of the legend matches the order of the curves.
More ROC curve examples
Six more ROC curves built from real public data, each with its source, the technique that makes it work and a prompt to rebuild it.
1. HIV antiviral screen: ROC curve against precision-recall curve
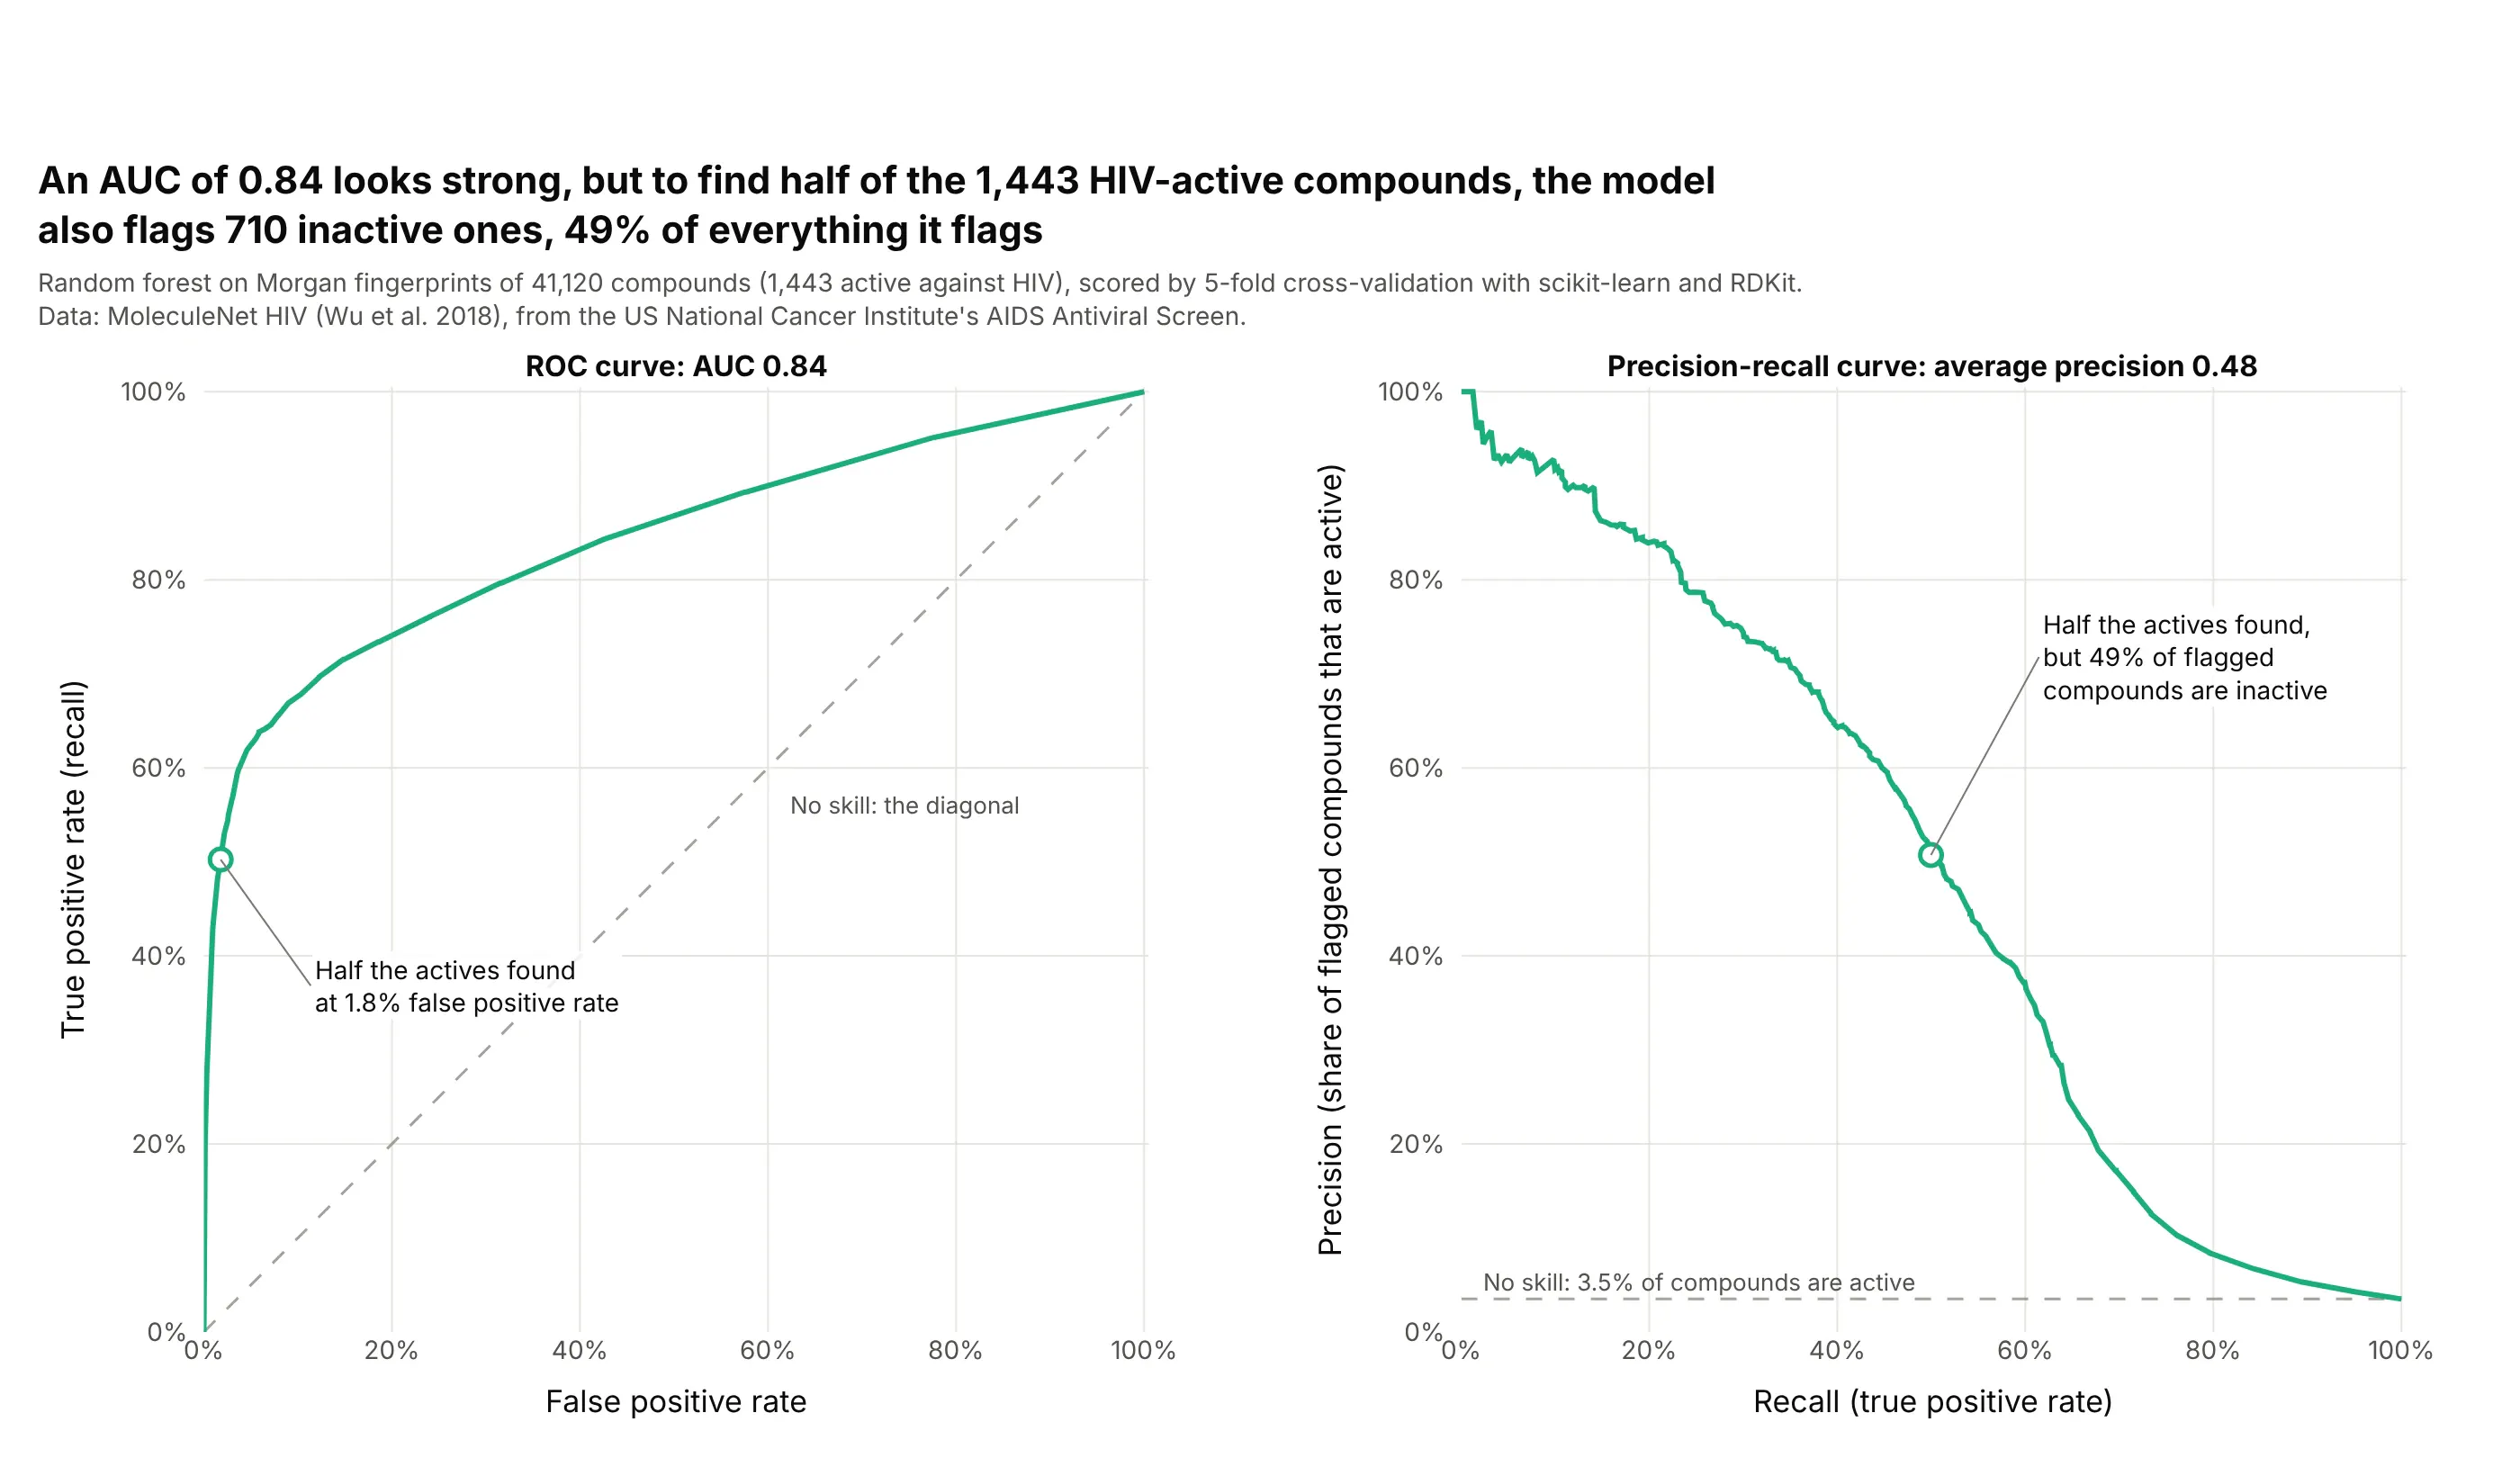
Only 3.5% of the 41,120 compounds are active, so the model's AUC of 0.84 hides how many inactive compounds come along. To find half of the 1,443 actives, it flags just 1.8% of the inactives, but that is 710 compounds, 49% of everything flagged, which the precision-recall curve shows directly. Data: MoleculeNet HIV (Wu et al. 2018), from the US National Cancer Institute's AIDS Antiviral Screen; model trained with scikit-learn and RDKit.
Tip: with rare positives, show the precision-recall curve next to the ROC curve and draw the no-skill line at the share of positives.
Get the data from the MoleculeNet HIV data set (US National Cancer Institute AIDS Antiviral Screen, 41,127compounds; deepchemdata HIV.csv) (columns: smiles, activity, HIV_active).Compute 2,048-bit Morgan fingerprints (radius 2) with RDKit, score every compound with a scikit-learn randomforest by 5-fold stratified cross-validation, and build two square plotly panels: the ROC curve and theprecision-recall curve, each with its no-skill line dashed and its AUC or average precision in the title,and the cutoff that finds half the actives marked on both.
2. Office occupancy from building sensors
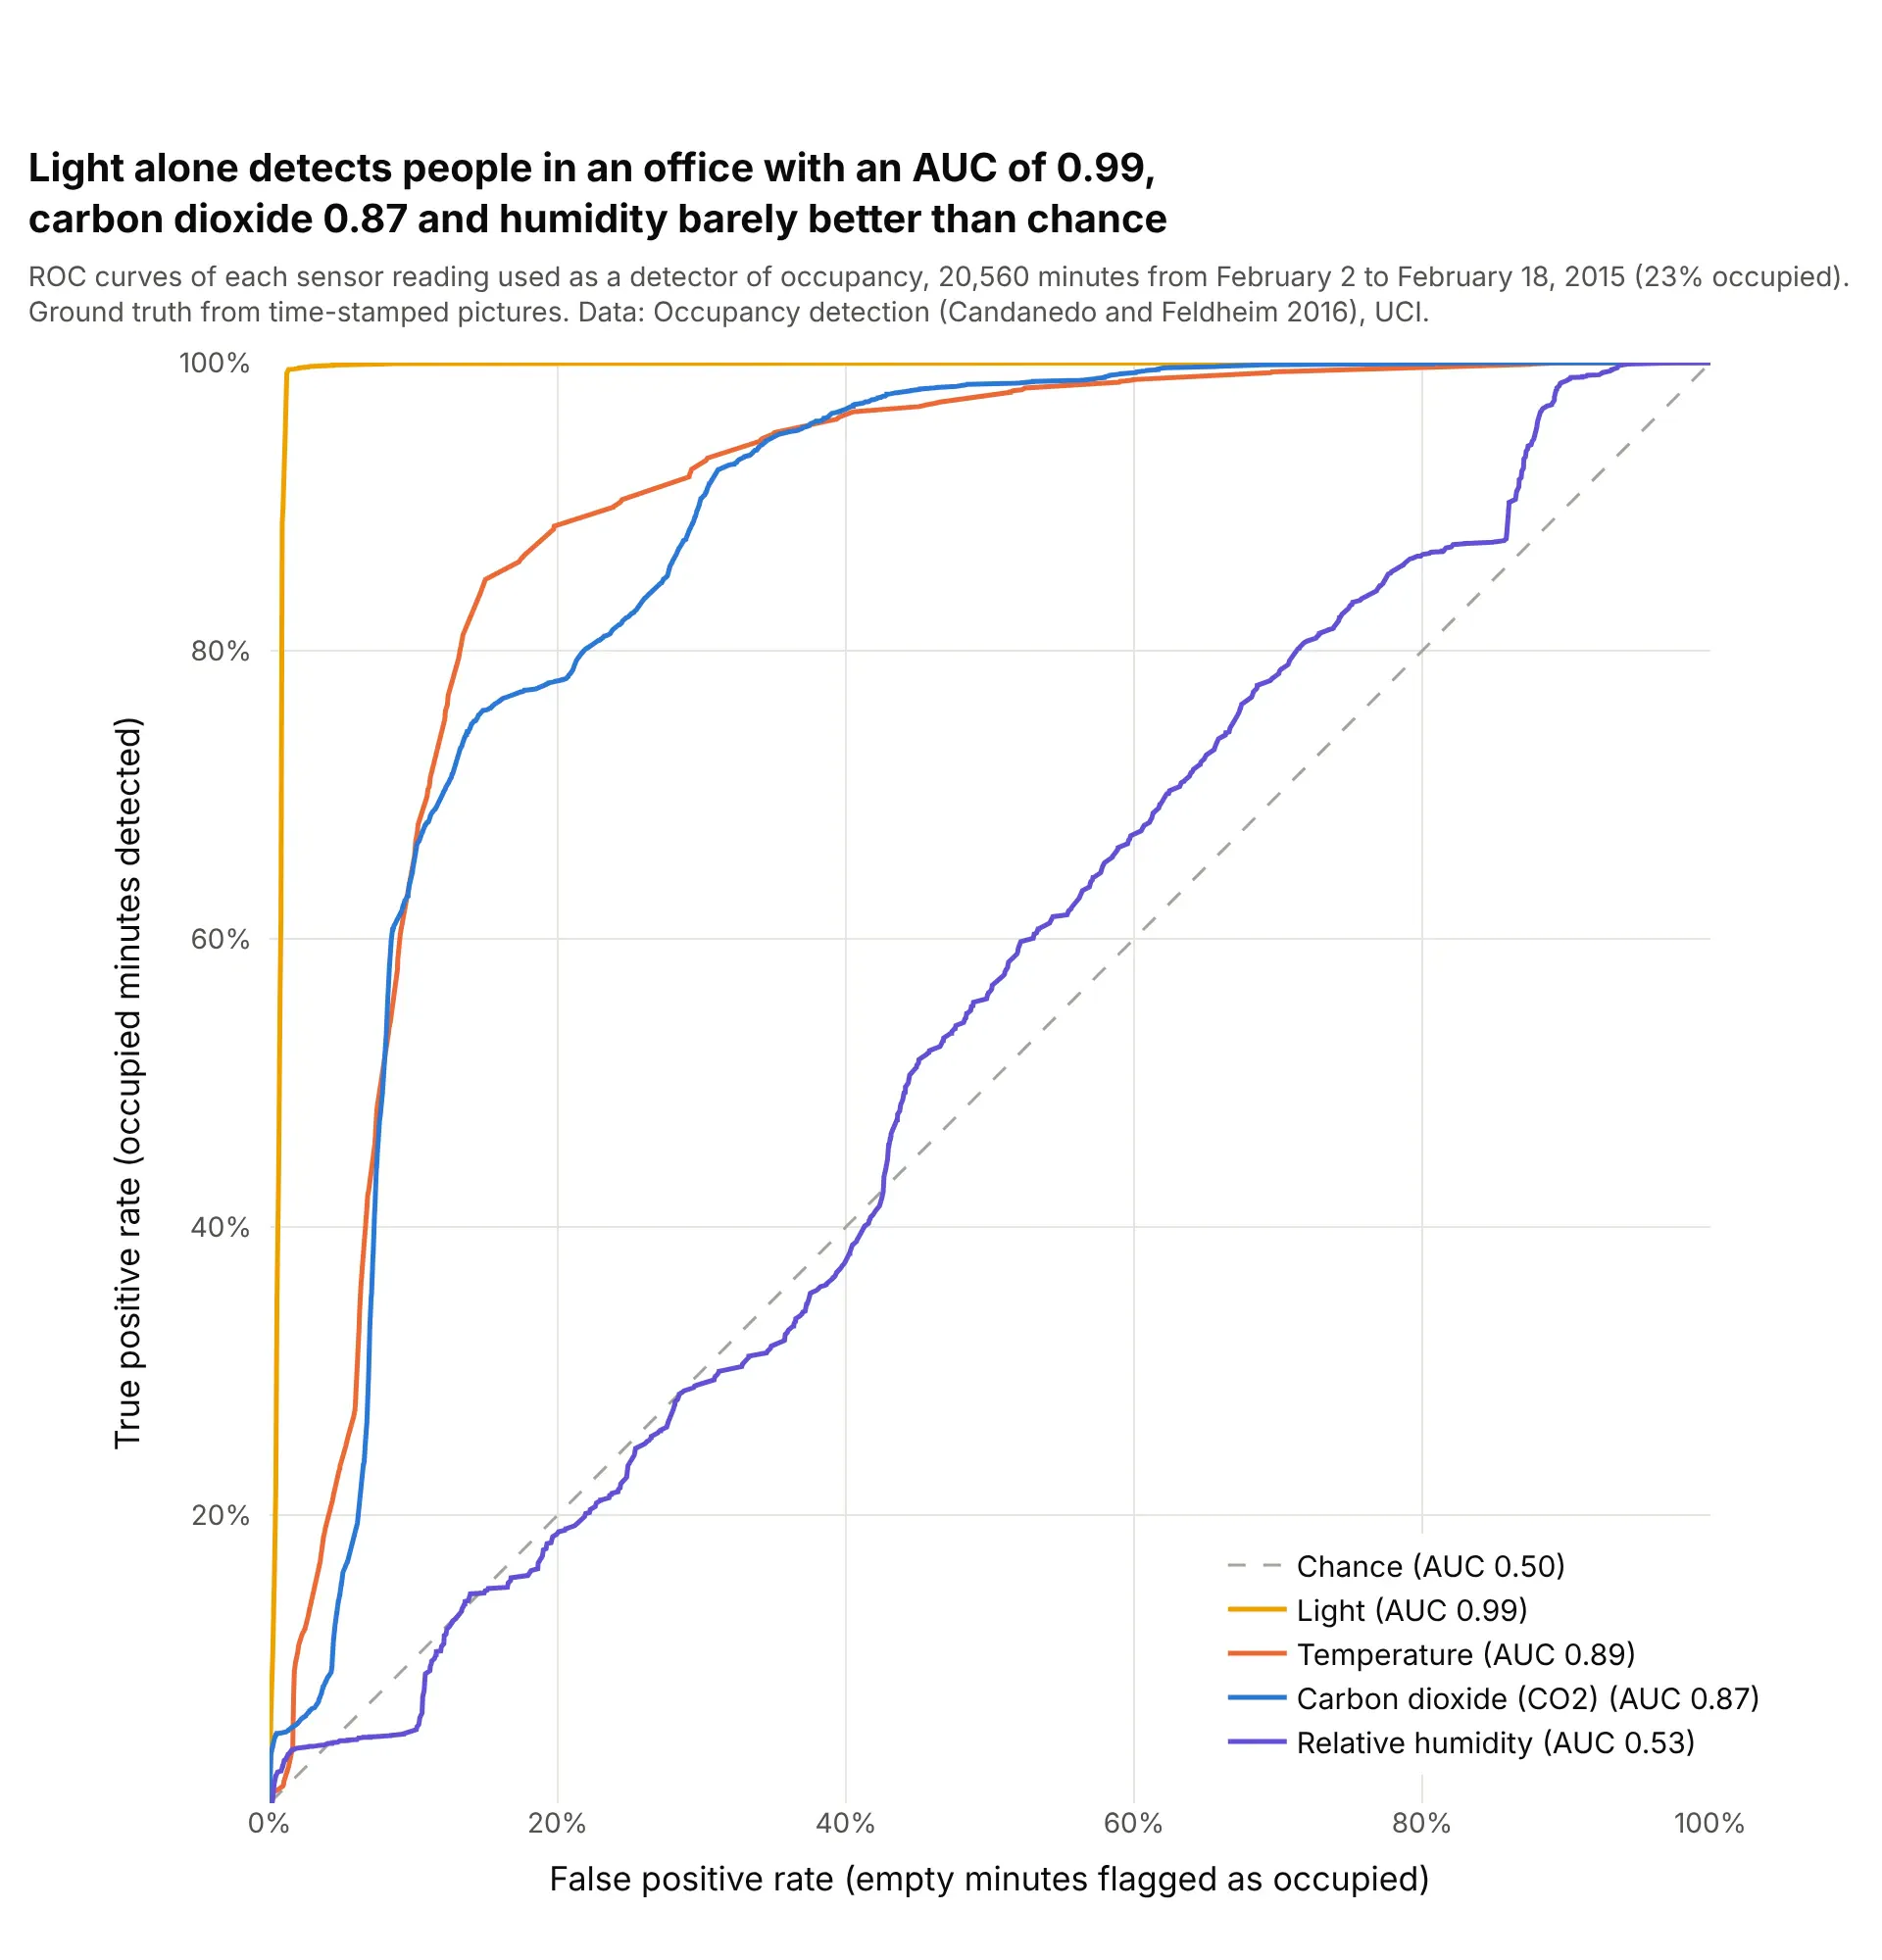
Used directly as a detector, with no model, the light sensor reaches an AUC of 0.99: at 366 lux or more it finds 99.5% of the occupied minutes and flags 1.3% of the empty ones. Temperature (0.89) and carbon dioxide (0.87) do well too, while relative humidity, at 0.53, carries almost no information on its own. Data: Occupancy detection (Candanedo and Feldheim 2016), UCI.
Tip: sensor readings in different units compare on one ROC chart, so put each cutoff in its own unit in the hover text.
Get the data from the UCI Machine Learning Repository data set "Occupancy detection" (Candanedo and Feldheim2016; datatraining.txt, datatest.txt and datatest2.txt combined) (columns: date, temperature, humidity, light,co2, humidityratio, occupancy).Build a plotly ROC chart with one curve per sensor reading used directly as the score for occupancy, AUC ineach legend entry sorted from best to worst, the cutoff and its unit (lux, ppm, °C, %) in the hover text, adashed diagonal and square axes.
3. Steel plate faults: one curve per class
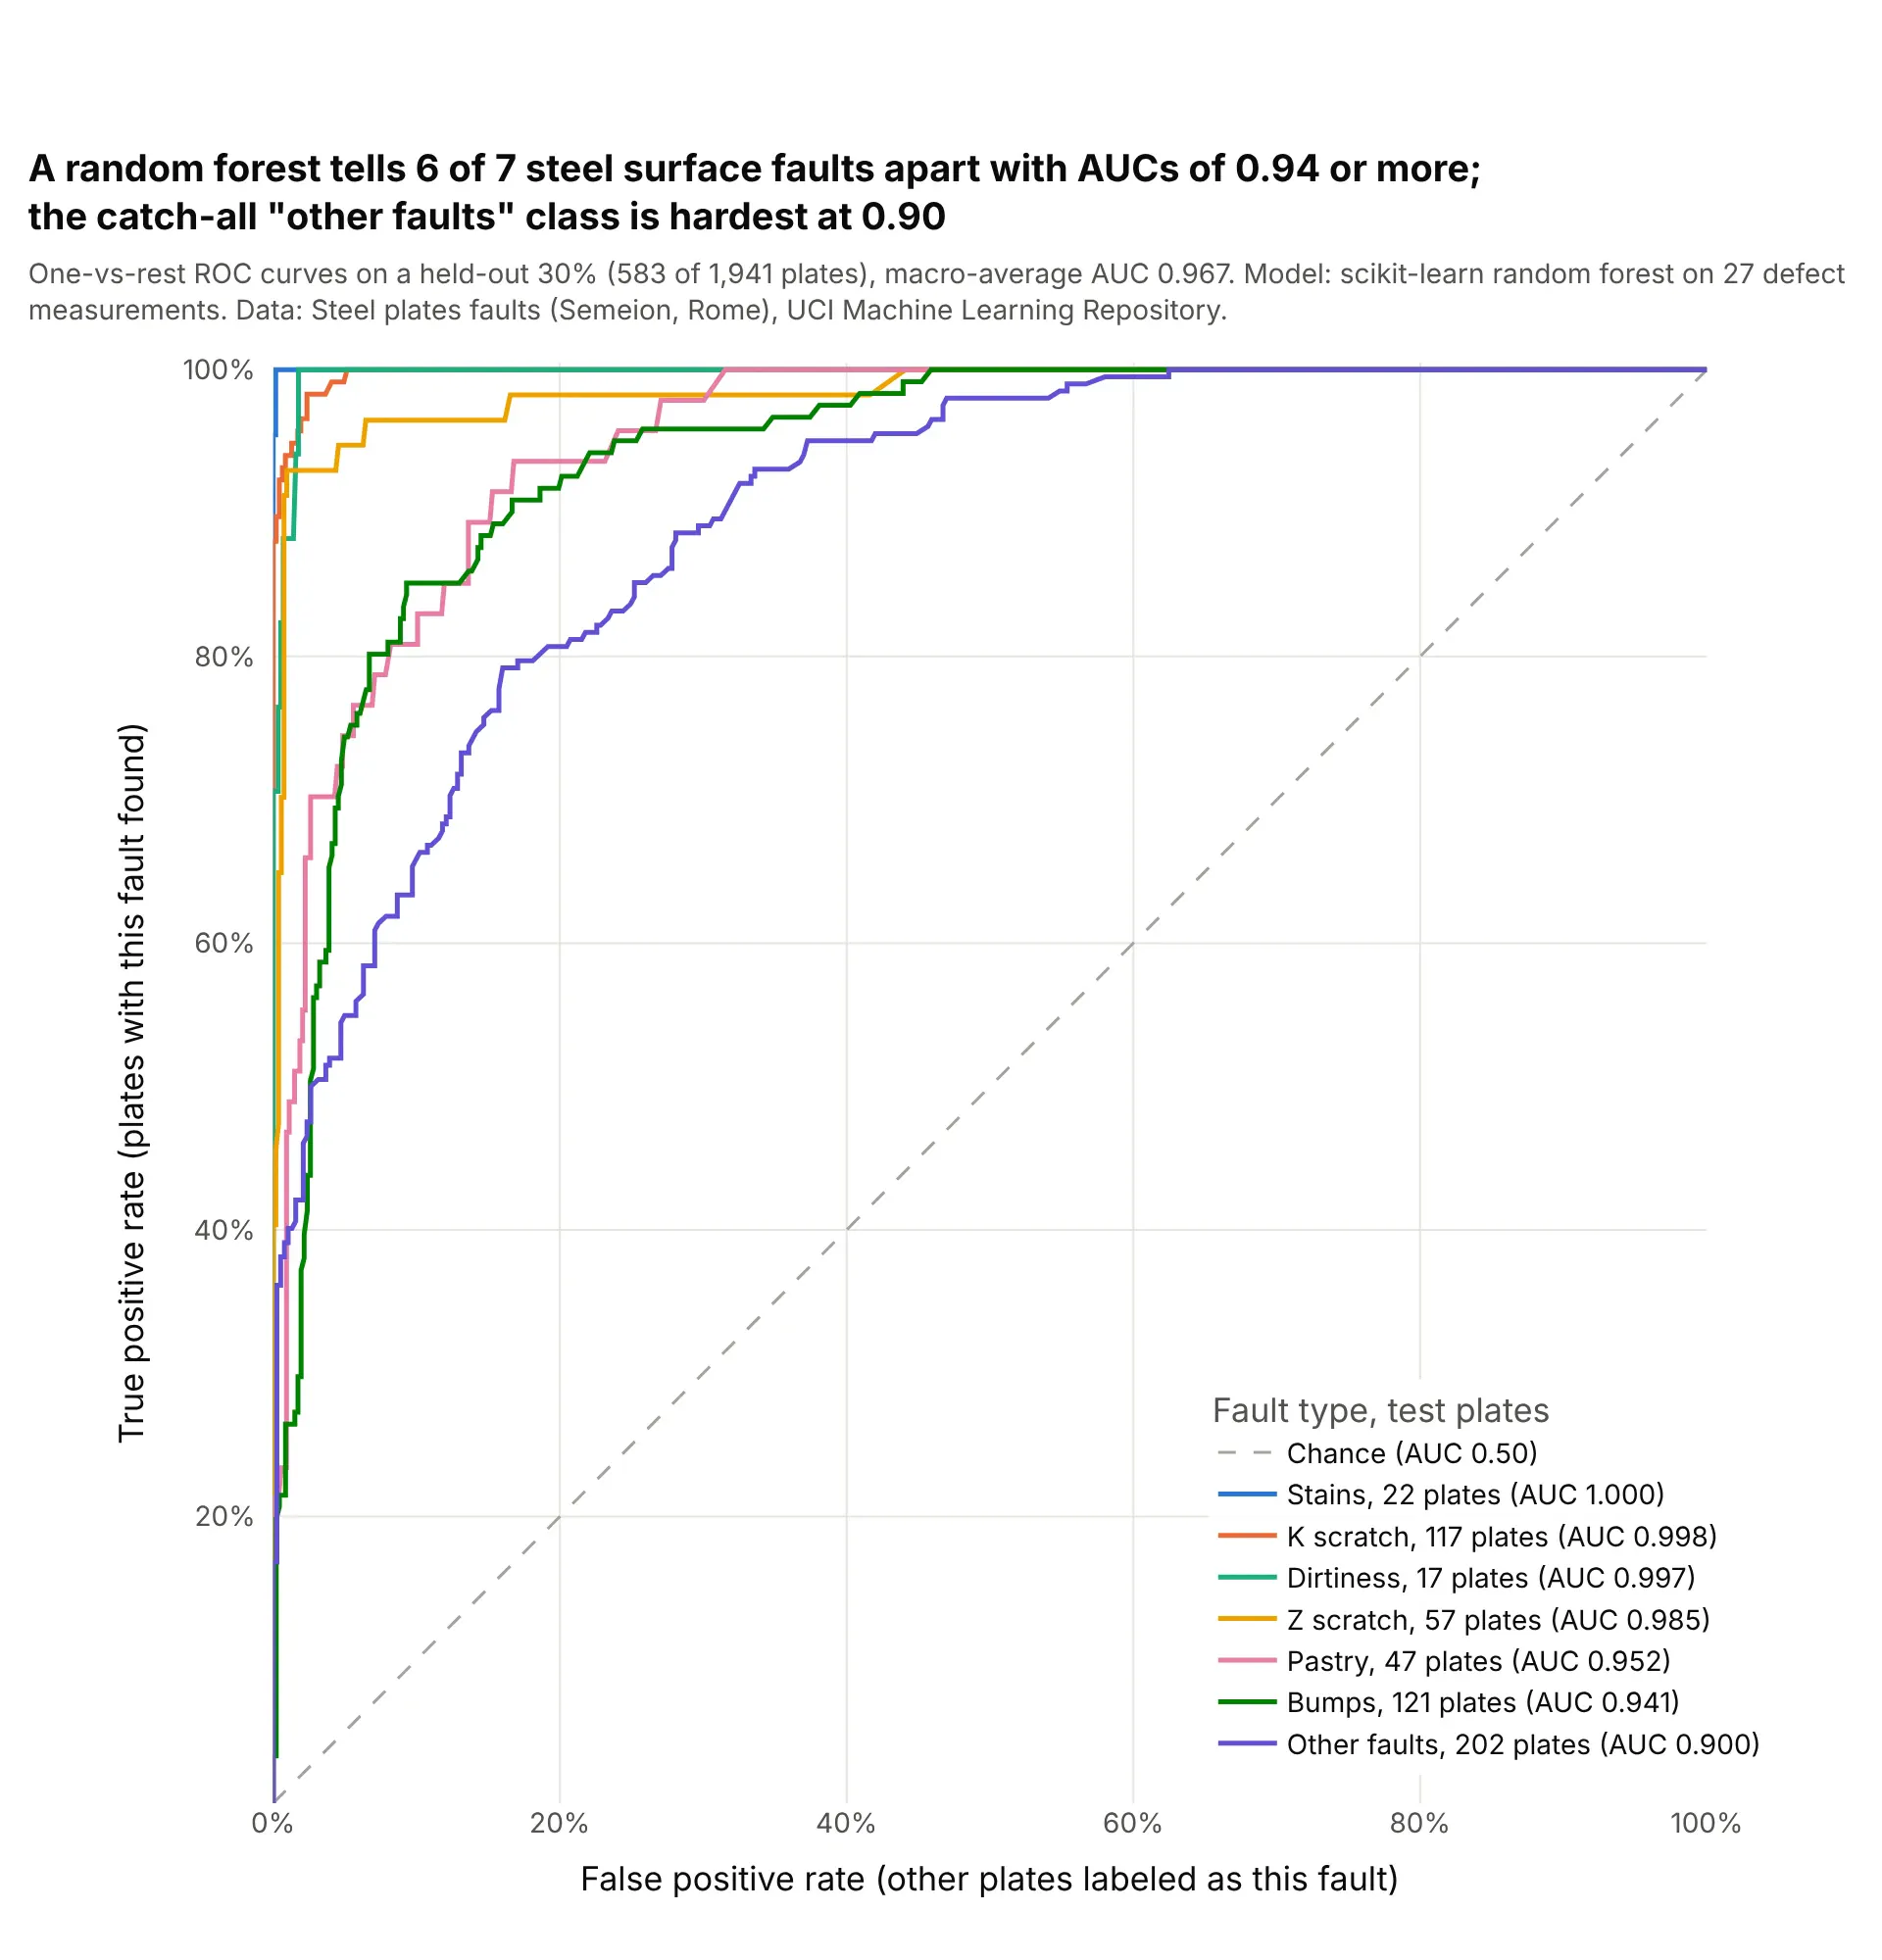
Six of seven fault types score an AUC of 0.94 or more against all the others, while the catch-all "other faults" class, the largest with 202 test plates, scores 0.90. scikit-learn's macro-average of the seven one-vs-rest AUCs is 0.967. Data: Steel plates faults (Semeion, Research Center of Sciences of Communication, Rome), UCI.
Tip: for several classes, draw one-vs-rest curves and put the number of test cases of each class in the legend, because a curve from 17 cases is much less certain than one from 202.
Get the data from the UCI Machine Learning Repository data set "Steel plates faults" (Semeion; Faults.NNA withthe 34 column names in Faults27x7_var) (columns: 27 measurements, then 7 one-hot fault columns).Train a scikit-learn random forest on 70% (stratified, random_state 0) and build a plotly chart of one-vs-restROC curves on the other 30%, one per fault type, legend sorted by AUC with the number of test plates of eachtype, and the macro-average AUC from roc_auc_score(multi_class="ovr") in the subtitle.
4. Heart disease with a bootstrap confidence band
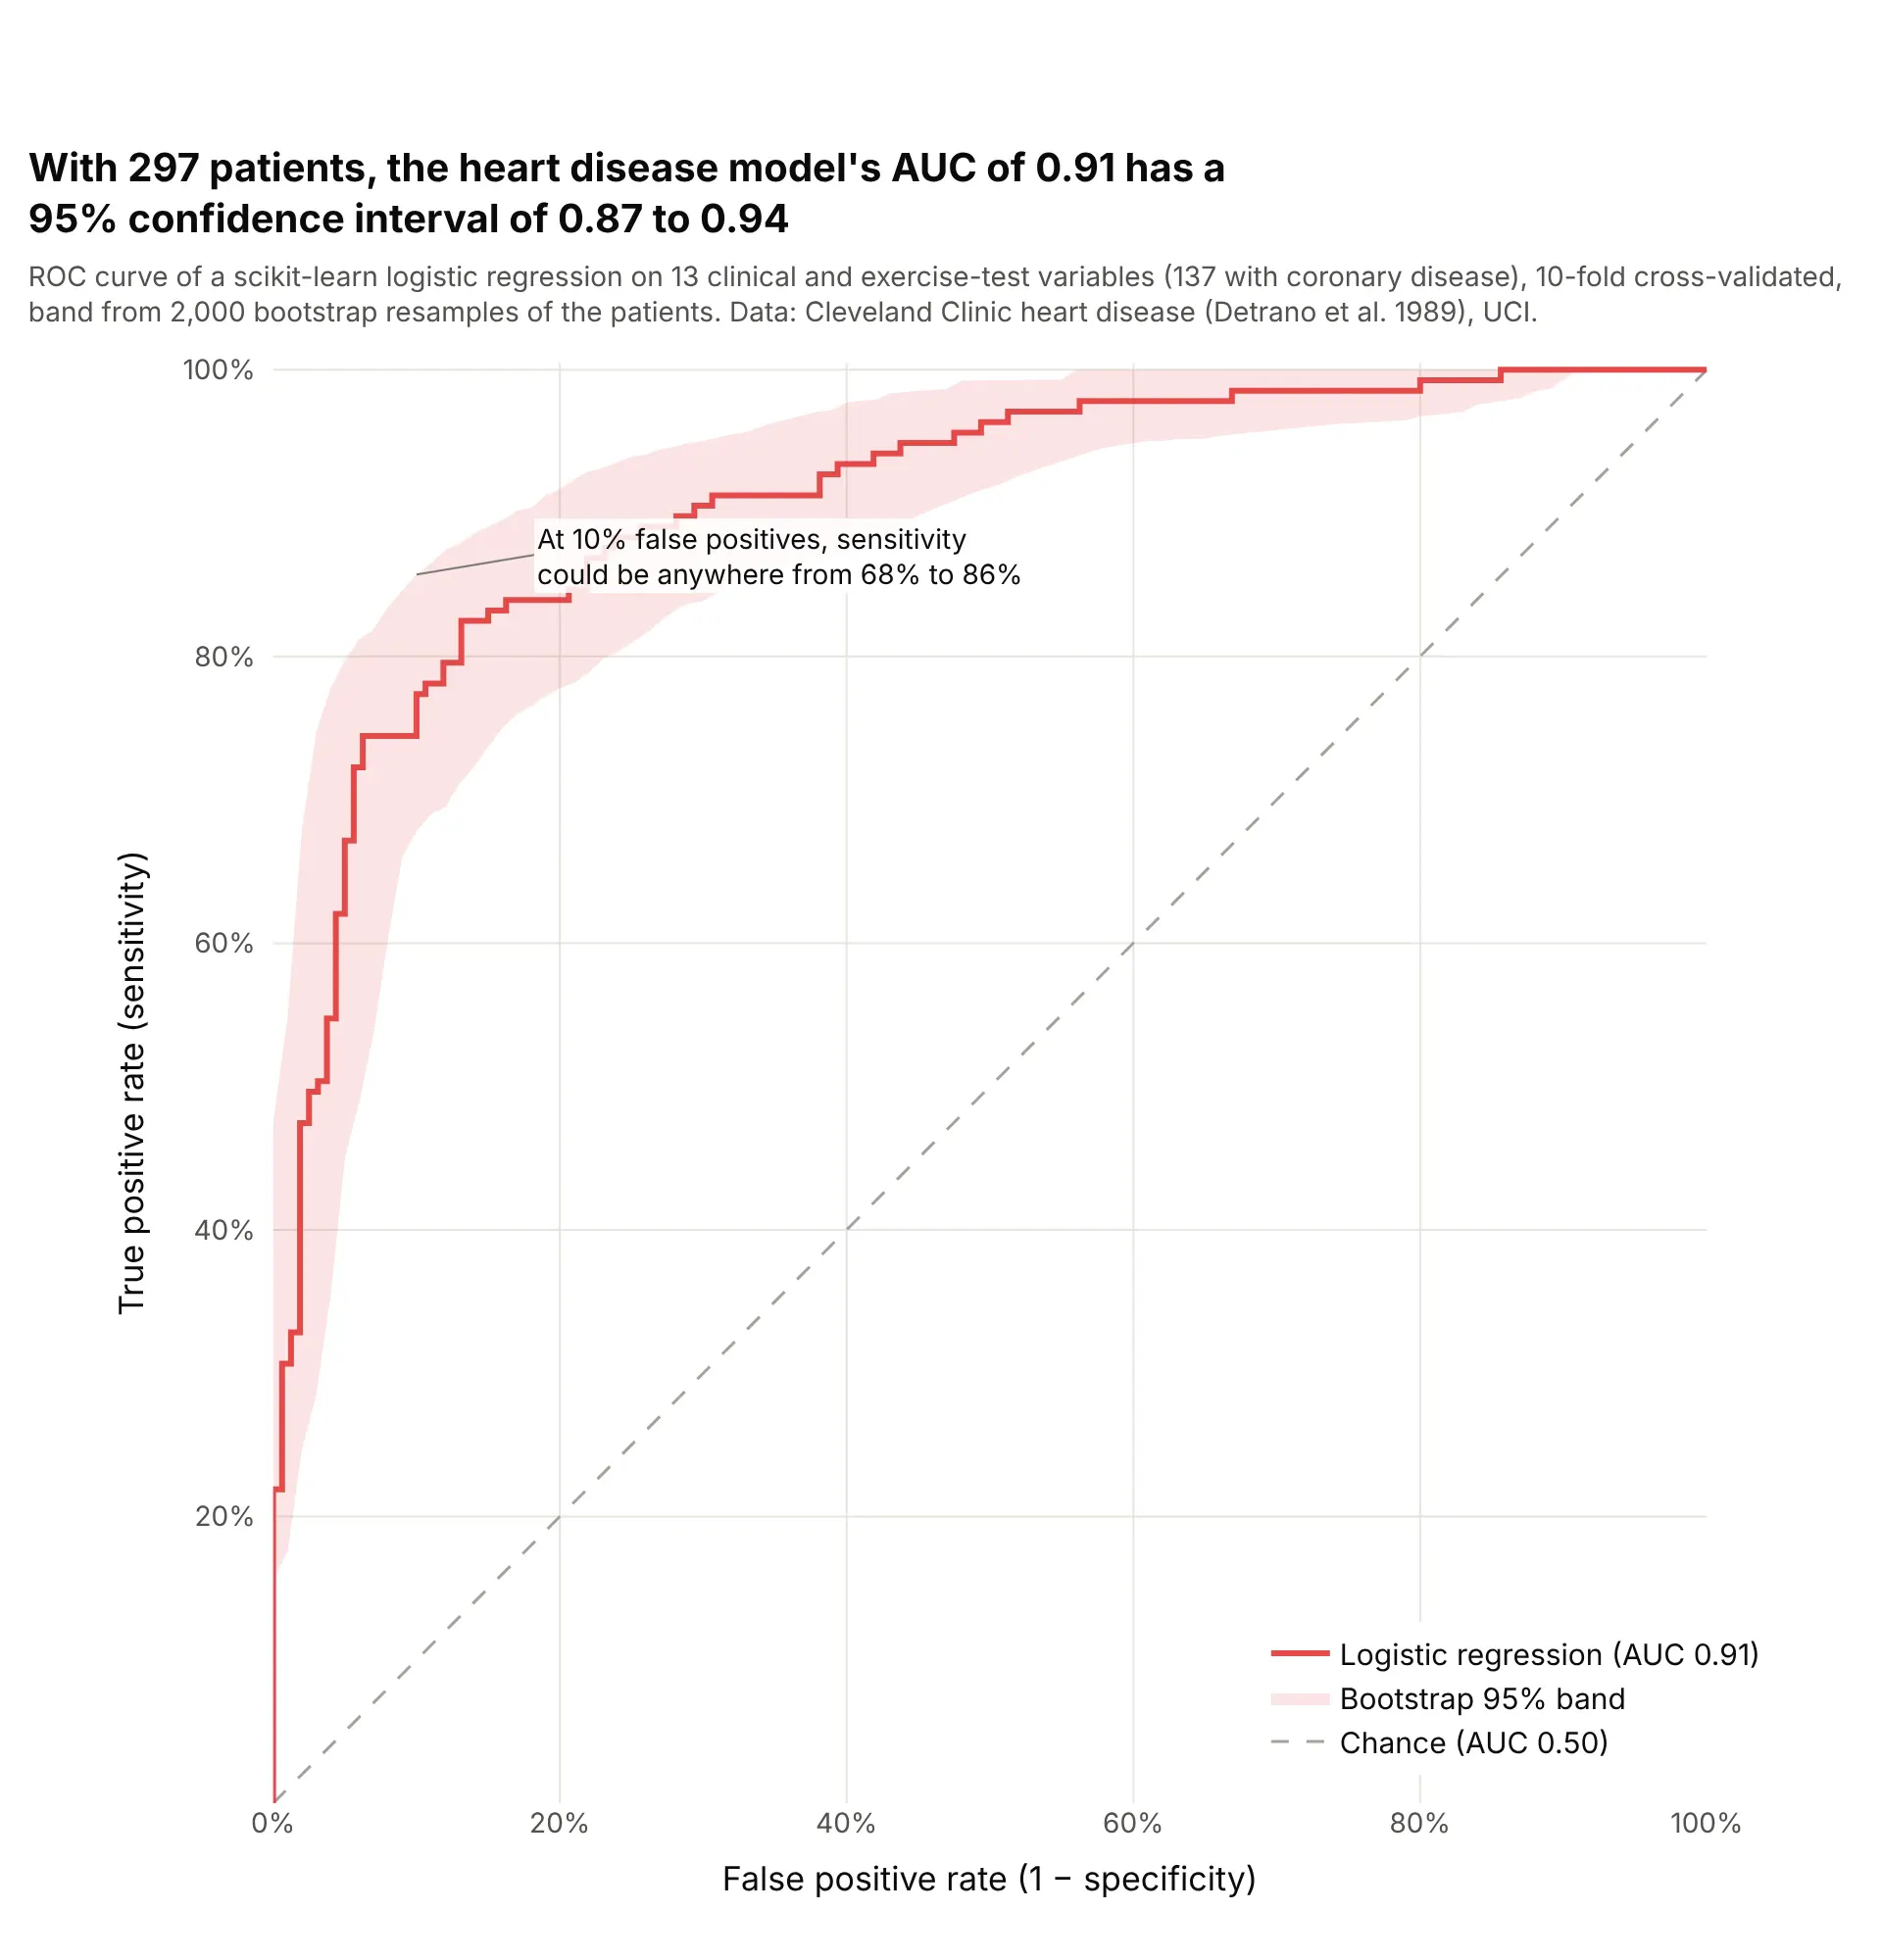
Resampling the 297 patients 2,000 times puts the model's AUC of 0.91 between 0.87 and 0.94, and its sensitivity at a 10% false positive rate anywhere from 68% to 86%. With a few hundred patients, the band matters as much as the curve. Data: Cleveland Clinic heart disease data (Detrano et al. 1989), UCI.
Tip: resample the patients, recompute the curve at a fixed grid of false positive rates, and draw the 2.5th and 97.5th percentiles with fill="tonexty".
Get the data from the UCI Machine Learning Repository heart disease data, processed.cleveland.data (Detranoet al. 1989; 303 patients, '?' for missing) (columns: age, sex, cp, trestbps, chol, fbs, restecg, thalach,exang, oldpeak, slope, ca, thal, num), with disease = num > 0.Score each patient with a scikit-learn logistic regression by 10-fold cross-validation, then build a plotly ROCcurve with a 95% band from 2,000 bootstrap resamples (true positive rate interpolated at 101 false positiverates), the AUC and its bootstrap interval in the title, a dashed diagonal and square axes.
5. Electricity prices: training data, a random split and later months
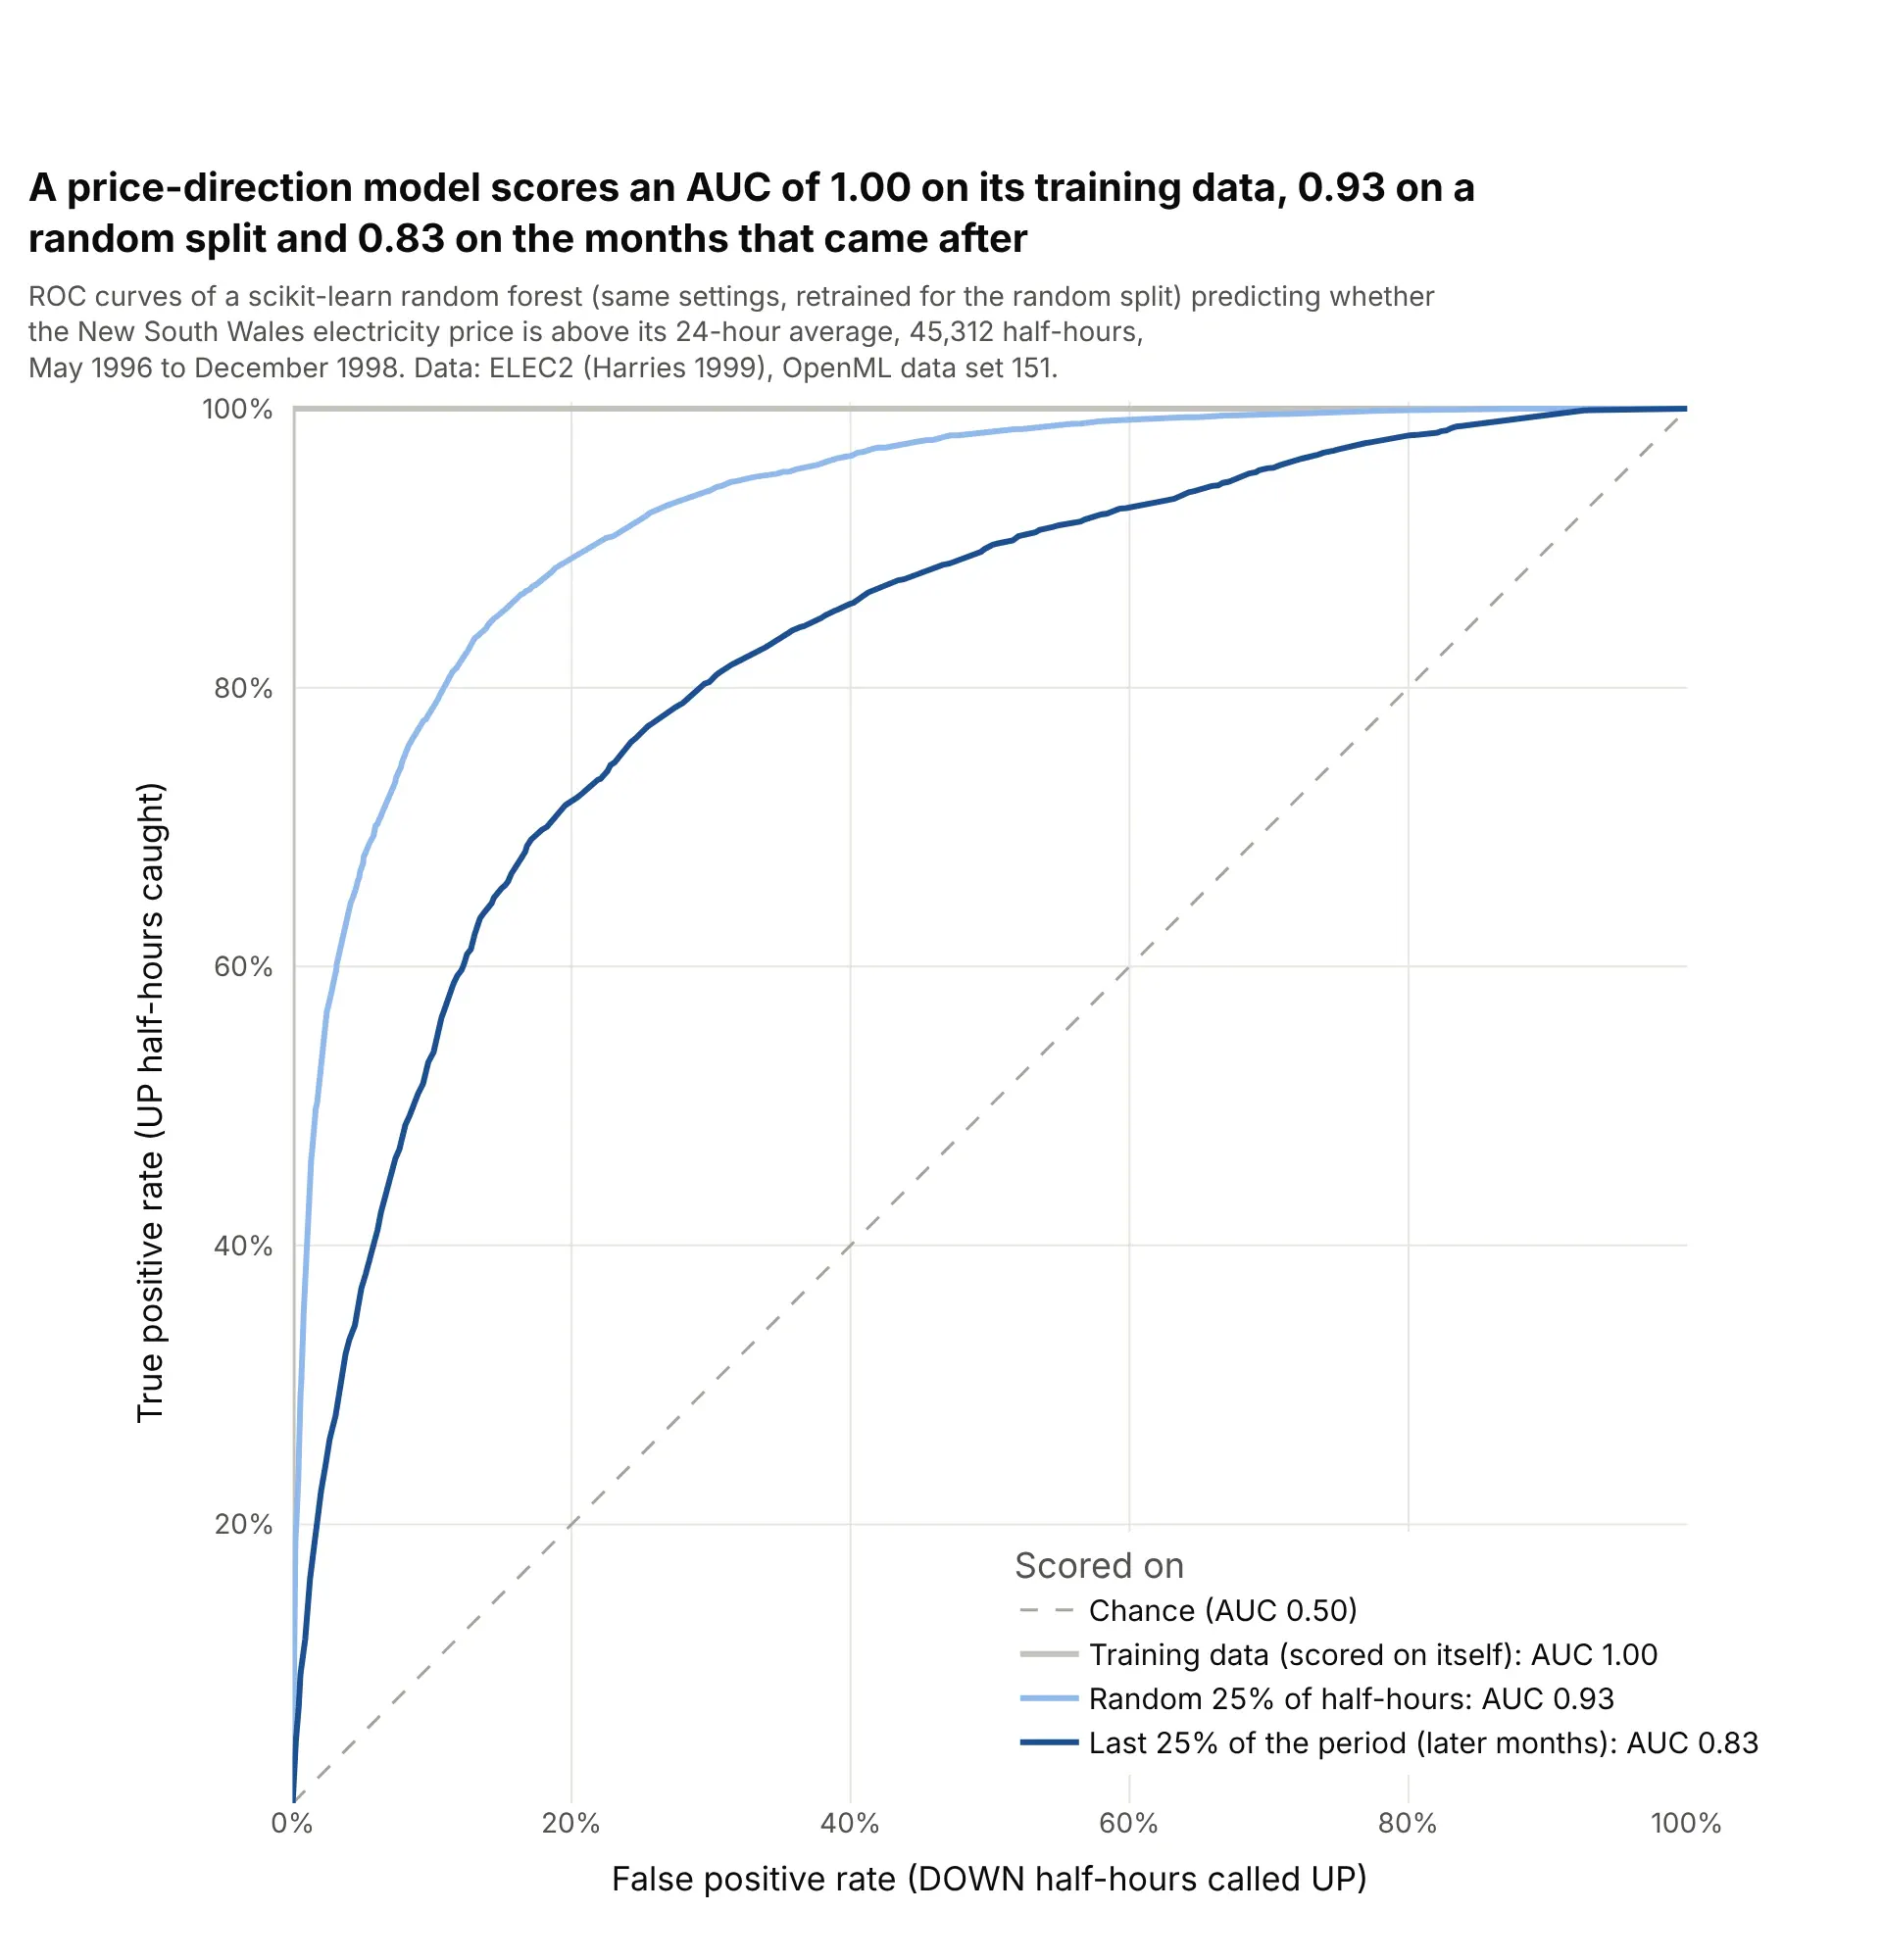
The same random forest setup scores an AUC of 1.00 on its own training data, 0.93 on a random 25% of half-hours and 0.83 on the last 25% of the period. A random split puts neighboring half-hours in both training and test sets, so only the later months show how the model would do on new data. Data: ELEC2 electricity market data (Harries 1999), OpenML data set 151.
Tip: for time series, score the curve on the period after the training data, and draw the misleading curves in lighter shades if you show them at all.
Get the data from OpenML data set 151, "electricity" (ELEC2, New South Wales market, May 1996 to December1998, normalized) (columns: date, day, period, nswprice, nswdemand, vicprice, vicdemand, transfer, class).Train a scikit-learn random forest on the first 75% of rows and build a plotly chart with three ROC curves:scored on its own training rows, on a random 25% test split from a second model, and on the last 25% of rows,with each AUC in the legend and the honest curve darkest.
6. Pima diabetes: a model against the single test
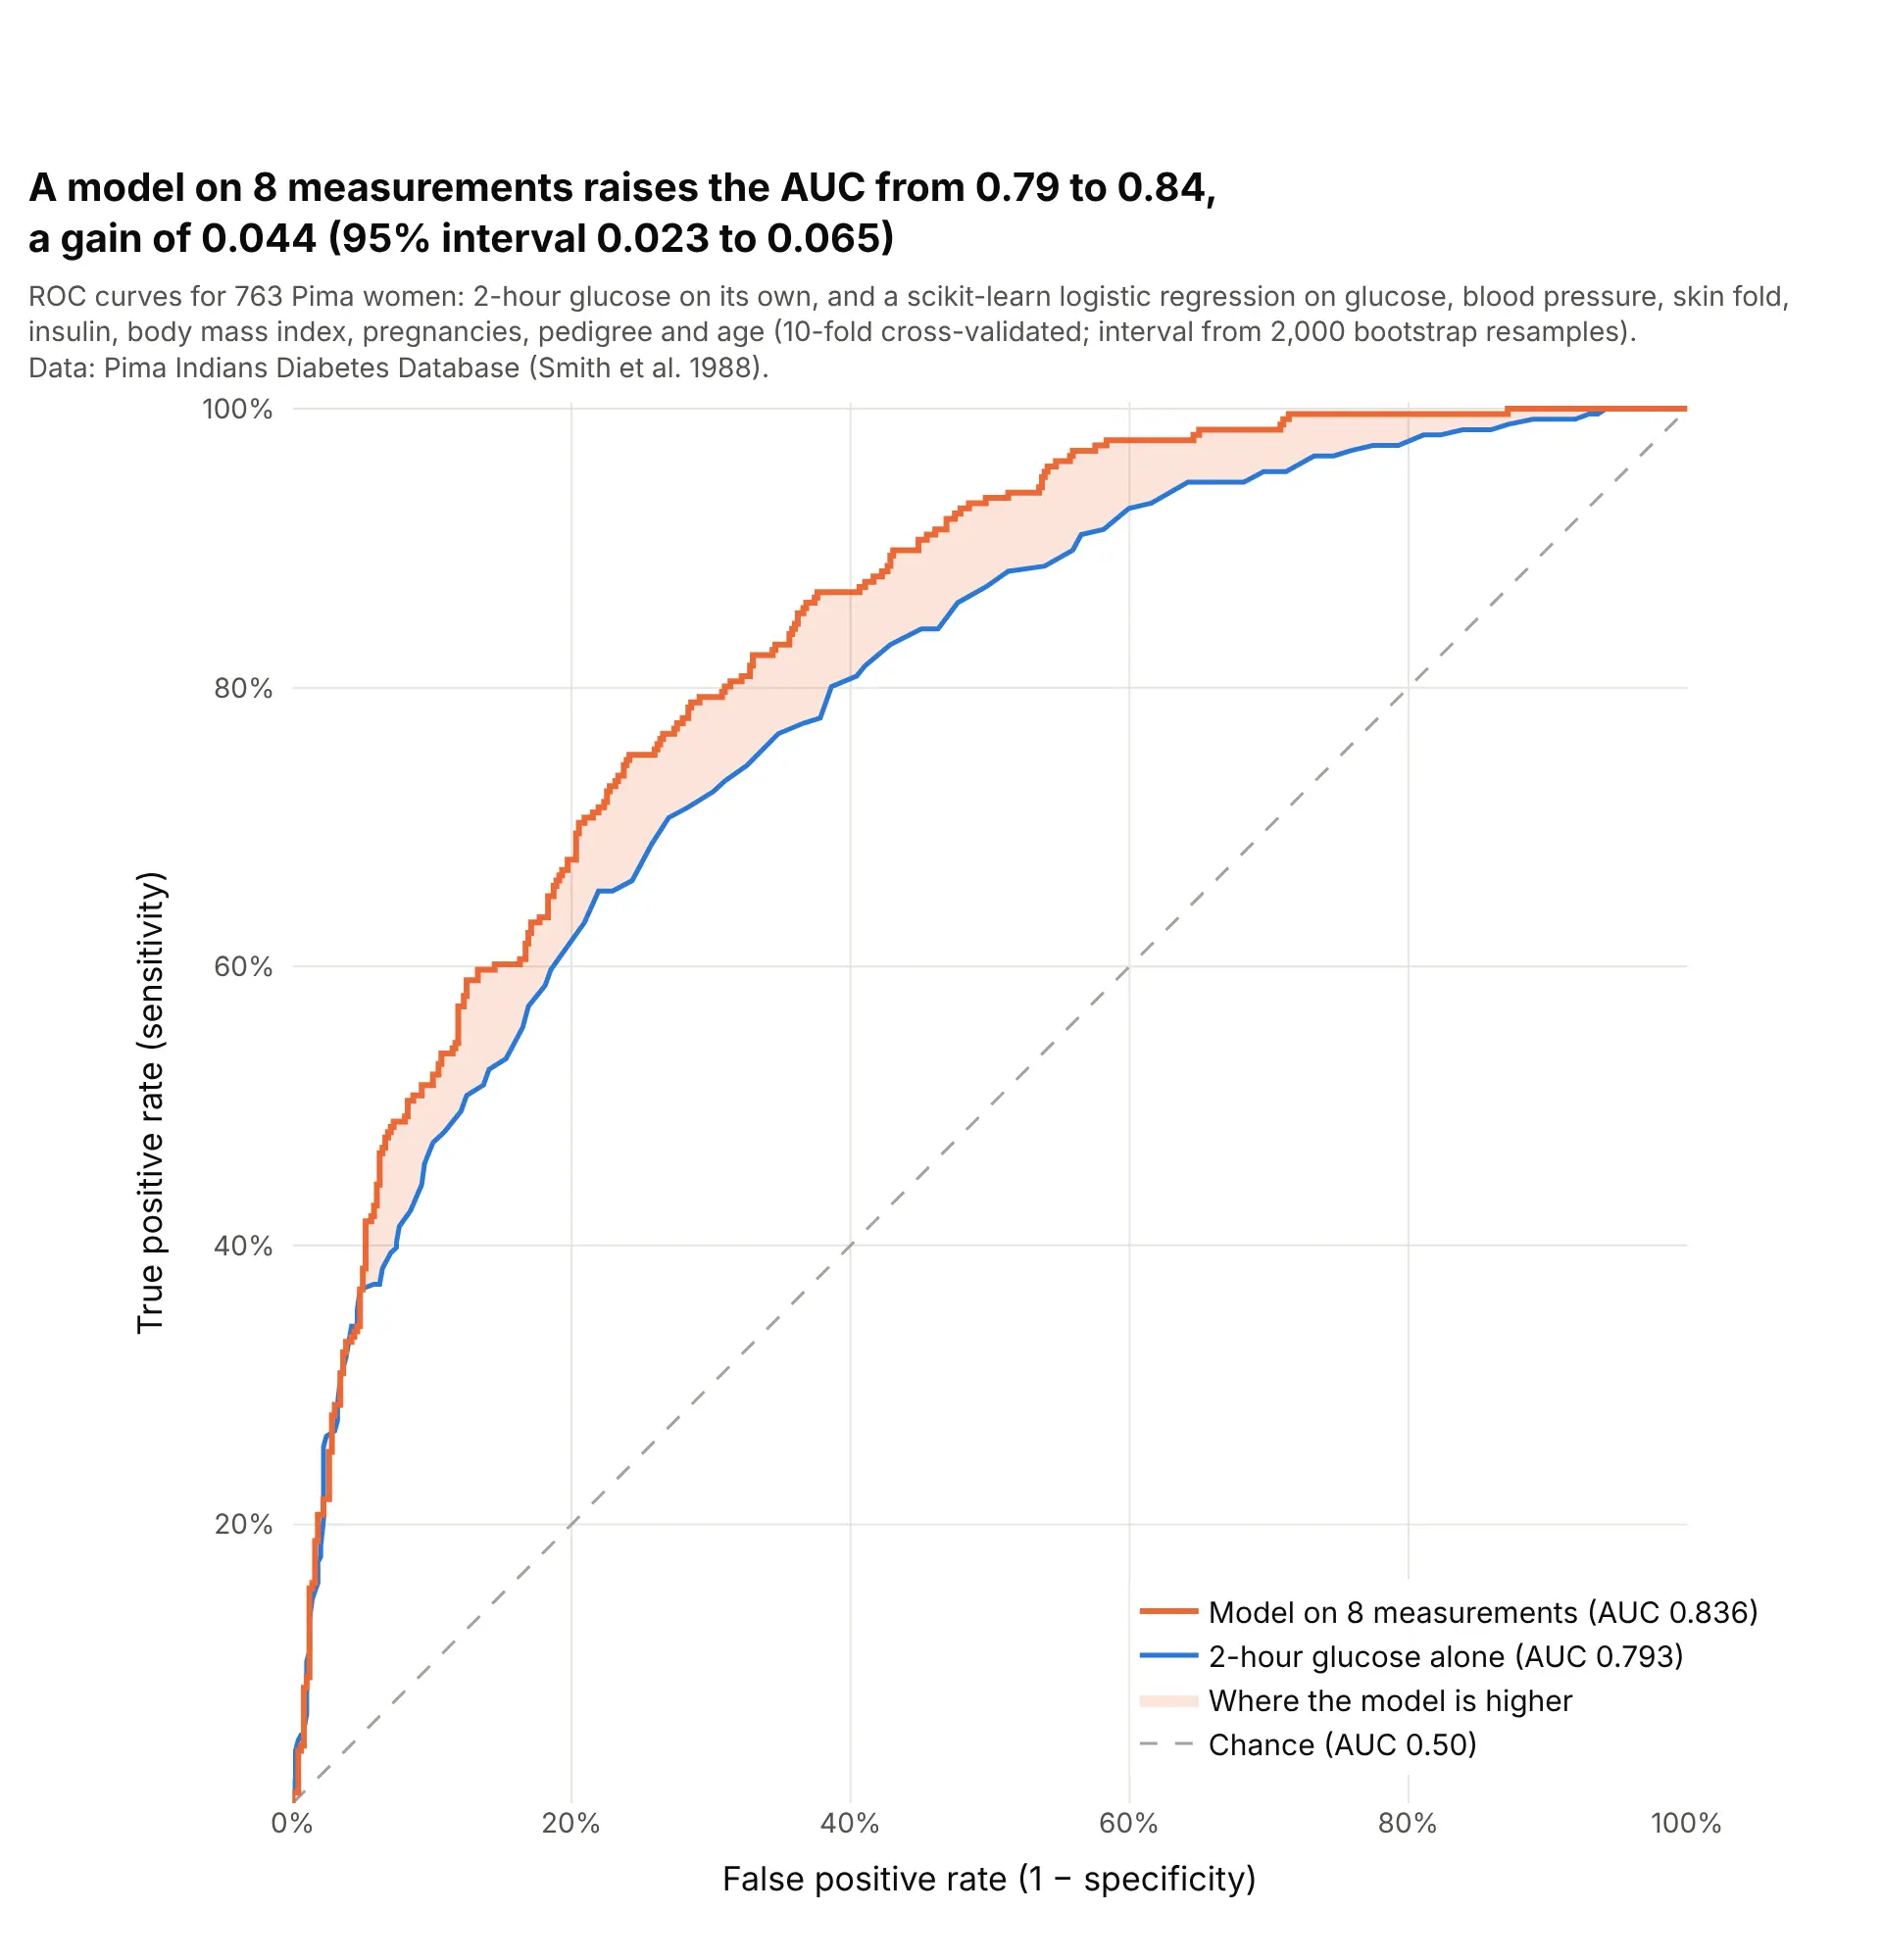
A logistic regression that adds blood pressure, body mass index, age and five other measurements to glucose raises the AUC from 0.793 to 0.836, a gain of 0.044 with a bootstrap 95% interval of 0.023 to 0.065. The gain shows up at false positive rates from about 10% to 70%. Data: Pima Indians Diabetes Database (Smith et al. 1988).
Tip: to show what a model adds, shade the area between its curve and the single test's, and give a confidence interval for the difference in AUC, not for each AUC.
Get the data from the Pima Indians Diabetes Database (National Institute of Diabetes and Digestive and KidneyDiseases; Smith et al. 1988), 768 women (columns: Pregnancies, Glucose, BloodPressure, SkinThickness,Insulin, BMI, DiabetesPedigreeFunction, Age, Outcome); zeros in Glucose, BloodPressure, SkinThickness,Insulin and BMI are missing.Build a plotly chart with the ROC curve of Glucose alone and of a scikit-learn logistic regression on all 8measurements (median imputation, 10-fold cross-validated), the area between them shaded where the model ishigher, and the AUC gain with a 2,000-sample bootstrap 95% interval in the title.