
Chris Parmer
November 18, 2026
Venn Diagrams - A Complete Guide
TL;DR
- A Venn diagram draws each set as a circle so that the overlaps show which items belong to several sets at once, with a region for every combination of sets and, in a data chart, the number of items in exactly that region written inside it.
- Venn diagrams are also known as set diagrams and logic diagrams, and are similar to Euler diagrams (which draw only the combinations that exist), UpSet plots and heatmaps of pairwise overlaps.
- They work for two or three sets. Four sets need ellipses and 15 regions, and from four or more sets an UpSet plot is easier to read.
- You can make a Venn diagram with Plotly from circle shapes and text annotations, and the helper below draws one in about 20 lines; an area-proportional version only needs a small amount of geometry to place the circles.
- See 11 ways to draw a Venn diagram below, from a two-circle diagram to area-proportional circles and ellipses, names inside the regions and an UpSet plot, all drawn from the 46 novel drugs the US Food and Drug Administration (FDA) approved in 2025.
What is a Venn diagram?
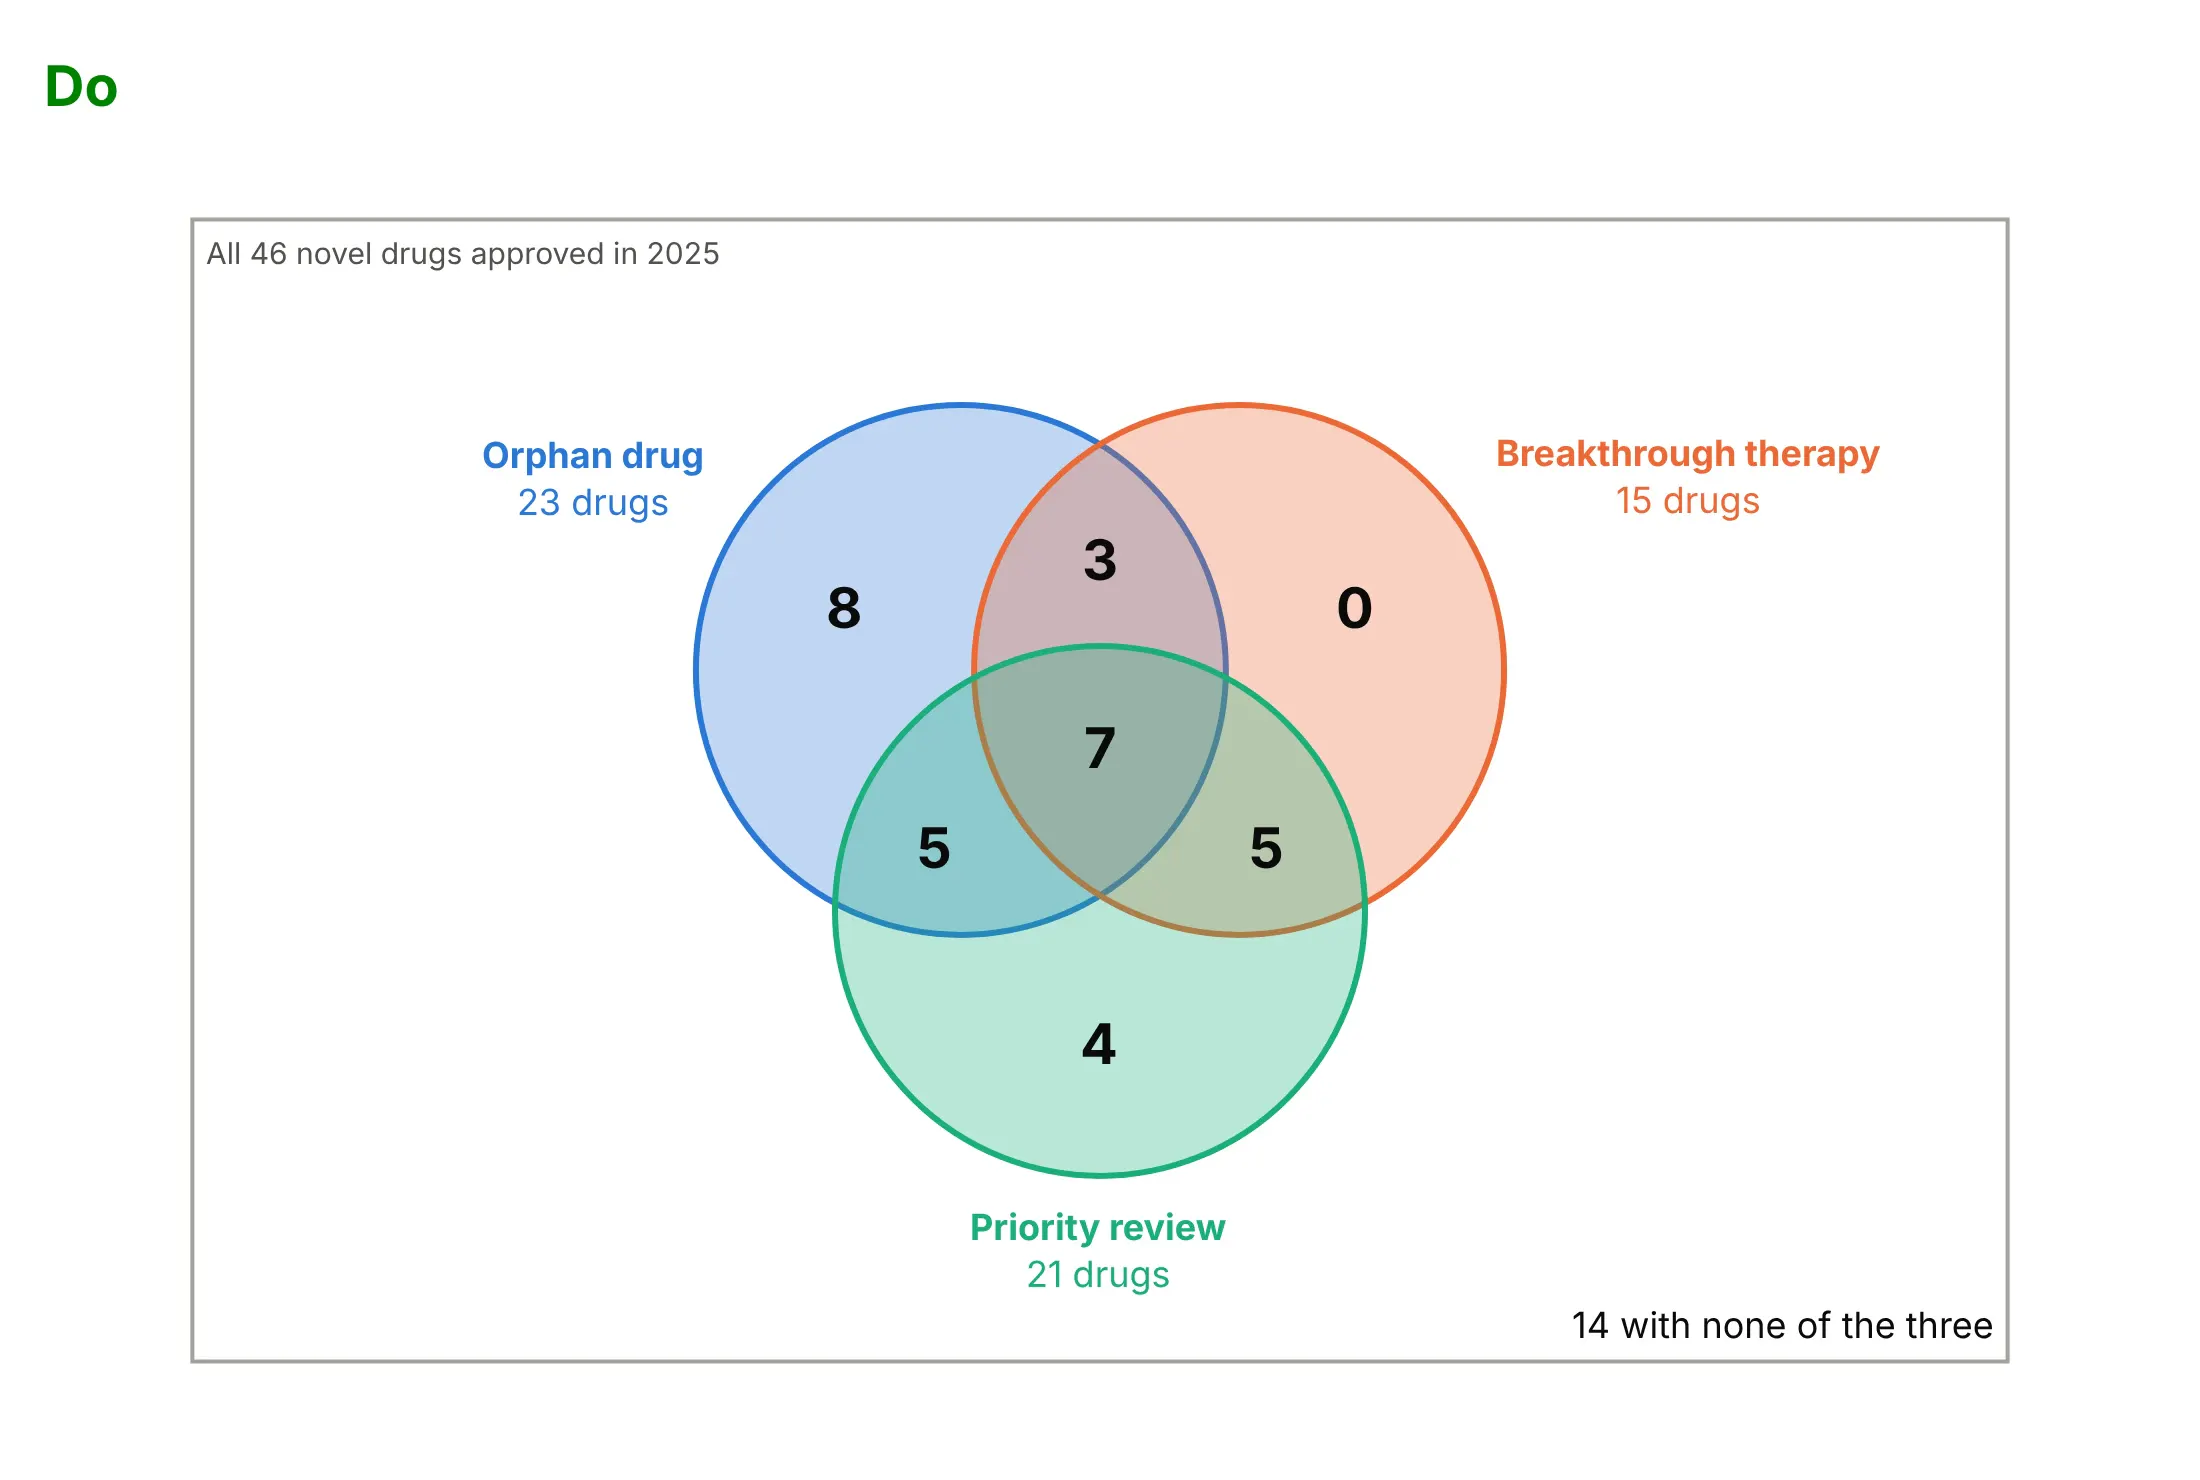
Venn diagrams look like this:
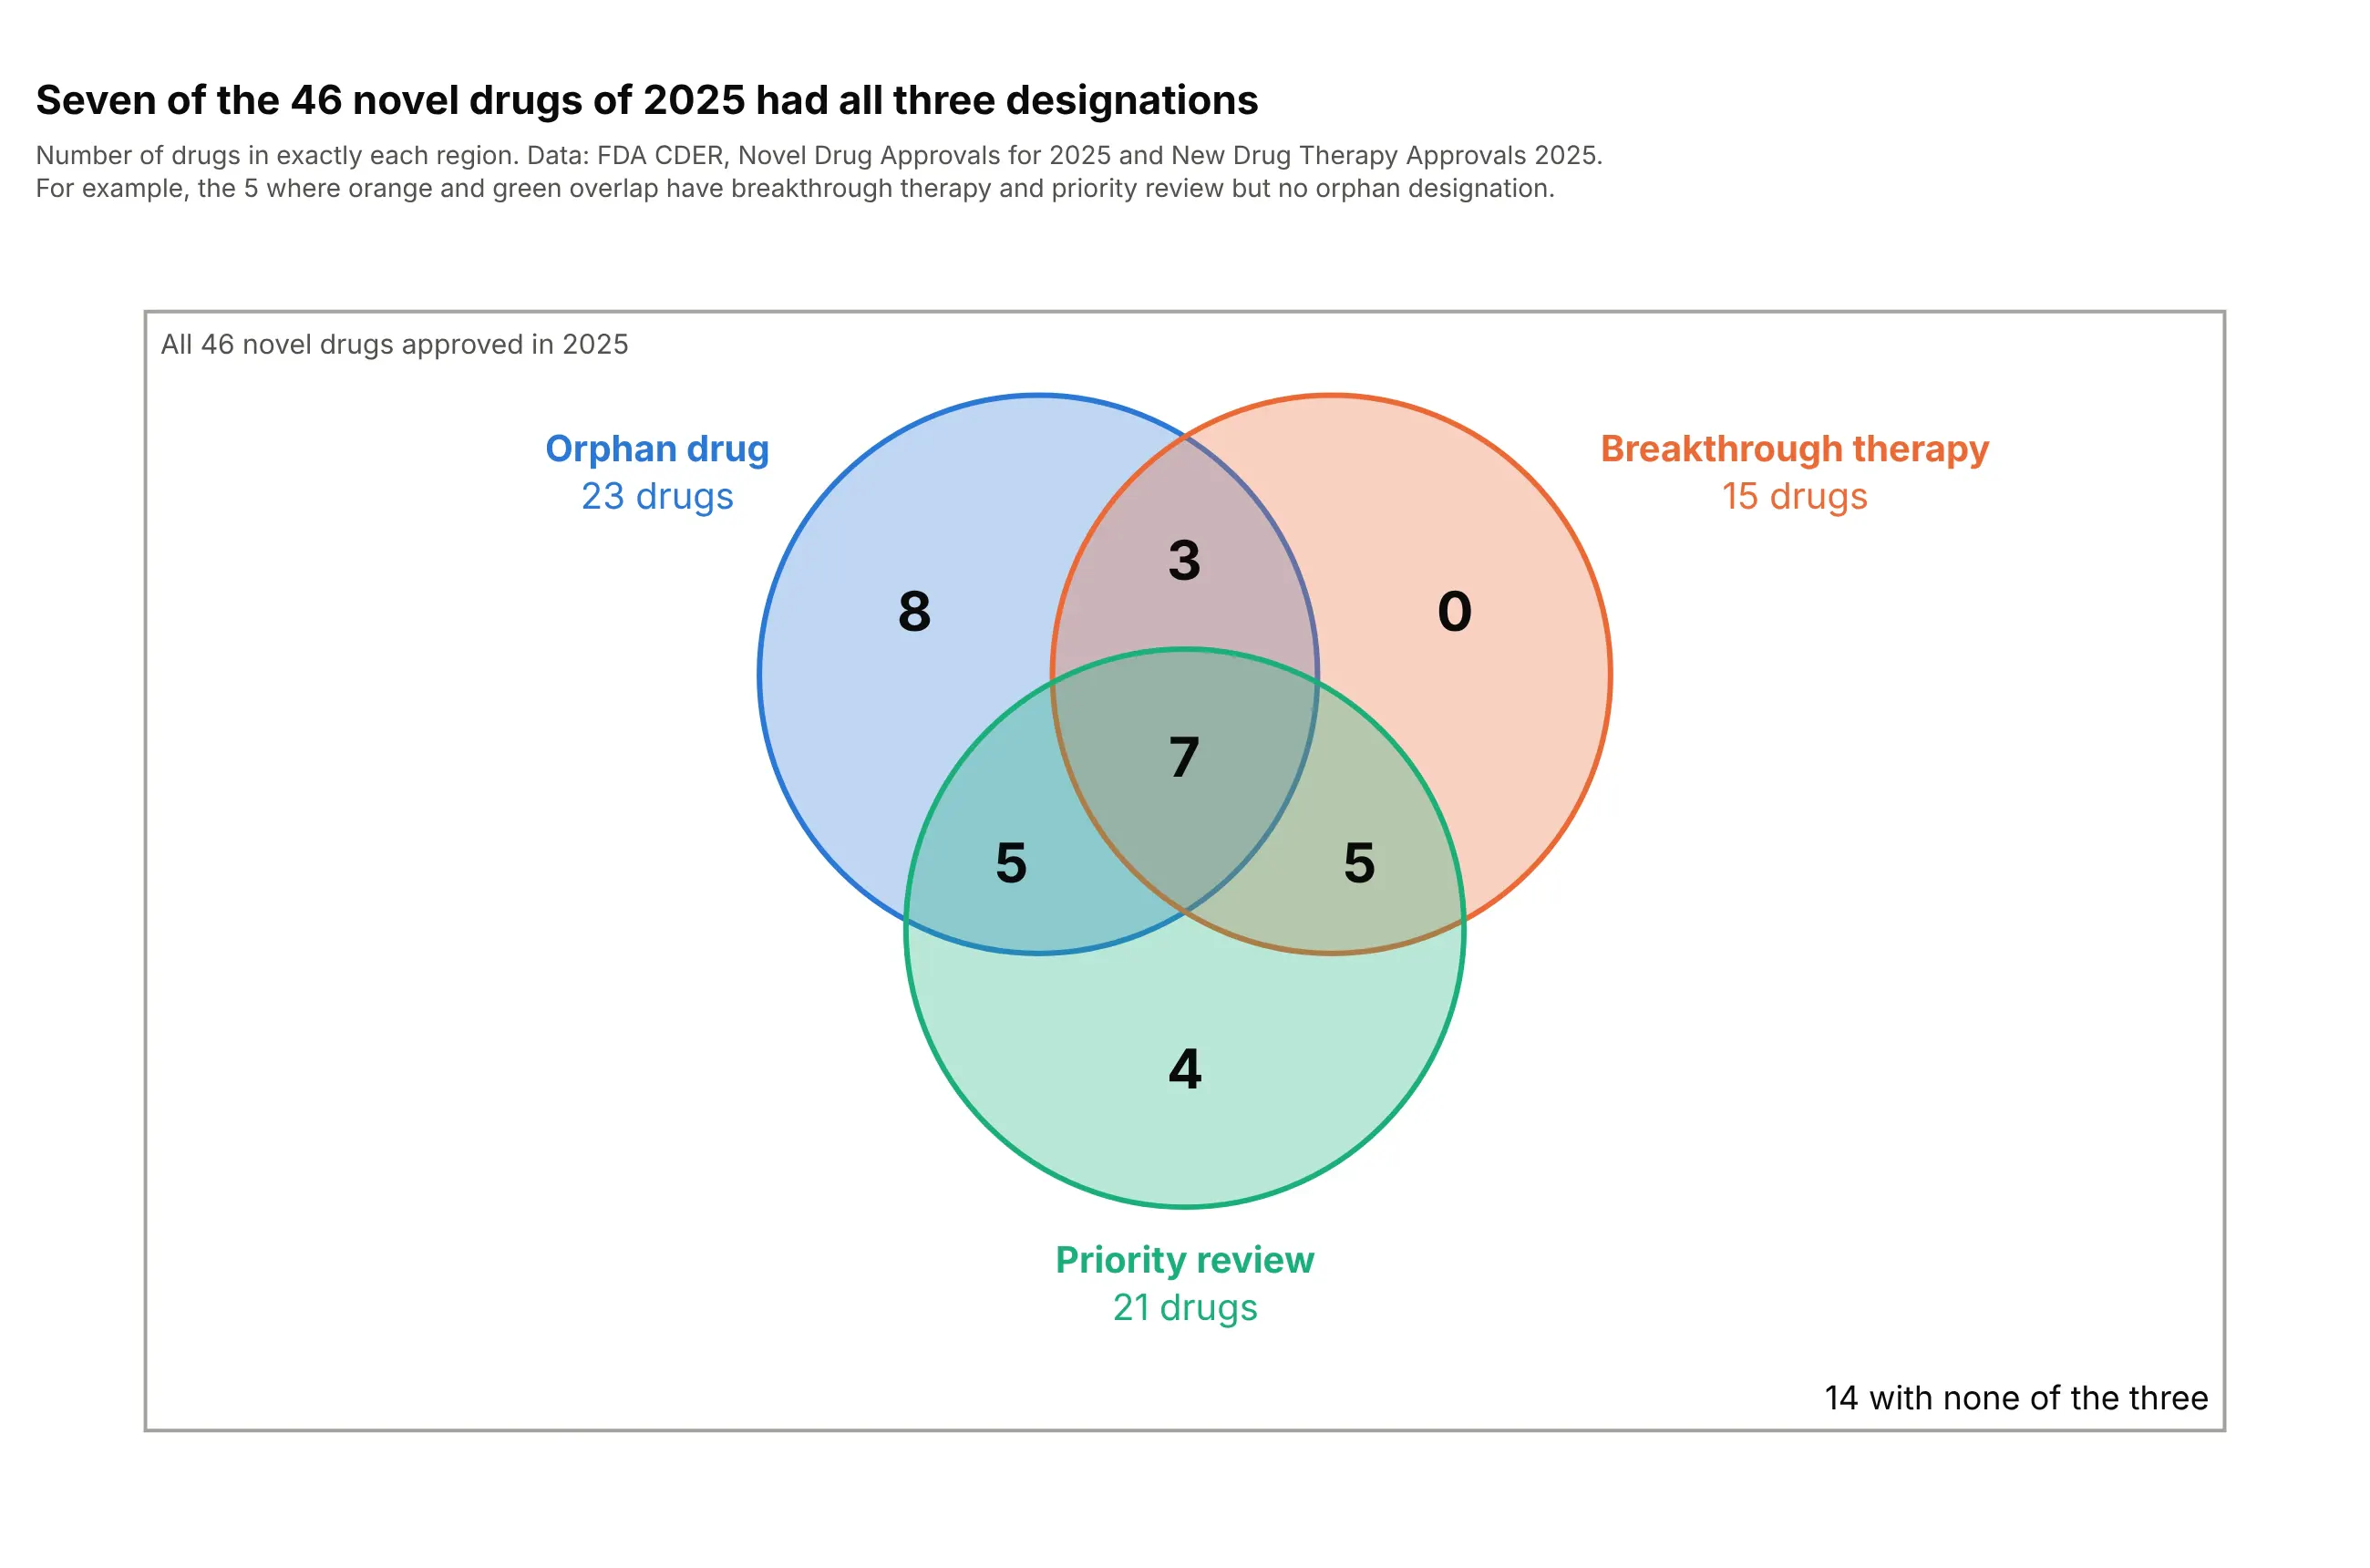
Data: FDA Center for Drug Evaluation and Research (CDER), Novel Drug Approvals for 2025 and the report New Drug Therapy Approvals 2025.
How do you read a Venn diagram? In the example above, notice these things:
- Each circle is one designation the FDA can give a new drug: orphan drug designation (for rare diseases), breakthrough therapy (for drugs that may be a large improvement over existing ones) and priority review (a faster review for serious conditions). A drug is inside a circle when it has that designation.
- Where circles overlap, drugs have all of those designations. The 7 in the middle have all three, and the number in each region counts the drugs in exactly that region, so the seven regions add up to 32.
- The rectangle is the universe, all 46 novel drugs of 2025. The 14 drugs outside every circle have none of the three, so the circles and the corner number together add up to 46.
- Breakthrough only shows a 0. A Venn diagram draws every combination, even an empty one, and this zero says that all 15 breakthrough drugs also had an orphan designation or priority review.
- The circles are all the same size, so the area of a region says nothing about its count: the 7 in the middle is drawn smaller than the 8 on the left. Read the numbers, and see the area-proportional versions below when sizes matter.
It's often used for charts like these:
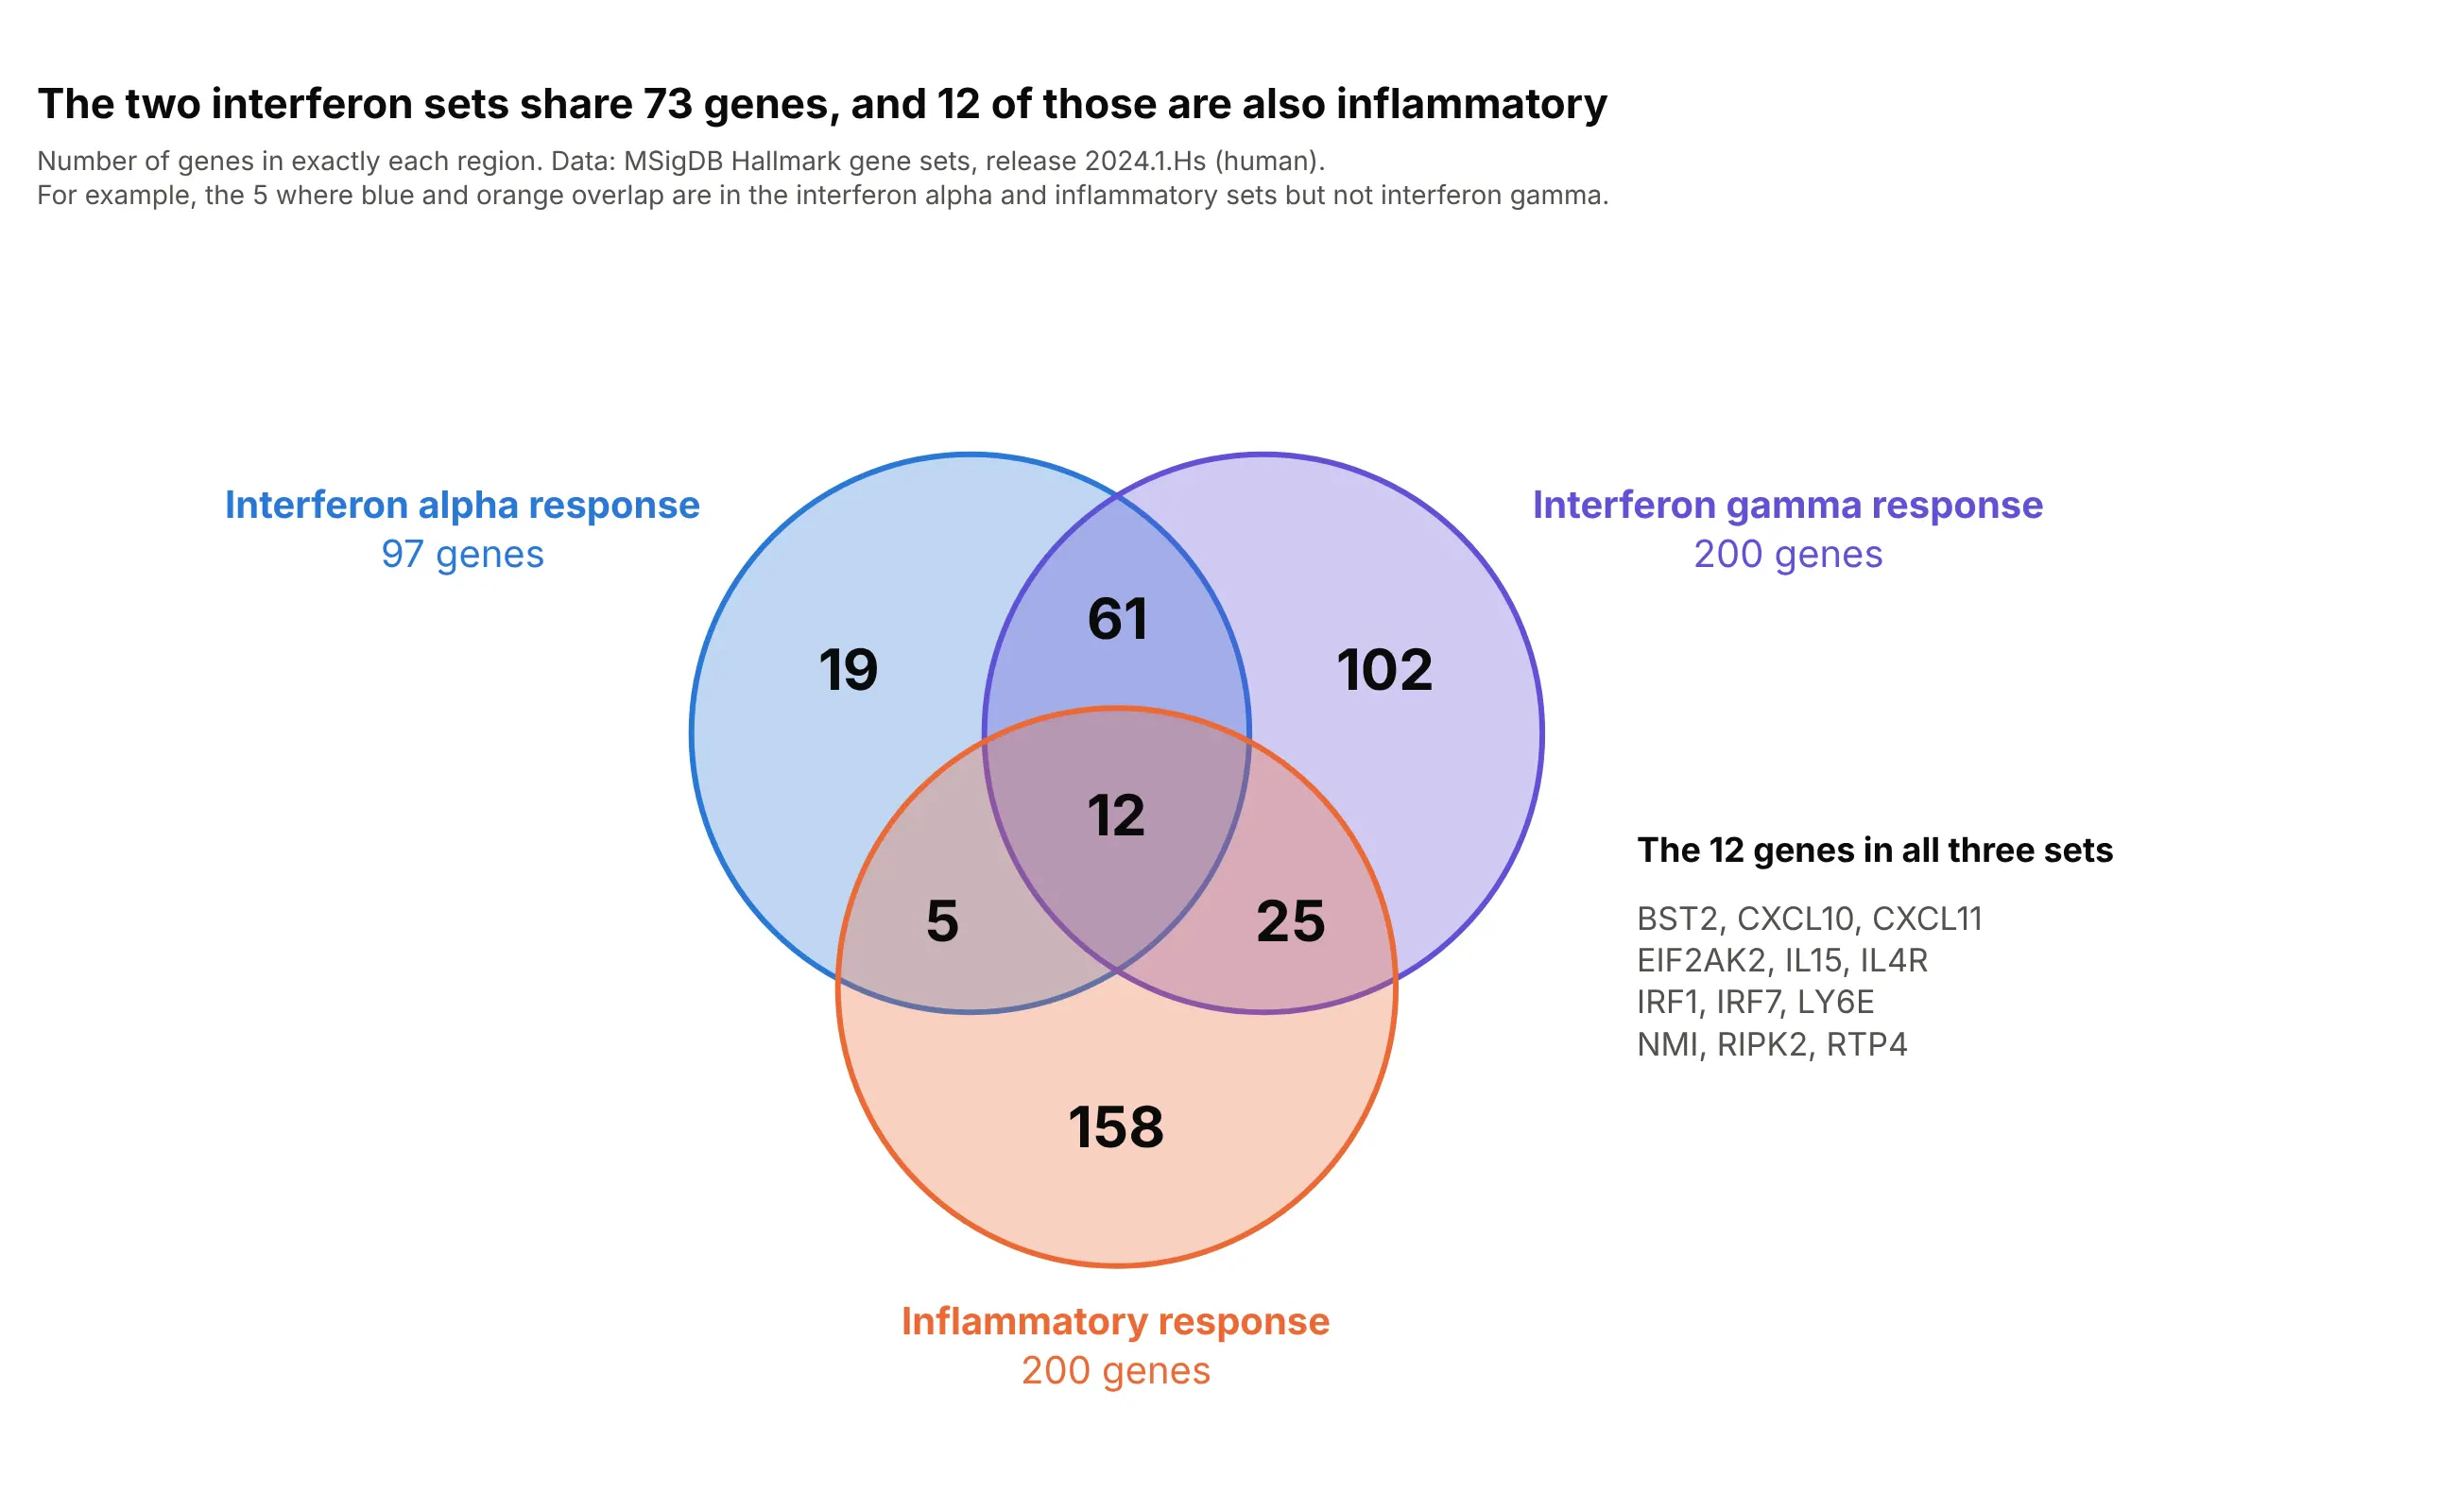
Genomics. The classic use of a Venn diagram is to compare gene lists from several studies or pathways: the two interferon response sets share 73 genes, and 12 of those are also in the inflammatory response set. Data: Molecular Signatures Database (MSigDB) Hallmark gene sets, release 2024.1.Hs.
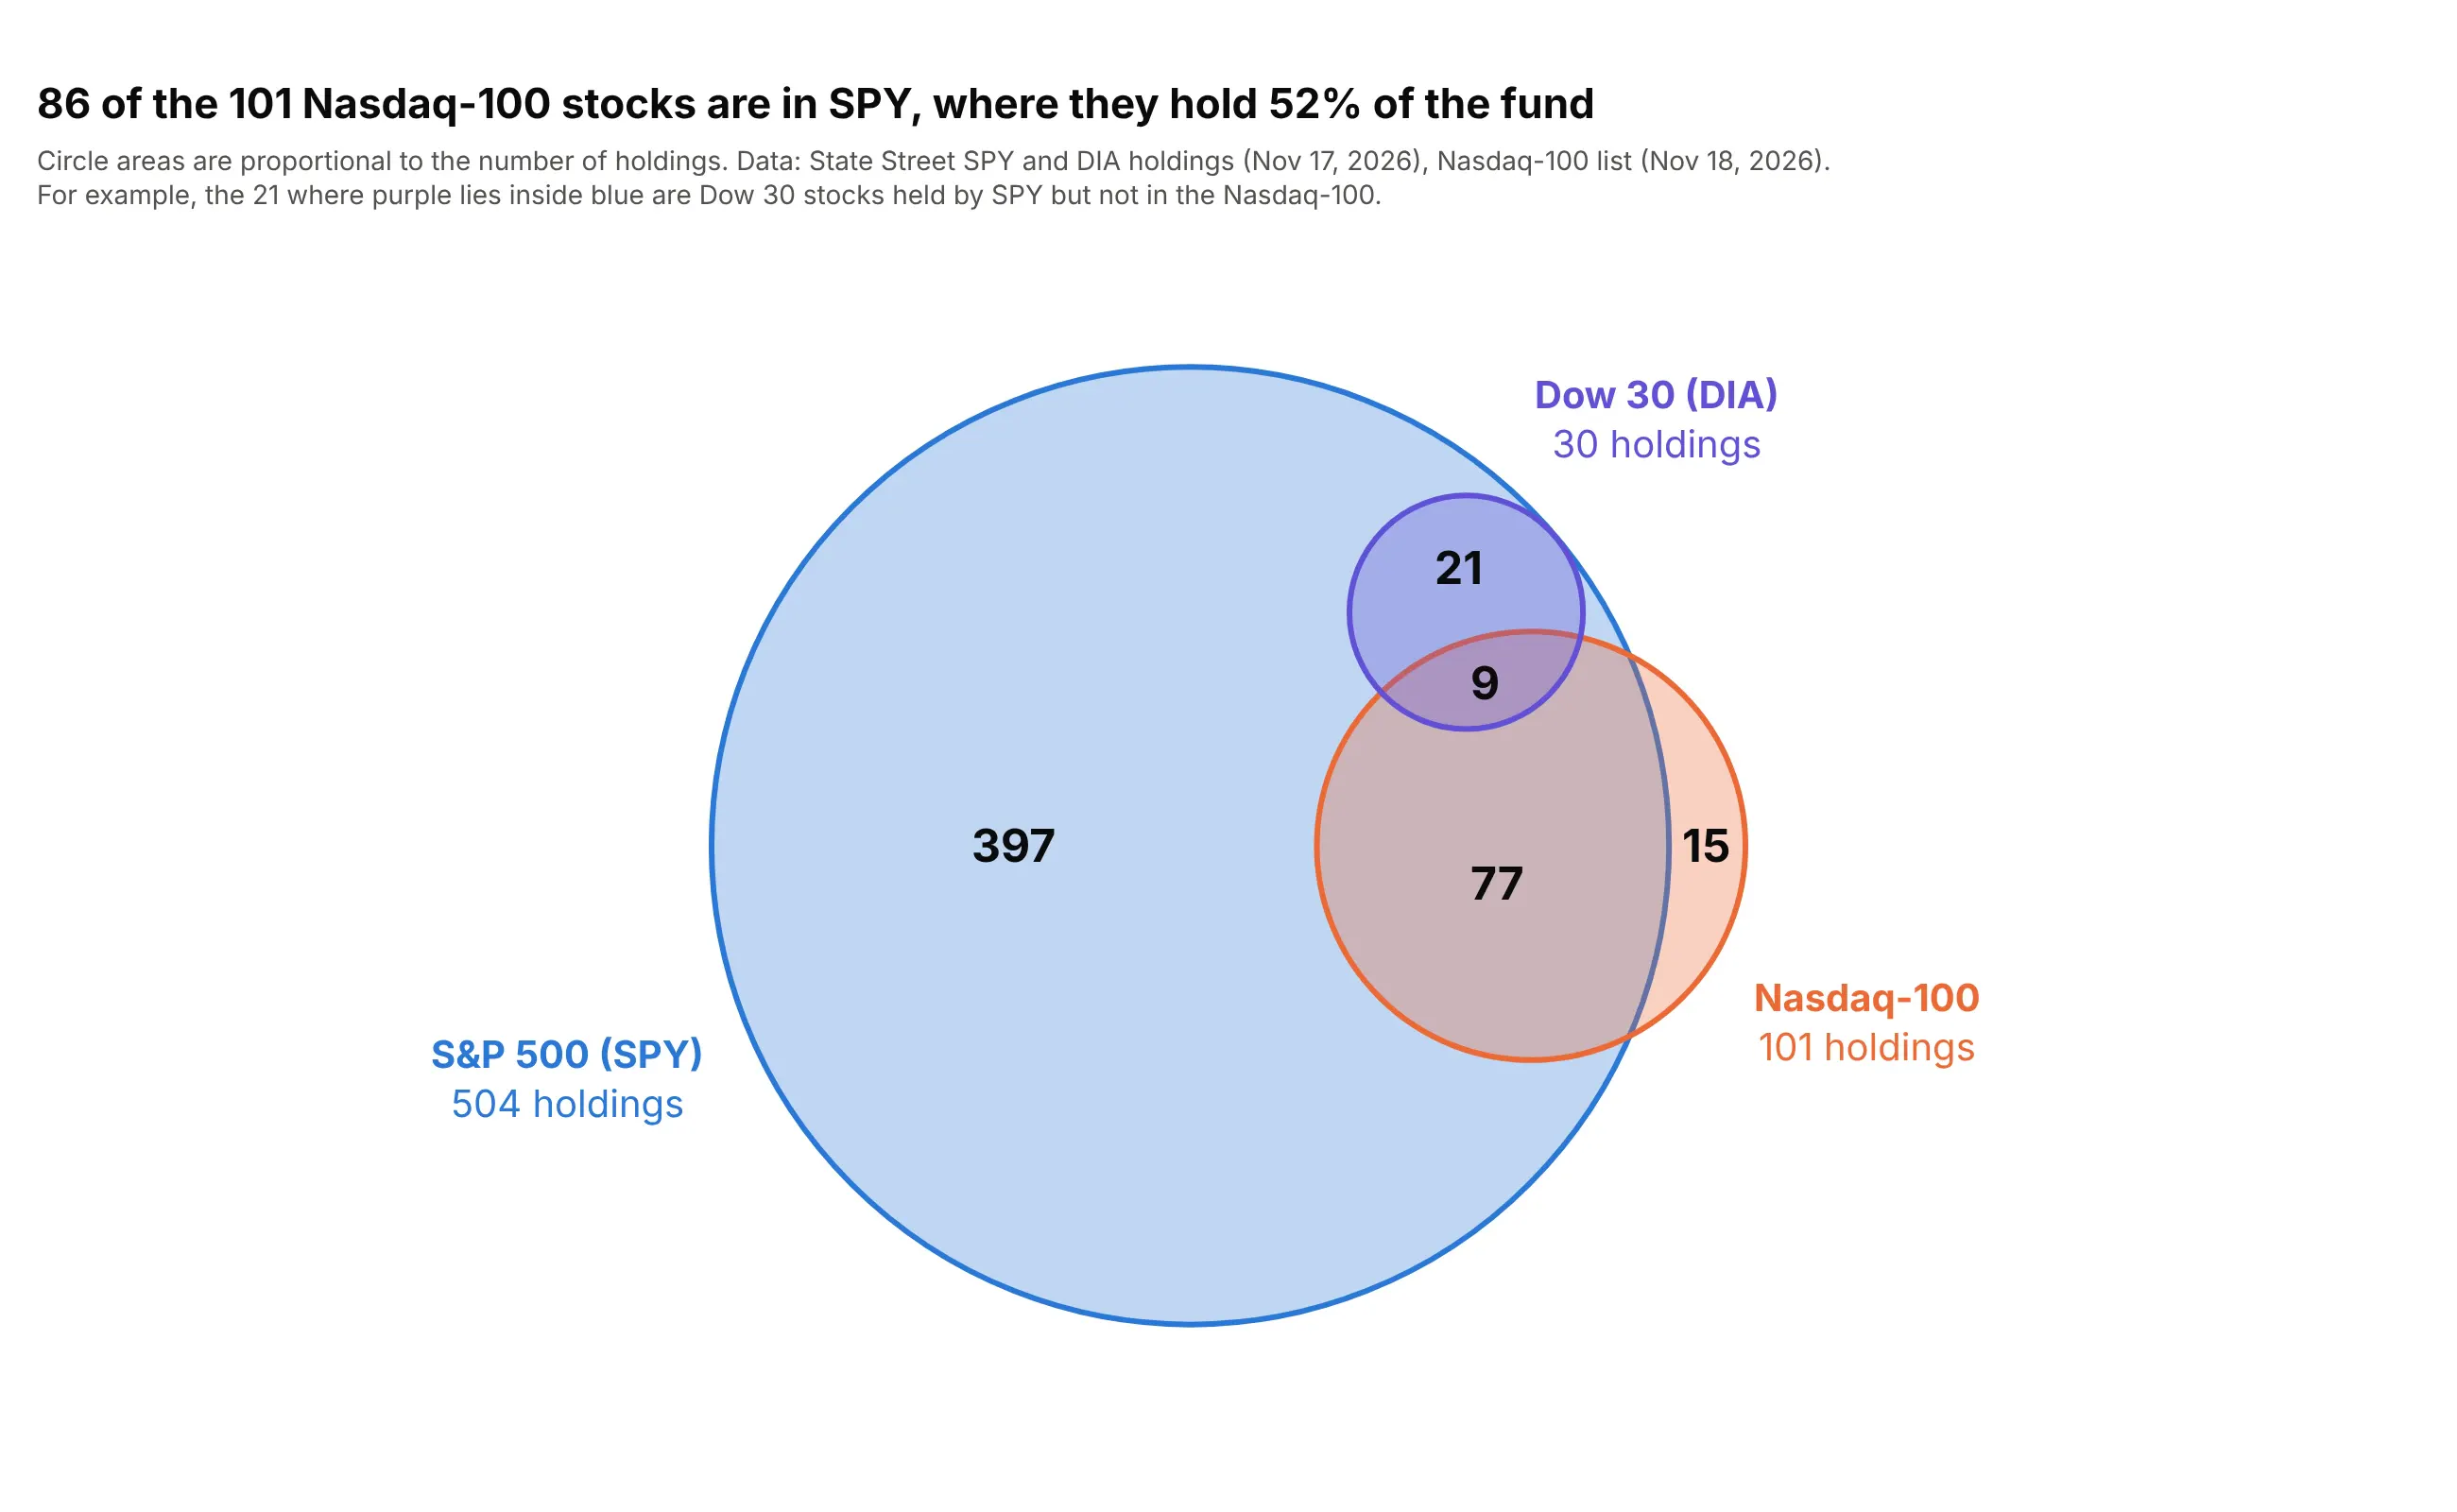
Finance. When one set sits inside another, the diagram is an Euler diagram, and area-proportional circles make it visible at once. Every one of the 30 stocks held by DIA, the exchange-traded fund (ETF) that tracks the Dow Jones Industrial Average, is also held by SPY, the ETF that tracks the S&P 500, and so are 86 of the 101 Nasdaq-100 stocks, which make up 52% of SPY's weight. Data: State Street SPY and DIA holdings (November 17, 2026) and the Nasdaq-100 list from Nasdaq (November 18, 2026).
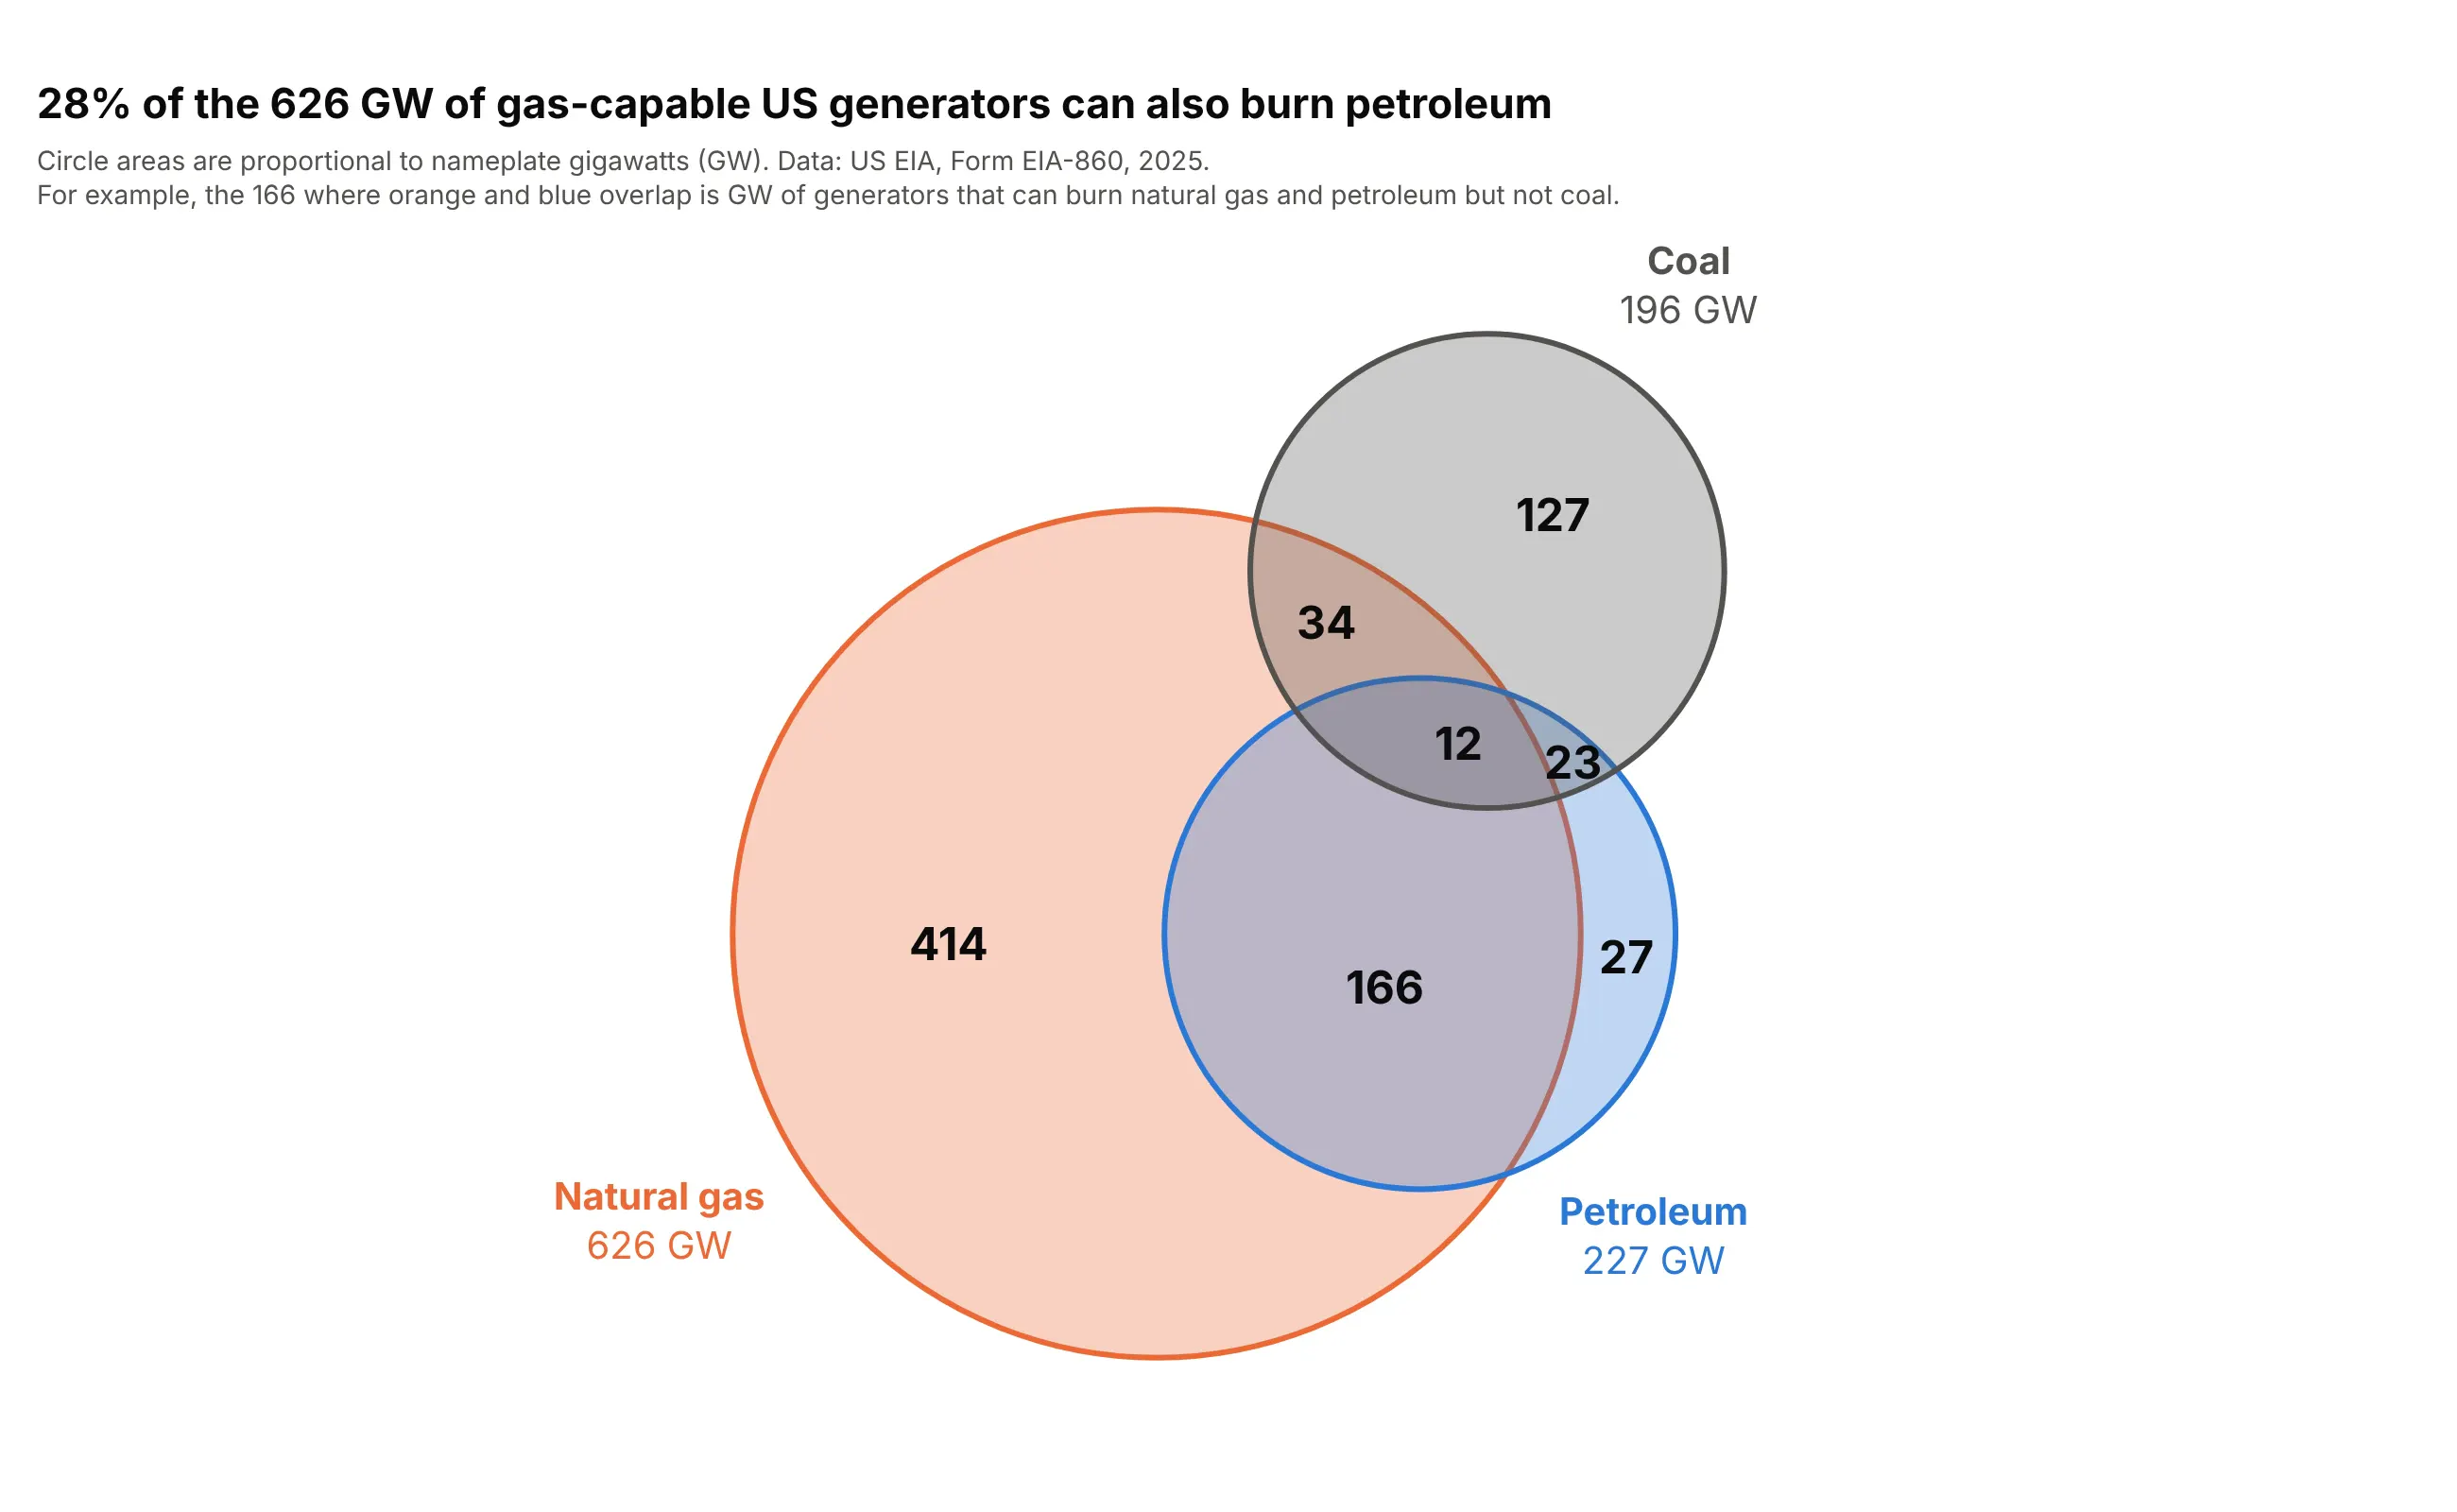
Energy, weighted by size. A Venn diagram doesn't have to count items. Summing nameplate capacity in gigawatts (GW) shows that 178 GW of US generators can burn both natural gas and petroleum, 28% of the 626 GW that can burn gas. Data: US Energy Information Administration (EIA), Form EIA-860, 2025.
A short history
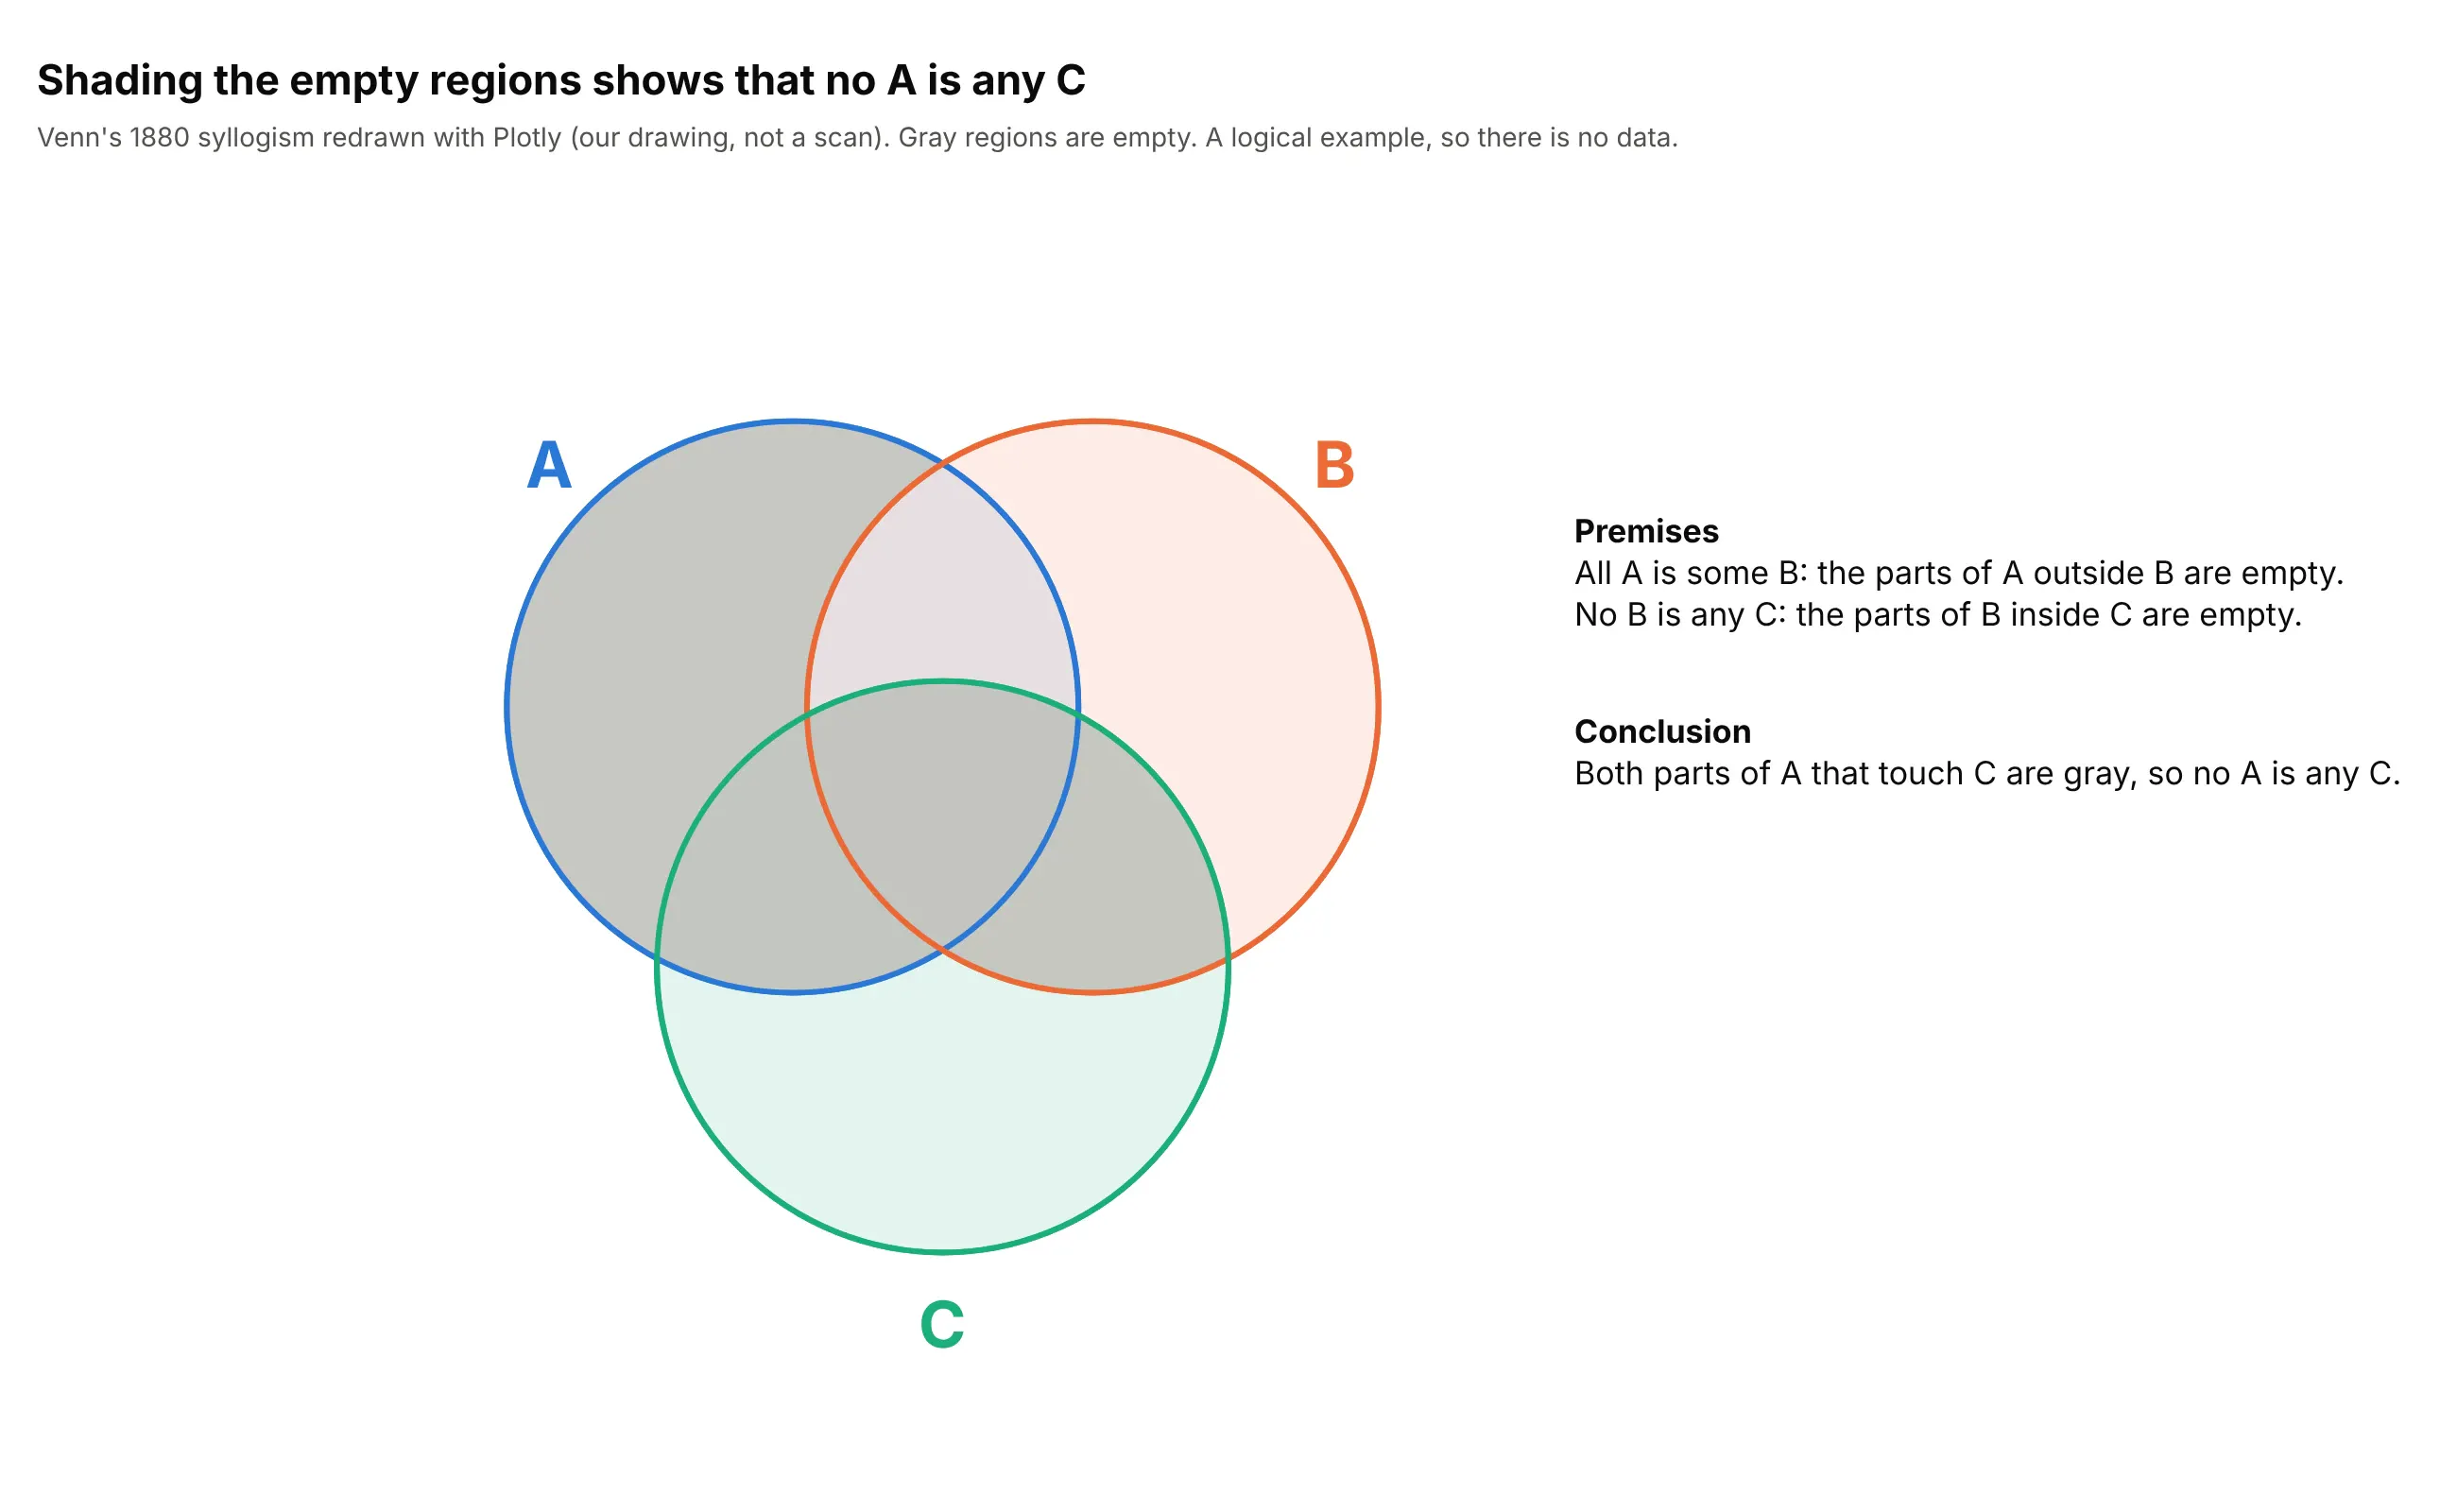
John Venn introduced the diagrams in 1880 to show what follows from statements in logic (Venn 1880, doi:10.1080/14786448008626877), and he called them "Eulerian circles" after Leonhard Euler's diagrams of the 1700s (Wikipedia). One of his examples was a syllogism with three terms, "All A is some B. No B is any C. Hence no A is any C", which three overlapping circles prove by shading the regions the premises make empty. Here it is redrawn with Plotly:
Area-proportional diagrams came much later, with computer methods such as Wilkinson's (2012, doi:10.1109/TVCG.2011.56) and the ellipse-based eulerAPE (Micallef and Rodgers 2014, doi:10.1371/journal.pone.0101717).
Venn diagram vs Euler diagram
A Venn diagram must contain every possible combination of its sets (two sets have 4, three sets have 8, and so on), including the empty ones, while an Euler diagram draws only the combinations that exist, so one set can sit inside another or two sets can be kept apart (Wikipedia; for a survey of the variants see Rodgers 2014, doi:10.1016/j.jvlc.2013.08.006). In the FDA data, nobody has breakthrough therapy without an orphan designation or priority review, so an Euler diagram leaves that region out (way 9 below). Most charts called Venn diagrams in data work are Euler diagrams in this sense.
Why area-proportional diagrams with three sets can't always be exact
In an area-proportional diagram the area of each region is its count. Two circles can always do this: three numbers (two set sizes and the overlap) fix two radii and one distance. Three circles have 6 free numbers (three radii and three distances between centers) but a three-set diagram has 7 regions to match, so once the circles match the set sizes and the pairwise overlaps, the middle region is already decided and usually comes out wrong. Micallef and Rodgers put it this way: "circles cannot draw accurate diagrams for most 3-set data" (2014). Ellipses have more free numbers, so they can match all seven regions, which is why eulerAPE and the R package eulerr use them (ways 7 and 8 below show both on the FDA data). The 6 against 7 count is our own arithmetic, and past three sets even ellipses can't always match every region.
Alternatives to a Venn diagram
Here's the same three FDA designations drawn six ways. Some are better for the question, some worse, some just different:
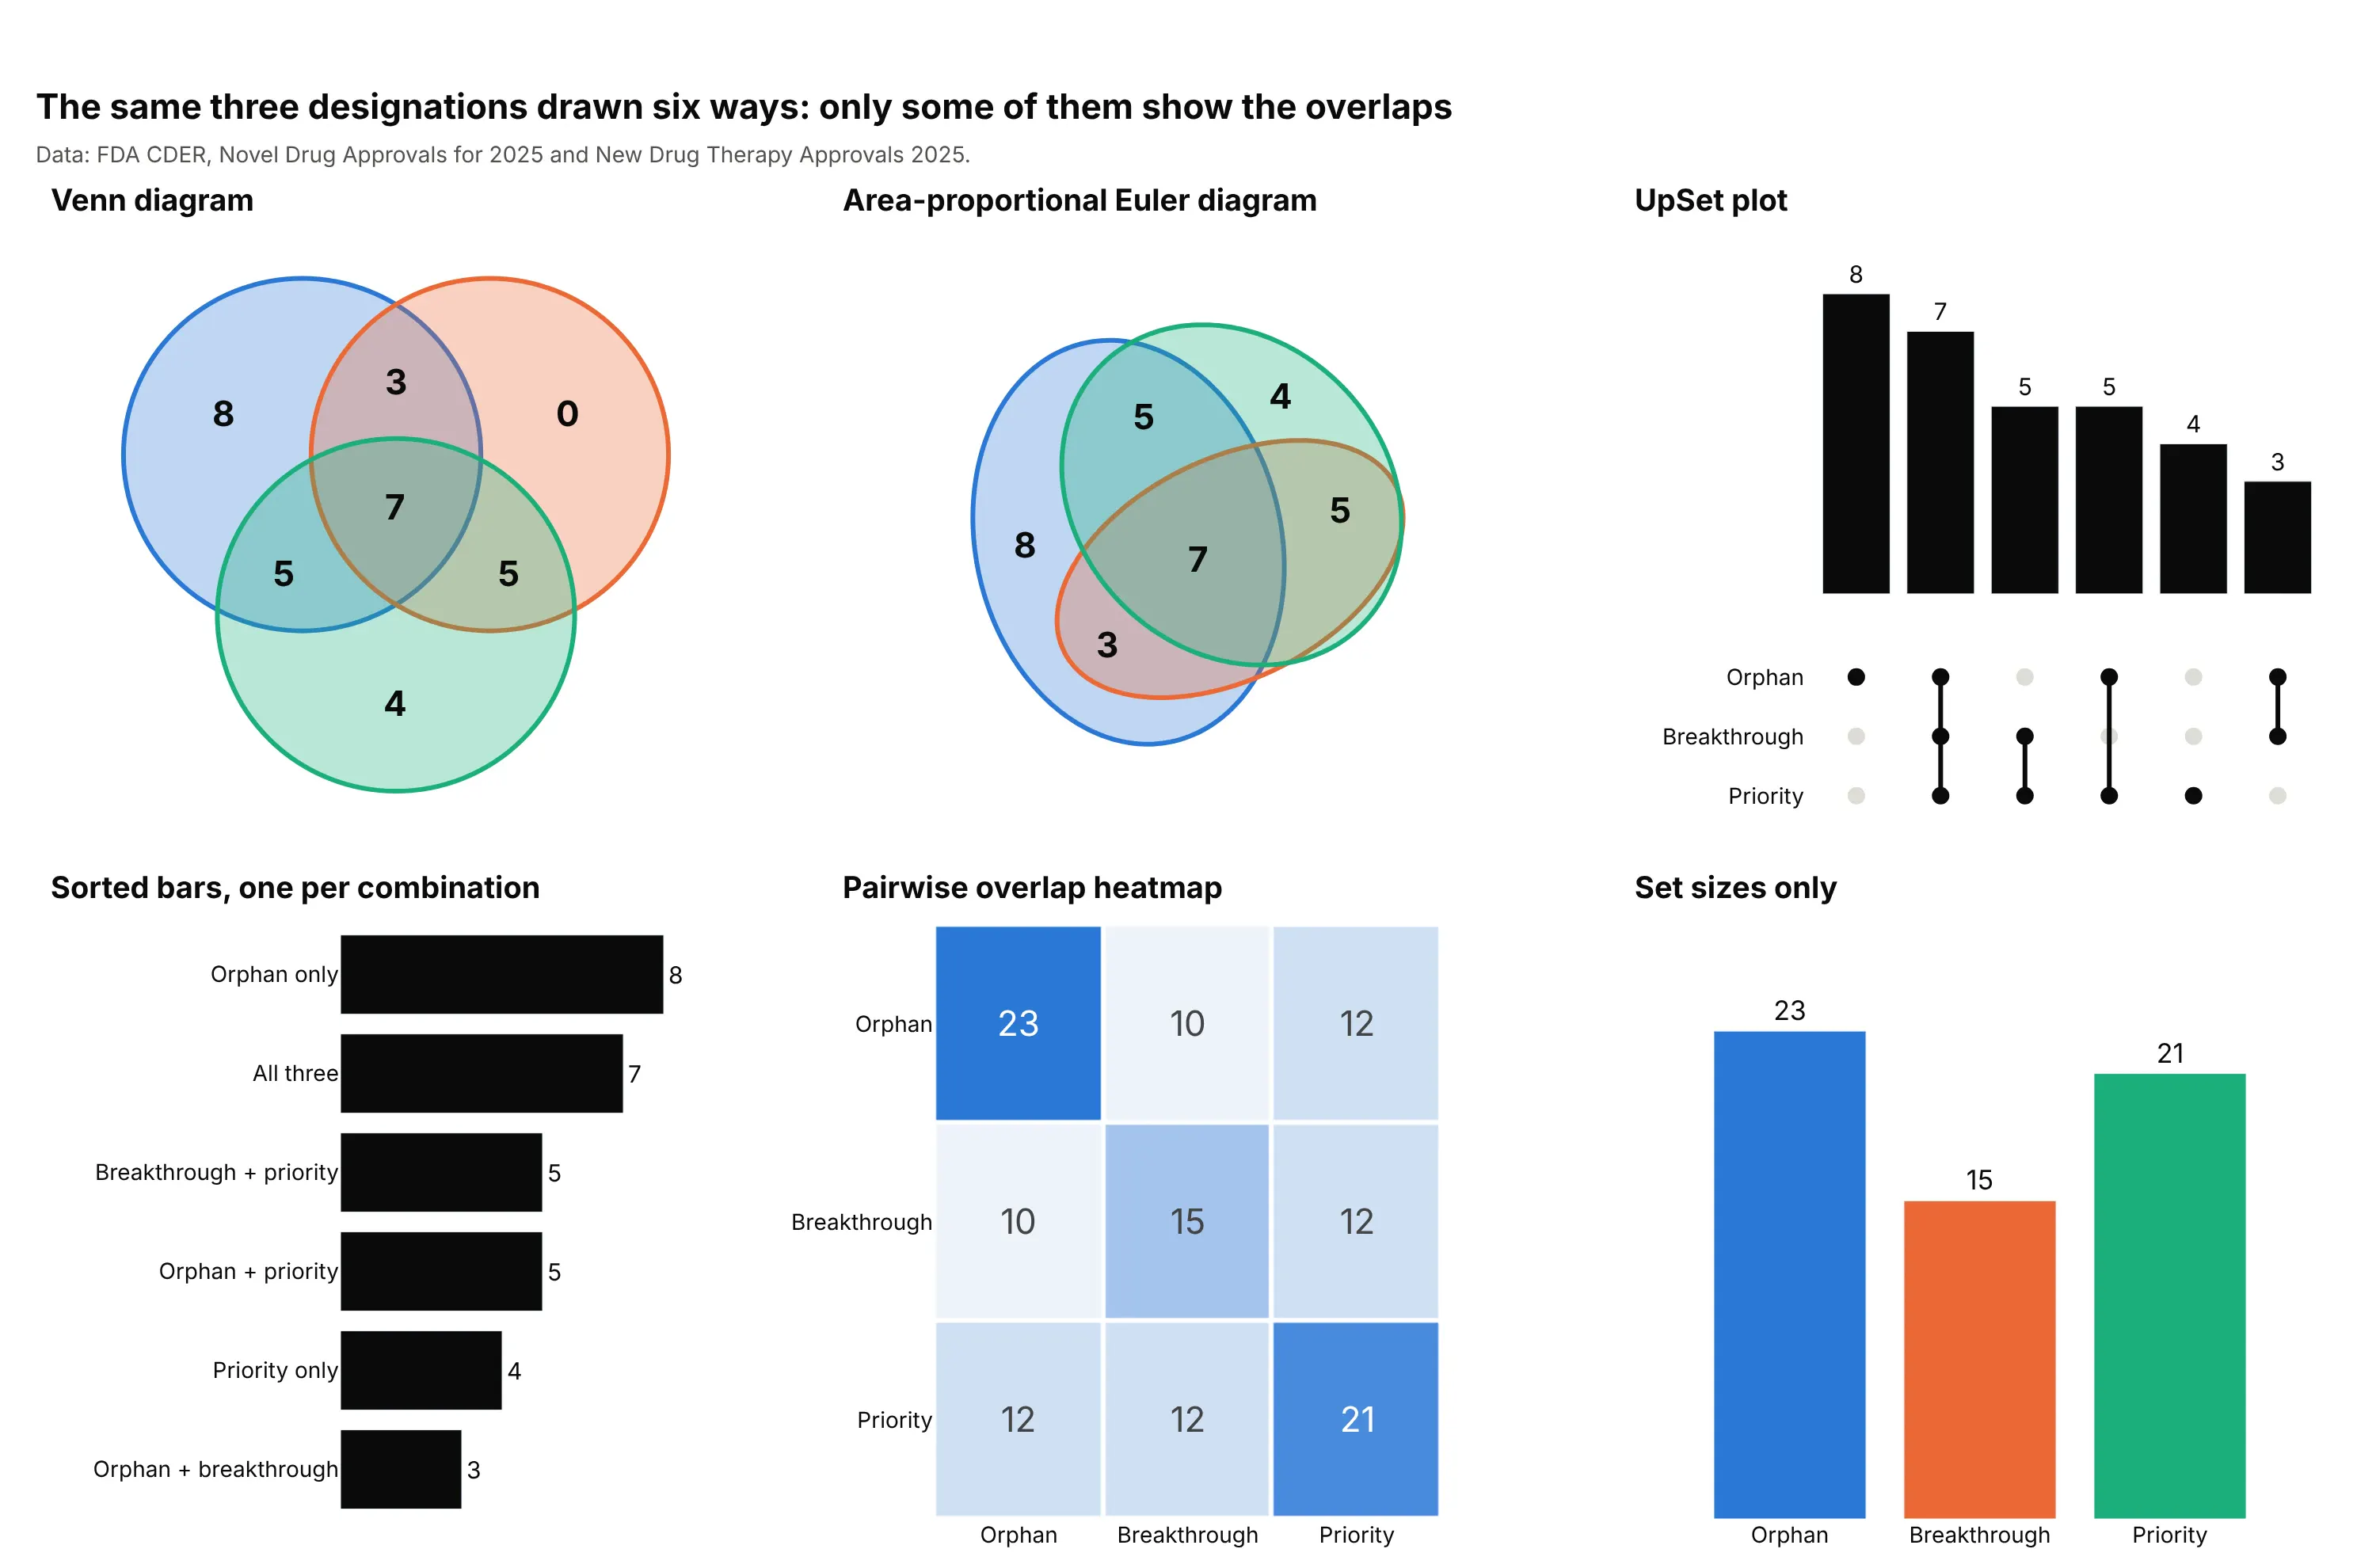
- Venn diagram (works for two or three sets). It shows every combination and reads at a glance, but the circles are the same size whatever the counts, and four or more sets get hard to read.
- Area-proportional Euler diagram (better when sizes matter). The areas carry the counts, as long as you say so, and with three sets it needs ellipses to be exact.
- UpSet plot (better for four or more sets). One bar per combination on a shared baseline, sorted by size, with a dot matrix saying which sets each bar is. Five sets have 31 combinations, and an UpSet plot lists the ones that occur.
- Sorted bars, one per combination (better for comparing region sizes). Orphan only at 8 and all three at 7 are easy to compare as bars. It's an UpSet plot without the matrix, and long labels are its cost.
- Heatmap of pairwise overlaps (different). Shows the overlap of every pair, here 12 drugs with both orphan and priority review, and scales to dozens of sets, but can't show three-way combinations.
- Bar chart of set sizes (worse). It hides the overlaps, which is the question.
How to make a Venn diagram
With AI
ChatGPT, Claude Code, GitHub Copilot, Cursor and other AI tools are excellent at writing Plotly code. Name Plotly in the prompt, say how the circles should be drawn, and list the checks you want:
Make a plotly Venn diagram of three sets from drugs.csv (one row per drug, 0/1 columns: orphan,breakthrough, priority).- Count the drugs in exactly each of the 8 combinations with groupby.- Draw three equal circles with fig.add_shape(type="circle"), semi-transparent fills in the setcolors and a solid outline, and one bold count per region with fig.add_annotation.- Put the circles on axes with visible=False and yaxis scaleanchor="x" so they stay round, and show thecount of drugs in none of the sets in a corner.- Put each set name and its total beside its circle in the set color, Inter font, white background,and a title that states the takeaway.- Check that the seven region counts add up to the number of drugs in at least one set.
With Plotly Studio
Plotly Studio is a product for creating data visualizations and Dash apps and for analyzing data with AI, available as a desktop app or embedded in Dash apps. Ask for a Venn diagram the same way:
Make a Venn diagram of the orphan, breakthrough and priority review columns: three circles with the number of drugs in each region, the set totals beside the circles, and a dropdown to switch which three designations are shown.
Make a Venn diagram in Python or JavaScript
Plotly can draw a Venn diagram from circle shapes and text annotations, which is what AI tools write under the hood. The helper below draws three equal circles and puts a count in each region. The numbers are the FDA example from the top of this guide:
import plotly.graph_objects as godef make_venn(counts, names, colors, title=""):"""Three-circle Venn diagram. counts maps (a, b, c) flags to the items in exactly those sets,for example (1, 1, 0) is "in the first and second set but not the third"."""s = 1.05 # distance between circle centerscenters = [(-s / 2, s * 3 ** 0.5 / 6), (s / 2, s * 3 ** 0.5 / 6), (0, -s * 3 ** 0.5 / 3)]spots = {(1, 0, 0): (-0.96, 0.53), (0, 1, 0): (0.96, 0.53), (0, 0, 1): (0, -1.11), (1, 1, 0): (0, 0.72),(1, 0, 1): (-0.63, -0.37), (0, 1, 1): (0.63, -0.37), (1, 1, 1): (0, 0.01)} # where each count goesfig = go.Figure()for (x, y), color, name in zip(centers, colors, names):fig.add_shape(type="circle", x0=x - 1, x1=x + 1, y0=y - 1, y1=y + 1, layer="below",fillcolor=color + "4d", line=dict(color=color, width=3)) # 4d = 30% opaquefig.add_annotation(x=x * 2.2, y=y * 2.2 + (0.2 if y > 0 else -0.35), text=f"<b>{name}</b>",showarrow=False, font=dict(color=color, size=18))for region, (x, y) in spots.items():fig.add_annotation(x=x, y=y, text=f"<b>{counts.get(region, 0)}</b>", showarrow=False, font_size=24)fig.update_xaxes(visible=False, range=[-2.6, 2.6], fixedrange=True)fig.update_yaxes(visible=False, range=[-2.0, 2.0], scaleanchor="x", fixedrange=True) # equal scale: round circlesfig.update_layout(title=title, template="simple_white", width=800, height=600, margin=dict(t=60, b=20))return figcounts = {(1, 0, 0): 8, (0, 1, 0): 0, (0, 0, 1): 4, (1, 1, 0): 3, (1, 0, 1): 5, (0, 1, 1): 5, (1, 1, 1): 7}fig = make_venn(counts, ["Orphan drug", "Breakthrough therapy", "Priority review"], ["#2a78d6", "#eb6834", "#1baf7a"],title="Seven of the 46 novel drugs of 2025 had all three designations")fig.show()
To get the counts from a table with one row per item and a 0/1 column per set, use df.groupby(["orphan", "breakthrough", "priority"]).size(). The area-proportional version only needs the circle distance that gives a chosen overlap. The area where two circles overlap has a closed formula, so brentq finds the distance:
import numpy as npfrom scipy.optimize import brentqdef lens_area(r1, r2, d):"""Area where two circles with radii r1 and r2, d apart, overlap."""if d >= r1 + r2:return 0.0if d <= abs(r1 - r2):return np.pi * min(r1, r2) ** 2a1 = r1 ** 2 * np.arccos((d ** 2 + r1 ** 2 - r2 ** 2) / (2 * d * r1))a2 = r2 ** 2 * np.arccos((d ** 2 + r2 ** 2 - r1 ** 2) / (2 * d * r2))return a1 + a2 - 0.5 * np.sqrt((-d + r1 + r2) * (d + r1 - r2) * (d - r1 + r2) * (d + r1 + r2))def proportional_pair(a, b, both):"""Centers and radii of two circles with areas a and b that overlap by exactly `both`."""r1, r2 = np.sqrt(a / np.pi), np.sqrt(b / np.pi)d = brentq(lambda d: lens_area(r1, r2, d) - both, abs(r1 - r2), r1 + r2)return (0, 0, r1), (d, 0, r2)# Orphan drugs (23), priority review (21), both (12): the circles' areas are in drugs(x1, y1, r1), (x2, y2, r2) = proportional_pair(23, 21, 12)
Pass the circles to fig.add_shape(type="circle", ...) as above. For three sets, the same distances give circles that match the set sizes and every pairwise overlap, and a fitting step (as in eulerr) or ellipses improves the rest; the figures in this guide use scipy.optimize.minimize on region areas counted on a grid.
In JavaScript, plotly.js takes the same shapes and annotations in the layout:
<div id="chart"></div><script src="https://cdn.plot.ly/plotly-4.1.1.min.js"></script><script>const colors = ["#2a78d6", "#eb6834", "#1baf7a"];const names = ["Orphan drug", "Breakthrough therapy", "Priority review"];const s = 1.05;const centers = [[-s / 2, s * Math.sqrt(3) / 6], [s / 2, s * Math.sqrt(3) / 6], [0, -s * Math.sqrt(3) / 3]];const counts = [[-0.96, 0.53, 8], [0.96, 0.53, 0], [0, -1.11, 4], [0, 0.72, 3], [-0.63, -0.37, 5], [0.63, -0.37, 5], [0, 0.01, 7]];const shapes = centers.map(([x, y], i) => ({type: "circle", x0: x - 1, x1: x + 1, y0: y - 1, y1: y + 1, layer: "below",fillcolor: colors[i] + "4d", line: {color: colors[i], width: 3}}));const annotations = [...counts.map(([x, y, n]) => ({x, y, text: "<b>" + n + "</b>", showarrow: false, font: {size: 24}})),...centers.map(([x, y], i) => ({x: x * 2.2, y: y * 2.2 + (y > 0 ? 0.2 : -0.35), text: "<b>" + names[i] + "</b>",showarrow: false, font: {size: 18, color: colors[i]}}))];Plotly.newPlot("chart", [], {shapes, annotations, width: 800, height: 600, margin: {t: 60, b: 20},title: {text: "Seven of the 46 novel drugs of 2025 had all three designations"},xaxis: {visible: false, range: [-2.6, 2.6], fixedrange: true},yaxis: {visible: false, range: [-2, 2], scaleanchor: "x", fixedrange: true}});</script>
Share it
Every Plotly chart has a Share chart button (the cloud icon in its toolbar) that uploads it to Plotly Cloud and gives you a link. Only you can see it until you change its visibility.
For a live app, put the chart in a Dash app and publish it with the Plotly Cloud CLI. Coding agents can run these commands for you:
pip install "dash[cloud]"plotly user loginplotly app publish
If your data has to stay in your own cloud or data center, publish to Dash Enterprise instead.
Dos and don'ts
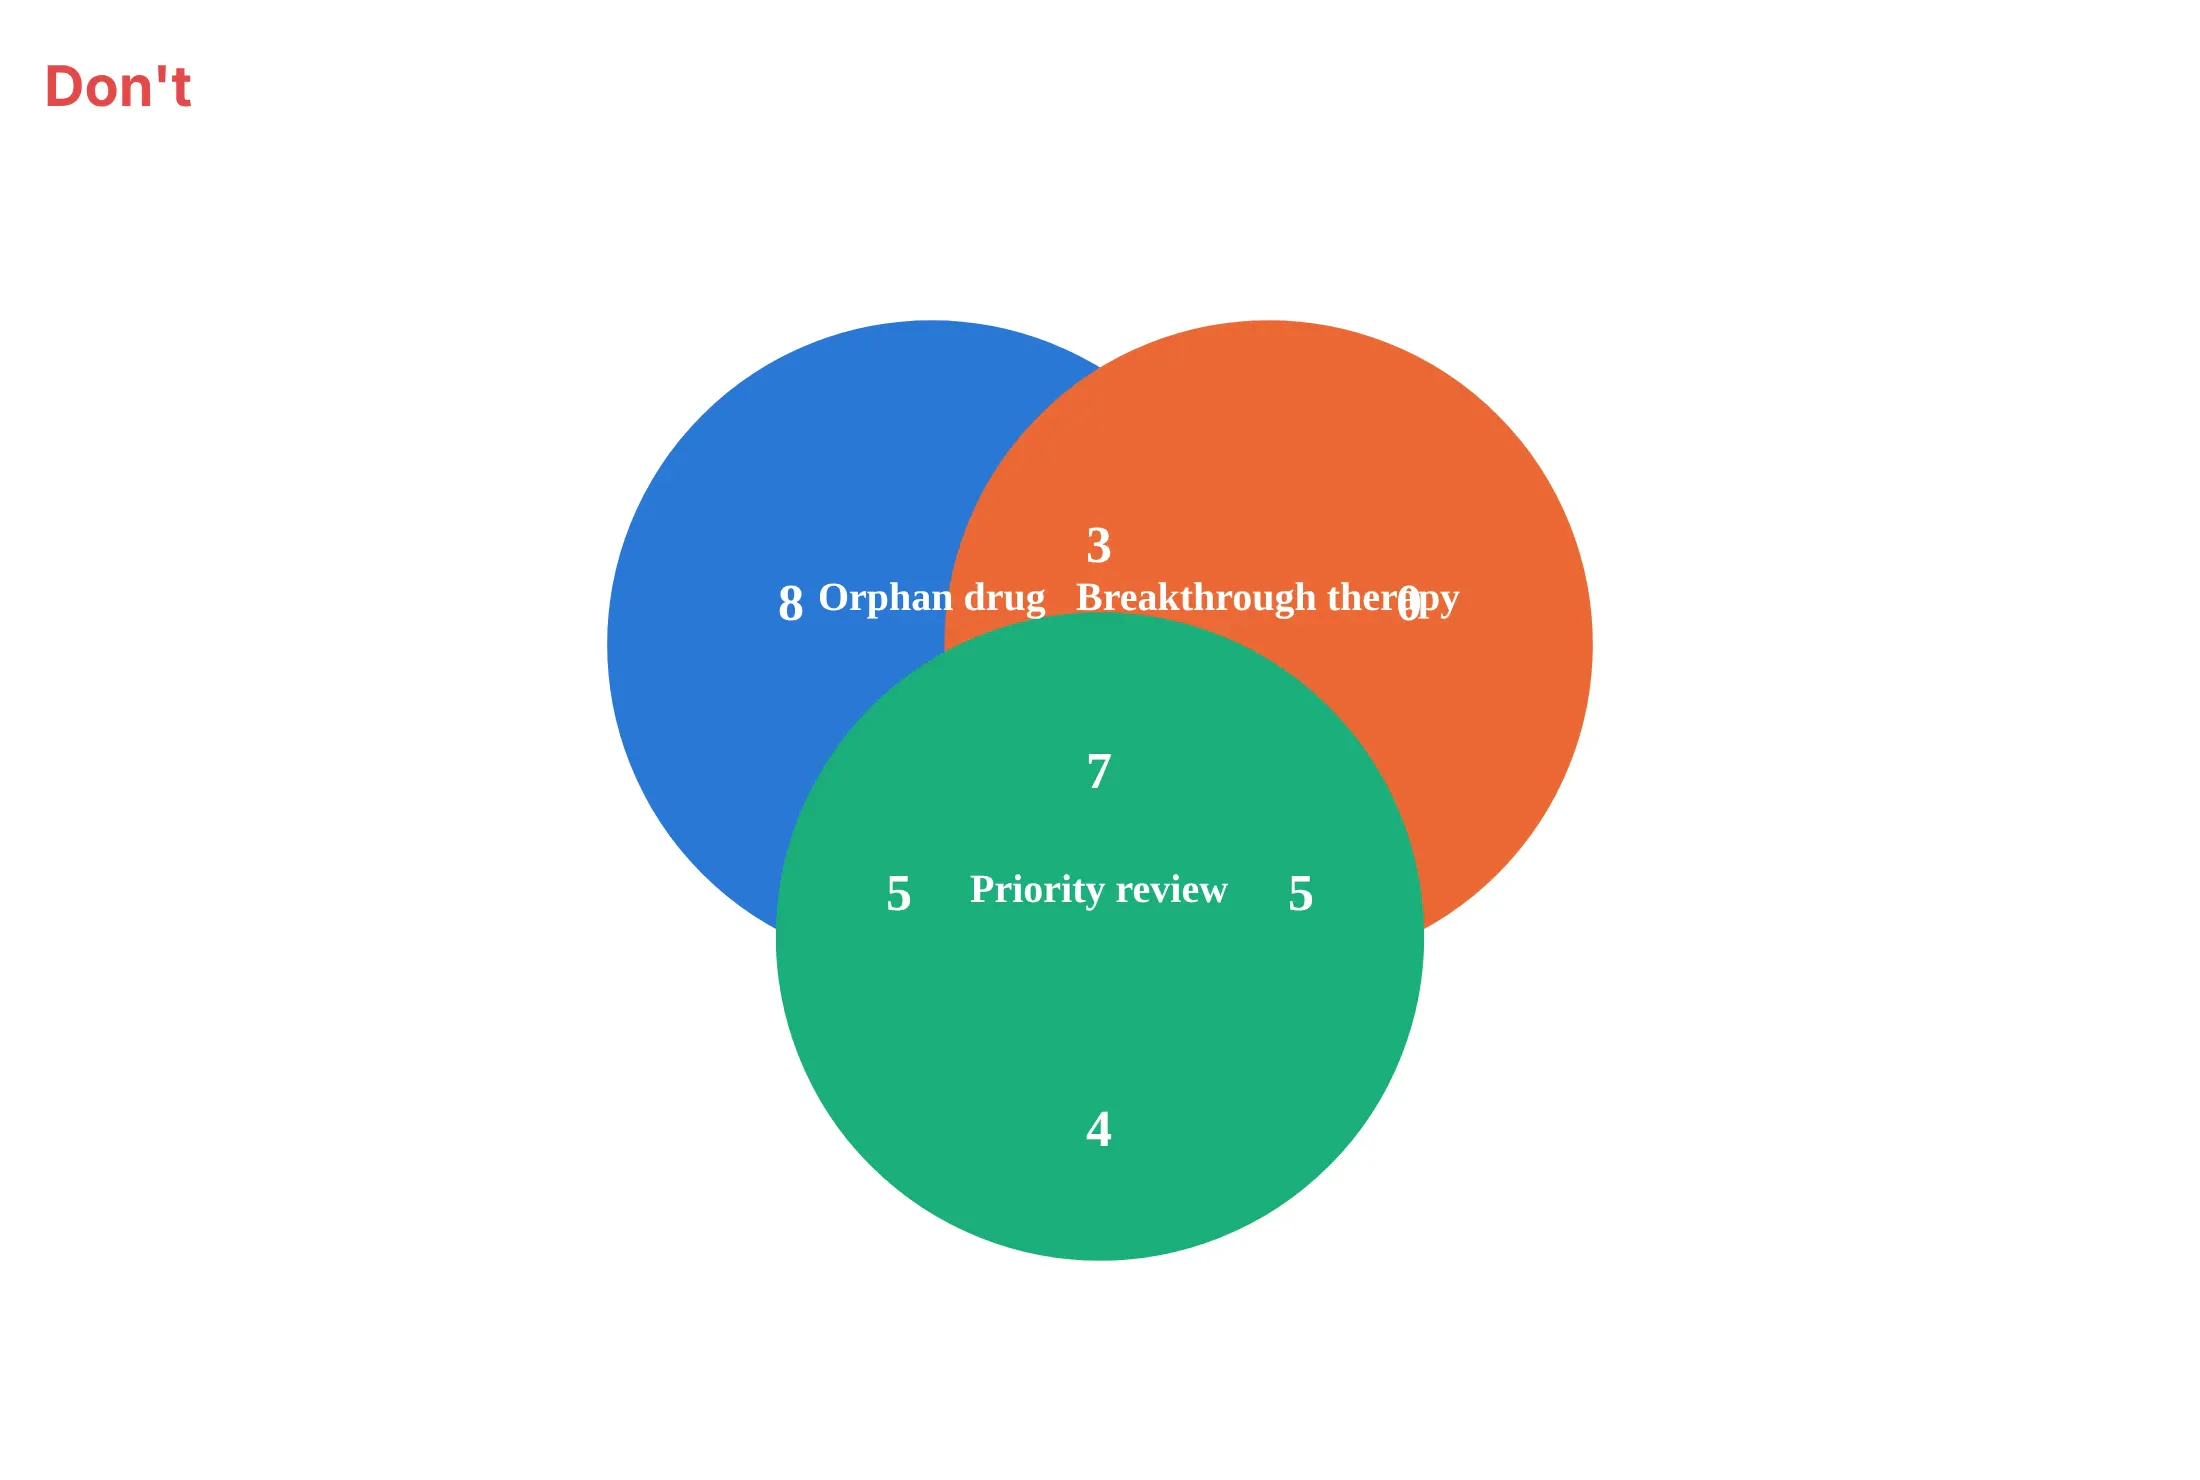
A Venn diagram is simple enough that the mistakes are about what is hidden. Here is the same FDA data both ways.
Don't fill the circles with solid color, print set names on top of the counts, drop the set totals and the count of items outside every circle, or leave the default serif font:
Do use semi-transparent fills so the overlaps show, put a count in every region, show each set's total beside its name, and give the number outside the circles in a labeled universe rectangle:
Checklist
Do
- Put a number in every region, including zeros, and say whether it counts items in exactly that region.
- Use semi-transparent fills and a solid outline in the same color, so overlaps blend and every circle stays visible.
- Show each set's total next to its name, and the count outside all sets in a labeled universe rectangle.
- Say in the subtitle when circle areas are proportional to counts, and when they are not.
- Keep to two or three sets, and use an UpSet plot beyond that.
Don't
- Use solid fills that hide the overlaps.
- Size circles by counts without matching the overlaps, or let readers assume equal circles show equal counts.
- Leave regions unlabeled and rely on hover to tell which one is which.
- Mix counts of exactly one region with counts of whole sets in the same diagram.
11 ways to draw a Venn diagram
A Venn diagram has more forms than most people use. We took the 46 novel drugs the FDA approved in 2025 and the designations they received (orphan drug, breakthrough therapy and priority review, plus fast track, which speeds development and review of drugs for serious conditions, and accelerated approval, which allows approval on a surrogate endpoint, for the larger diagrams) and drew them 11 ways. Each one answers a slightly different question.
1. Two circles from shapes
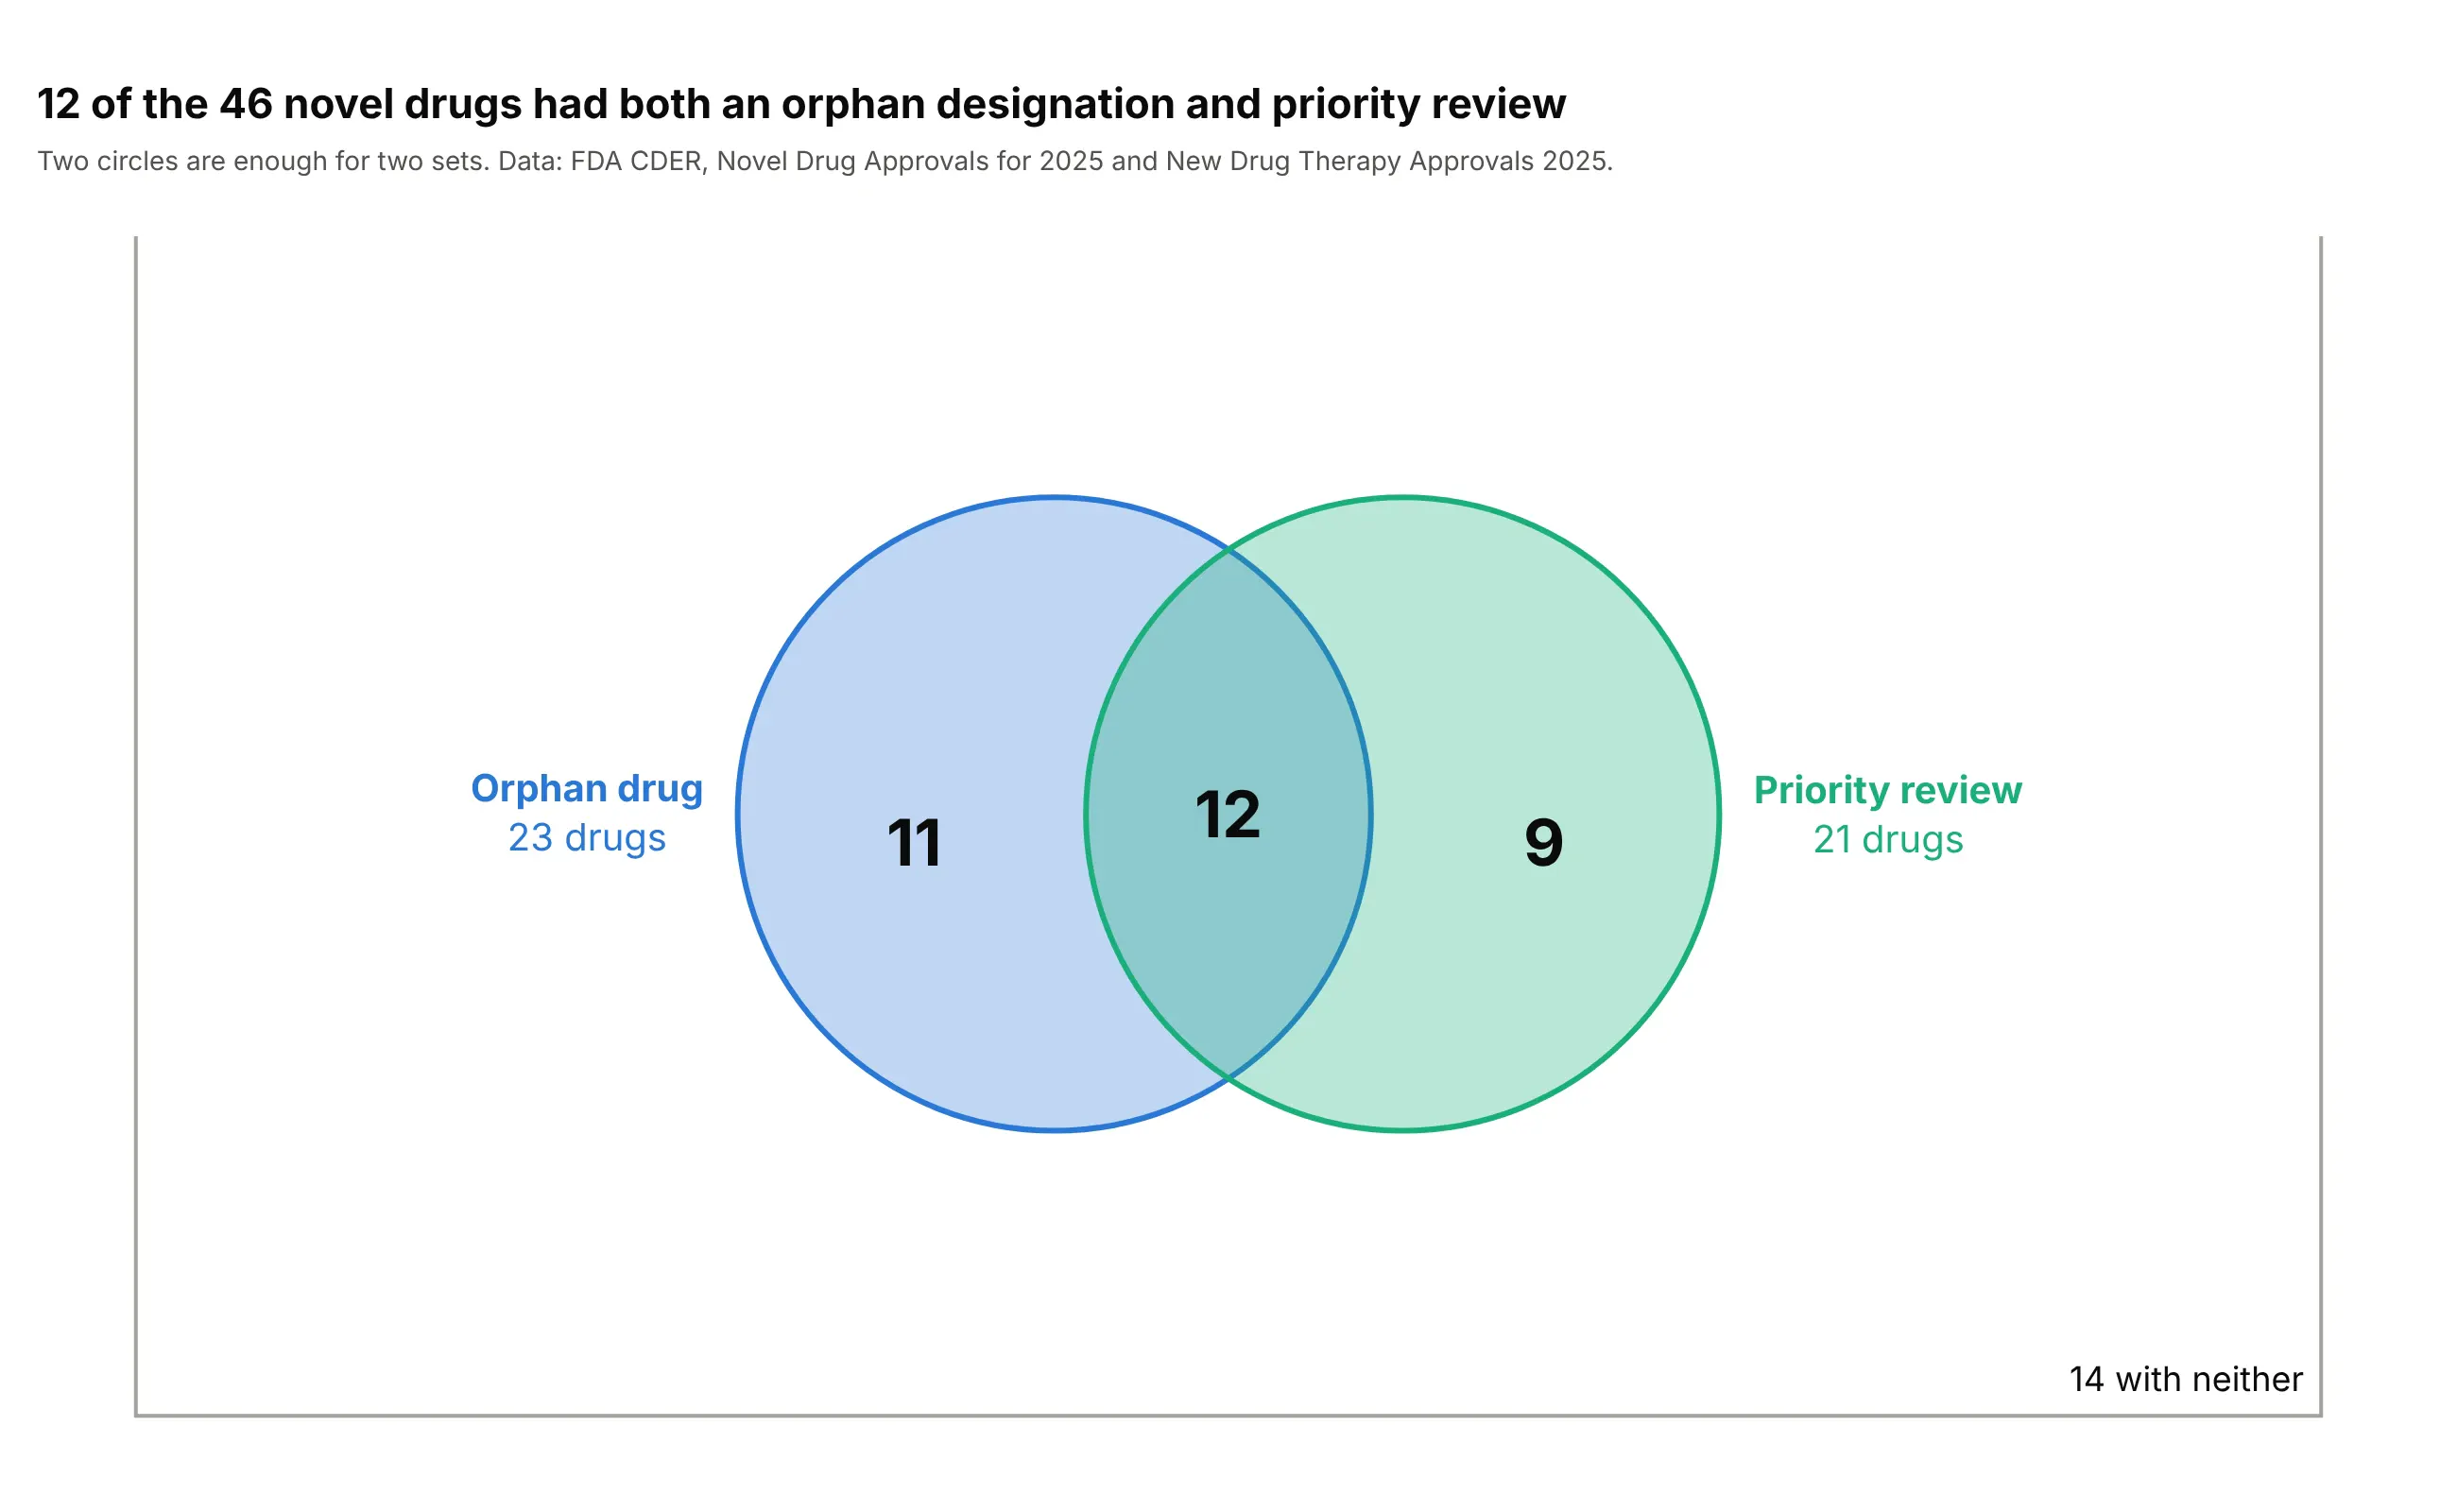
Two circles are enough for two sets: 12 of the 46 drugs had both an orphan designation and priority review, 11 only the first and 9 only the second. Each circle is one fig.add_shape(type="circle", x0=, y0=, x1=, y1=) with a semi-transparent fillcolor, and each count is a fig.add_annotation(showarrow=False). Setting yaxis_scaleanchor="x" keeps the circles round.
Prompt: Get the data from the FDA CDER Novel Drug Approvals for 2025 page and the New Drug Therapy Approvals 2025 report (fda.gov), 46 drugs with 0/1 columns for orphan and priority review. Make a plotly two-circle Venn diagram with fig.add_shape(type="circle"), fillcolor with 30% opacity, add_annotation counts for the three regions, yaxis scaleanchor="x", a rectangle for all 46 drugs with the 14 in neither, and a takeaway title.
2. Shares instead of counts
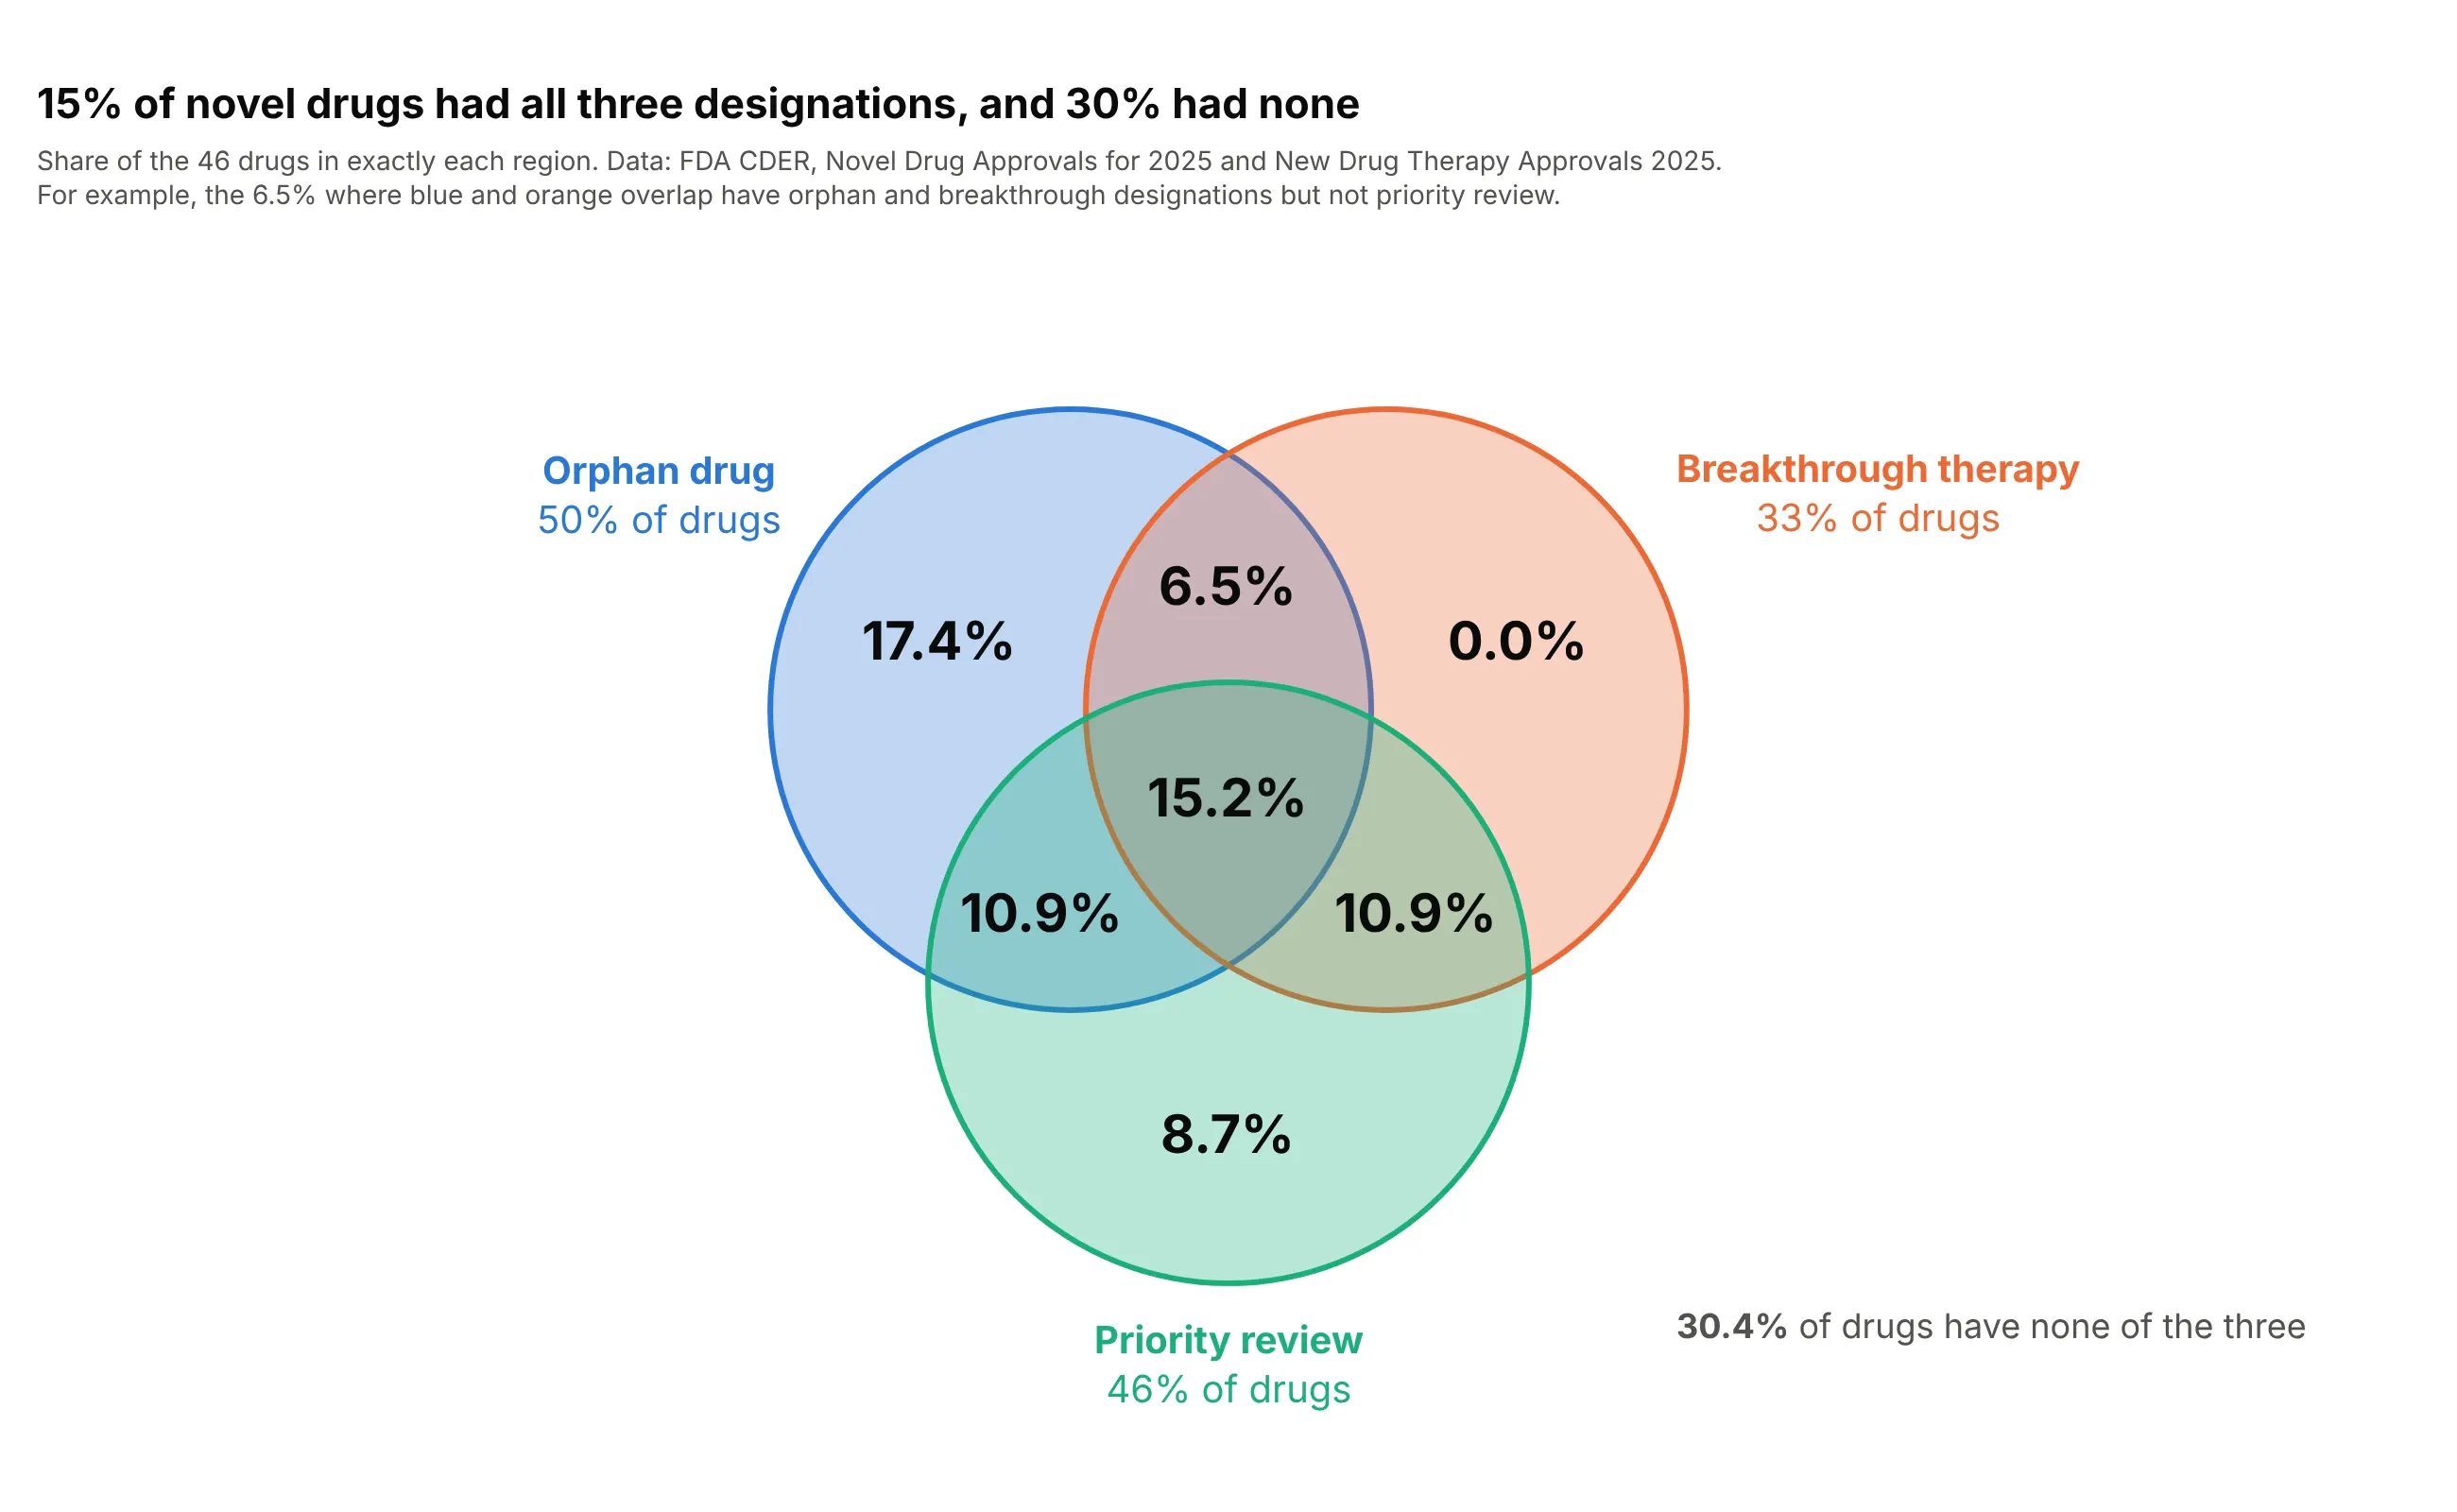
Percentages answer "how common is this?" when the total is known and the reader will compare diagrams of different sizes: 15.2% of the drugs had all three designations and 30.4% none. Divide each count by the total before writing it into the annotation, and say in the subtitle which total you used. Keep one decimal, since a region of one drug is already 2.2%.
Prompt: Get the data from the FDA CDER Novel Drug Approvals for 2025 page and the New Drug Therapy Approvals 2025 report, 46 drugs with 0/1 columns orphan, breakthrough and priority. Make a plotly three-circle Venn diagram (add_shape circles, add_annotation) labeled with the share of all 46 drugs in each region to one decimal, a universe rectangle with the share in none, and a title that states the largest shares.
3. One region highlighted
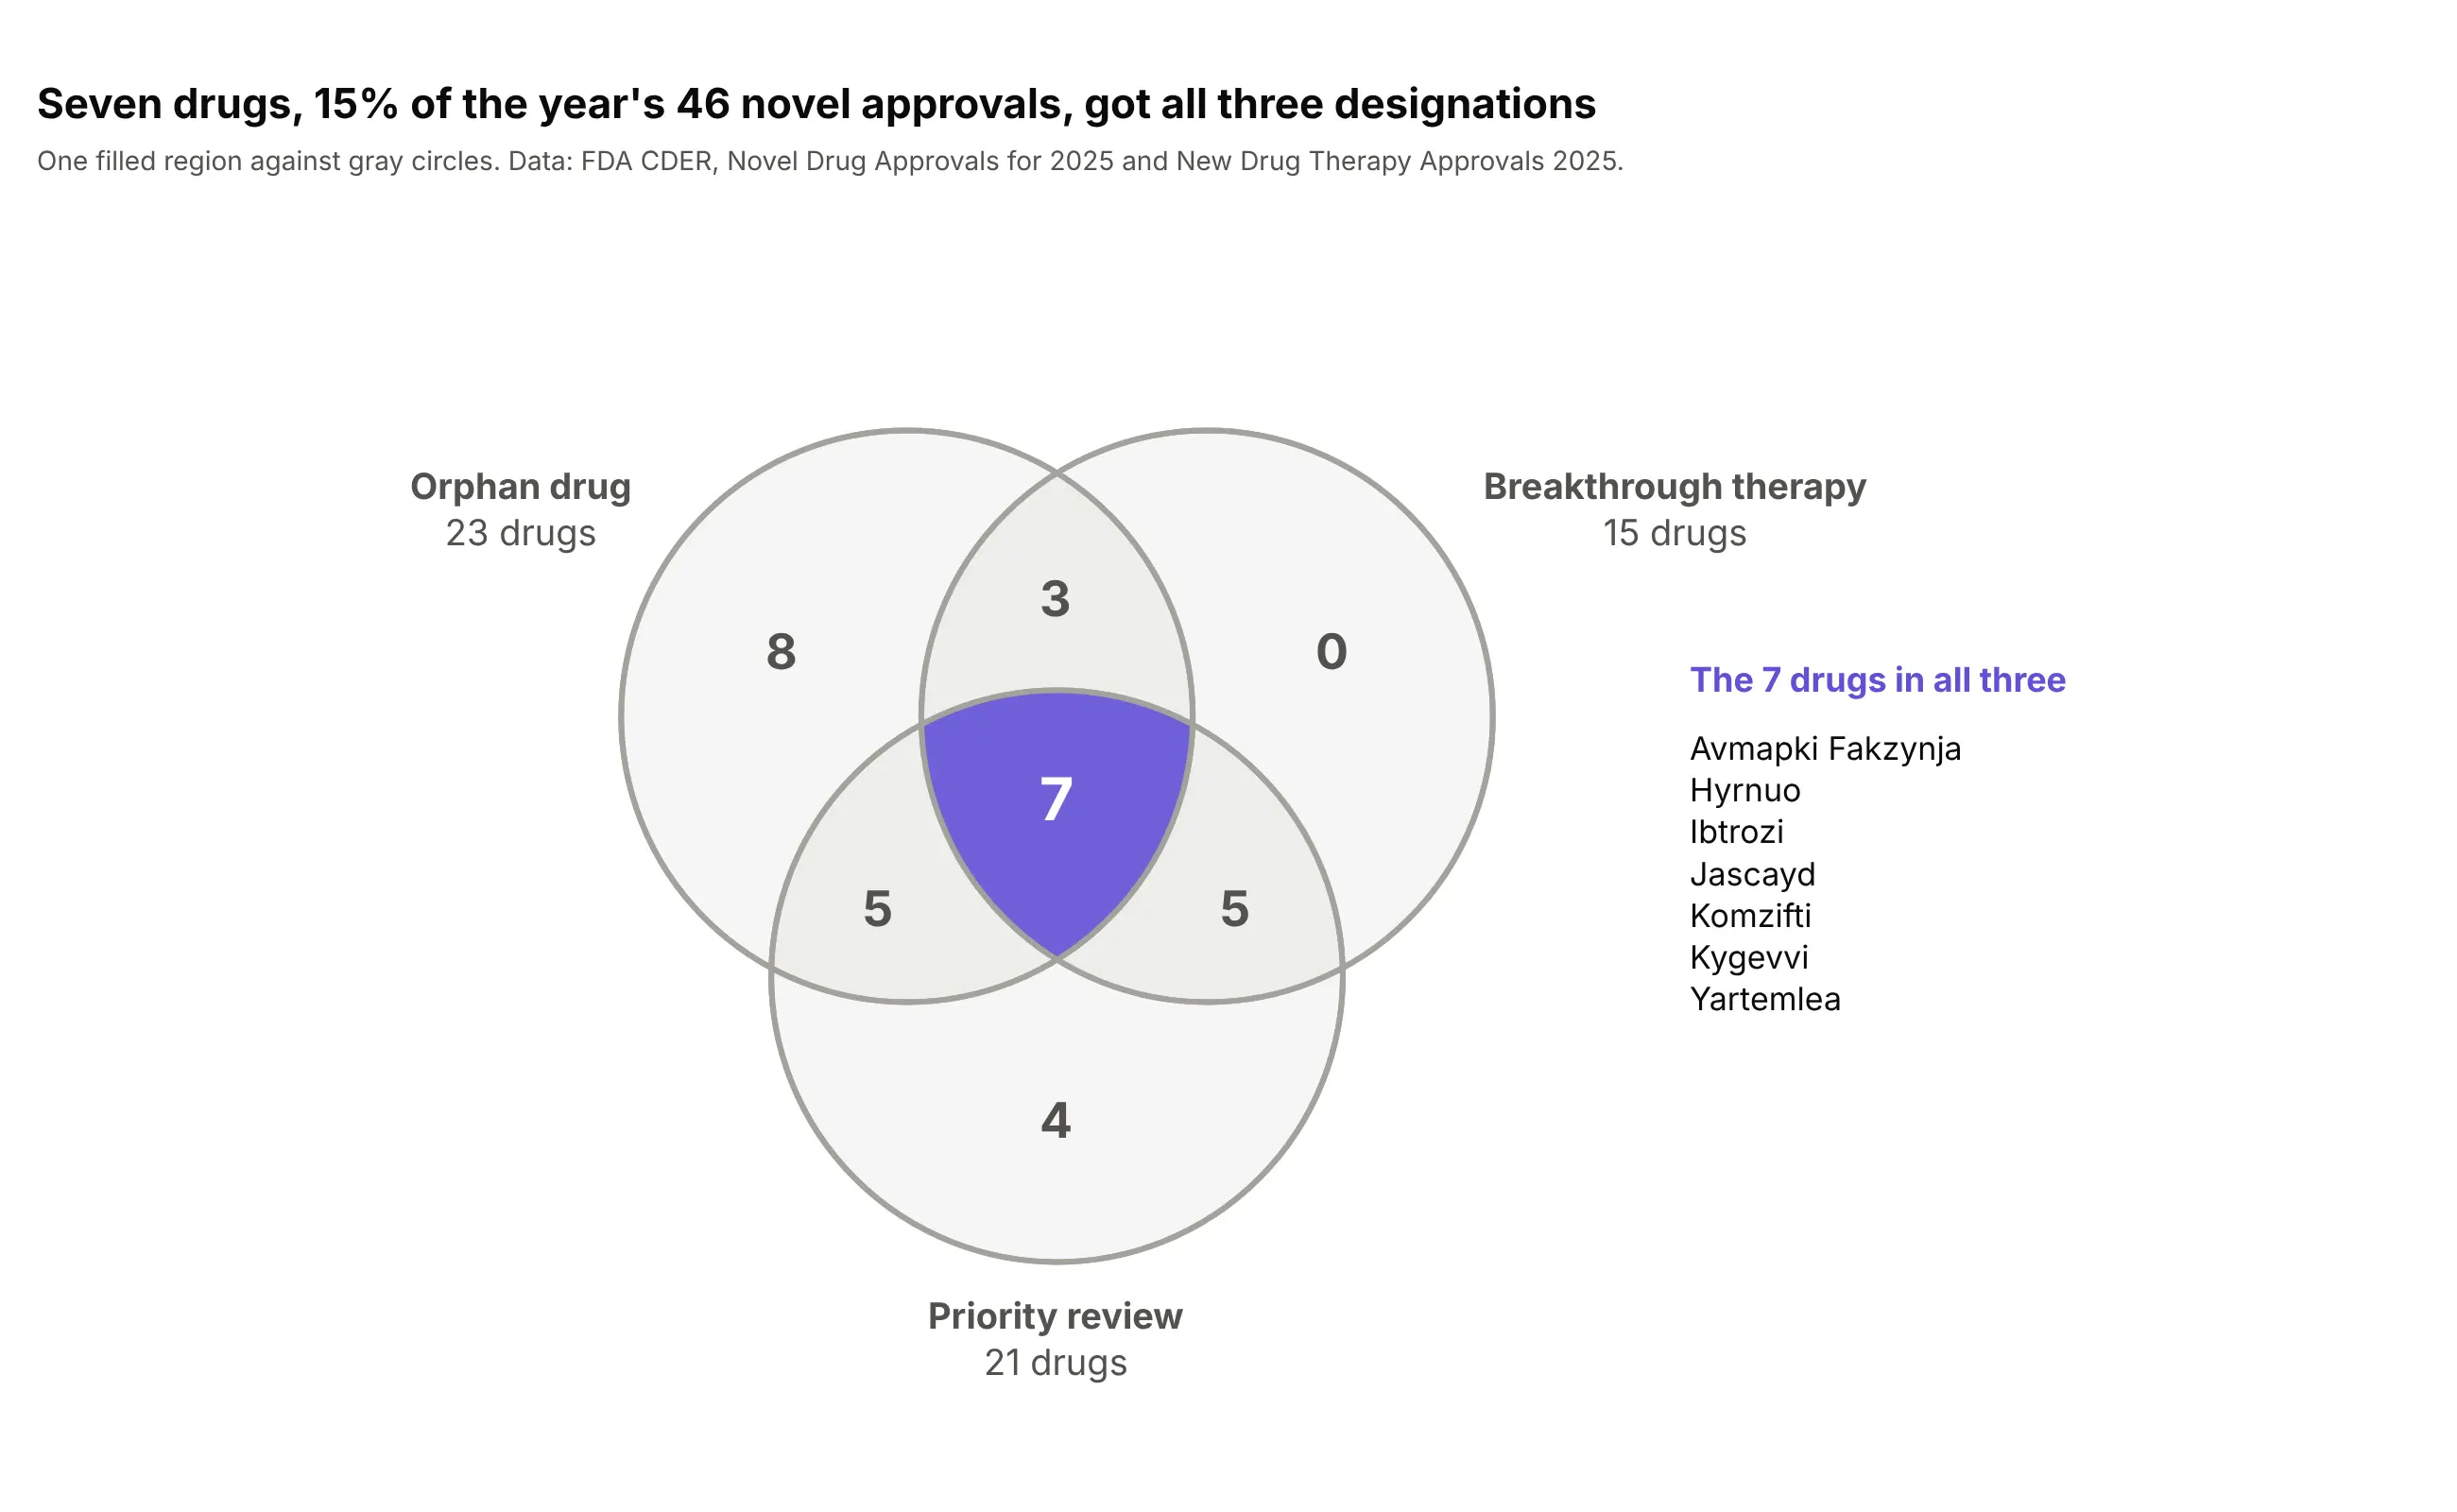
When the story is one combination, draw the circles in gray and fill only that region: seven drugs, 15% of the year's approvals, had all three designations. Plotly can't fill the overlap of two shapes directly, so compute the region outline (for example with shapely's intersection and difference) and draw it as a type="path" shape with fillrule="evenodd". Muted numbers elsewhere keep the focus.
Prompt: Get the data from the FDA CDER Novel Drug Approvals for 2025 page and the New Drug Therapy Approvals 2025 report with 0/1 columns orphan, breakthrough and priority. Make a plotly three-circle Venn diagram with gray circles and counts, filling only the region where all three overlap with a purple path shape (outline computed with shapely, fillrule="evenodd"), white bold count, and the names of those drugs listed on the right.
4. Names inside the regions
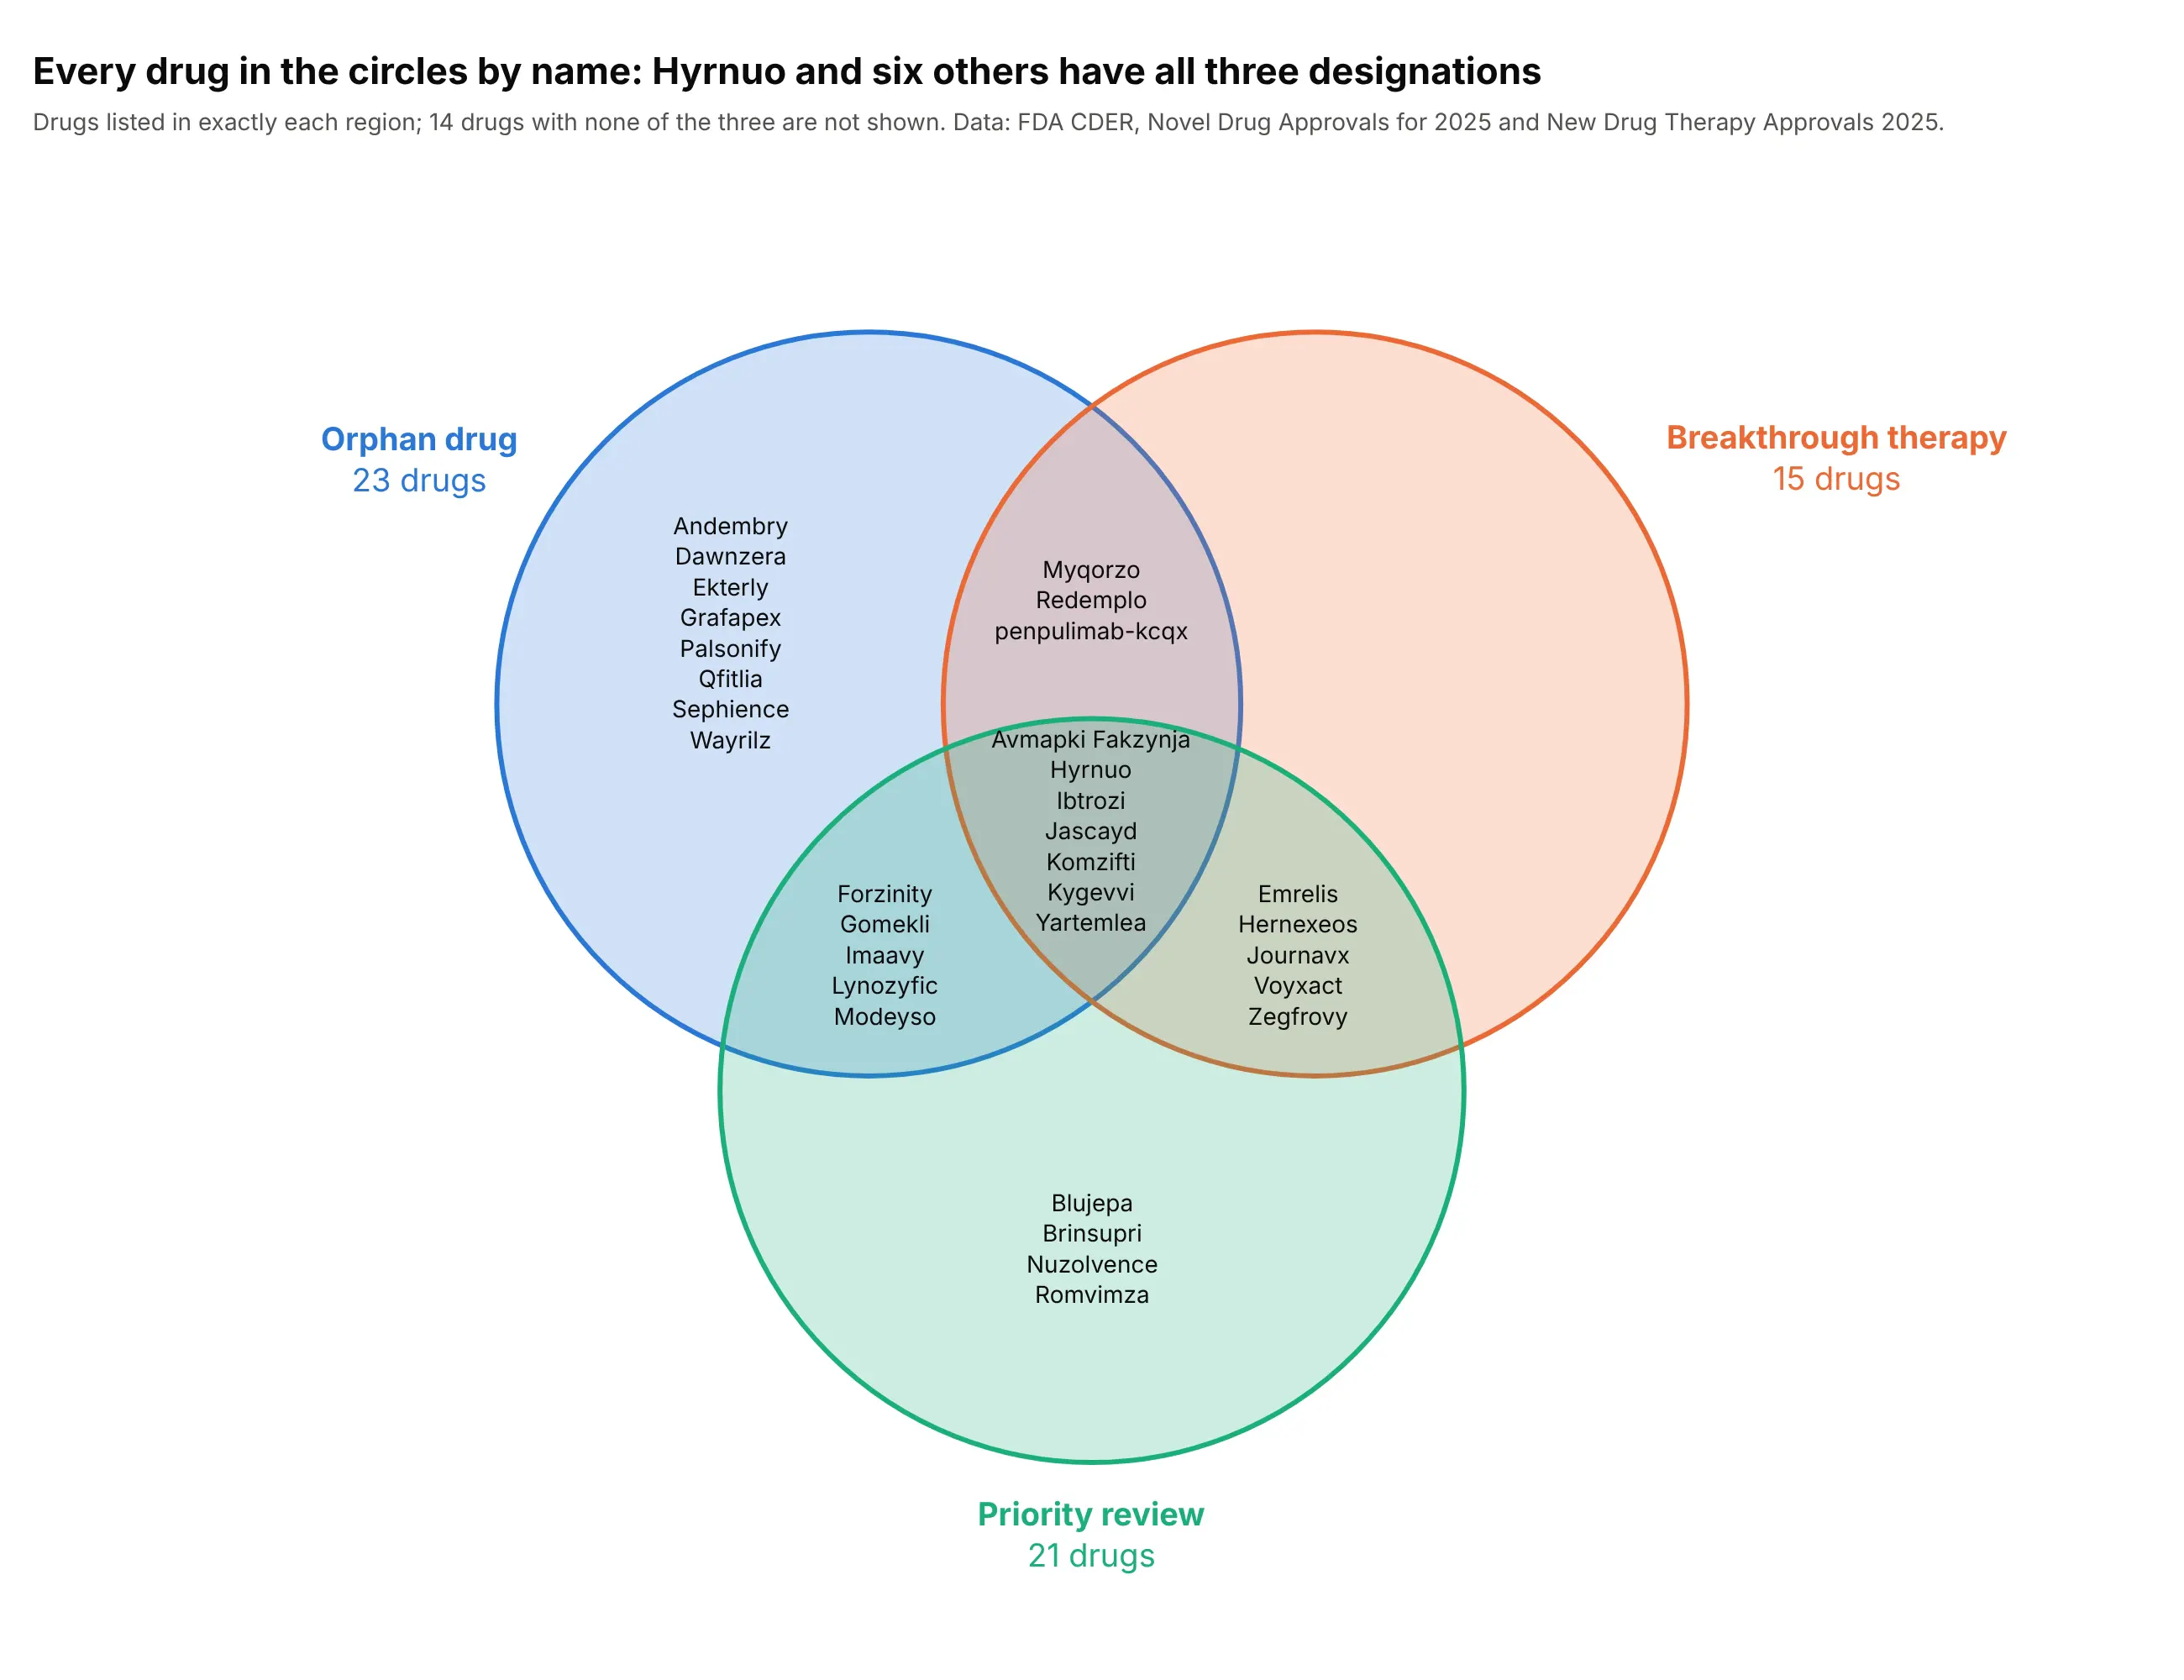
With a few dozen items, names are more useful than counts: here every one of the 32 drugs that have at least one of the three designations is listed in its region. Make the circles large, join the names with <br> in one annotation per region and use a 14 px font. Past about 8 names a region the text stops fitting, and a table or an UpSet plot is better.
Prompt: Get the data from the FDA CDER Novel Drug Approvals for 2025 page and the New Drug Therapy Approvals 2025 report with the brand name and 0/1 columns orphan, breakthrough and priority. Make a large plotly three-circle Venn diagram that lists the drug names in each region as one add_annotation per region (names joined with "<br>", font size 14), set names with totals outside the circles, and a title that states the number with all three.
5. Circles as traces, with a legend and hover
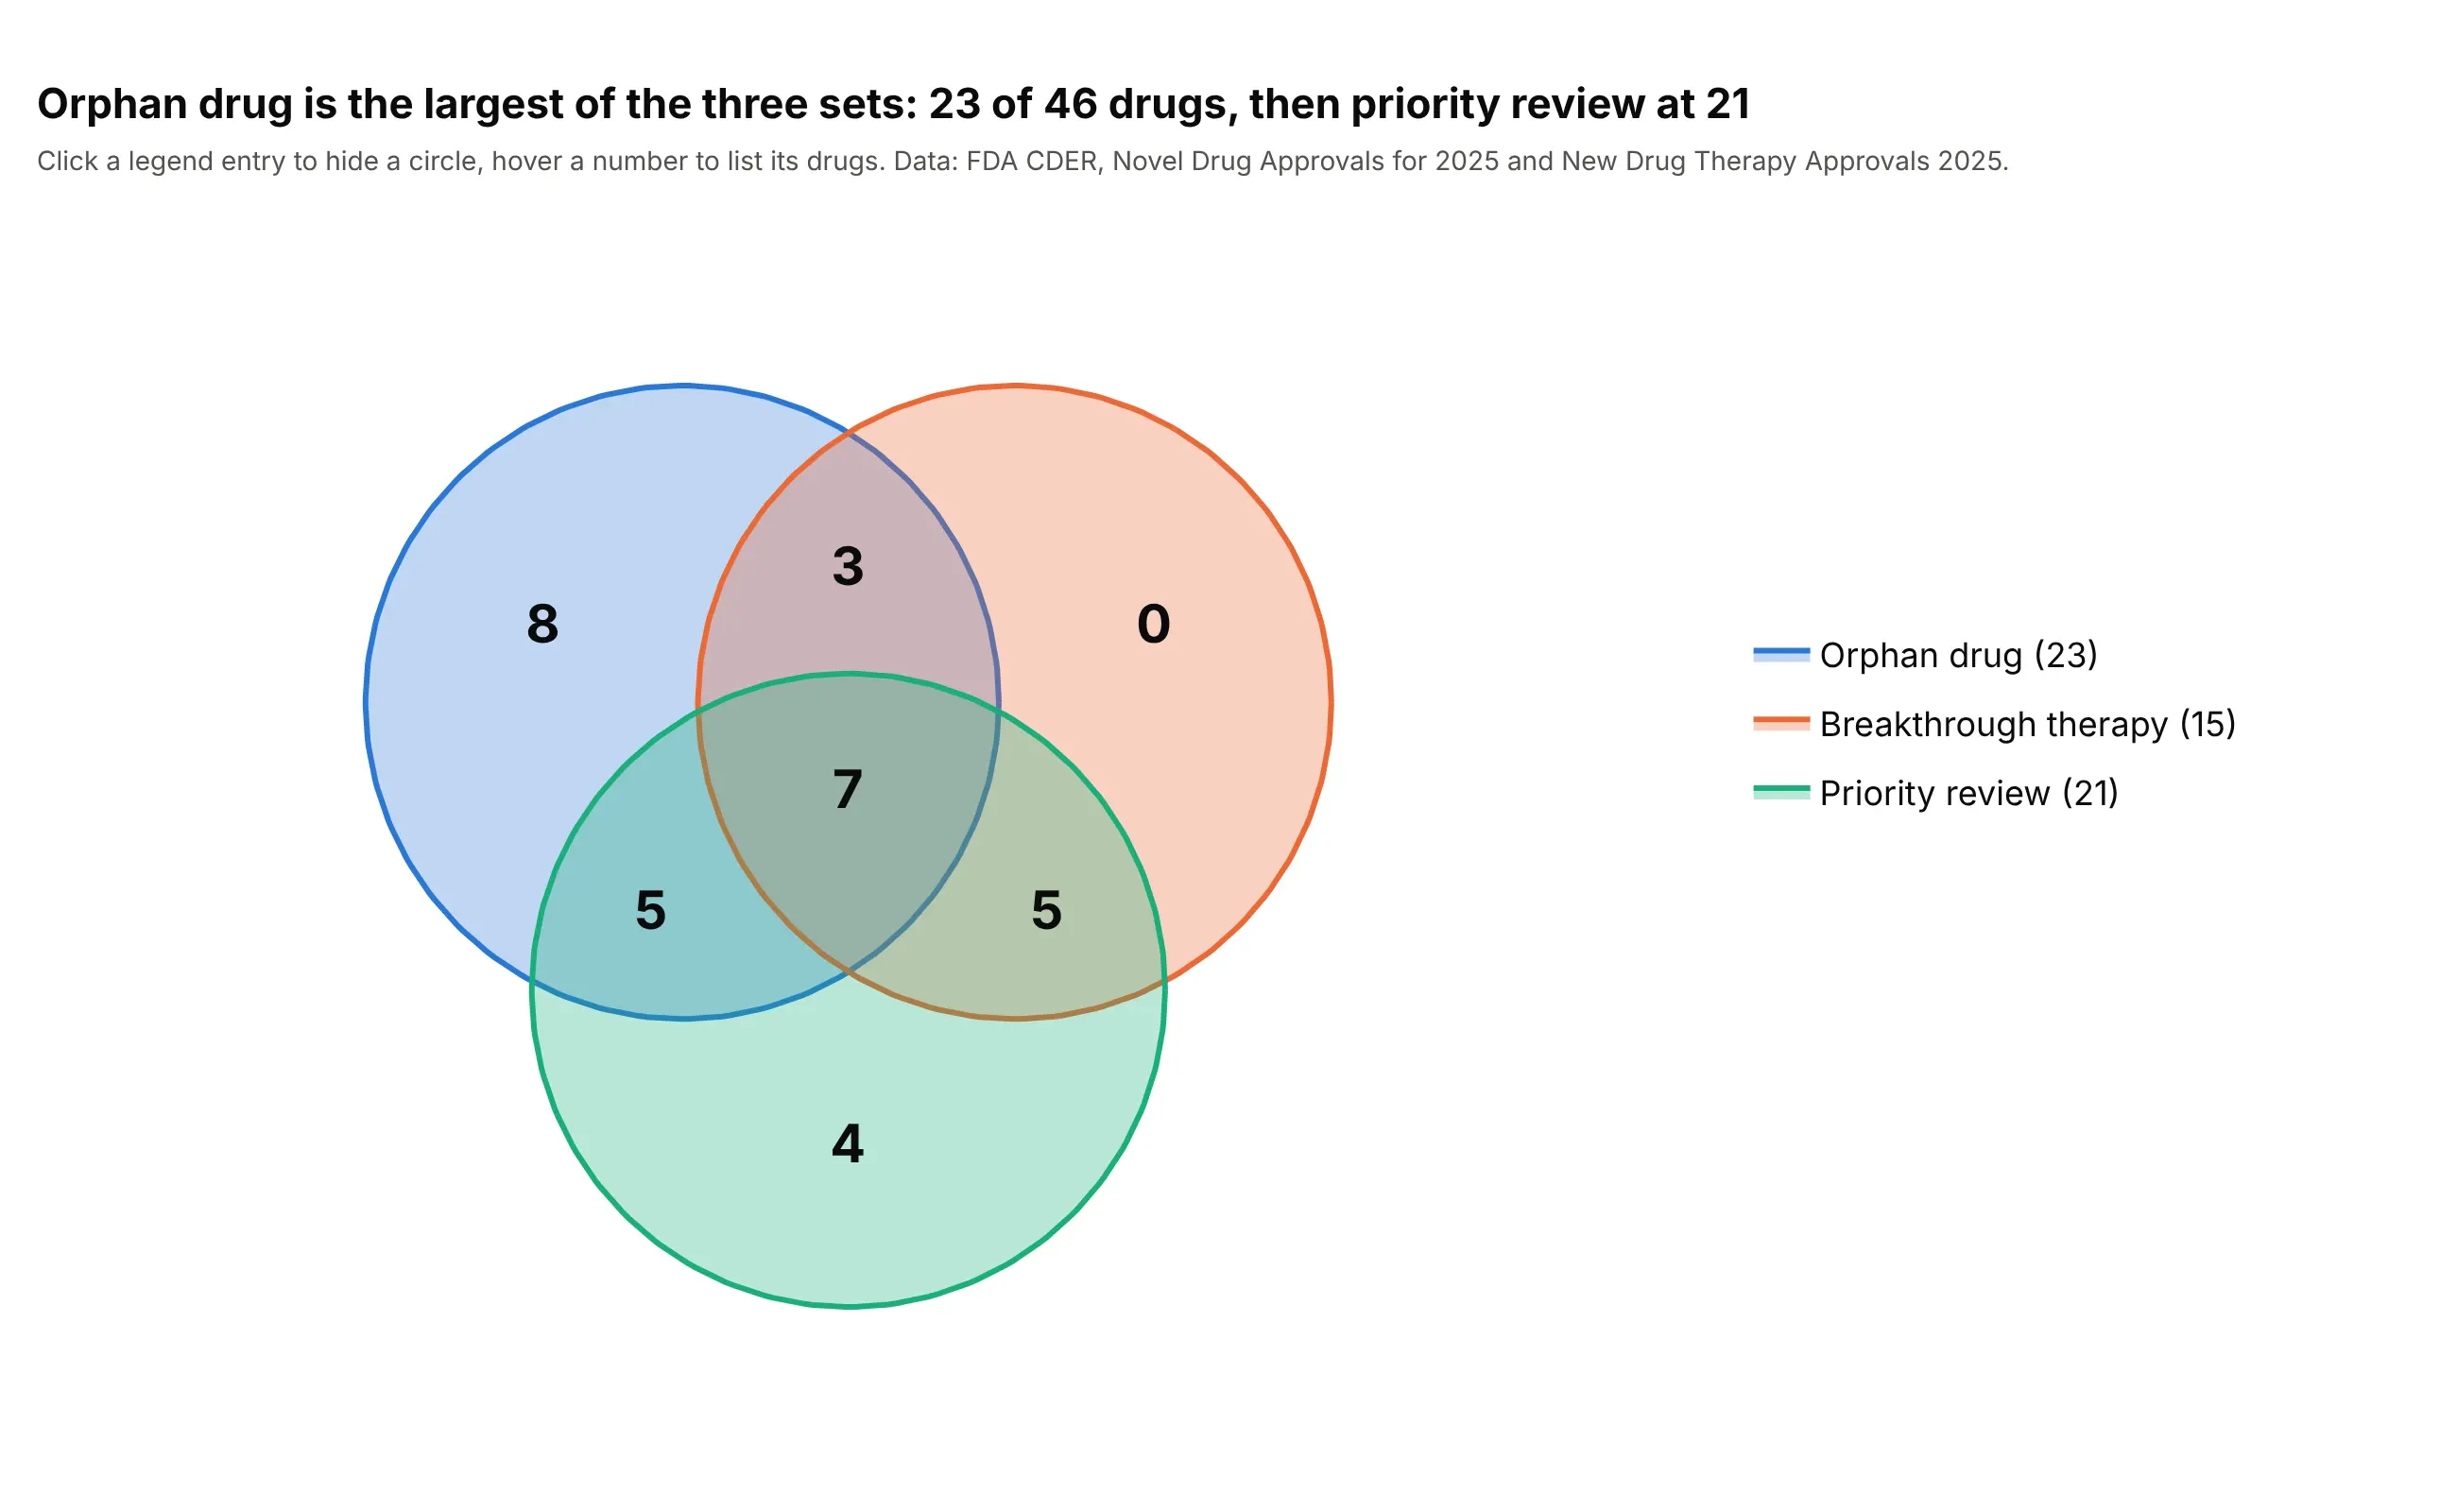
Shapes can't be hovered or toggled, so for an interactive chart draw each circle as a go.Scatter trace with fill="toself" and give it a name. The legend then hides a circle on click, and a text trace at the region centers can carry customdata with the names so that hovering a count lists the drugs. Orphan drug is the largest set here at 23 of 46 drugs.
Prompt: Get the data from the FDA CDER Novel Drug Approvals for 2025 page and the New Drug Therapy Approvals 2025 report with 0/1 columns orphan, breakthrough and priority. Make a plotly Venn diagram where each circle is a go.Scatter trace with mode="lines", fill="toself" and a legend name that includes the total, plus a mode="text" trace of region counts whose customdata lists the drug names for a hovertemplate.
6. Area-proportional, two sets
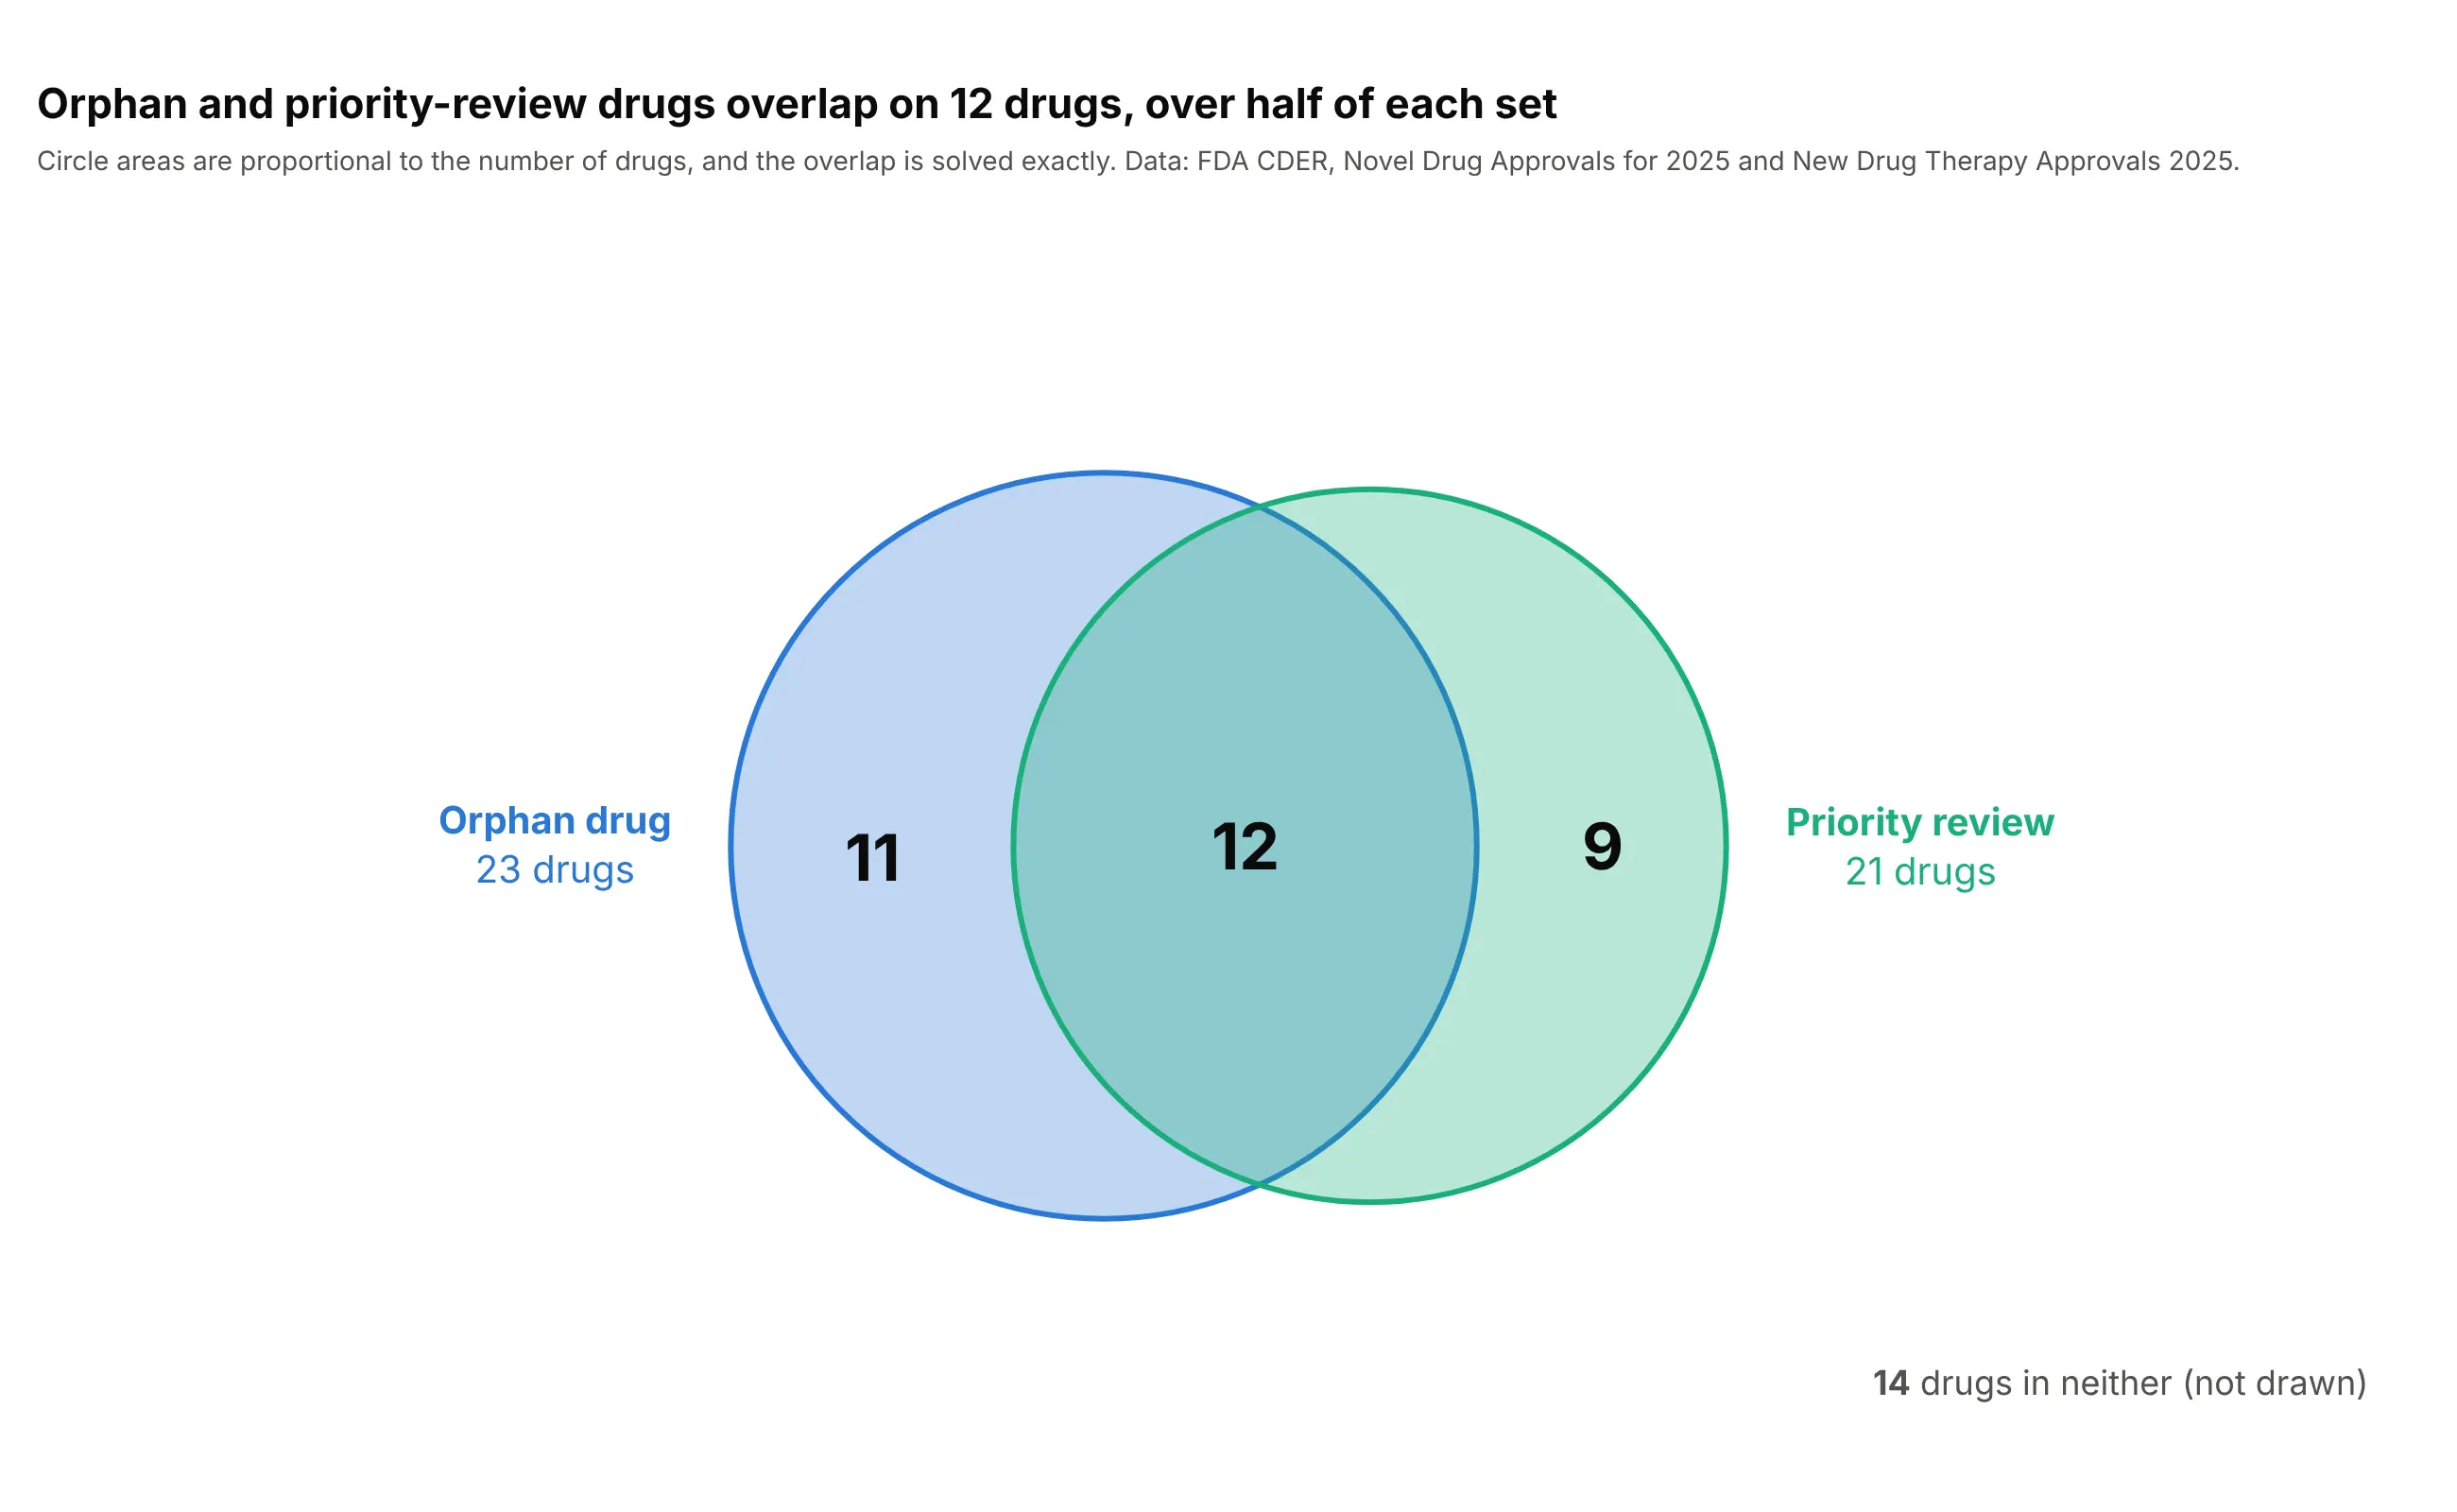
With two sets, circles can be exact: the radii come from the set sizes (area = count) and the distance between centers from the overlap, solved with the lens-area formula. The 12 shared drugs are over half of each set, 52% of the orphan drugs and 57% of the priority-review ones, and that is visible in the picture. The code in the Python section above does it in 15 lines.
Prompt: Use these counts from the FDA CDER Novel Drug Approvals for 2025 and New Drug Therapy Approvals 2025: orphan 23, priority review 21, both 12, neither 14. Make a plotly area-proportional two-circle Venn diagram: radius = sqrt(count / pi), the center distance from the circle-overlap area formula with scipy brentq, add_shape circles, counts in the regions and a note that says the areas are proportional.
7. Area-proportional, three sets with circles
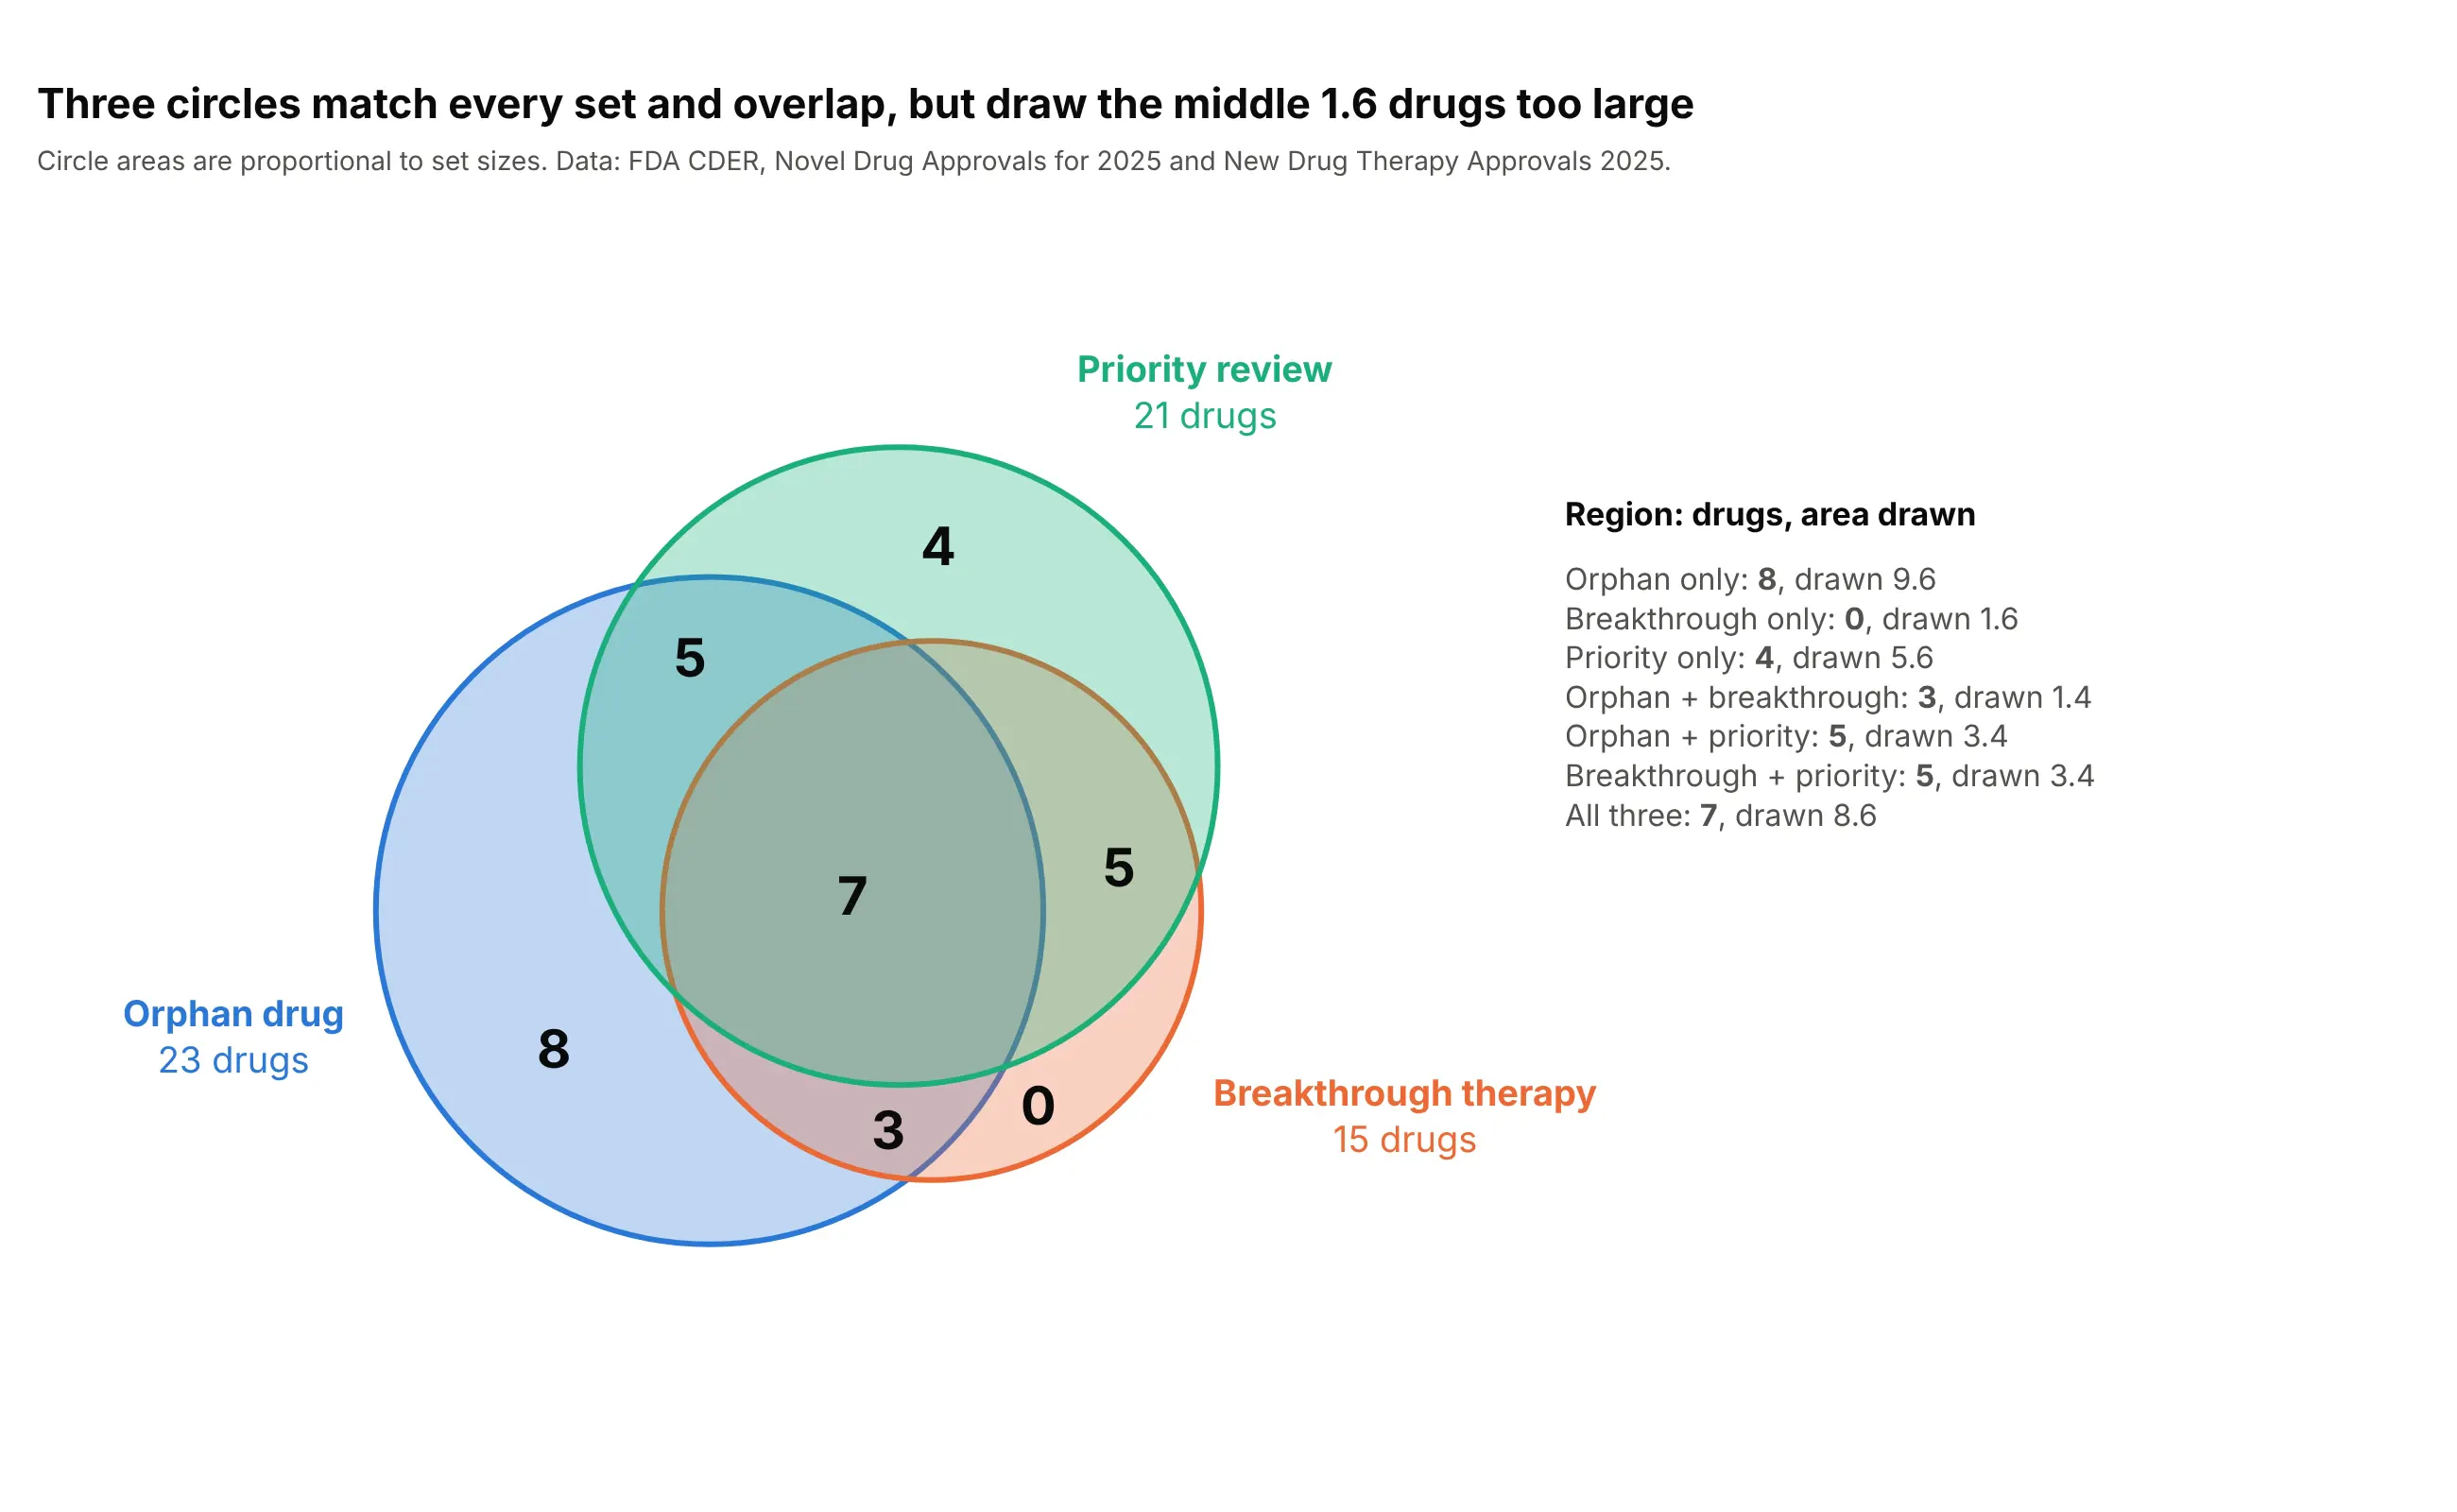
Circles can match every set size and every pairwise overlap, and then the middle region is decided for you: here it is drawn as 8.6 drugs instead of 7, which makes each region that touches it 1.6 too large or too small. Always say that three-circle proportional diagrams are approximate, and show the drawn areas if the reader will rely on them.
Prompt: Use these region counts from the FDA 2025 novel drug approvals: orphan only 8, breakthrough only 0, priority only 4, orphan and breakthrough 3, orphan and priority 5, breakthrough and priority 5, all three 7. Make a plotly three-circle diagram with areas equal to the set sizes and the center distances solved from each pairwise overlap, then compute the drawn area of each region on a grid and list drawn against actual next to the diagram.
8. Area-proportional, three sets with ellipses
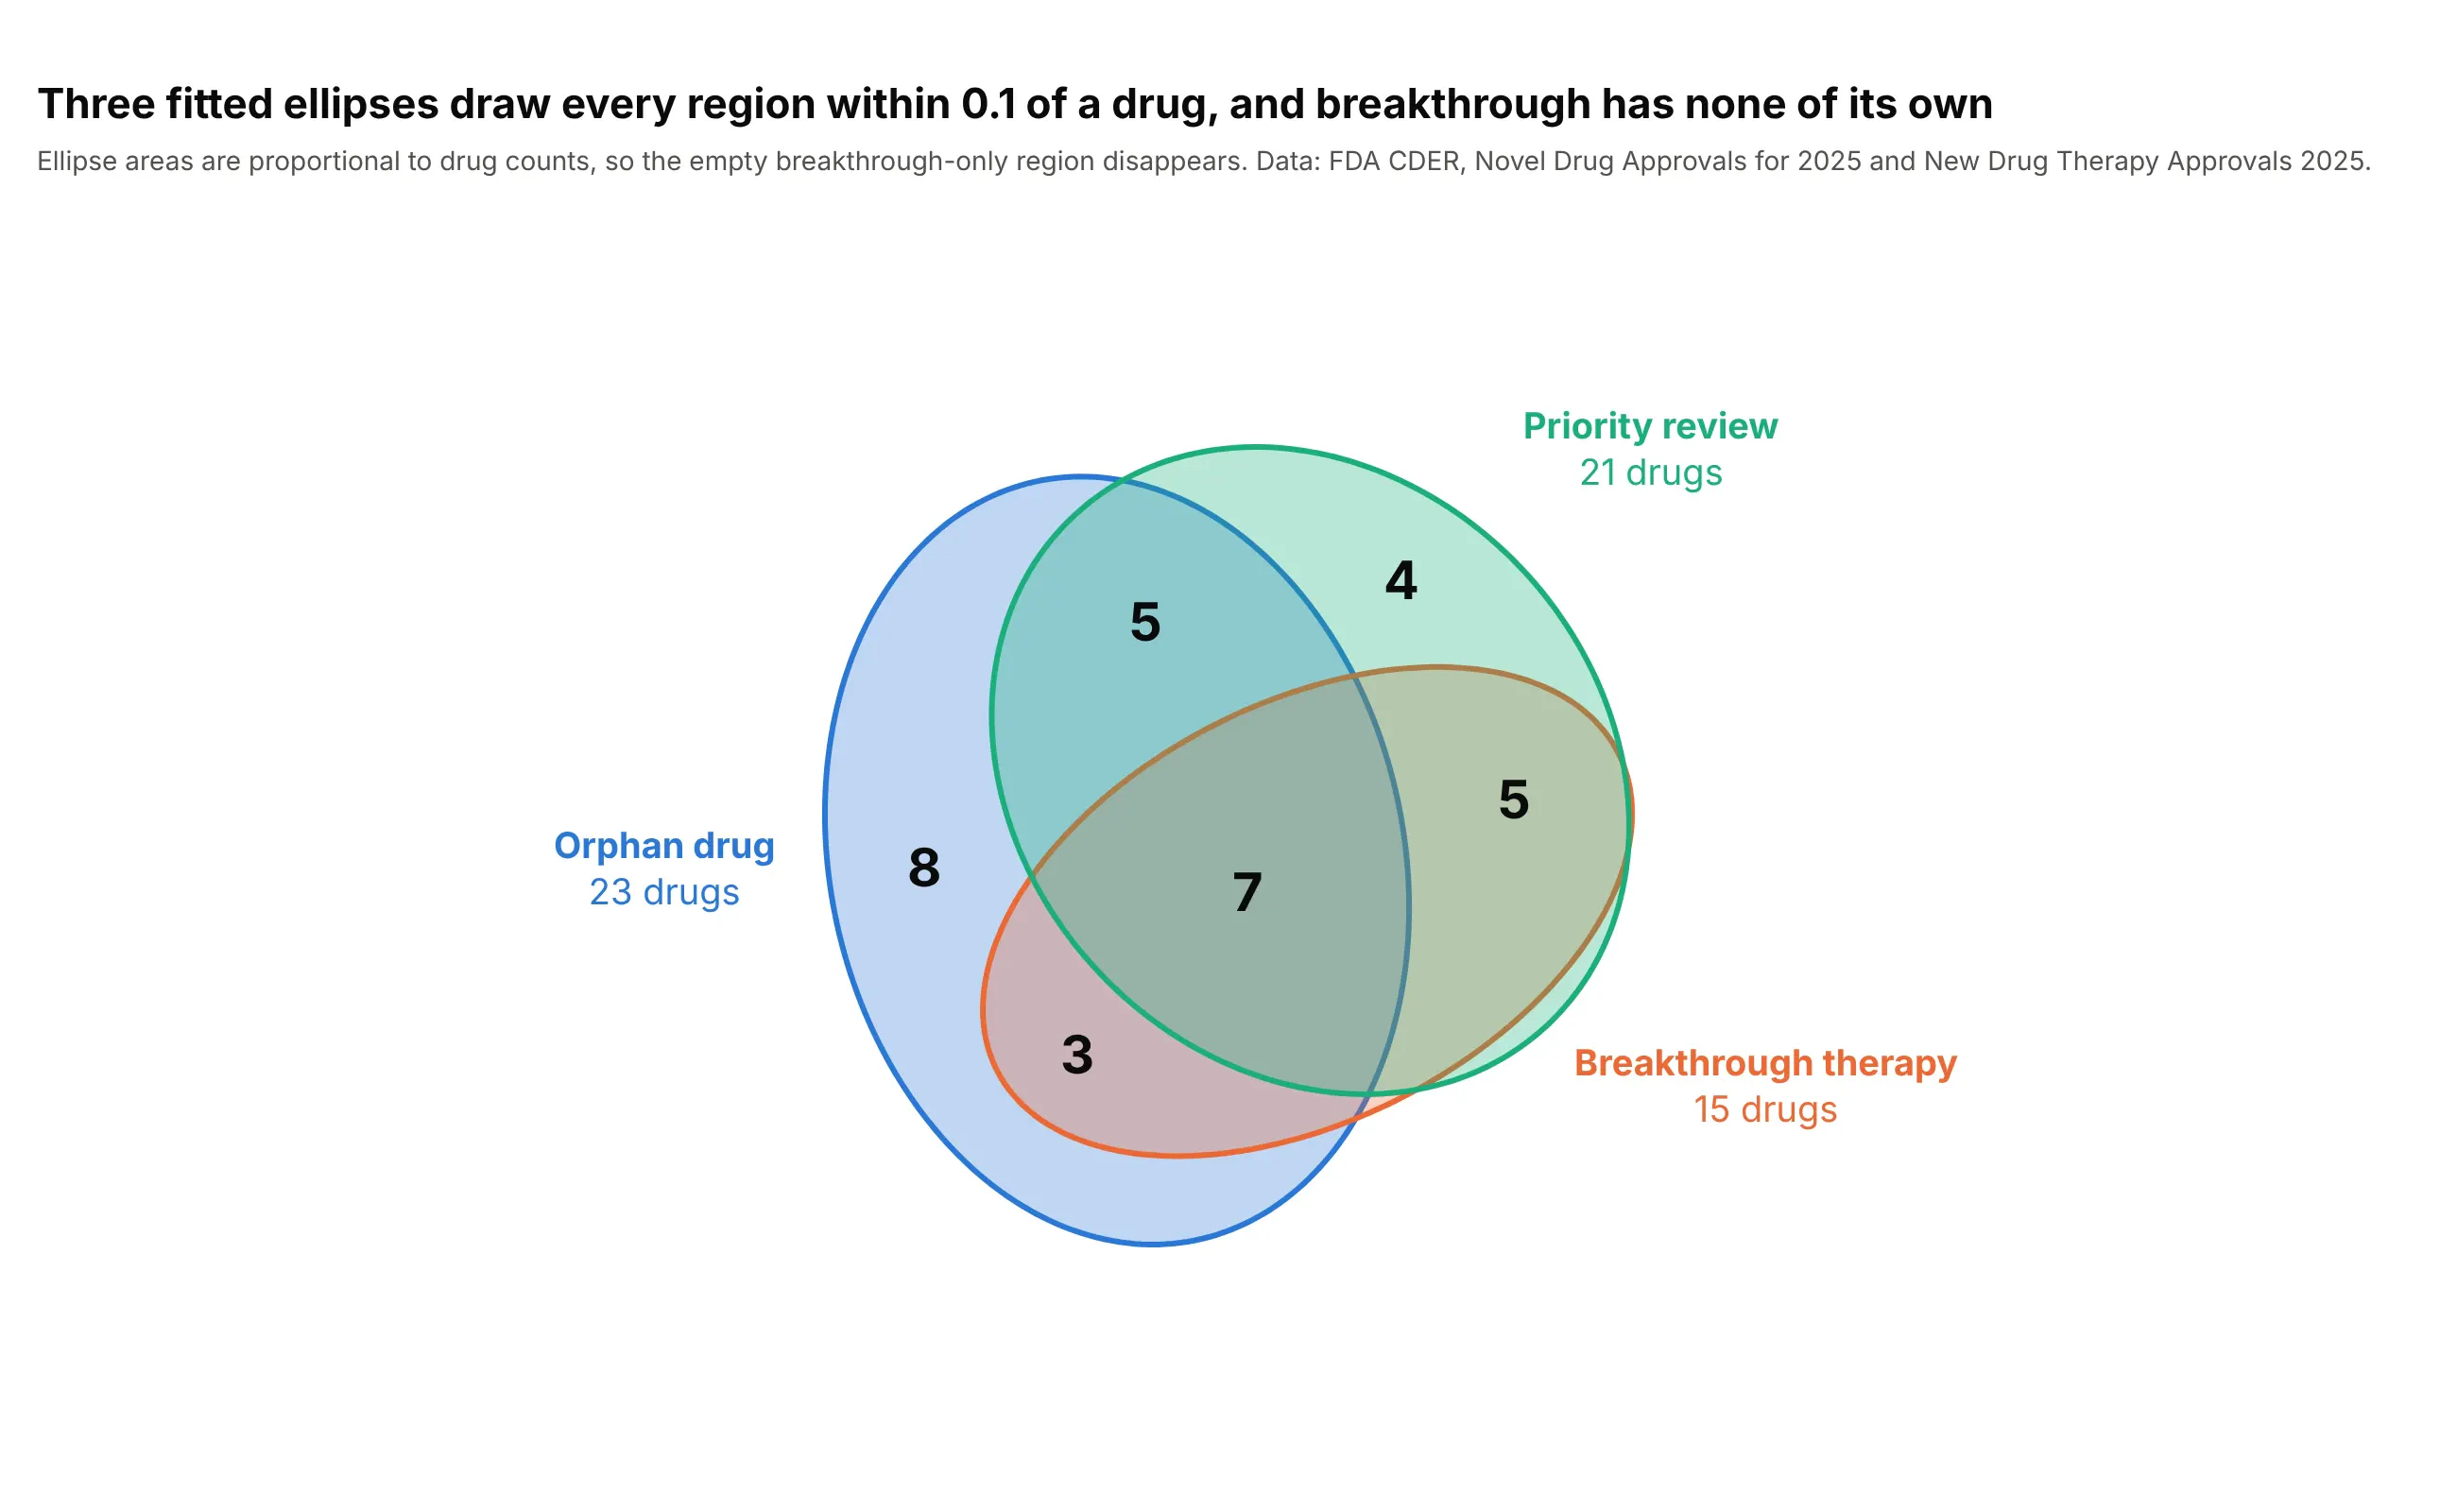
Ellipses have enough freedom to match all seven regions: every region is within 0.1 of a drug, and the empty breakthrough-only region disappears because the breakthrough ellipse fits inside the other two. This is how eulerAPE and eulerr work. Ellipses are drawn as type="path" shapes, and the fit minimizes the error in the region areas, so it takes a few seconds of optimization.
Prompt: Use these region counts from the FDA 2025 novel drug approvals: orphan only 8, breakthrough only 0, priority only 4, orphan and breakthrough 3, orphan and priority 5, breakthrough and priority 5, all three 7. Fit three ellipses (center, two axes and an angle each) with scipy.optimize.minimize so each region's area on a grid matches its count, then draw them as plotly path shapes with counts in the regions.
9. Venn next to Euler
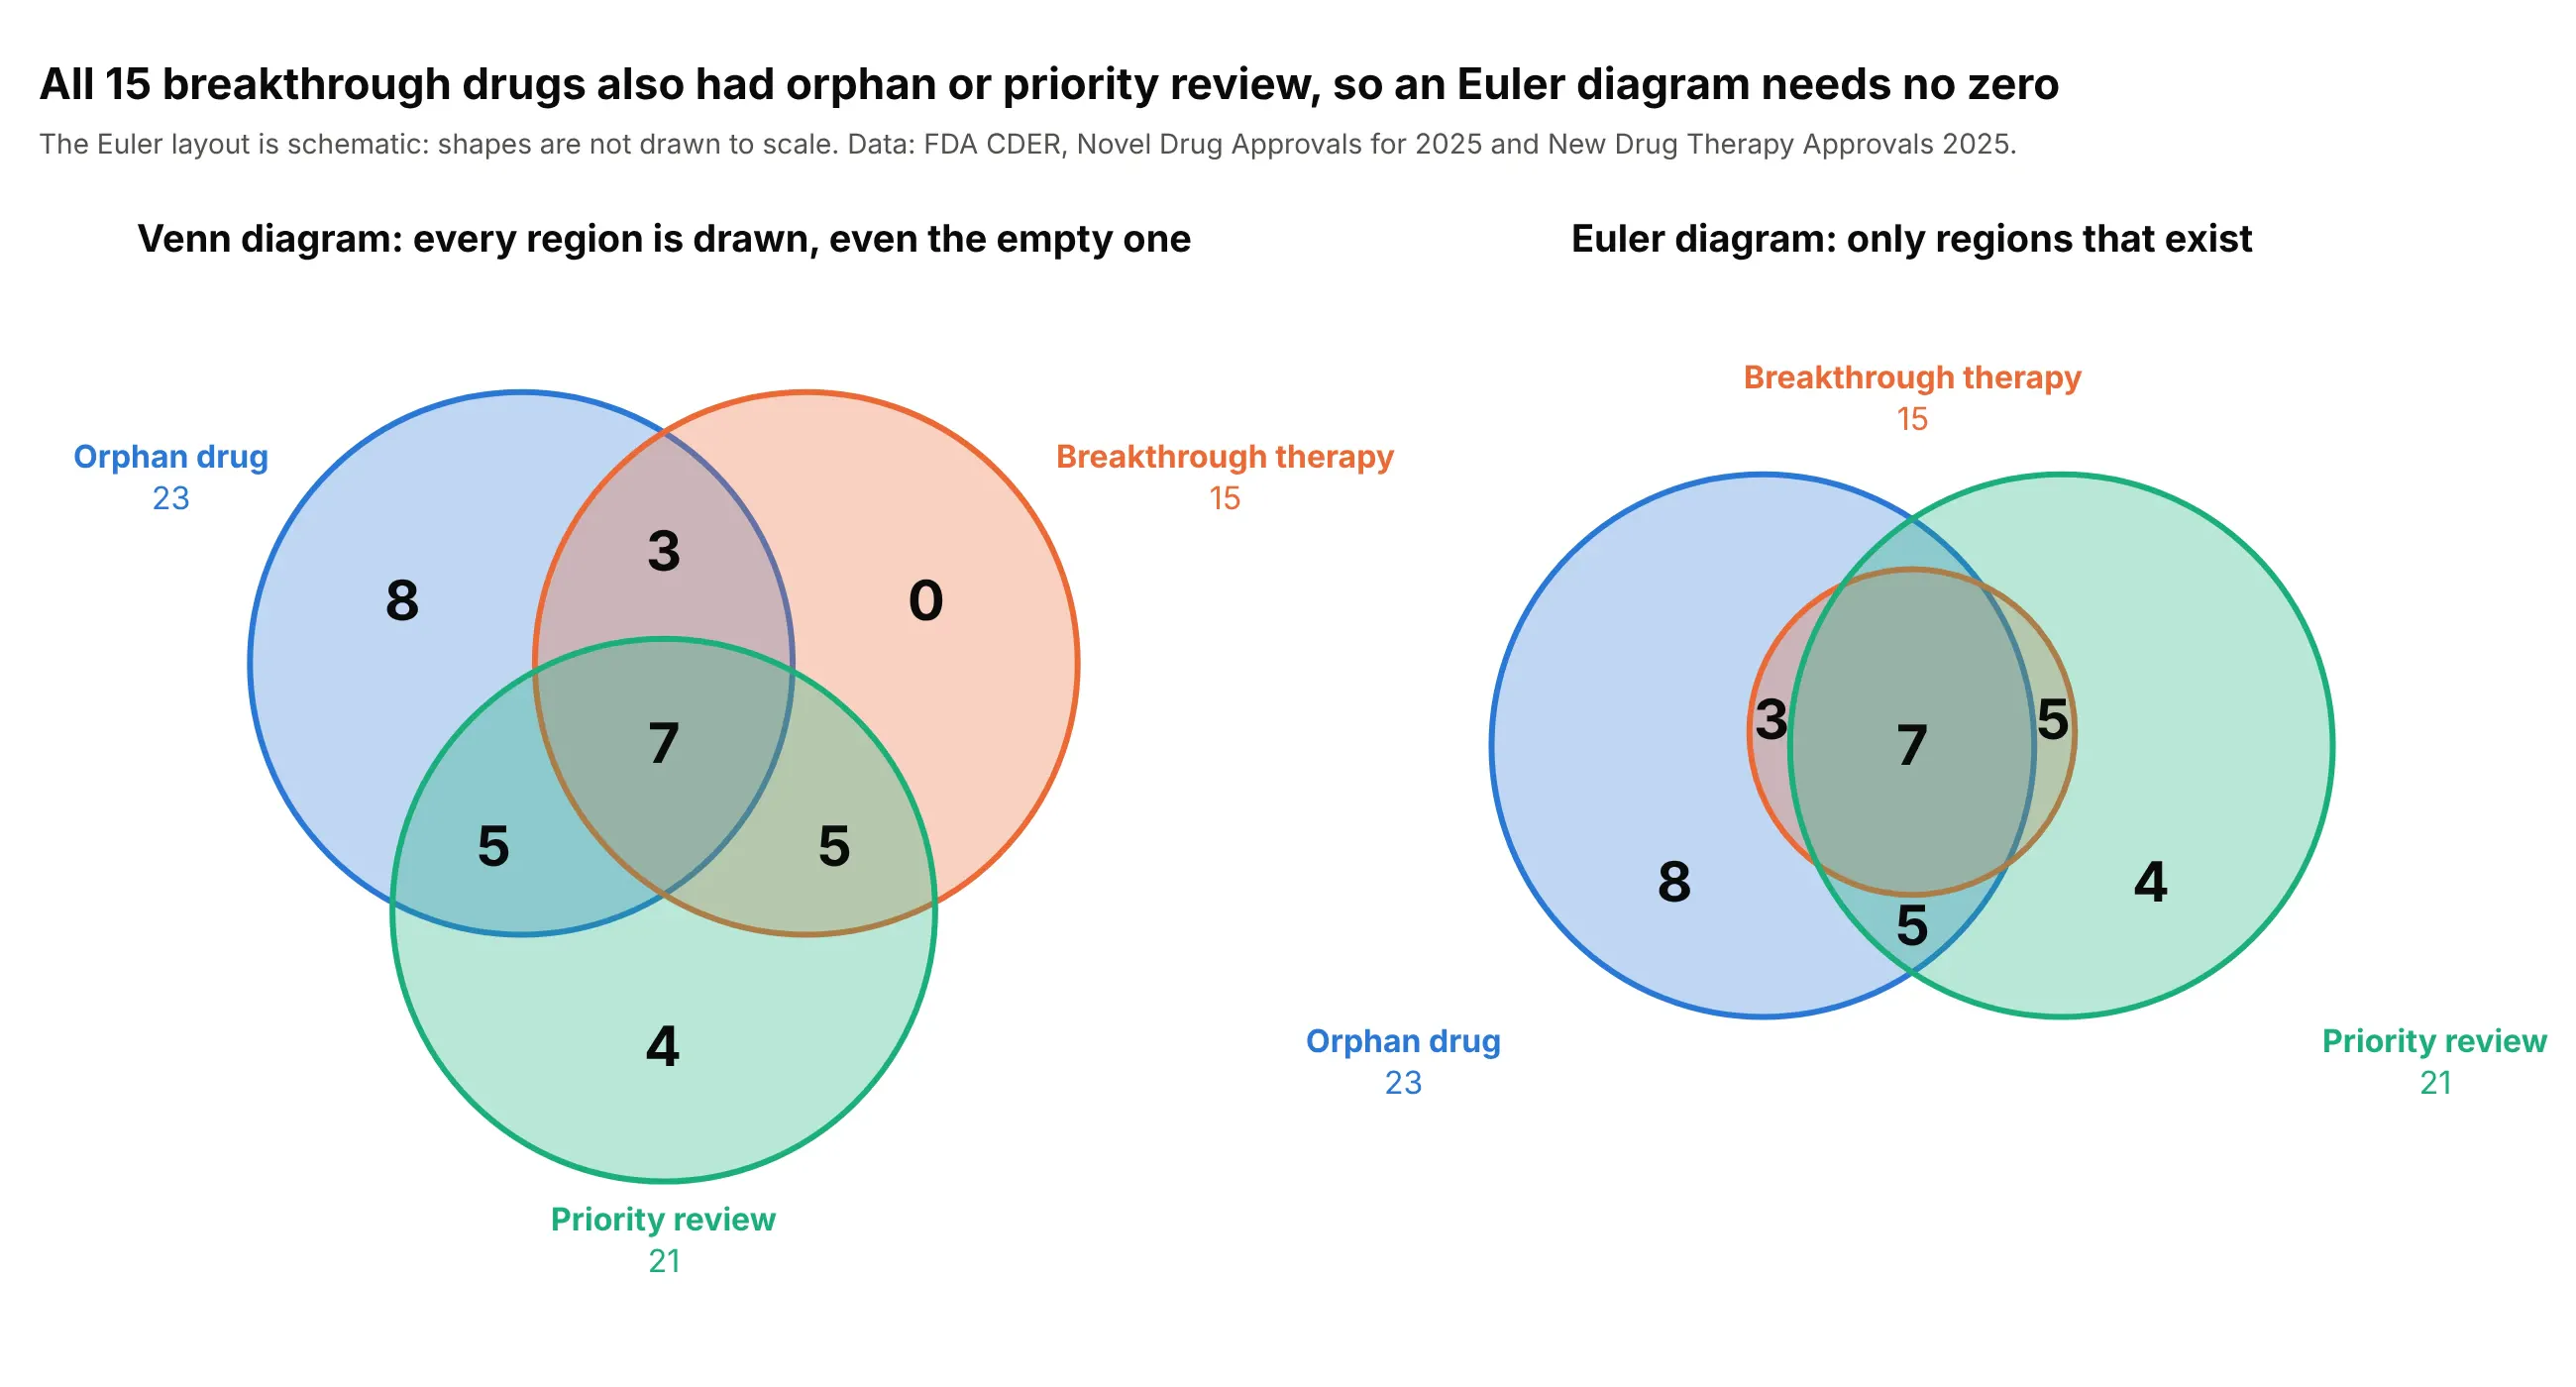
All 15 breakthrough drugs also had an orphan designation or priority review, so a Venn diagram shows a 0 where an Euler diagram has no region. The Euler layout is a drawing choice: put the breakthrough circle inside the union of the other two and the zero goes away. Use the Venn form when the empty combination is part of the point.
Prompt: Use these region counts from the FDA 2025 novel drug approvals: orphan only 8, breakthrough only 0, priority only 4, orphan and breakthrough 3, orphan and priority 5, breakthrough and priority 5, all three 7. Make a plotly figure with two panels side by side: a Venn diagram of three equal circles including the 0, and a schematic Euler diagram where the breakthrough circle is smaller and lies inside the union of the orphan and priority circles, with the six non-empty counts.
10. Four sets with ellipses
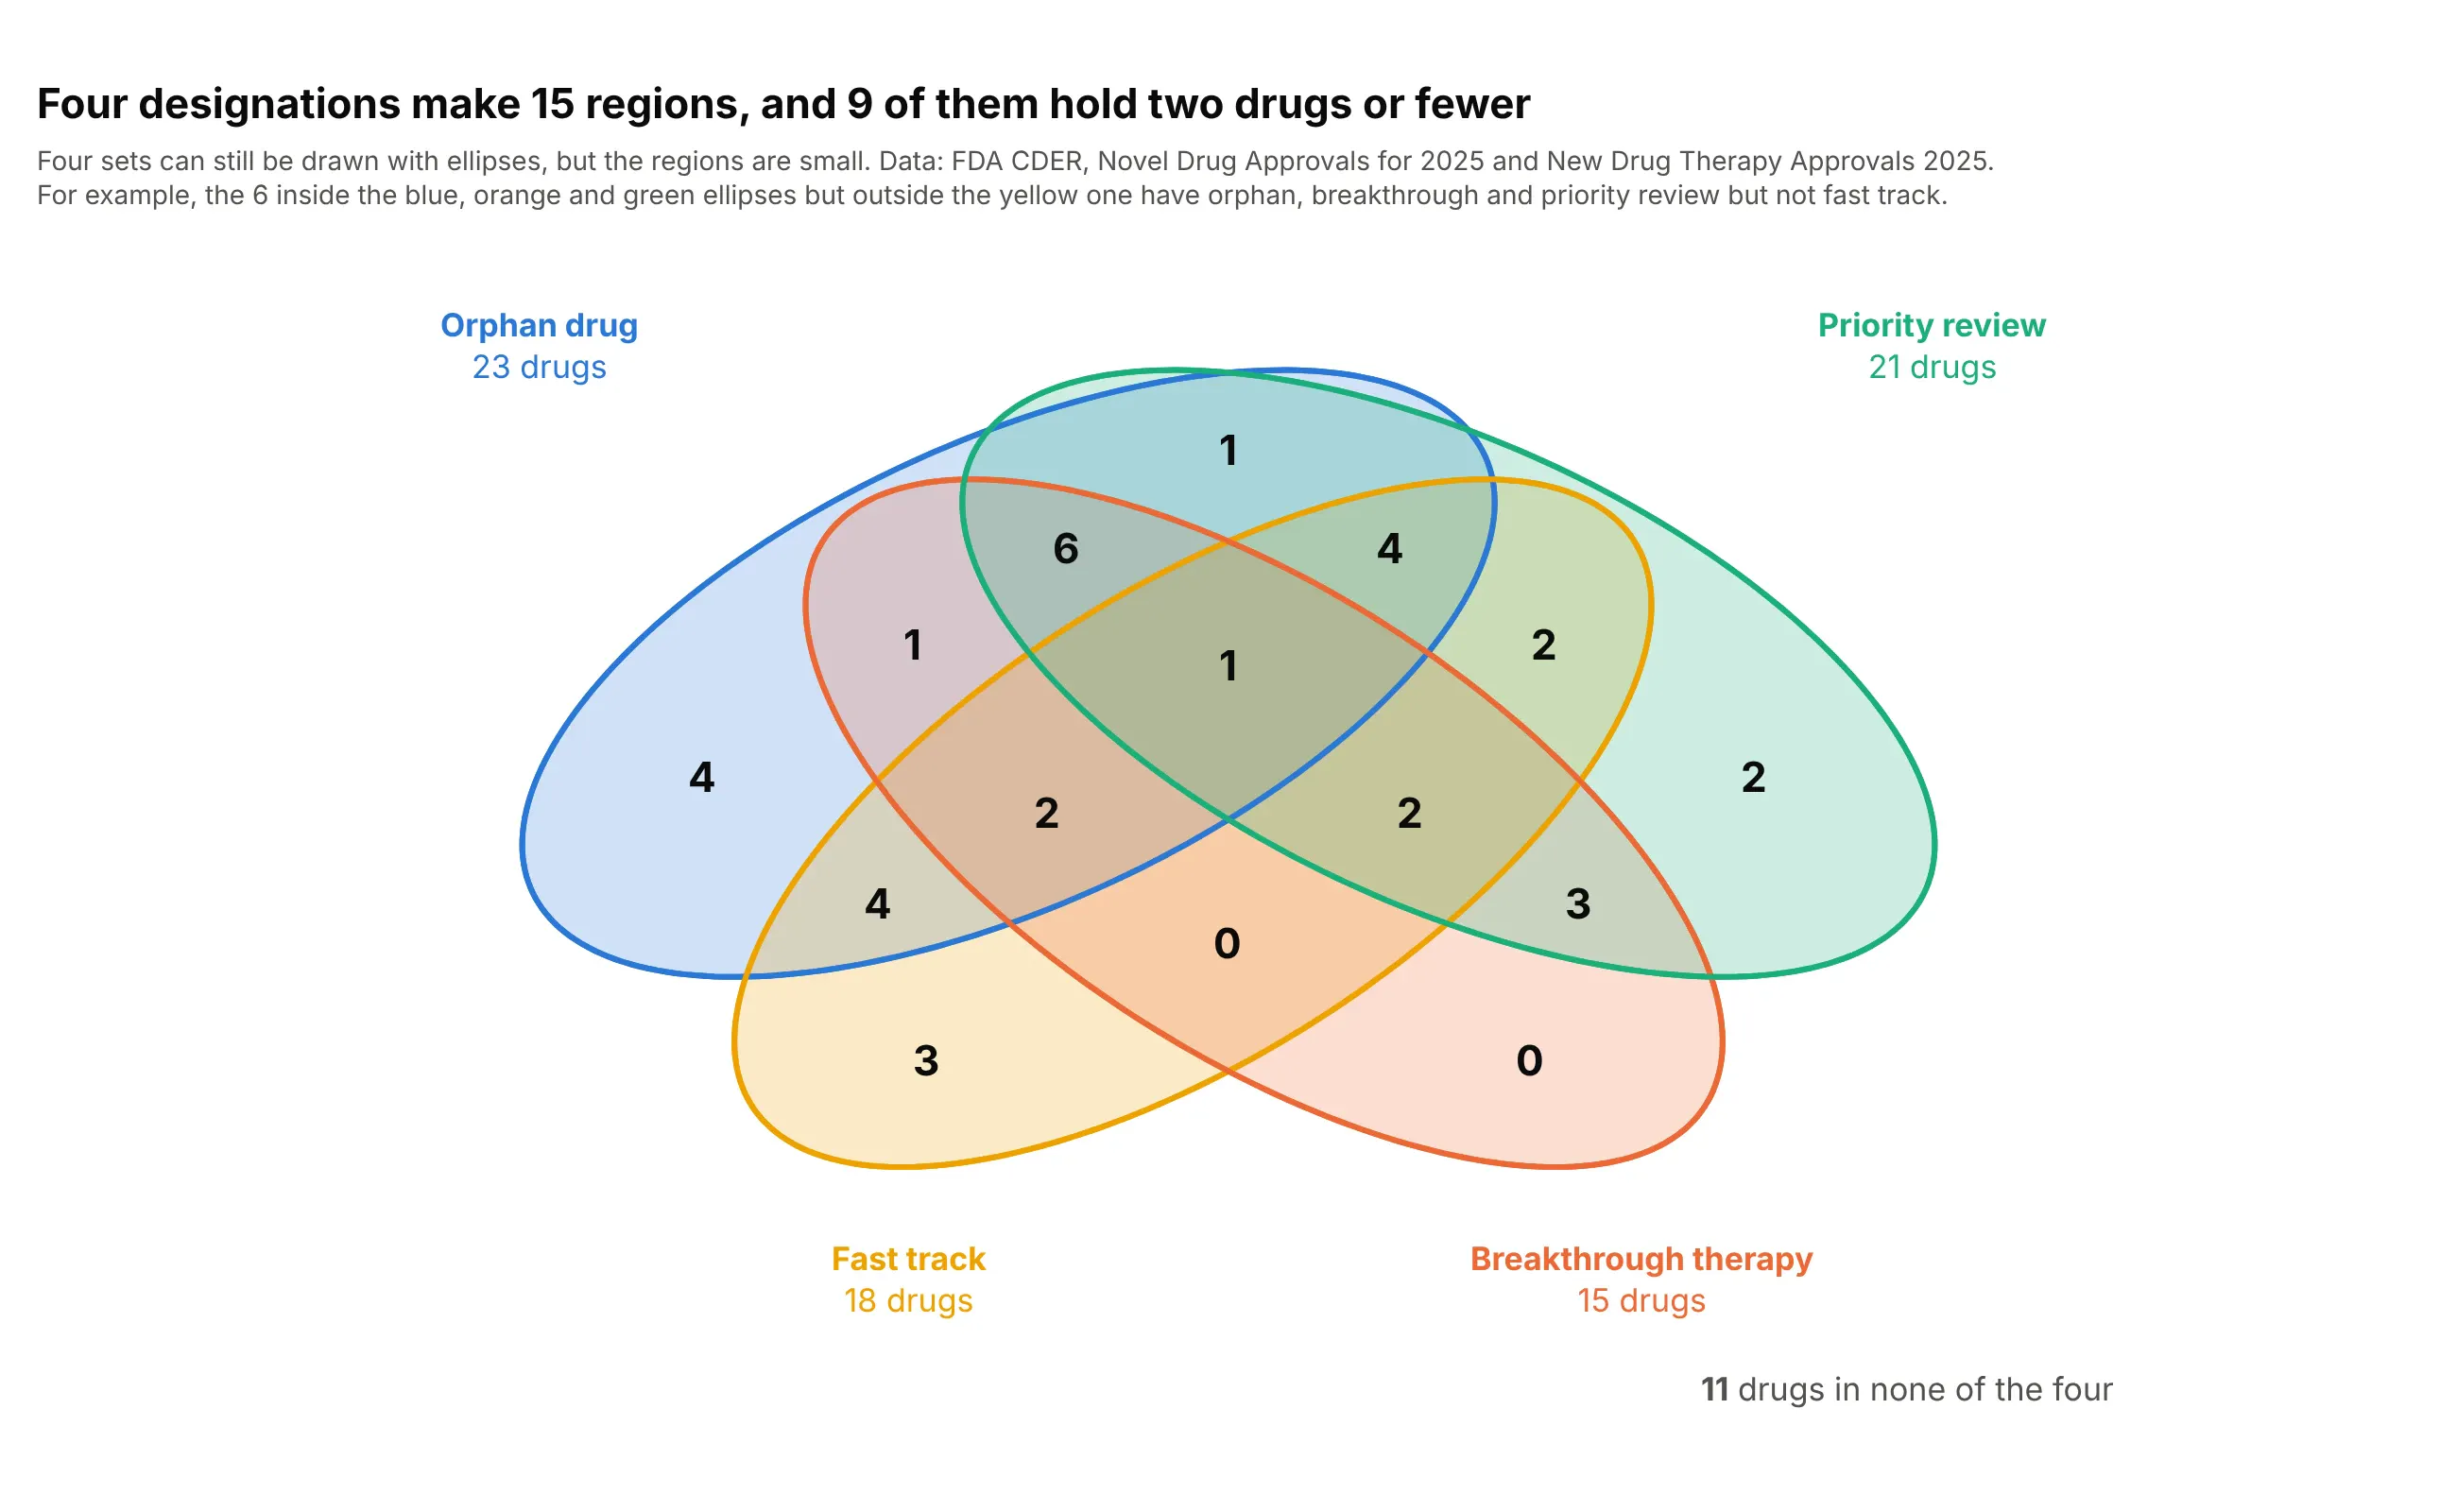
Four sets can still be drawn, with four ellipses that cross in 15 regions, and 9 of those regions hold two drugs or fewer, two of them none. It works as a reference for how the sets relate, but finding one combination means tracing the outlines. Draw the ellipses as type="path" shapes and put the count at the point farthest from every edge.
Prompt: Get the data from the FDA CDER Novel Drug Approvals for 2025 page and the New Drug Therapy Approvals 2025 report with 0/1 columns orphan, fast_track, breakthrough and priority. Make a plotly four-set Venn diagram with four equal mirror-symmetric ellipses (path shapes) that make all 15 regions, counts in every region, set names with totals around it, and the number of drugs in none of the four.
11. Past three sets, an UpSet plot
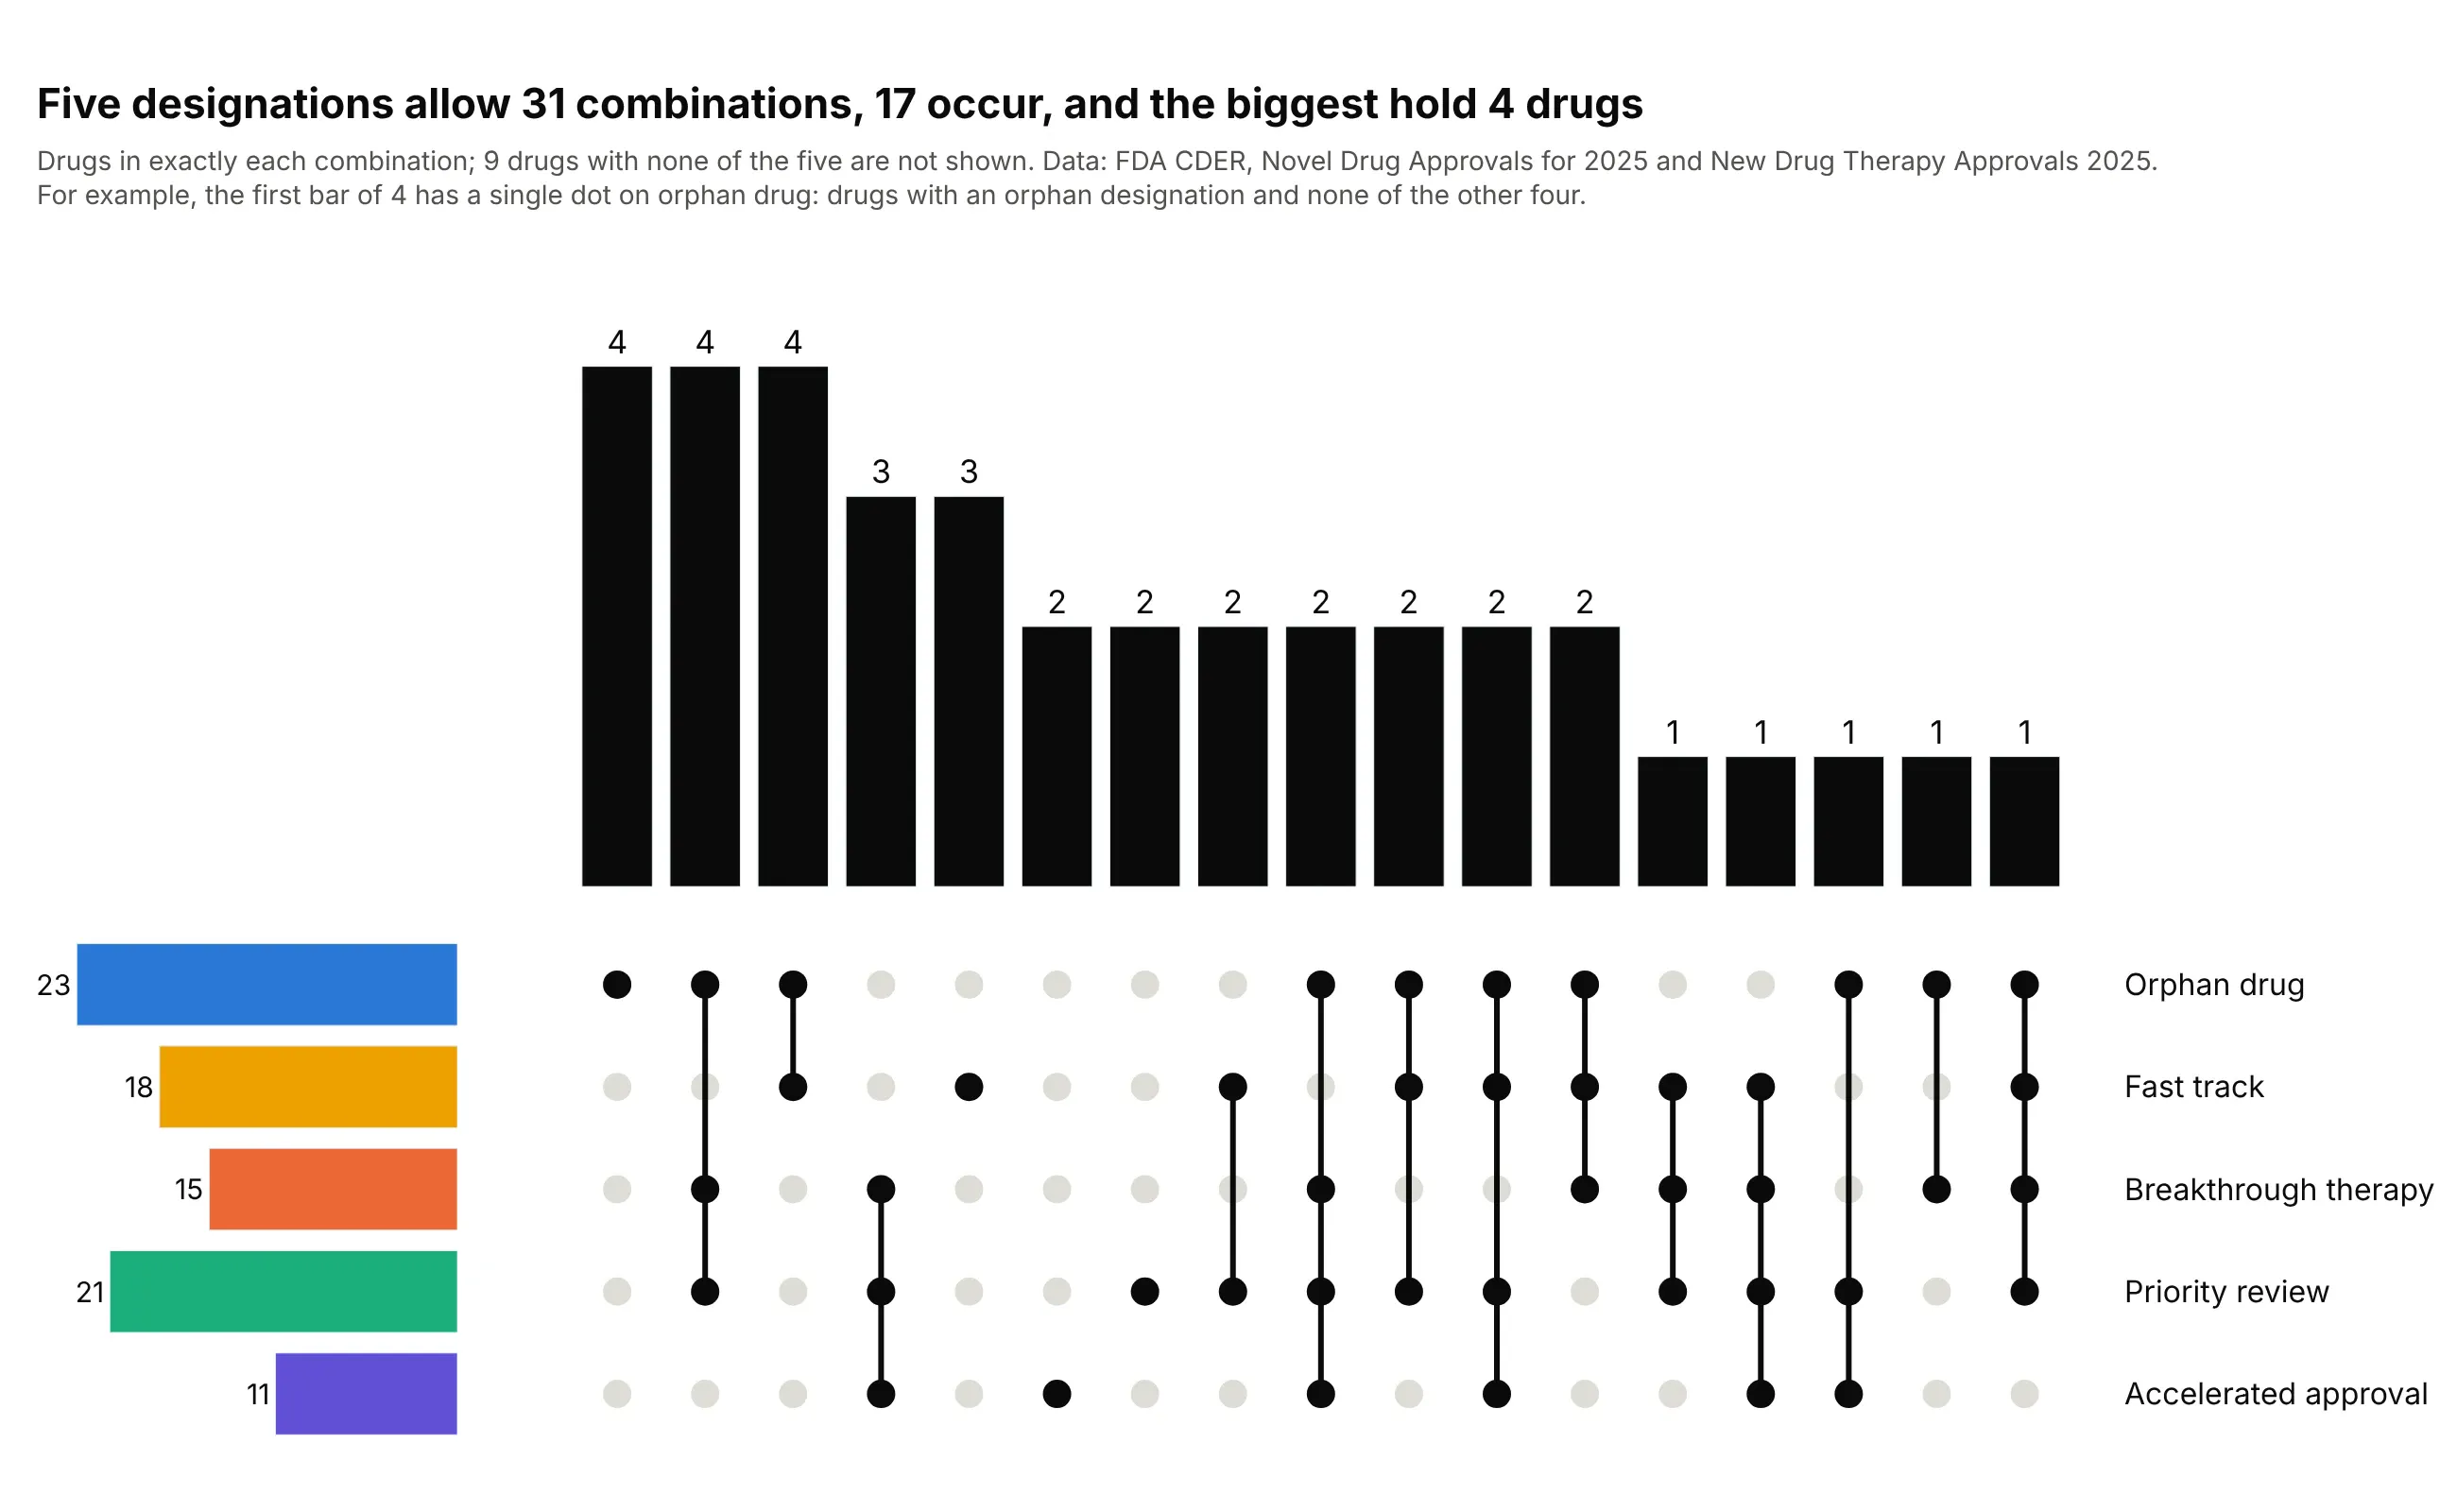
Five designations allow 31 combinations and 17 of them occur, so a Venn diagram has nowhere to put them, while an UpSet plot gives each one a bar and a column of dots. The largest bars hold only 4 drugs, which shows how thin the data is, and 9 drugs with none of the five are left out. It's built from go.Bar, go.Scatter markers and make_subplots.
Prompt: Get the data from the FDA CDER Novel Drug Approvals for 2025 page and the New Drug Therapy Approvals 2025 report with 0/1 columns orphan, fast_track, breakthrough, priority and accelerated. Make a plotly UpSet plot with make_subplots: bars of drugs in exactly each combination that occurs, sorted by size, a dot matrix underneath with joined dots for members, and horizontal set-size bars on the left in the designation colors.
FAQ
Options to customize
These are the Plotly pieces that matter for building a Venn diagram. The references are the shapes, text and annotations and axes documentation.
- fig.add_shape(type="circle", x0, y0, x1, y1): one circle per set, defined by its bounding box in axis units.
- fillcolor with an alpha value, line.color, line.width: a semi-transparent fill so overlaps blend, and a solid outline in the same color.
- layer="below": draws the circles under the traces and annotations.
- type="path" with path="M x,y L x,y ... Z": ellipses and other shapes, including a filled overlap region with fillrule="evenodd".
- fig.add_annotation(x, y, text, showarrow=False): the count in each region and the set names, with font for size and color.
- yaxis.scaleanchor="x": one unit is the same length on both axes, so circles stay round.
- xaxis.visible=False, yaxis.visible=False, range: hides the axes and fixes the area that holds the diagram.
- fixedrange=True: stops zooming from changing the geometry.
- go.Scatter(fill="toself", mode="lines"): circles as traces, for a legend, legendgroup and hover.
- customdata, hovertemplate: the names of the items in a region, on a text trace placed at the region center.
- shapes and annotations in layout: the same objects in plotly.js, as in the JavaScript example above.
- margin, template: room for set names and the brand font and colors.