
Chris Parmer
November 3, 2026
Pie Charts - A Complete Guide
TL;DR
- A pie chart splits a circle into slices whose angles add up to the whole, so each slice shows one part's share of a total, such as a market, a budget or the seats in a parliament.
- Pie charts are also known as pie graphs, circle charts and circle graphs, and are similar to donut charts, waffle charts, sunburst charts and treemaps.
- A pie works well for a few parts of one whole, sorted largest first, when one part is near a quarter, a half or two thirds. To compare parts that are close in size, or many wholes, a sorted bar chart is more precise.
- You can make a pie chart with Plotly in one line of code with px.pie; hole=0.5 turns it into a donut chart, and plotly.js draws the same chart in JavaScript.
- See 13 ways to draw a pie chart below, from the basic sorted pie to donuts, half donuts, sunbursts, bubble pies, animated pies and waffles, all drawn from the world's electricity in 2025.
What is a pie chart?
Pie charts look like this:
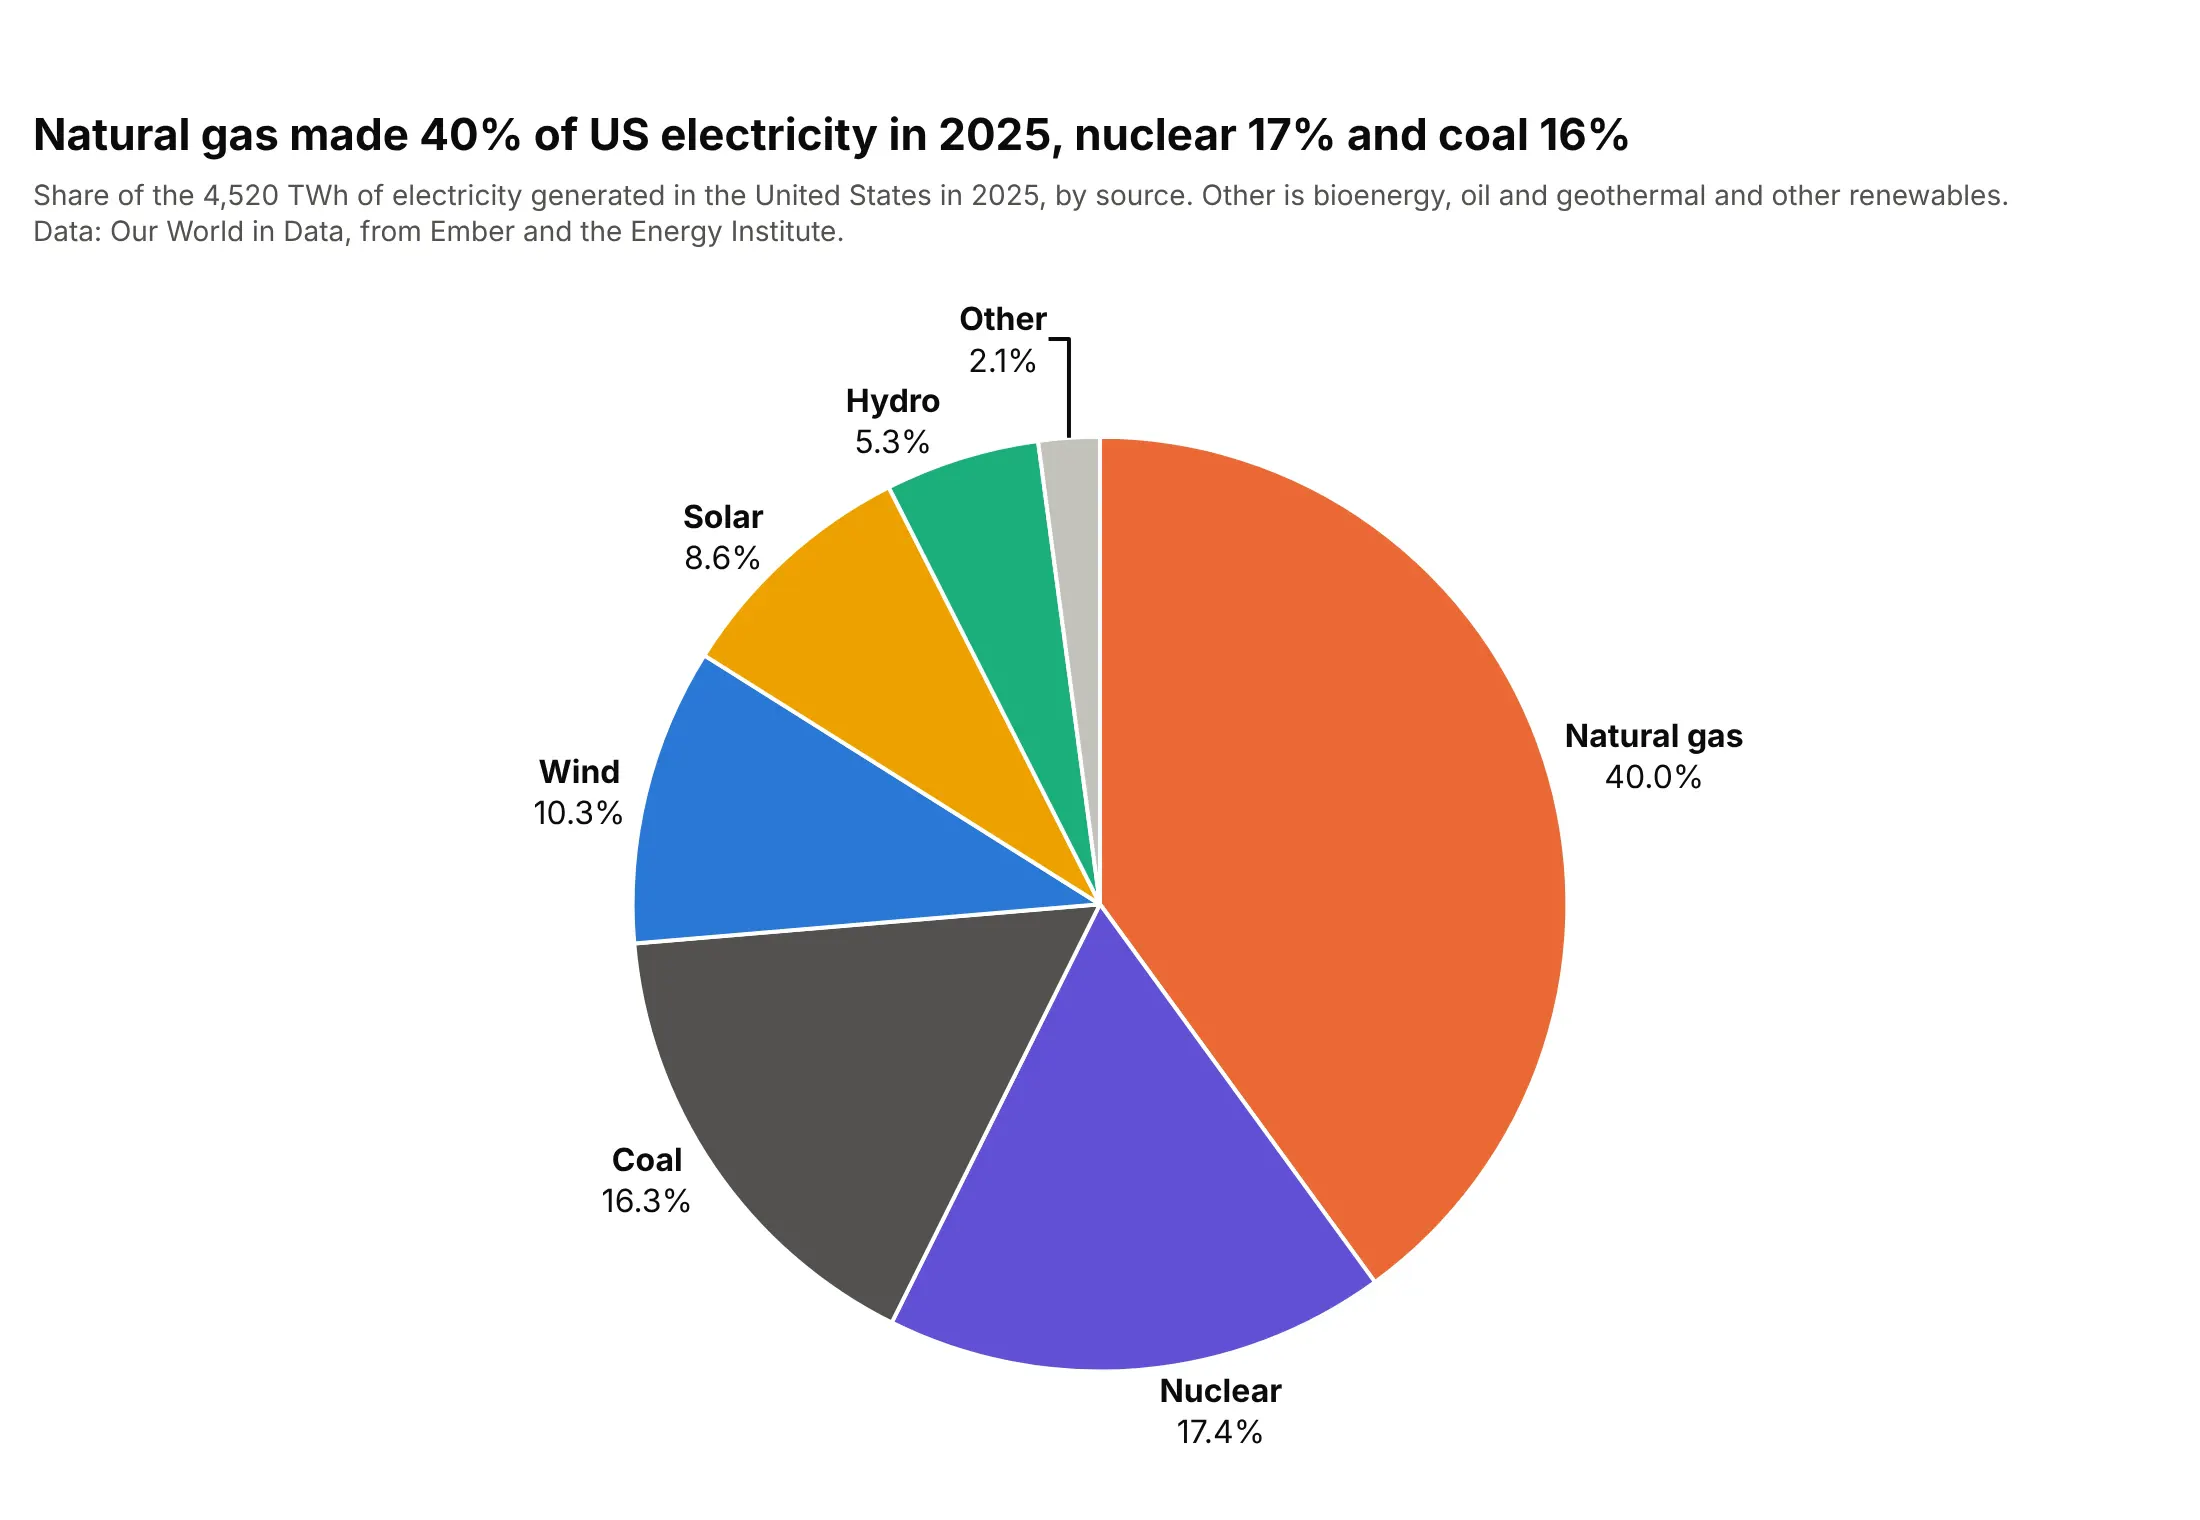
Data: Our World in Data energy dataset, from Ember and the Energy Institute.
How do you read a pie chart? In the example above, notice these things:
- Each slice is one source of US electricity in 2025, and its angle (and so its area) is that source's share of the total, so the whole circle is the 4,520 TWh generated that year.
- The slices are sorted largest first and run clockwise from 12 o'clock, so you read natural gas first and the shares shrink as you go around. Plotly sorts pie slices this way by default.
- Natural gas fills a little less than the right half of the circle. People judge halves and quarters of a circle well, which is why the 40% reads at a glance.
- Nuclear and coal look the same size, but their shares are 17.4% and 16.3%. When slices are this close, only the labels tell them apart, so print the shares on the chart.
- The names and shares sit next to their slices, so there's no legend to look colors up in.
It's often used for charts like these:
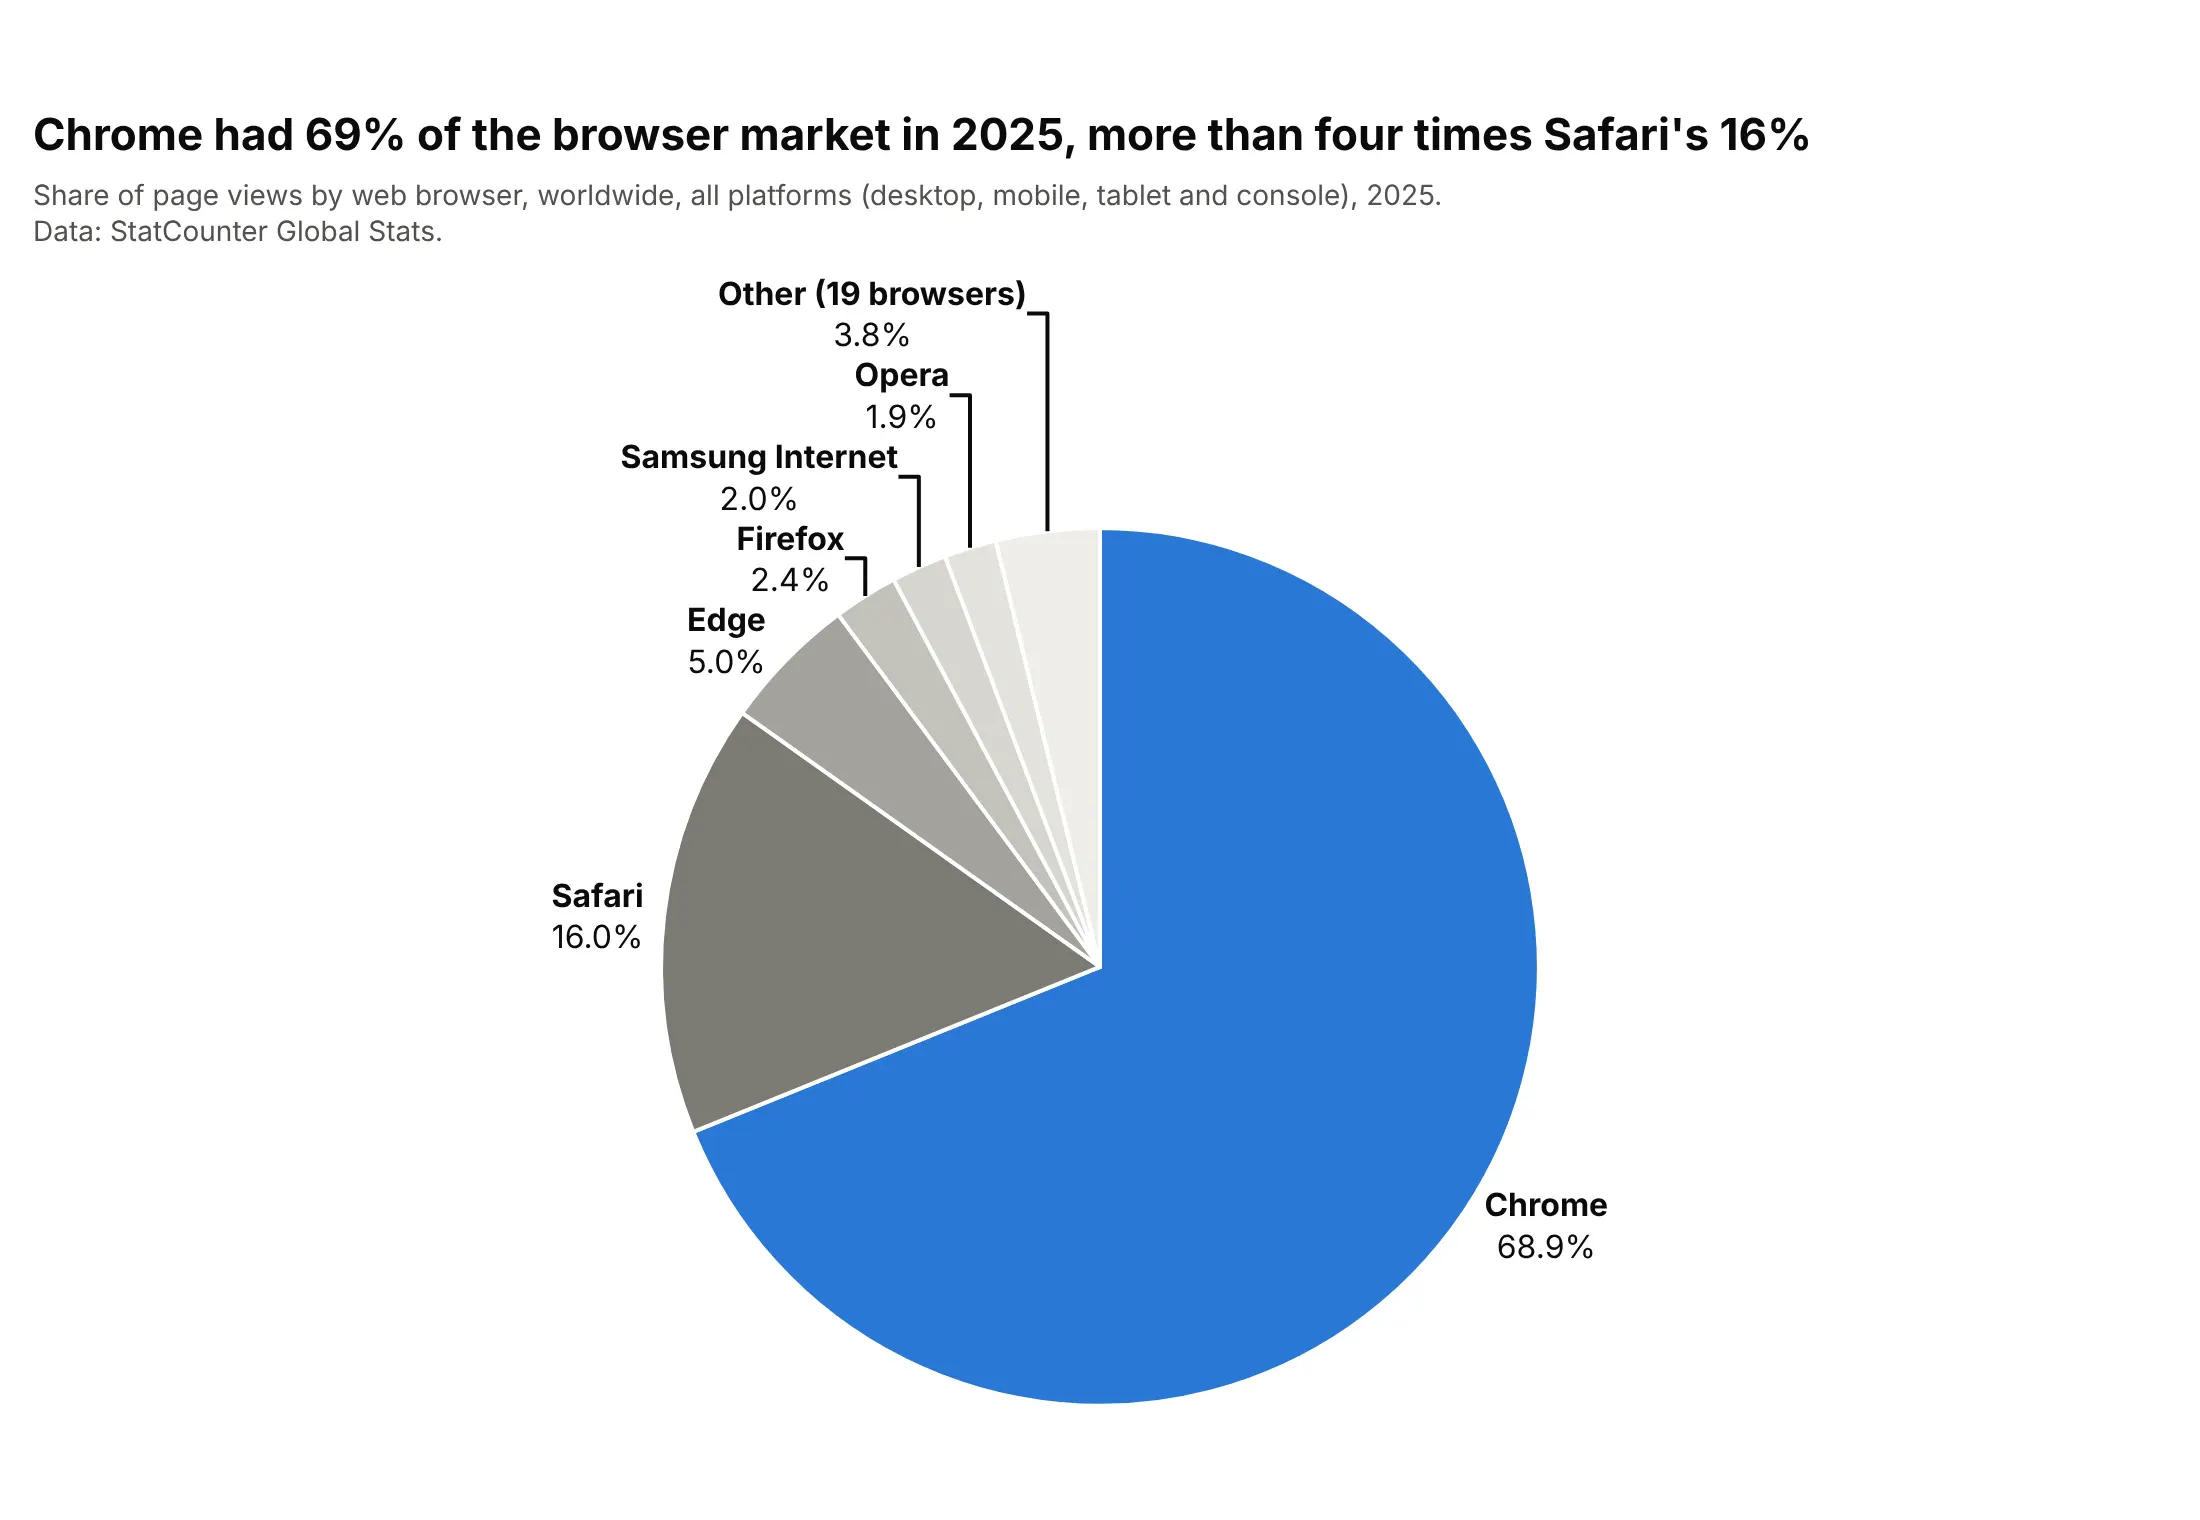
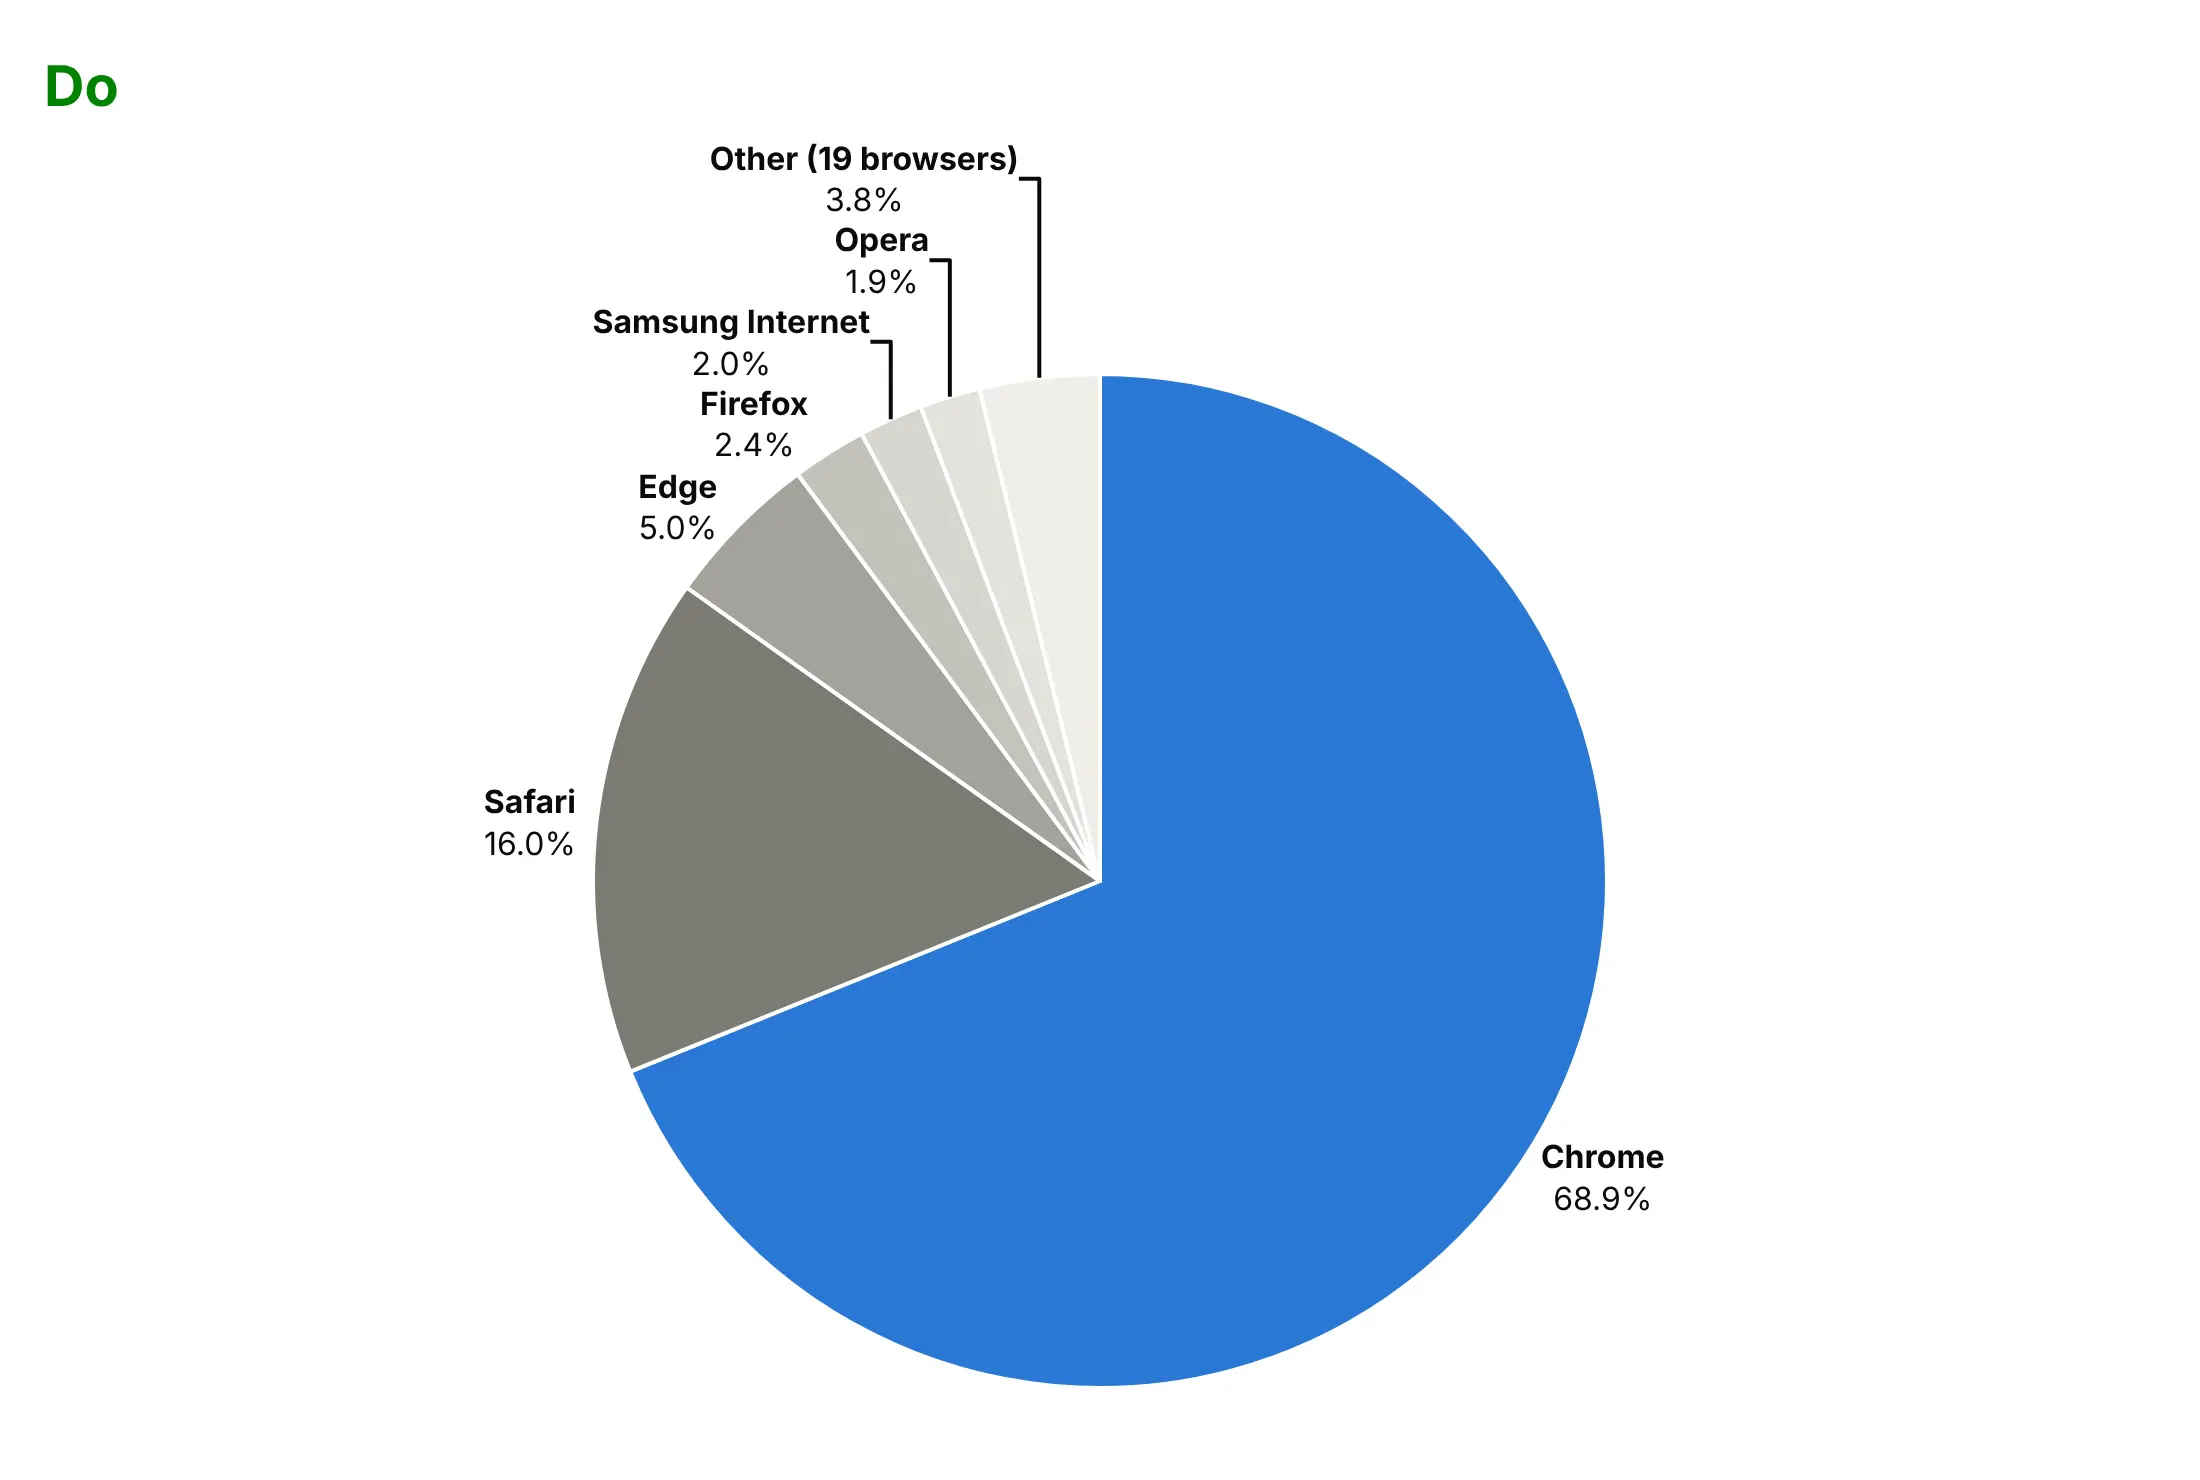
Market share. Chrome had 68.9% of the world's browser page views in 2025, more than four times Safari's 16.0%, and a pie shows a slice of more than two thirds instantly. Data: StatCounter Global Stats.
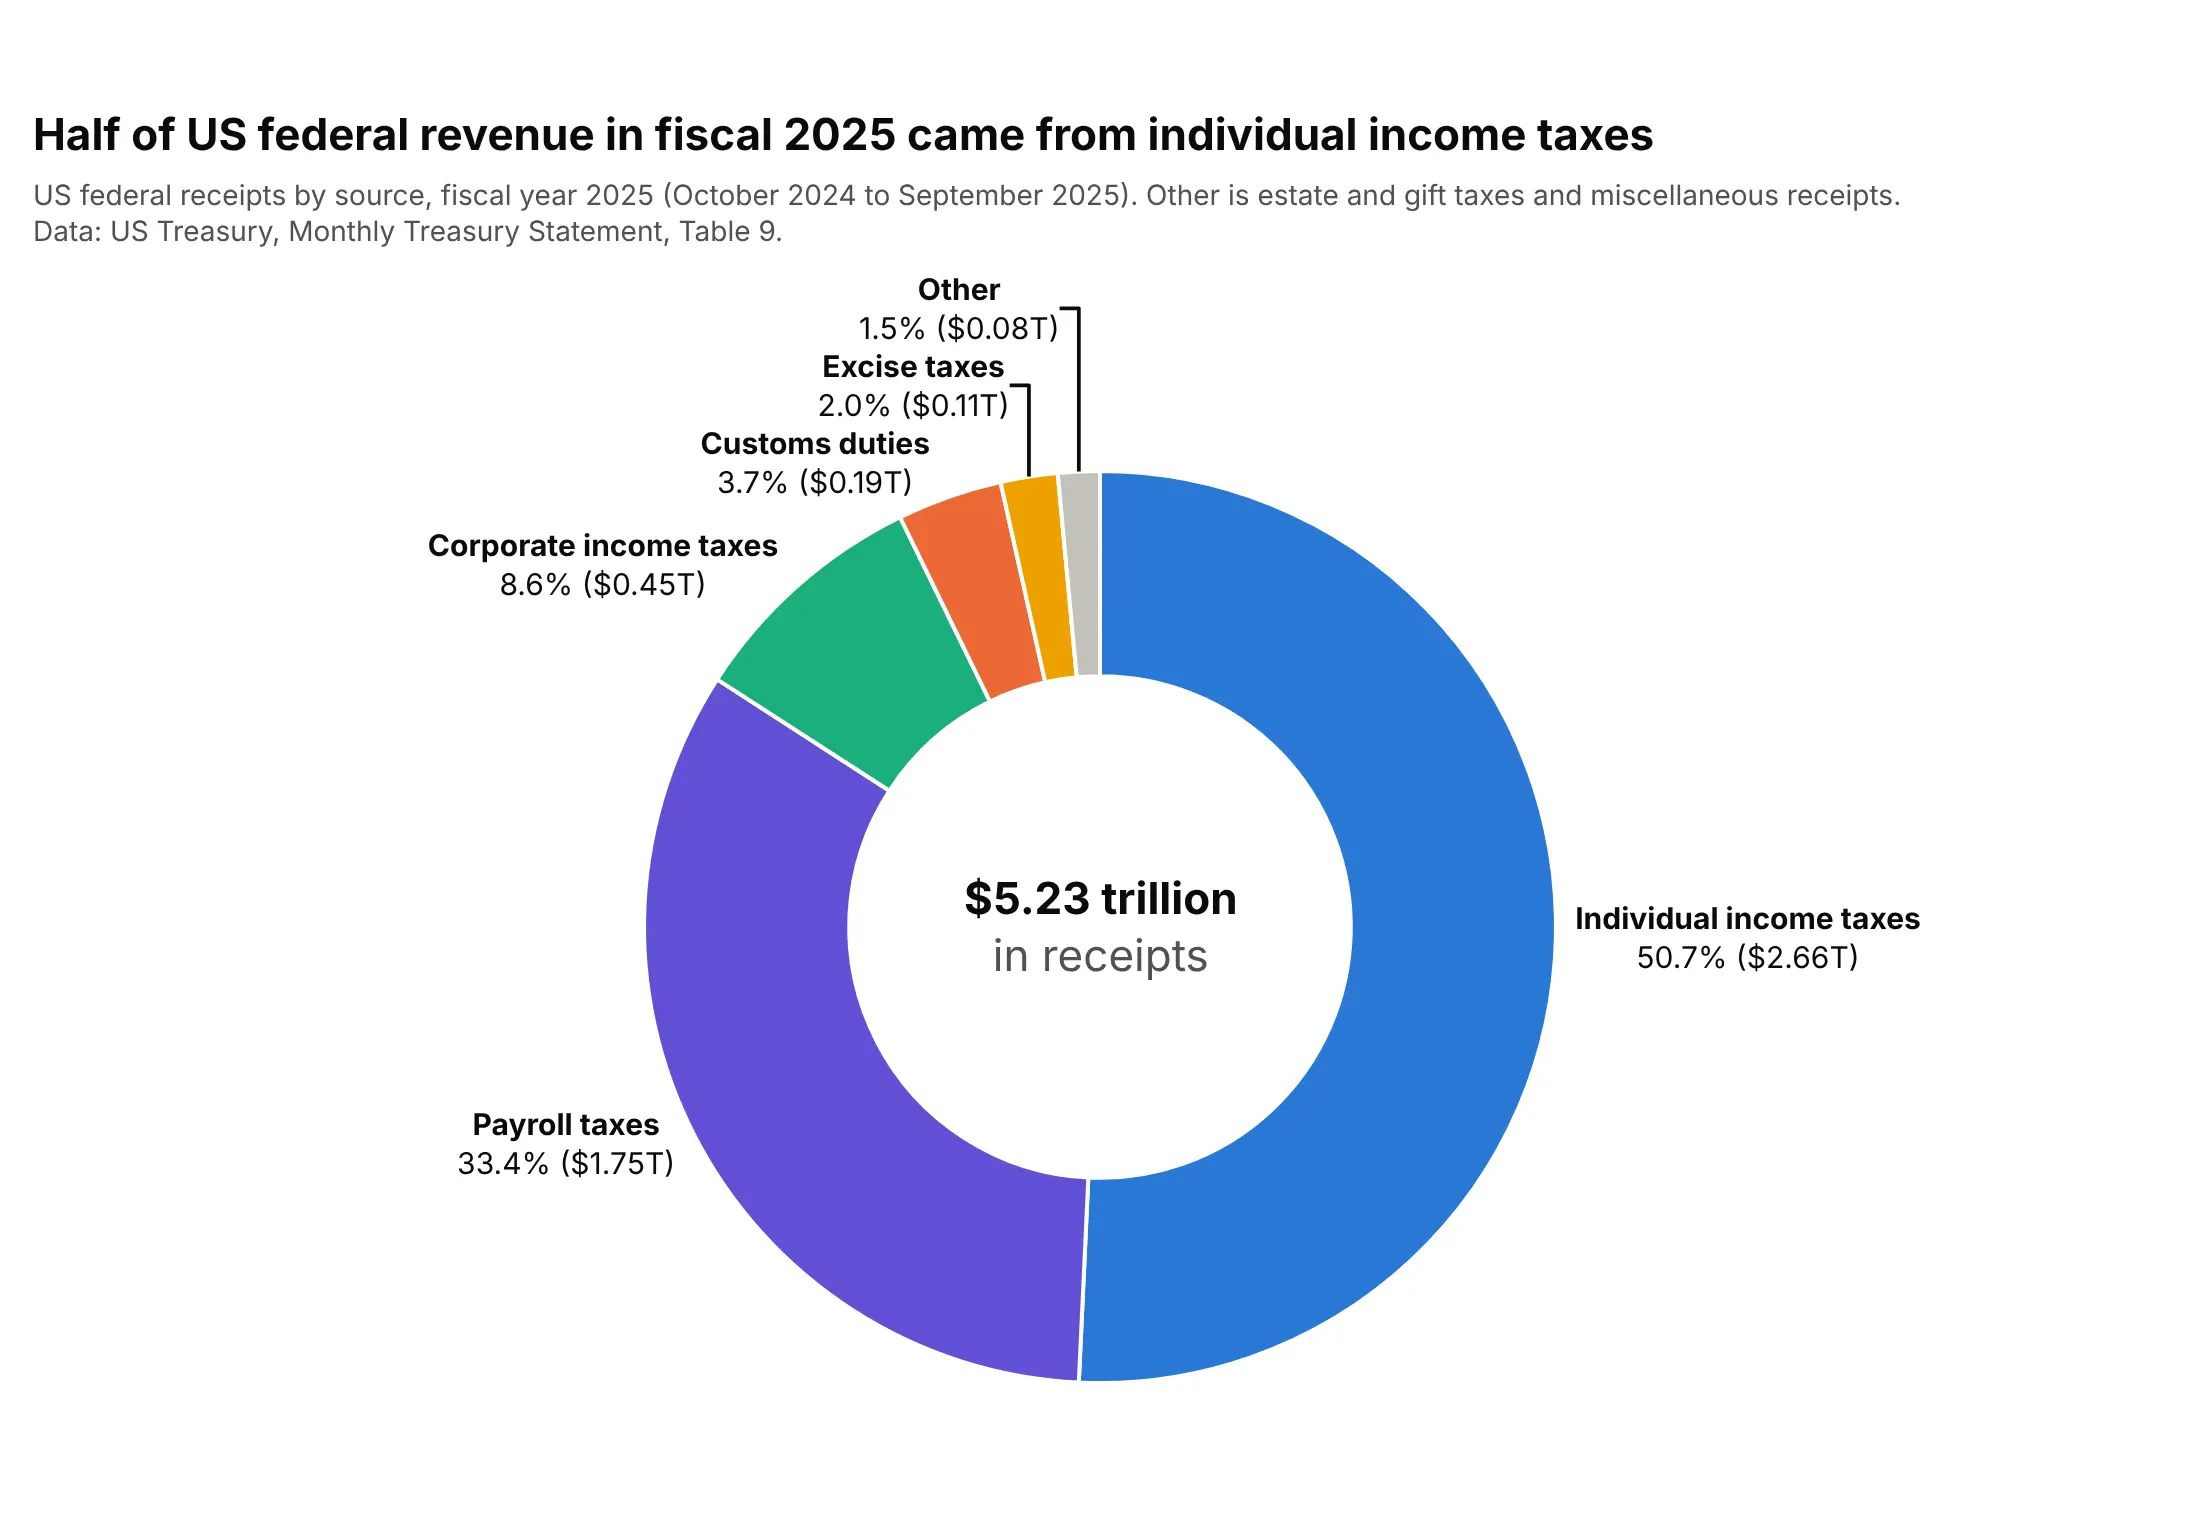
Budgets. Individual income taxes brought in half of the US government's $5.23 trillion of receipts in fiscal 2025, and the donut's hole holds the total. Data: US Treasury, Monthly Treasury Statement, Table 9.
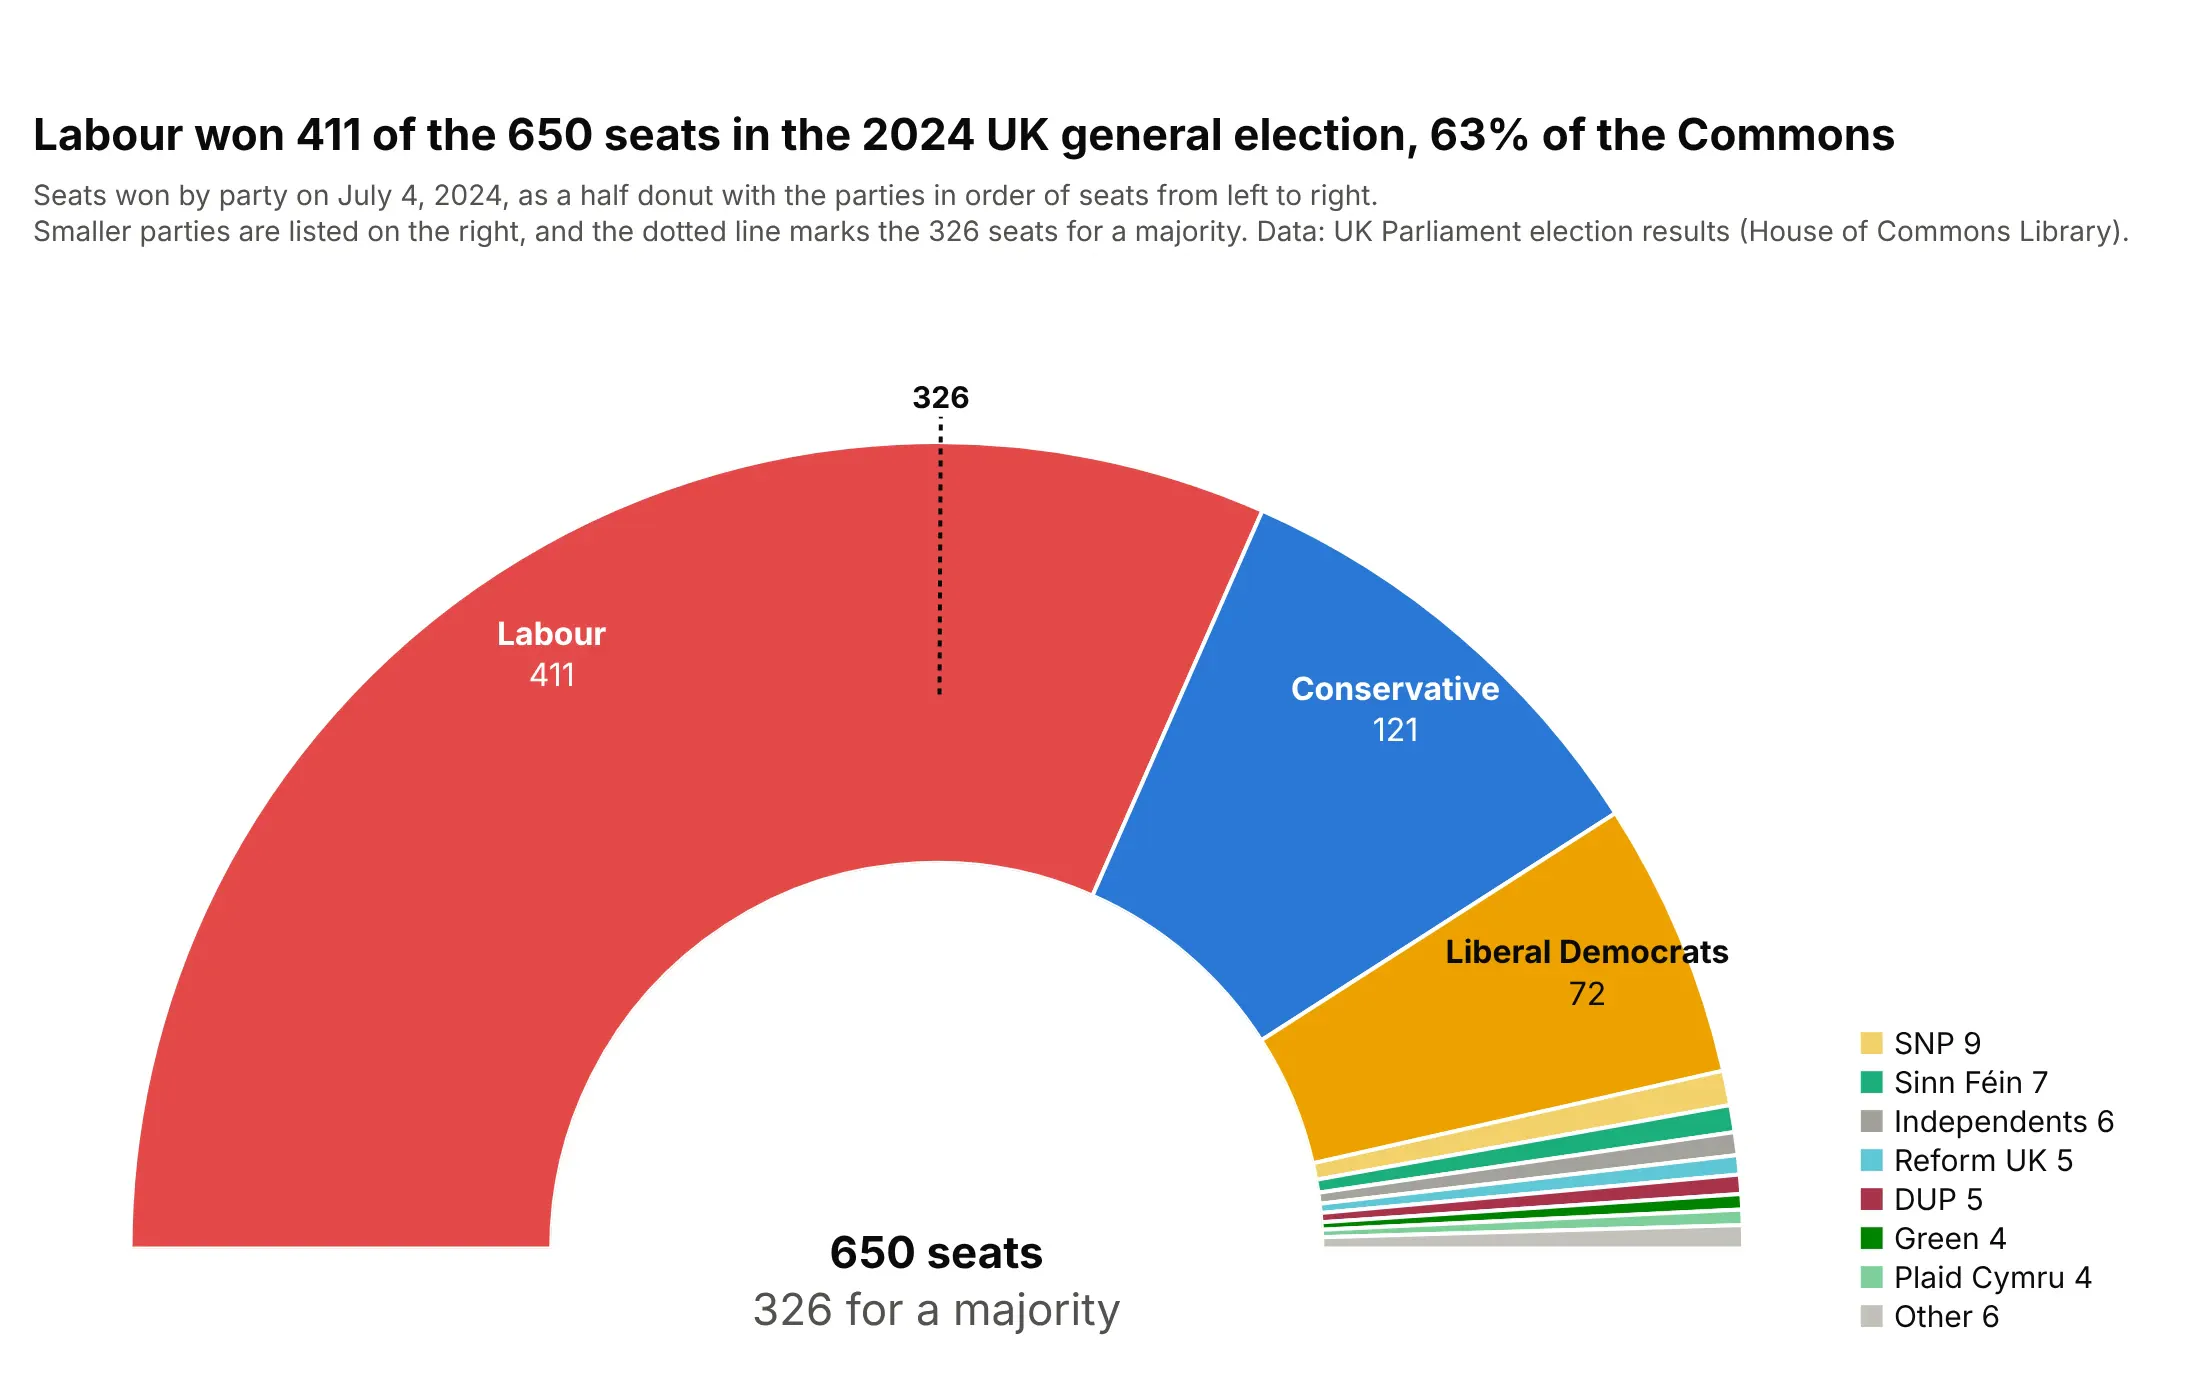
Election seats. Labour won 411 of the 650 seats in the House of Commons in 2024, and the half donut shows at once that it passed the 326 needed for a majority. Data: UK Parliament election results (House of Commons Library).
A short history
The earliest known pie charts are in William Playfair's Statistical Breviary of 1801, including one of the Turkish Empire's territory in Asia, Europe and Africa (Wikipedia; Ian Spence traces their origins in "No Humble Pie", 2005). In 1858 Charles Joseph Minard placed pie charts on a map of the cattle sent to Paris from across France, the idea behind today's bubble pie charts, and Florence Nightingale sent Queen Victoria her polar area diagram of army deaths in the Crimea, a pie whose wedges vary in length instead of angle (our wind rose guide redraws it with Plotly). Statisticians have long preferred bars, because Cleveland and McGill found that people judge angles less accurately than lengths (1984), but for reading proportions of a whole Spence and Lewandowsky found "little to choose between the pie and the bar chart" (1991).
Alternatives to a pie chart
Here's the same US electricity mix drawn six ways. Some are better for the question, some worse, some just different:
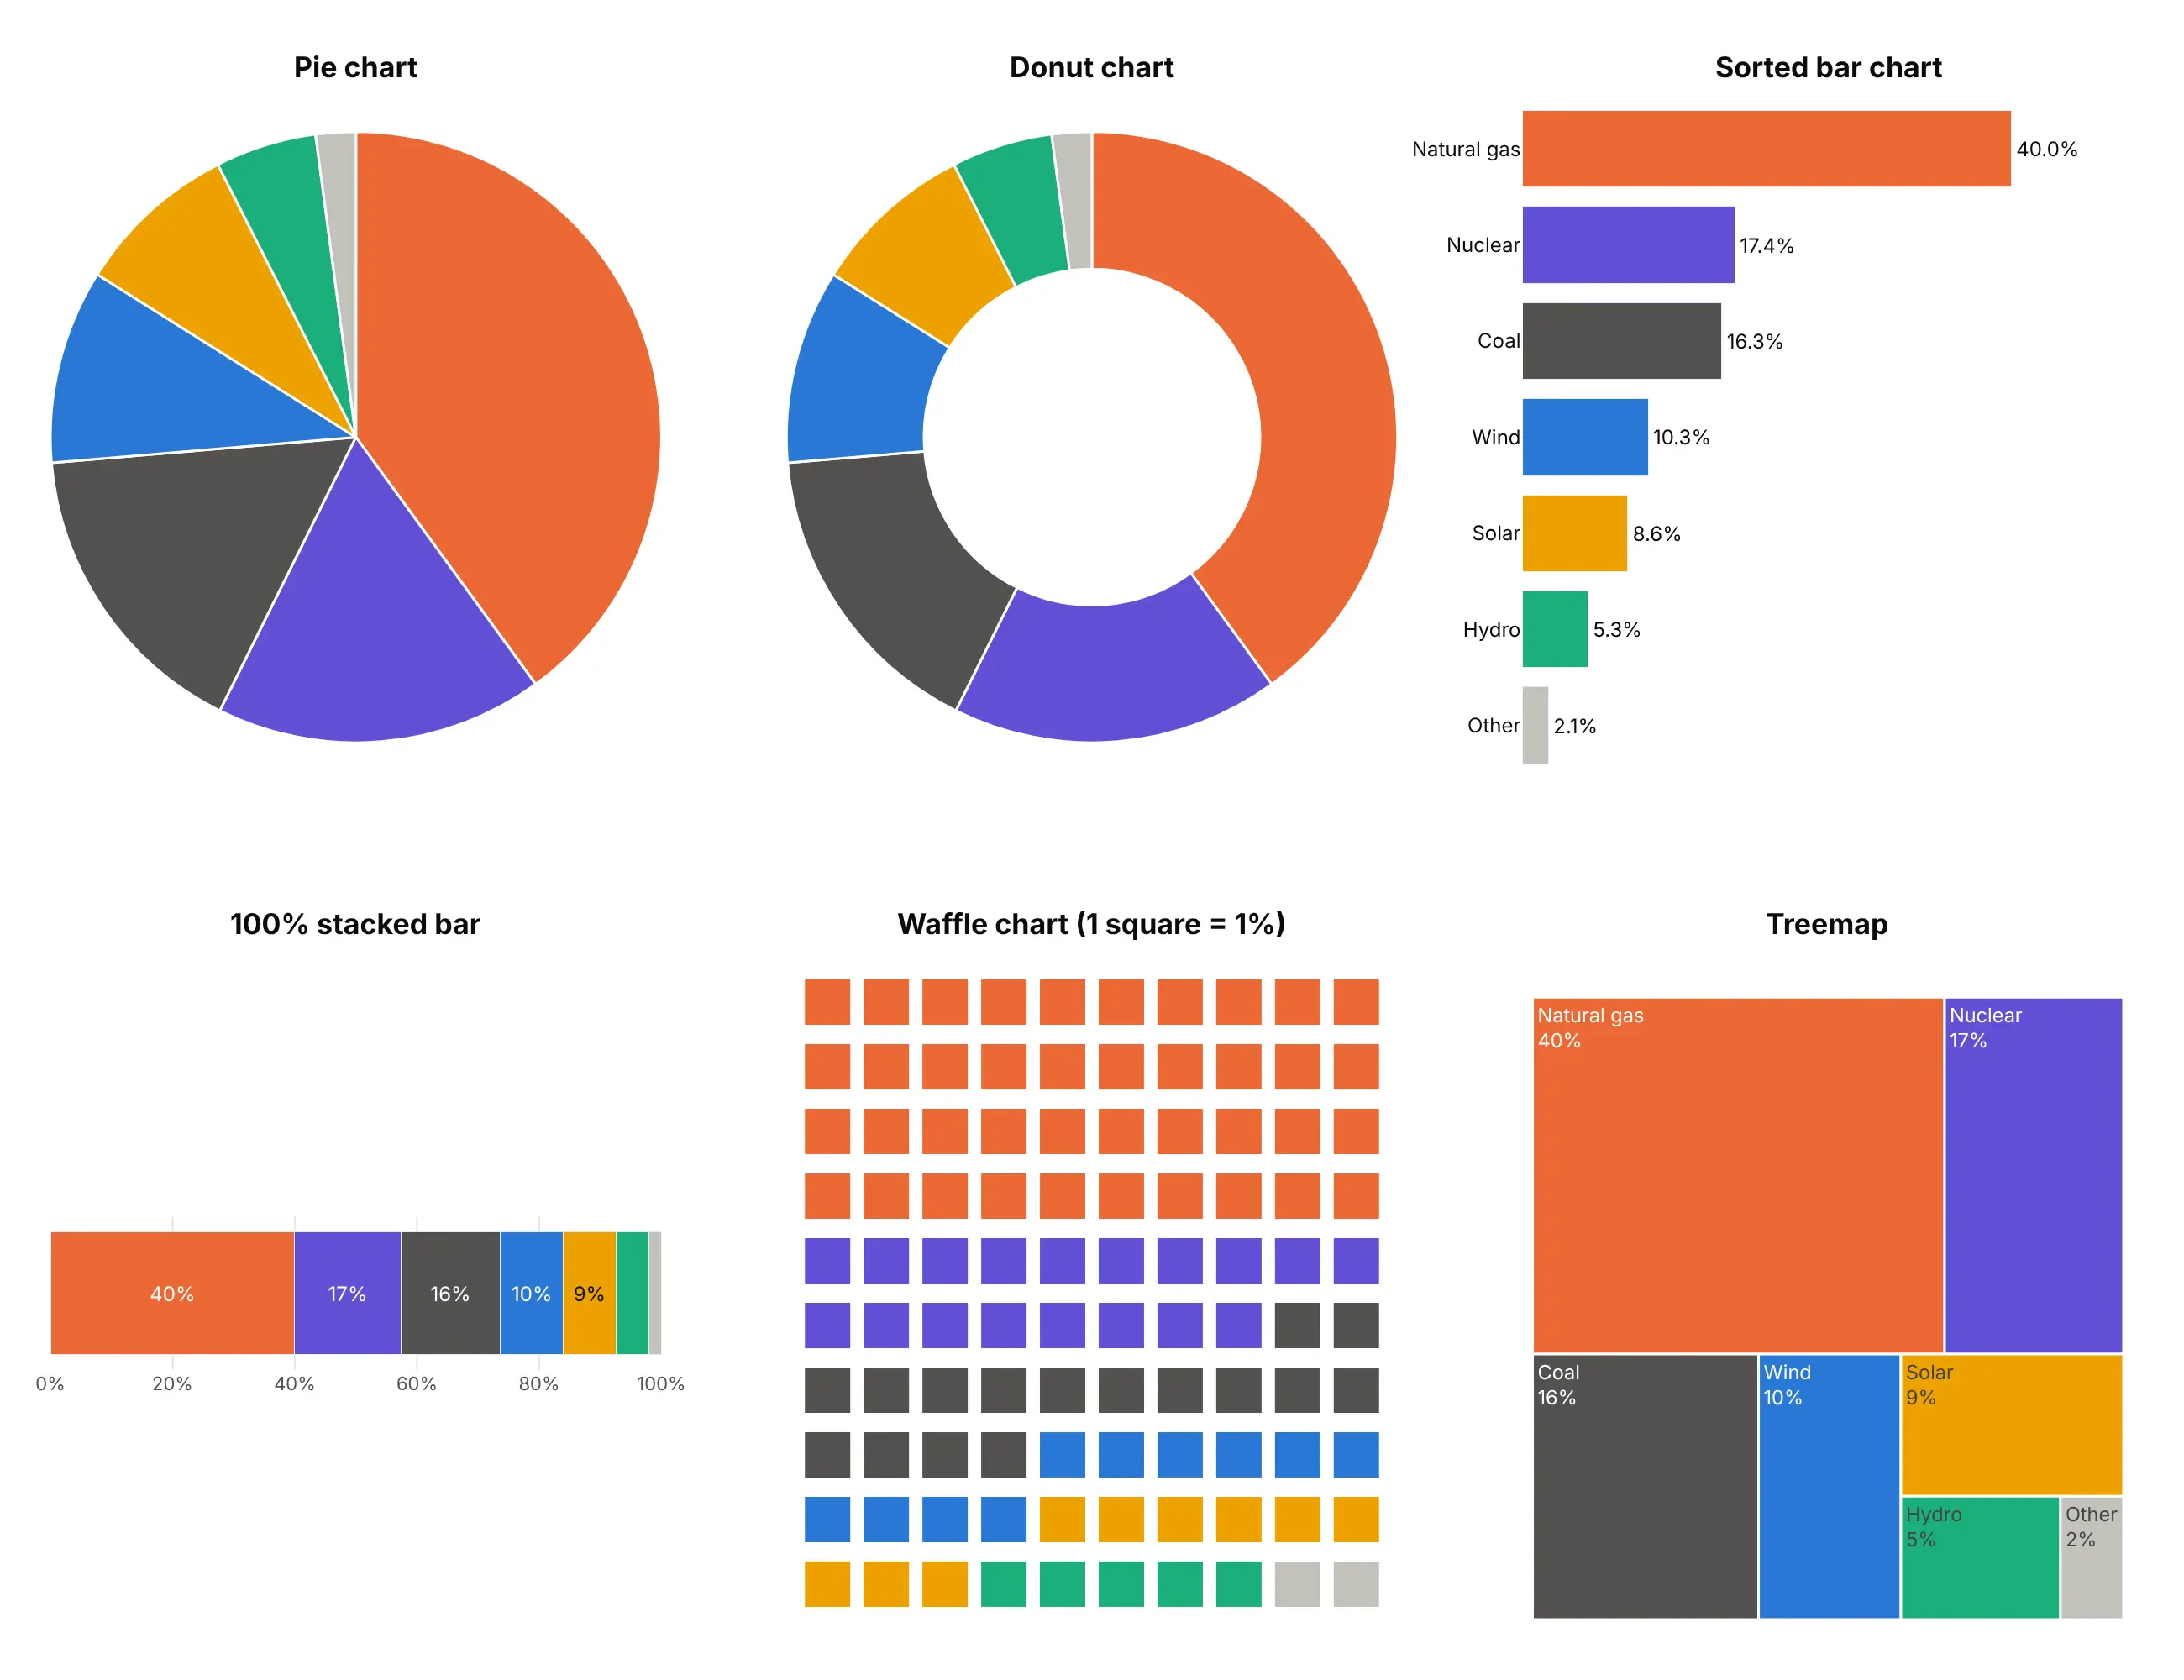
- Donut chart (works too). The same slices with the middle cut out, which leaves room for the total. Skau and Kosara found people read donuts as accurately as pies (2016).
- Sorted bar chart (better for precise comparisons). Nuclear at 17.4% and coal at 16.3% look equal in the pie but not as bars on one axis, and a bar chart still works with 20 categories.
- 100% stacked bar (better for comparing wholes). One bar per year or country lines the shares up, which side-by-side pies can't do (way 8 below).
- Waffle chart (works too). 100 squares you can count, so 40% is 40 squares, and small shares stay visible.
- Treemap (better for many parts). Rectangles hold labels better than thin slices and can nest groups inside groups.
For parts that split into subparts, a pie chart with subcategories is a sunburst chart (way 6 below). A pie works fine as it is when there are a few parts of one whole and the question is "what share of the total?".
How to make a pie chart
With AI
ChatGPT, Claude Code, GitHub Copilot, Cursor and other AI tools are excellent at writing Plotly code. Name Plotly in the prompt, and say how many slices to keep, the order and where the labels go:
Make a plotly pie chart from us_electricity.csv (columns: source, twh).- Use px.pie with names = source and values = twh, one slice per source.- Slices sorted largest first, clockwise from 12 o'clock, white lines between slices.- One fixed color per source, labels outside with the name and the share to one decimal, no legend.- Fixed width and height and a title that states the takeaway.- Check: print each source's share of the total.
With Plotly Studio
Plotly Studio is a desktop app where you point an AI at a dataset and it builds charts and a Dash app around your questions. Ask for a pie chart the same way:
Show a donut chart of US federal receipts by source for the latest fiscal year, sorted largest first, with each source's share and amount next to its slice and the total in the middle.
Make a pie chart in Python or JavaScript
This is the code AI tools write under the hood. In Python, a Plotly pie chart is one call to px.pie, and the Plotly pie chart documentation covers colors, labels and subplots. For a donut chart in Python, pass hole:
import pandas as pdimport plotly.express as pxdf = pd.read_csv("us_electricity.csv") # source, twhfig = px.pie(df, names="source", values="twh", hole=0, # hole=0.5 makes it a donuttitle="Natural gas made 40% of US electricity in 2025")fig.update_traces(direction="clockwise", textposition="outside",texttemplate="%{label}<br>%{percent:.1%}") # slices are sorted largest first by defaultfig.update_layout(showlegend=False, margin=dict(t=110))fig.show()
px.pie returns a figure with one go.Pie trace. Plotly adds up the values, so you pass raw amounts and it computes the percentages.
In JavaScript, plotly.js draws a JavaScript pie chart or donut chart from the same trace. This is how to create a pie chart in JavaScript, with the hole holding the total:
<div id="chart"></div><script src="https://cdn.plot.ly/plotly-4.1.1.min.js"></script><script>// US federal receipts, fiscal year 2025, billions of dollars (Monthly Treasury Statement, Table 9)const sources = ["Individual income taxes", "Payroll taxes", "Corporate income taxes","Customs duties", "Excise taxes", "Other"];const billions = [2656.0, 1748.3, 452.1, 194.9, 105.9, 77.4];Plotly.newPlot("chart", [{type: "pie", labels: sources, values: billions,hole: 0.55, // a donut chart; 0 is a piedirection: "clockwise", // slices are sorted largest first by defaulttextposition: "outside", texttemplate: "%{label}<br>%{percent:.1%}",hovertemplate: "%{label}: $%{value:,.0f} billion<extra></extra>"}], {width: 800, height: 560, showlegend: false, margin: {t: 90, b: 60, l: 130, r: 130},annotations: [{text: "<b>$5.23 trillion</b>", showarrow: false, font: {size: 20}}] // the total in the hole});</script>
Share it
Every Plotly chart has a Share chart button (the cloud icon in its toolbar) that uploads it to Plotly Cloud and gives you a link. Only you can see it until you change its visibility.
For a live app, put the chart in a Dash app and publish it with the Plotly Cloud CLI. Coding agents can run these commands for you:
pip install "dash[cloud]"plotly user loginplotly app publish
If your data has to stay in your own cloud or data center, publish to Dash Enterprise instead.
Dos and don'ts
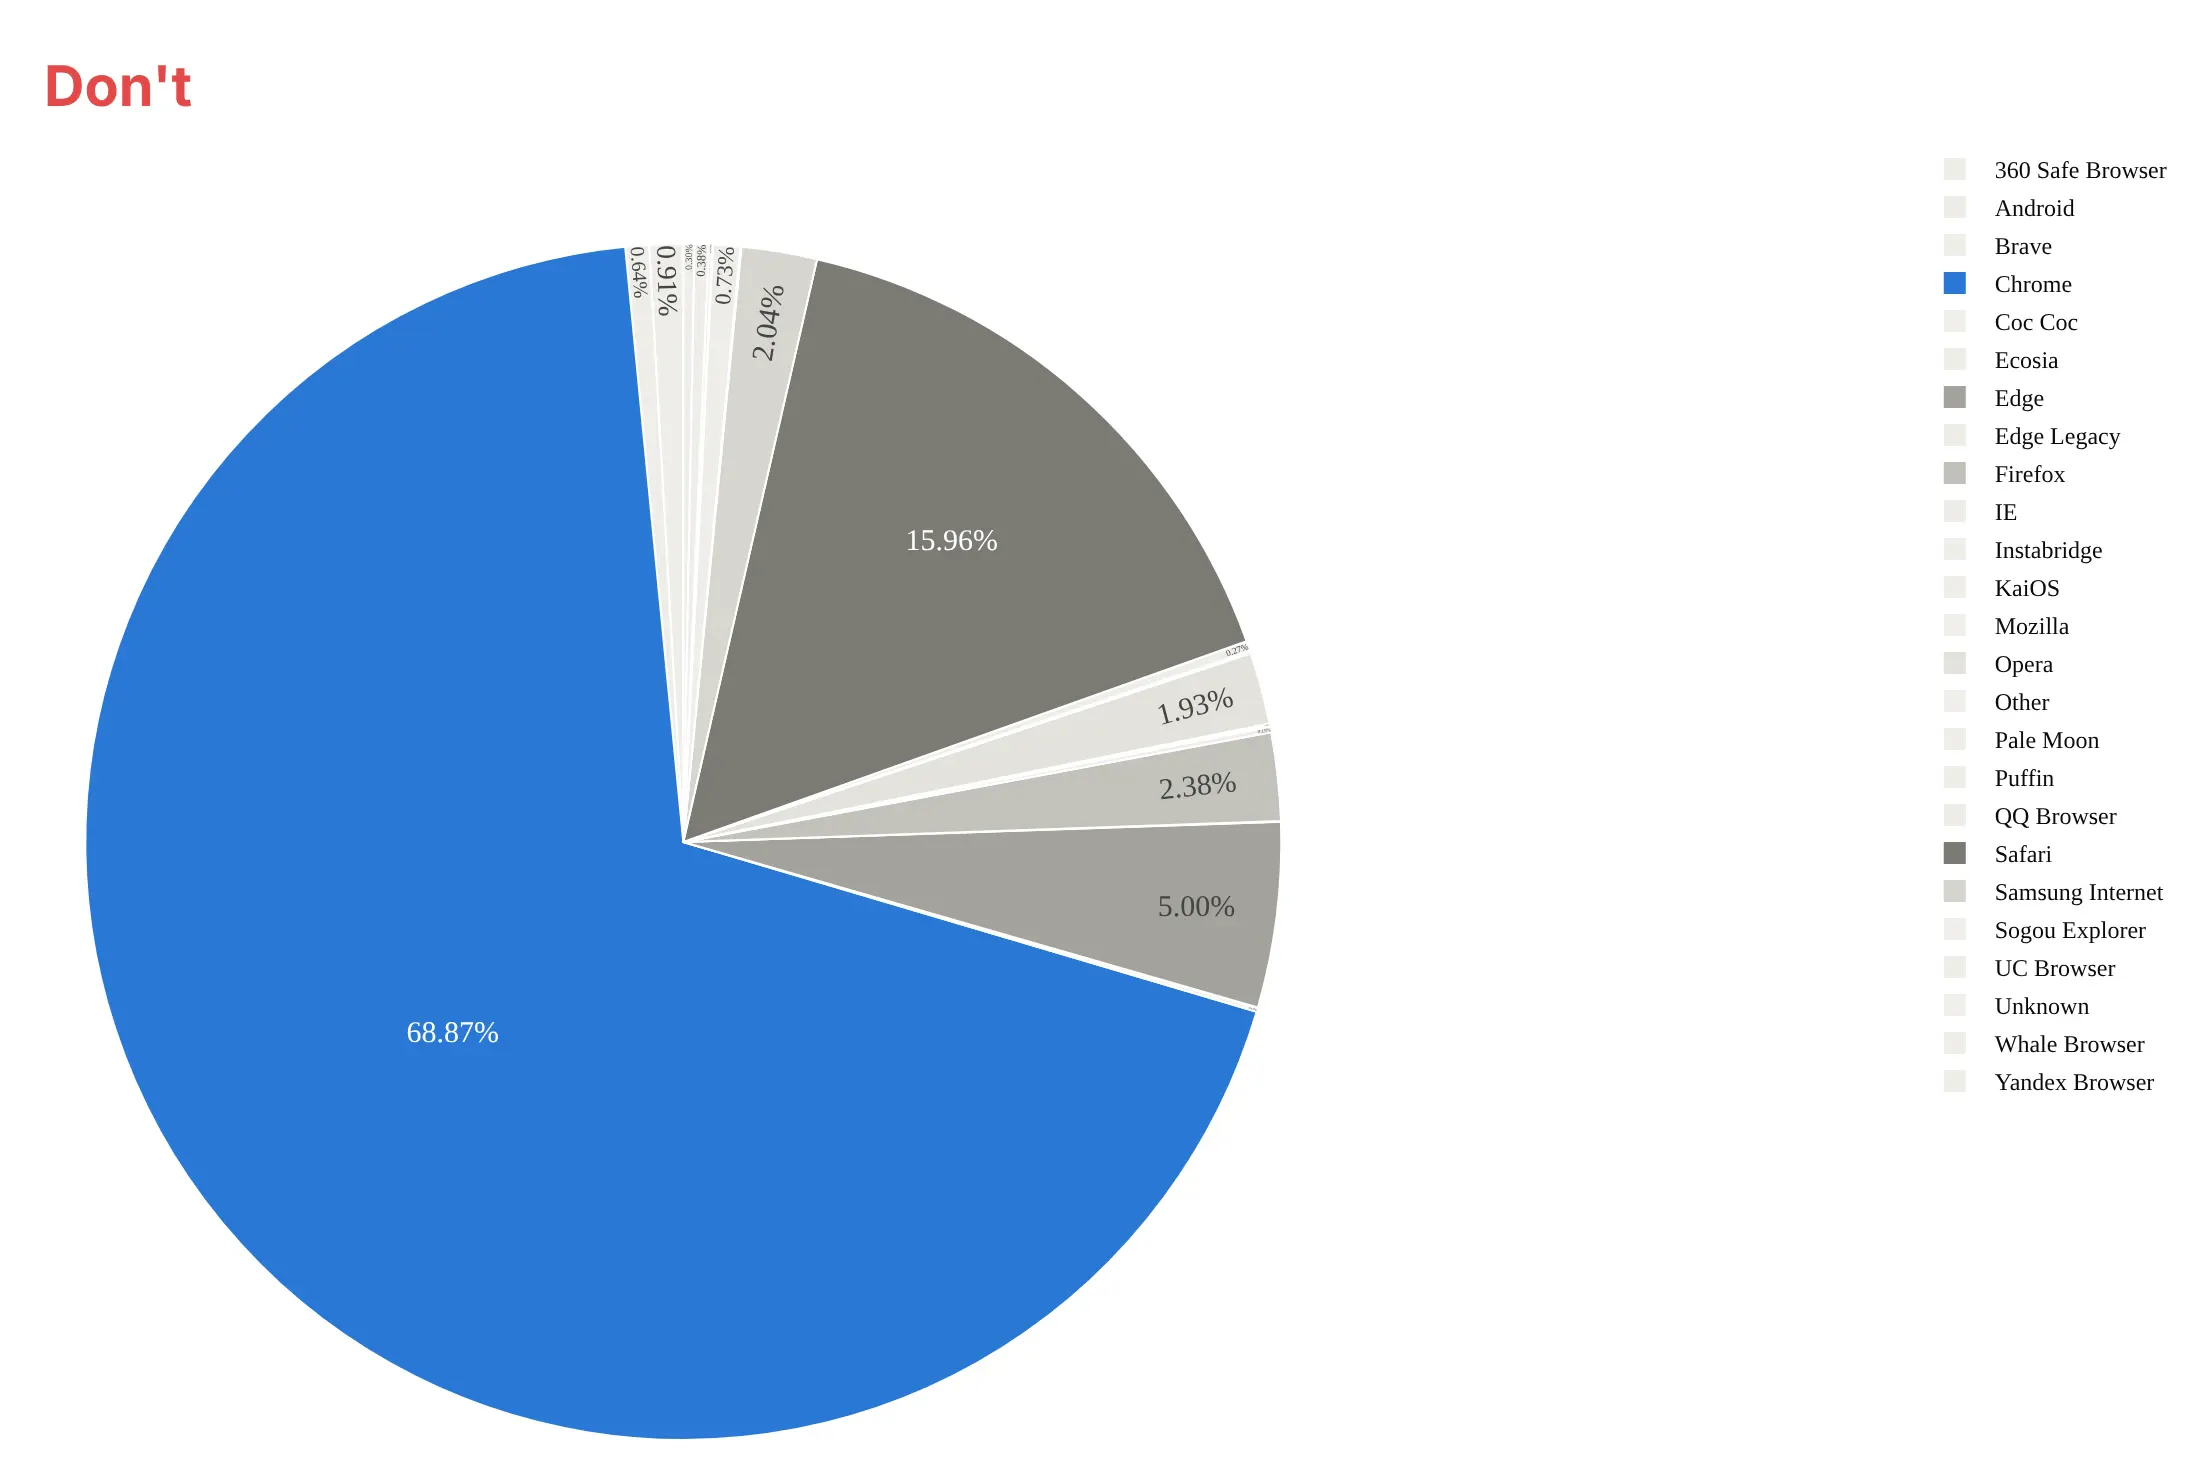
Most of the work in a published pie chart is deciding which parts get their own slice and putting the labels where they can be read. Here are StatCounter's 25 browser shares for 2025 both ways, in the same colors.
Don't give each of the 25 browsers its own slice, turn sorting off so the slices run in alphabetical order, print two-decimal percentages inside slices too thin to hold them, make readers match 25 legend colors, or leave the default serif font:
Do group the 19 smallest browsers into one "Other" slice, sort the slices largest first, and put each name and share next to its slice so no legend is needed:
Checklist
Do
- Keep to about six slices and group the rest into "Other", saying how many it holds.
- Sort slices largest first and start at 12 o'clock (Plotly's sort=True default), clockwise.
- Label slices directly with the name and the share, rounded to what the reader needs.
- Put the total in the title, the subtitle or a donut's hole.
- Use one color per category and keep it across every chart in a report.
- Write a title that states the takeaway.
Don't
- Compare several pies side by side when the differences matter; use a 100% stacked bar.
- Use a pie for values that don't add up to a meaningful whole, or for negative values.
- Tilt the pie into 3D or pull every slice apart; both distort the angles.
Options to customize
A pie chart in Plotly is px.pie or a go.Pie trace, so these are the options that matter most. The full lists are in the px.pie reference and the pie trace reference.
- px.pie(names=..., values=...): the category column and the amount column; Plotly computes the shares.
- hole: the fraction of the radius cut out, from 0 (pie) to about 0.6 (thin donut).
- sort: True by default, which orders slices largest first; set False to keep your own order, as in ways 2 and 4.
- direction, rotation: clockwise or counterclockwise (the default), and the angle where the first slice starts (0 is 12 o'clock).
- textinfo, texttemplate: what each label shows, such as "%{label}<br>%{percent:.1%}".
- textposition, insidetextorientation: labels inside, outside or automatic, and how inside text is turned.
- pull: pulls one or more slices out from the center to highlight them, as in way 4.
- marker.colors or color_discrete_map, marker.line: fixed colors per category and the white lines between slices.
- domain and make_subplots(specs=[[{"type": "domain"}]]): where each pie sits, for several pies in one figure.
- scalegroup: sizes pies in the same group so their areas are proportional to their totals.
- uniformtext: one text size for every slice, hiding labels that don't fit.
- automargin: lets outside labels push the margins so they aren't clipped.
- go.Sunburst, go.Barpolar with polar.sector: subcategories in rings, and half donuts.
- frames, updatemenus, sliders: an animated pie with a play button and a year slider.
13 ways to draw a pie chart
A pie chart has more forms than most people use. We took the world's electricity in 2025, 31,772 TWh from nine sources and seven regions, plus every year back to 2000, and drew it 13 ways. Each one answers a slightly different question.
1. Basic pie, sorted
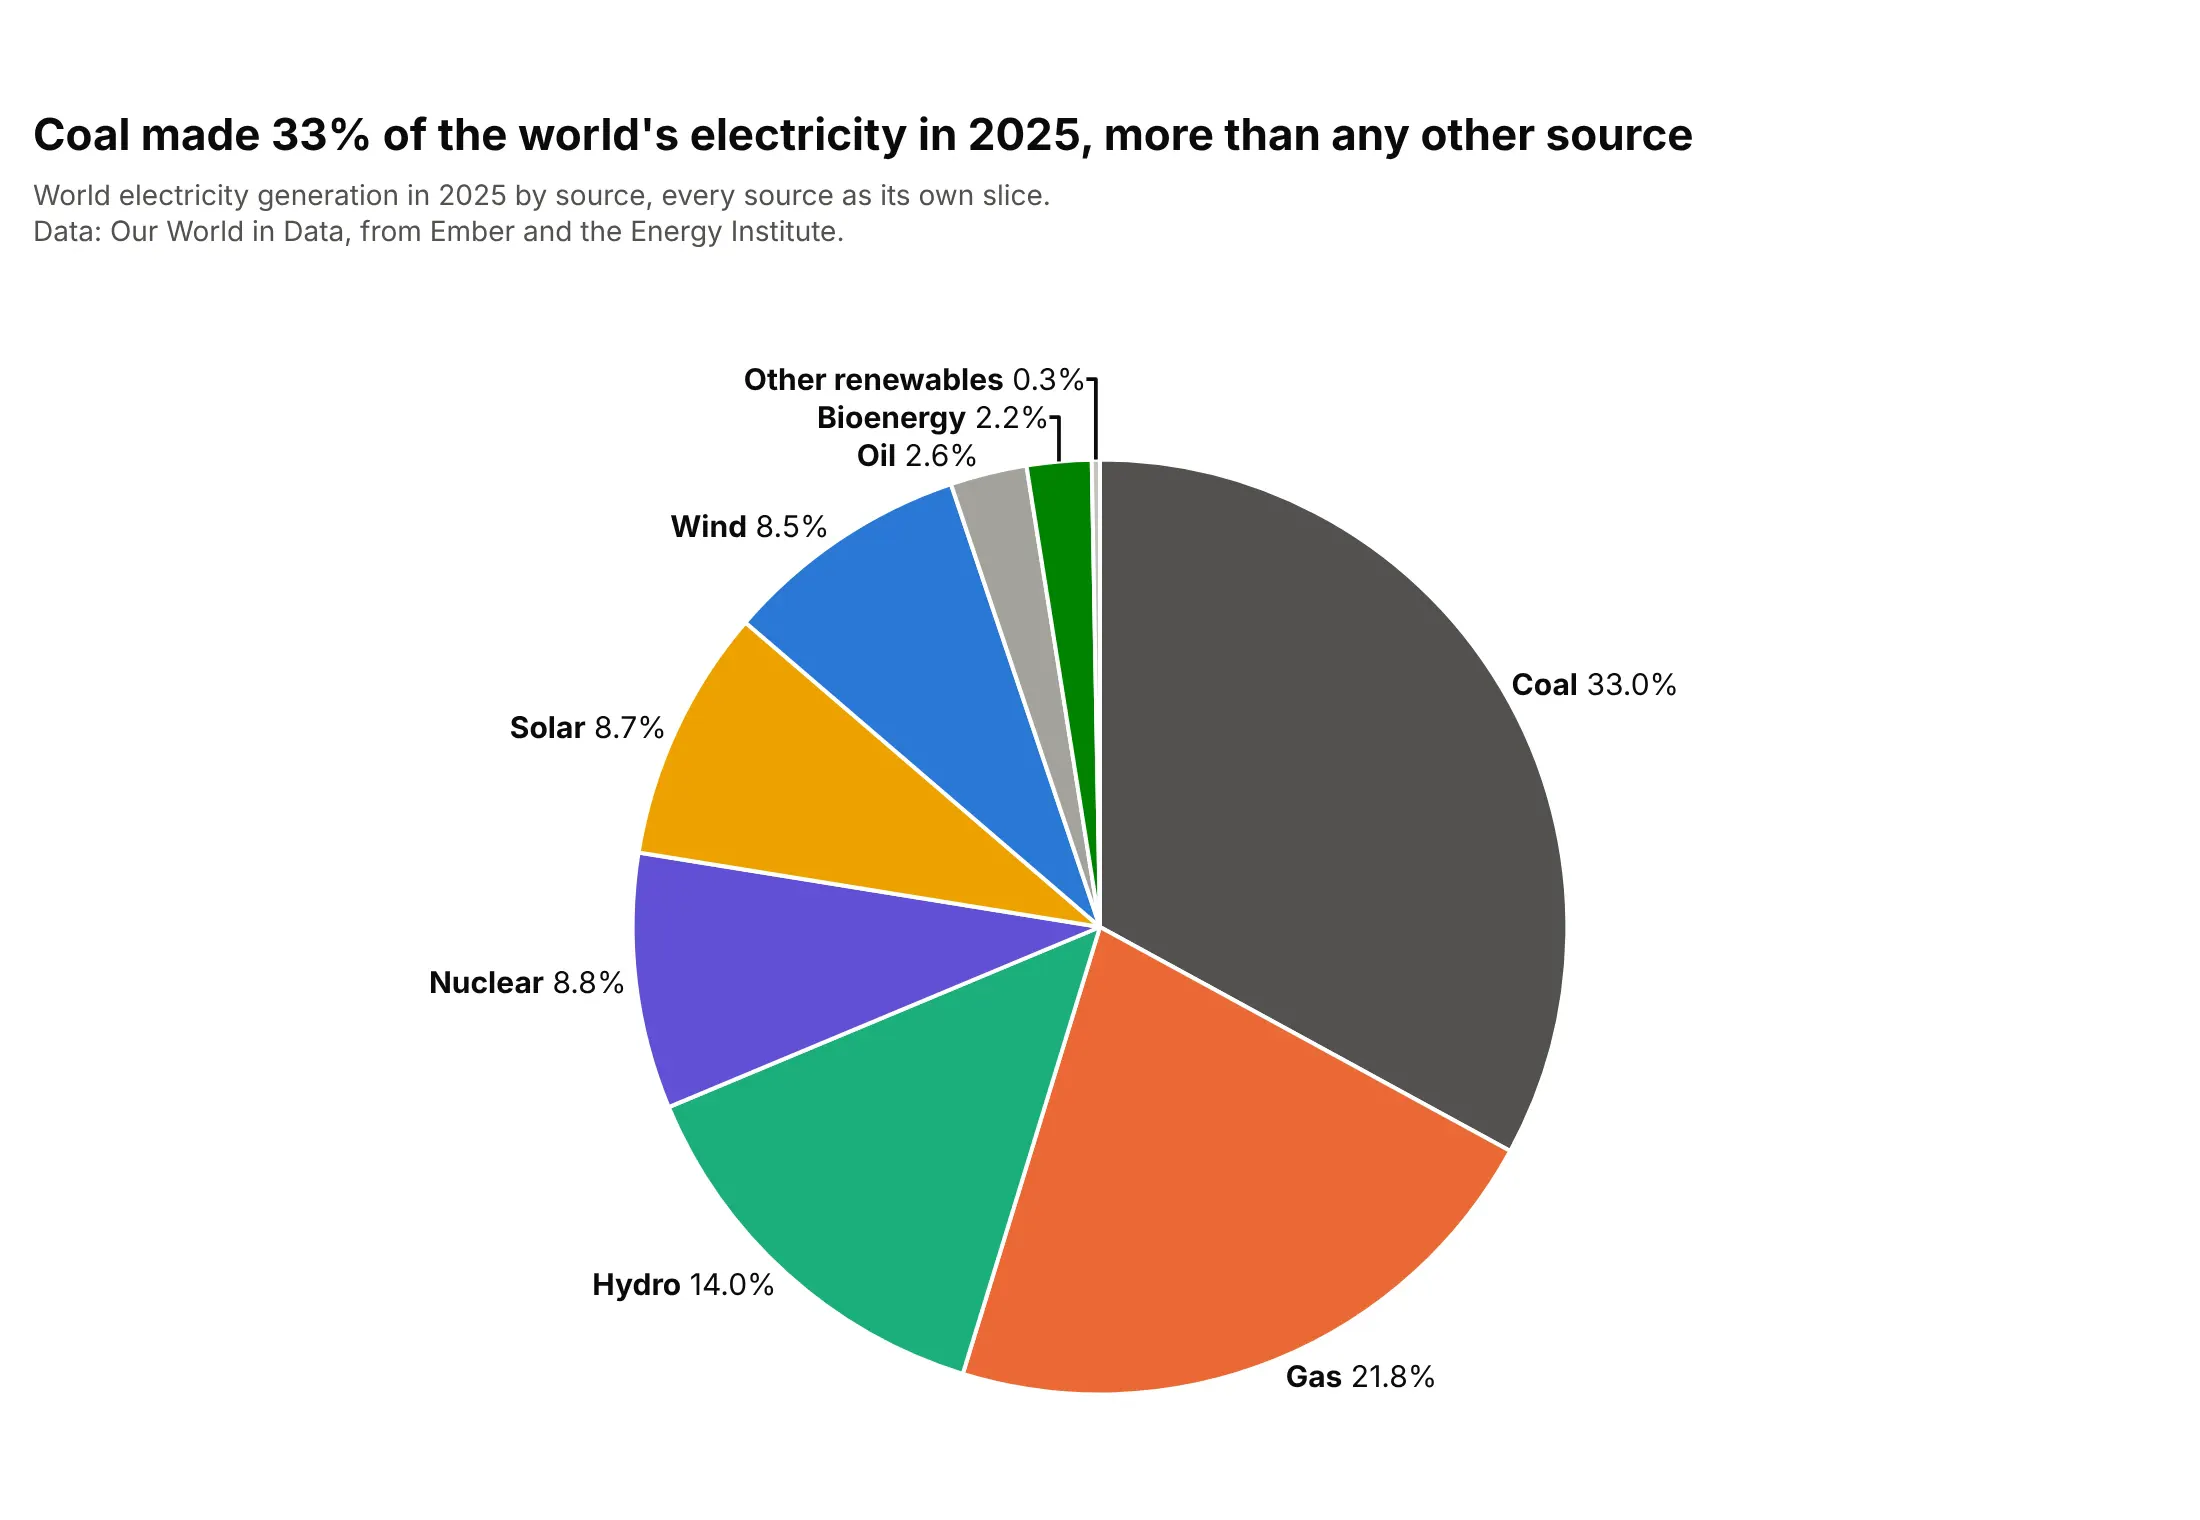
Every source gets a slice, sorted largest first and clockwise from 12 o'clock, so coal's third of the world's electricity reads at once. With nine slices the small ones crowd together at the top, where their labels need leader lines. Plotly sorts slices by default; direction="clockwise" and textposition="outside" do the rest.
Prompt: Get the data from Our World in Data's energy dataset (github.com/owid/energy-data, from Ember and the Energy Institute), entity World, year 2025, columns <source>_electricity for nine sources. Make a plotly pie chart with go.Pie: sort=True, direction="clockwise", one fixed color per source, labels outside with the name and the share to one decimal, no legend, and a title that states the largest share.
2. Small slices grouped into Other
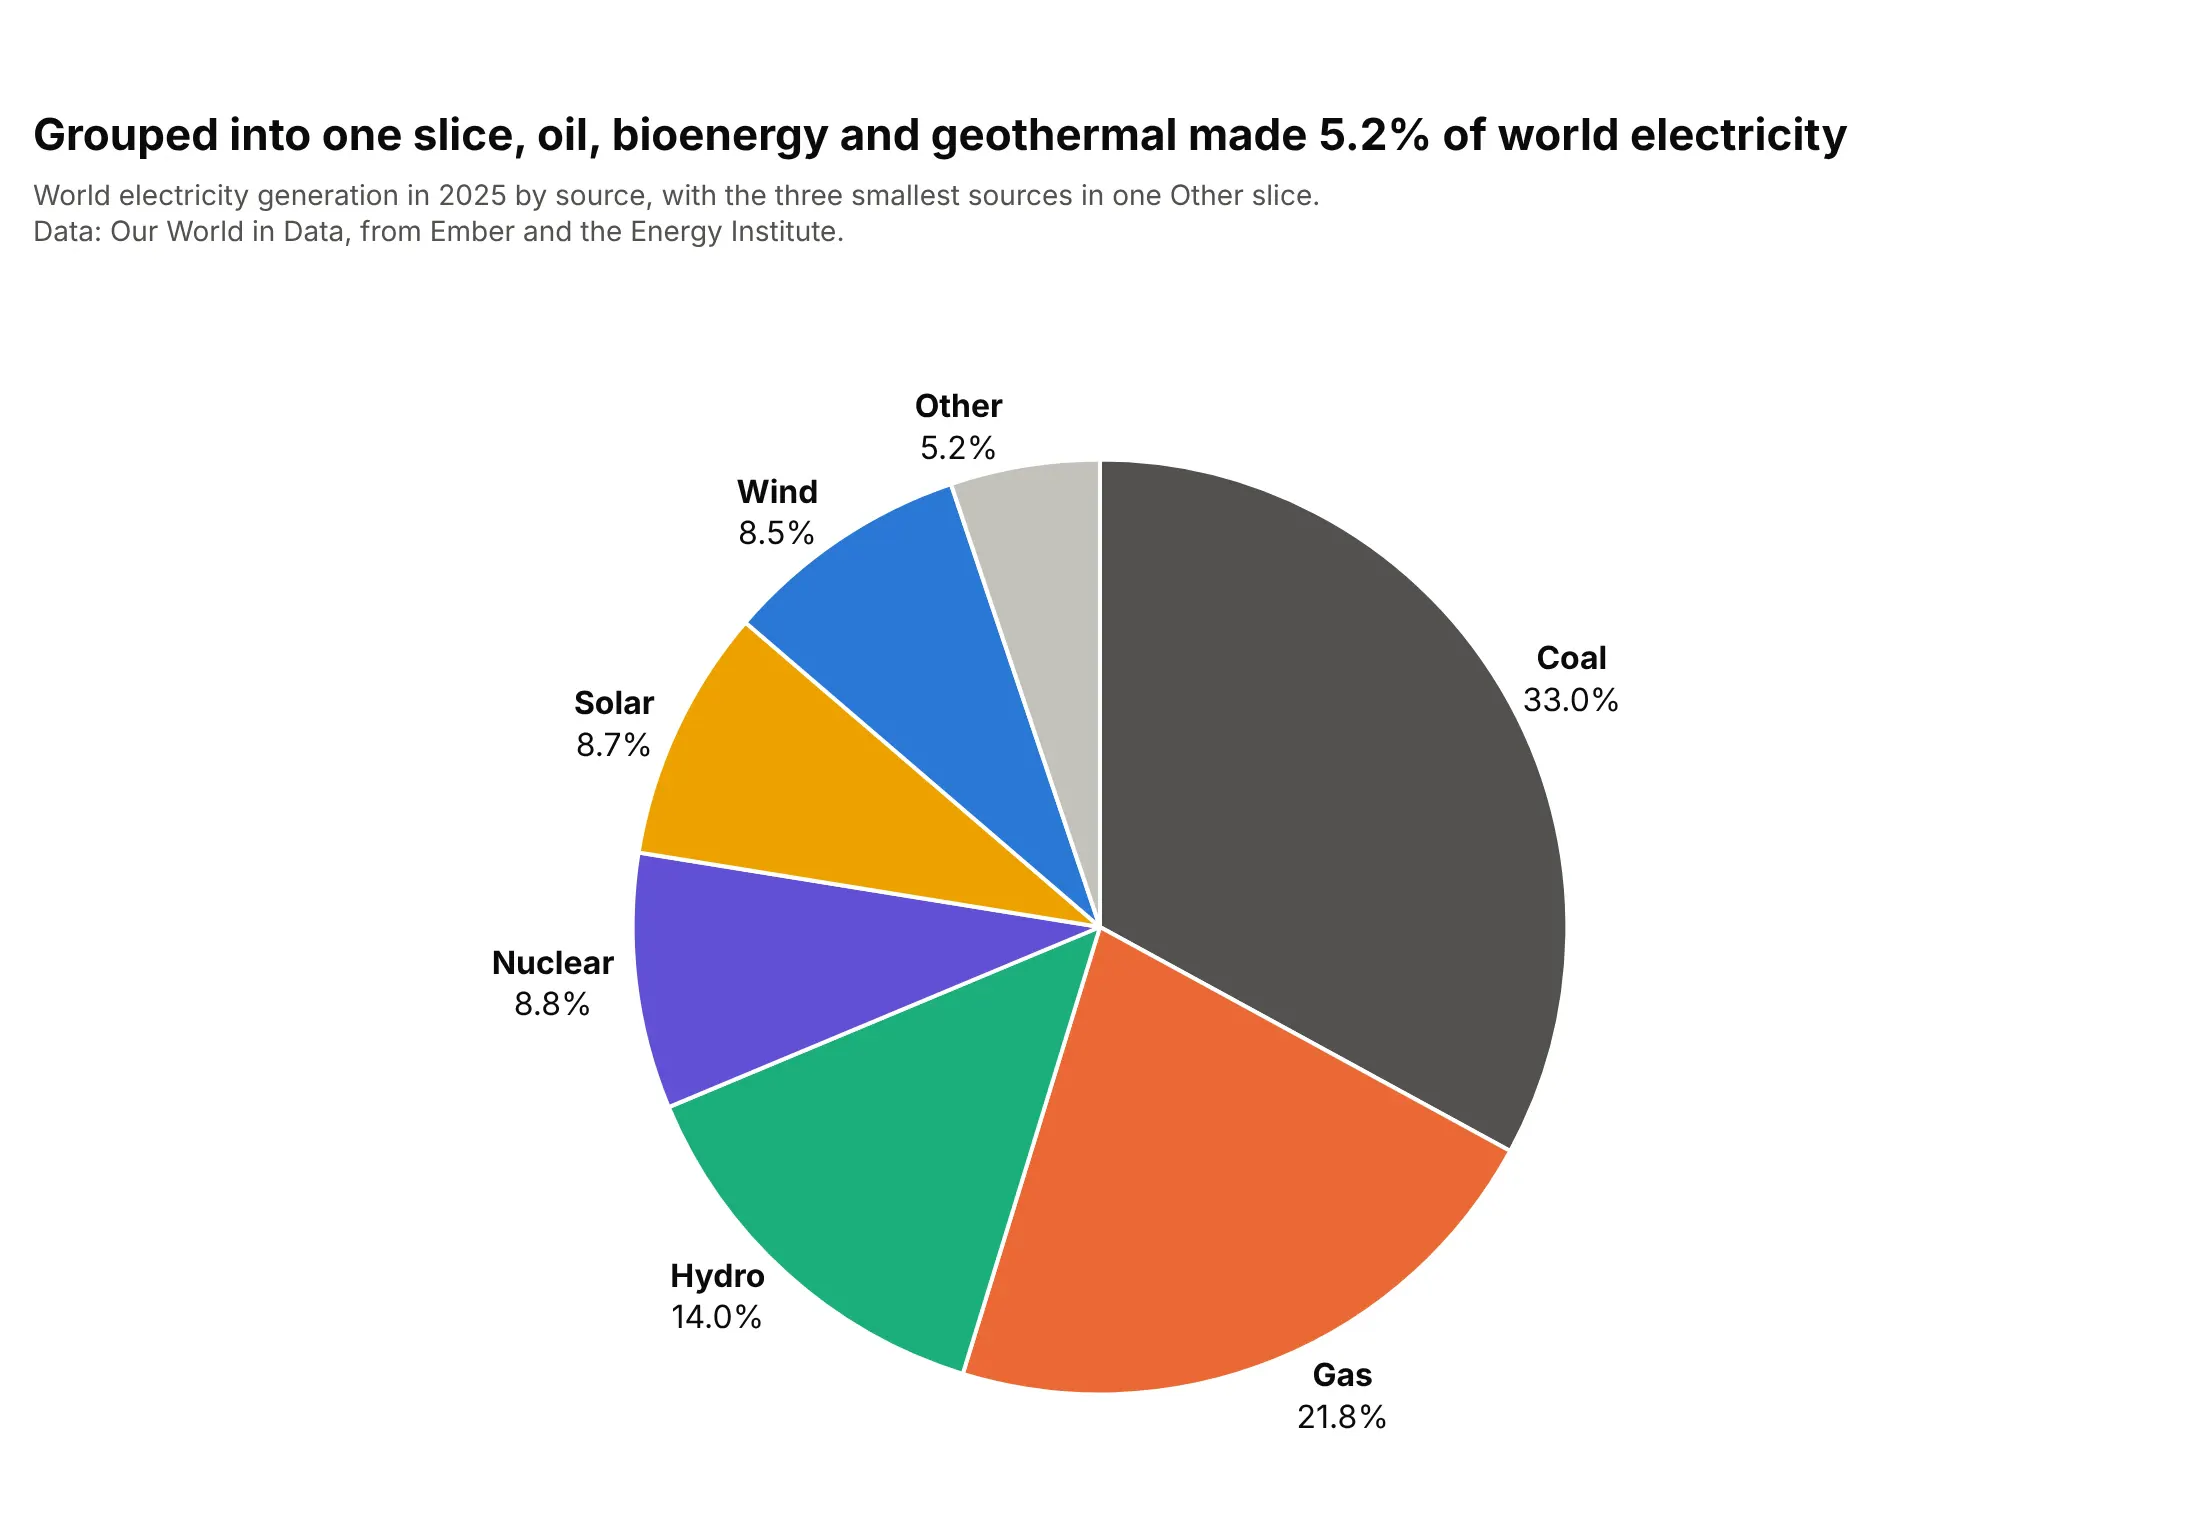
Oil, bioenergy and geothermal together made 5.2% of world electricity, and as one gray "Other" slice they stop crowding the labels. This is the most useful single fix for a busy pie, as long as the subtitle says what Other holds. Add the slice yourself in pandas and pass sort=False so Other stays last instead of being sorted into the middle.
Prompt: Get the data from Our World in Data's energy dataset (github.com/owid/energy-data), entity World, year 2025, electricity by source in TWh. Group oil, bioenergy and other renewables into one "Other" row. Make a plotly pie chart with go.Pie, sort=False with the rows in descending order and Other last, direction="clockwise", Other in light gray, labels outside, and a subtitle that lists what Other contains.
3. Donut chart with the total in the middle
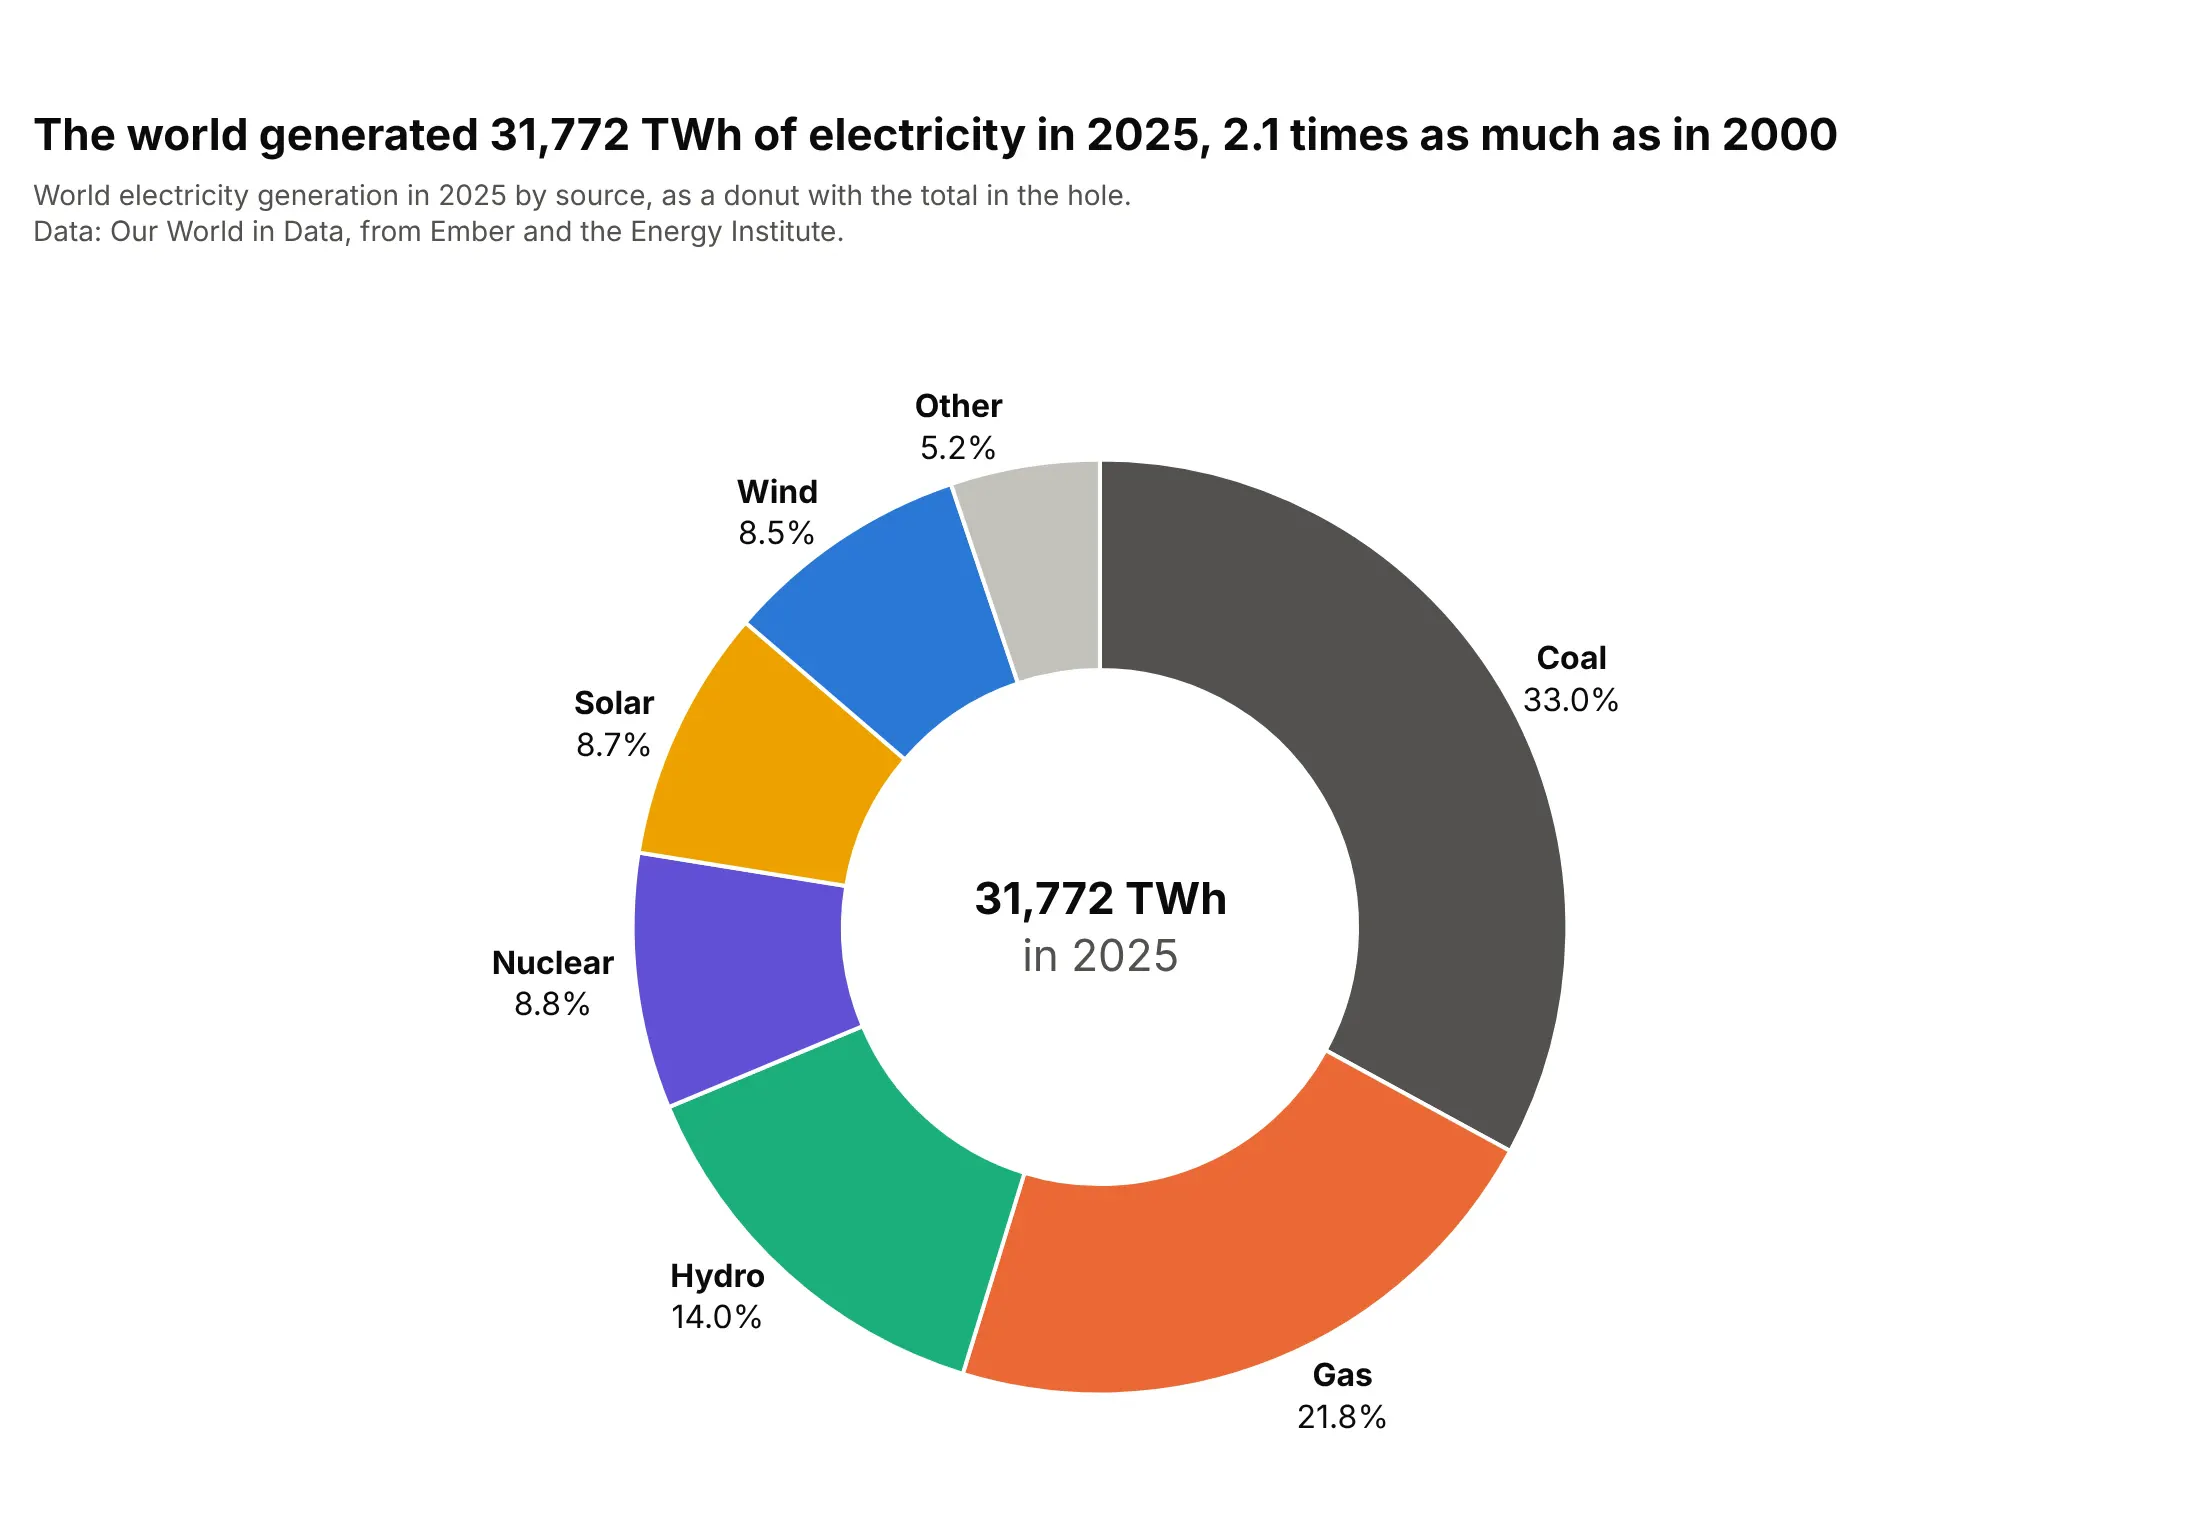
The world generated 31,772 TWh in 2025, 2.1 times as much as in 2000, and the donut puts that total where the eye lands first. A donut reads as accurately as a pie, and the hole is the natural place for the number the shares add up to. In Plotly, set hole=0.55 and add the total with fig.add_annotation(x=0.5, y=0.5, showarrow=False).
Prompt: Get the data from Our World in Data's energy dataset (github.com/owid/energy-data), entity World, years 2000 and 2025, electricity by source in TWh. Make a plotly donut chart of 2025 with go.Pie and hole=0.55, the three smallest sources grouped into Other, labels outside, and the 2025 total in TWh as an annotation in the hole. Put the growth since 2000 in the title.
4. One story in color, the rest in gray
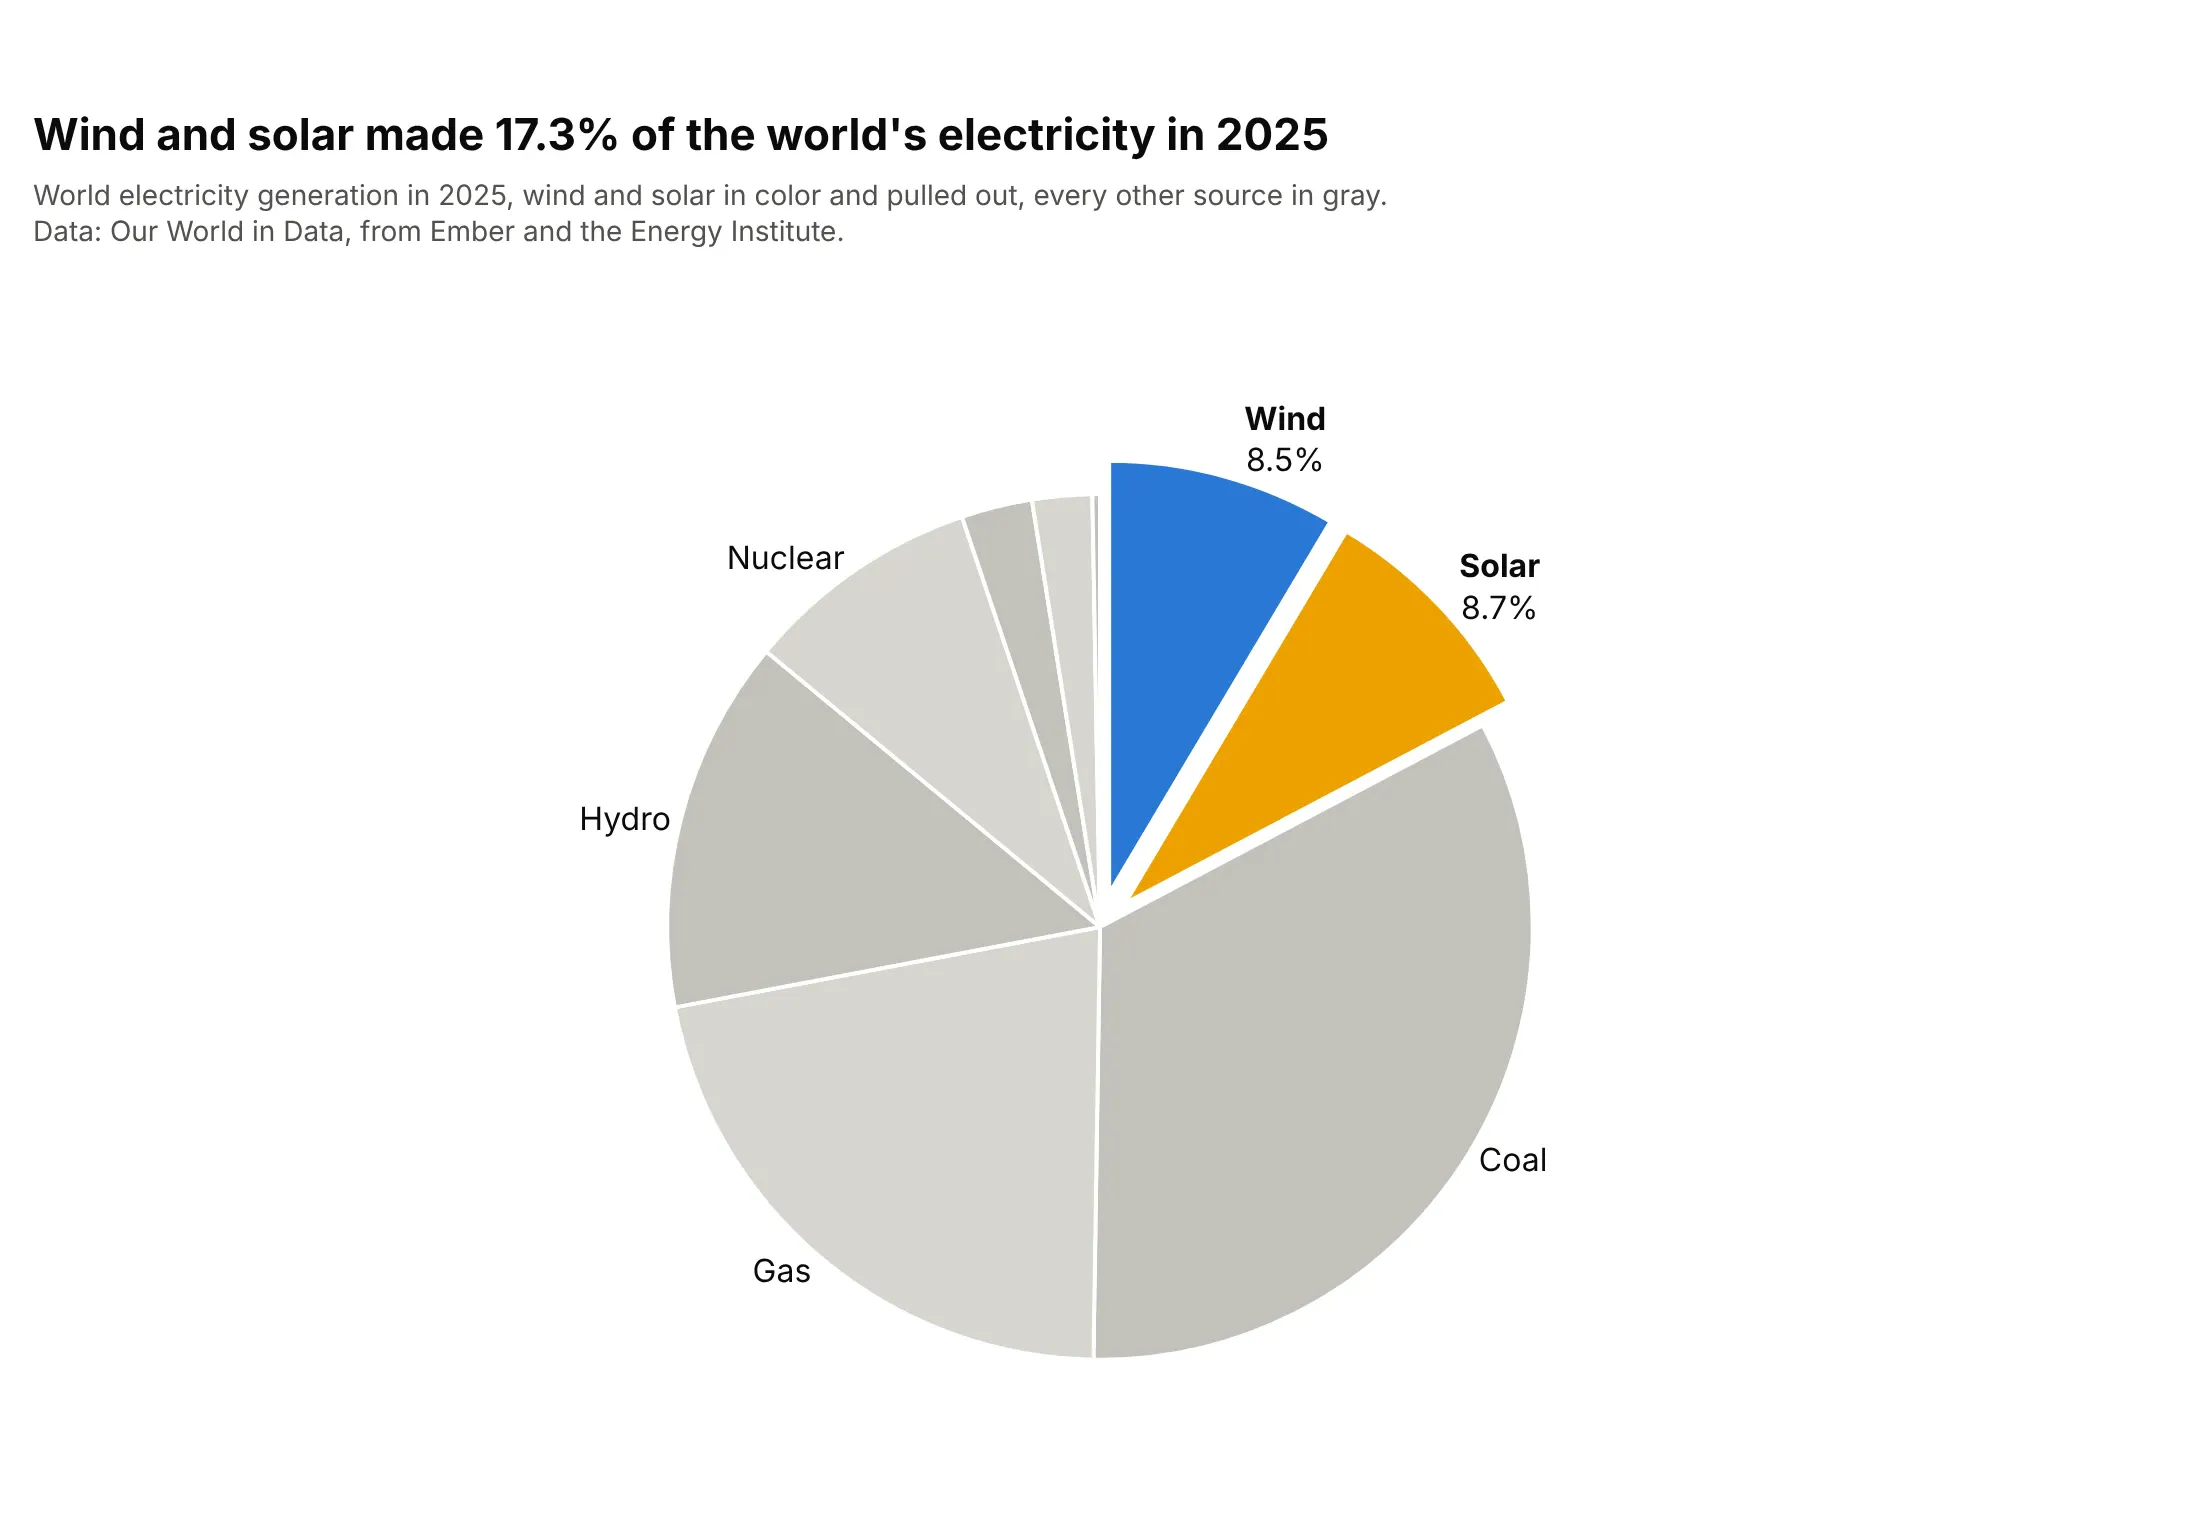
Wind and solar made 17.3% of the world's electricity in 2025, and coloring only those two slices, pulled out a little, makes that the whole point of the chart. Use it when the reader needs one answer, and say it in the title. Put the highlighted slices first with sort=False, set pull=[0.08, 0.08, 0, ...] and give every other slice a gray from marker.colors.
Prompt: Get the data from Our World in Data's energy dataset (github.com/owid/energy-data), entity World, year 2025, electricity by source in TWh. Make a plotly pie chart with go.Pie, sort=False with wind and solar first, pull=0.08 on those two slices only, wind in blue and solar in yellow, all other sources in alternating light grays, and labels only on the colored slices and the four largest gray ones.
5. Fewer, bigger slices
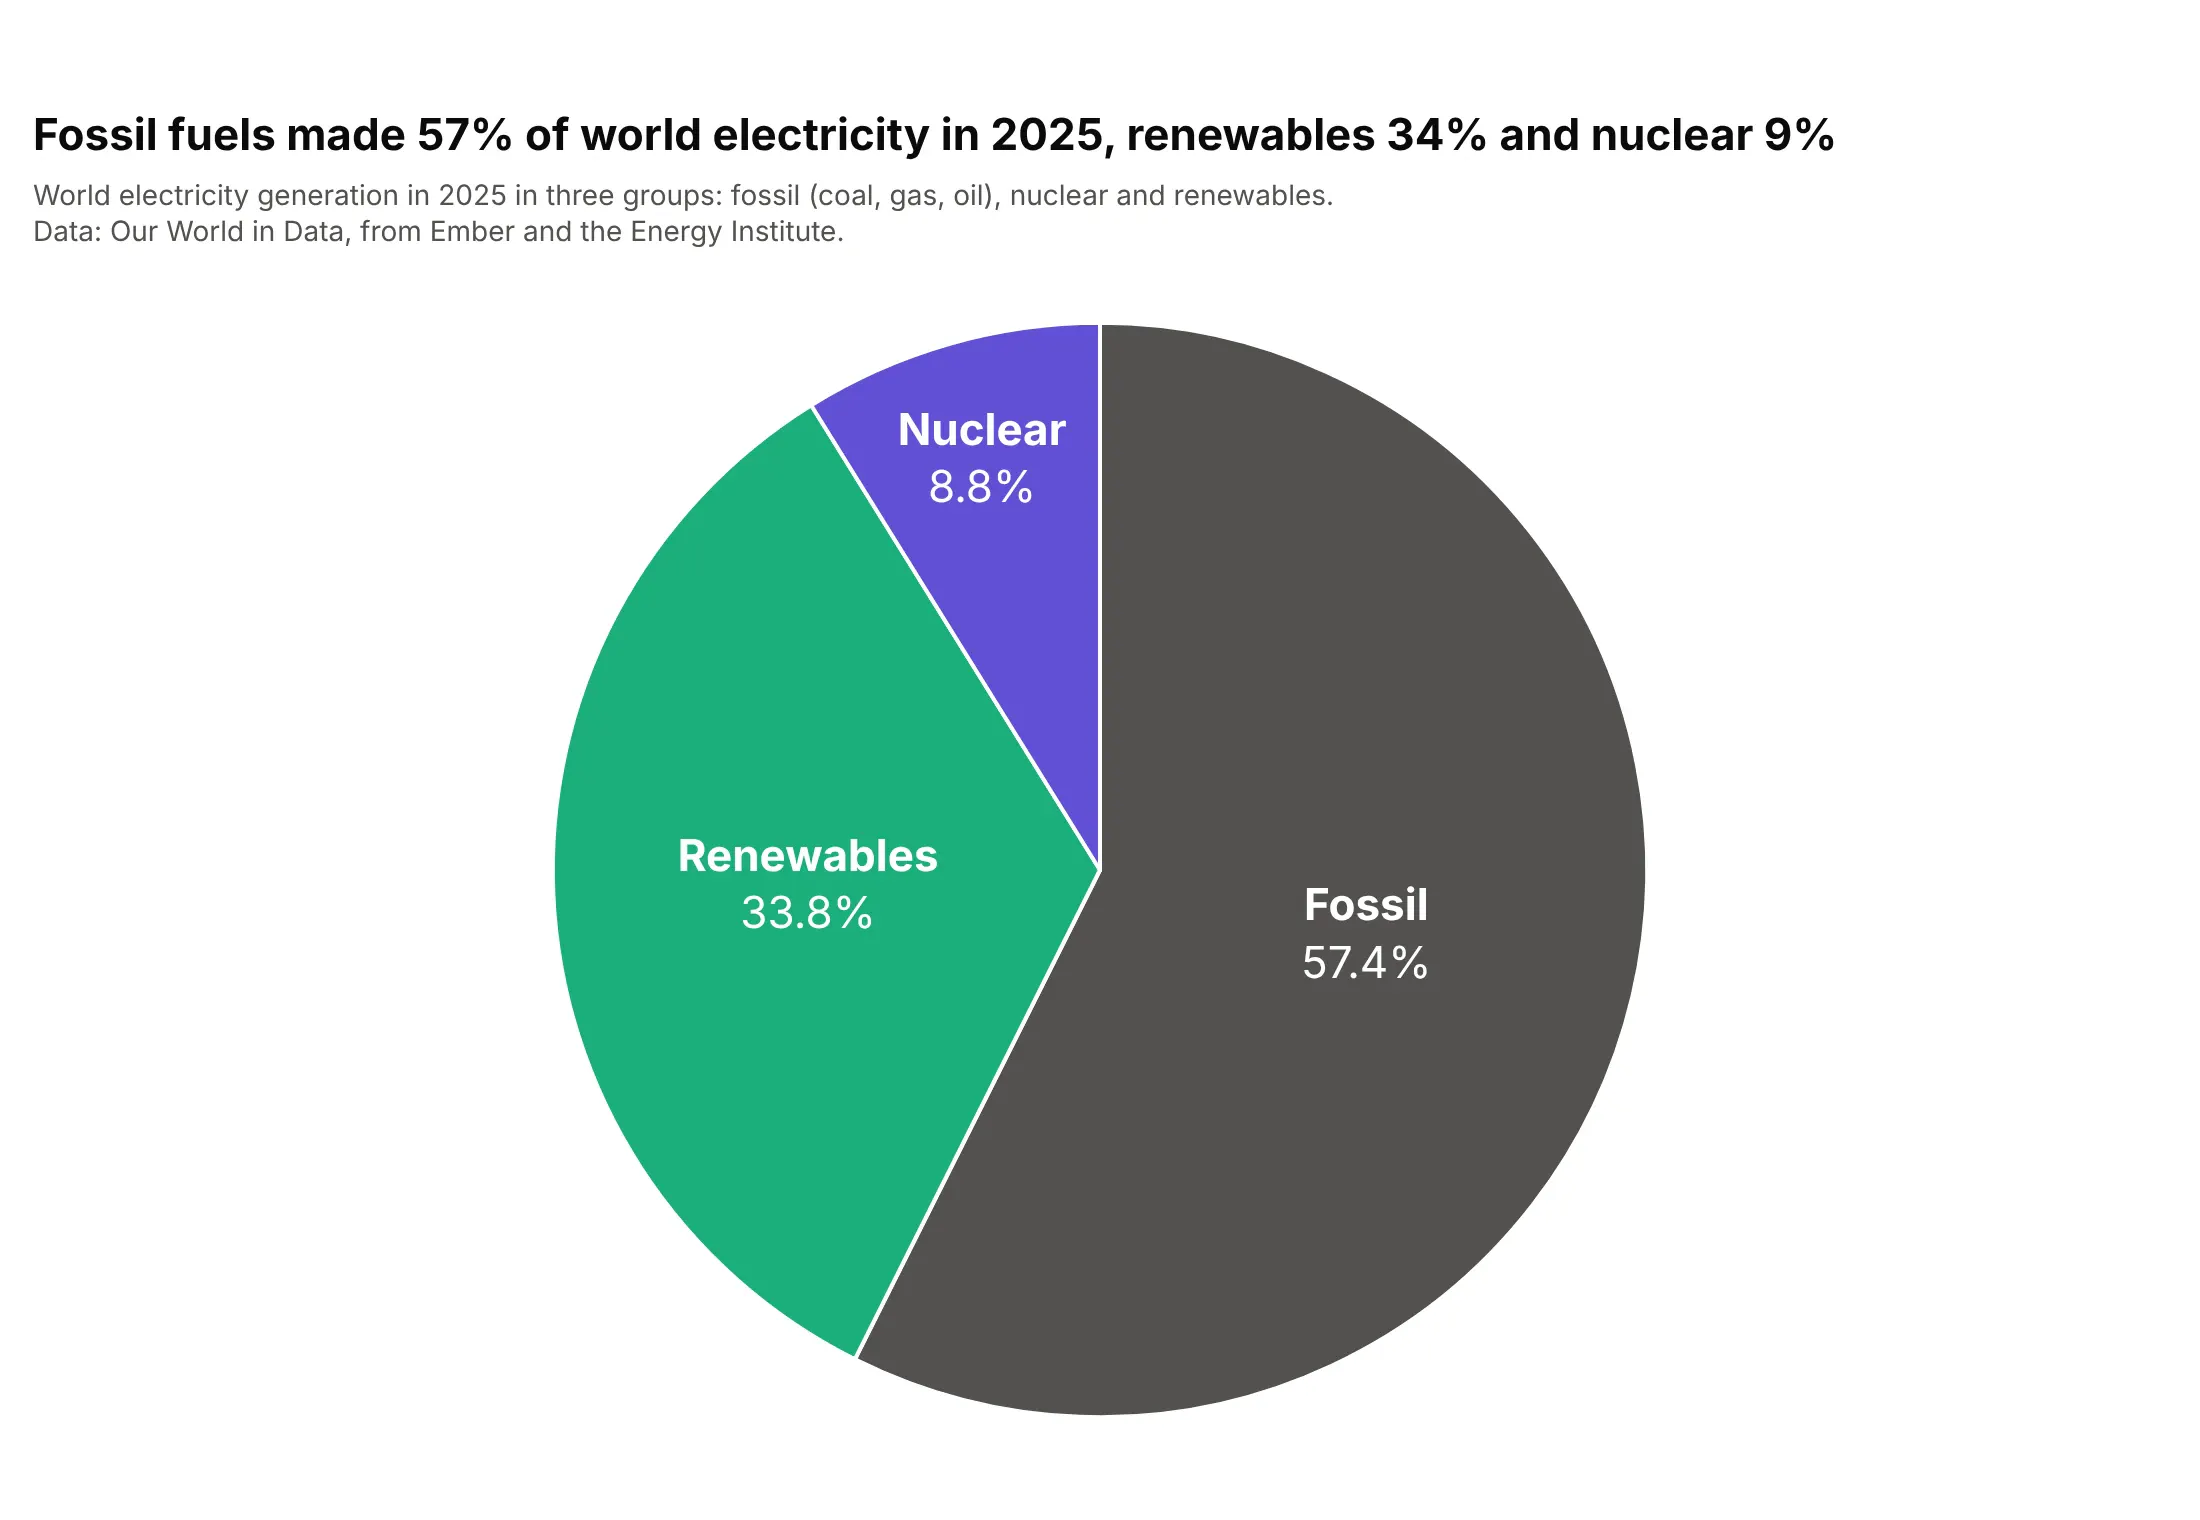
Added up into three groups, fossil fuels made 57% of world electricity in 2025, renewables 34% and nuclear 9%. Three slices are the easiest pie to read, and the labels fit inside at a large size. The cost is detail, since coal and gas disappear into "Fossil"; the next way gets it back.
Prompt: Get the data from Our World in Data's energy dataset (github.com/owid/energy-data), entity World, year 2025, and sum the sources into three groups: Fossil (coal, gas, oil), Nuclear and Renewables (hydro, wind, solar, bioenergy, other). Make a plotly pie chart with go.Pie, three fixed group colors, textposition="inside", insidetextorientation="horizontal", 22 px white labels with the group and its share.
6. Pie chart with subcategories (sunburst)
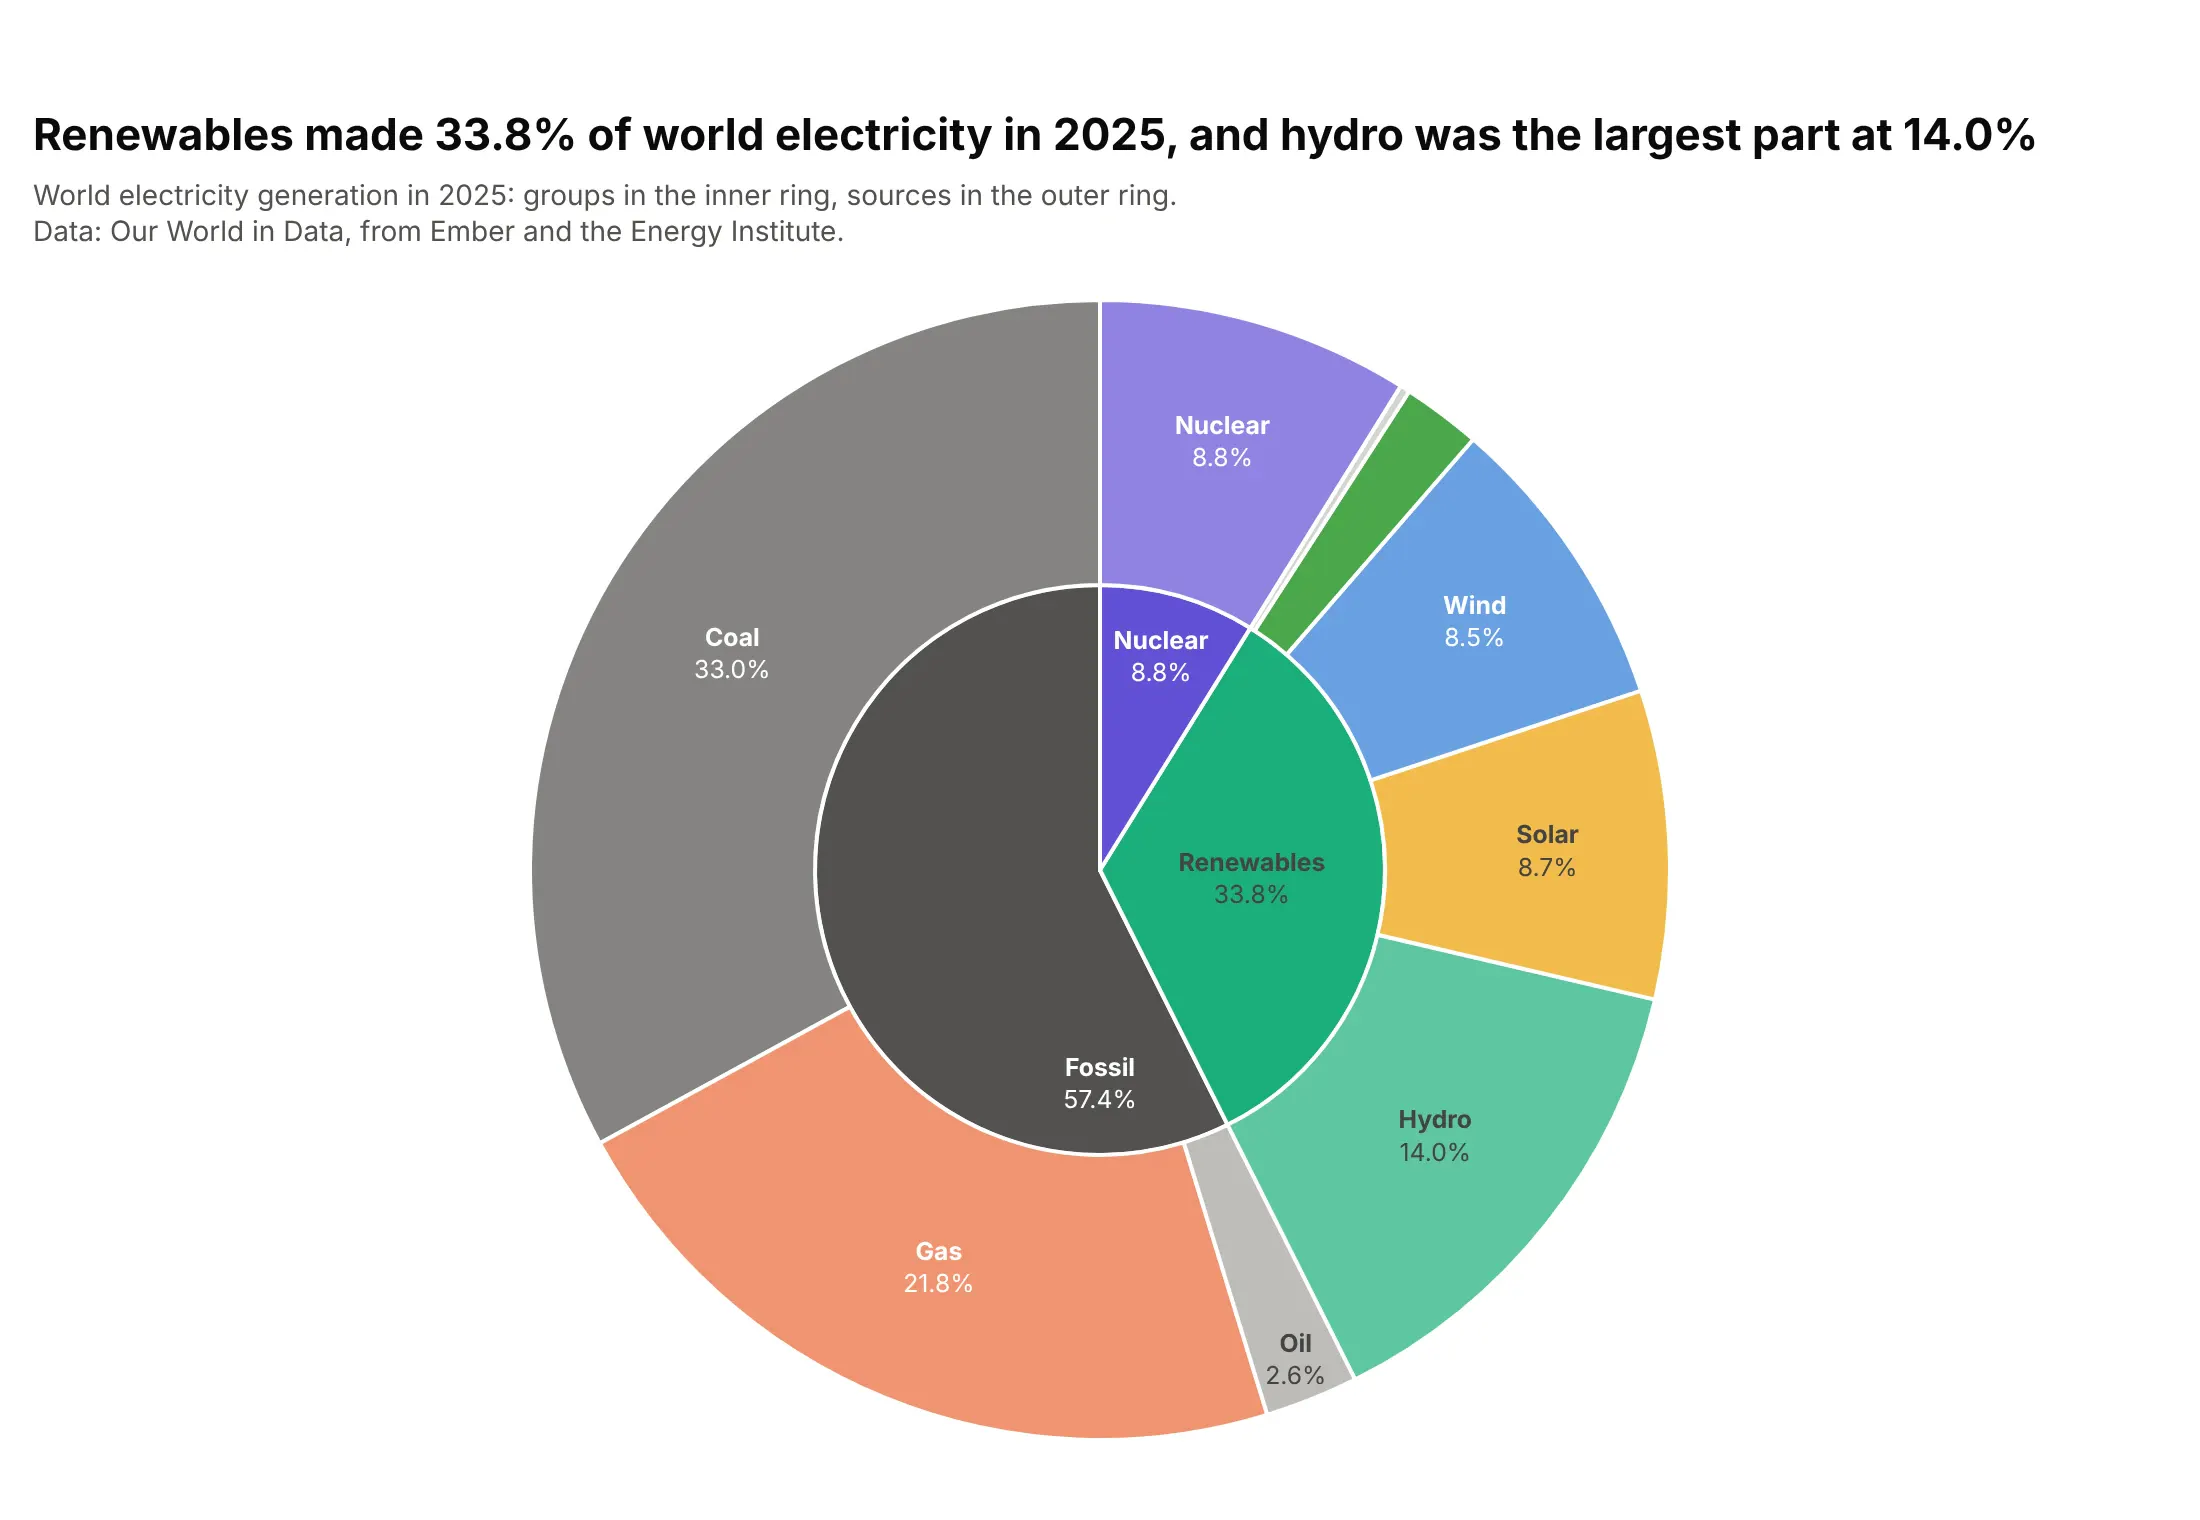
Renewables made 33.8% of world electricity in 2025, and the outer ring shows that hydro was still the largest part at 14.0%. A sunburst is what people mean by a double donut chart or a pie chart with subcategories: each outer slice sits exactly inside its group. Use go.Sunburst with parents and branchvalues="total", and give the sources ids like "Renewables/Hydro" when a group and a source share a name, as Nuclear does here. The sunburst guide covers more.
Prompt: Get the data from Our World in Data's energy dataset (github.com/owid/energy-data), entity World, year 2025, nine sources with their group (Fossil, Nuclear, Renewables). Make a plotly sunburst with go.Sunburst: groups in the inner ring, sources in the outer ring with ids "group/source", branchvalues="total", the guide's source colors, labels with %{percentRoot:.1%}, and uniformtext minsize 11 so slivers stay unlabeled.
7. Half donut chart
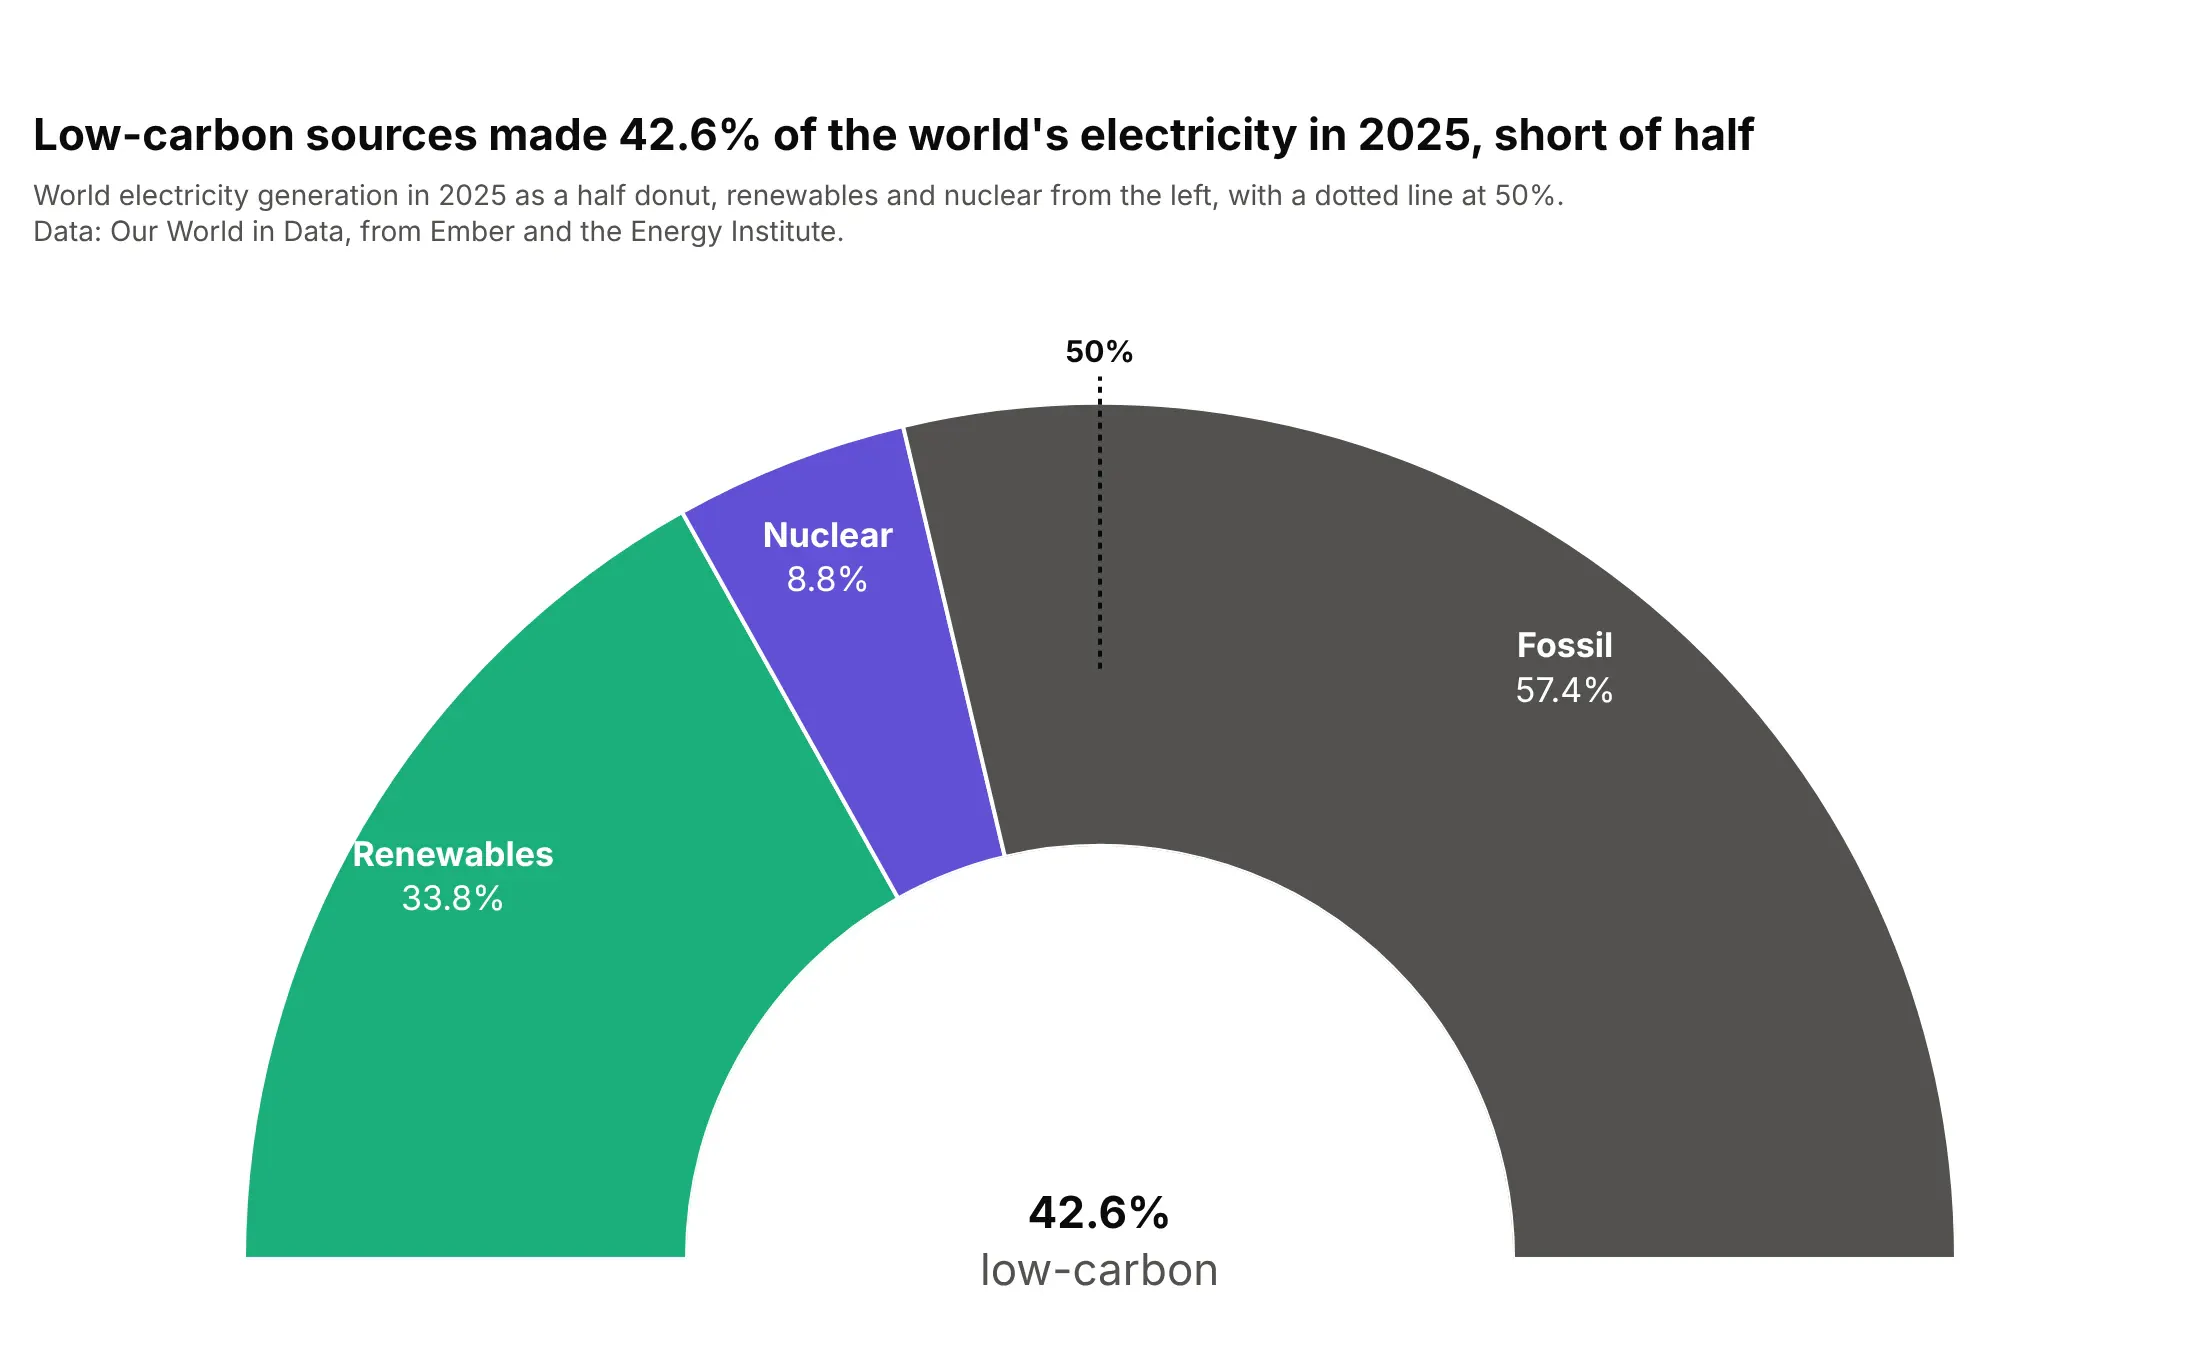
Low-carbon sources made 42.6% of the world's electricity in 2025, and the half donut with a line at the top shows how far that is from half. The shape suits one question with a threshold, like a parliament majority or a target. In Plotly it's a go.Barpolar trace on a polar subplot with polar.sector=[0, 180] and polar.hole, one bar per group with an angular width of its share of 180 degrees.
Prompt: Get the data from Our World in Data's energy dataset (github.com/owid/energy-data), entity World, year 2025, summed into Renewables, Nuclear and Fossil. Make a plotly half donut: go.Barpolar with r=1 per group, width = share x 180 degrees, polar.sector=[0, 180], polar.hole=0.45, angularaxis rotation=180 and direction clockwise, labels from a go.Scatterpolar text trace, a dotted line at 90 degrees for 50%, and the low-carbon total underneath.
8. Small multiples, one pie per region
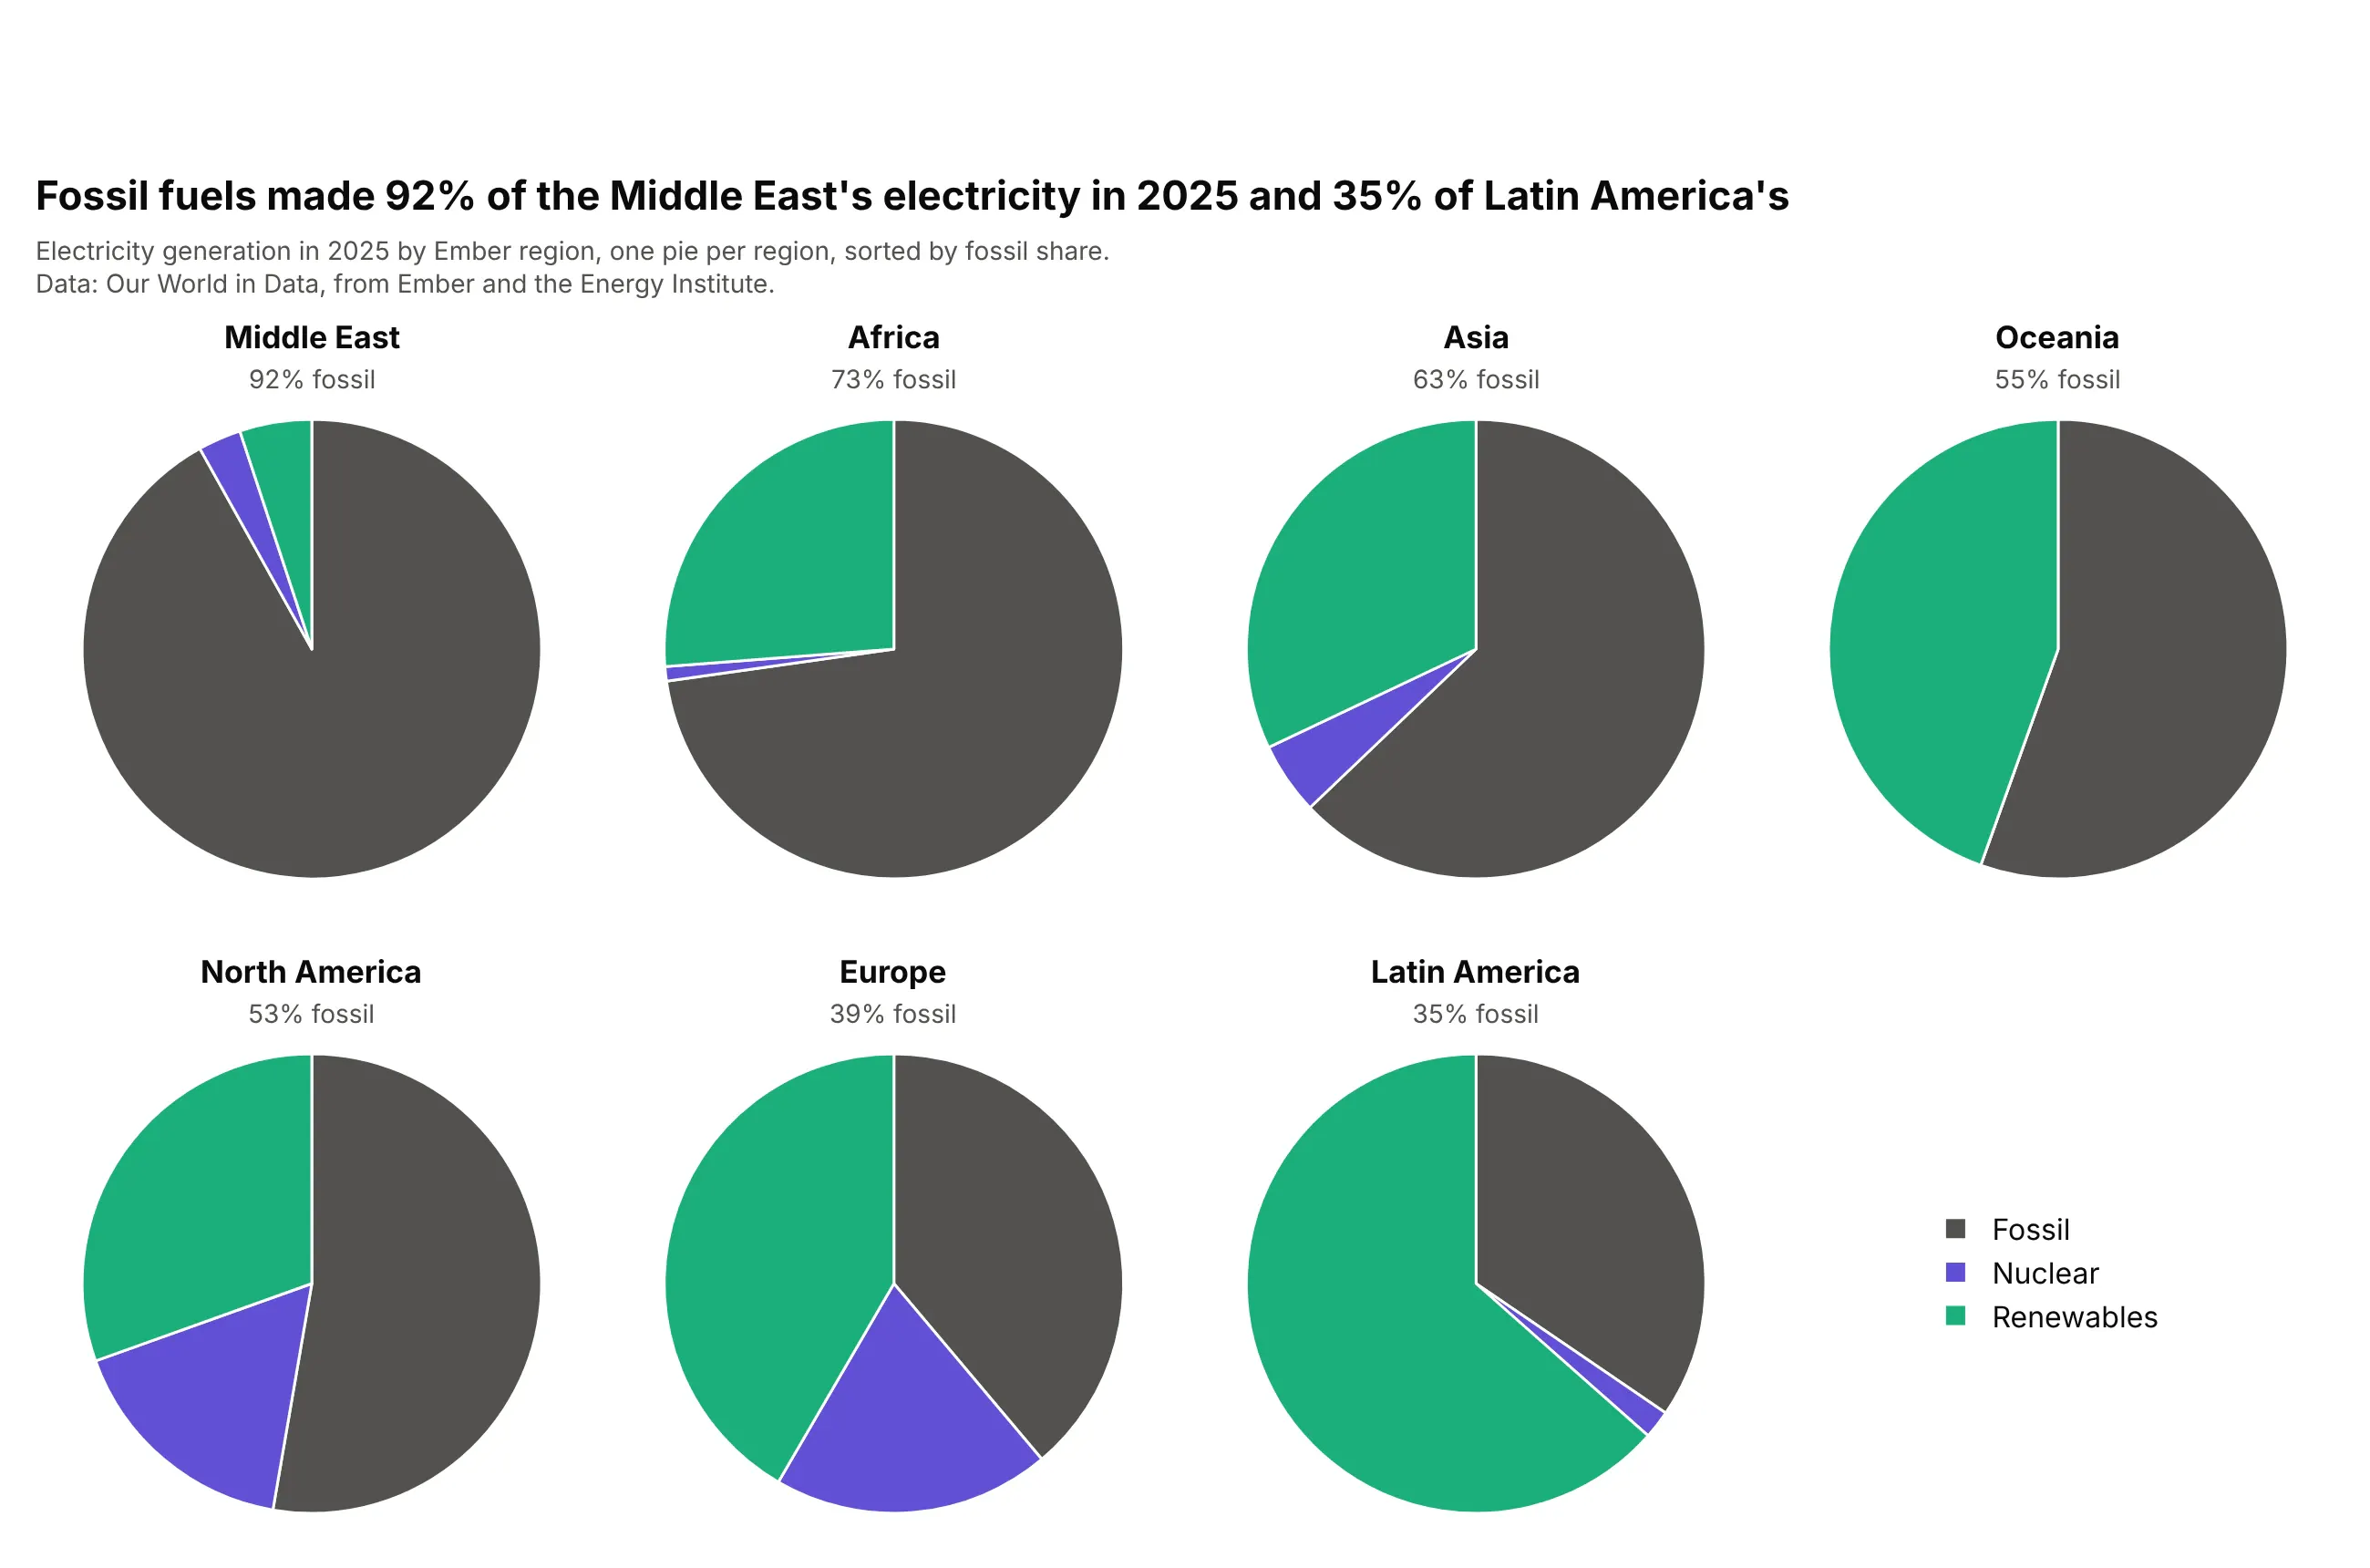
Fossil fuels made 92% of the Middle East's electricity in 2025 and 35% of Latin America's. With the same three colors and slice order in every pie, each region's mix becomes a shape you can recognize, and sorting the pies by fossil share gives the grid an order. Build the grid with make_subplots(rows=2, cols=4, specs=[[{"type": "domain"}] * 4] * 2) and one go.Pie per cell. To compare the regions precisely, a 100% stacked bar works better.
Prompt: Get the data from Our World in Data's energy dataset (github.com/owid/energy-data), year 2025, Ember's seven regions ("Africa (Ember)" and so on), summed into Fossil, Nuclear and Renewables. Make a plotly figure of seven pies with make_subplots (2 x 4, domain cells), sorted by fossil share, the same colors and slice order in each, the region and its fossil share as each subplot title, and one shared legend.
9. Pies sized by their totals
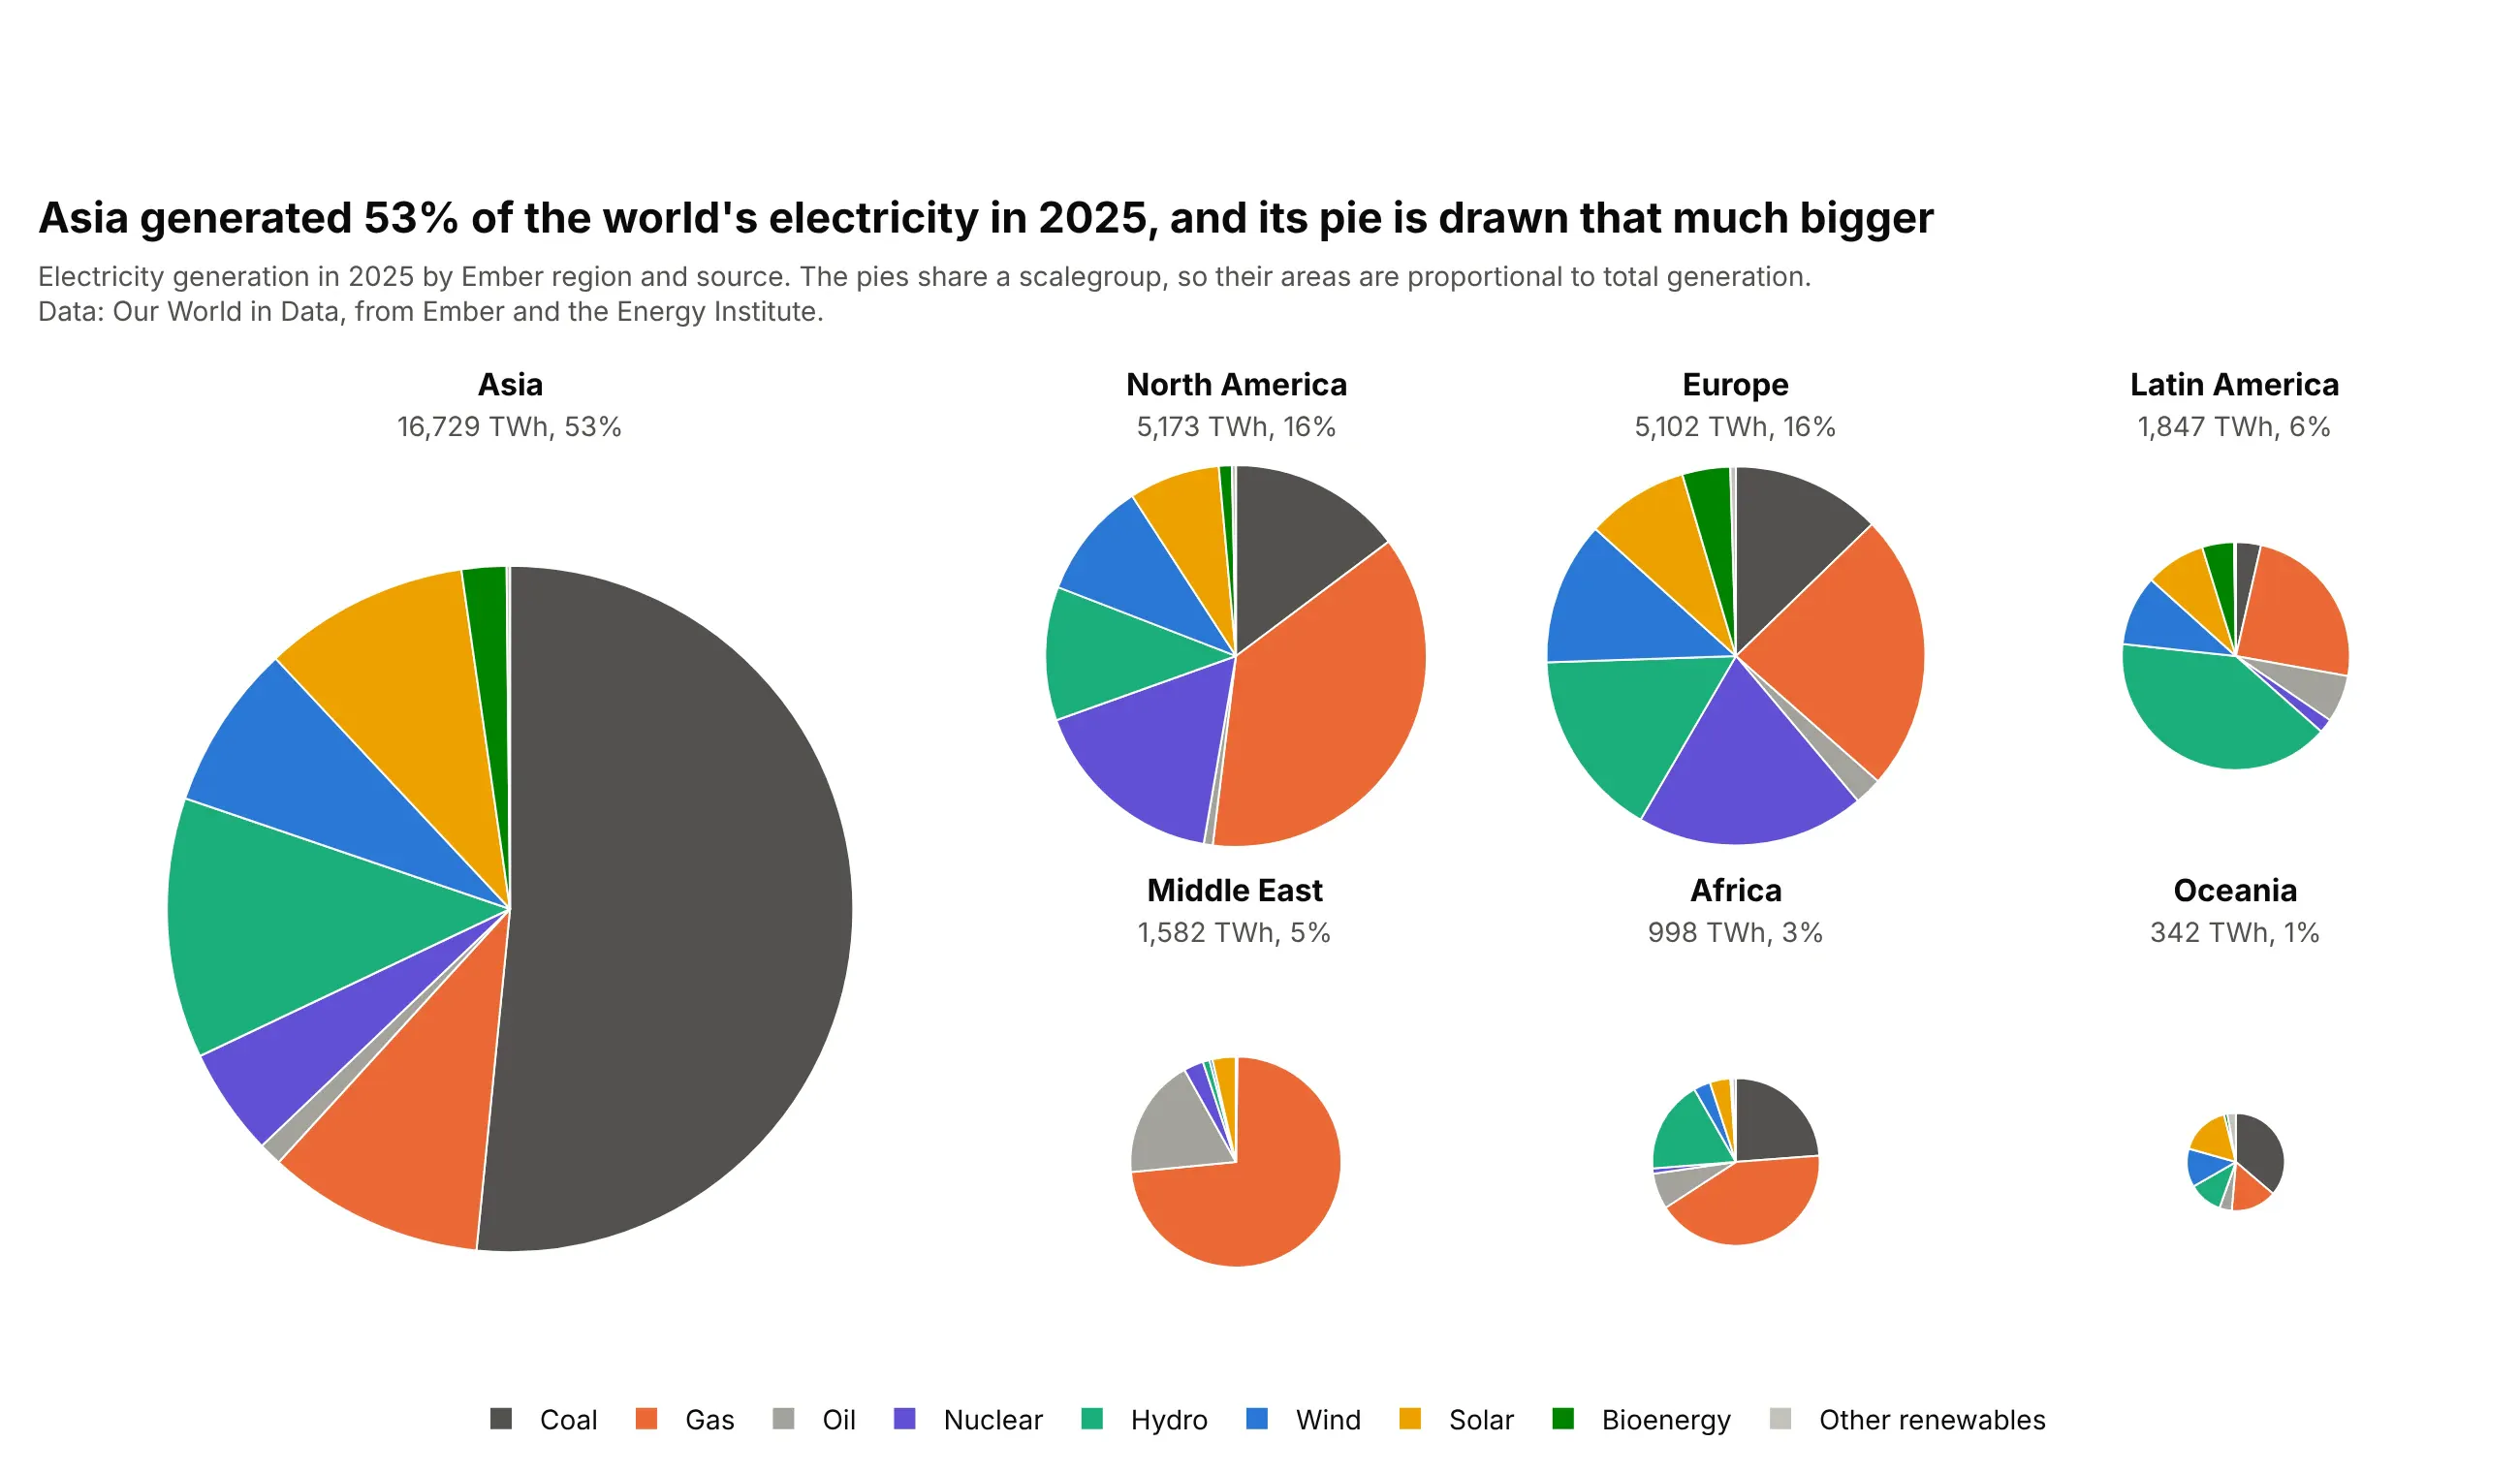
Asia generated 53% of the world's electricity in 2025, and with a shared scalegroup its pie is drawn with that much more area than the others. Same-size pies hide the fact that the wholes differ, and Oceania's 342 TWh would otherwise look as big as Asia's 16,729. Set the same scalegroup string on every go.Pie trace, and give the largest pie the most room in the grid.
Prompt: Get the data from Our World in Data's energy dataset (github.com/owid/energy-data), year 2025, Ember's seven regions, electricity by nine sources in TWh. Make a plotly figure of seven pies with make_subplots, Asia in a large cell spanning two rows, scalegroup="regions" on every go.Pie so areas follow total generation, no slice text, fixed source colors, and each region's TWh and world share in its subplot title.
10. Bubble pie chart
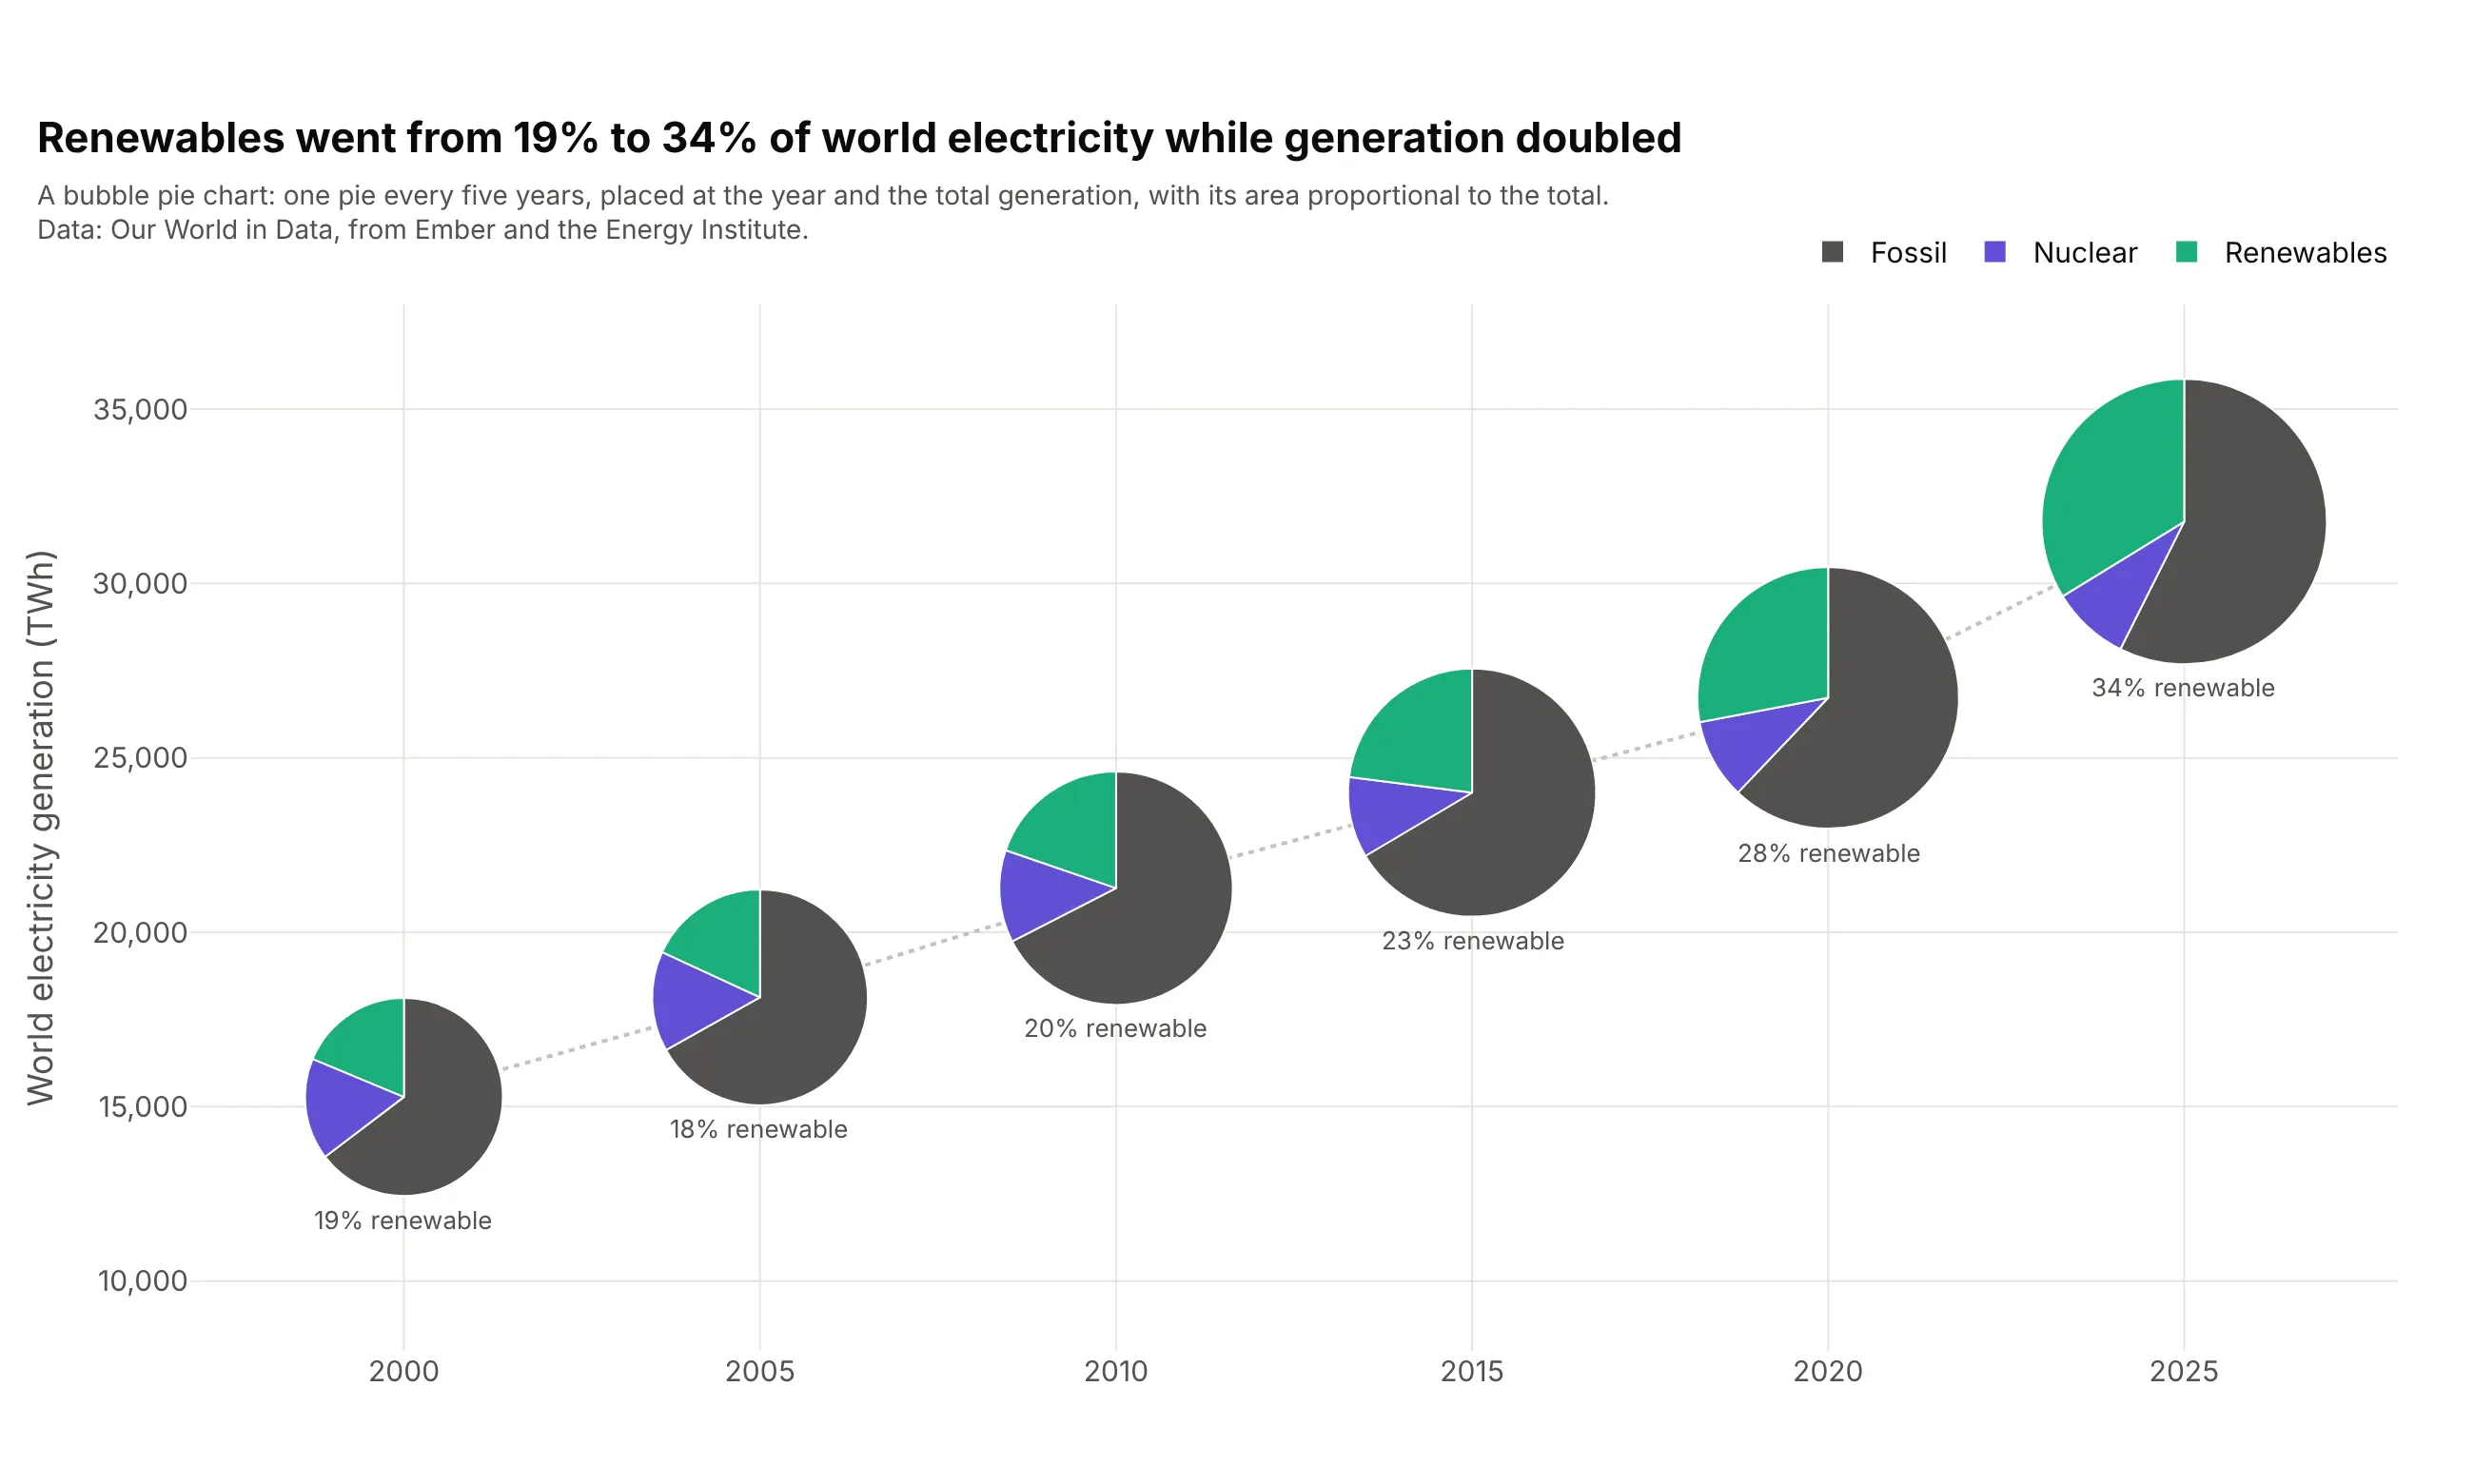
Renewables went from 19% to 34% of world electricity from 2000 to 2025 while generation doubled. A bubble pie chart places each pie like a bubble on a scatter plot, here at its year and its total, with its area proportional to the total, so position, size and mix share one picture. Plotly draws each pie with go.Pie and a domain computed from the point's data coordinates and fixed axis ranges.
Prompt: Get the data from Our World in Data's energy dataset (github.com/owid/energy-data), entity World, years 2000 to 2025 every five years, summed into Fossil, Nuclear and Renewables. Make a plotly bubble pie chart: fixed x (year) and y (TWh) ranges, one go.Pie per year with its domain computed from its data coordinates, diameter proportional to the square root of the total, a dotted line through the totals, and the renewable share under each pie.
11. Animated pie
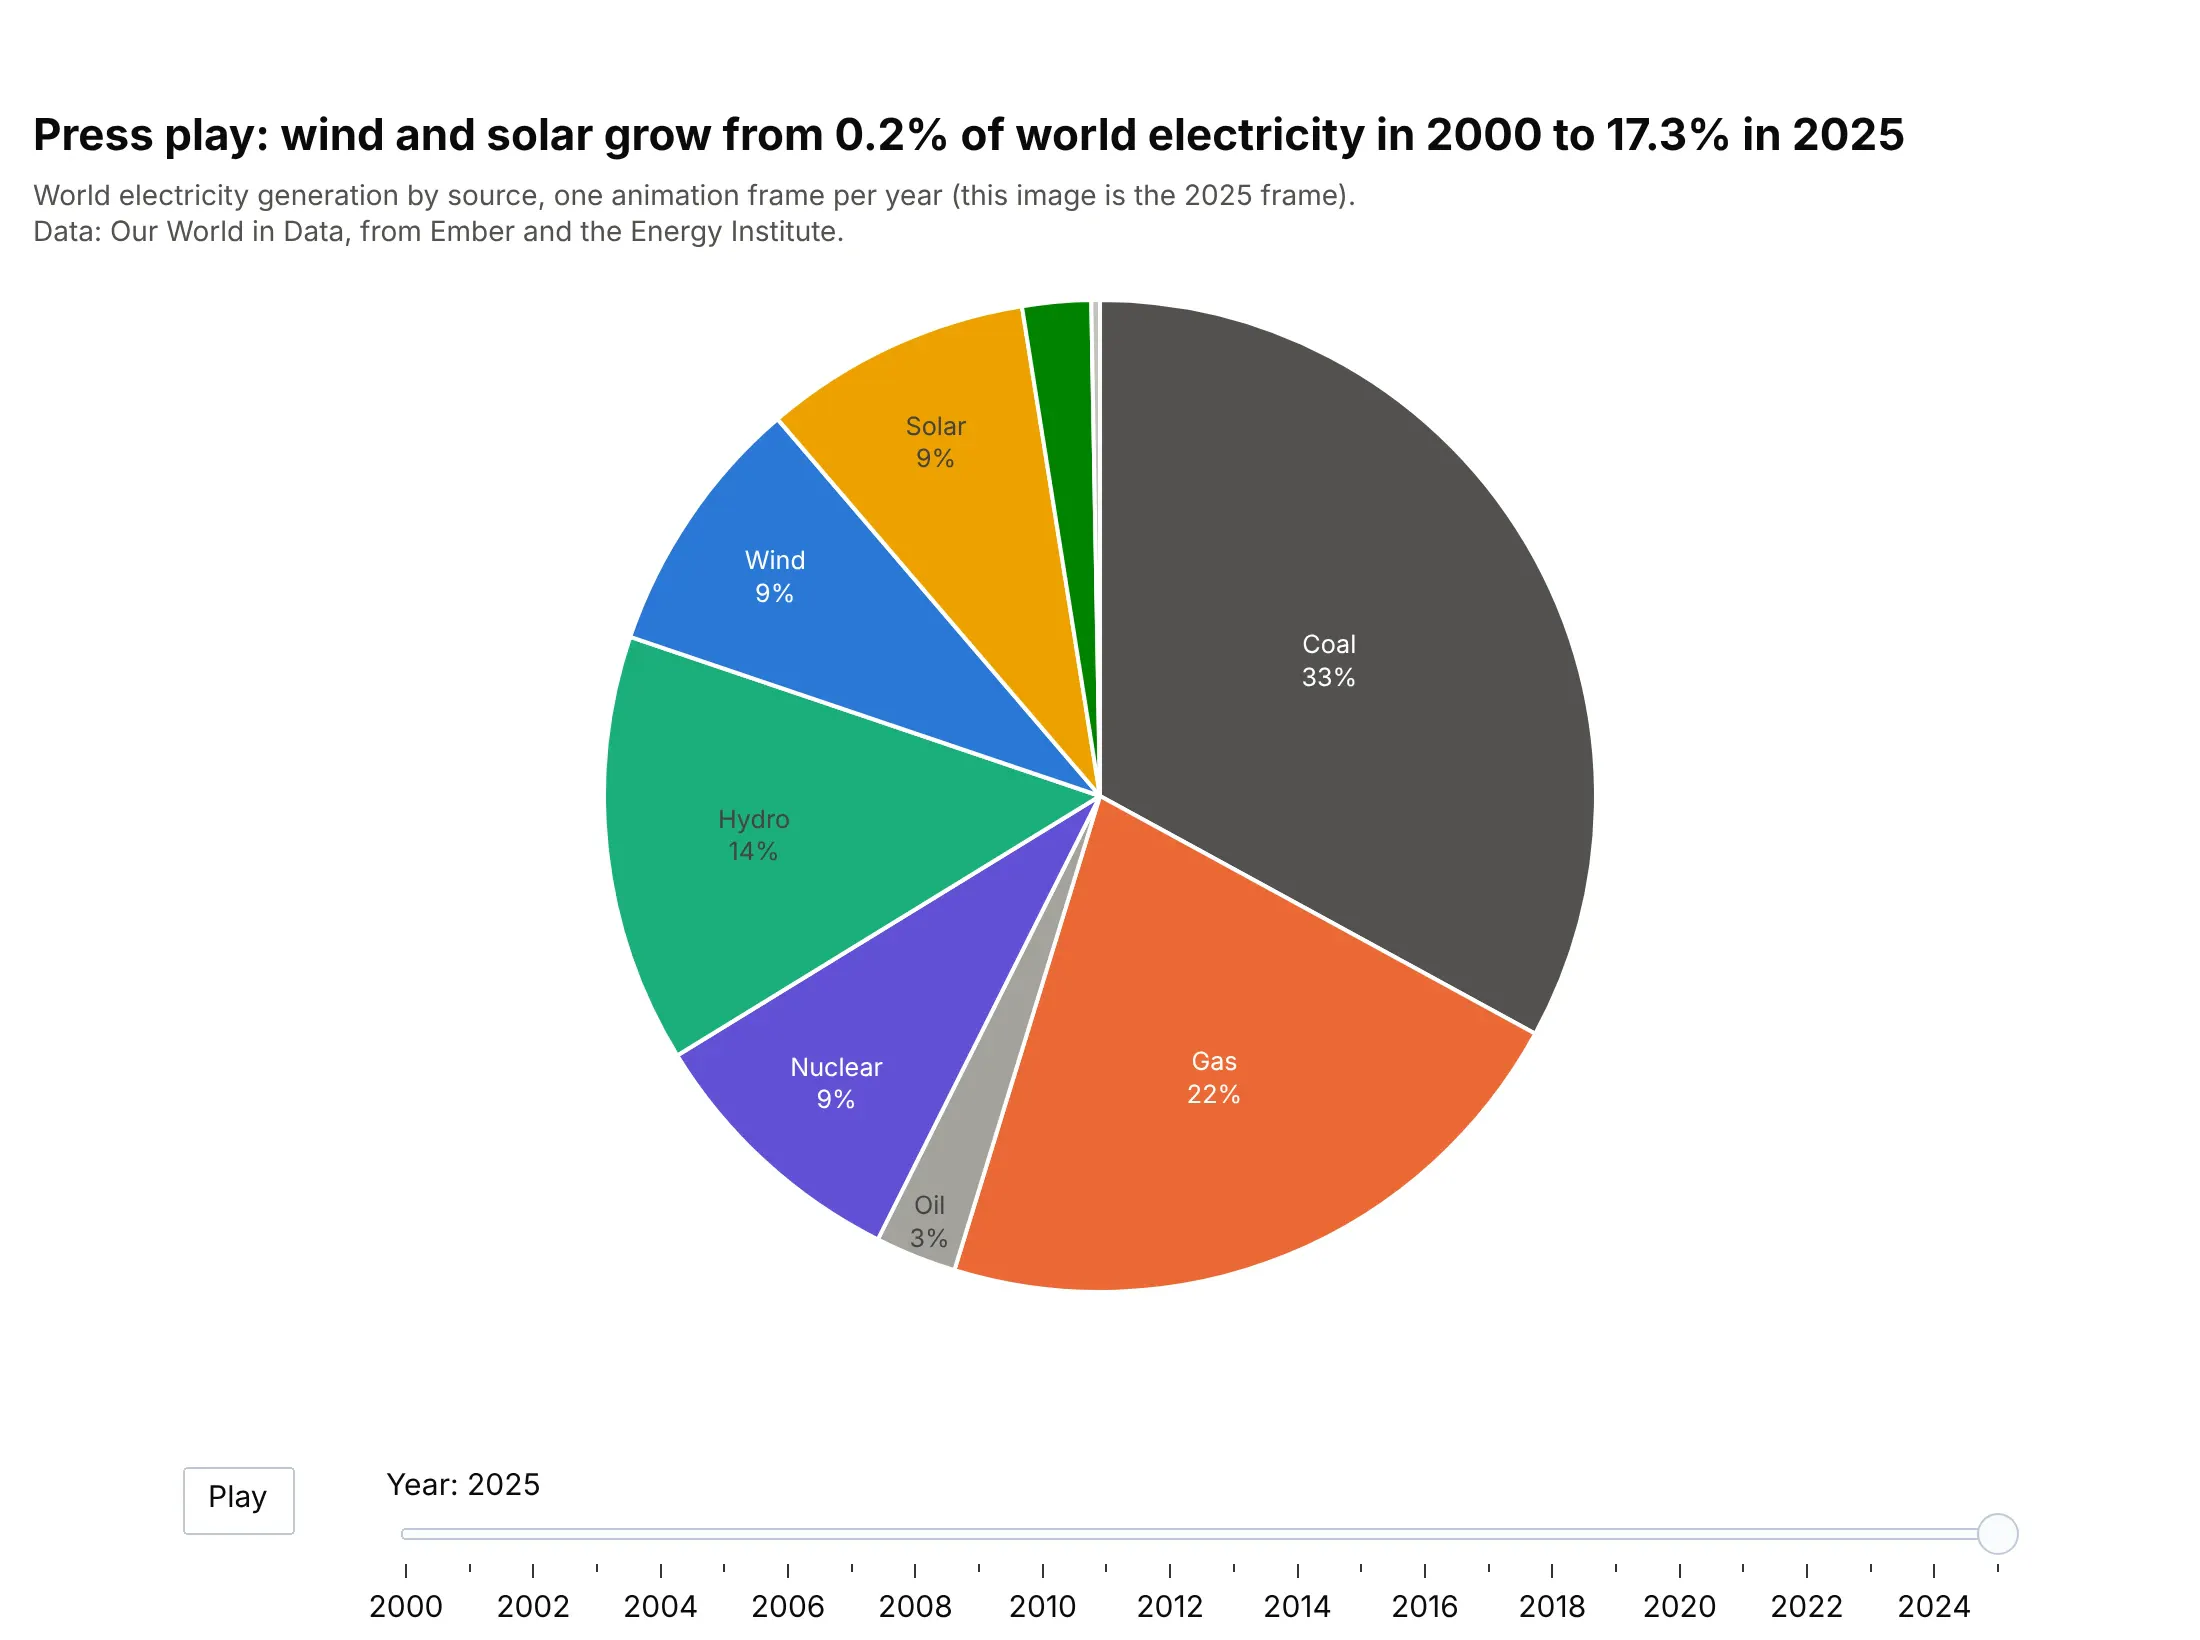
Press play and wind and solar grow from 0.2% of world electricity in 2000 to 17.3% in 2025, while the other slices shift around them. Animation suits a talk or a dashboard, where people watch it once; for reading, the bubble pie or a stacked area chart shows the same change at a glance. In Plotly, add one go.Frame per year and a slider whose steps call "animate", and keep sort=False so slices don't jump between frames.
Prompt: Get the data from Our World in Data's energy dataset (github.com/owid/energy-data), entity World, every year from 2000 to 2025, electricity by nine sources. Make an animated plotly pie chart with go.Figure(frames=...), one go.Frame per year, sort=False with a fixed source order and colors, a Play button in updatemenus, a year slider with method "animate", and the first frame set to 2025.
12. Waffle chart
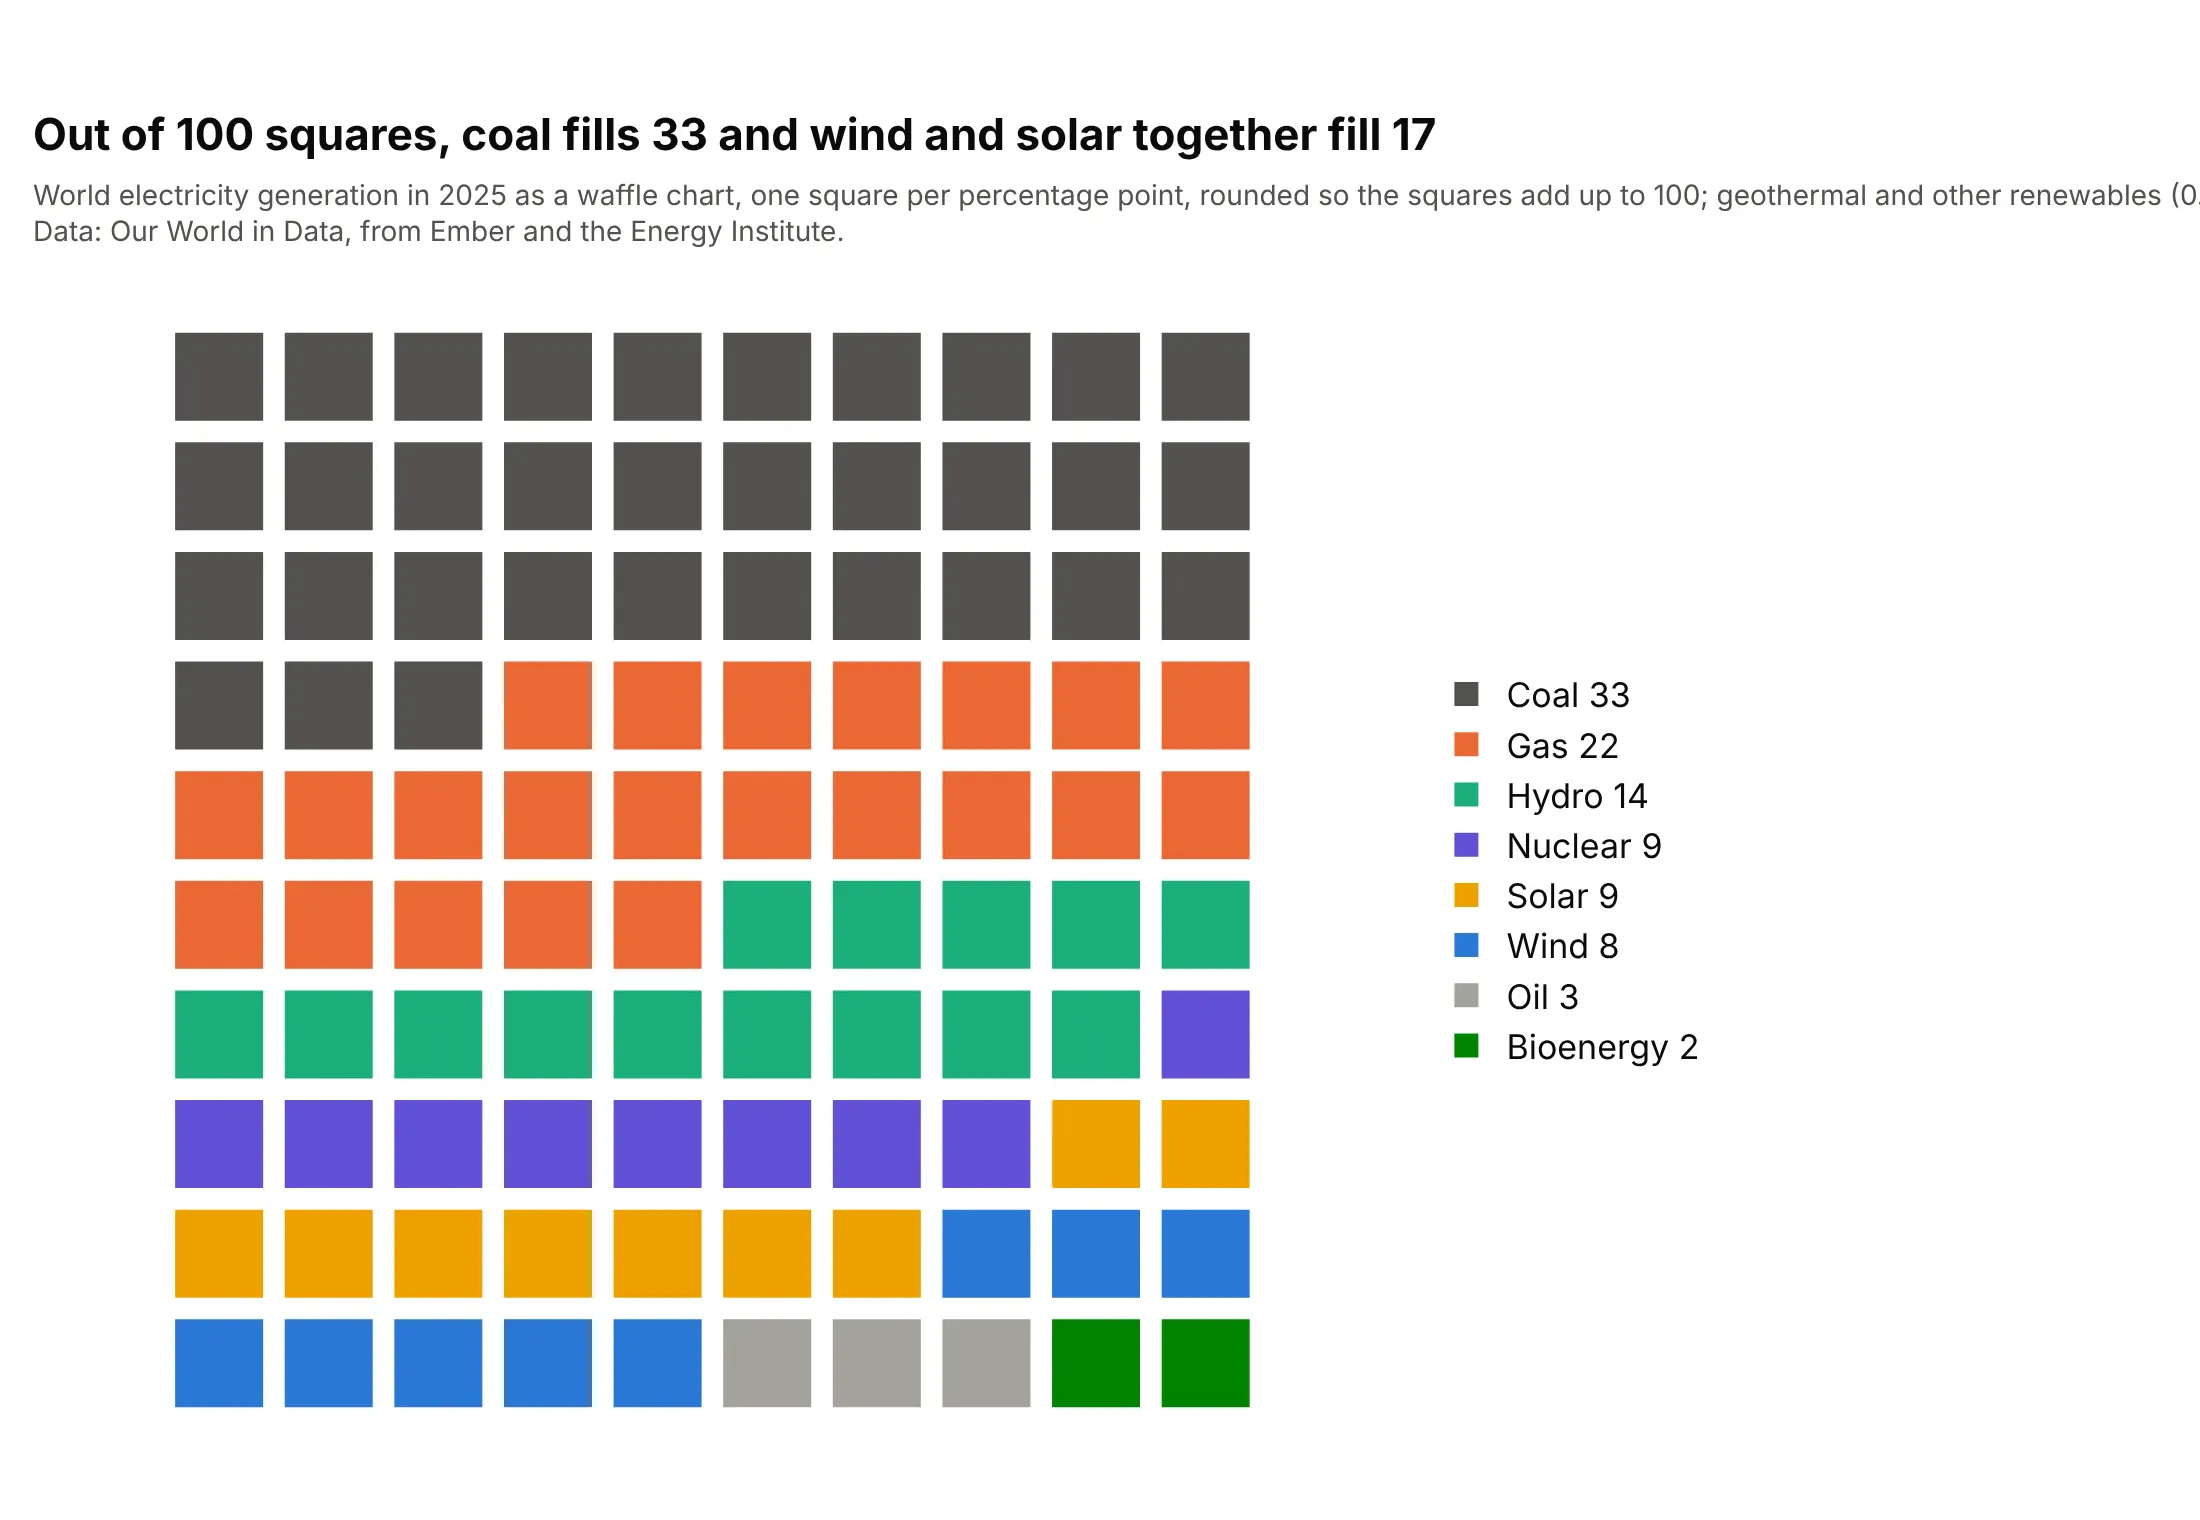
Out of 100 squares, coal fills 33 and wind and solar together fill 17. A waffle trades angles for squares you can count, which makes shares exact to a percentage point, though geothermal and the other small renewables, at 0.3%, round to no square. Plotly draws it as a go.Scatter of square markers on a 10 x 10 grid, one trace per source; the waffle chart guide has more.
Prompt: Get the data from Our World in Data's energy dataset (github.com/owid/energy-data), entity World, year 2025, electricity by source. Round the shares to 100 squares with the largest-remainder method. Make a plotly waffle chart: go.Scatter with marker symbol "square", one trace per source, x = index % 10 and y = 9 - index // 10, hidden axes with scaleanchor so squares stay square, and the square counts in the legend.
13. Pie next to a sorted bar chart
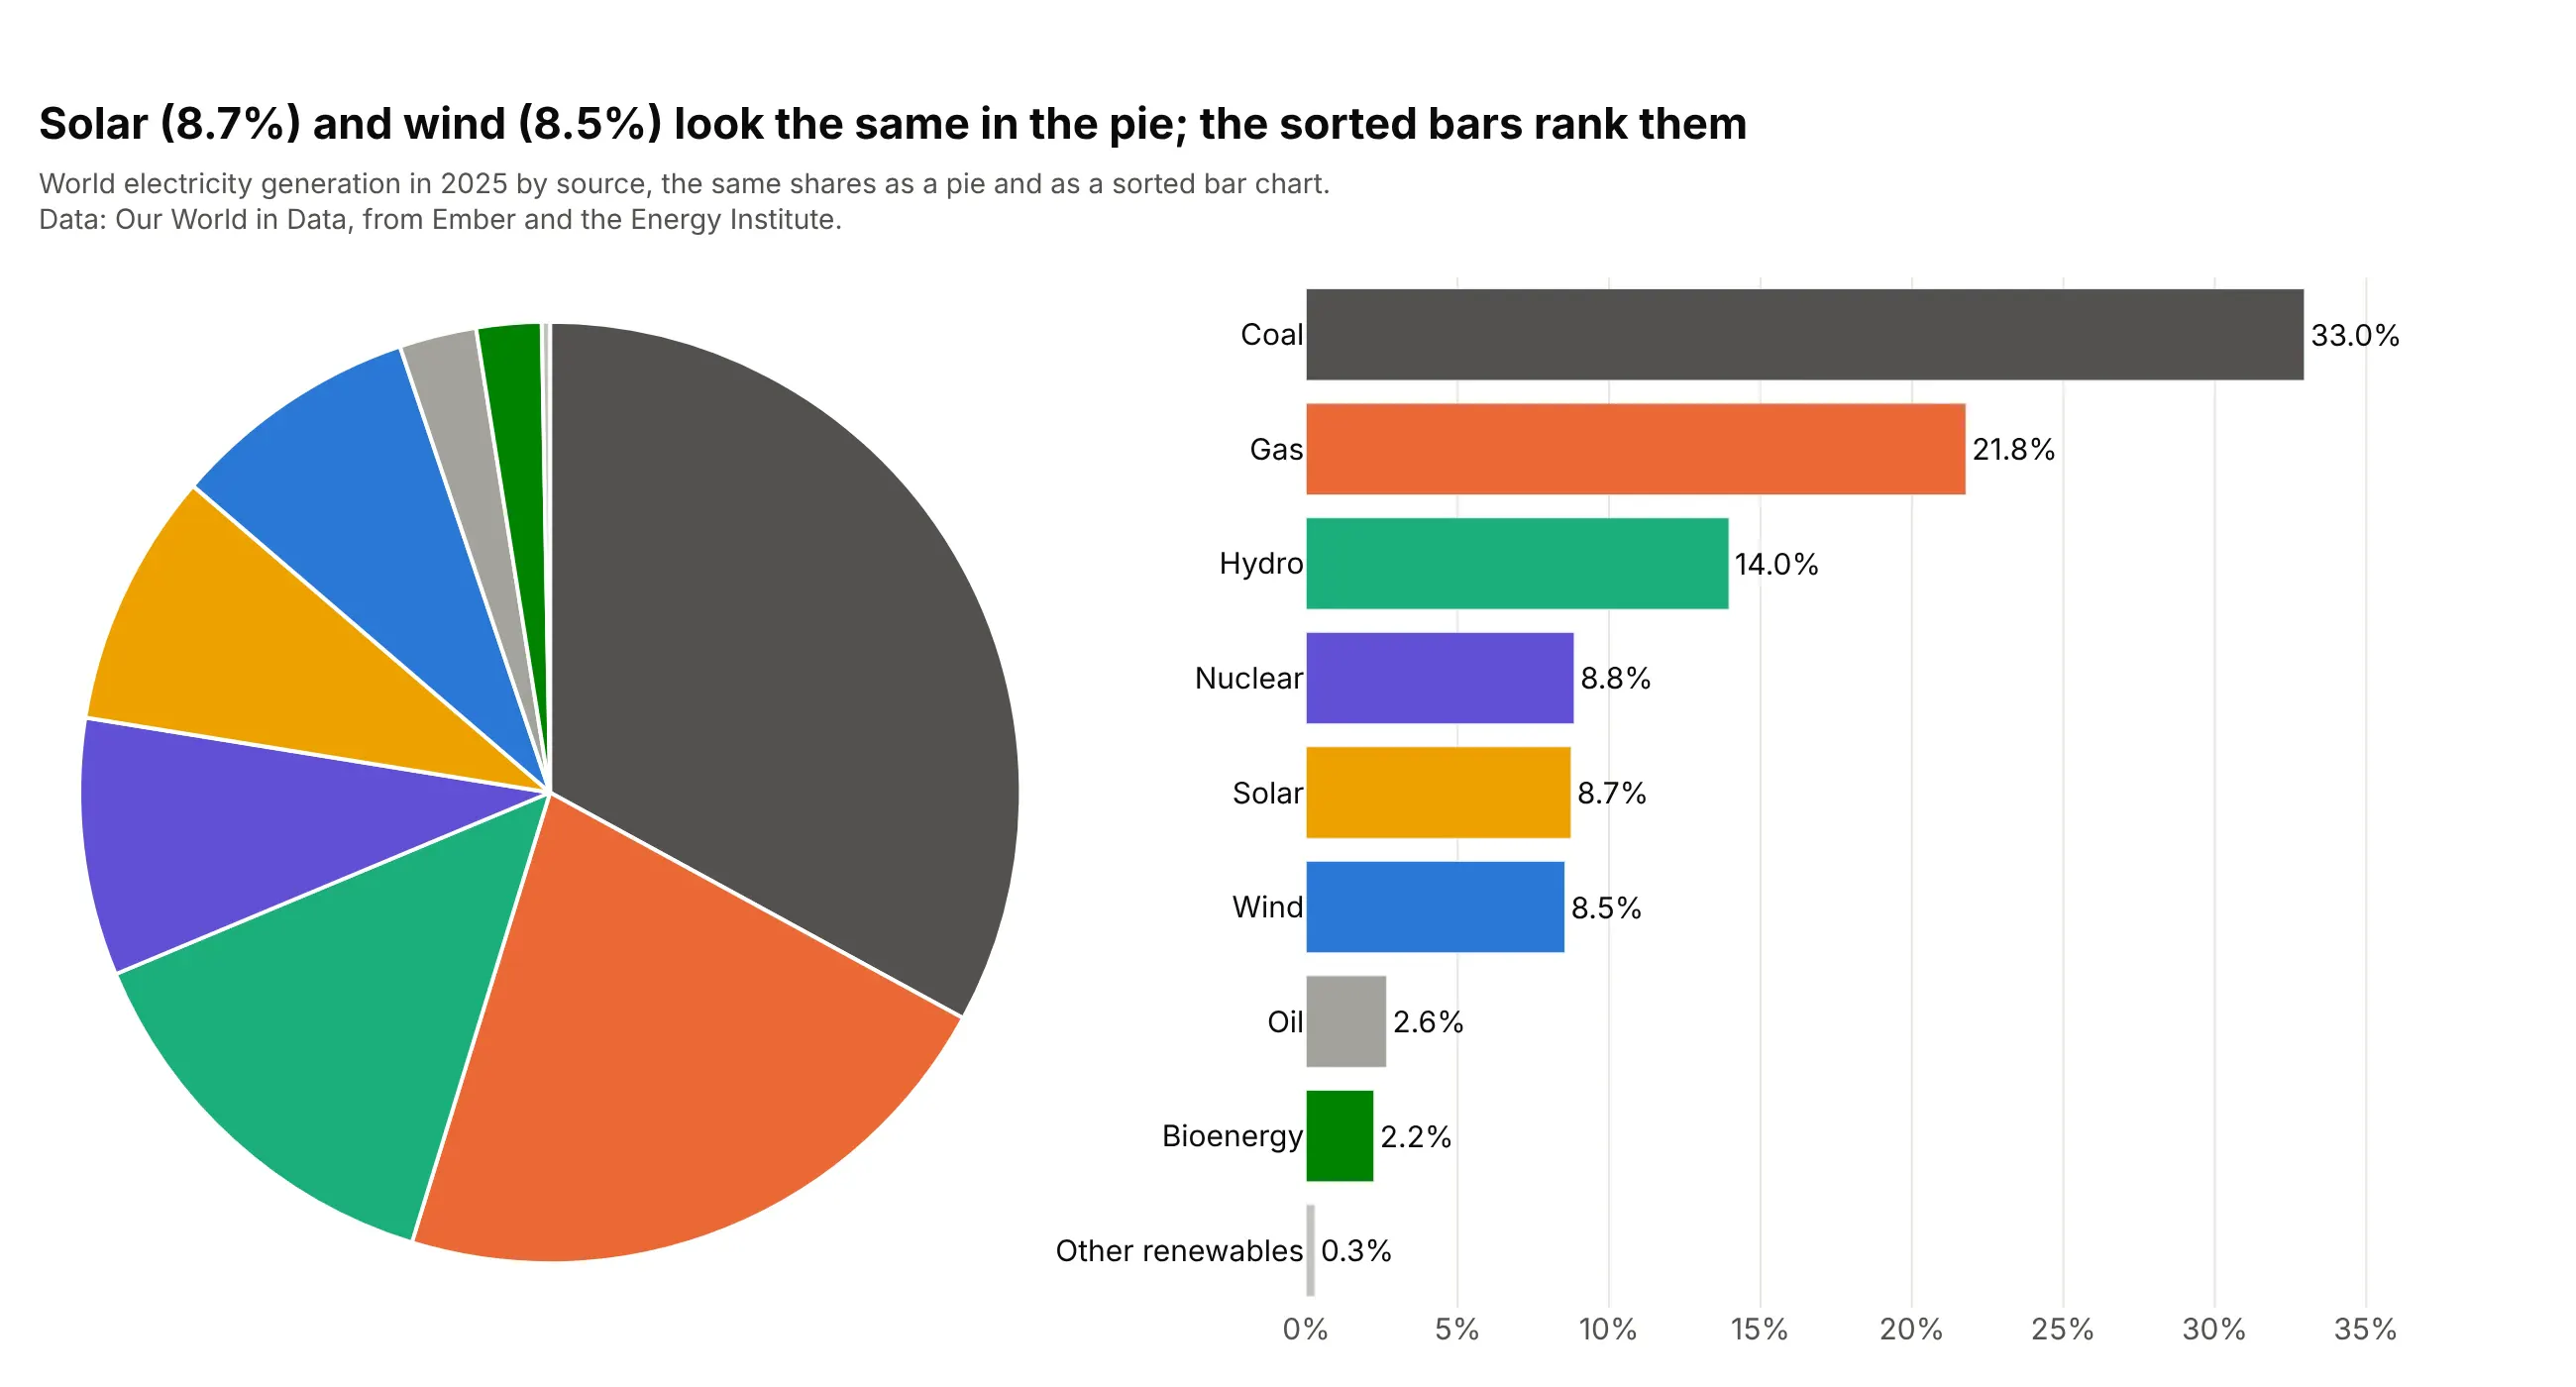
Solar (8.7%) and wind (8.5%) look the same in the pie, and so does nuclear (8.8%), but the sorted bars put them in order on one axis. Drawing both is a good way to decide: the pie shows the part-to-whole at a glance, and the bars give the ranking. Use make_subplots(specs=[[{"type": "domain"}, {"type": "xy"}]]) and the same colors in both.
Prompt: Get the data from Our World in Data's energy dataset (github.com/owid/energy-data), entity World, year 2025, electricity by nine sources. Make a plotly figure with make_subplots, a domain cell on the left and an xy cell on the right: a sorted go.Pie with no text, and a horizontal go.Bar of the shares sorted largest at the top with values outside, in the same source colors.