
Chris Parmer
October 27, 2026
Streamgraphs - A Complete Guide
TL;DR
- A streamgraph is a stacked area chart whose layers float around a center line instead of sitting on a zero baseline, so you can follow how each category rises and falls over time.
- Streamgraphs are also known as stream graphs and ThemeRivers, and are similar to stacked area charts and small multiples.
- Use one for many categories over time when the shapes and the turnover matter more than exact values: genres, topics, sources of electricity, waves of a disease.
- Use a stacked area chart when the total matters, a line chart or small multiples when exact values matter, and a 100% stacked area chart for shares.
- You can make a streamgraph with Plotly from go.Scatter traces in one stackgroup, with a computed baseline as an invisible first trace. The helper below does it in about 20 lines.
What is a streamgraph?
Streamgraphs look like this:
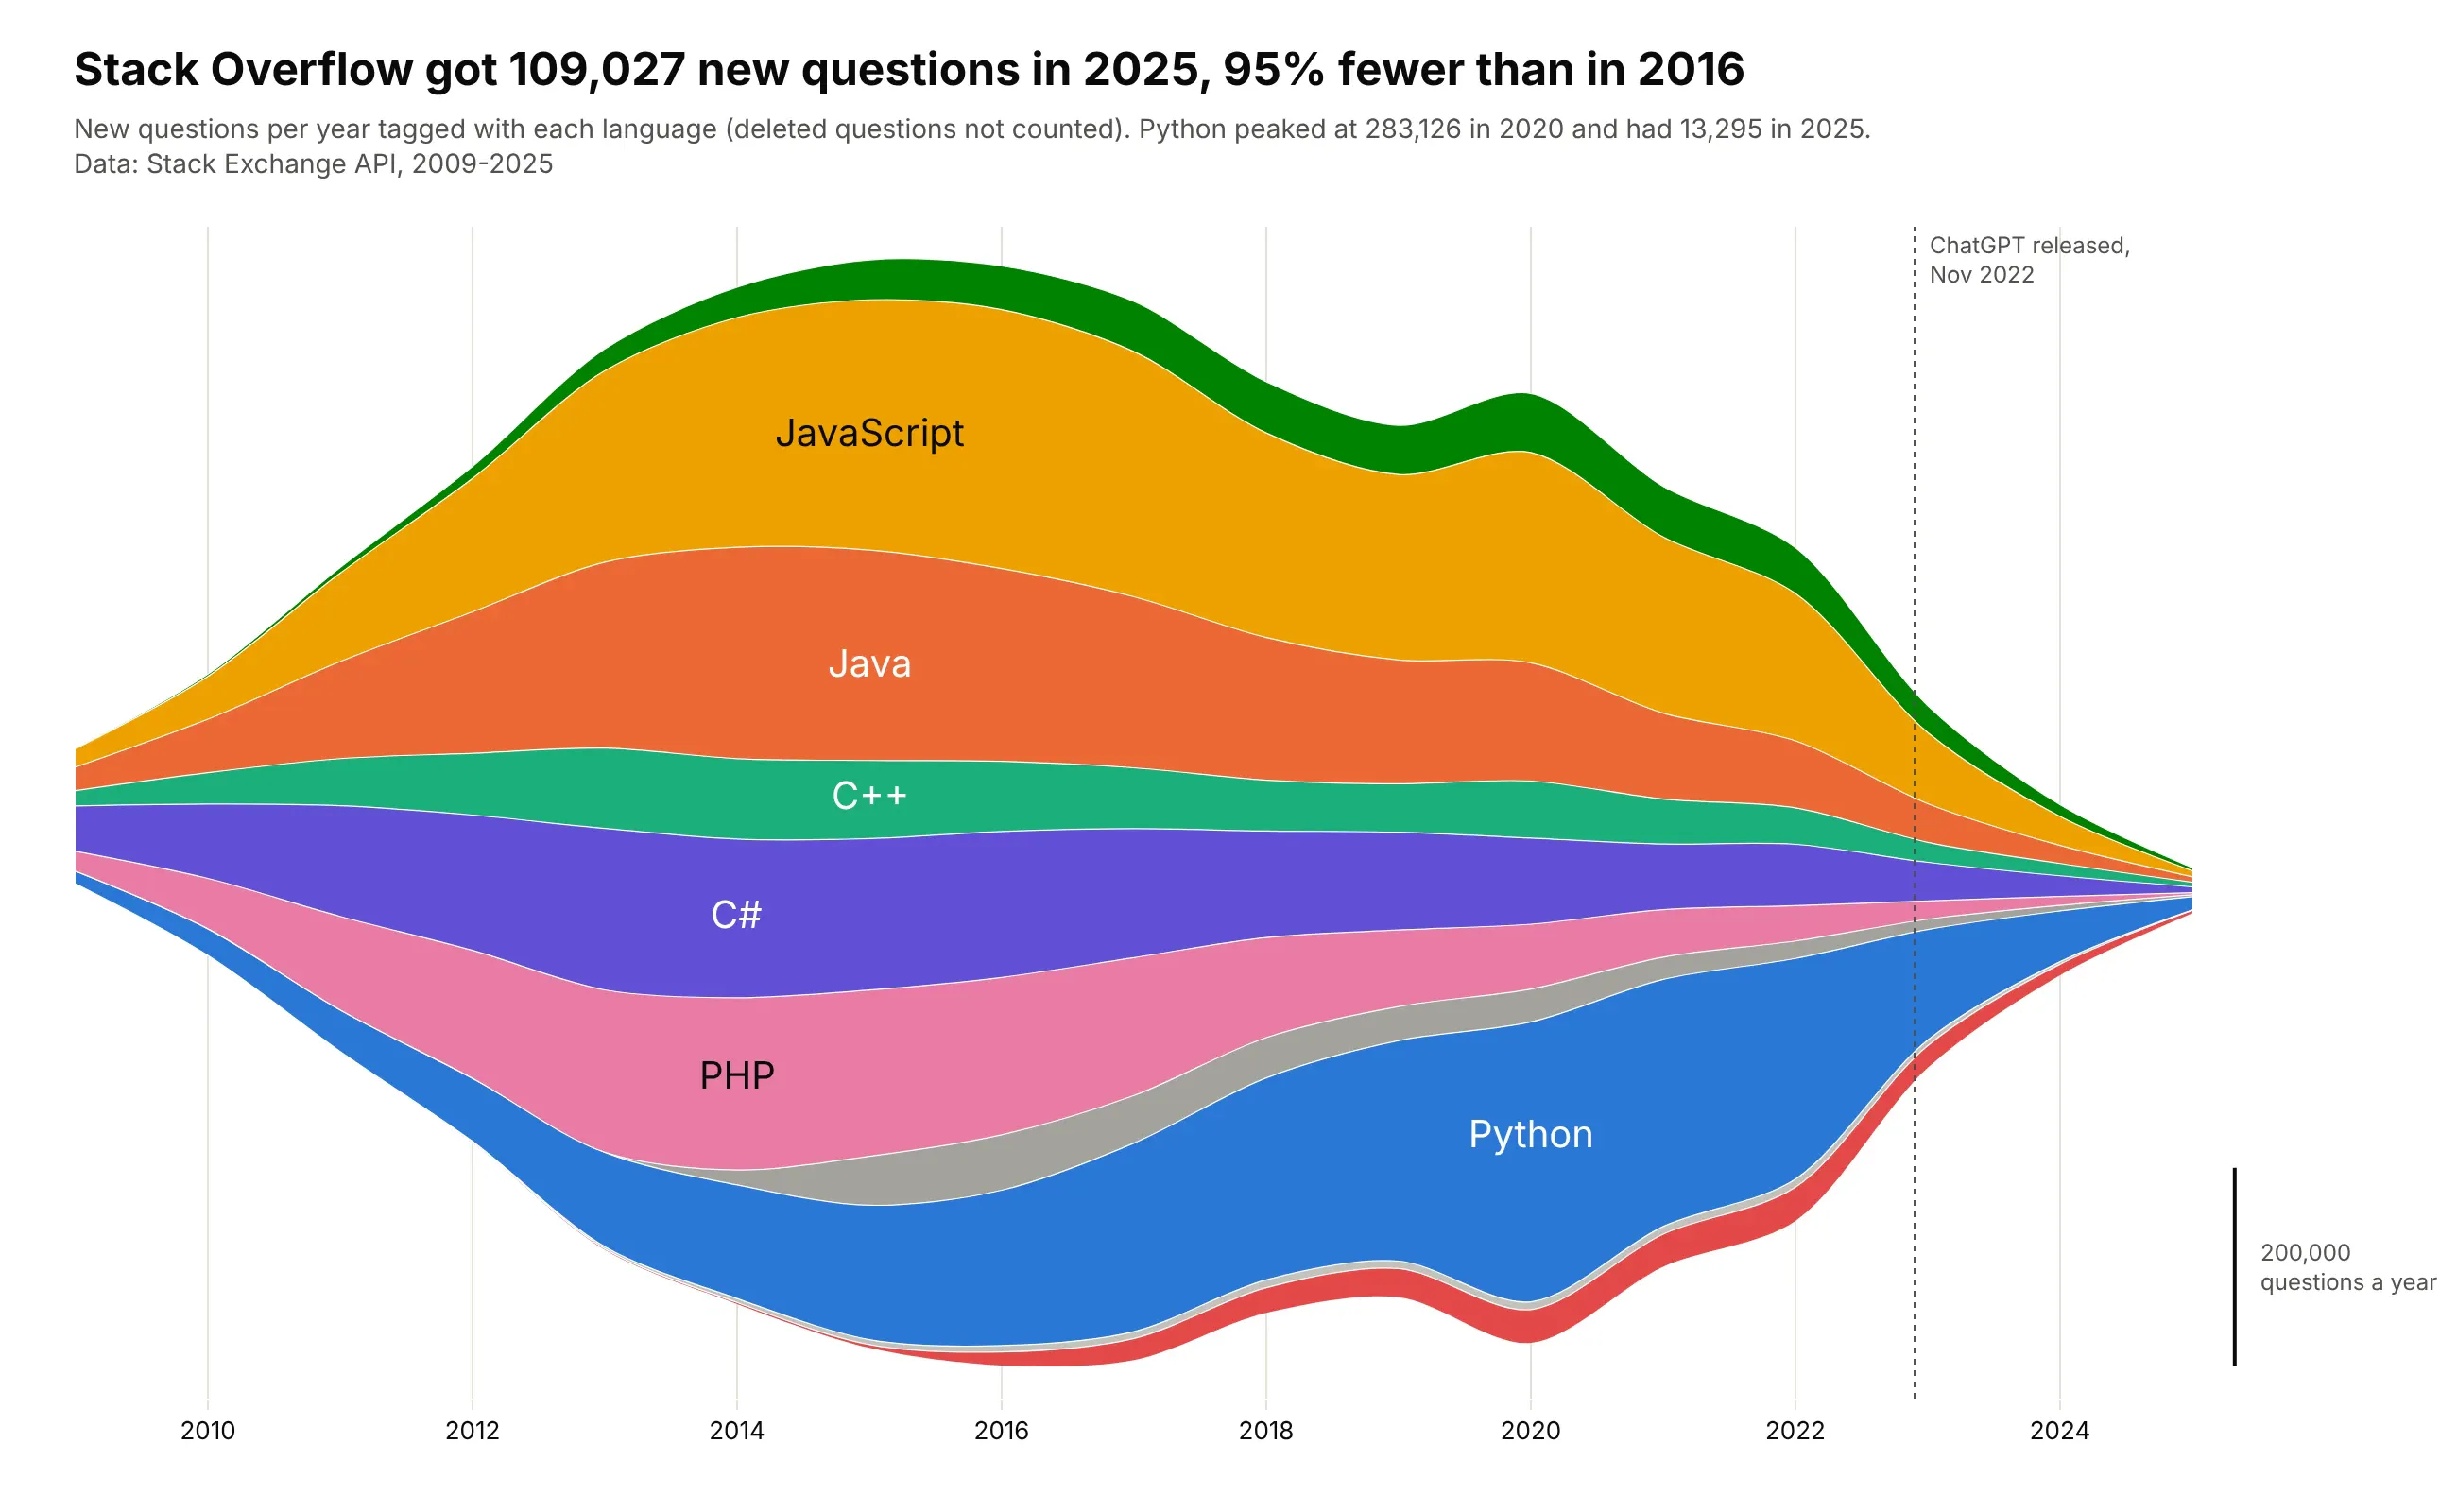
Data: Stack Exchange API, 2009-2025.
How do you read a streamgraph? In the example above, notice these things:
- Each colored layer is one language, and its thickness at any year is the number of new questions tagged with it that year. The orange JavaScript layer is the thickest one through the mid-2010s.
- The outline of the whole stream is the total, so its shape tells the story of Stack Overflow itself. It is widest around 2016 and narrows to almost nothing by 2025, when there were 95% fewer new questions.
- Follow one layer from left to right to see the mix change. The blue Python layer at the bottom keeps getting thicker while PHP and C# thin out, until it becomes the thickest layer in the stream in 2019.
- The bottom edge is a computed curve that keeps the stream centered around the middle, which is why there is no y axis. To judge how thick a layer is, hold it up against the scale bar on the right.
- A layer moves up or down when the layers under it grow or shrink, so where it sits tells you nothing about its own value. Measure each layer straight up and down instead, which shows that JavaScript peaked in 2016, the same year the whole stream was widest.
It's often used for charts like these:
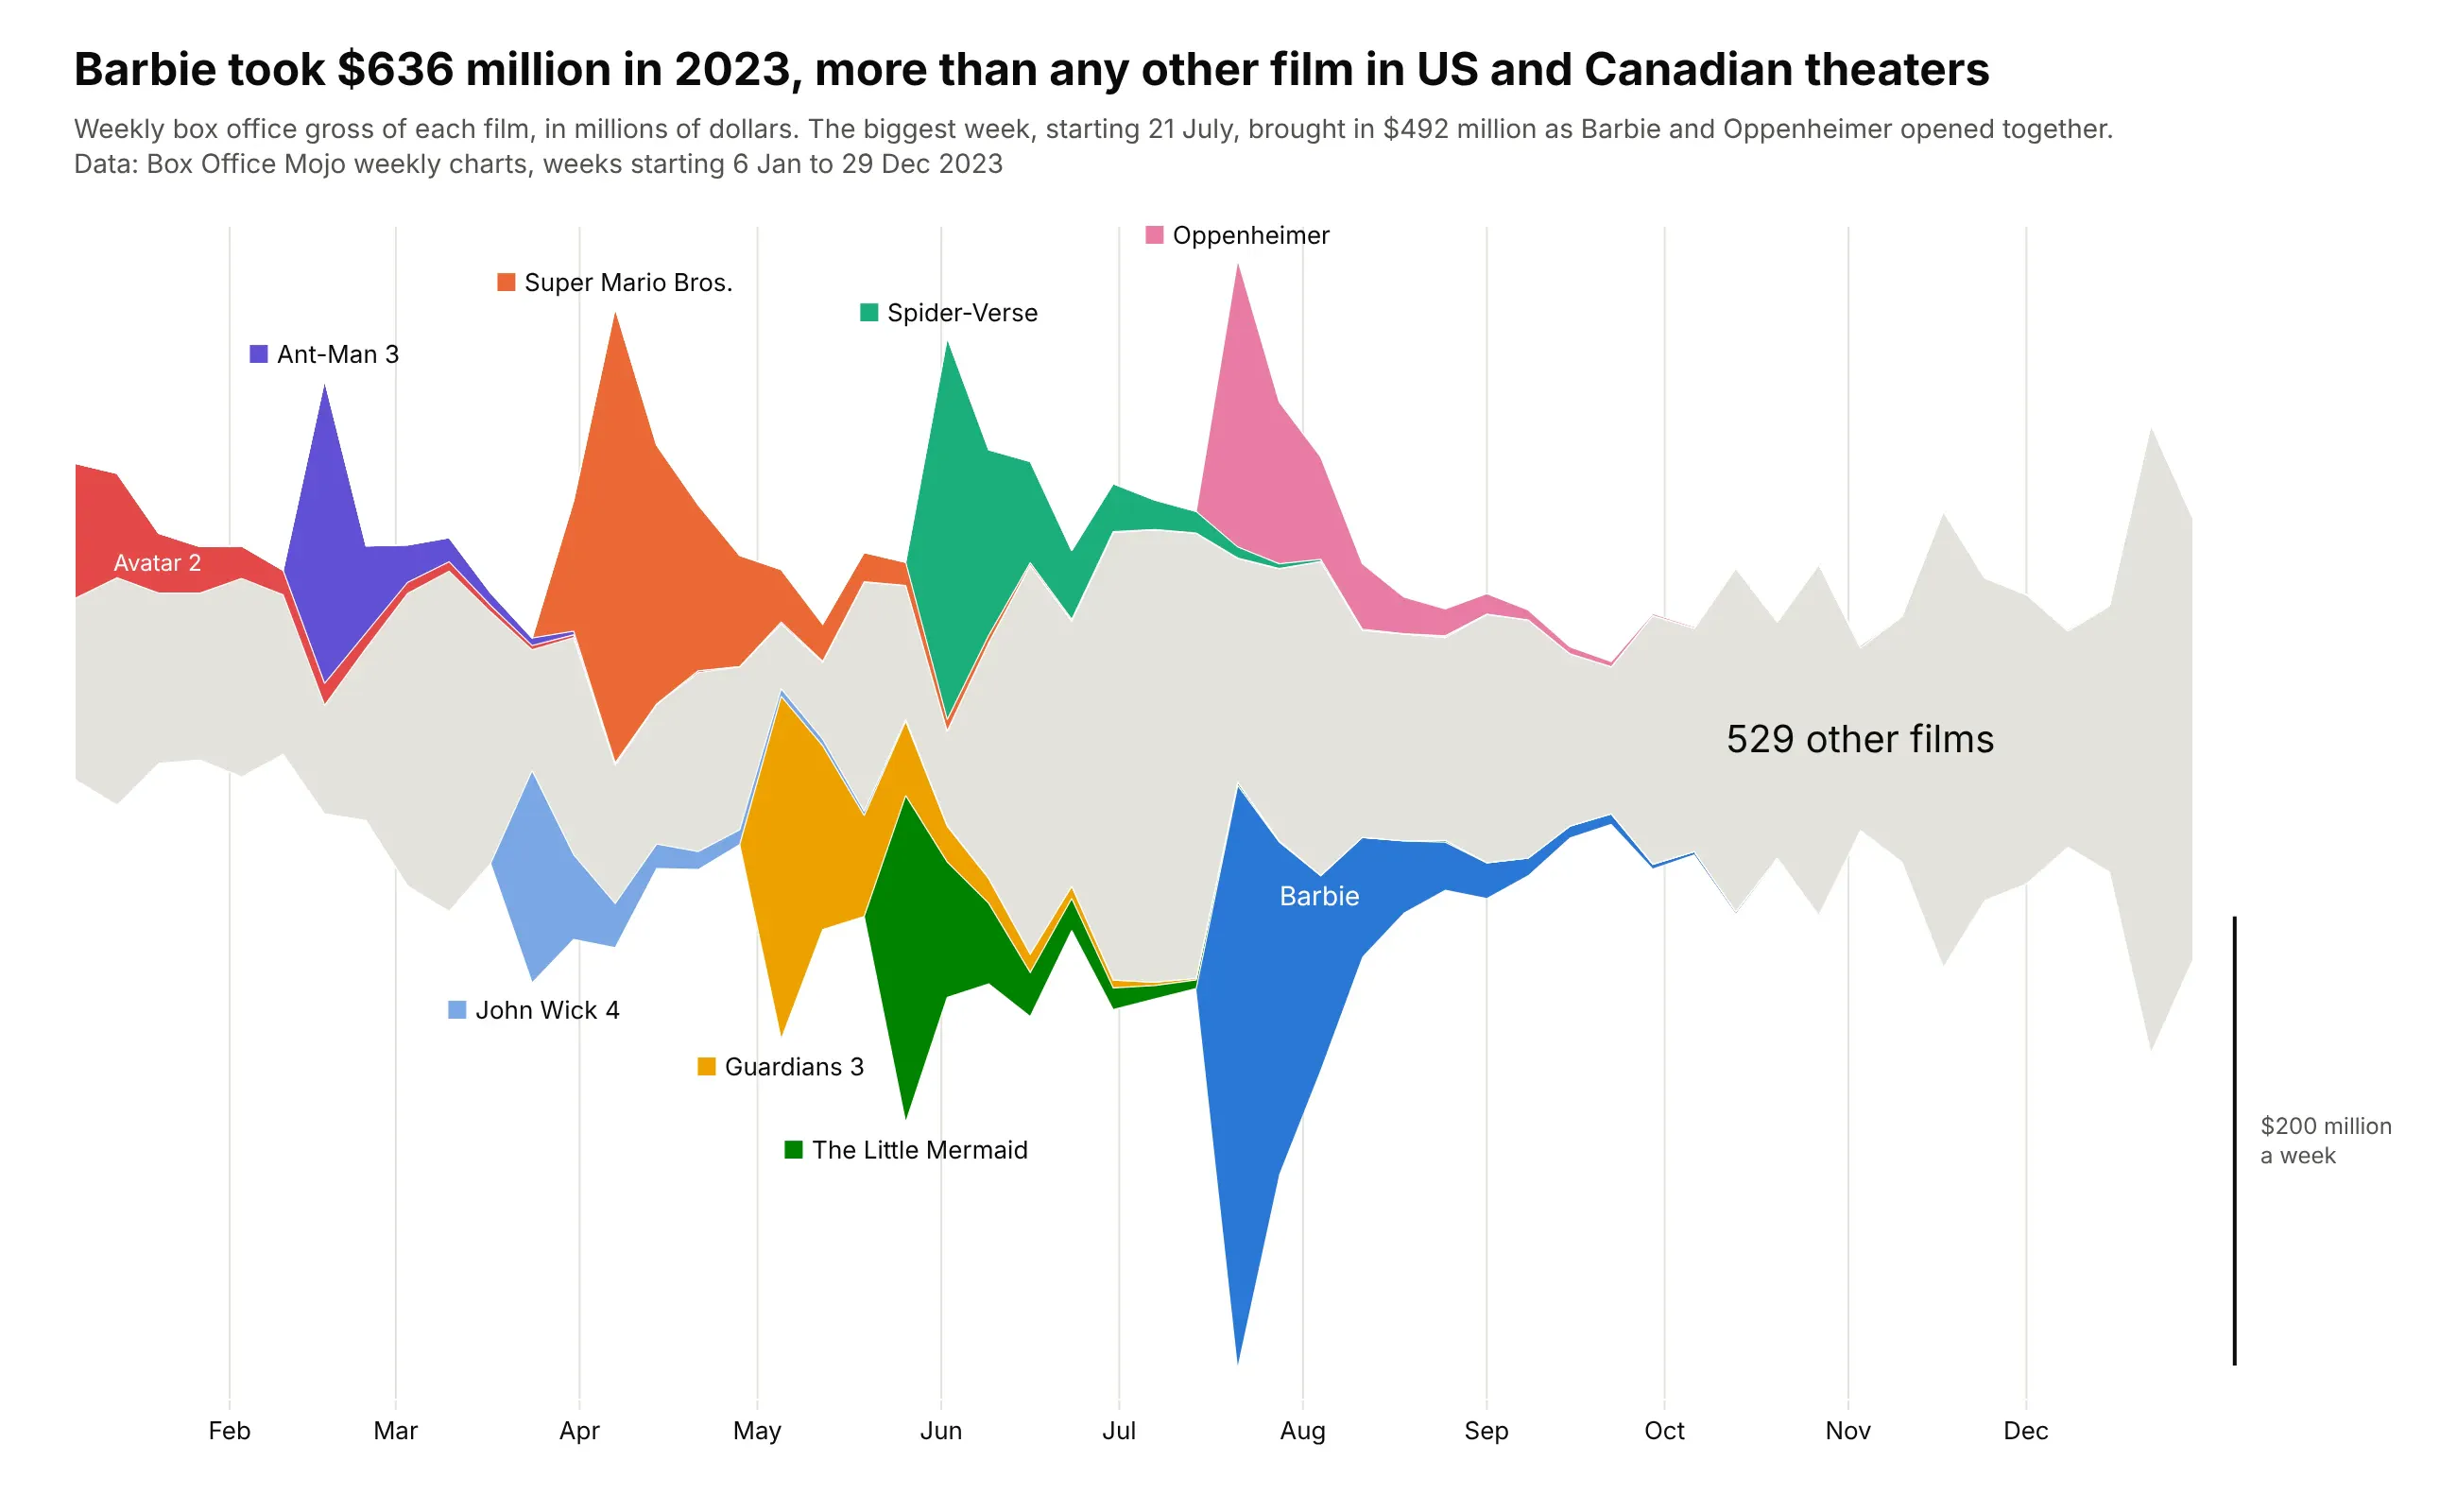
A year at the box office, the subject of The New York Times' 2008 streamgraph. Barbie took $636 million in US and Canadian theaters in 2023, and the week it opened alongside Oppenheimer brought in $492 million, the biggest week of the year. Data: Box Office Mojo weekly charts.
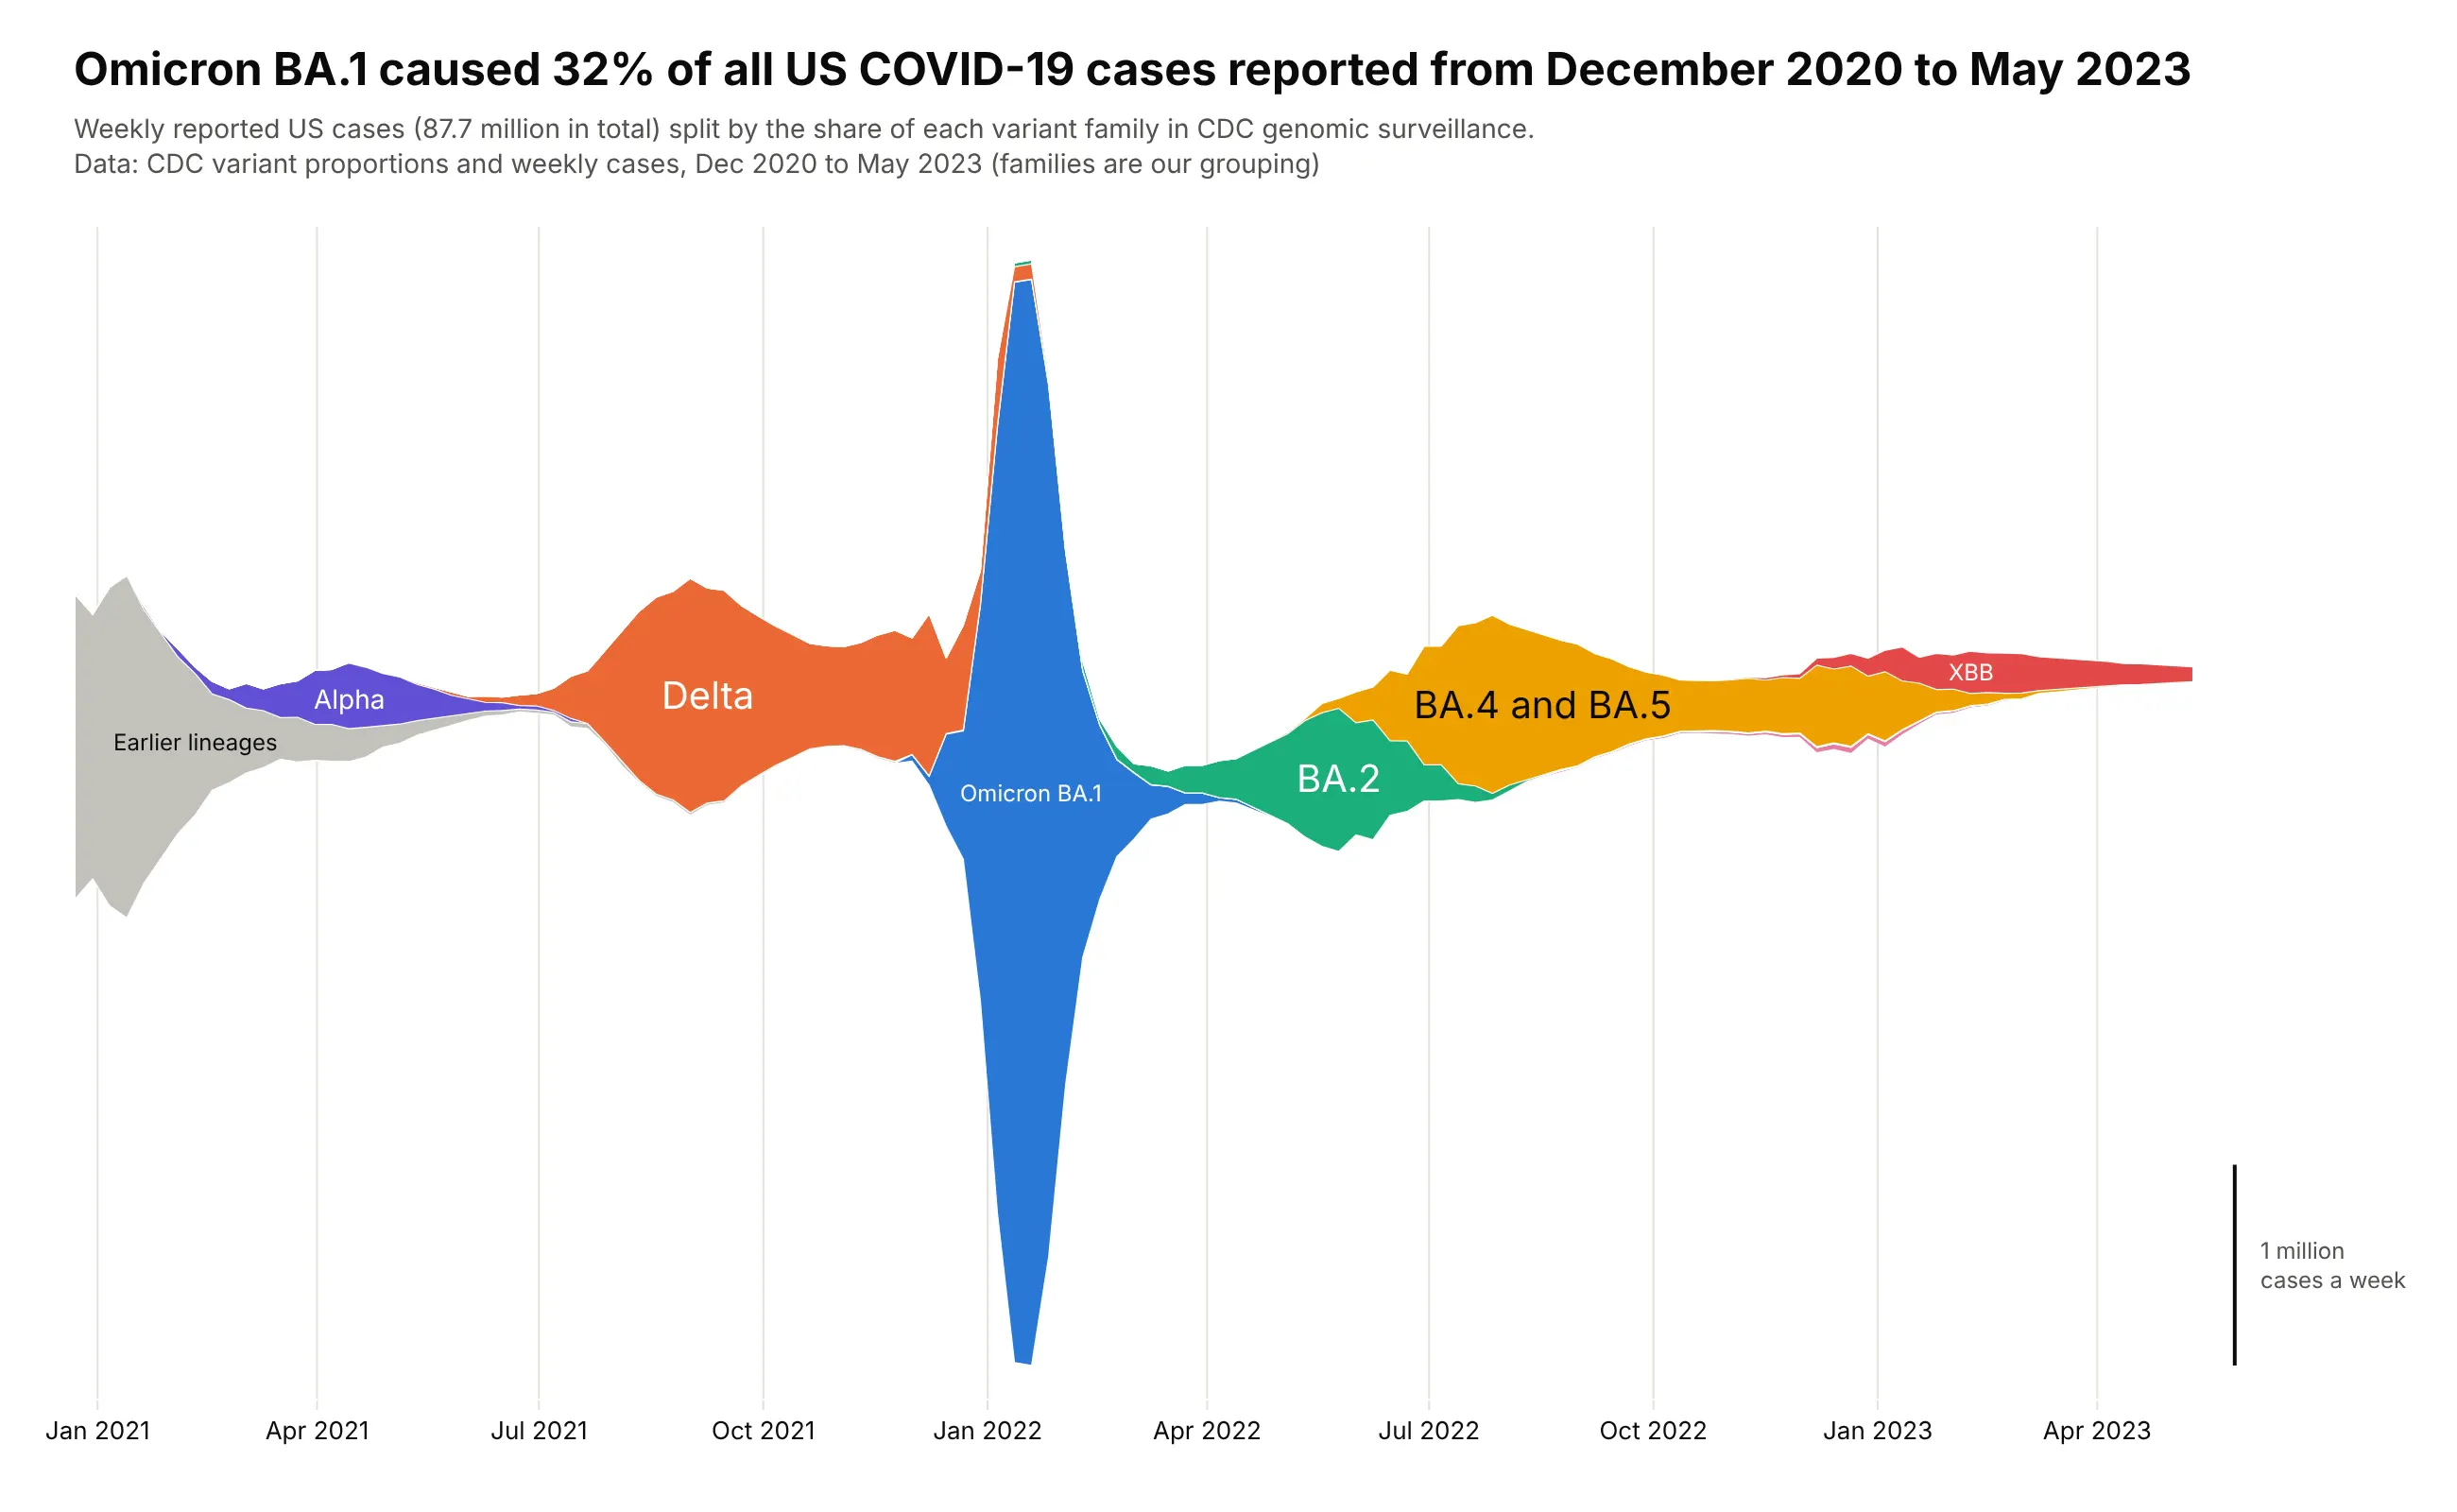
Waves that replace each other. Omicron BA.1 caused 32% of the 87.7 million US COVID-19 cases reported from December 2020 to May 2023, and 83% of its cases came in the six weeks from late December 2021 to early February 2022. Data: CDC variant proportions and weekly cases.
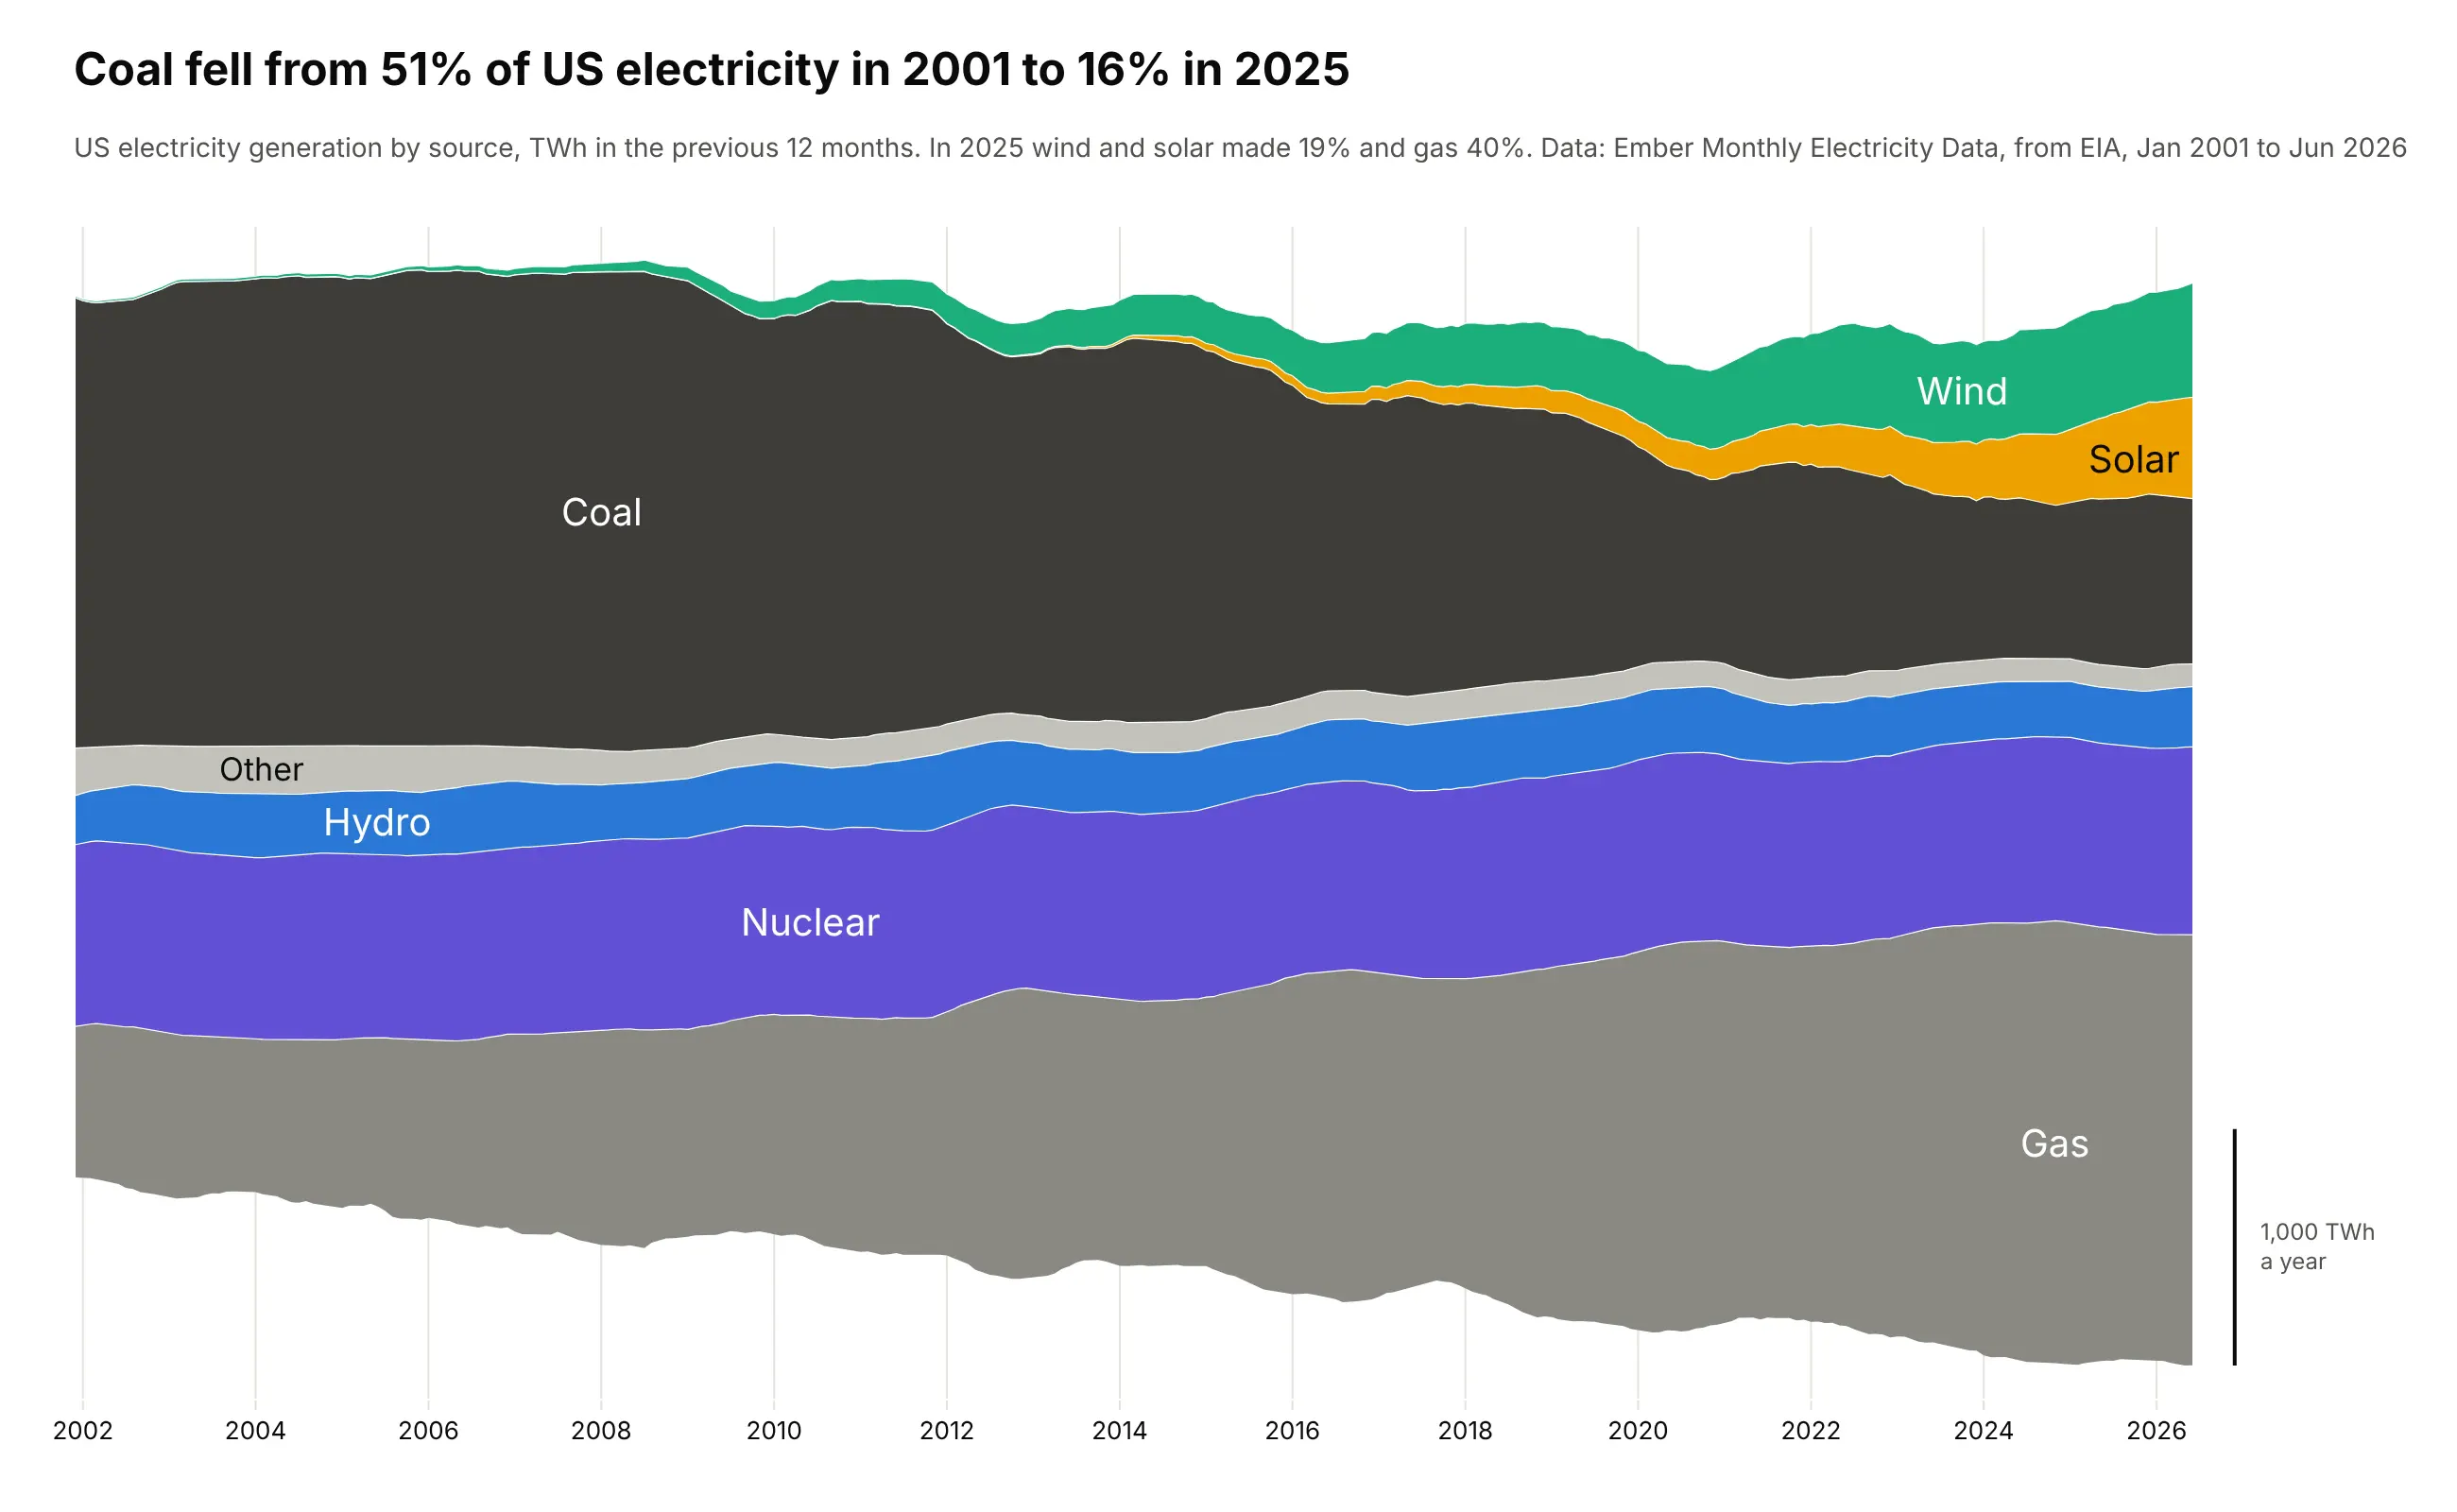
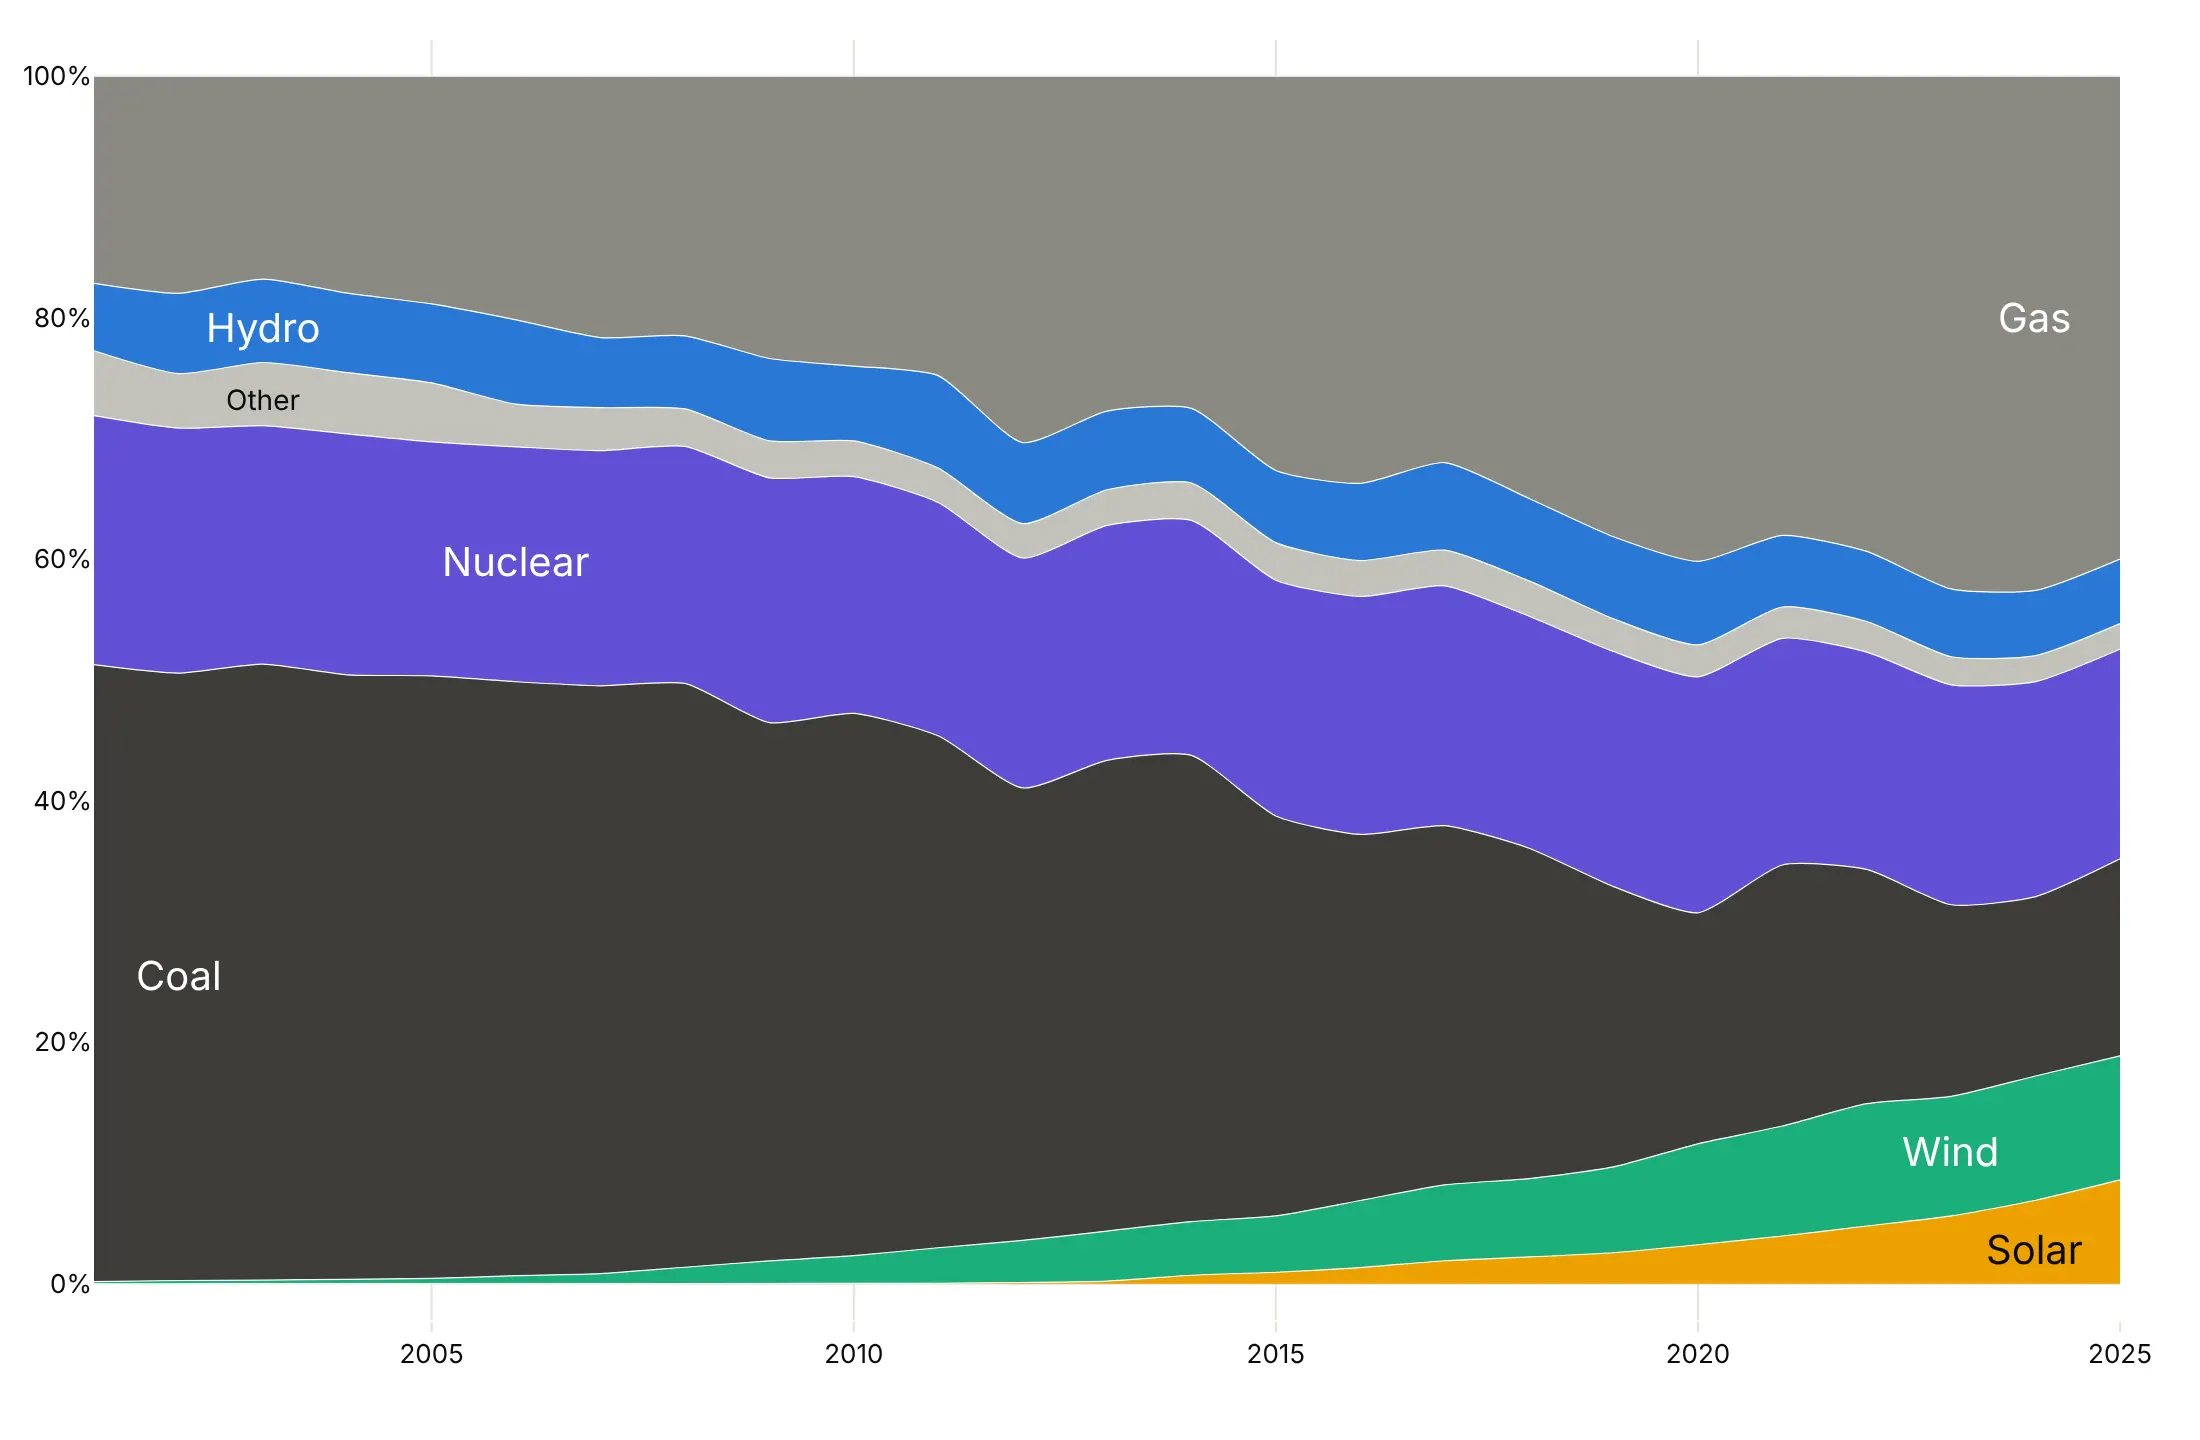
A mix that shifts over decades. Coal made 51% of US electricity in 2001 and 16% in 2025, when wind and solar together made 19%. Data: Ember Monthly Electricity Data, from EIA.
A short history
Stacked graphs of topics over time were first called ThemeRiver, by Susan Havre and colleagues at Pacific Northwest National Laboratory, who centered the layers on a line (Havre et al., 2002). Martin Wattenberg's NameVoyager (2005) stacked US baby names on a zero baseline and let visitors filter it by the letters they typed (Wattenberg, 2005). Here is that style redrawn with Plotly on the same public SSA data:
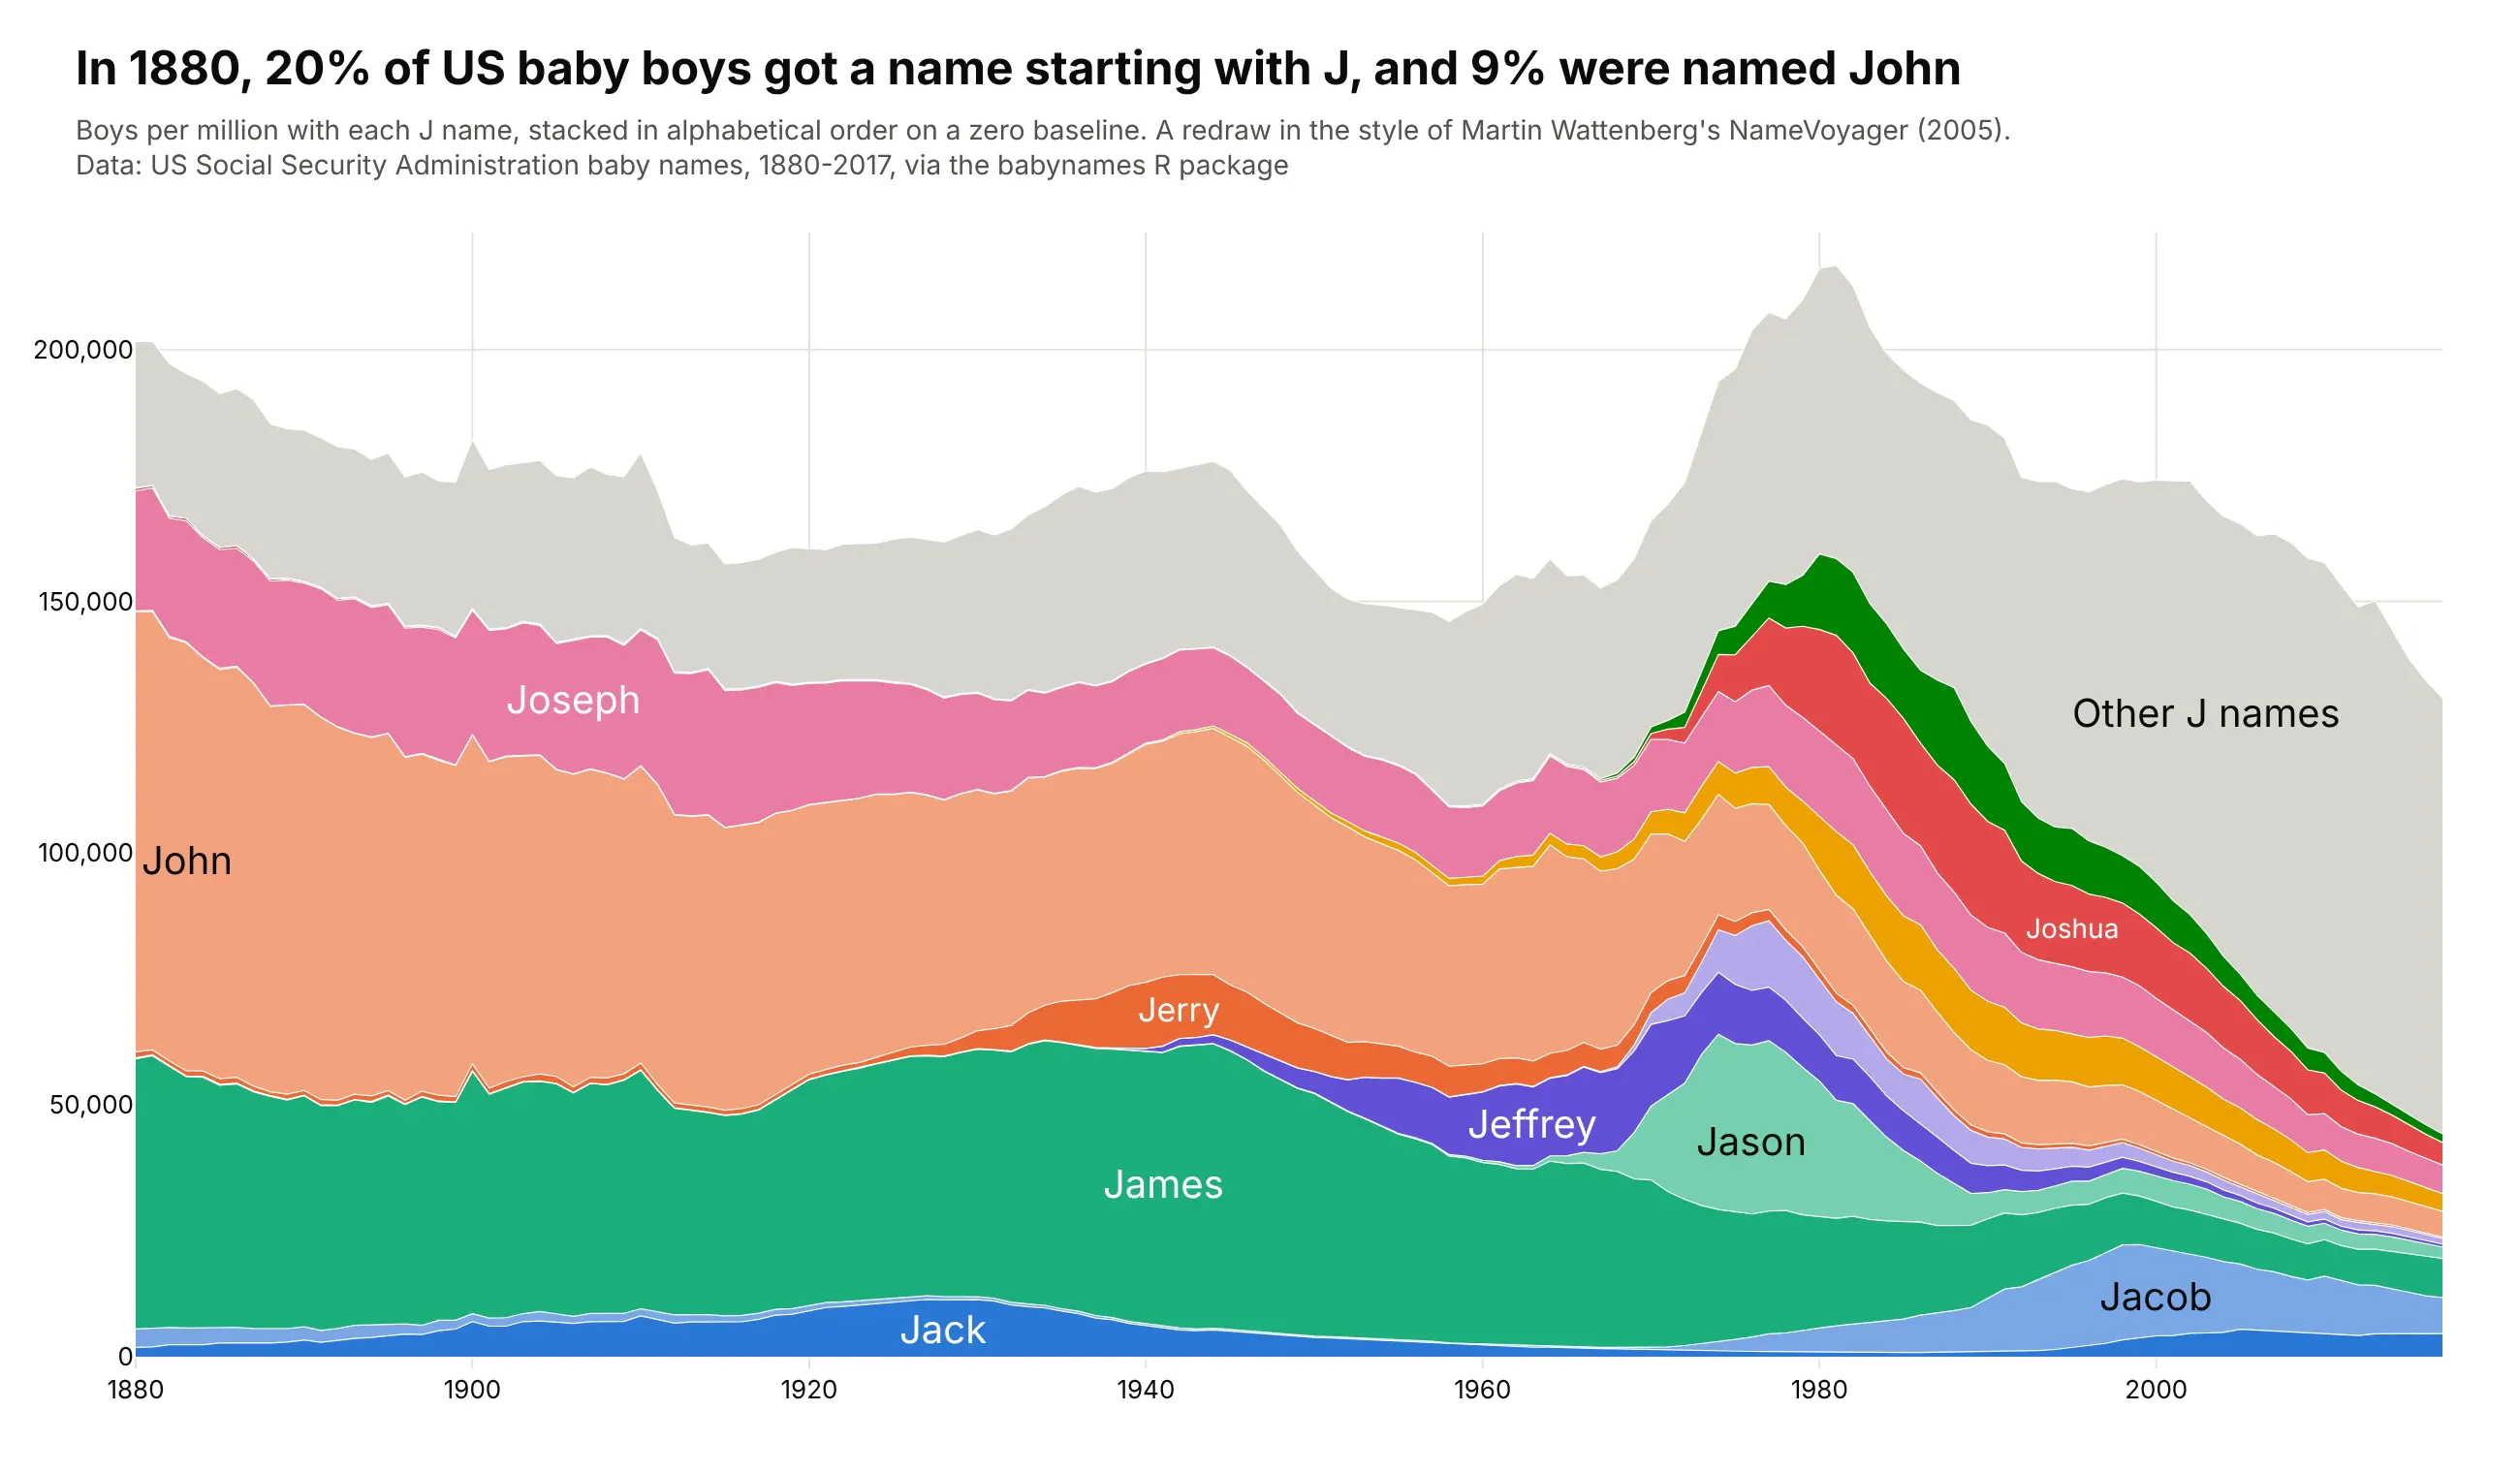
Lee Byron and Martin Wattenberg named the streamgraph in 2008 and worked out its geometry: a "wiggle" baseline that keeps the layers as flat as possible, and an inside-out layer order (Byron and Wattenberg, 2008). The same year, Byron drew The New York Times' box office graphic "The Ebb and Flow of Movies", which made the shape famous.
Alternatives to a streamgraph
Here's the same Stack Overflow data drawn six ways. Some are better for the question, some worse, some just different:
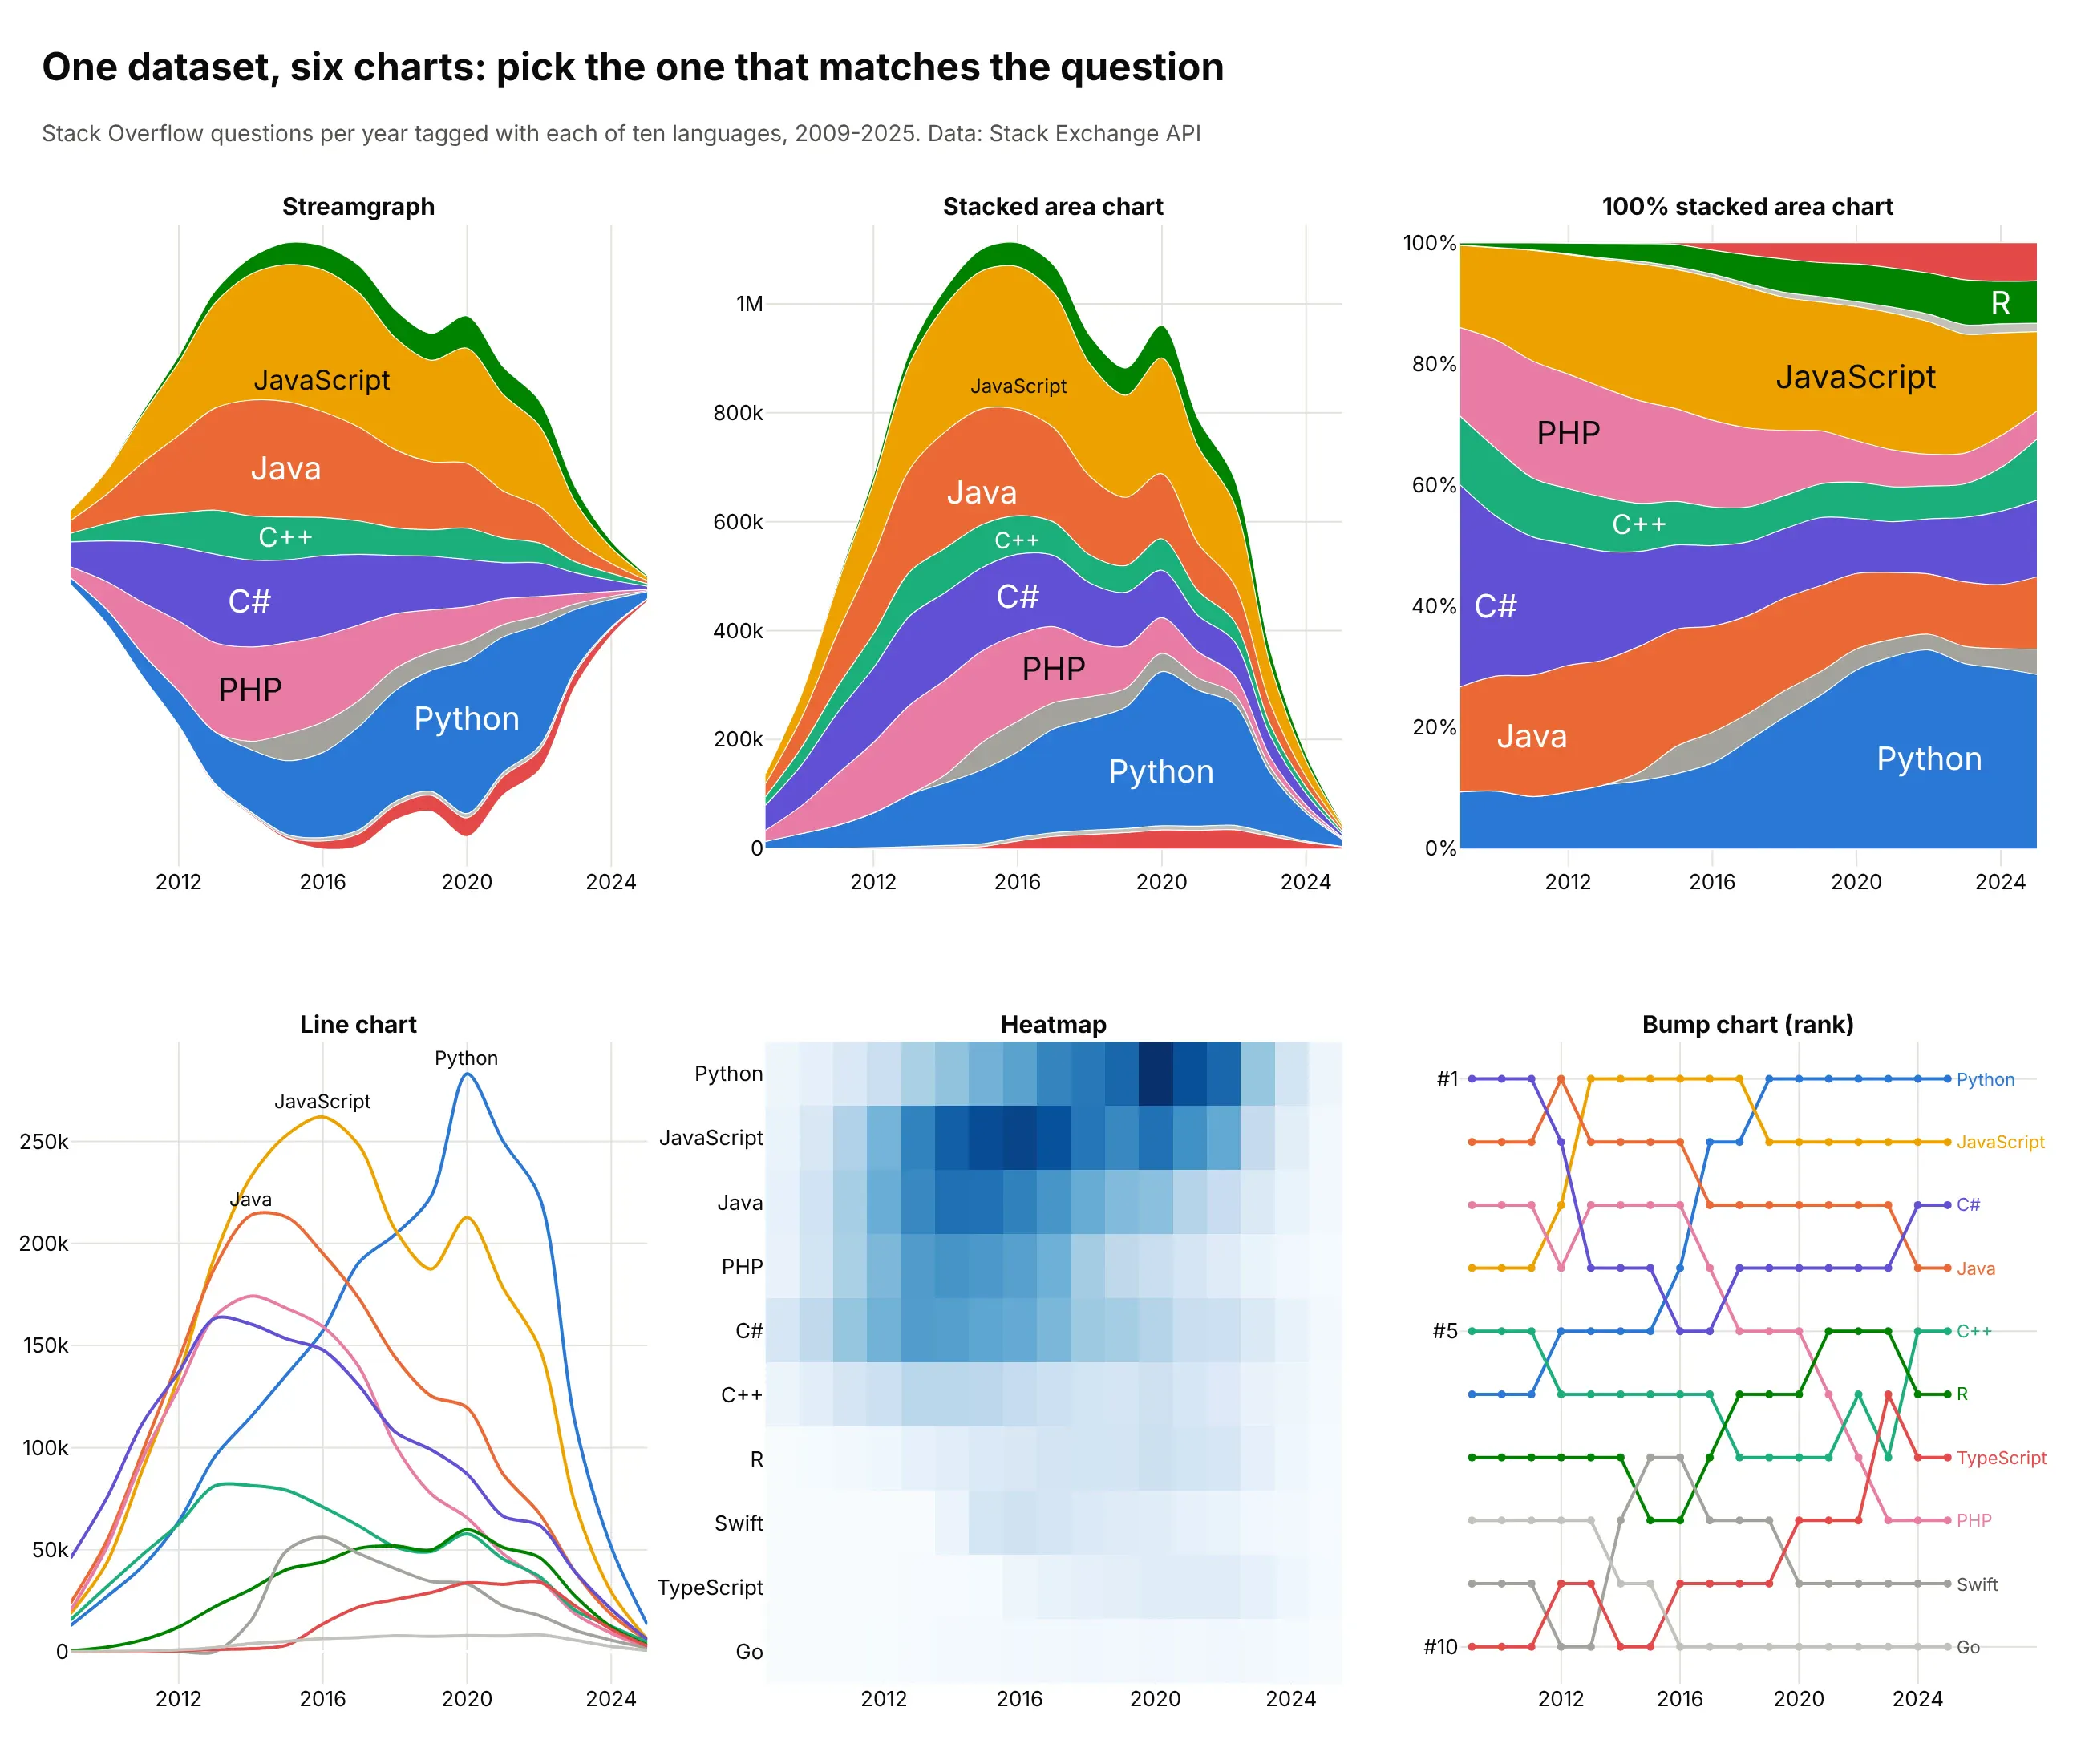
- Stacked area chart (better when the total matters). The same layers on a zero baseline, so the top edge is the total you can read against a y axis. Layers above the bottom one are still hard to compare.
- 100% stacked area chart (better for shares). Every year adds up to 100%, so you see Python's share grow while the site shrinks. It hides the collapse in volume.
- Line chart (better for exact values). Each language from zero, easy to read precisely, but ten crossing lines get crowded.
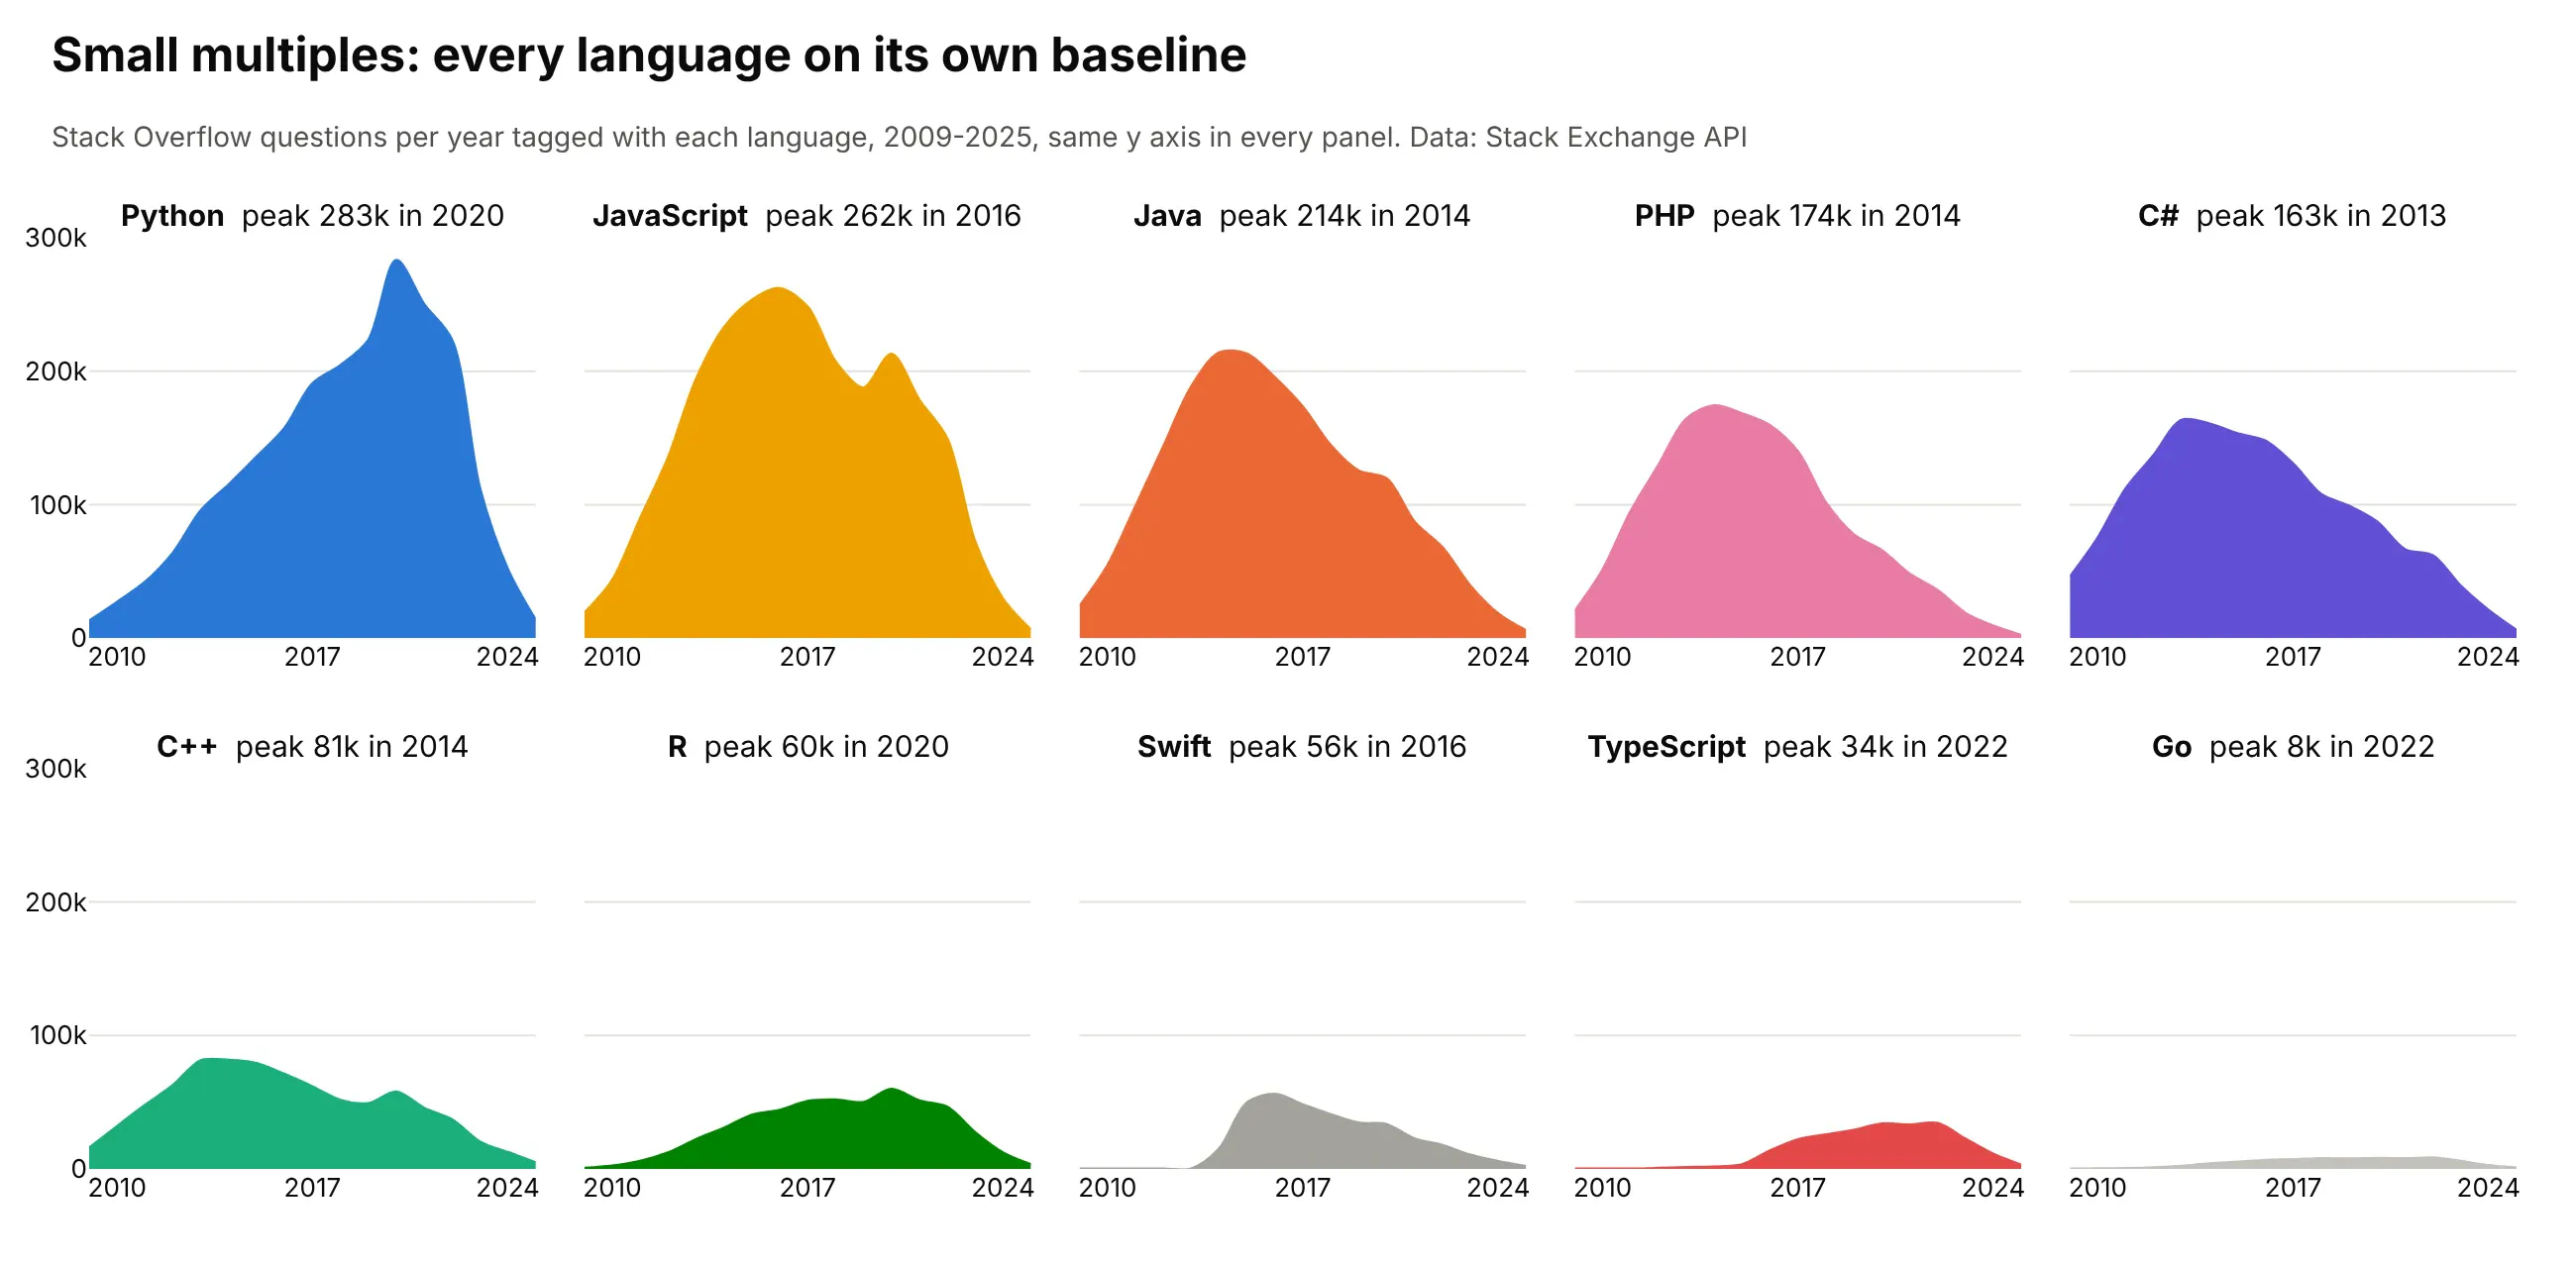
- Small multiples (better for comparing each layer's shape). One small chart per language on a shared axis, shown below.
- Heatmap (different). Rows of languages and columns of years, which scales to hundreds of categories but turns amounts into shades.
- Bump chart (different). Only the rank, which shows that Python passed JavaScript in 2019 and loses how big the gap was.
Here's where small multiples win. Each language gets its own zero baseline, so its peak and decline can be read exactly:
How to make a streamgraph
With AI
ChatGPT, Claude Code, GitHub Copilot, Cursor and other AI tools are excellent at writing Plotly code. Name Plotly in the prompt, say which baseline and layer order you want, and list the checks:
Make a plotly streamgraph from generation.csv (columns: month, source, twh).- Use go.Scatter traces in one stackgroup. Add the baseline as an invisible first trace(fill="none", hoverinfo="skip") computed with Byron & Wattenberg's weighted wiggle formula.- Sum the monthly values over a rolling 12 months first, so seasonal spikes don't hide the trend.- Order layers inside-out: sort by the month each source peaks, put the earliest in the middle,and add later ones alternately above and below.- One fixed color per source. Write each source's name inside its layer where it is thickest,and skip the label if the layer is thinner than the text.- Hide the y axis and draw a scale bar for 1,000 TWh instead. Hover shows each source's value.- A title that states the main takeaway and a subtitle with the source.- Check that every month's layers add up to the total in the file.
With Plotly Studio
Plotly Studio is a desktop app where you point an AI at a dataset and it builds charts and a Dash app around your questions. Ask for a streamgraph the same way:
Show a streamgraph of electricity generation by source over time, with the layers centered on a wiggle baseline and labeled inside. Add a toggle to switch between the streamgraph, a stacked area chart and a 100% stacked area chart.
Make a streamgraph in Python or JavaScript
This is the code AI tools write under the hood. The Python helper makes a streamgraph from go.Scatter traces: it computes Byron and Wattenberg's wiggle baseline and stacks the layers on top of it:
import numpy as npimport pandas as pdimport plotly.graph_objects as godef wiggle_baseline(wide):"""Byron & Wattenberg's weighted wiggle: the bottom edge that keeps layers as flat as possible."""f = wide.to_numpy(float)df = np.diff(f, axis=0, prepend=f[:1])below = np.cumsum(df, axis=1) - dfstep = ((below + df / 2) * f).sum(axis=1) / f.sum(axis=1)g0 = -np.cumsum(step)return g0 - np.mean(g0 + f.sum(axis=1) / 2)def make_streamgraph(df, x, y, group):wide = df.pivot_table(index=x, columns=group, values=y, aggfunc="sum").fillna(0)fig = go.Figure(go.Scatter(x=wide.index, y=wiggle_baseline(wide), stackgroup="s", fill="none",line=dict(width=0), hoverinfo="skip", showlegend=False))for name in wide.columns:fig.add_trace(go.Scatter(x=wide.index, y=wide[name], name=name, stackgroup="s", fill="tonexty",line=dict(width=0.5, shape="spline")))fig.update_layout(yaxis_visible=False, hovermode="x unified")return figdf = pd.DataFrame({"year": [2001, 2001, 2001, 2013, 2013, 2013, 2025, 2025, 2025],"source": ["Coal", "Gas", "Wind"] * 3,"twh": [1904, 639, 7, 1581, 1125, 168, 737, 1807, 464],})fig = make_streamgraph(df, "year", "twh", "source")fig.show()
The examples in this guide use a fuller version of the same helper with the inside-out order, labels inside the layers, a scale bar and silhouette, zero and normalized baselines. In JavaScript, plotly.js builds the same thing from the same traces. This one uses the simpler silhouette baseline, minus half of each year's total:
<div id="chart"></div><script src="https://cdn.plot.ly/plotly-4.1.1.min.js"></script><script>const years = [2001, 2005, 2010, 2015, 2020, 2025];const layers = { // US electricity, TWh a year (Ember)Coal: [1904, 2013, 1847, 1352, 773, 737],Gas: [639, 761, 988, 1334, 1624, 1807],Nuclear: [769, 782, 807, 797, 790, 785],Wind: [7, 18, 95, 191, 338, 464],};// Silhouette baseline: start each year at minus half its total, so the stream is centered.const totals = years.map((_, i) => Object.values(layers).reduce((s, v) => s + v[i], 0));const traces = [{x: years, y: totals.map(t => -t / 2), stackgroup: "s", fill: "none",line: {width: 0}, hoverinfo: "skip", showlegend: false}];for (const [name, y] of Object.entries(layers)) {traces.push({x: years, y, name, stackgroup: "s", fill: "tonexty", line: {shape: "spline", width: 0.5}});}Plotly.newPlot("chart", traces, {yaxis: {visible: false}, hovermode: "x unified"});</script>
A plain stacked area chart, the same layers on a zero baseline, needs no helper. In Python it's one line, px.area(df, x="year", y="twh", color="source"); in JavaScript it's the scatter traces above without the invisible baseline trace; and in React you pass those traces as the data prop of the Plot component from react-plotly.js.
Share it
Every Plotly chart has a Share chart button (the cloud icon in its toolbar) that uploads it to Plotly Cloud and gives you a link. Only you can see it until you change its visibility.
For a live app, put the chart in a Dash app and publish it with the Plotly Cloud CLI. Coding agents can run these commands for you:
pip install "dash[cloud]"plotly user loginplotly app publish
If your data has to stay in your own cloud or data center, publish to Dash Enterprise instead.
Dos and don'ts
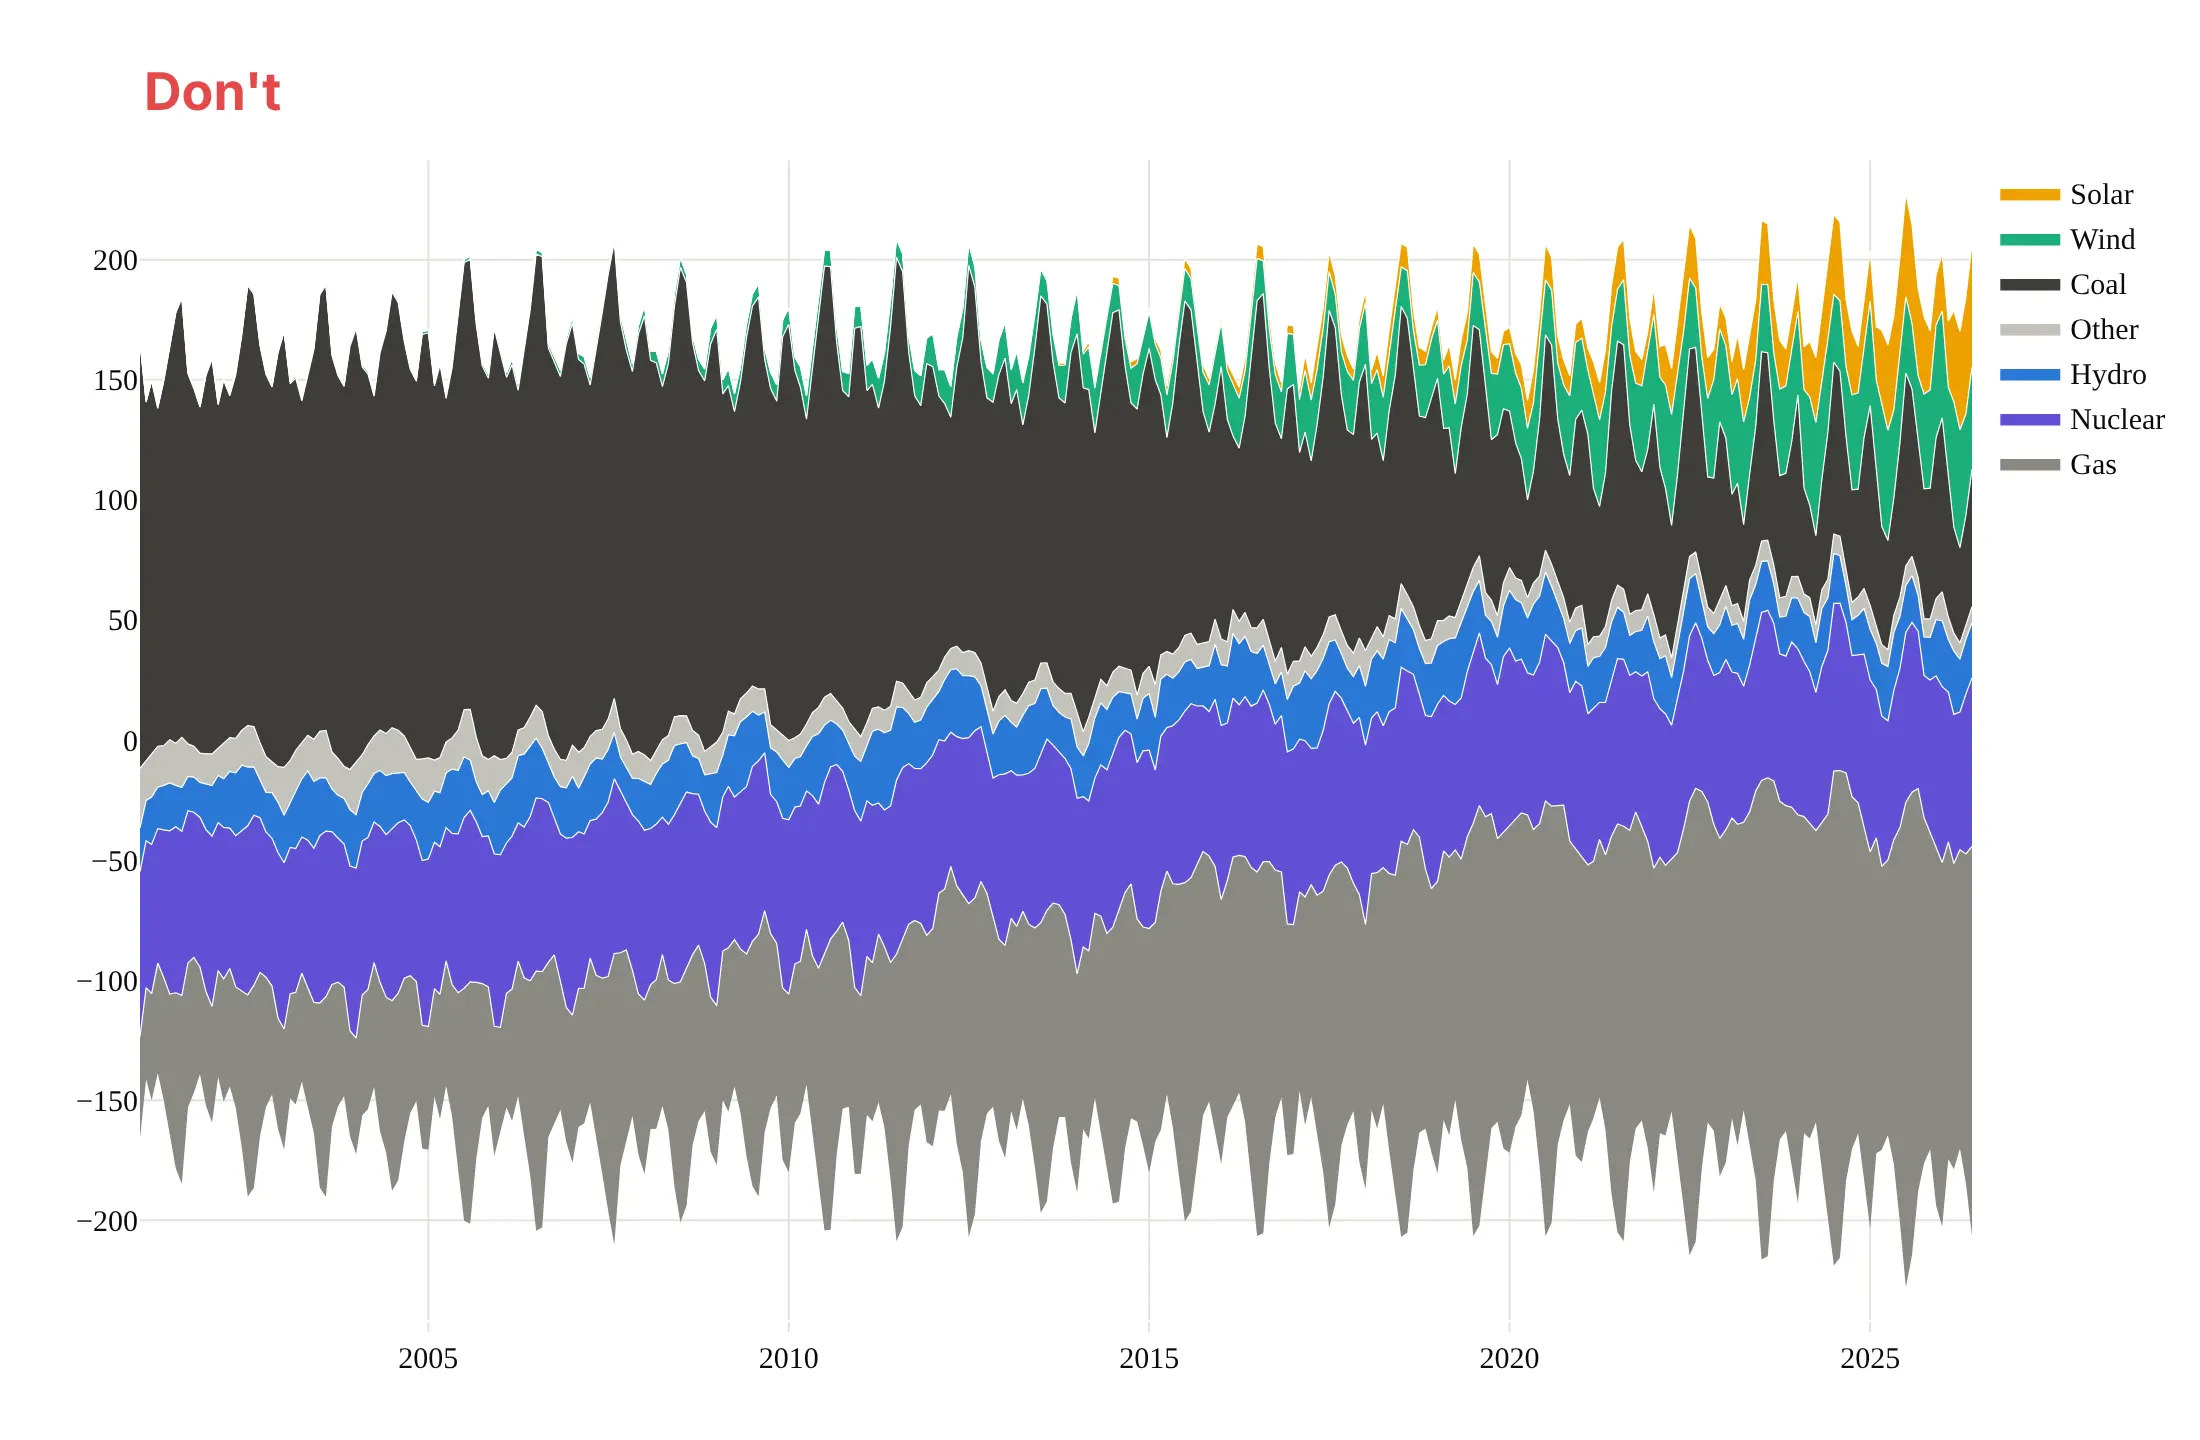
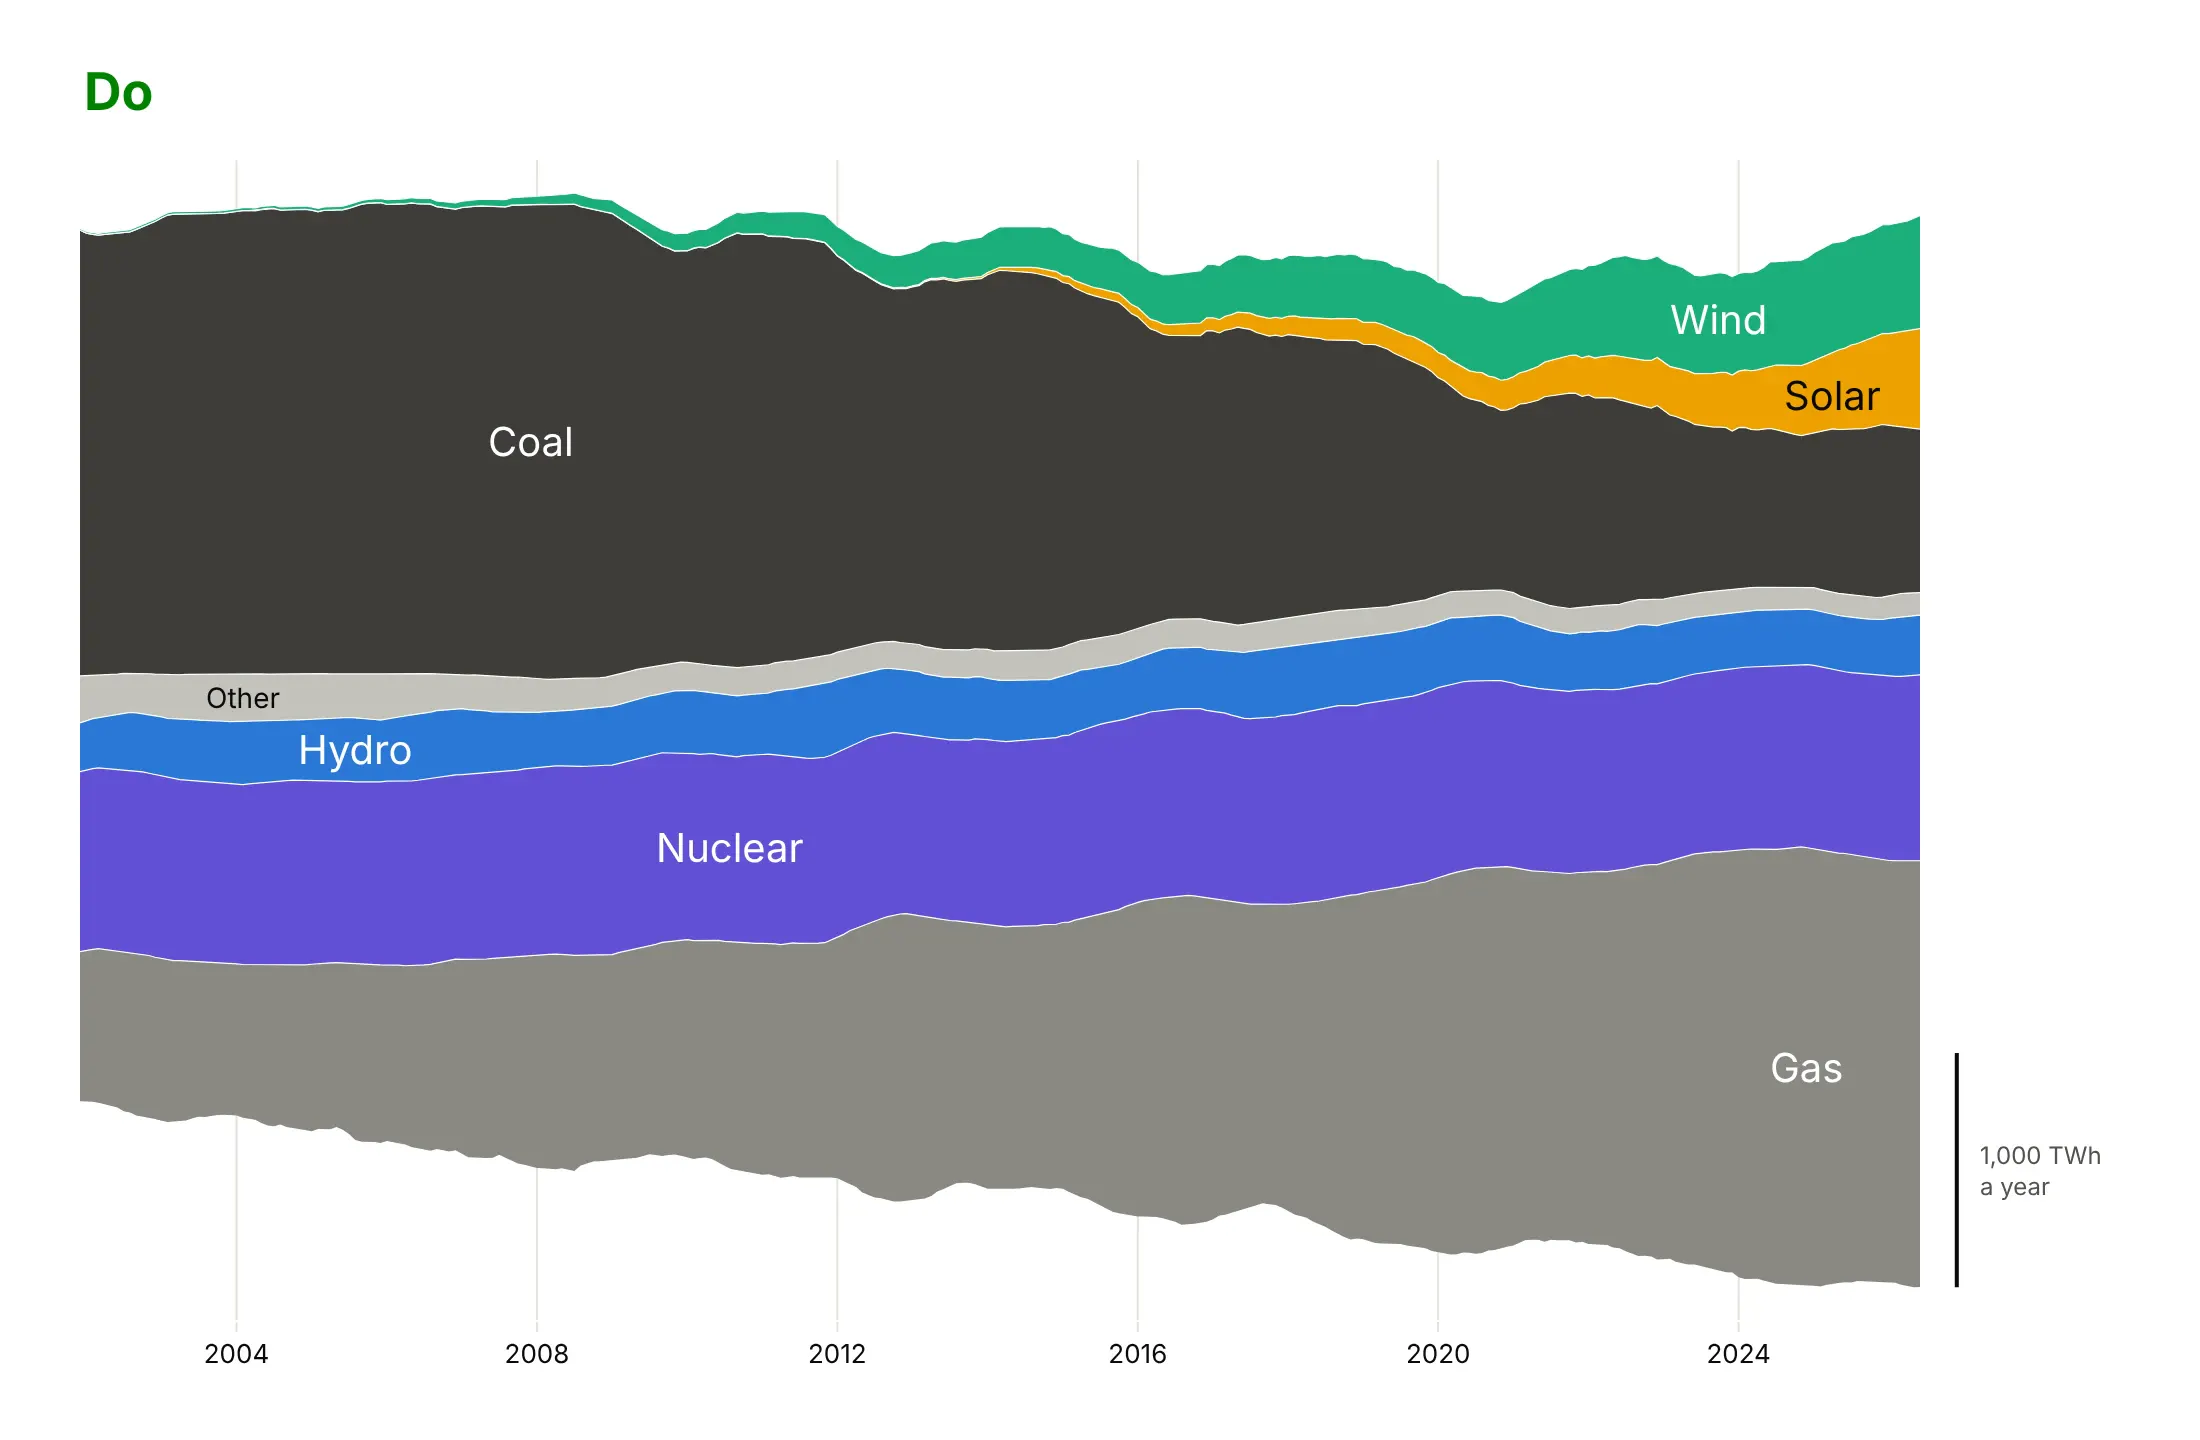
A streamgraph is easy to make noisy, because every wobble in one layer moves all the layers above it. Here is the same electricity data both ways, with the same colors and layer order.
Don't plot raw monthly values with seasonal spikes, keep a y axis whose negative numbers mean nothing, or use a hard-to-read default serif font:
Do smooth the data to the time scale of the story (here a 12-month rolling sum), label the layers inside, and replace the y axis with a scale bar:
Pick a baseline
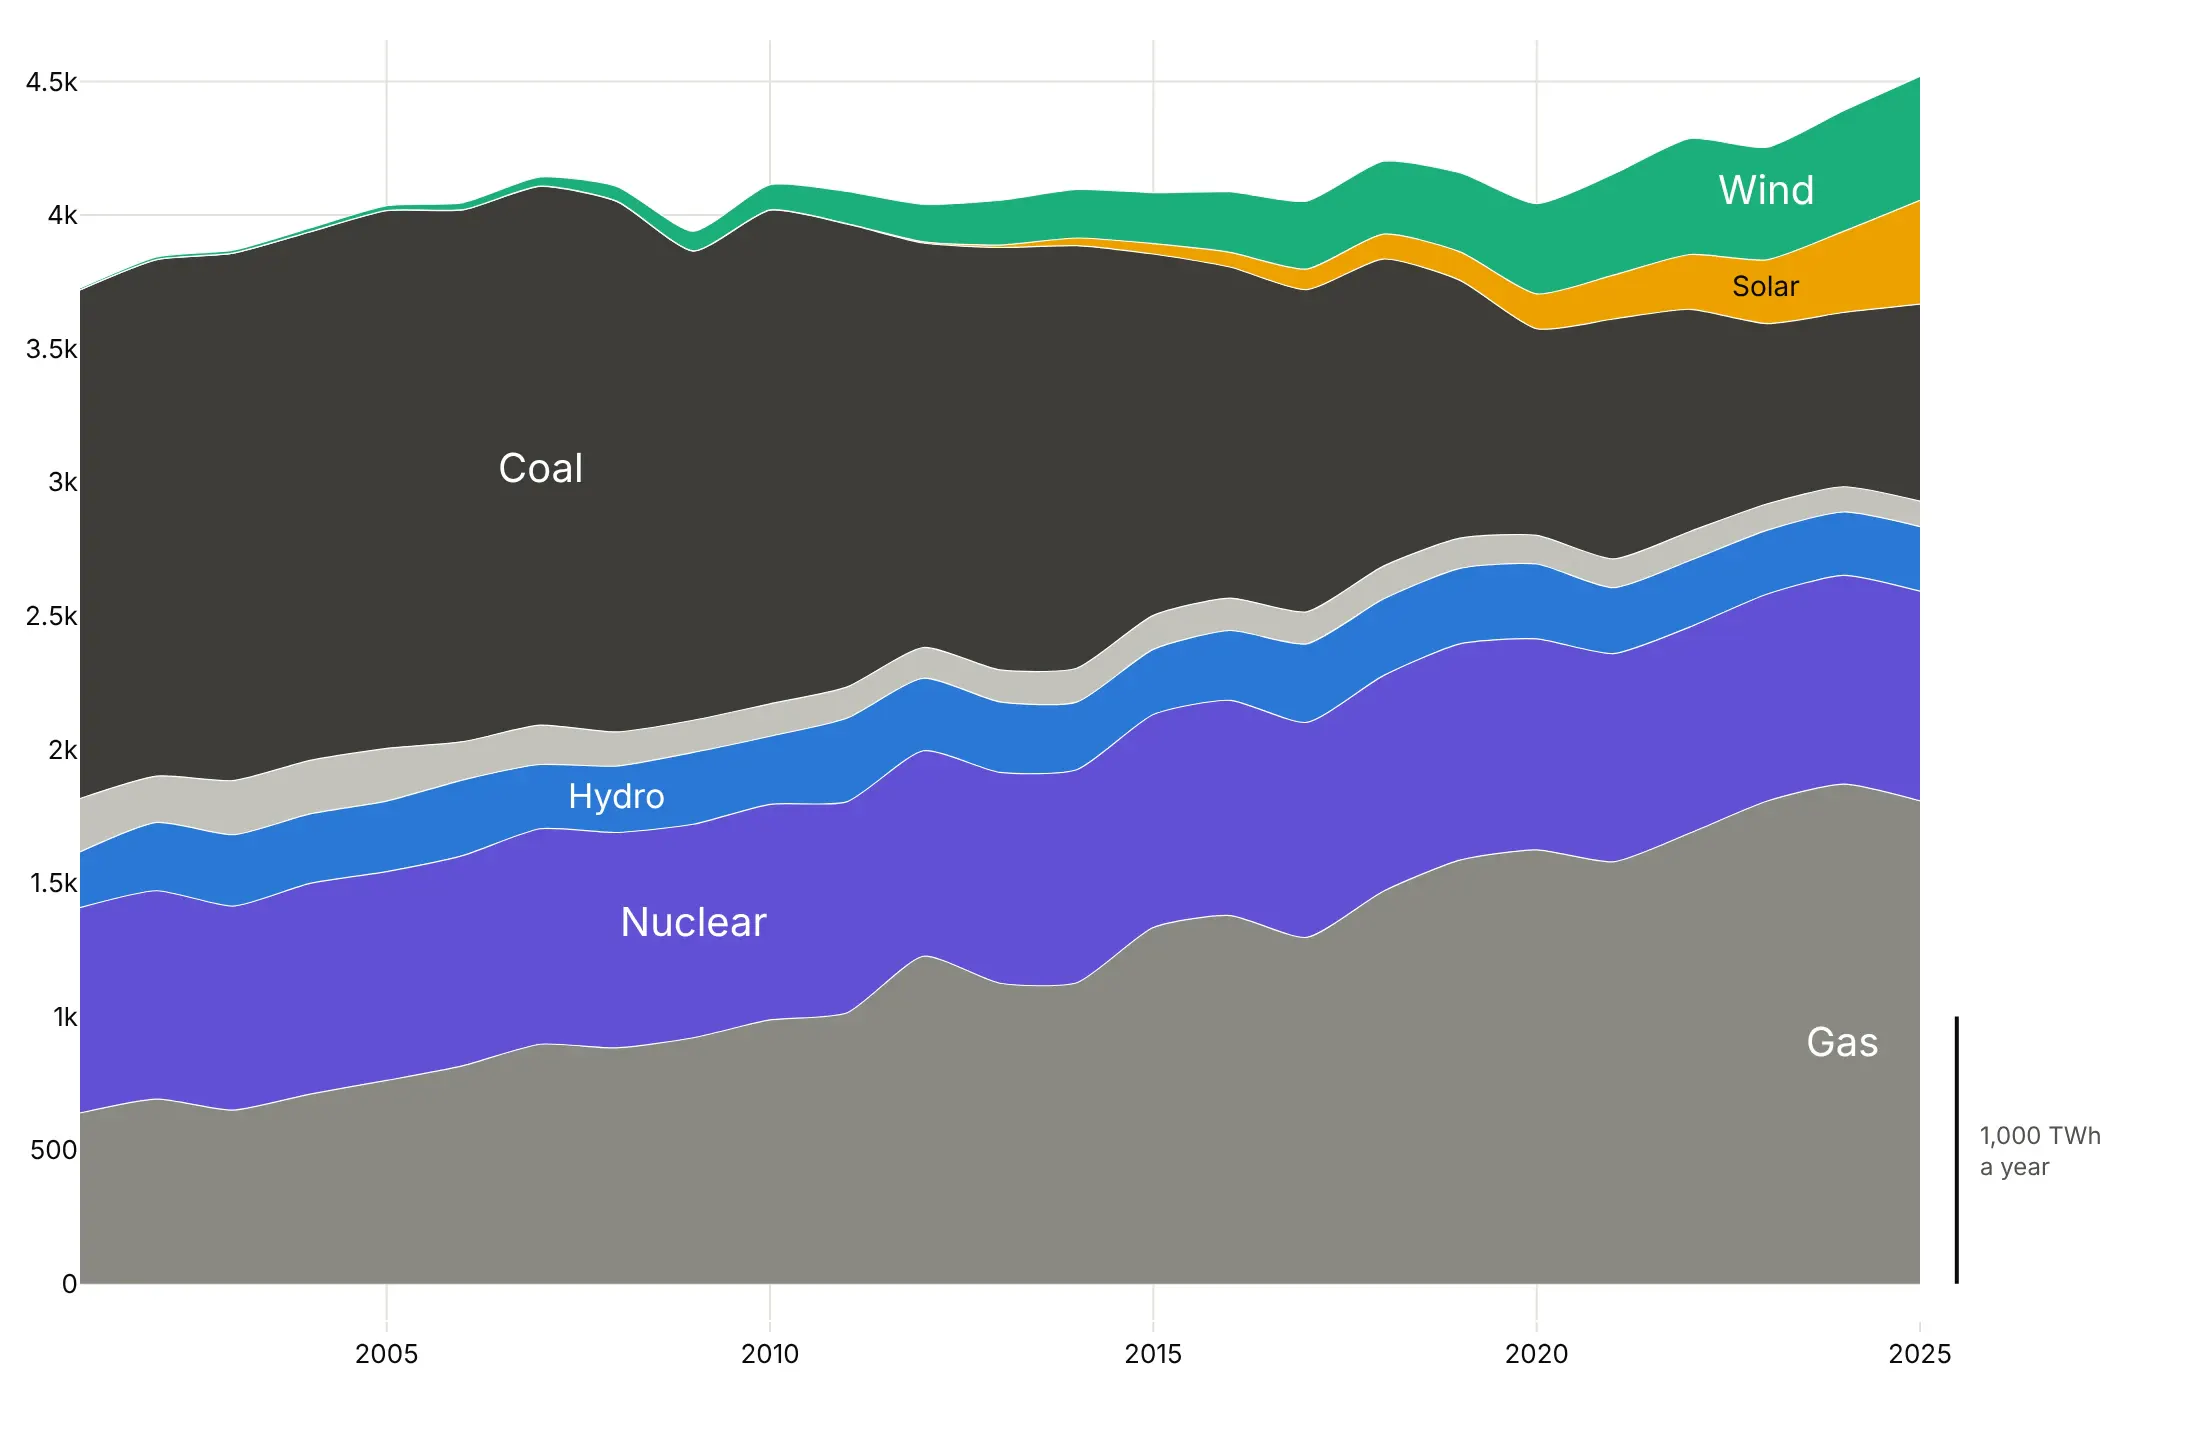
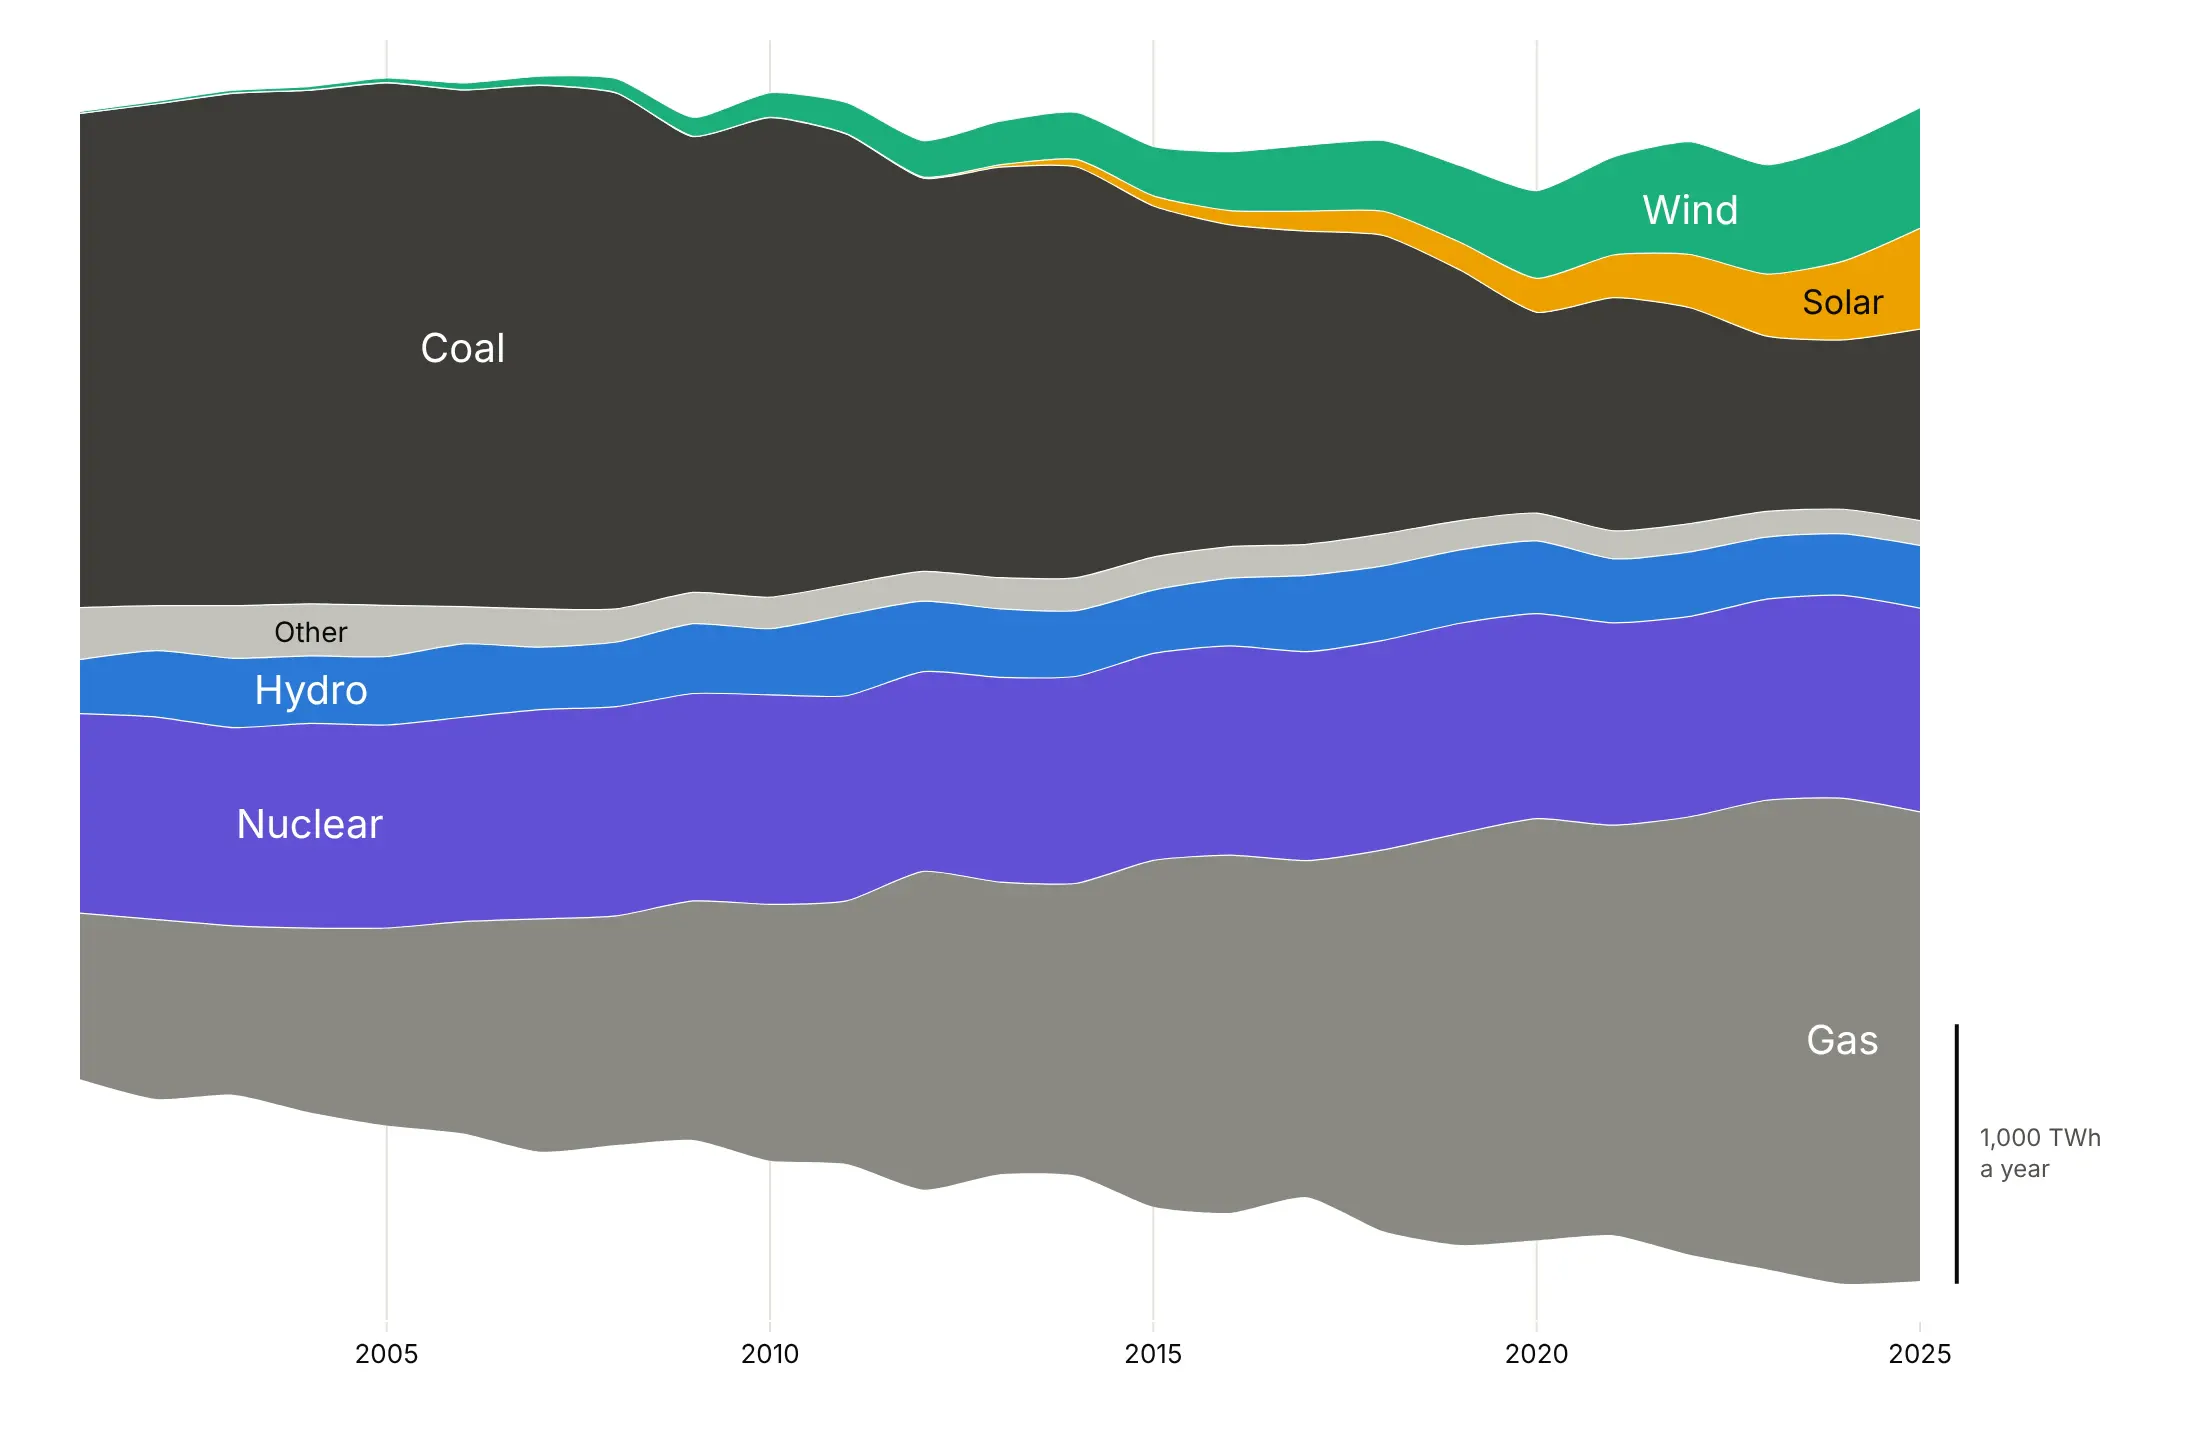
The baseline decides where the stack starts. Here are four on the same annual electricity data.
Zero. An ordinary stacked area chart, where the top edge is the total.
Silhouette. Symmetric around zero, as in ThemeRiver, so the outline shows the total as a width.
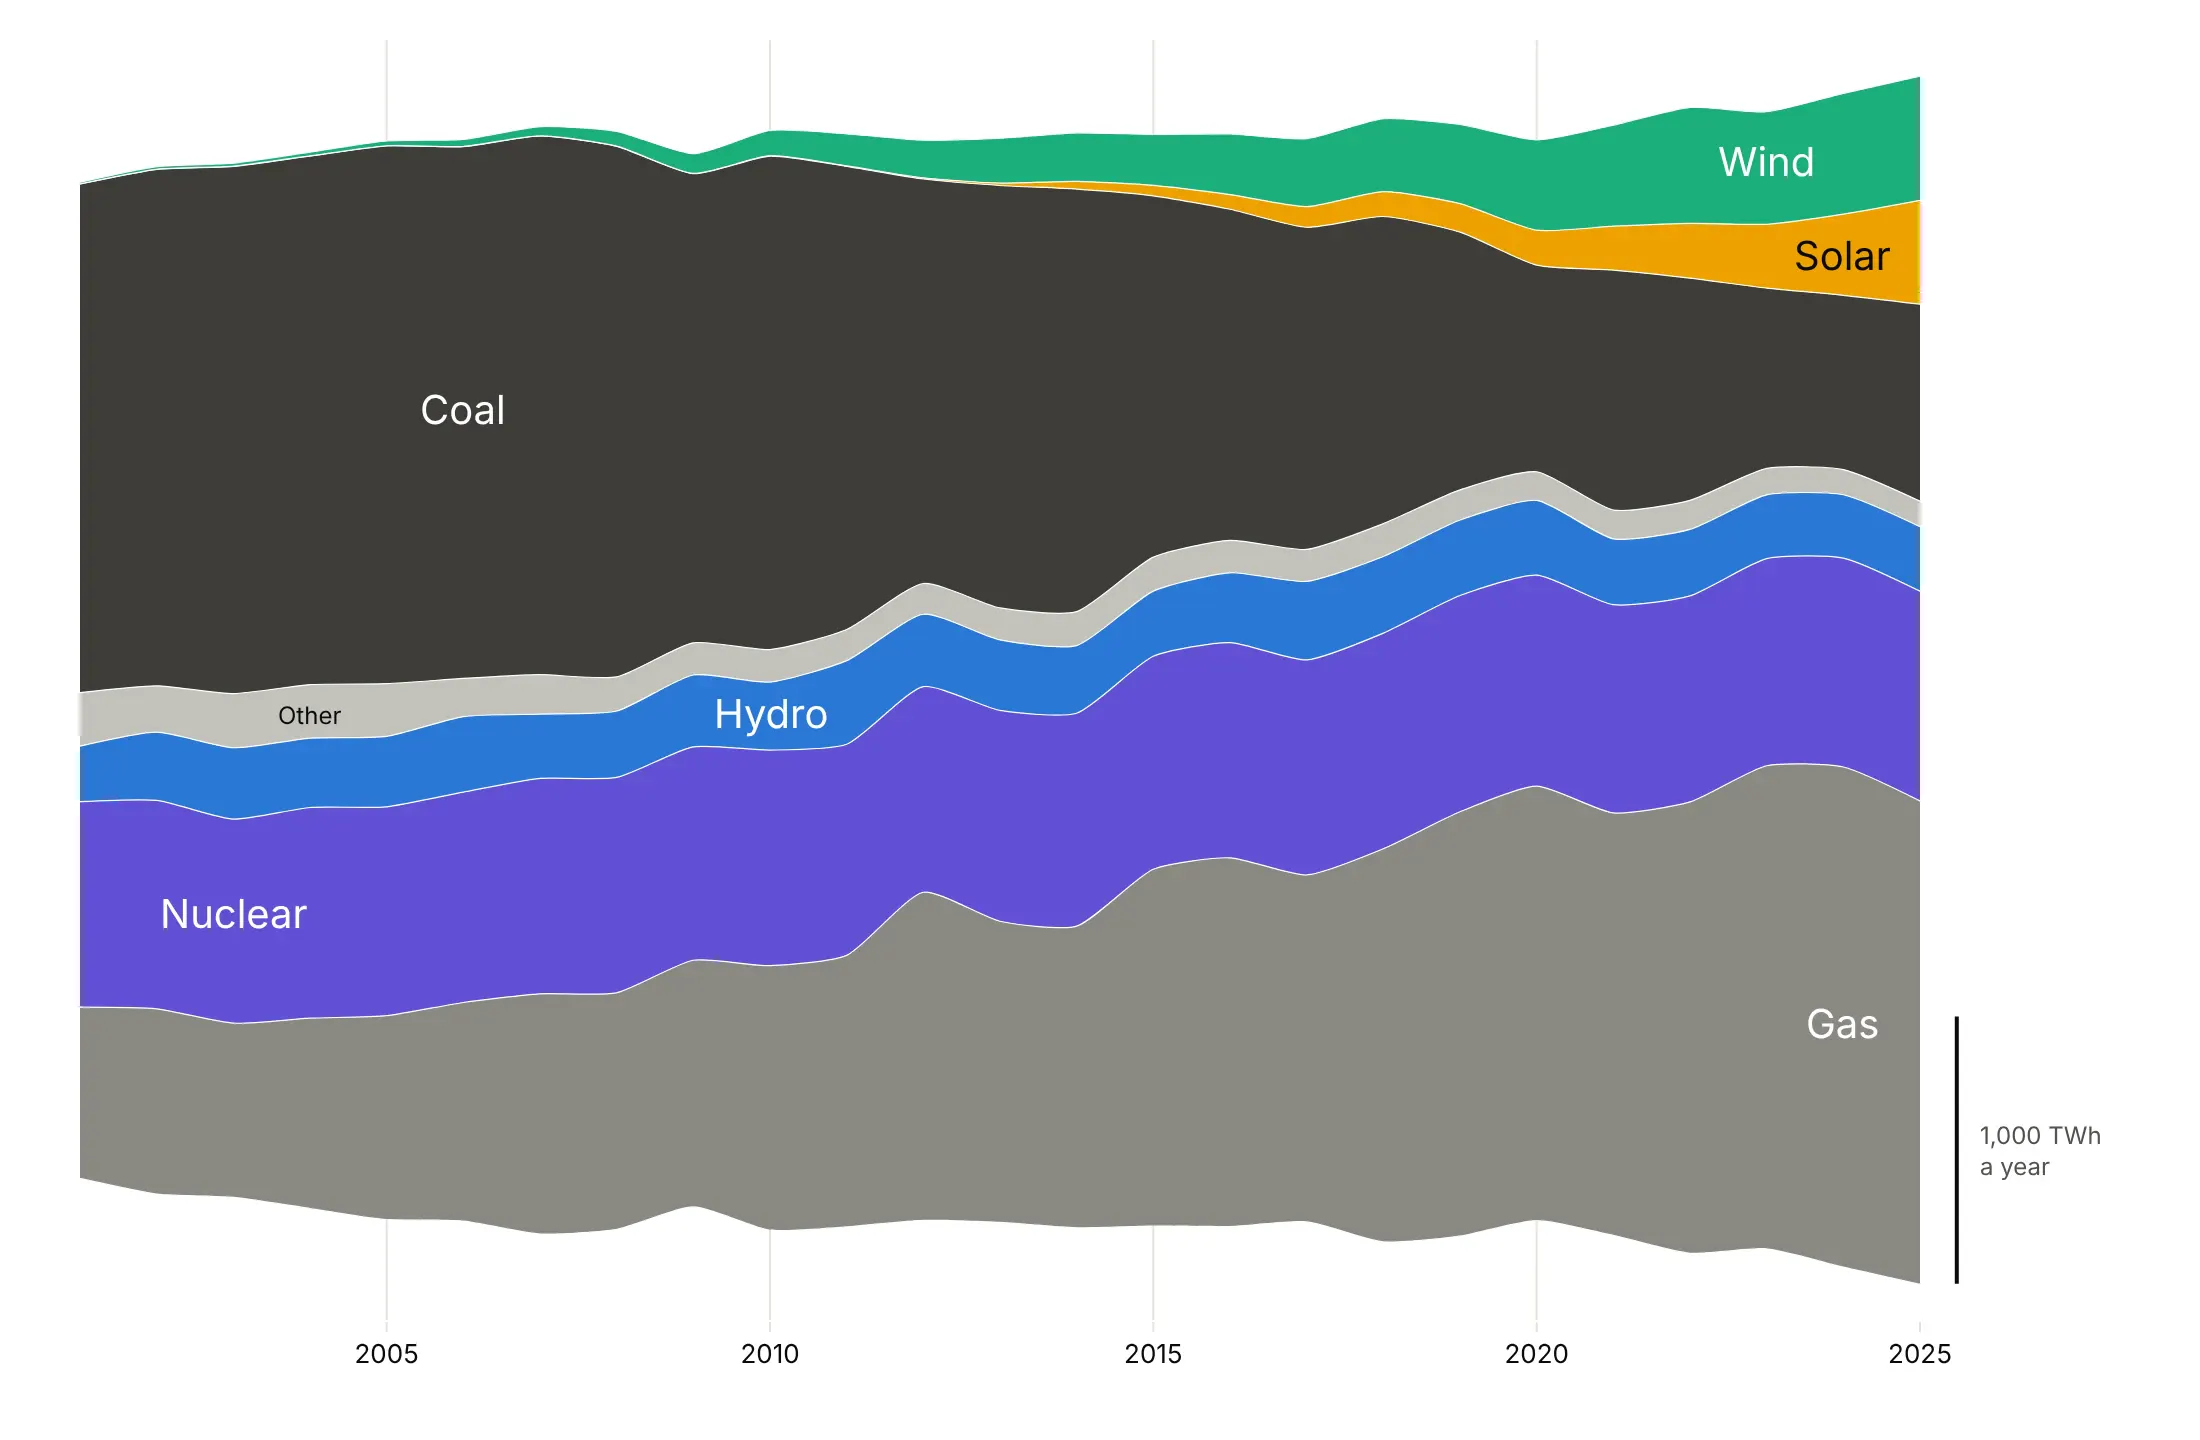
Wiggle. Byron and Wattenberg's baseline moves each year so the layers, weighted by their thickness, tilt as little as possible. It's the best default for reading individual layers.
Normalized. Every year adds up to 100%, so only the mix shows: coal falls from about half to under a fifth.
Order the layers
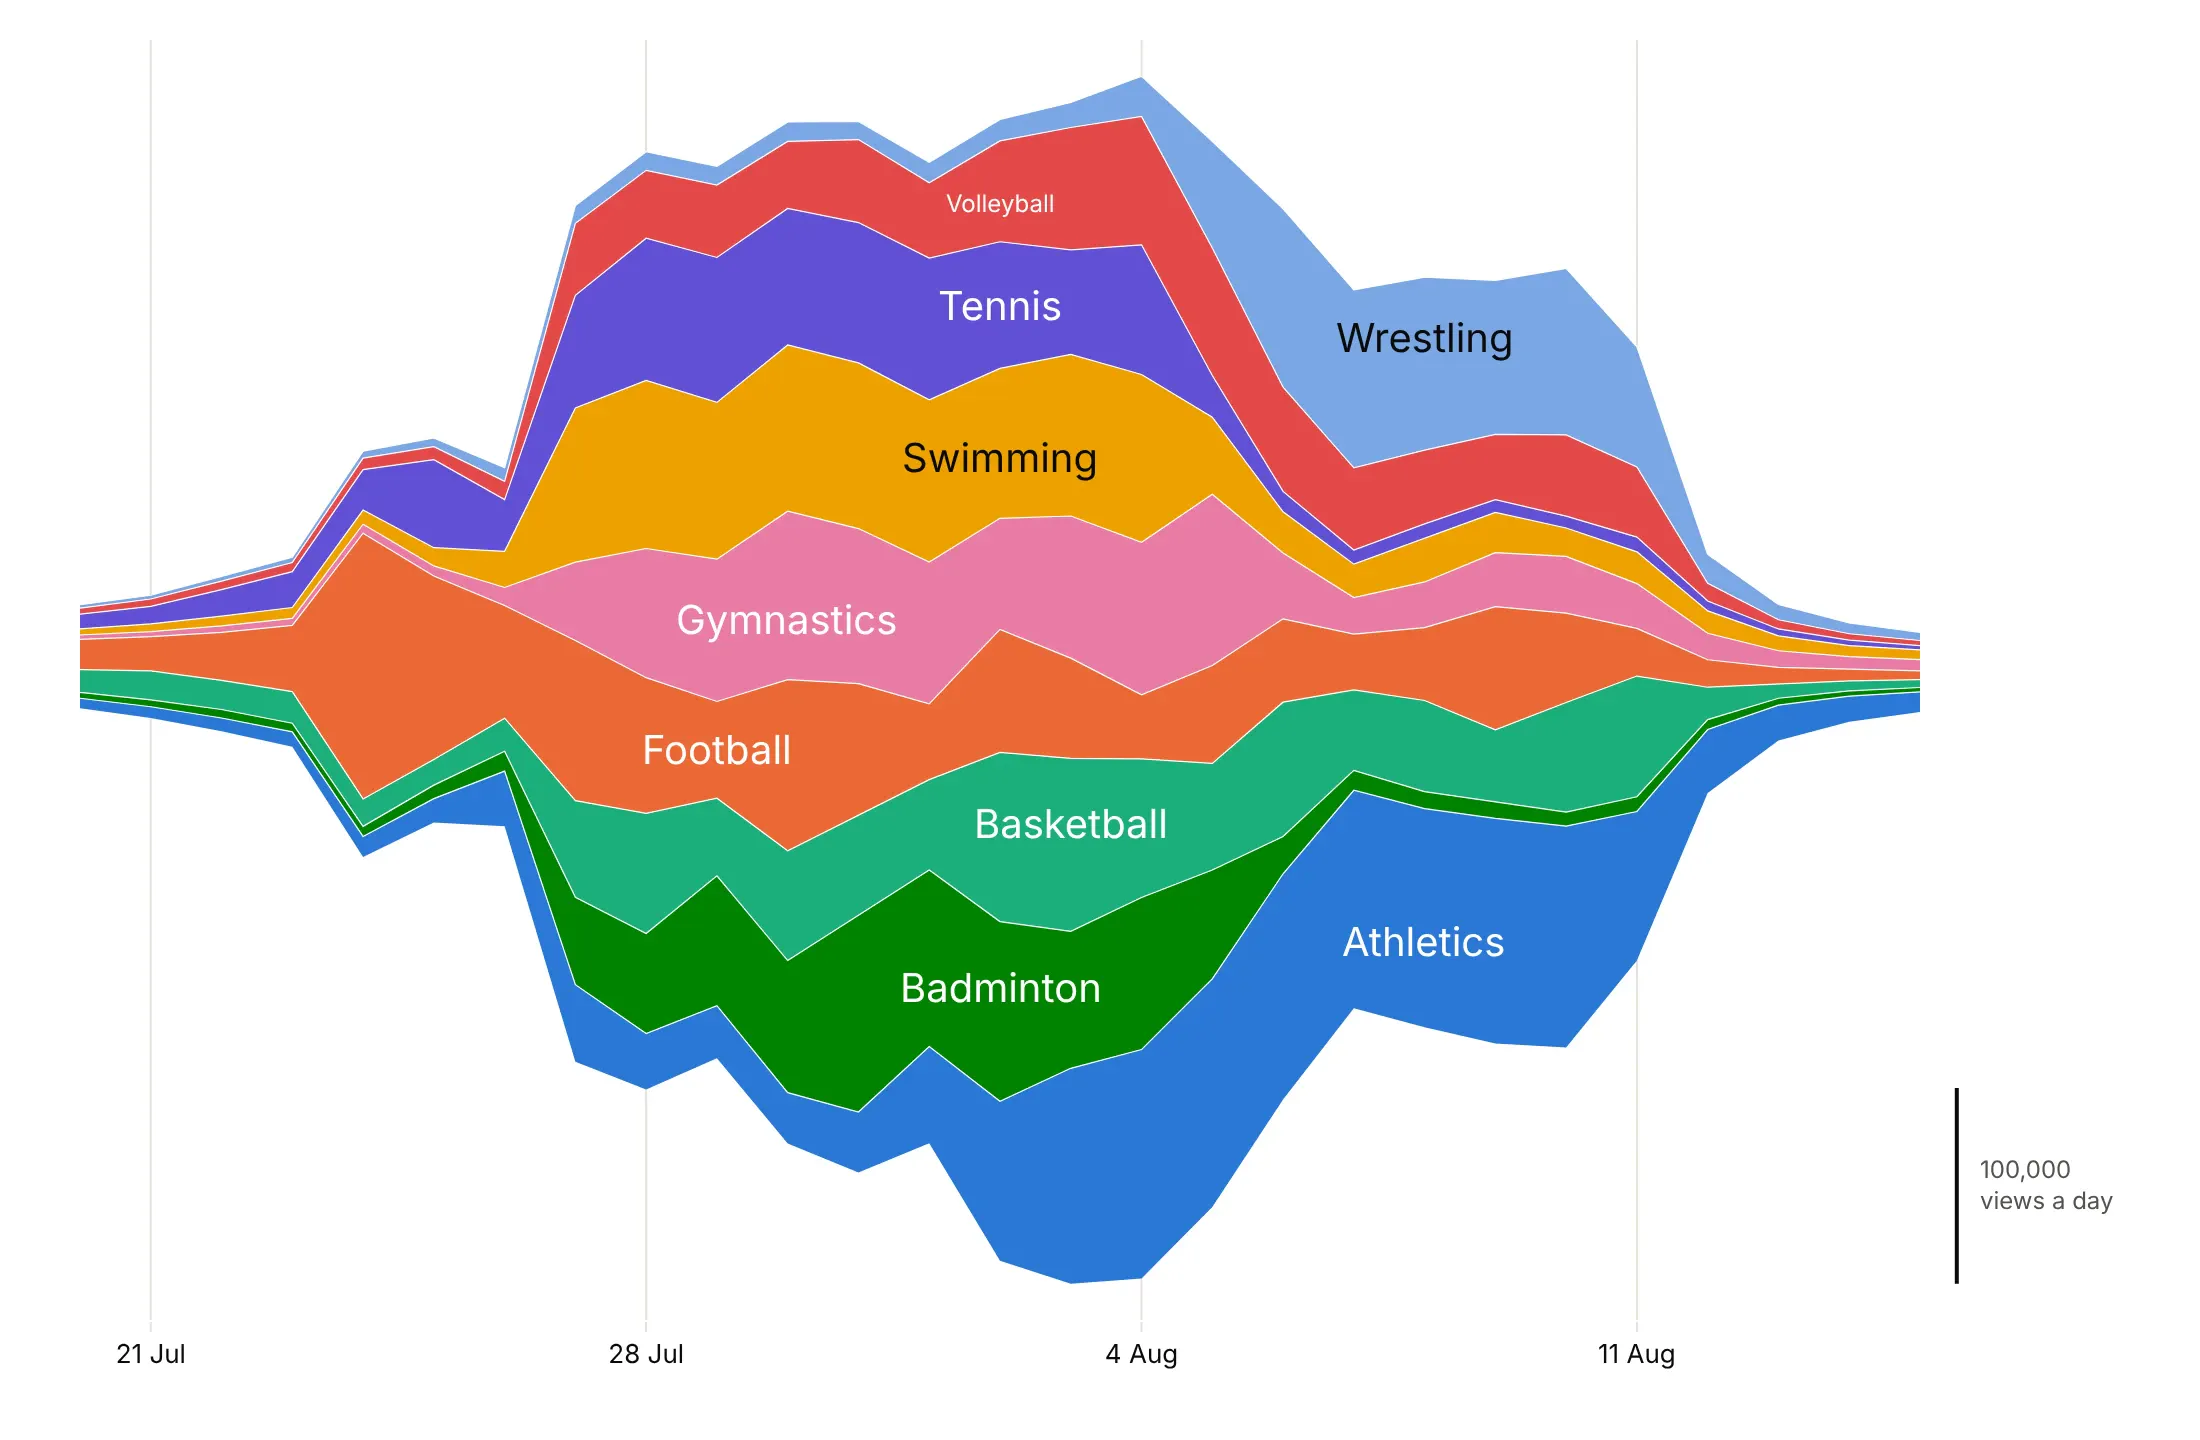
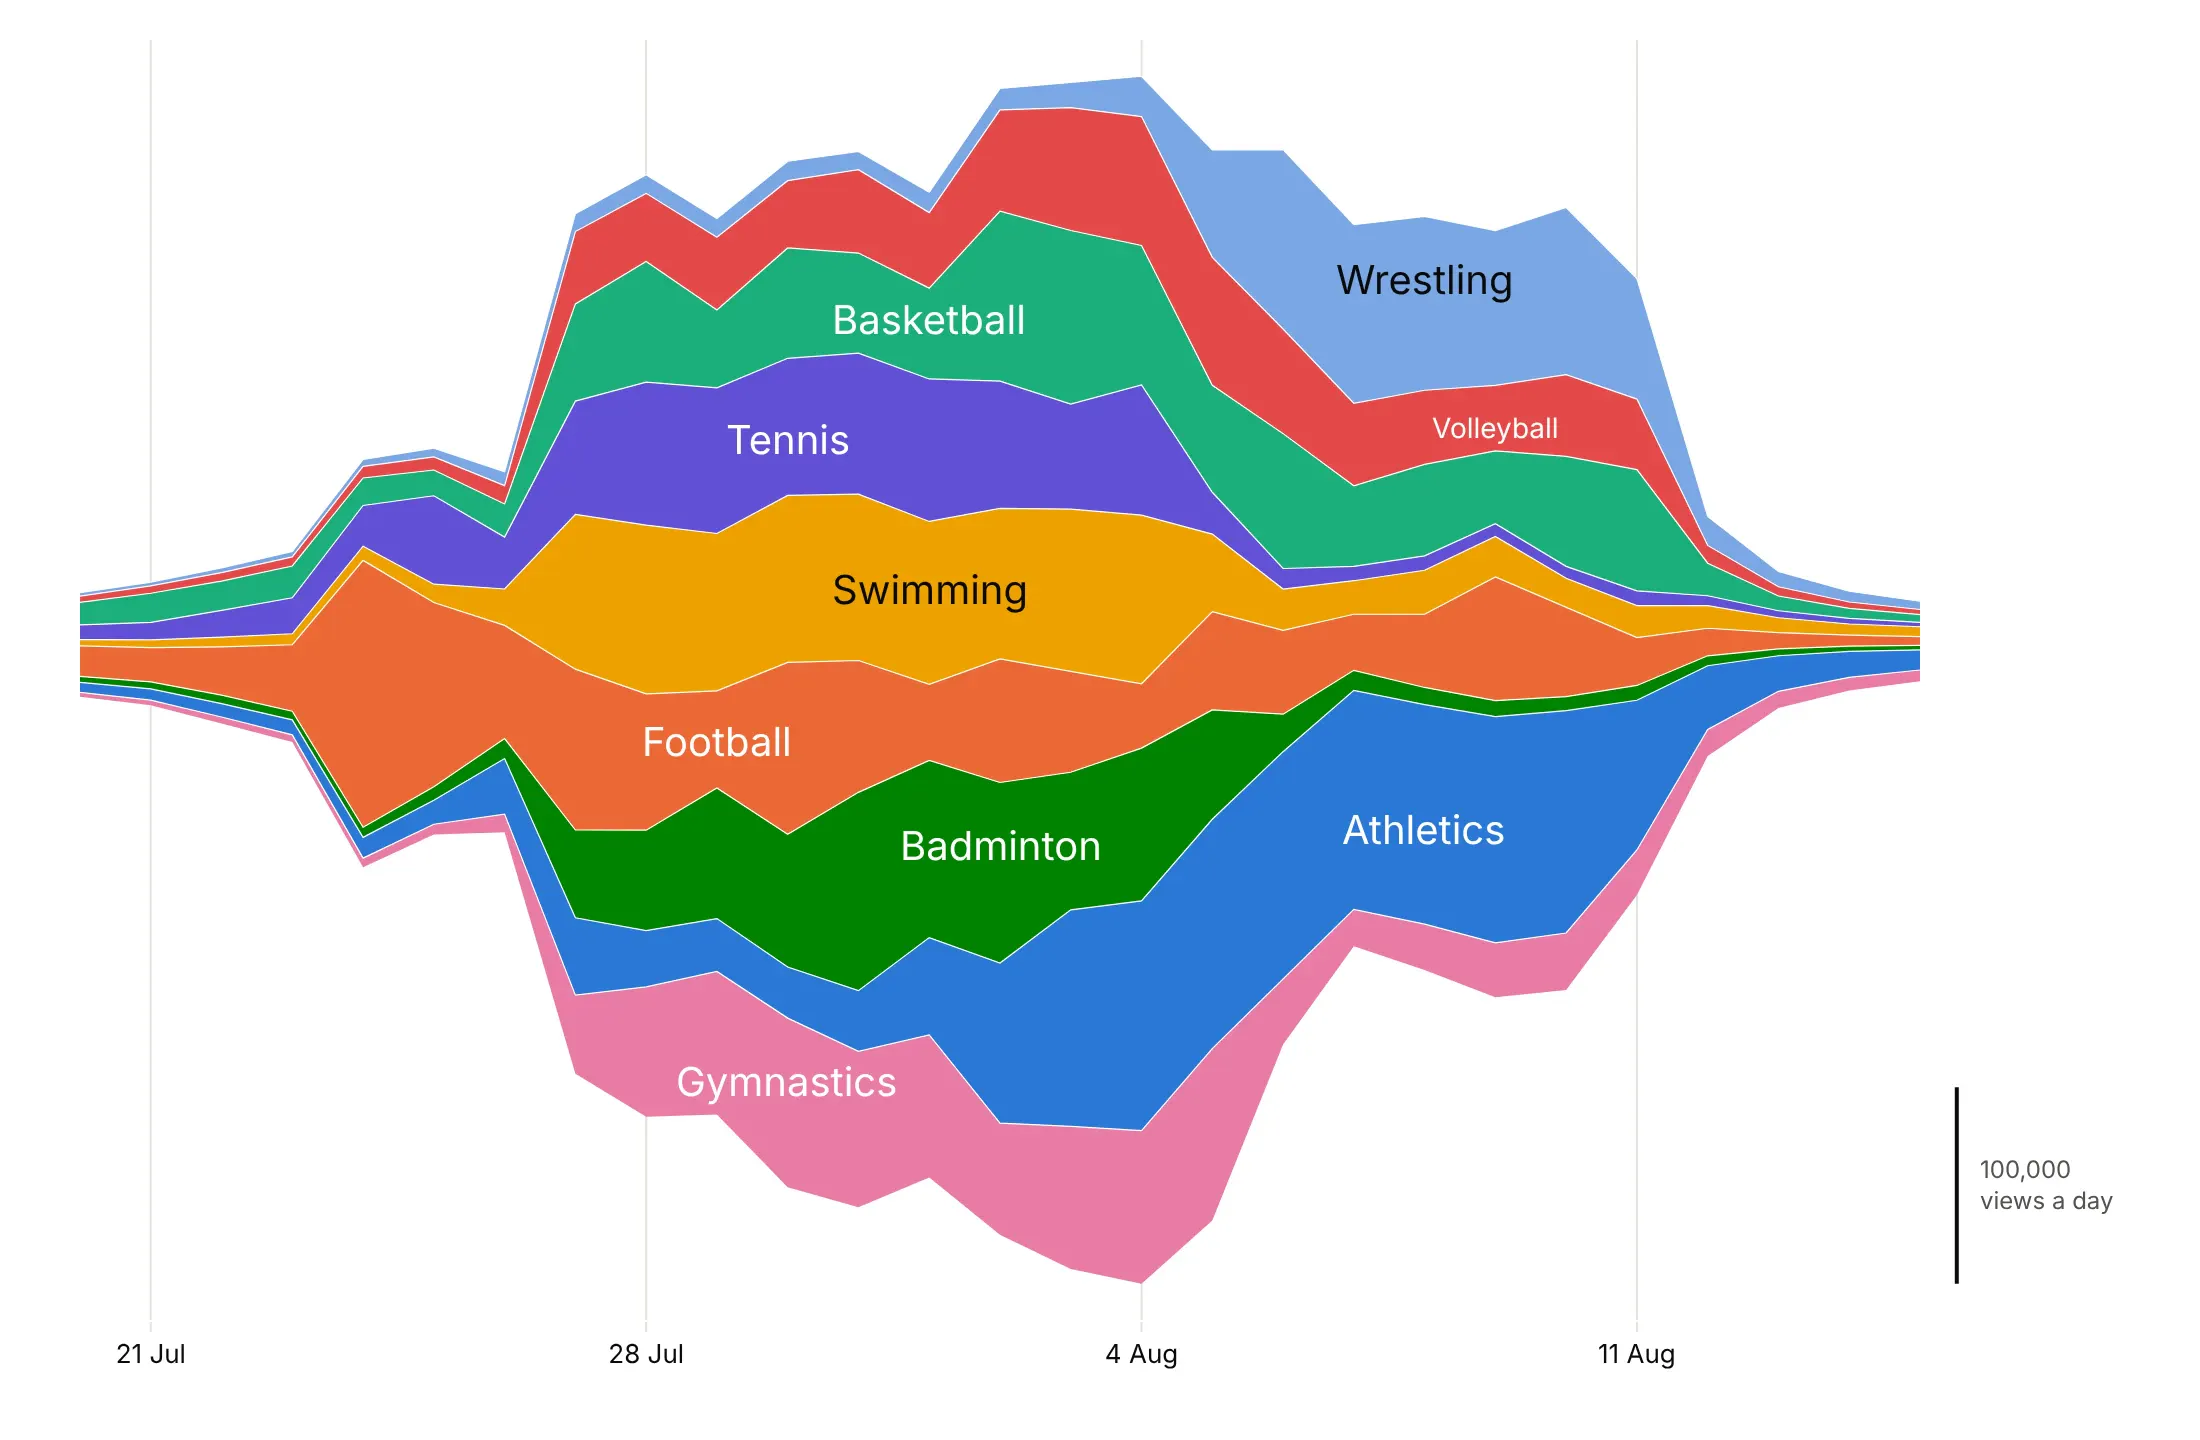
Order matters as much as the baseline. Here are the nine most-viewed Paris 2024 sport articles two ways, both on the wiggle baseline.
Alphabetical. Early and late peaks sit next to each other, and the layers move up and down by 19,024 views a day on average (our measure of Byron and Wattenberg's wiggle).
Inside-out. Layers sorted by the day they peak, earliest in the middle and later ones added alternately above and below. The wiggle drops 9%, to 17,288 views a day, and the first-week sports sit together in the middle.
Checklist
Do
- Write a title that states the takeaway, and label layers inside where they are thickest.
- Smooth or aggregate to the time scale of the story (rolling sums, weeks, years).
- Use the inside-out order, or put steady layers in the middle and spiky ones on the outside.
- Fold small categories into one gray "Other" layer.
- Replace the y axis with a scale bar, and keep exact values in the hover.
Don't
- Show a y axis with negative numbers on a centered stream.
- Use a streamgraph when readers need exact values or the total over time.
- Draw more than about 10-12 colored layers.
- Use splines on a few hundred thousand points; they draw slowly (see the FAQ).
Options to customize
These are the go.Scatter and layout options a streamgraph is built from. The full list is in the Plotly filled area documentation and the scatter reference.
- stackgroup: traces with the same value are stacked on each other, in the order they are added.
- The baseline trace: an invisible first trace in the stackgroup (fill="none", line.width=0, hoverinfo="skip") whose y is the computed baseline.
- fill="tonexty": fills each layer down to the one below it.
- groupnorm="percent": set on the first trace of a stackgroup to make a 100% stacked area chart without computing shares yourself.
- line.shape="spline", line.smoothing: smooth curves through the points; 0.6-1.0 suits yearly data.
- line.width, line.color: a thin white line between layers.
- fillcolor: one fixed color per layer, the same in every chart of the series.
- hovertemplate: the exact value of each layer, for example "Coal: %{y:,.0f} TWh<extra></extra>".
- hovermode="x unified" (layout): one hover box with every layer's value at that date.
- stackgaps: what to do with missing values, infer zero (default) or interpolate.
- yaxis.visible=False (layout): hide an axis whose numbers mean nothing once the baseline moves.
- add_annotation: layer labels inside the stream and a scale bar with add_shape.
- xaxis.dtick, tickformat: years or dates on the time axis.
More streamgraph examples
Ten more streamgraphs built from real public data, each with its source, the technique that makes it work and a prompt to rebuild it.
1. Where US crude oil imports come from
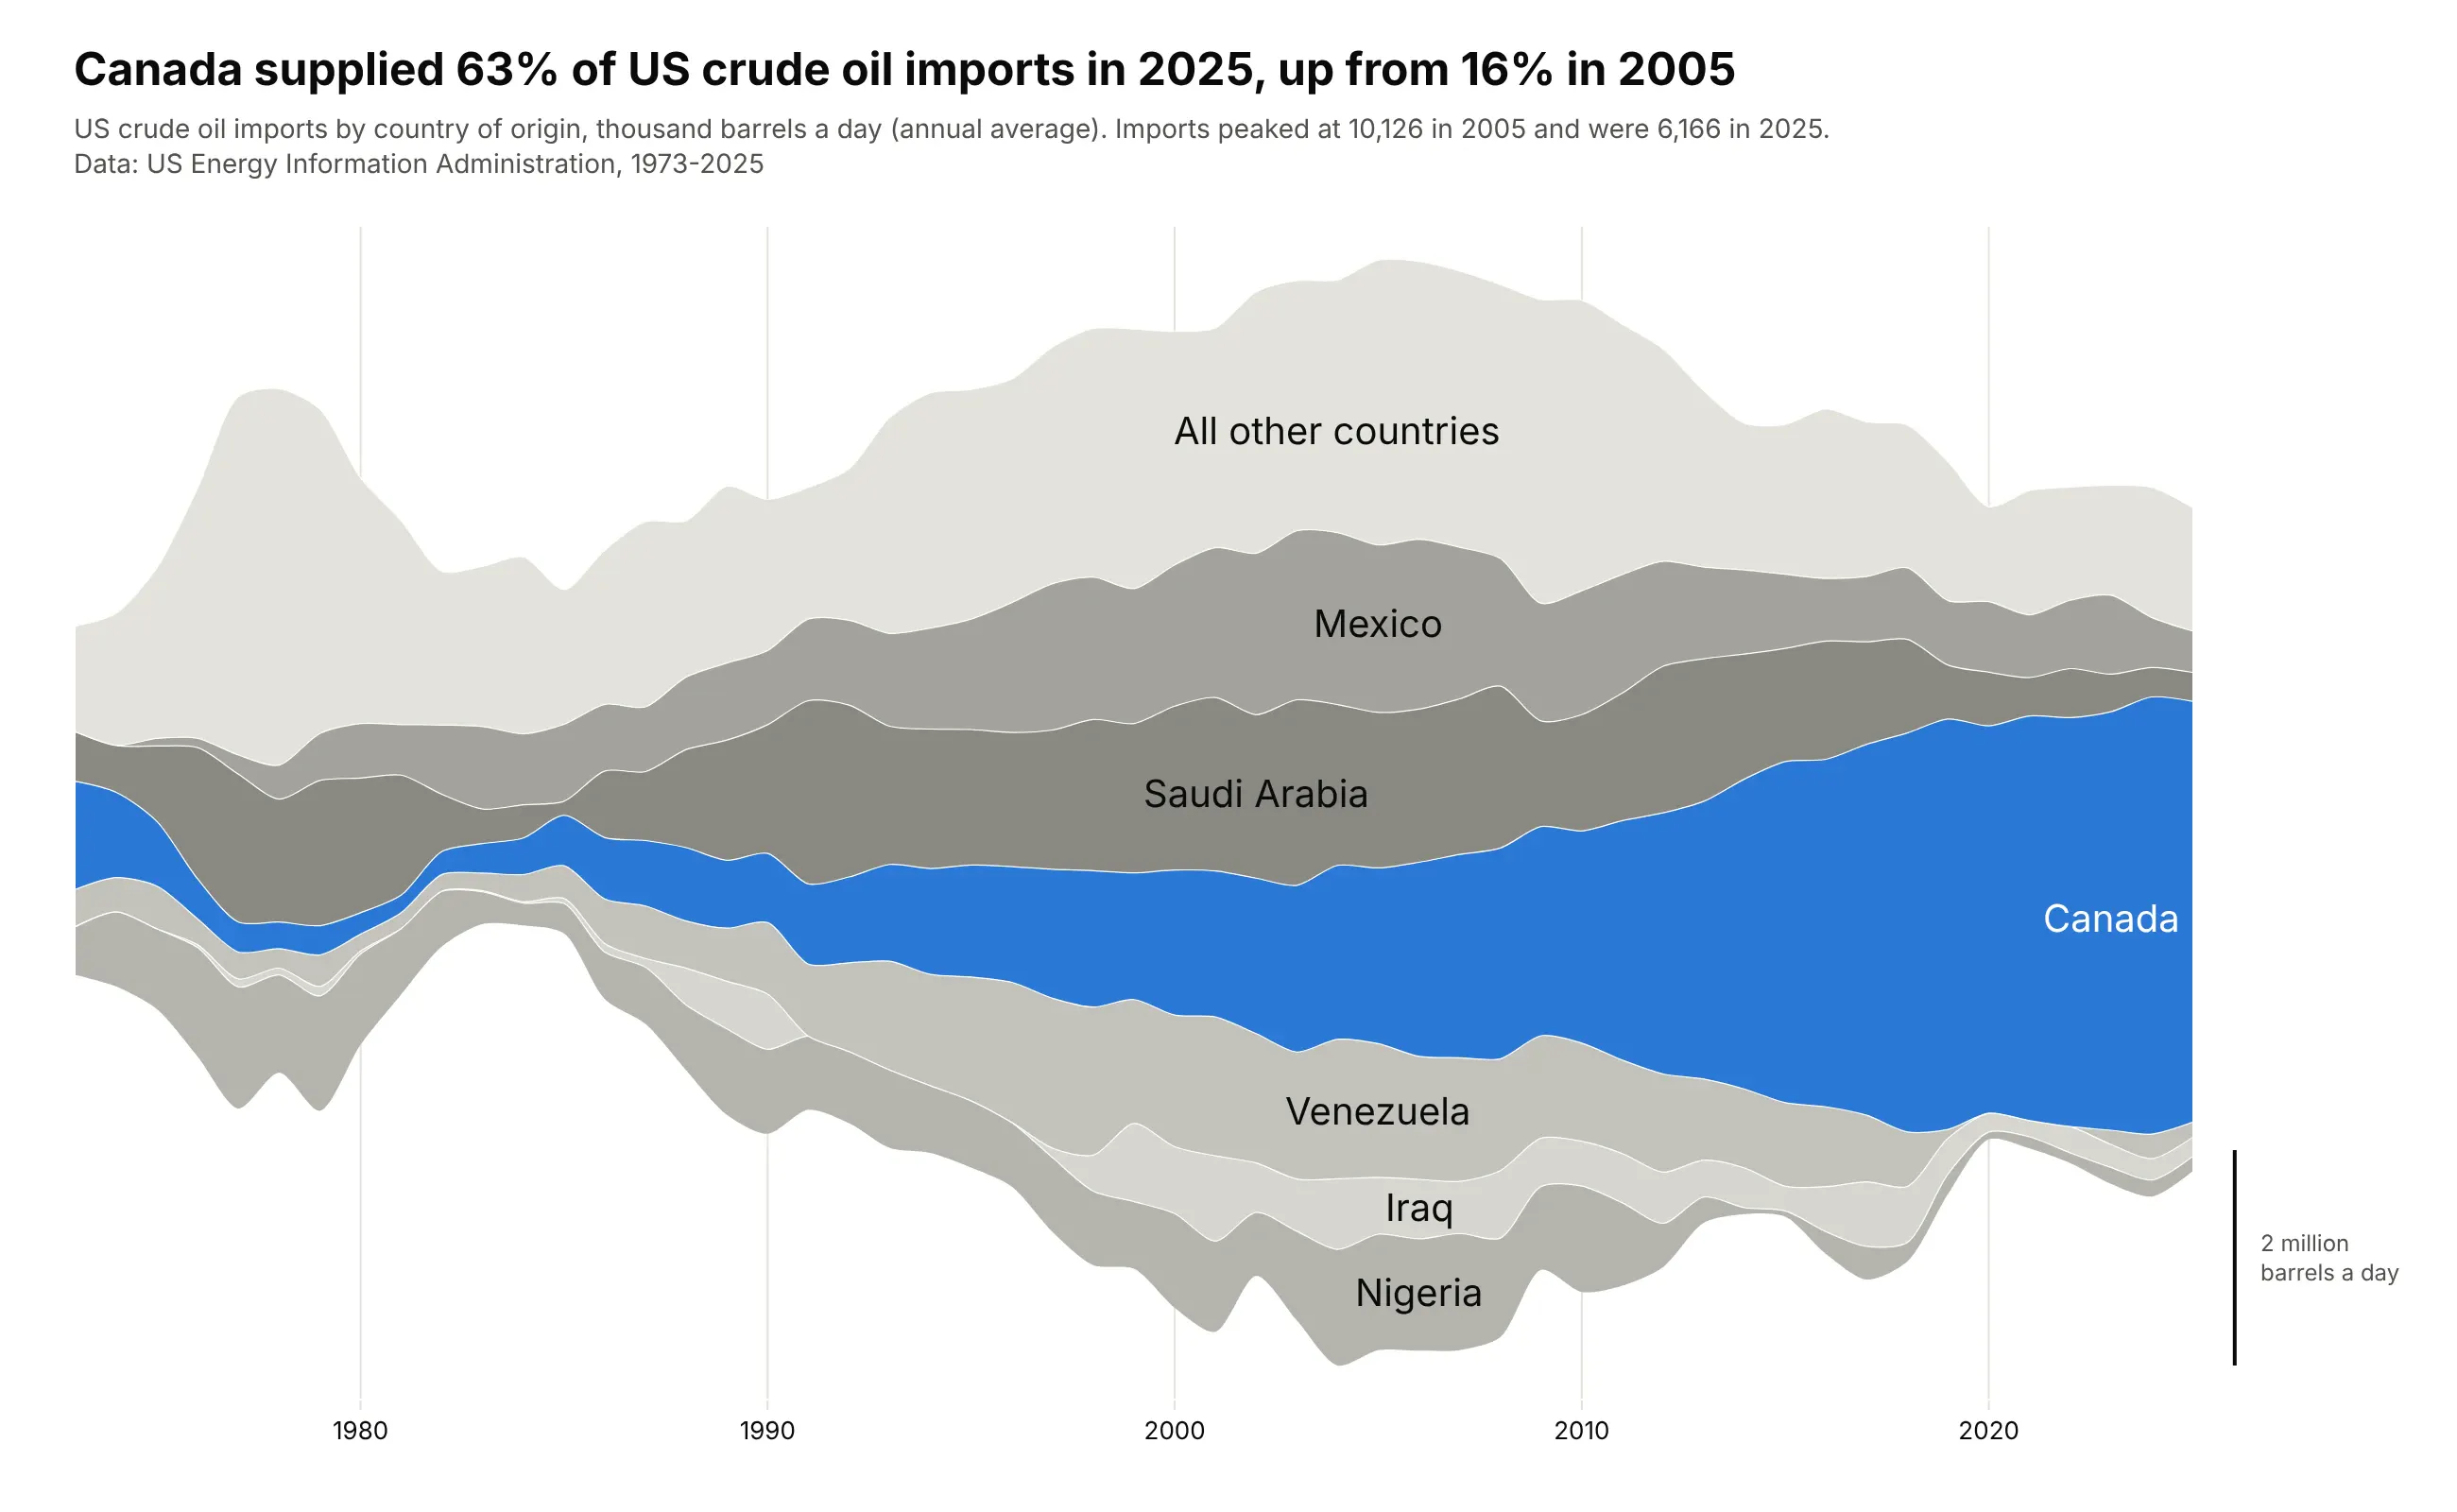
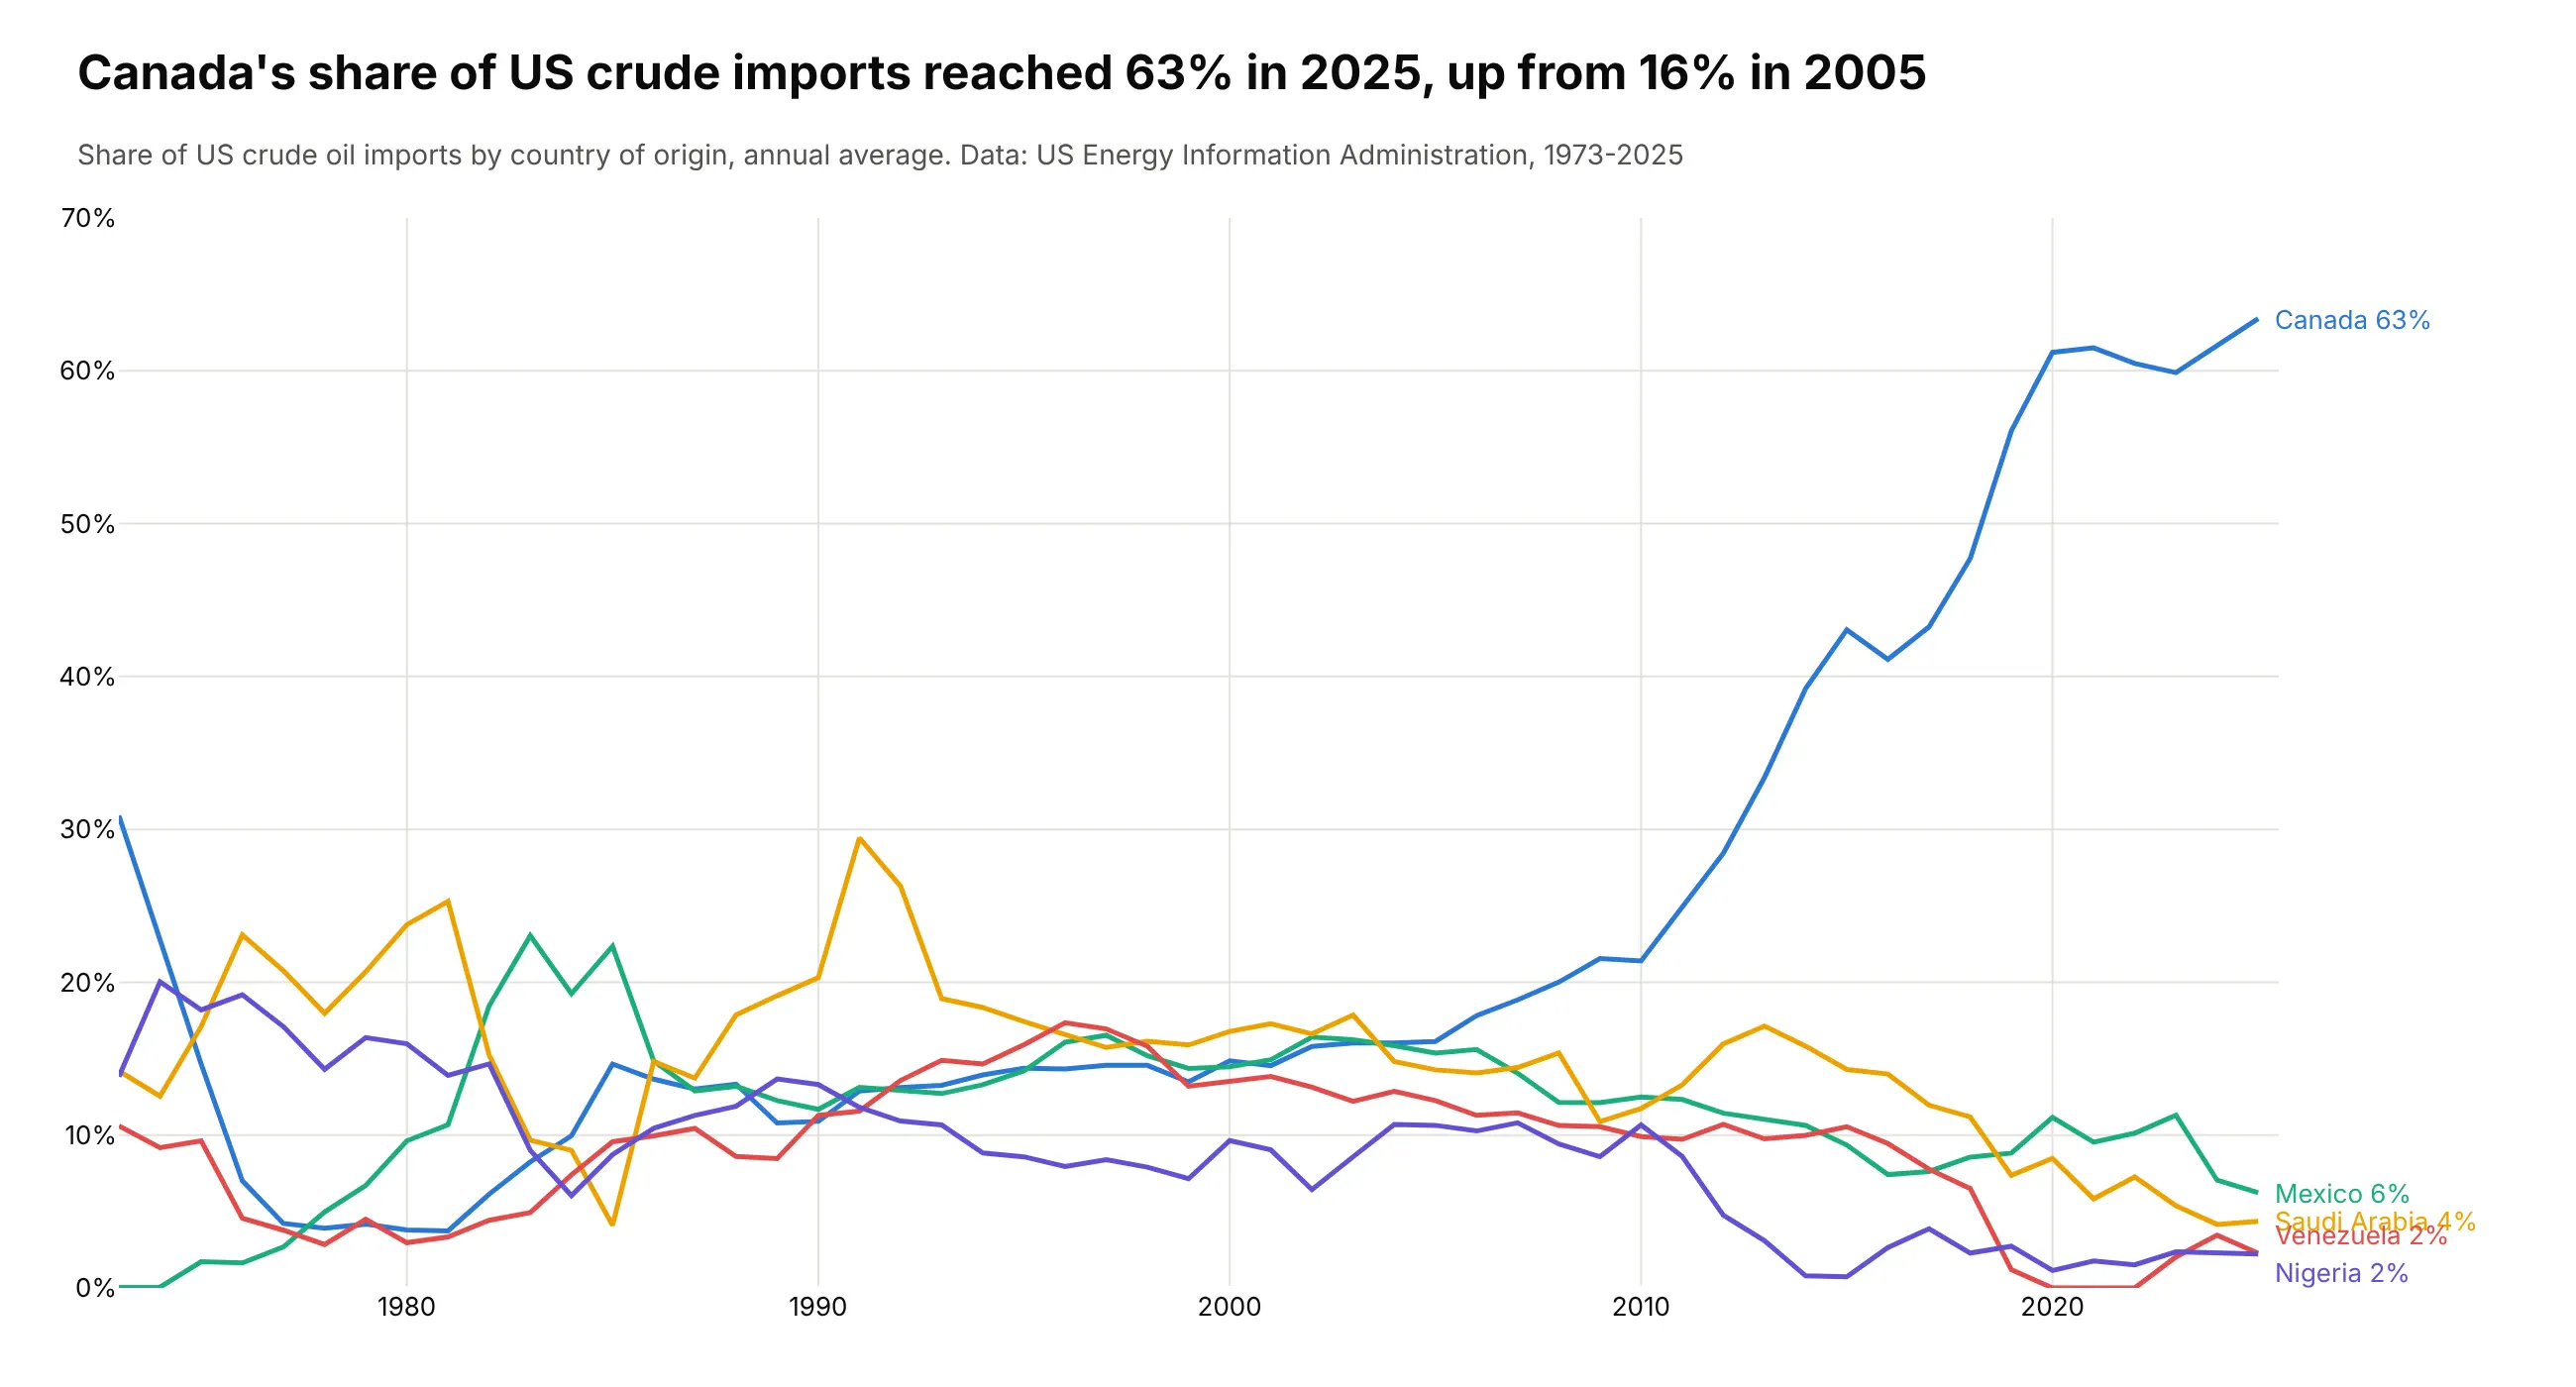
Canada supplied 63% of US crude oil imports in 2025, up from 16% in 2005, while Saudi Arabia, Venezuela, Mexico and Nigeria faded. Total imports peaked at 10,126 thousand barrels a day in 2005 and were 6,166 in 2025. Data: US Energy Information Administration, imports by country of origin, 1973-2025.
Tip: one highlighted layer on gray neighbors makes the main story read first, and the grays still show who Canada replaced.
Get the data from the US Energy Information Administration's crude oil imports by country of origin(eia.gov, series PET_MOVE_IMPCUS_A2_NUS_EPC0_IM0_MBBLPD_M, monthly, thousand barrels per day)and shape it into a table of annual averages(columns: year, country, kbd; 1973-2025; countries that never reach 5% of imports in a yearsummed into "All other countries" as the EIA total minus the named countries).Make a plotly streamgraph of imports by country with the wiggle baseline.- Keep Canada, Mexico, Saudi Arabia, Venezuela, Nigeria and Iraq; fold the rest into "All other countries".- Canada blue, every other layer a different light gray; labels inside the layers.- Splines through the yearly points (smoothing 0.8), a scale bar for 2 million barrels a day.- Title with Canada's share in 2025 and 2005.
Another way to see it: a line chart of each supplier's share shows the climb exactly (Canada passed 60% in 2020), but loses the fall in total imports since 2005.
2. Who emits the world's CO2
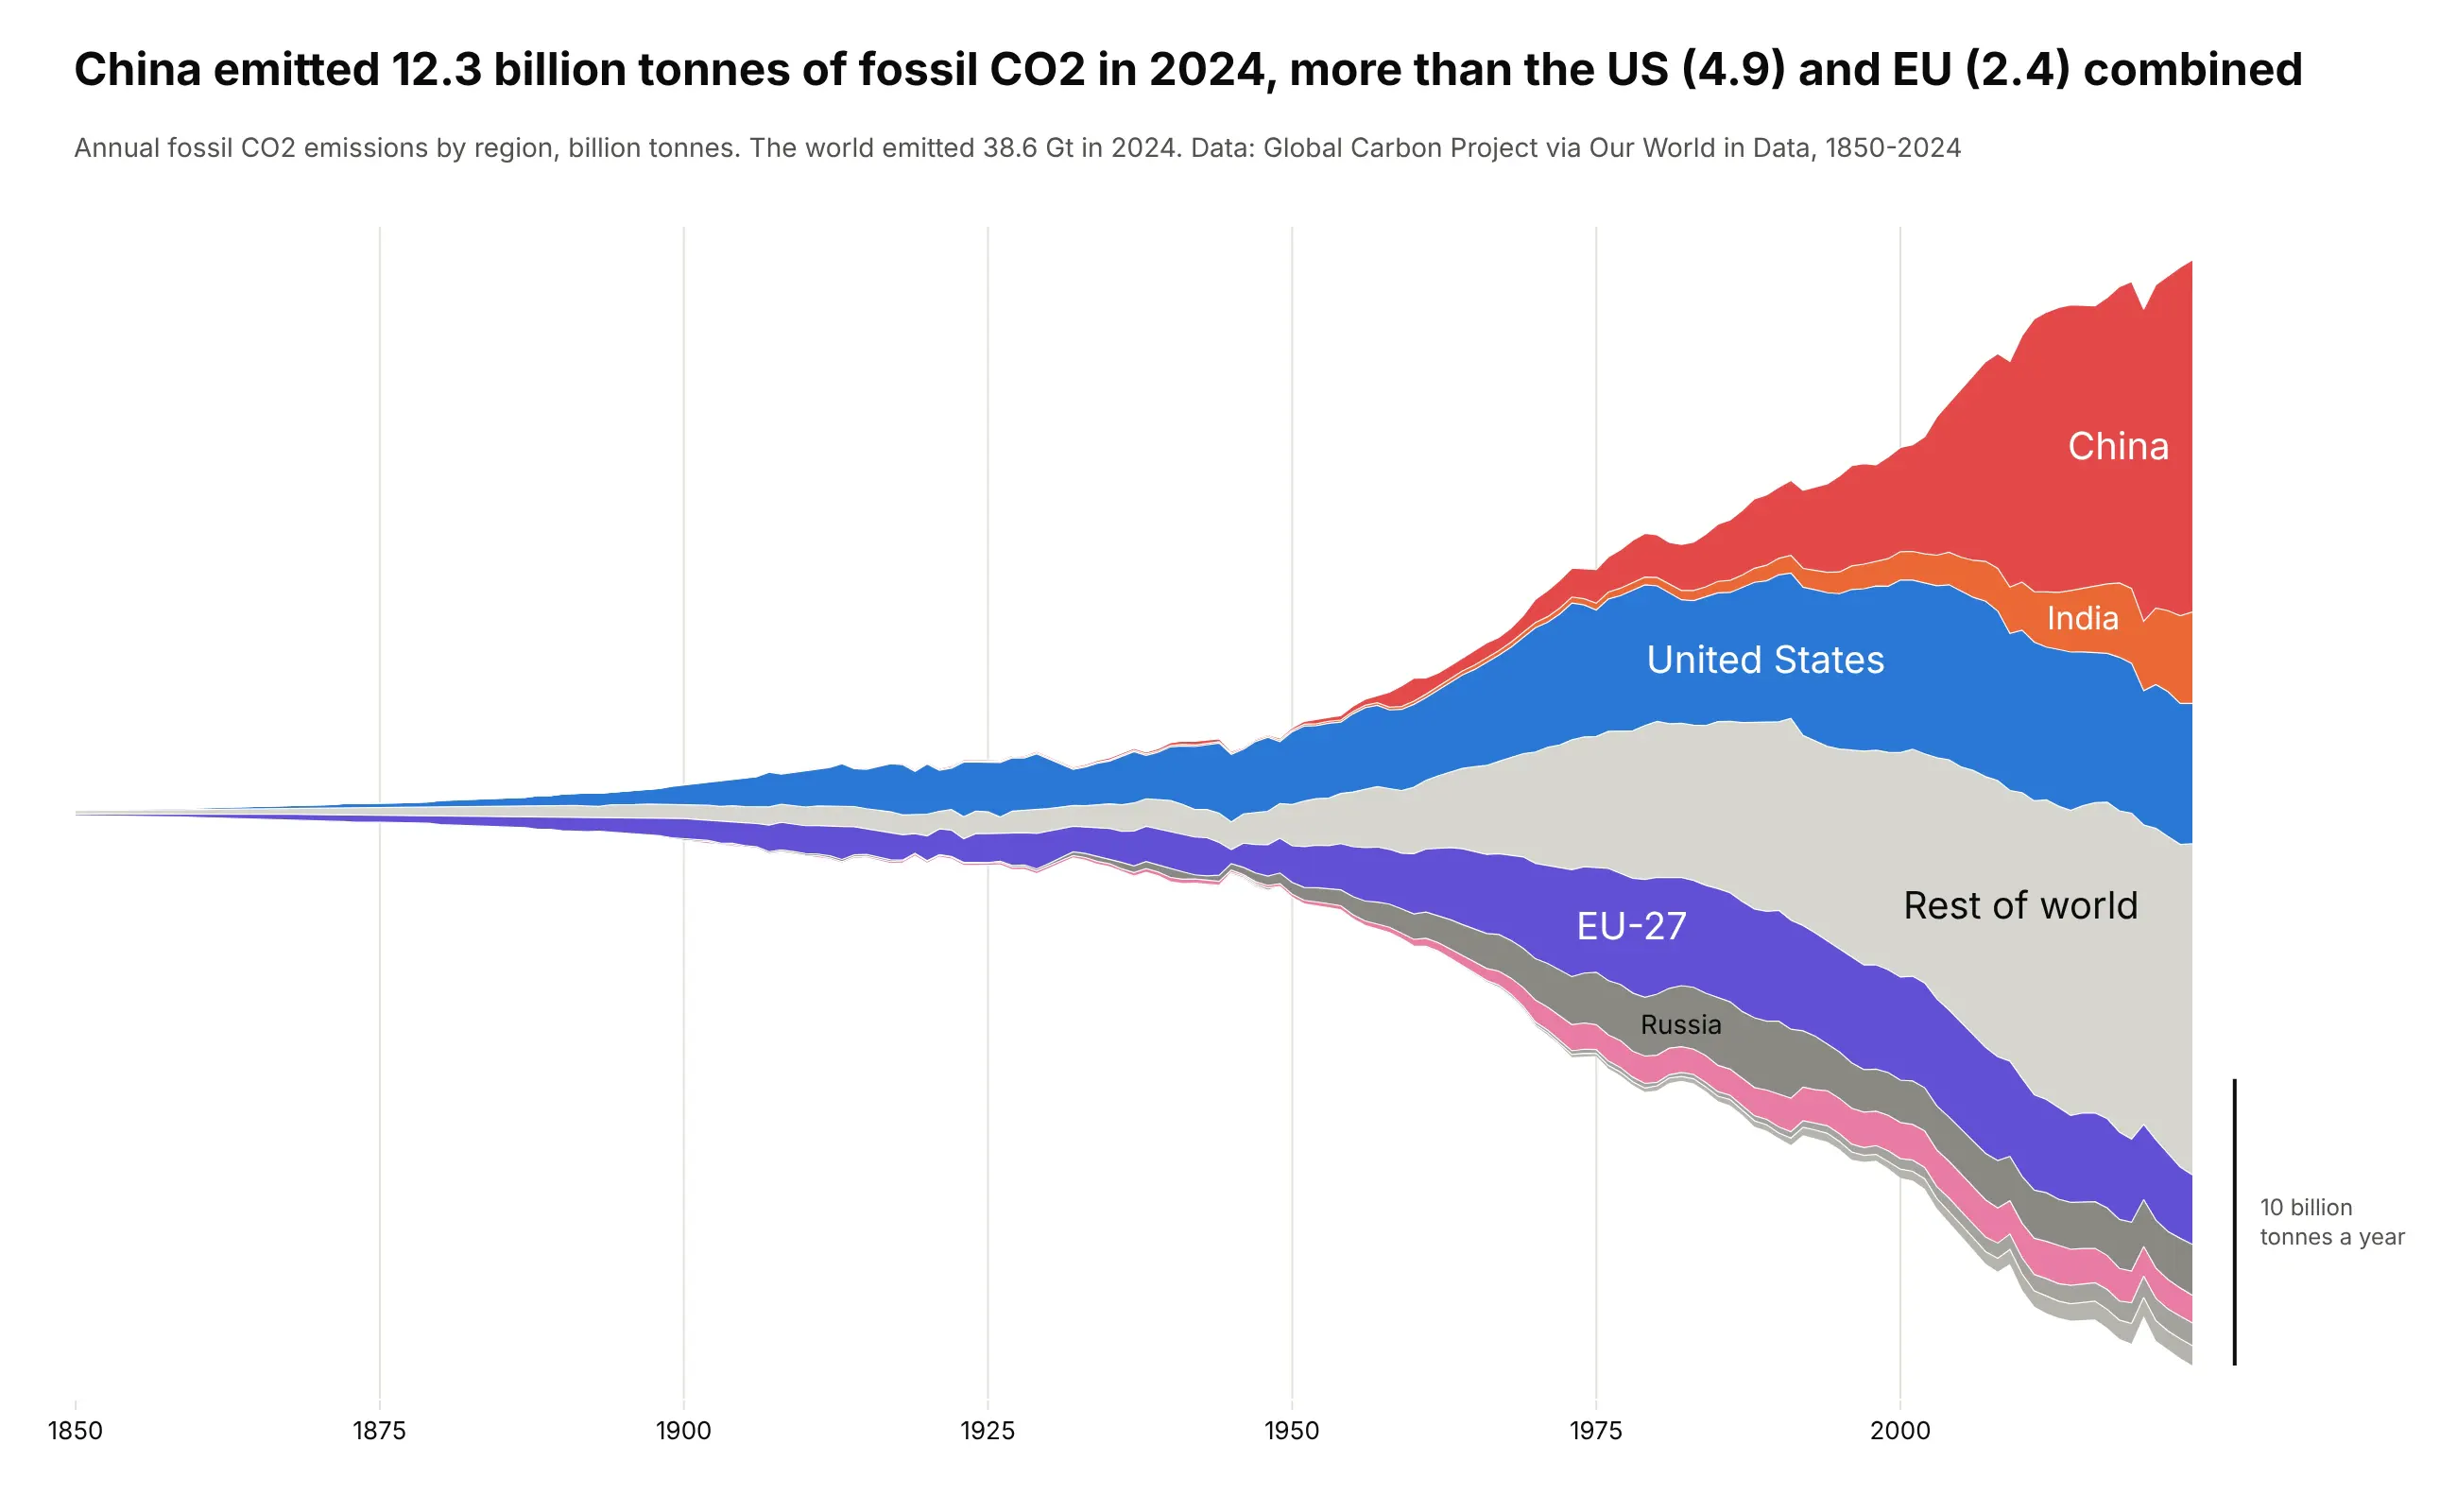
China emitted 12.3 billion tonnes of fossil CO2 in 2024, more than the US (4.9) and the EU (2.4) combined, out of 38.6 billion for the world. The stream starts as a thread in 1850 and shows who drove each era of growth. Data: Global Carbon Project via Our World in Data.
Tip: the silhouette baseline keeps the stream symmetric, so its width reads as the world total, which matters here as much as the layers.
Get the data from Our World in Data's CO2 dataset (github.com/owid/co2-data), column co2 (fossil CO2, Mt)and shape it into a table(columns: year, region, mt; 1850-2024; China, United States, European Union (27), India, Russia,Japan, Iran, Saudi Arabia and "Rest of world" = World minus those, so each year adds up to World).Make a plotly streamgraph with the silhouette baseline (each year starts at minus half its total).- Order the layers by when each region industrialized, China on the outside, rest of world in light gray.- Convert to billion tonnes, labels inside the layers, a scale bar for 10 billion tonnes a year.- Title comparing China's 2024 emissions with the US and EU combined.
3. Foreign holders of US Treasuries
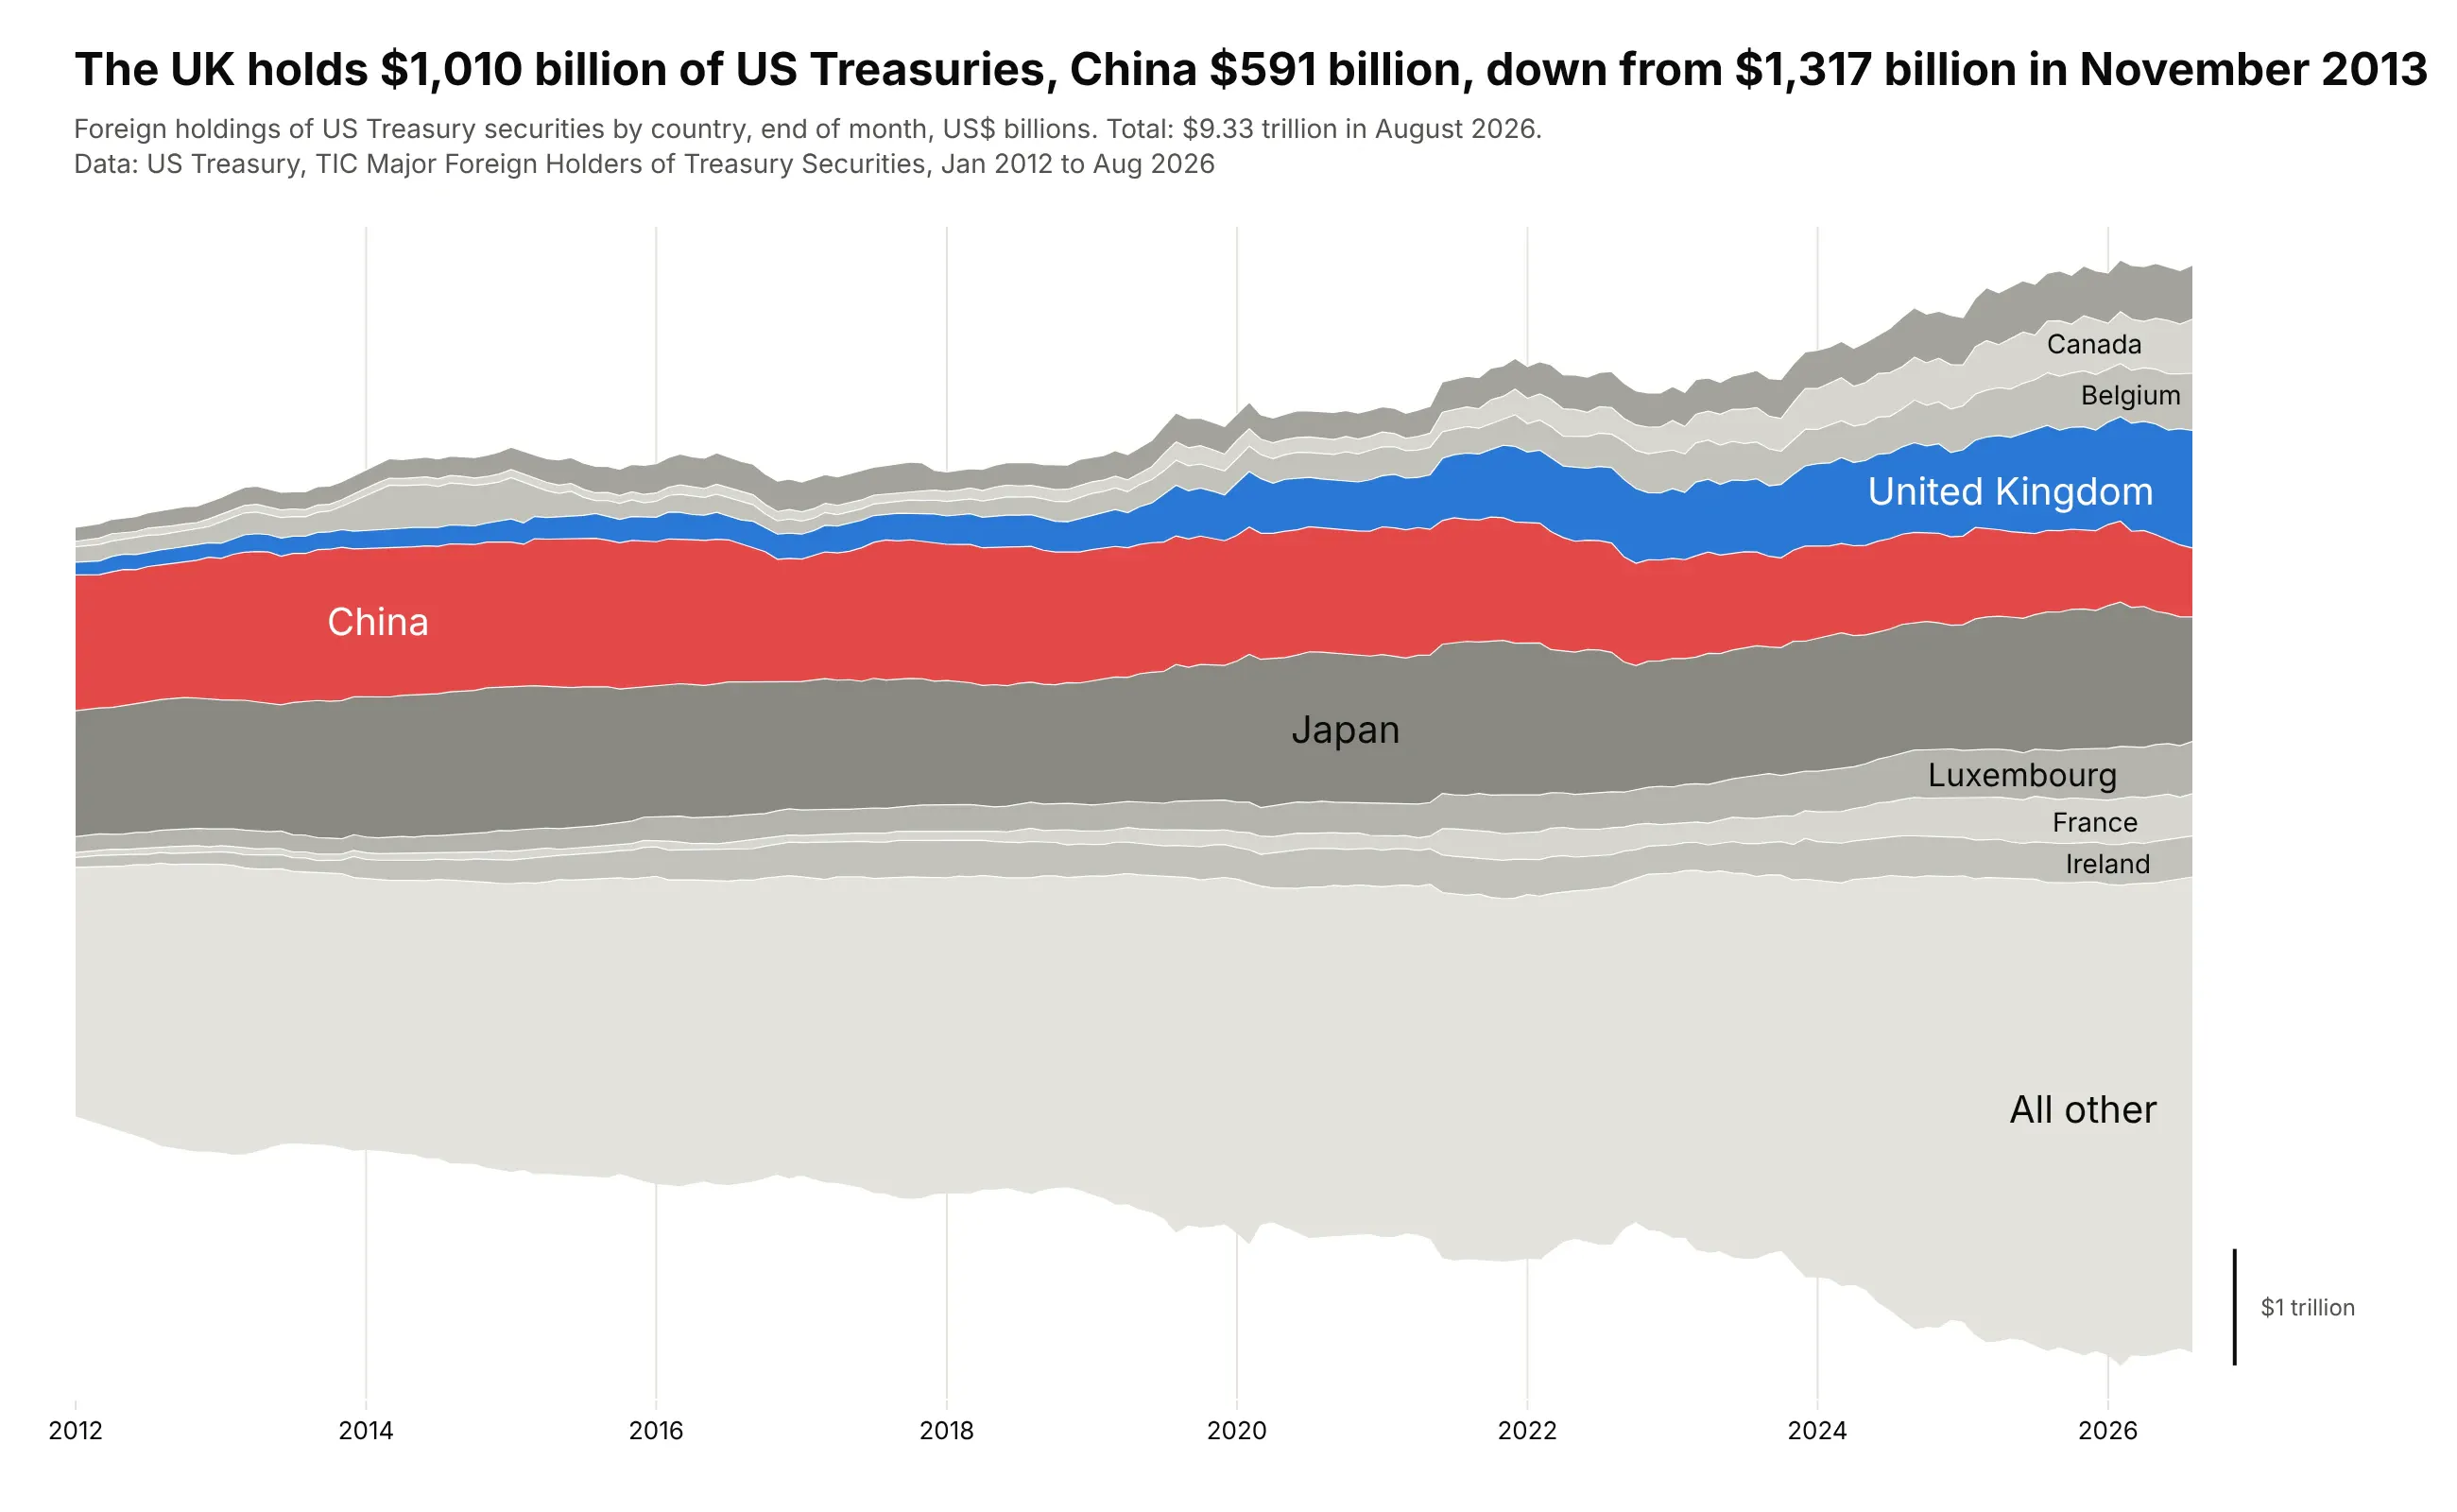
China held $1,317 billion of US Treasuries in November 2013 and $591 billion in August 2026, while the United Kingdom grew to $1,010 billion. Foreign holdings rose to $9.33 trillion in total. Data: US Treasury, TIC Major Foreign Holders of Treasury Securities, January 2012 to August 2026.
Tip: placing the two layers you want to compare next to each other in the middle, instead of using the inside-out order, makes their thickness easy to compare.
Get the data from the US Treasury's TIC "Major Foreign Holders of Treasury Securities"(ticdata.treasury.gov, mfhhis01.txt for history and slt_table5.txt for the latest months)and shape it into a table(columns: date as YYYY-MM, country, usd_bn; January 2012 on; the nine largest holders and"All other" = Grand Total minus those nine).Make a plotly streamgraph with the wiggle baseline.- Put China and the United Kingdom next to each other in the middle; China red, UK blue, others gray.- Labels inside the layers, a scale bar for $1 trillion, hover in $ billions.- Title with the UK's and China's latest holdings and China's peak.
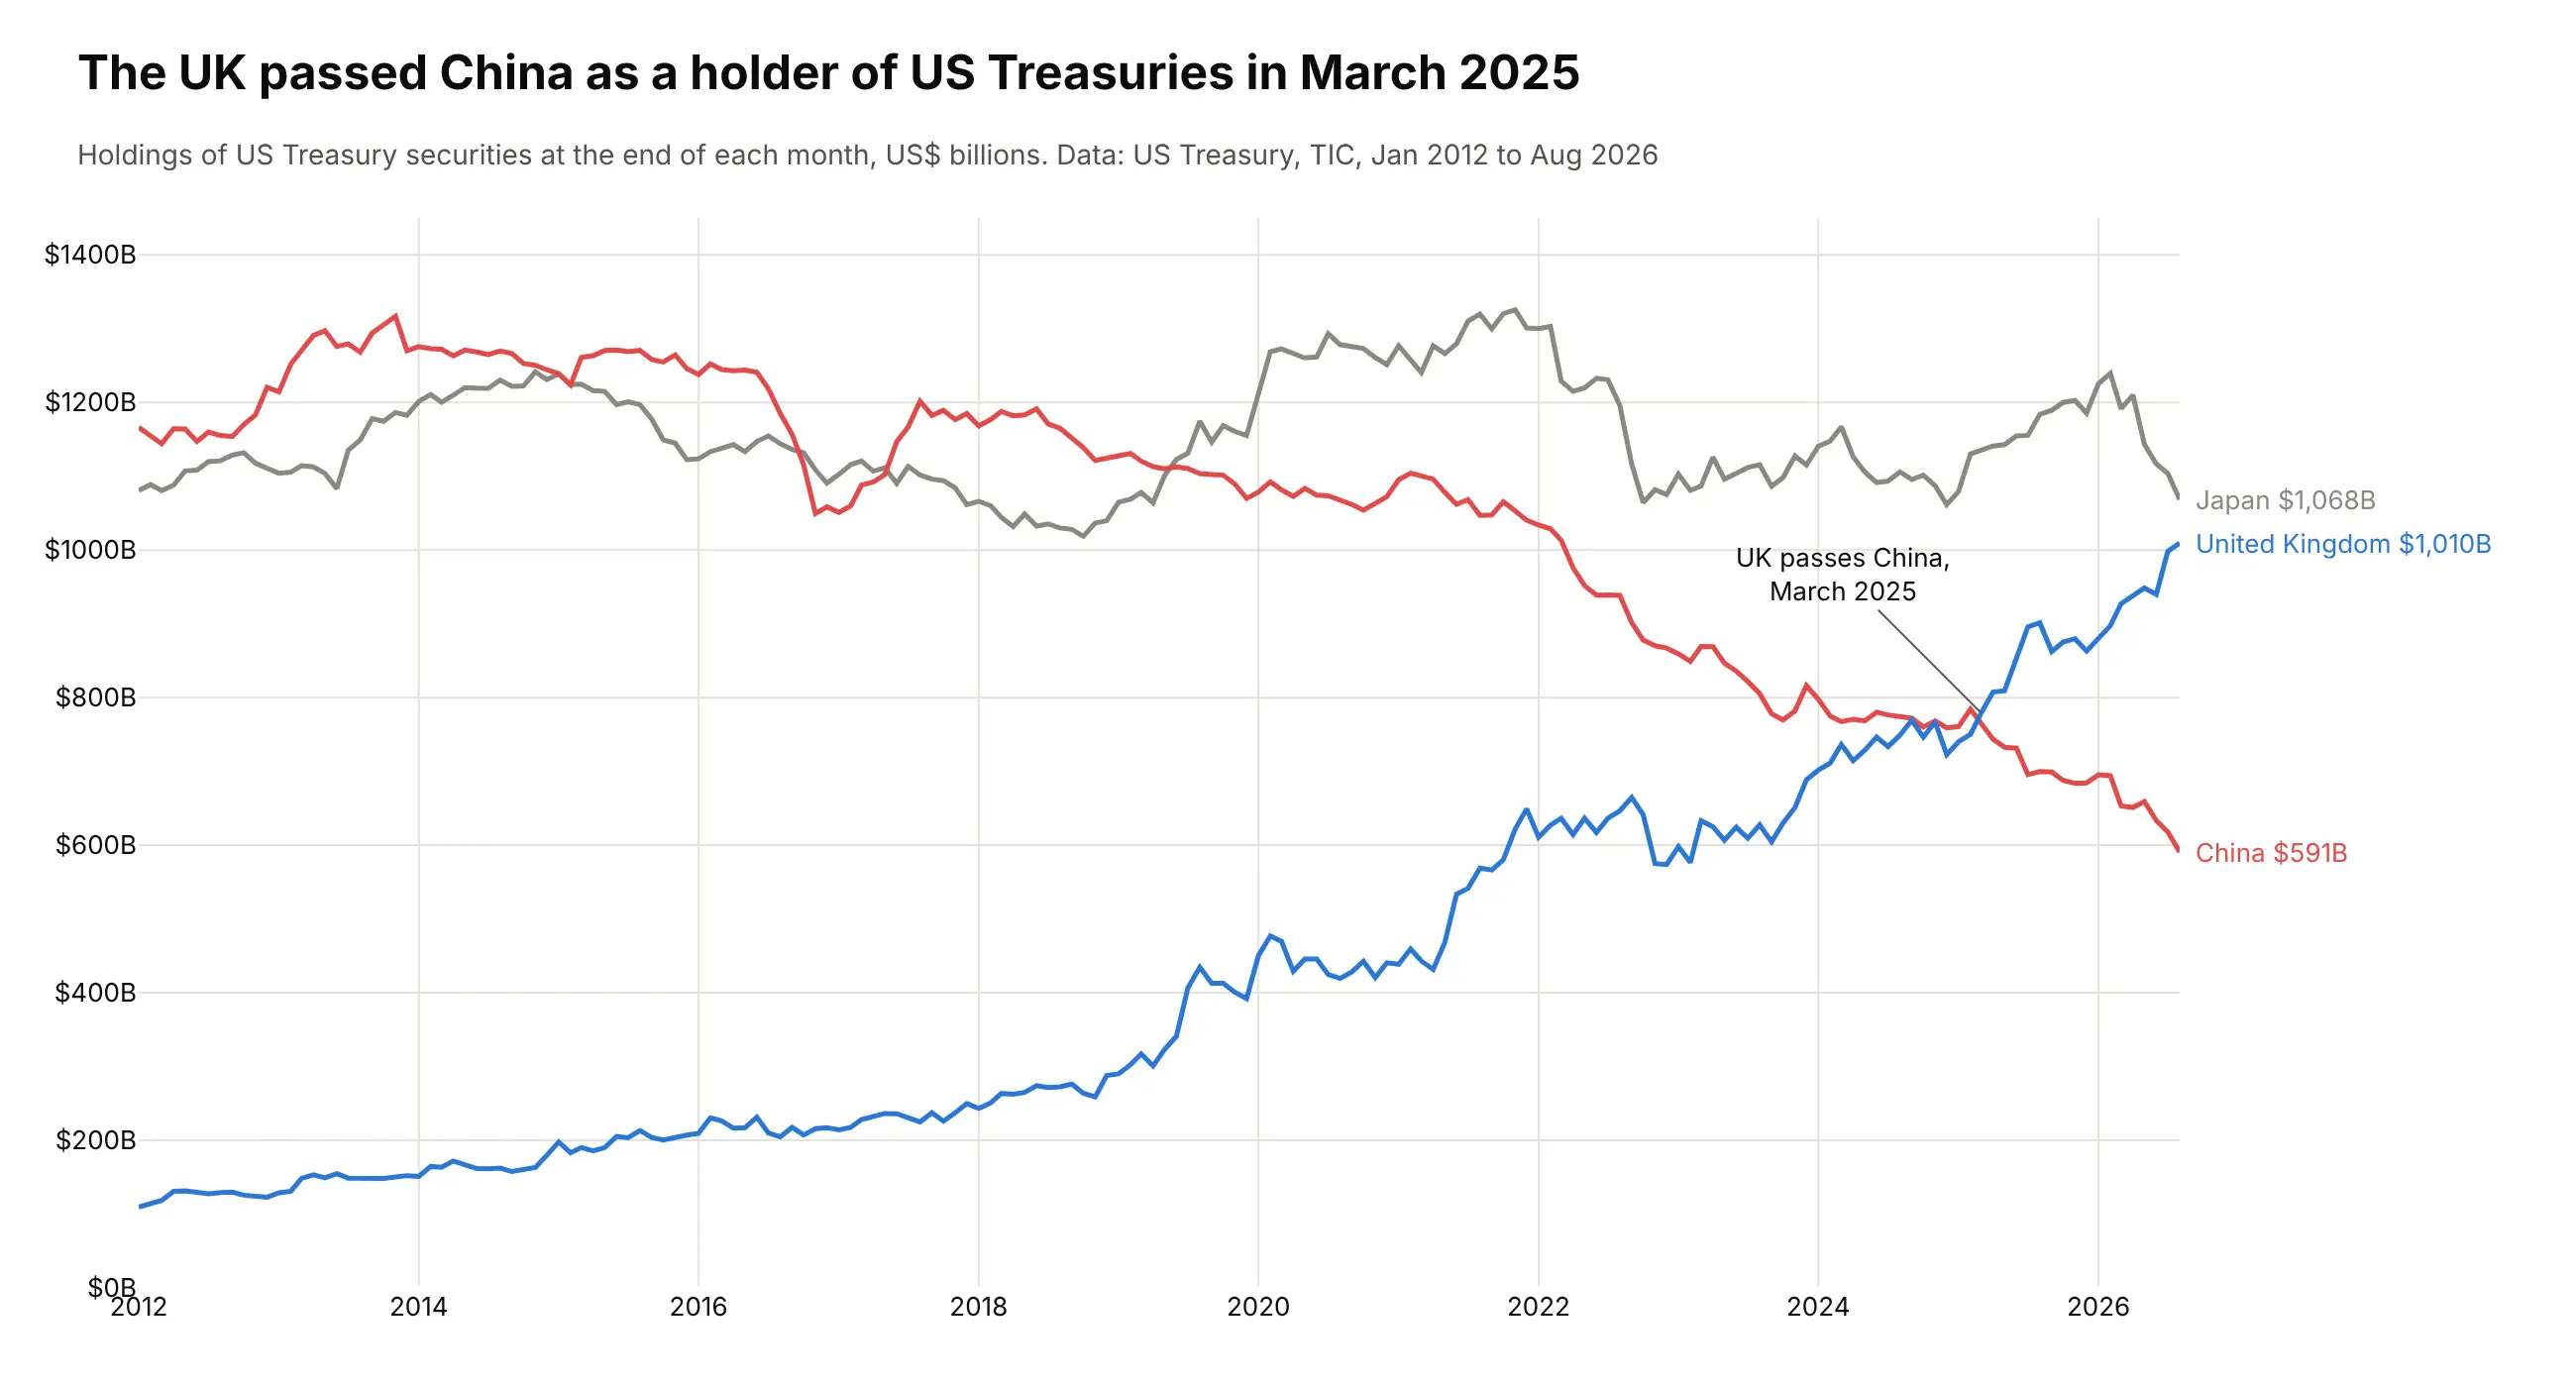
Another way to see it: a line chart of China, Japan and the UK shows the exact month the UK passed China, March 2025.
4. When the total is the story: the Fed's balance sheet
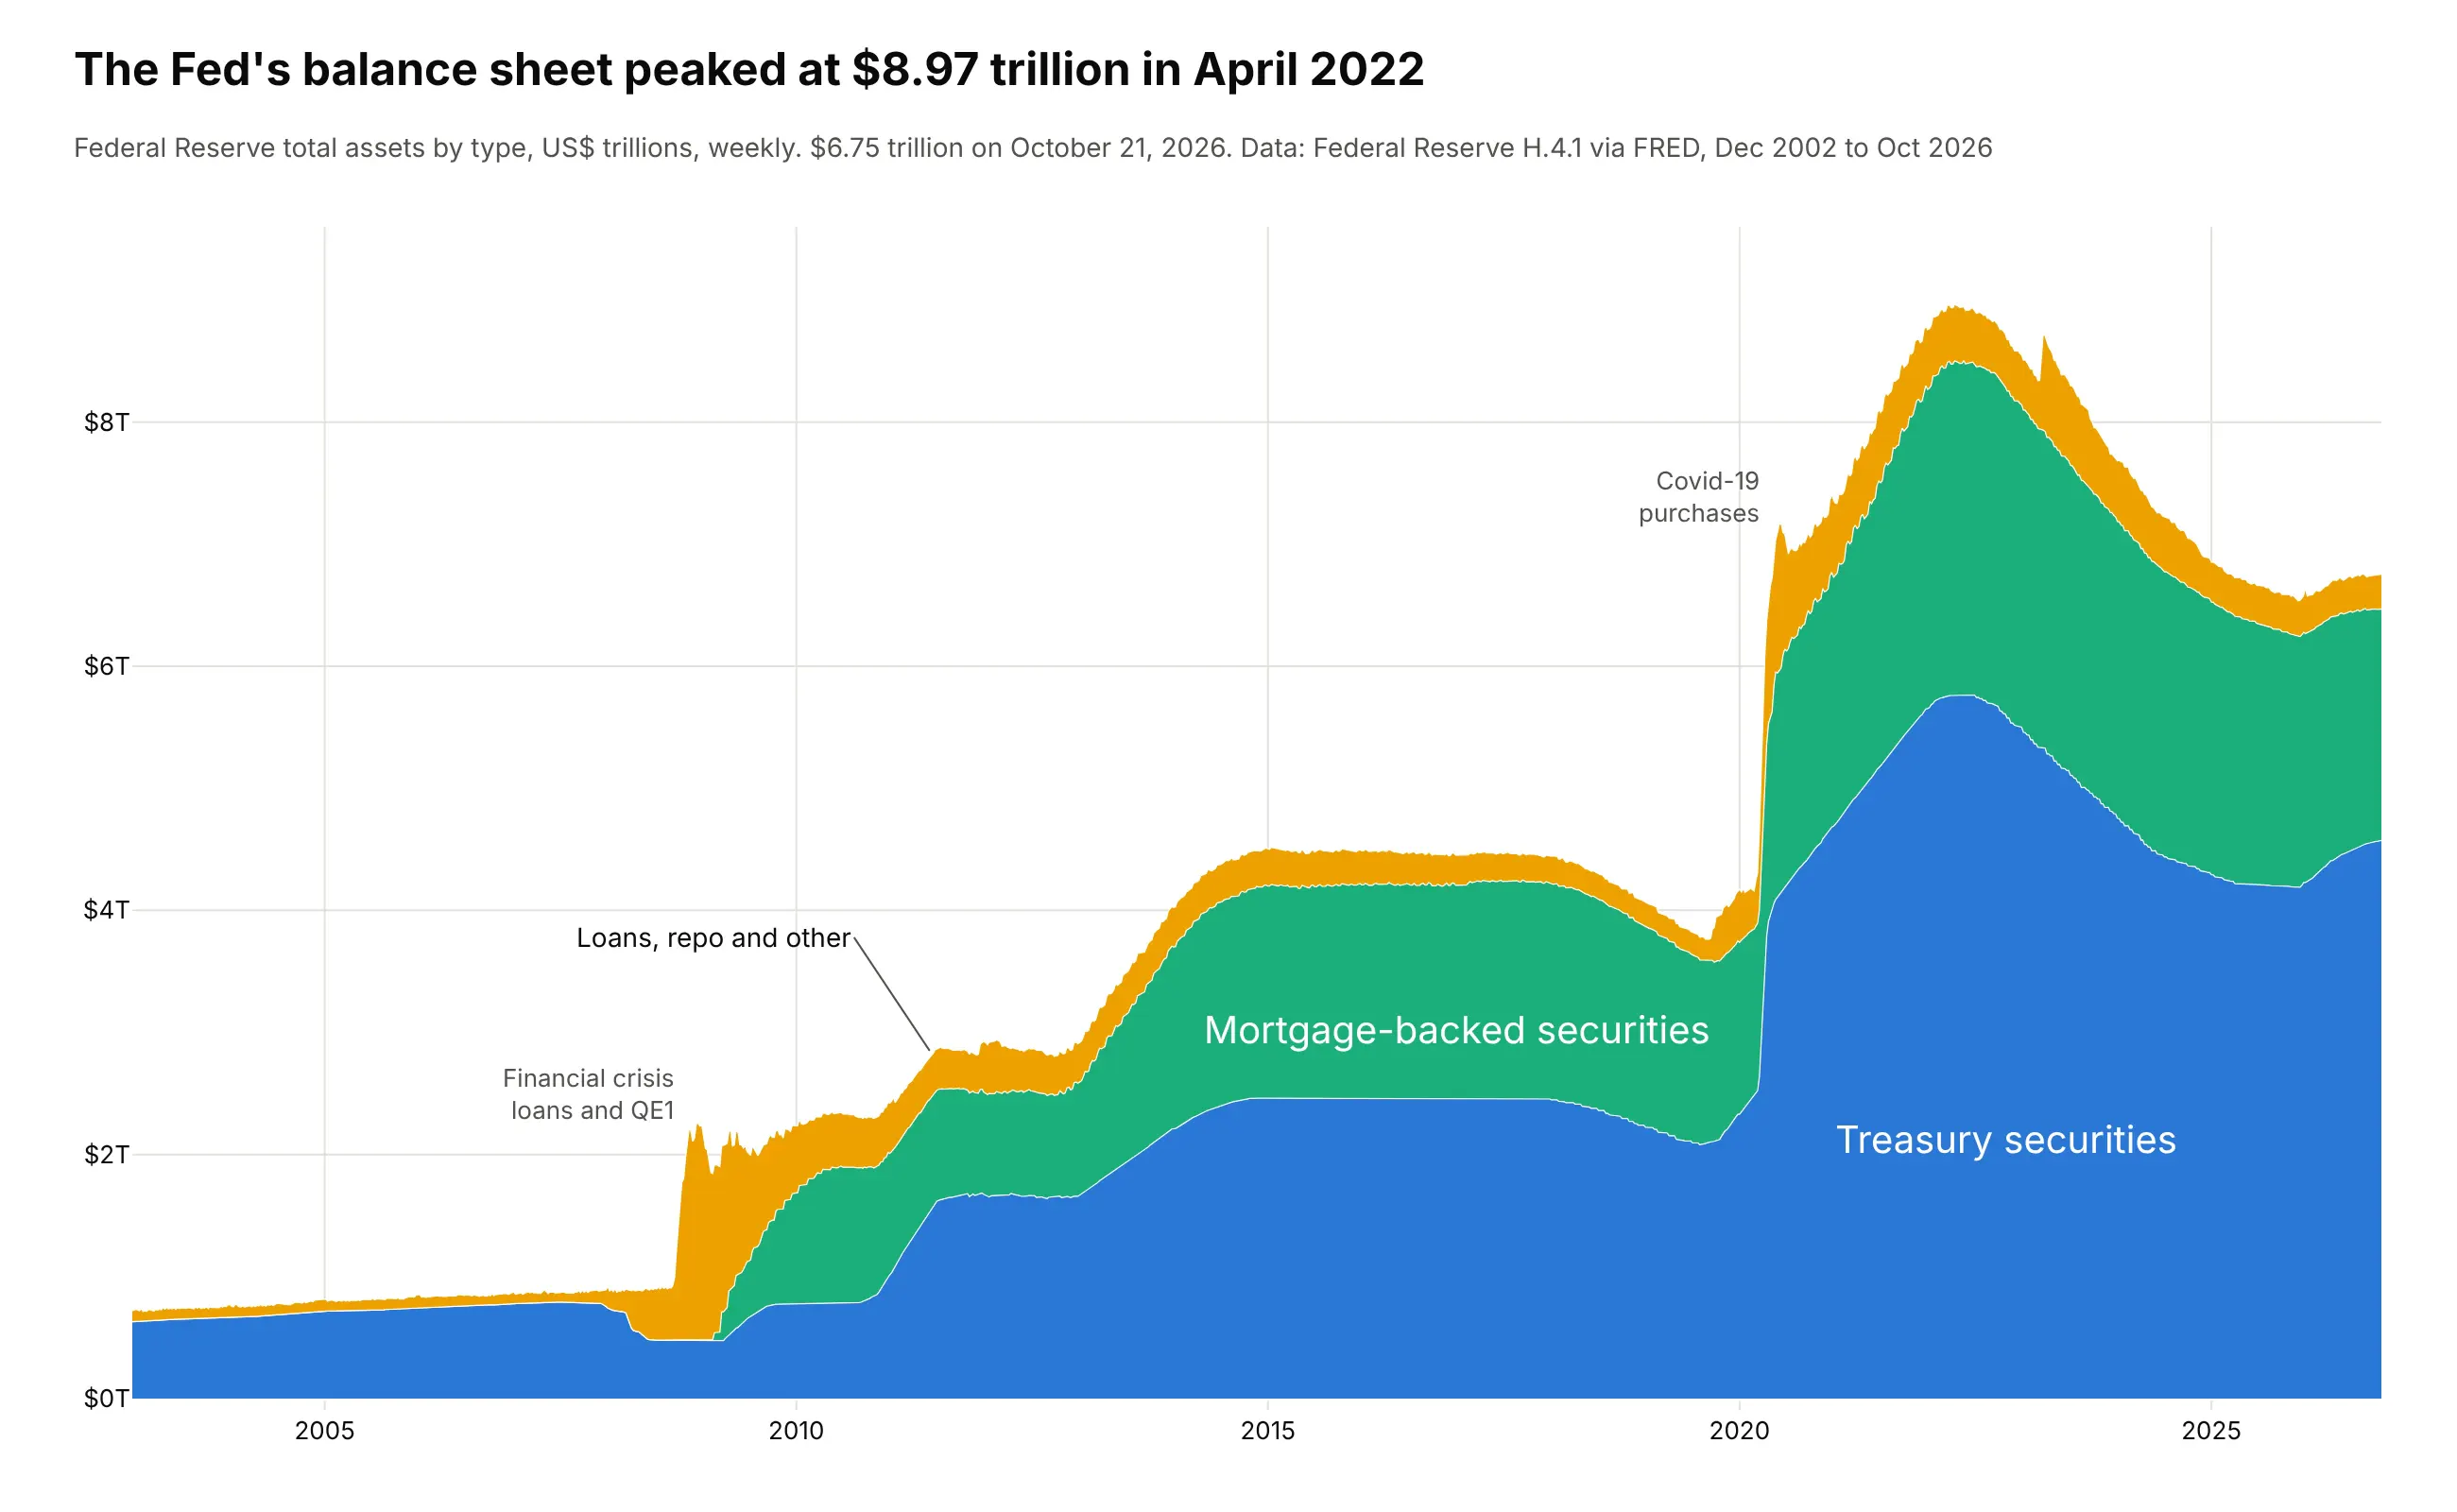
The Fed's balance sheet peaked at $8.97 trillion in April 2022 and was $6.75 trillion on October 21, 2026. Here readers ask "how big is it?" first, so this one keeps the zero baseline and a y axis: the same helper with baseline="zero". Data: Federal Reserve H.4.1 via FRED.
Tip: a thin top layer gets an outside label with a pointer instead of a label squeezed inside it.
Get the data from the Federal Reserve's H.4.1 release via FRED (series WALCL, WSHOTSL, WSHOMCB, weekly, $ millions)and shape it into a table(columns: date, treasuries, mbs, other in $ trillions; other = WALCL - WSHOTSL - WSHOMCB).Make a plotly stacked area chart (go.Scatter, one stackgroup, zero baseline).- Treasuries at the bottom, then MBS, then loans, repo and other.- y axis in trillions with a $ prefix; notes at the 2008 and 2020 jumps.- Title with the peak and its date.
5. What Americans died of, week by week
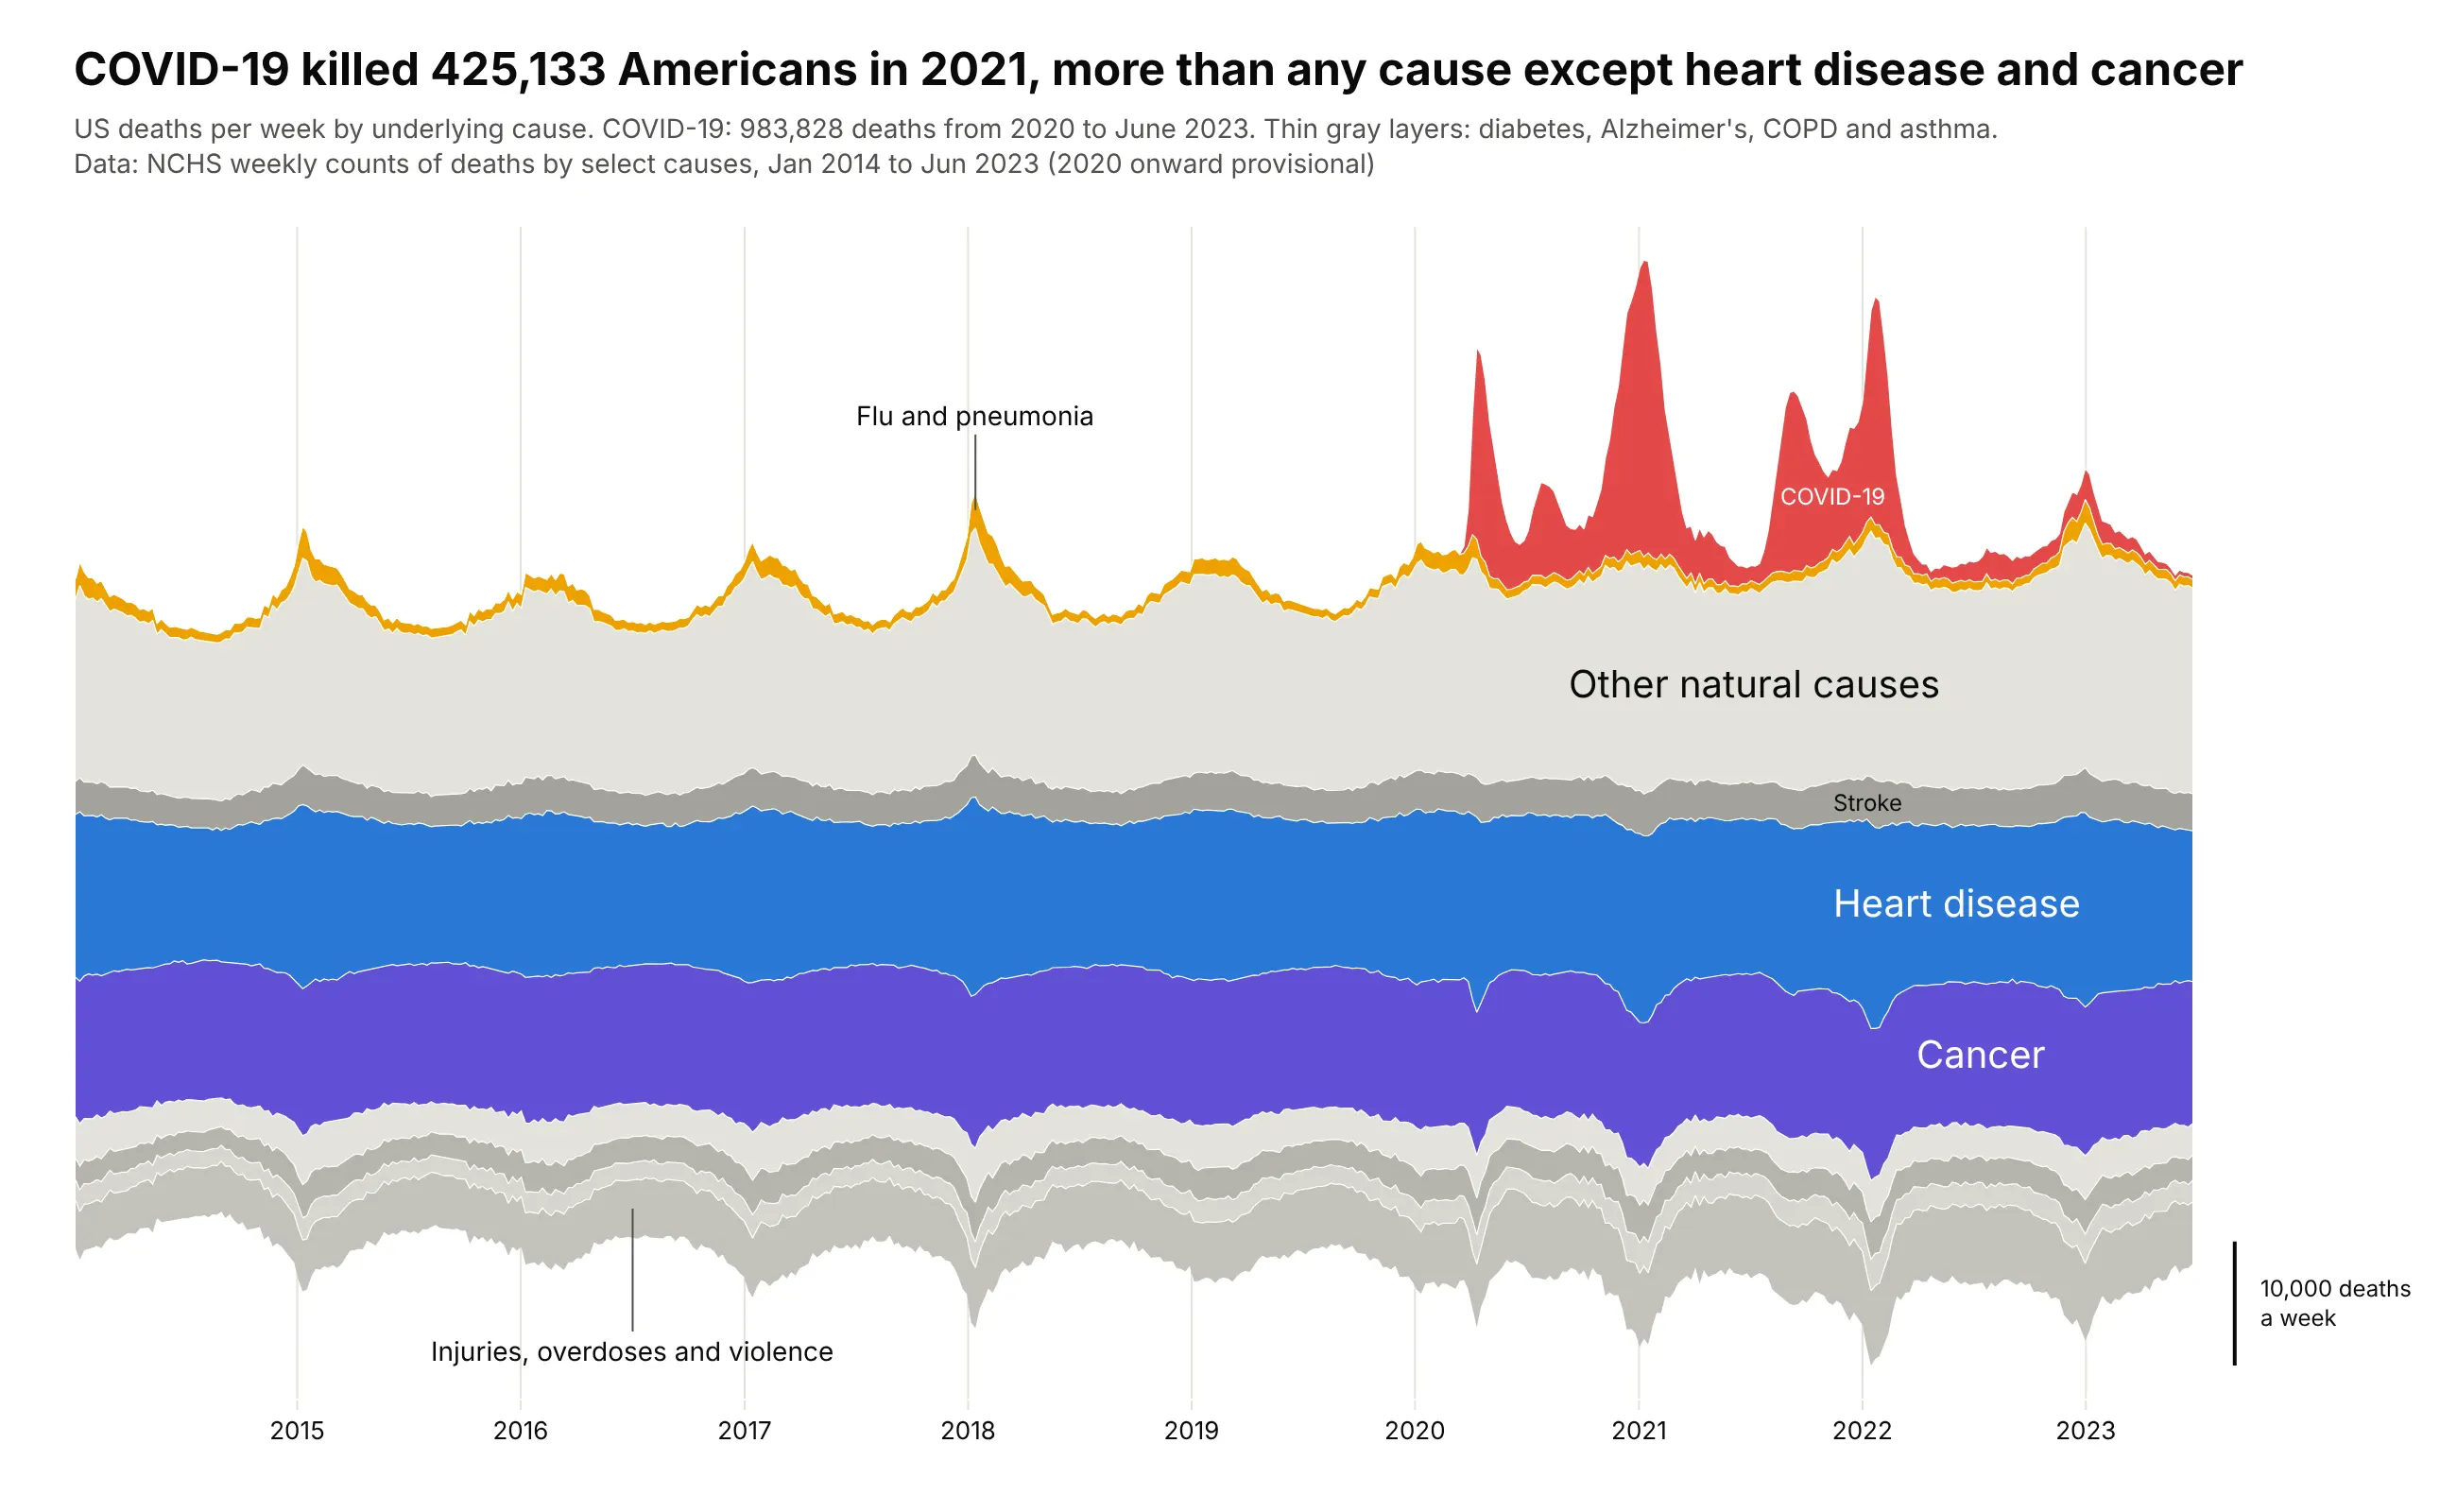
COVID-19 killed 425,133 Americans in 2021, more than any cause except heart disease (694,876) and cancer (604,296), and 983,828 from 2020 to June 2023. Before 2020 the biggest spikes are the winter flu seasons. Data: NCHS weekly counts of deaths by select causes.
Tip: the order is chosen by hand, with the steady causes in the middle and the spiky ones (COVID-19, flu) on the outside, so their spikes don't push every other layer up and down.
Get the data from the NCHS weekly counts of deaths by select causes on data.cdc.gov(datasets 3yf8-kanr for 2014-2019 and muzy-jte6 for 2020-2023, jurisdiction "United States")and shape it into a table(columns: week, cause, deaths; underlying cause; "Other natural causes" = natural causes minus thenamed ones and "External causes" = all causes minus natural causes, so each week adds up).Make a plotly streamgraph with the wiggle baseline, ending at the week of 24 June 2023.- Order by hand: external causes at the bottom, steady causes in the middle, flu and COVID-19 on top.- Heart disease blue, cancer purple, COVID-19 red, flu yellow, everything else in grays.- Labels inside the thick layers and outside labels with pointers for thin ones.
6. Who runs clinical trials
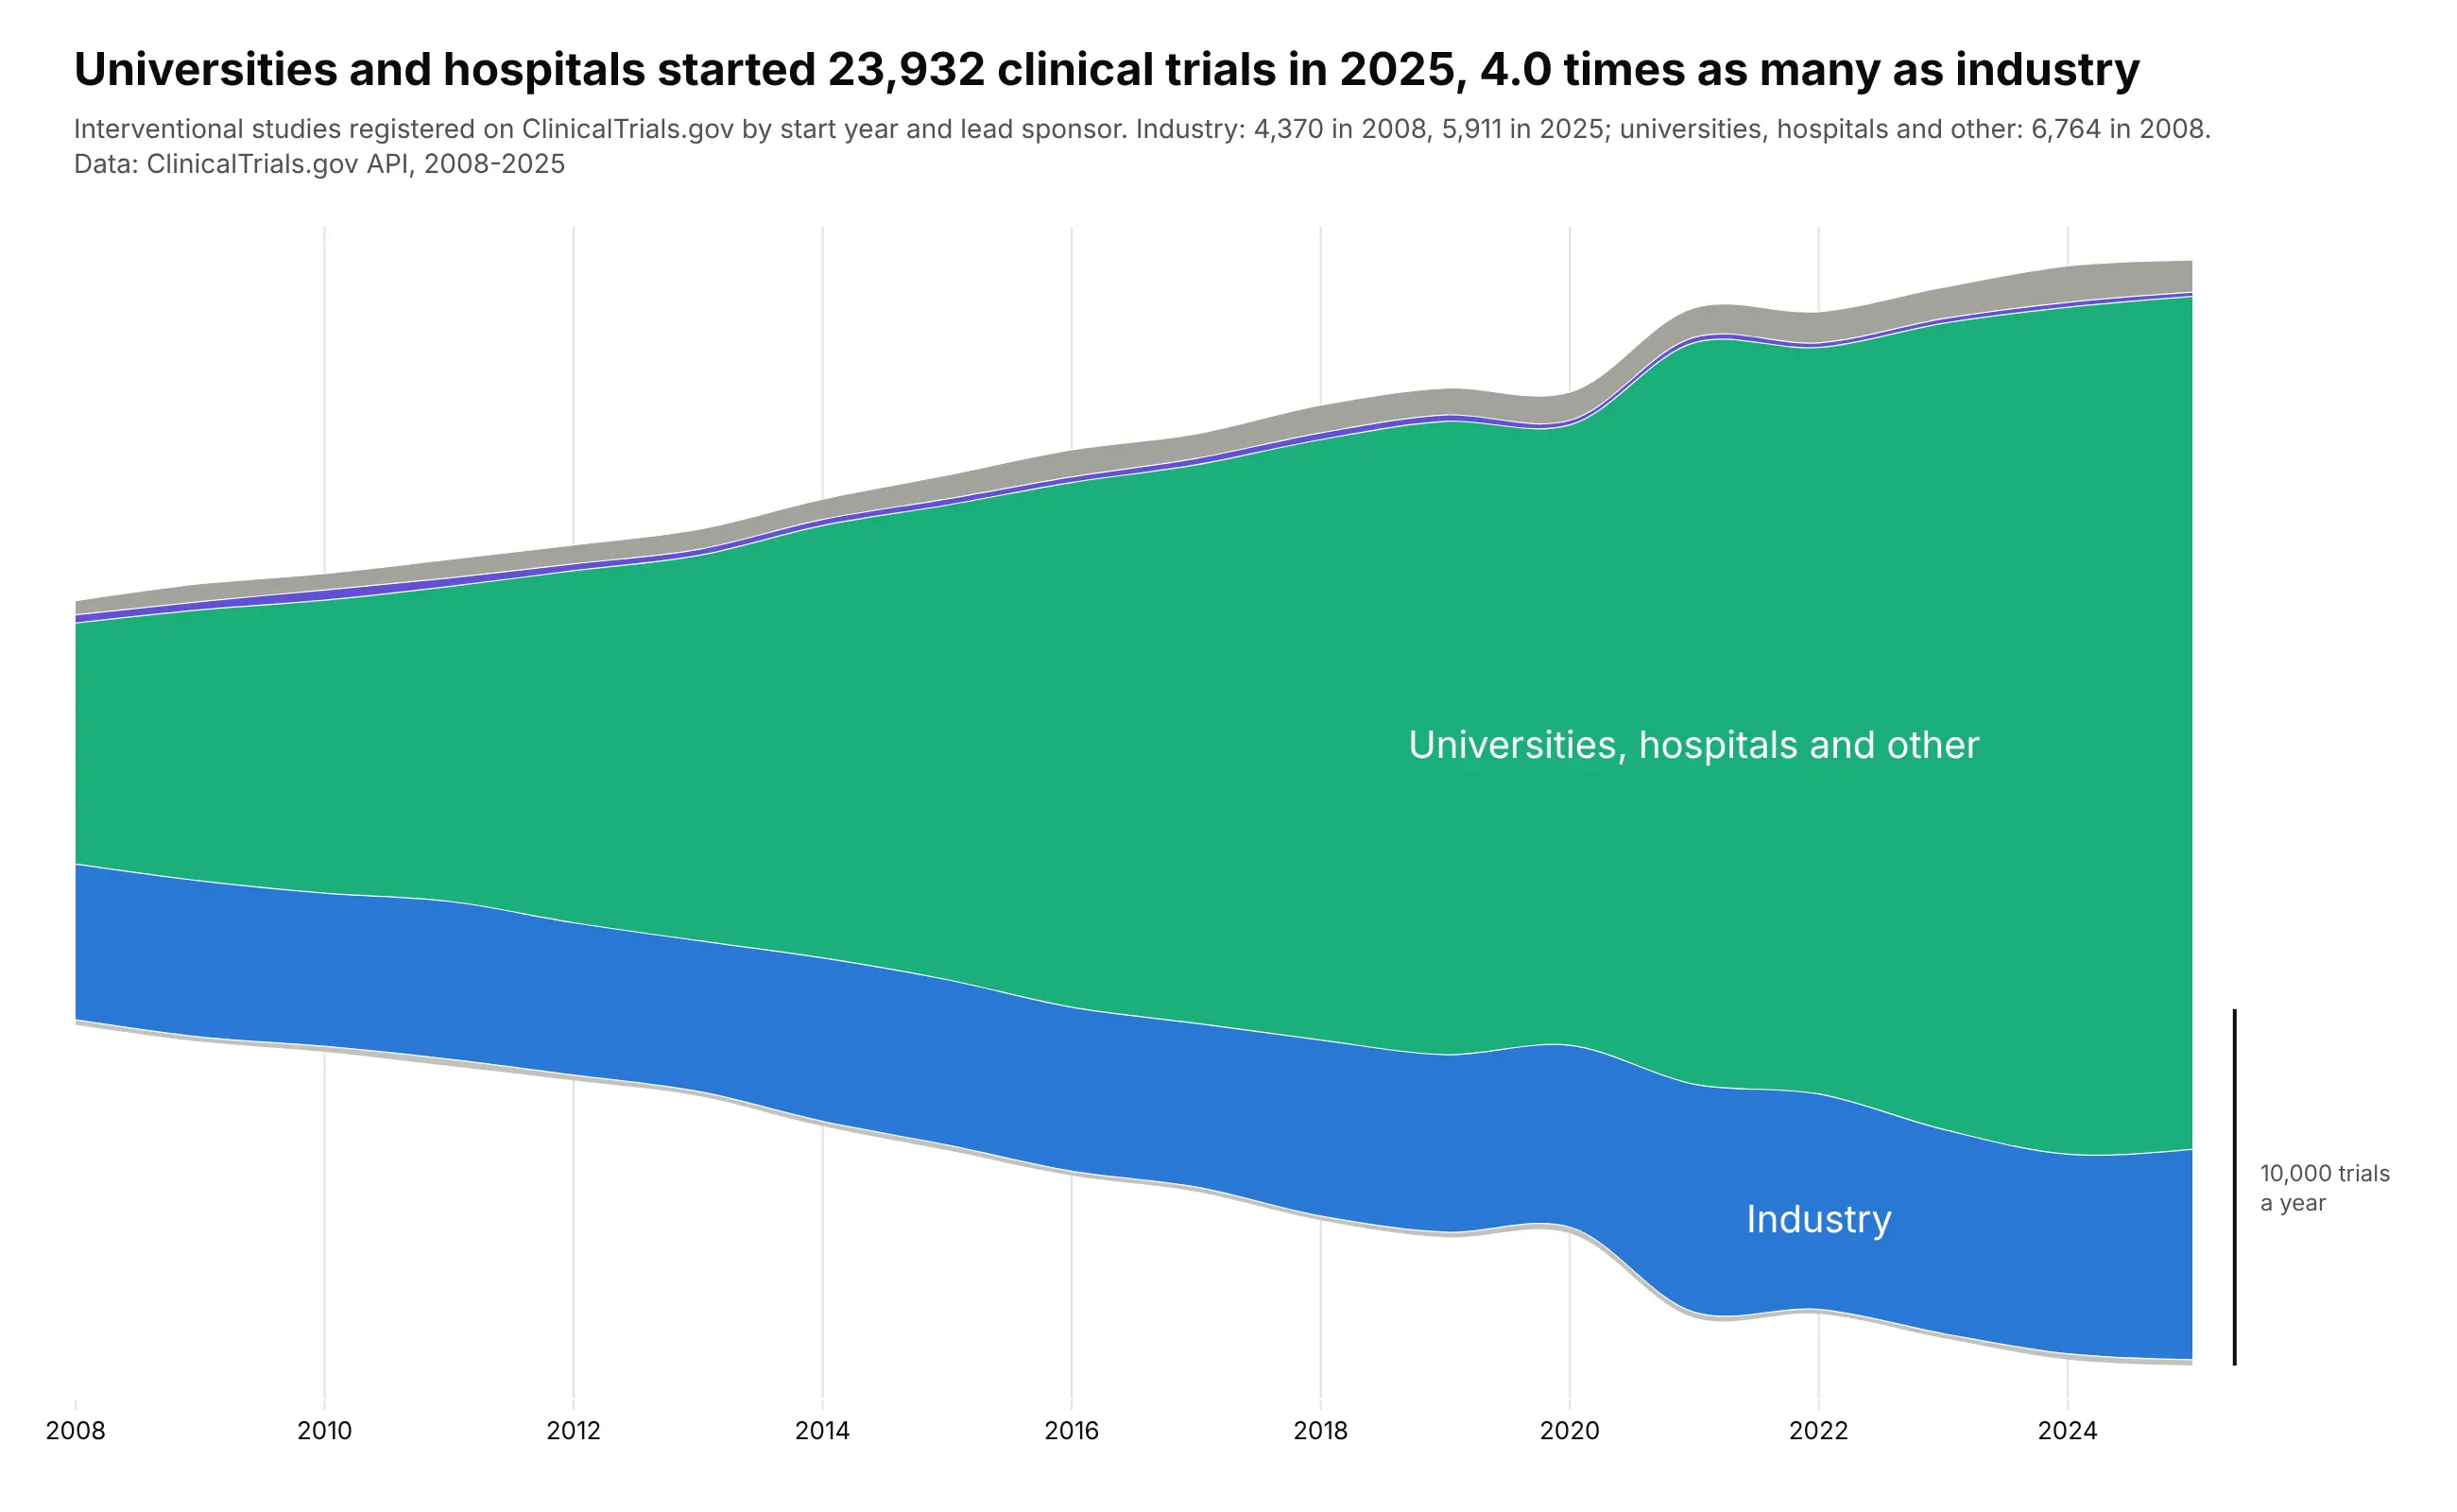
Universities and hospitals started 23,932 interventional trials in 2025, 4.0 times as many as industry (5,911). In 2008 the two were close: 6,764 and 4,370. Data: ClinicalTrials.gov API, interventional studies by start year and lead sponsor class.
Tip: with yearly points, splines (smoothing=1.0) make the layers easier to follow without changing any value at the data points.
Get the data from the ClinicalTrials.gov API v2 (count-only queries,query.term = AREA[StudyType]INTERVENTIONAL AND AREA[StartDate]RANGE[...] AND AREA[LeadSponsorClass]...)and shape it into a table(columns: year, sponsor_class, trials; 2008-2025; classes INDUSTRY, NIH, FED, OTHER_GOV, NETWORK,INDIV, OTHER, AMBIG, UNKNOWN).Make a plotly streamgraph with the silhouette baseline and splines.- Group the classes into Industry, Universities/hospitals/other, NIH, Governments, Networks and individuals.- Industry blue, universities green, the small groups gray. Labels inside, scale bar for 10,000 trials.- Title with the 2025 ratio of universities and hospitals to industry.
7. Which GLP-1 drugs people read about
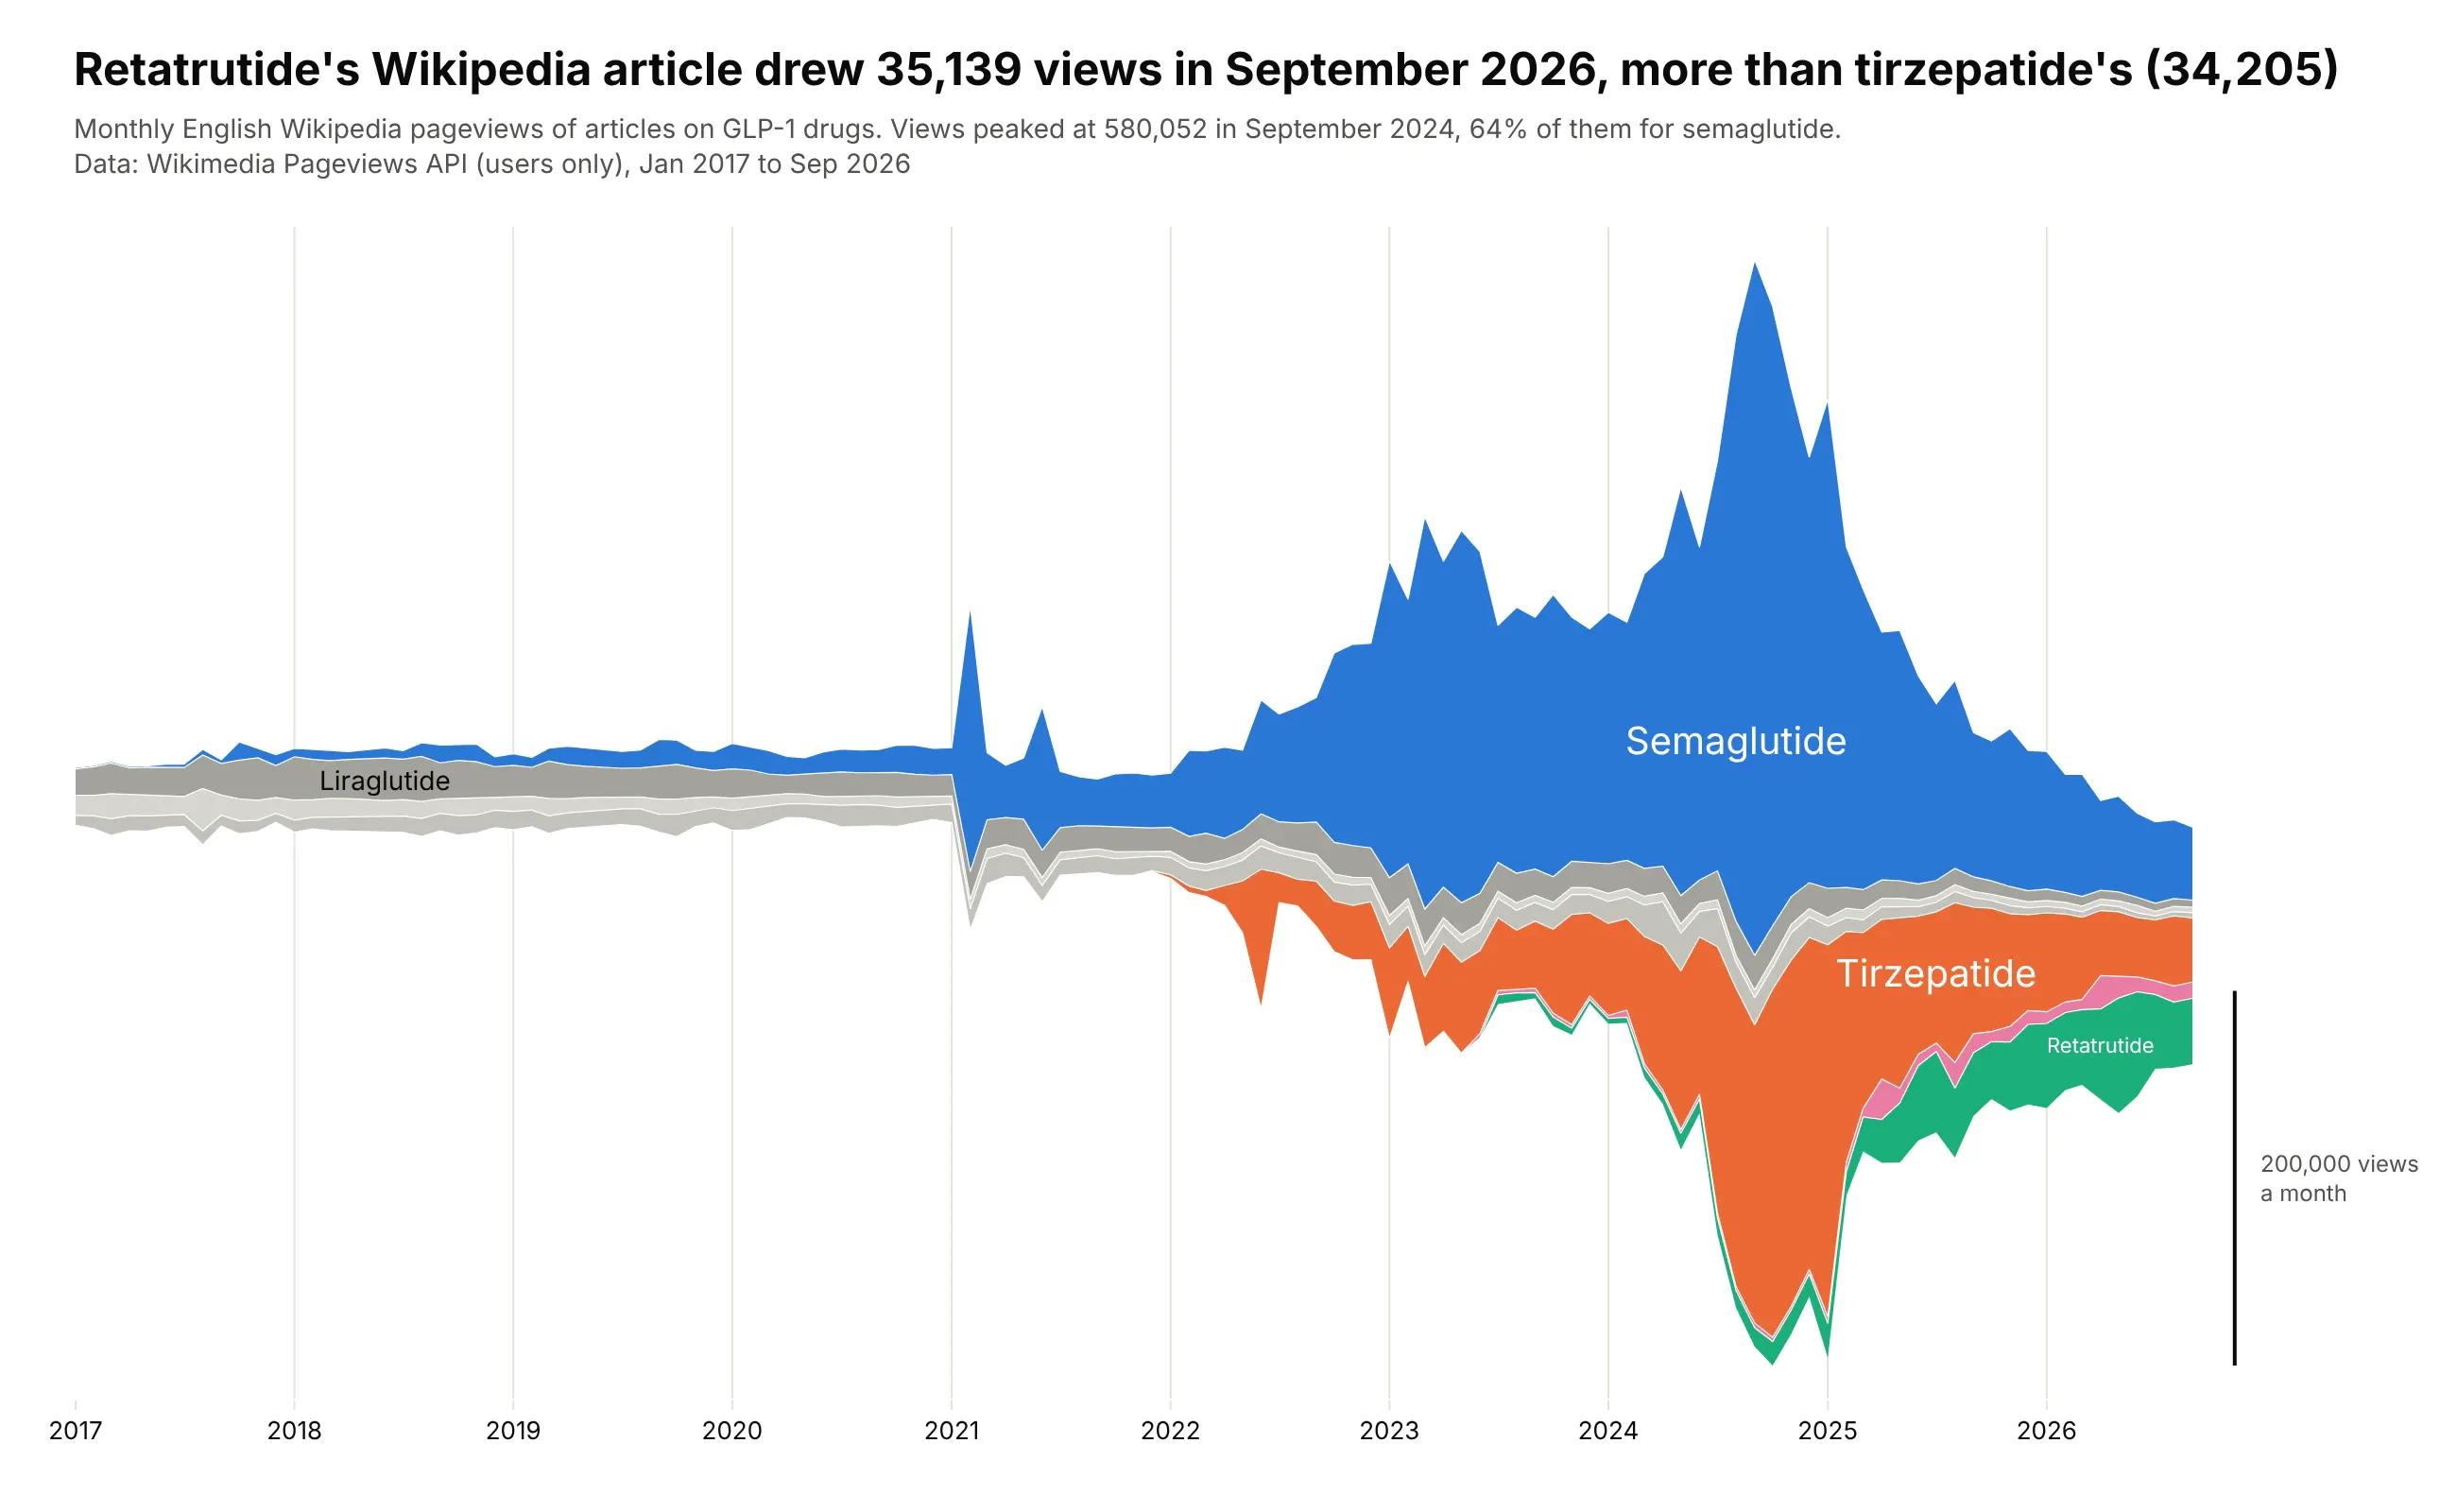
Readers of the GLP-1 articles peaked at 580,052 views in September 2024, 64% of them on semaglutide's. By September 2026 retatrutide's article drew 35,139 views, more than tirzepatide's (34,205). Data: Wikimedia Pageviews API, English Wikipedia, users only.
Tip: the inside-out order puts drugs that peaked early in the middle and lets the newest ones grow on the outside, where a new layer doesn't push the others around.
Get the data from the Wikimedia Pageviews API (per-article, en.wikipedia, all-access, user, monthly)for the articles Semaglutide, Tirzepatide, Liraglutide, Dulaglutide, Exenatide, Retatrutide and Orforglipronand shape it into a table(columns: month, article, views; January 2017 to September 2026).Make a plotly streamgraph with the wiggle baseline and the inside-out order.- Semaglutide blue, tirzepatide orange, retatrutide green, orforglipron pink, older drugs in grays.- Labels inside the layers, a scale bar for 200,000 views a month.- Title comparing retatrutide and tirzepatide in the latest month.
8. How computer science took over arXiv
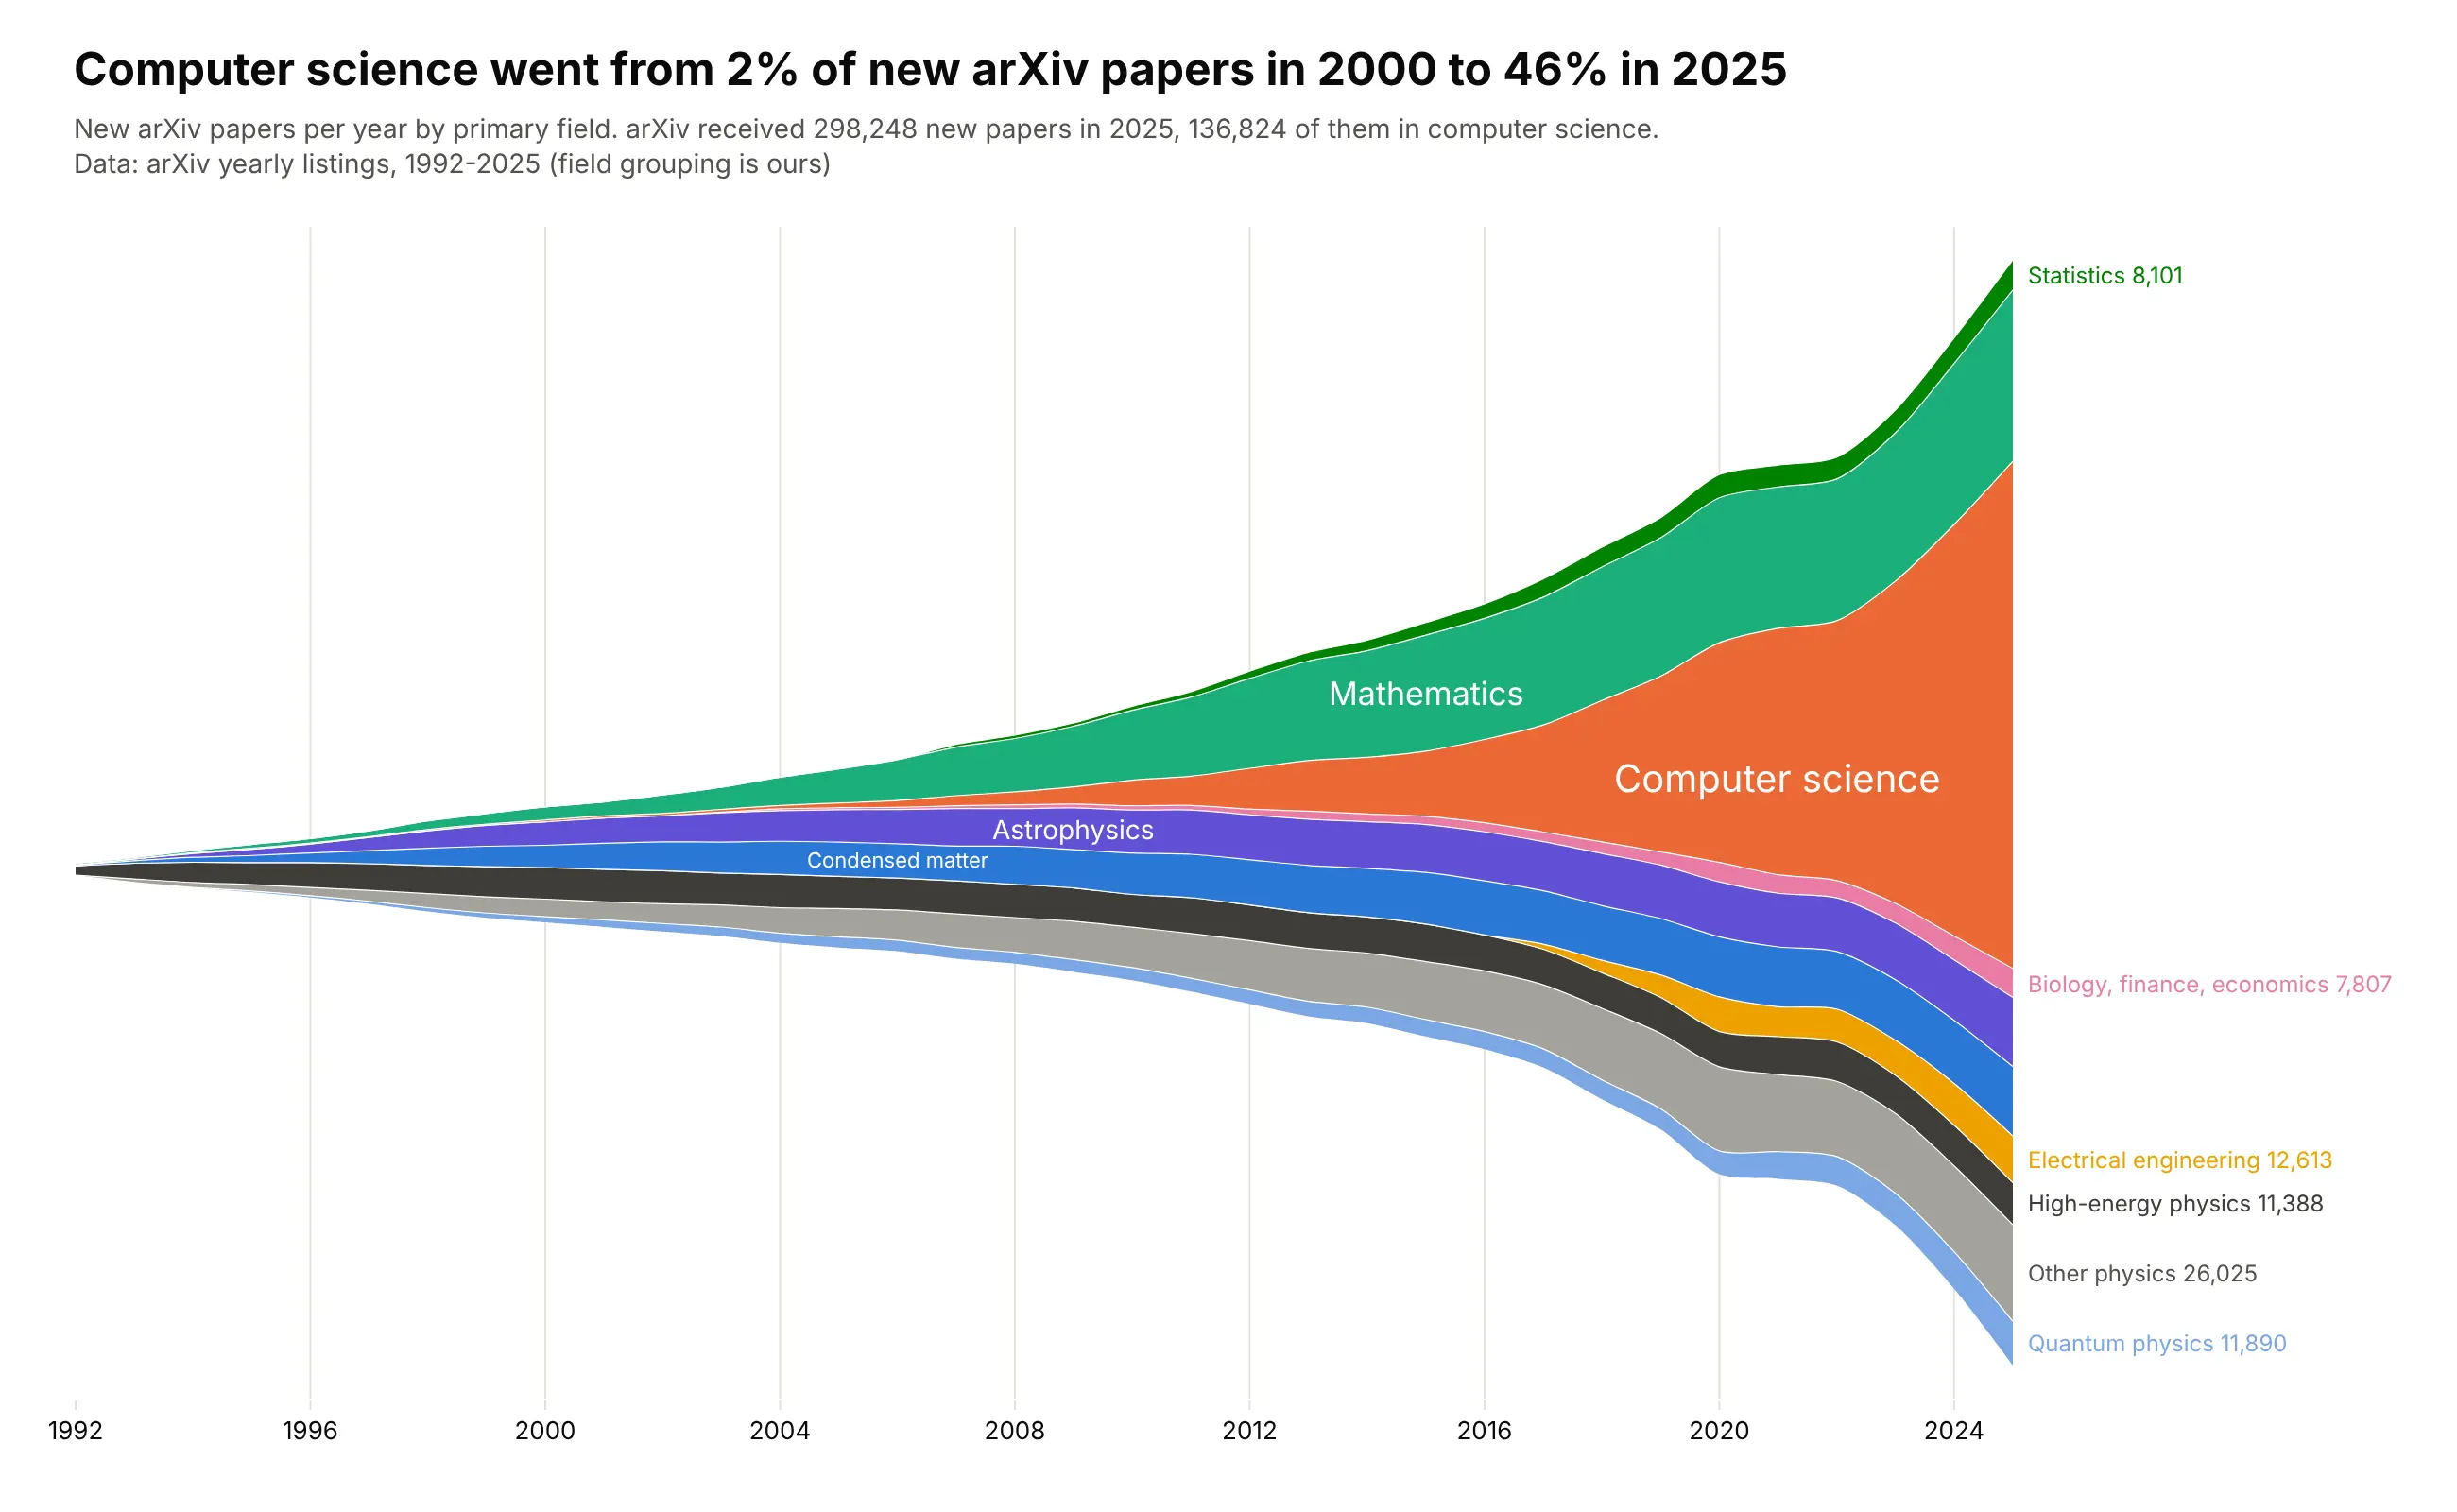
Computer science was 2% of new arXiv papers in 2000 and 46% in 2025, when arXiv received 298,248 new papers, 136,824 of them in computer science. The physics archives that founded arXiv still grow, from 27,126 papers in 2000 to 86,678 in 2025, just much more slowly. Data: arXiv yearly listings by primary archive (the field grouping is ours).
Tip: thin layers that can't hold a label inside get end labels in the right margin, at the middle of each layer in the last year.
Get the data from arXiv's yearly listings (arxiv.org/year/<archive>/<year>, the "N articles" count,which is papers with that primary archive) for cs, math, astro-ph, cond-mat, hep-*, quant-ph, physics,gr-qc, nucl-*, math-ph, nlin, stat, eess, q-bio, q-fin and econand shape it into a table(columns: year, archive, articles; 1992-2025).Make a plotly streamgraph with the wiggle baseline and splines.- Group archives into ten fields; computer science orange, physics in blues, purples and grays.- Labels inside the thick layers and end labels with the 2025 count for thin ones.- Title with computer science's share in 2000 and 2025.
9. The rise of boys' names ending in n
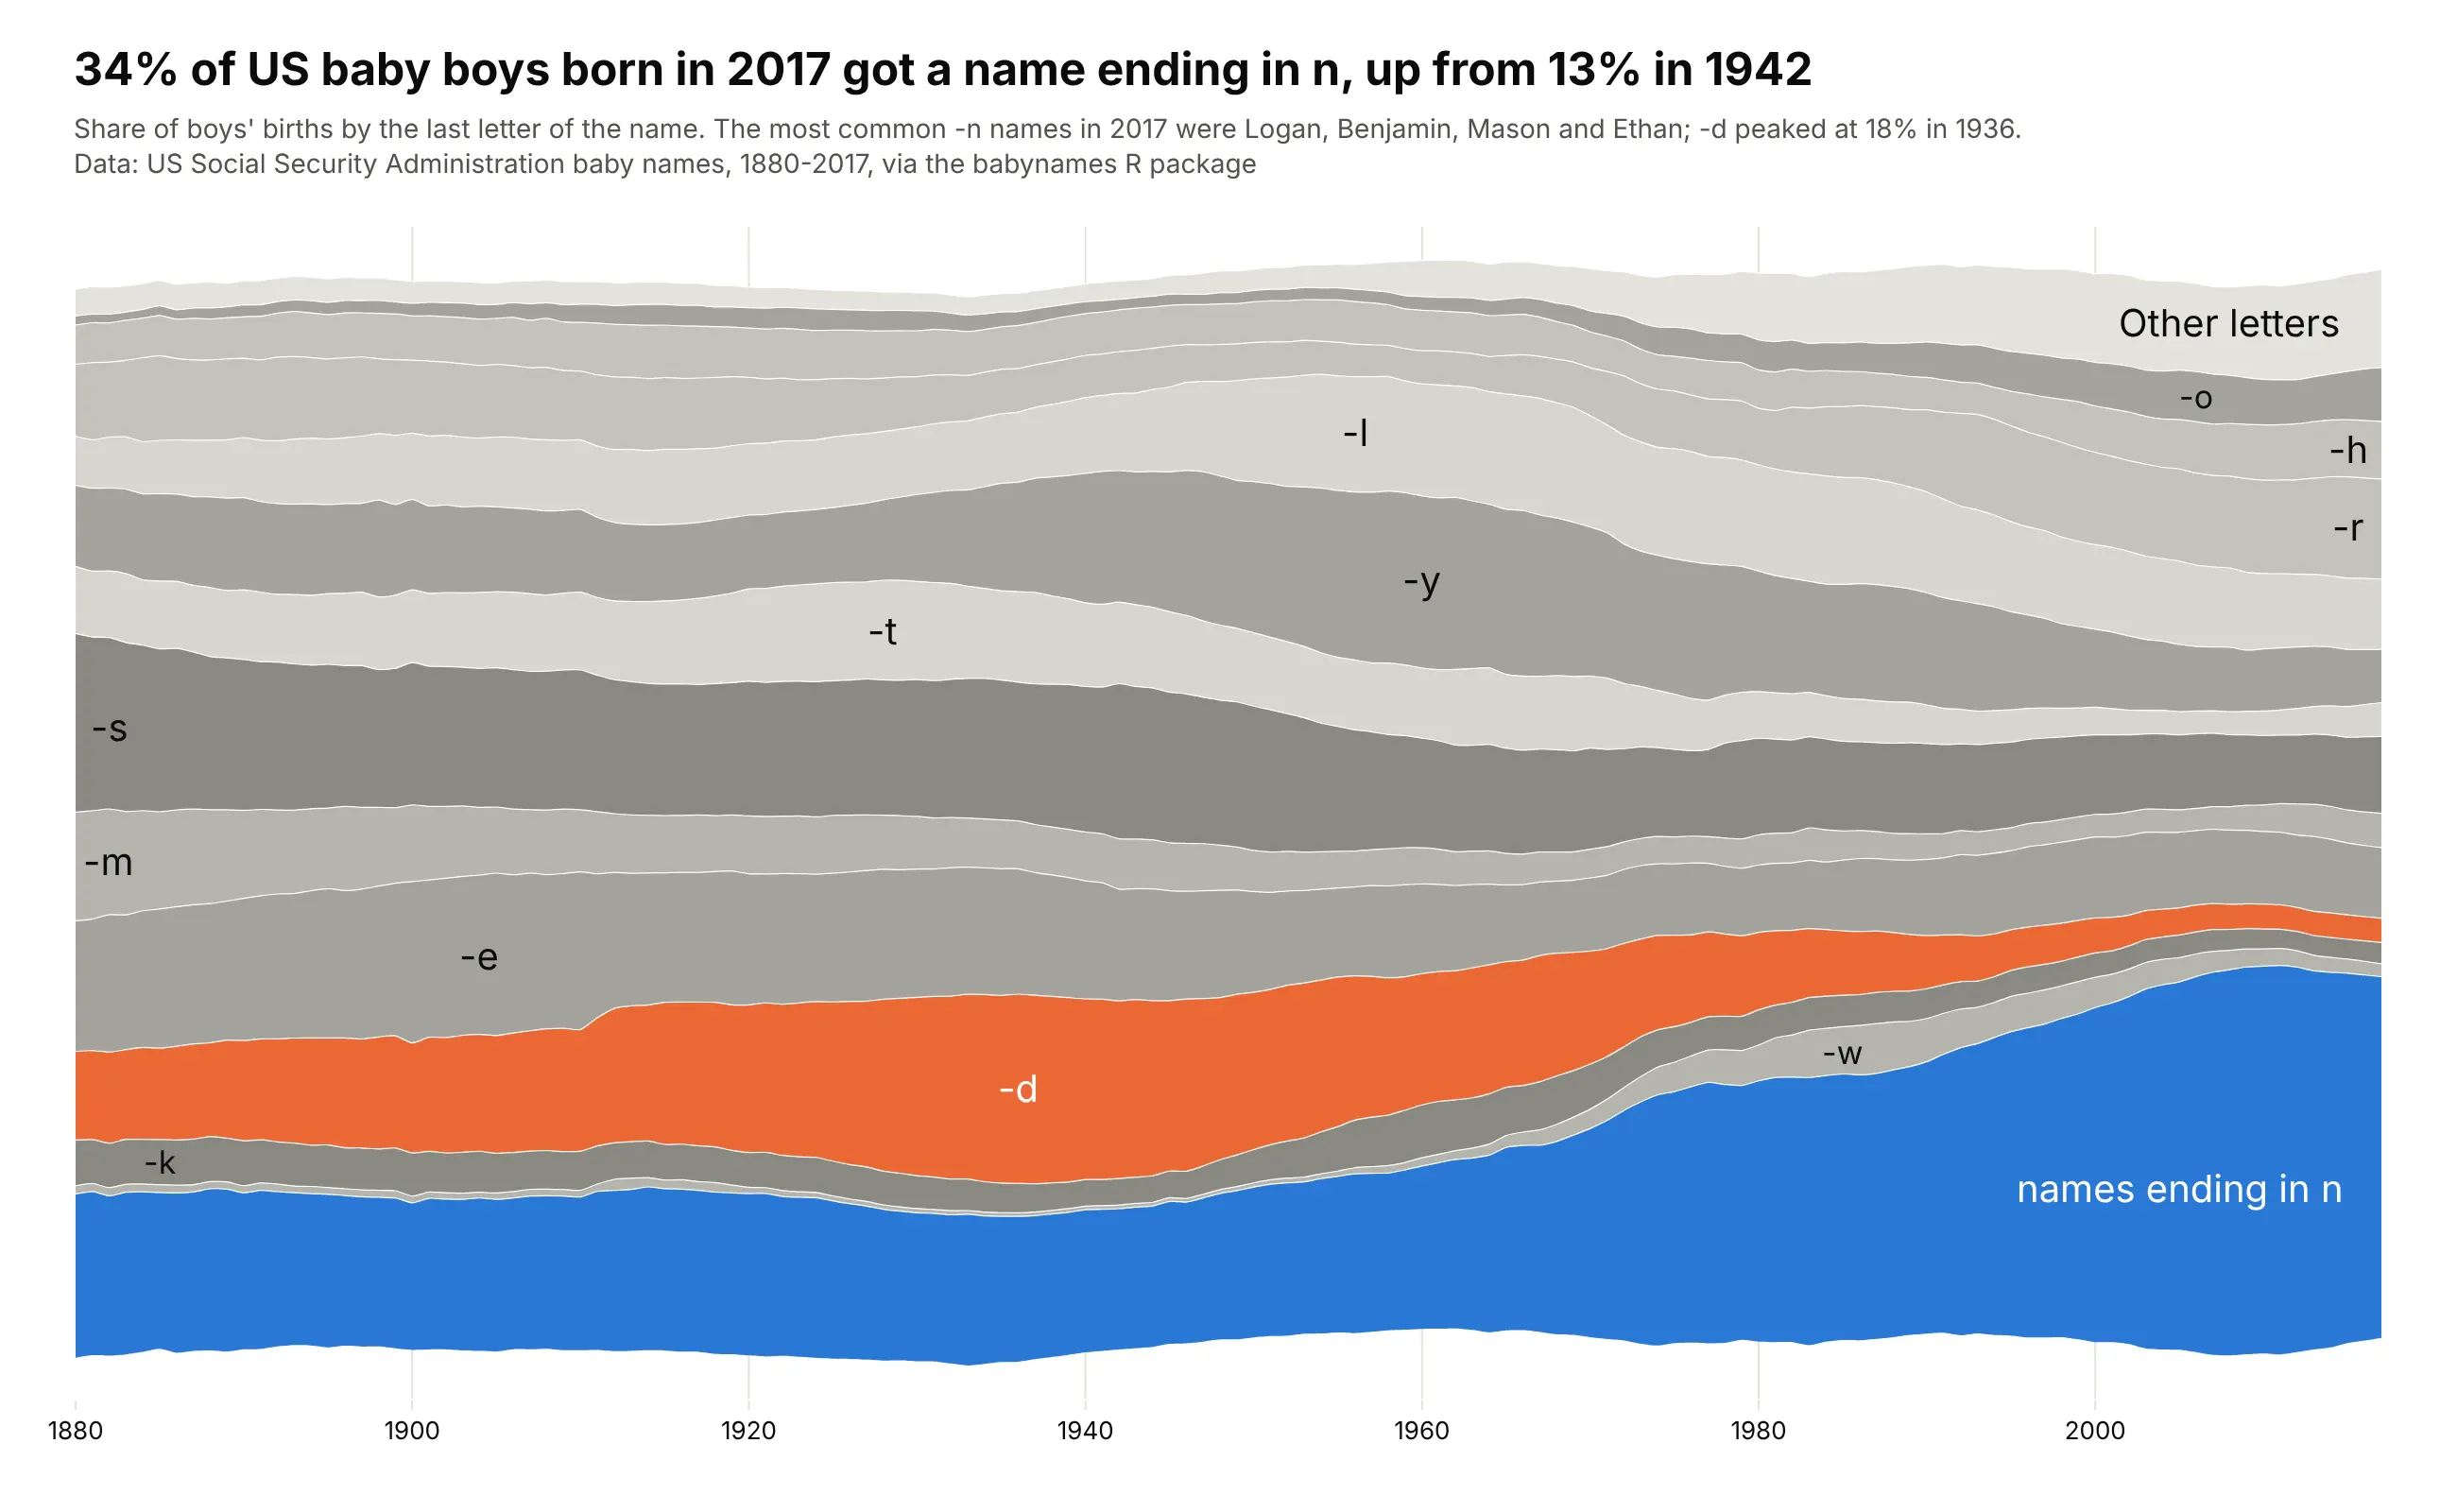
34% of US baby boys born in 2017 got a name ending in n, up from 13% in 1942. The -d names (Richard, Donald, David) peaked at 18% in 1936. Data: US Social Security Administration baby names, 1880-2017, via the babynames R package.
Tip: normalize=True gives every year the same height, so the chart is about the mix, not the number of births.
Get the data from the US Social Security Administration's national baby names files (ssa.gov, names.zip,or the babynames R package for 1880-2017)and shape it into a table(columns: year, letter, births, share; boys only; share = births with names ending in that letterdivided by all boys' births in the file that year).Make a plotly streamgraph of shares (each year sums to 100%) with splines.- Keep letters that reach 4% in any year and fold the rest into "Other letters".- Names ending in n blue, -d orange, other letters in alternating grays.- Title with the 2017 share of -n names and its low point.
10. What MLB pitchers throw
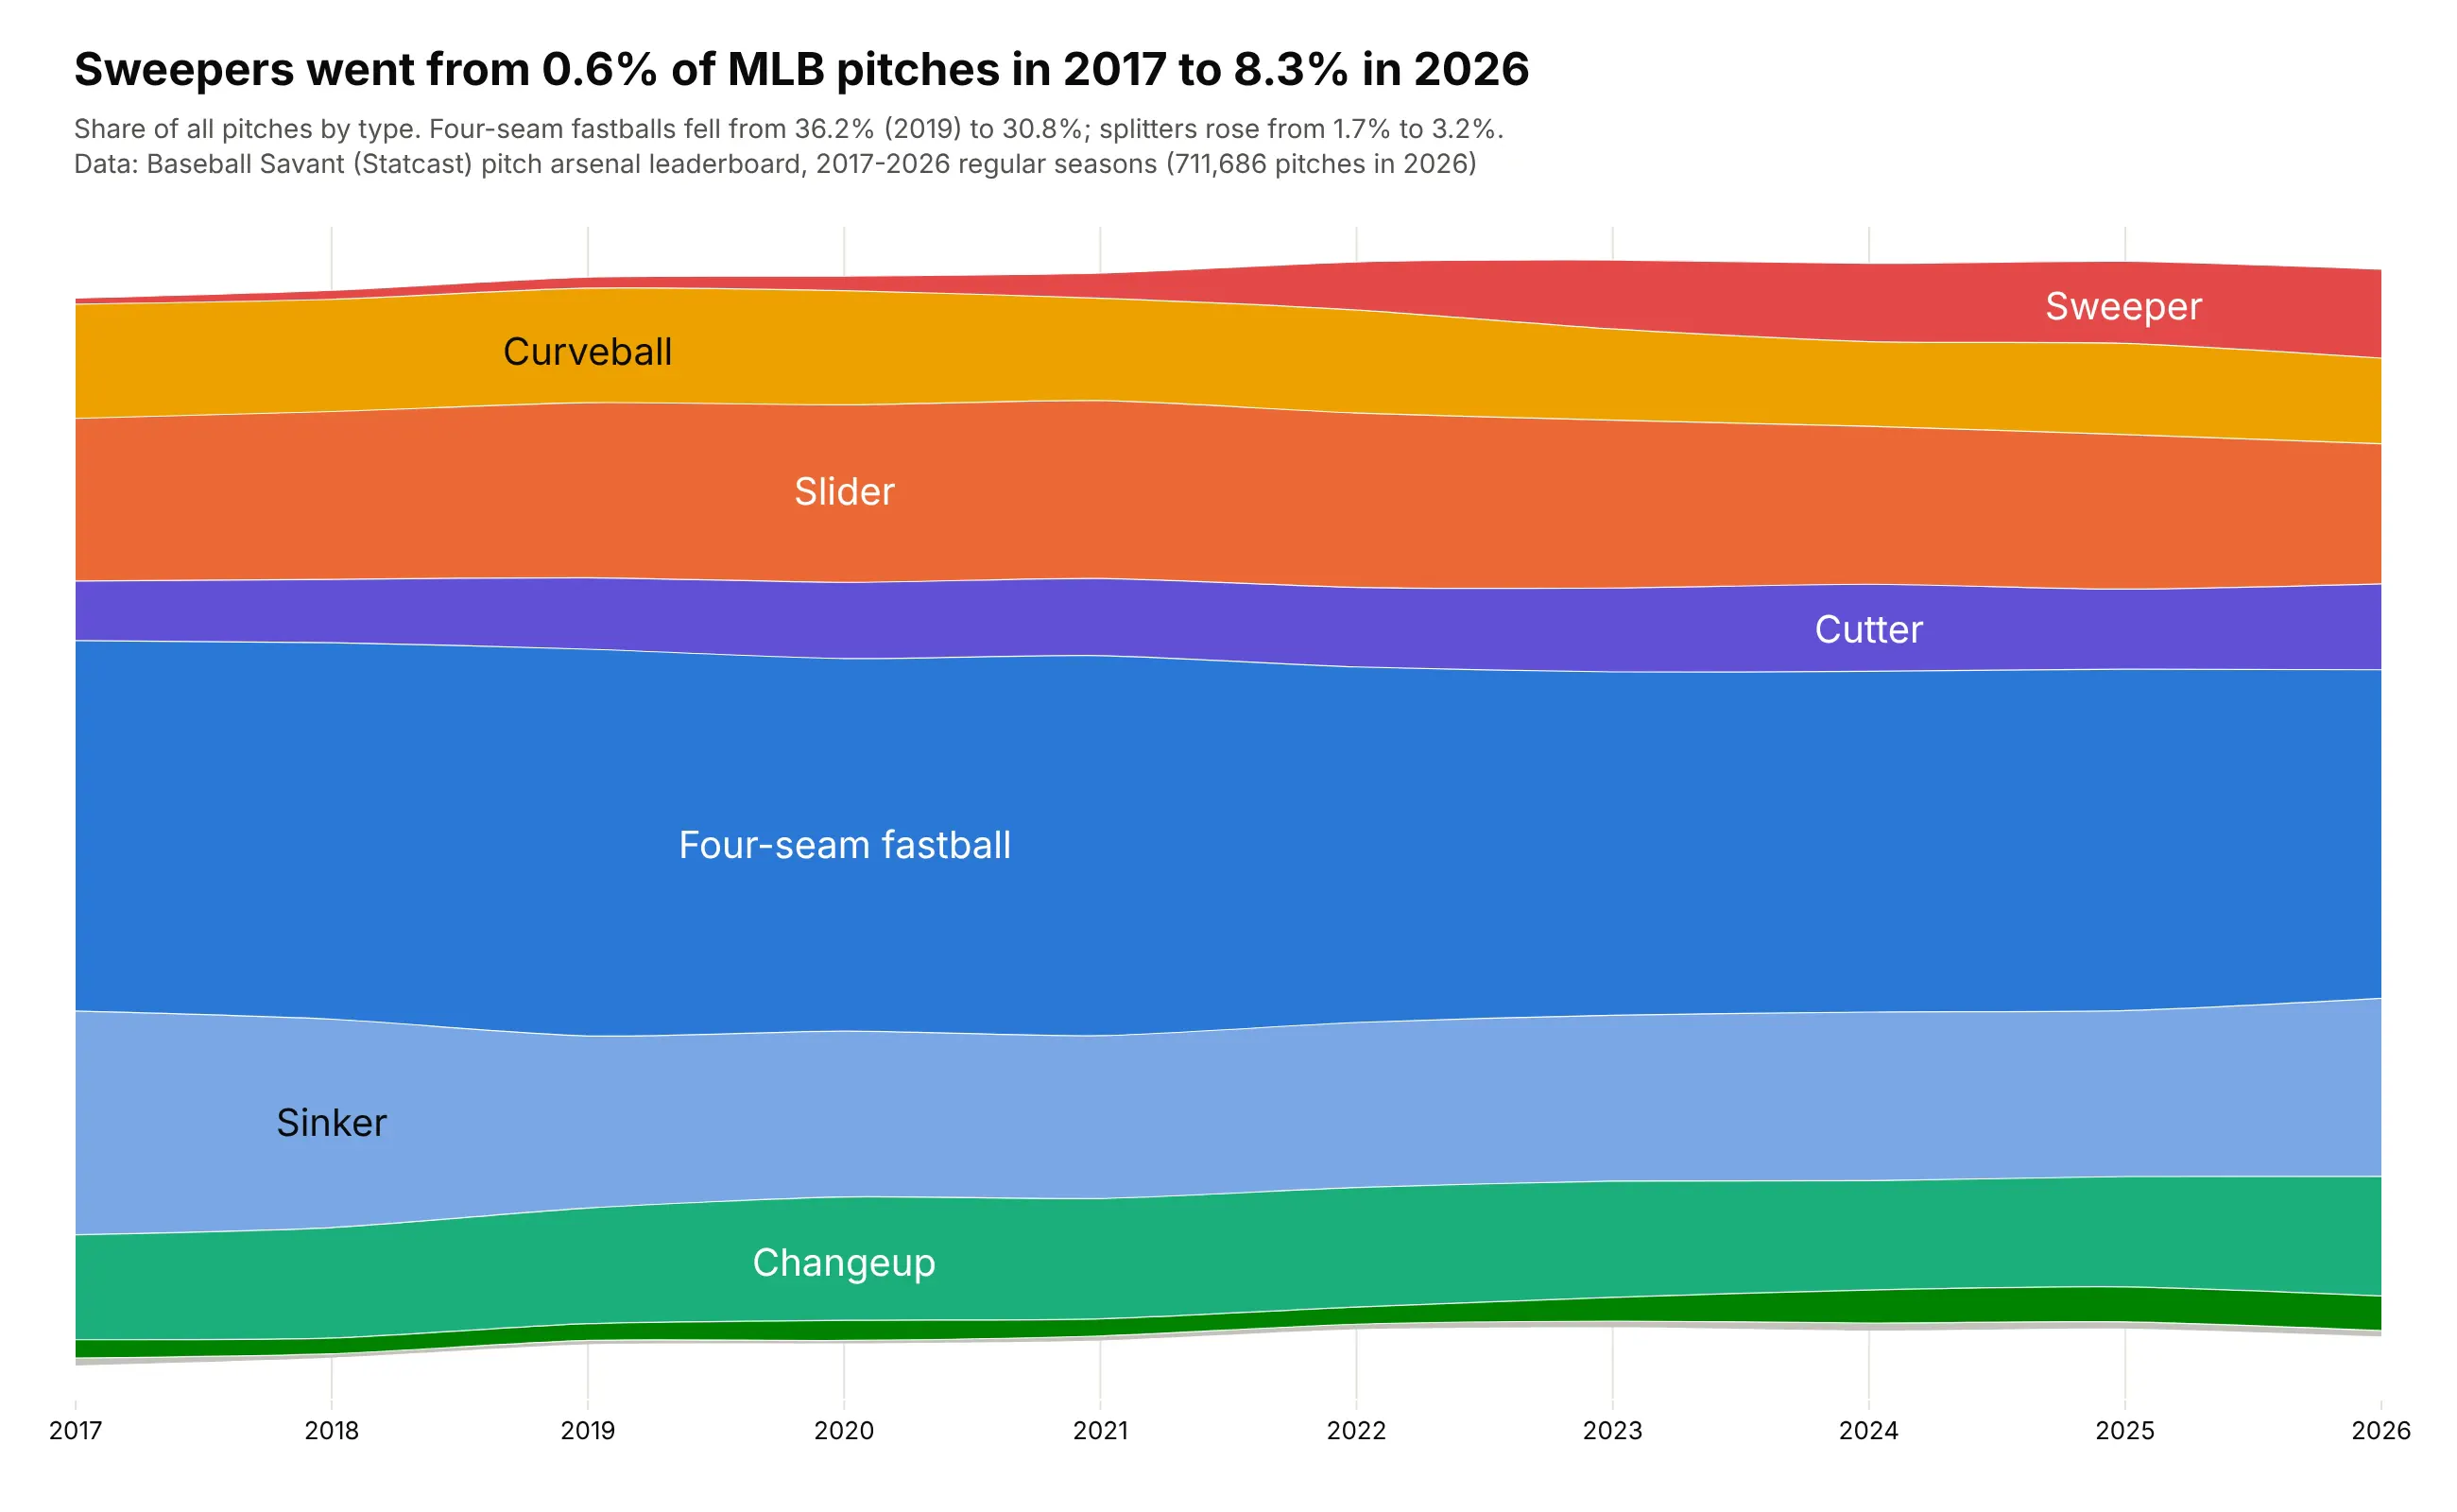
Sweepers went from 0.6% of MLB pitches in 2017 to 8.3% in 2026, while four-seam fastballs fell from 36.2% in 2019 to 30.8%. 2020's 60-game season had 262,443 pitches, 36% of 2019's, which would pinch every layer in a chart of counts. Data: Baseball Savant (Statcast) pitch arsenal leaderboard.
Tip: normalizing removes the short 2020 season from the picture, so the chart shows what pitchers threw, not how many games they played.
Get the data from Baseball Savant's pitch arsenal leaderboard (baseballsavant.mlb.com, one CSV per season2017-2026, type=pitcher, min=1, with a pitches column per pitcher and pitch type)and shape it into a table(columns: season, pitch, pitches; summed over all pitchers).Make a plotly streamgraph of each pitch type's share of all pitches (each season sums to 100%).- Fastballs in blues, breaking balls in warm colors, offspeed in greens; rare pitches as "Other".- Splines through the yearly points; labels inside the layers.- Title with the sweeper's share in 2017 and 2026.
11. Which Olympic sports people read about, day by day
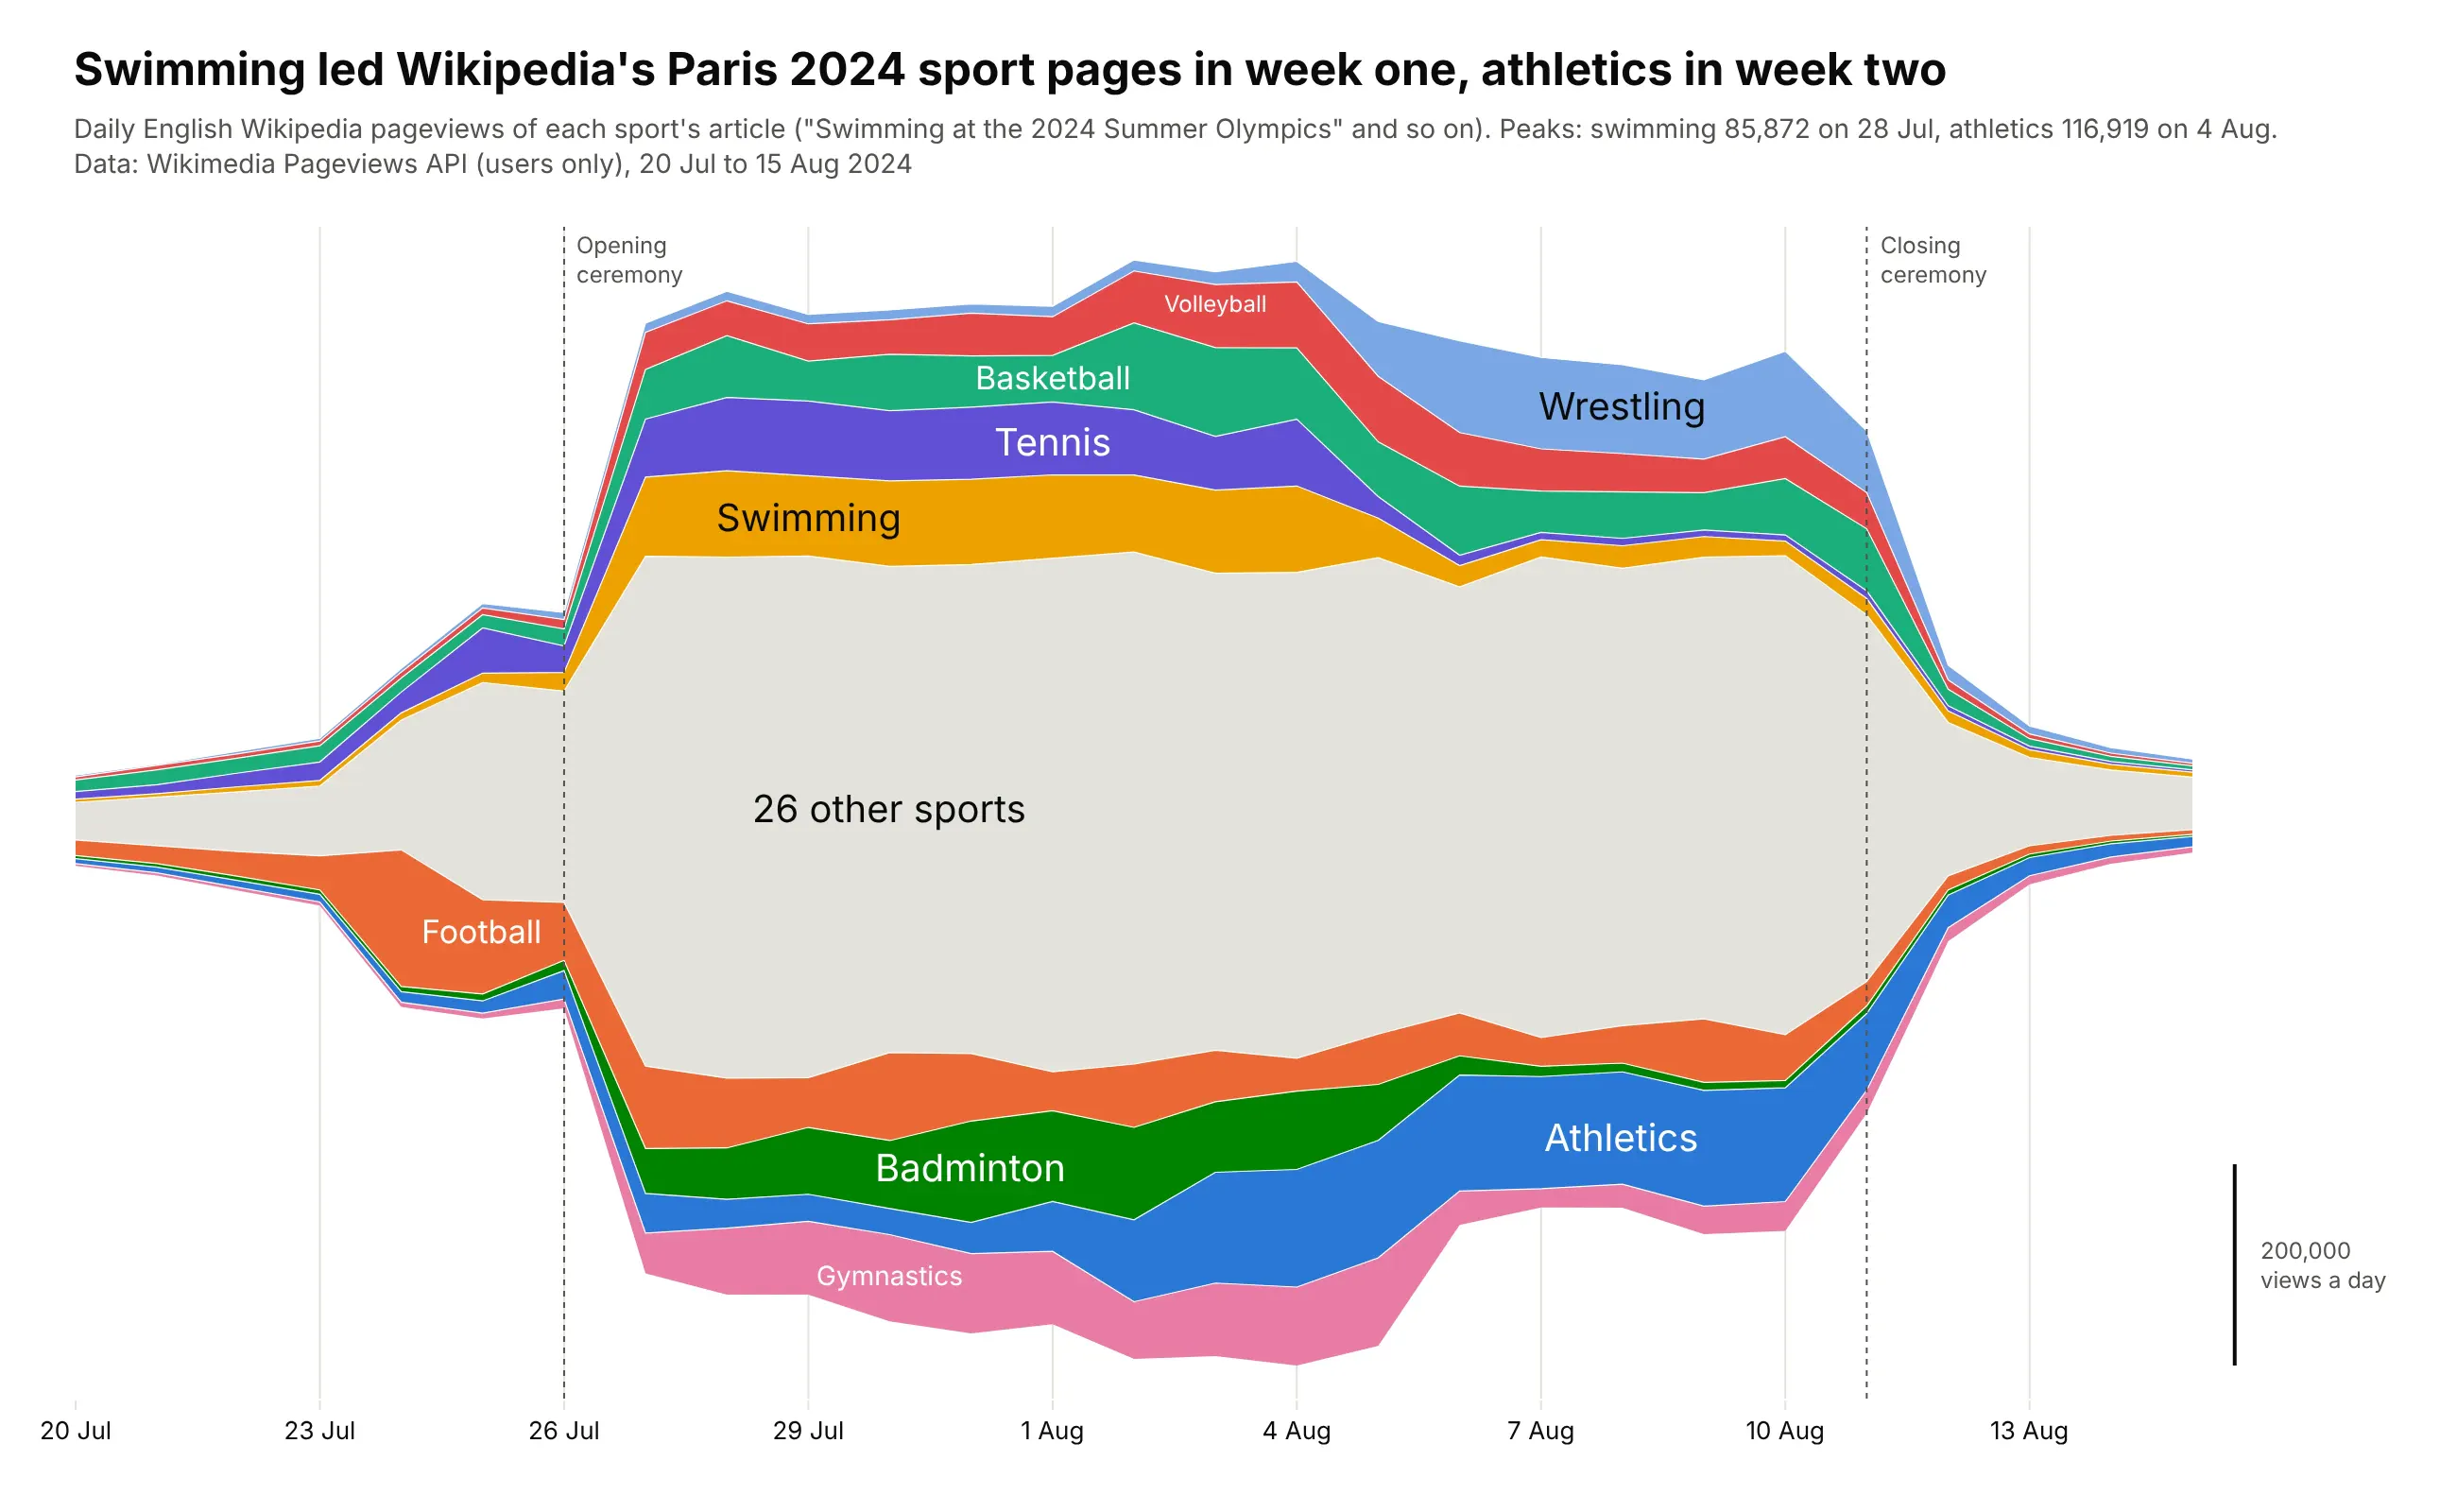
Swimming's Wikipedia article peaked at 85,872 views on 28 July 2024 and athletics at 116,919 on 4 August, so the Paris 2024 schedule shows up in what people read: each sport's layer swells while its events run and fades when they end. Data: Wikimedia Pageviews API.
Tip: the inside-out order puts the sports that peaked first in the middle, so the bulges follow the calendar of the Games from the center outward.
Get the data from the Wikimedia Pageviews API (wikimedia.org/api/rest_v1, per-article, en.wikipedia,agent=user, daily, 20 July to 15 August 2024) for each "<Sport> at the 2024 Summer Olympics" articleand shape it into a table(columns: date, sport, views).Make a plotly streamgraph of daily views with the inside-out layer order (earliest peak in the middle).- Color and label the 9 most-viewed sports; fold the other sports into one gray layer in the middle.- Dotted lines with labels for the opening and closing ceremonies.- Title with the days swimming and athletics peaked.