Chris Parmer
October 24, 2026
Waterfall Charts - A Complete Guide
TL;DR
- A waterfall chart shows how a starting value becomes an ending value through a series of increases and decreases, with each bar starting where the previous one ended.
- Waterfall charts are also known as bridge charts, cascade charts and flying bricks charts, and are similar to funnel charts and Sankey diagrams.
- Use one for anything that is a sum of signed steps: an income statement, a bridge from last year to this year, a cash flow, a fund balance or the components of a change.
- Mark subtotals as totals, not as steps, or the chart counts them twice without an error. Use a line chart for values over time and a sorted bar chart to rank many changes.
- Any coding agent can make one with Plotly in a minute. In Python it's go.Waterfall(x=..., y=..., measure=...).
What is a waterfall chart?
Waterfall charts look like this:
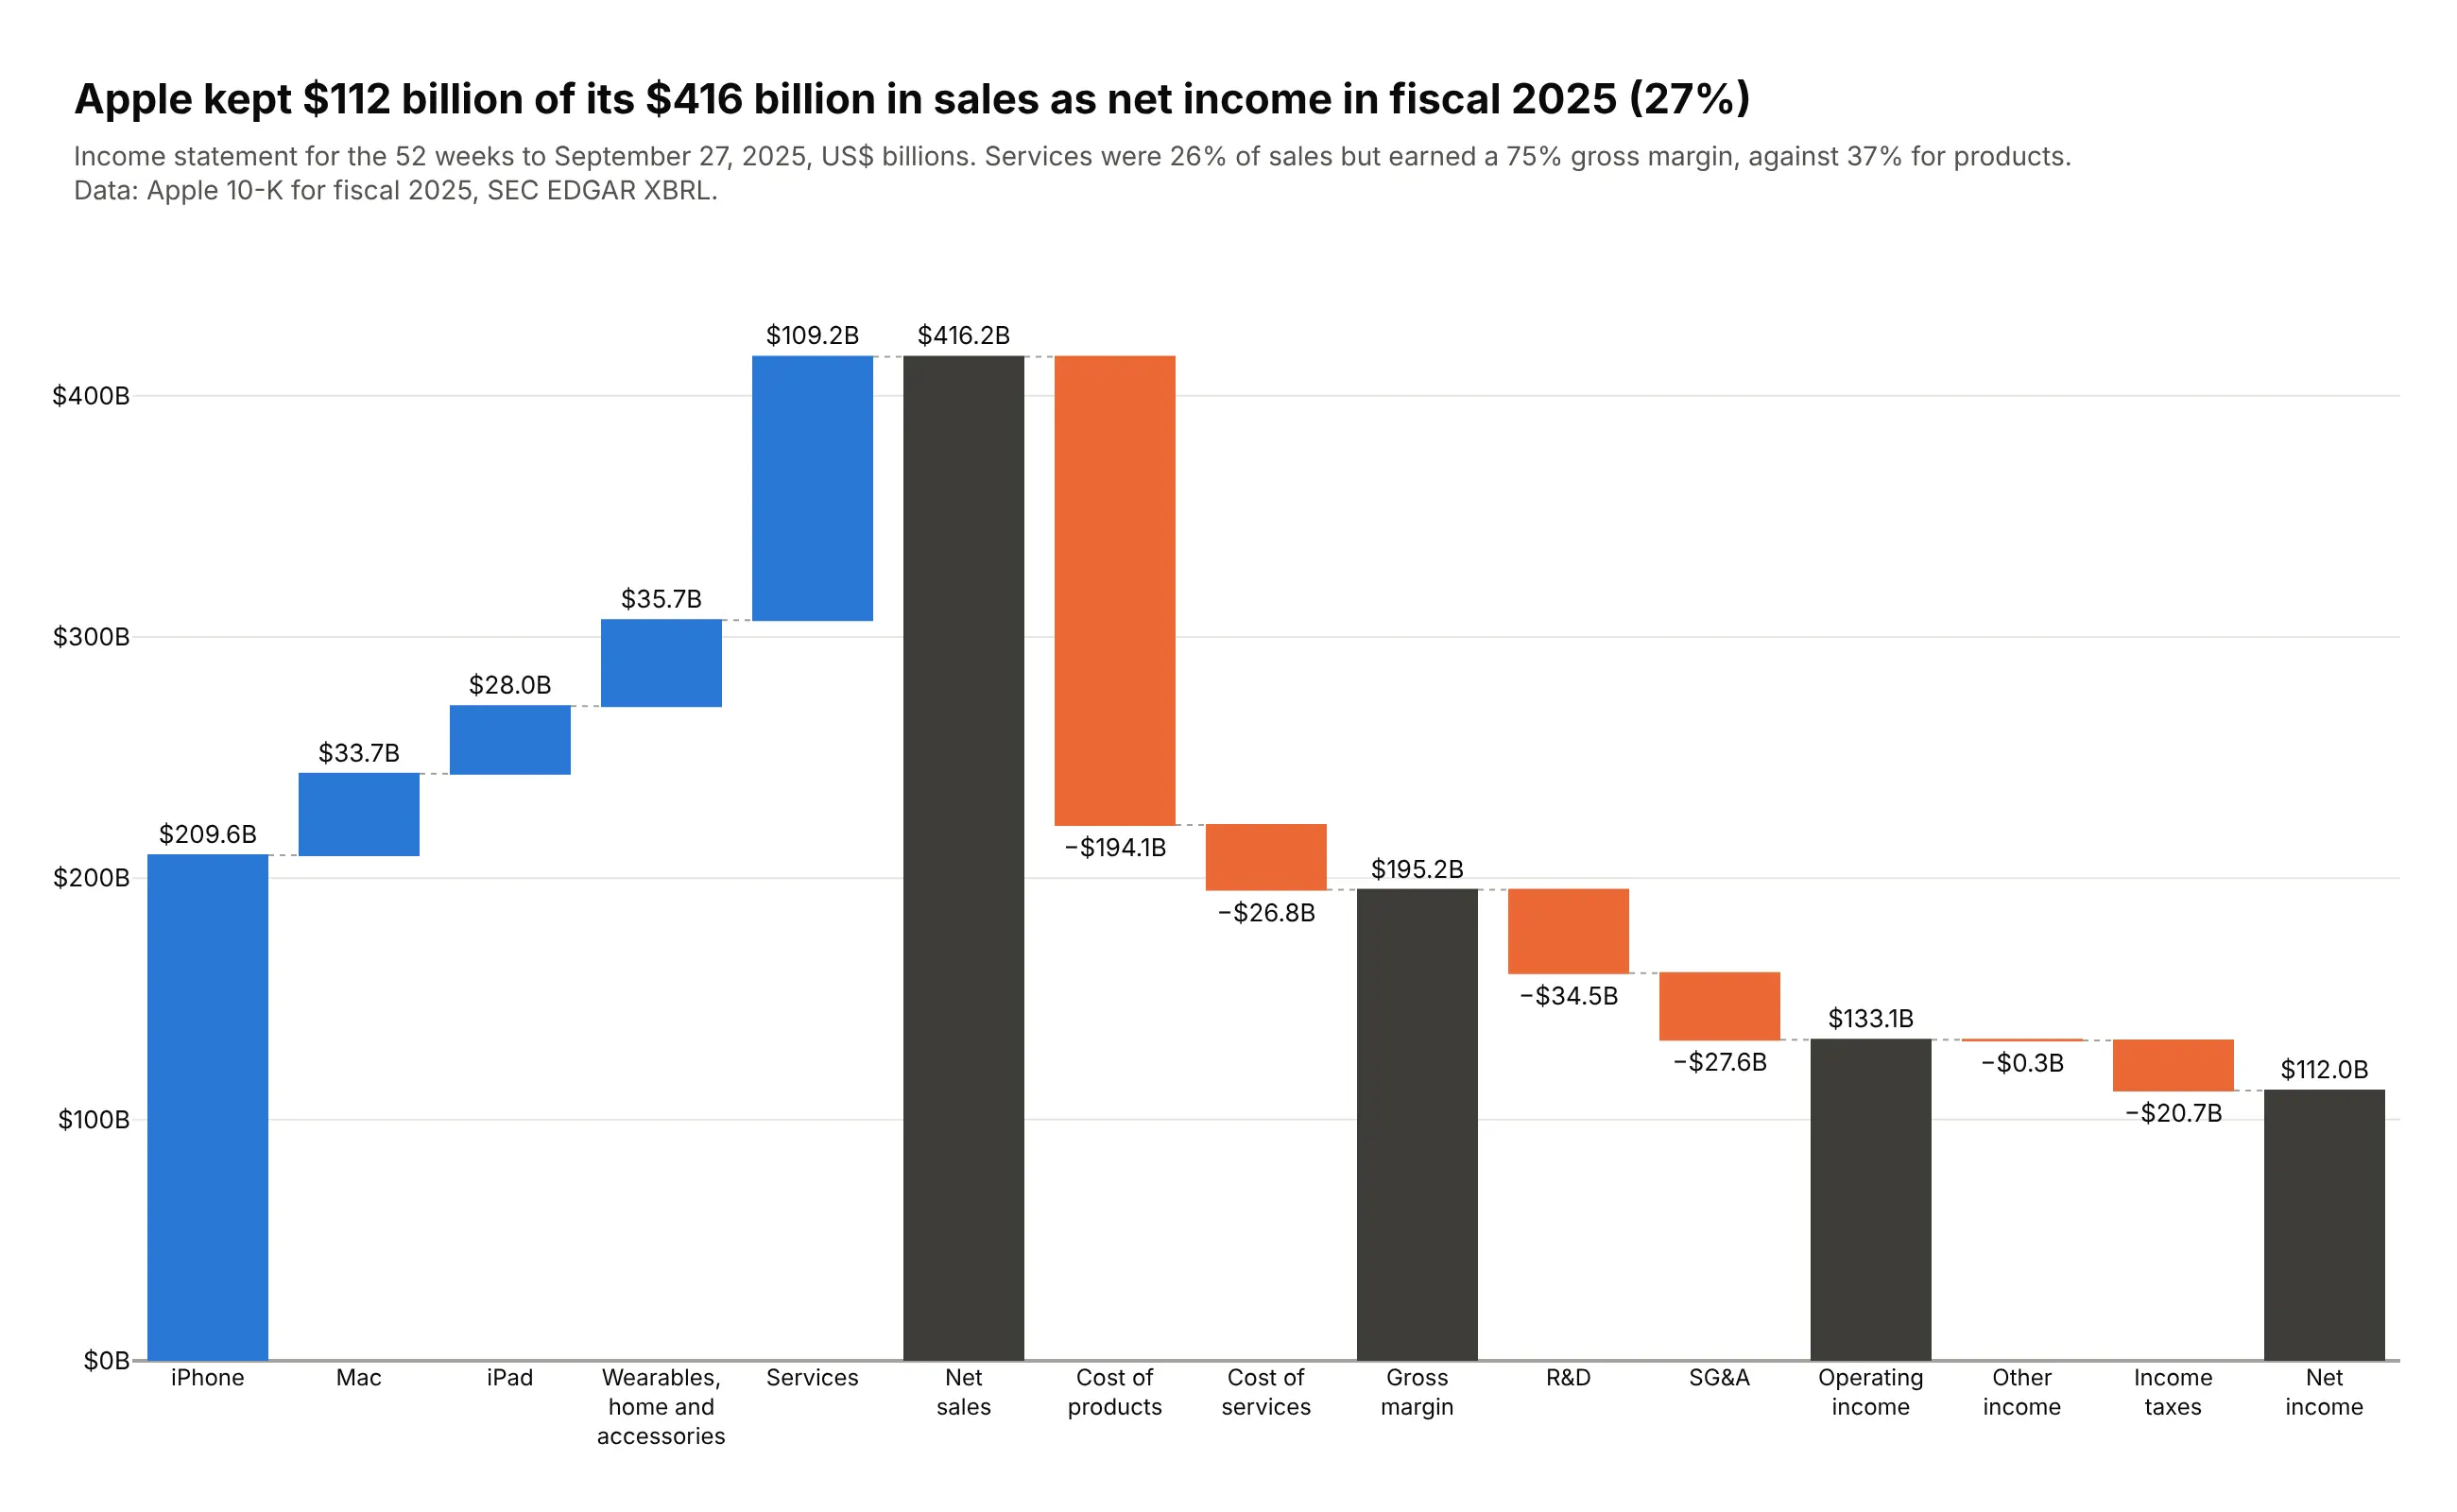
Data: Apple 10-K for fiscal 2025, SEC EDGAR XBRL.
How do you read a waterfall chart? In the example above, notice these things:
- Each blue bar is one of Apple's product lines. iPhone starts at zero and every other step starts where the bar before it ended, so the five steps climb to Services like a staircase.
- The dark bars are totals drawn from zero, so you can read them straight off the axis. Net sales is the tallest at $416.2 billion, and gross margin, operating income and net income show what is left after each group of costs.
- Each orange bar is a cost, and its length is how much it takes away from the running total. Cost of products is by far the longest step down, while other income is so small that it is almost a line.
- The thin dashed lines join the end of one bar to the start of the next, which lets your eye follow the running total from left to right.
- Apart from iPhone, only the dark bars start at zero, so for a floating step the axis tells you where it sits in the running total. The size of a step is the length of its bar, which is the number in its label, such as the $35.7B for wearables, home and accessories.
It's often used for charts like these:
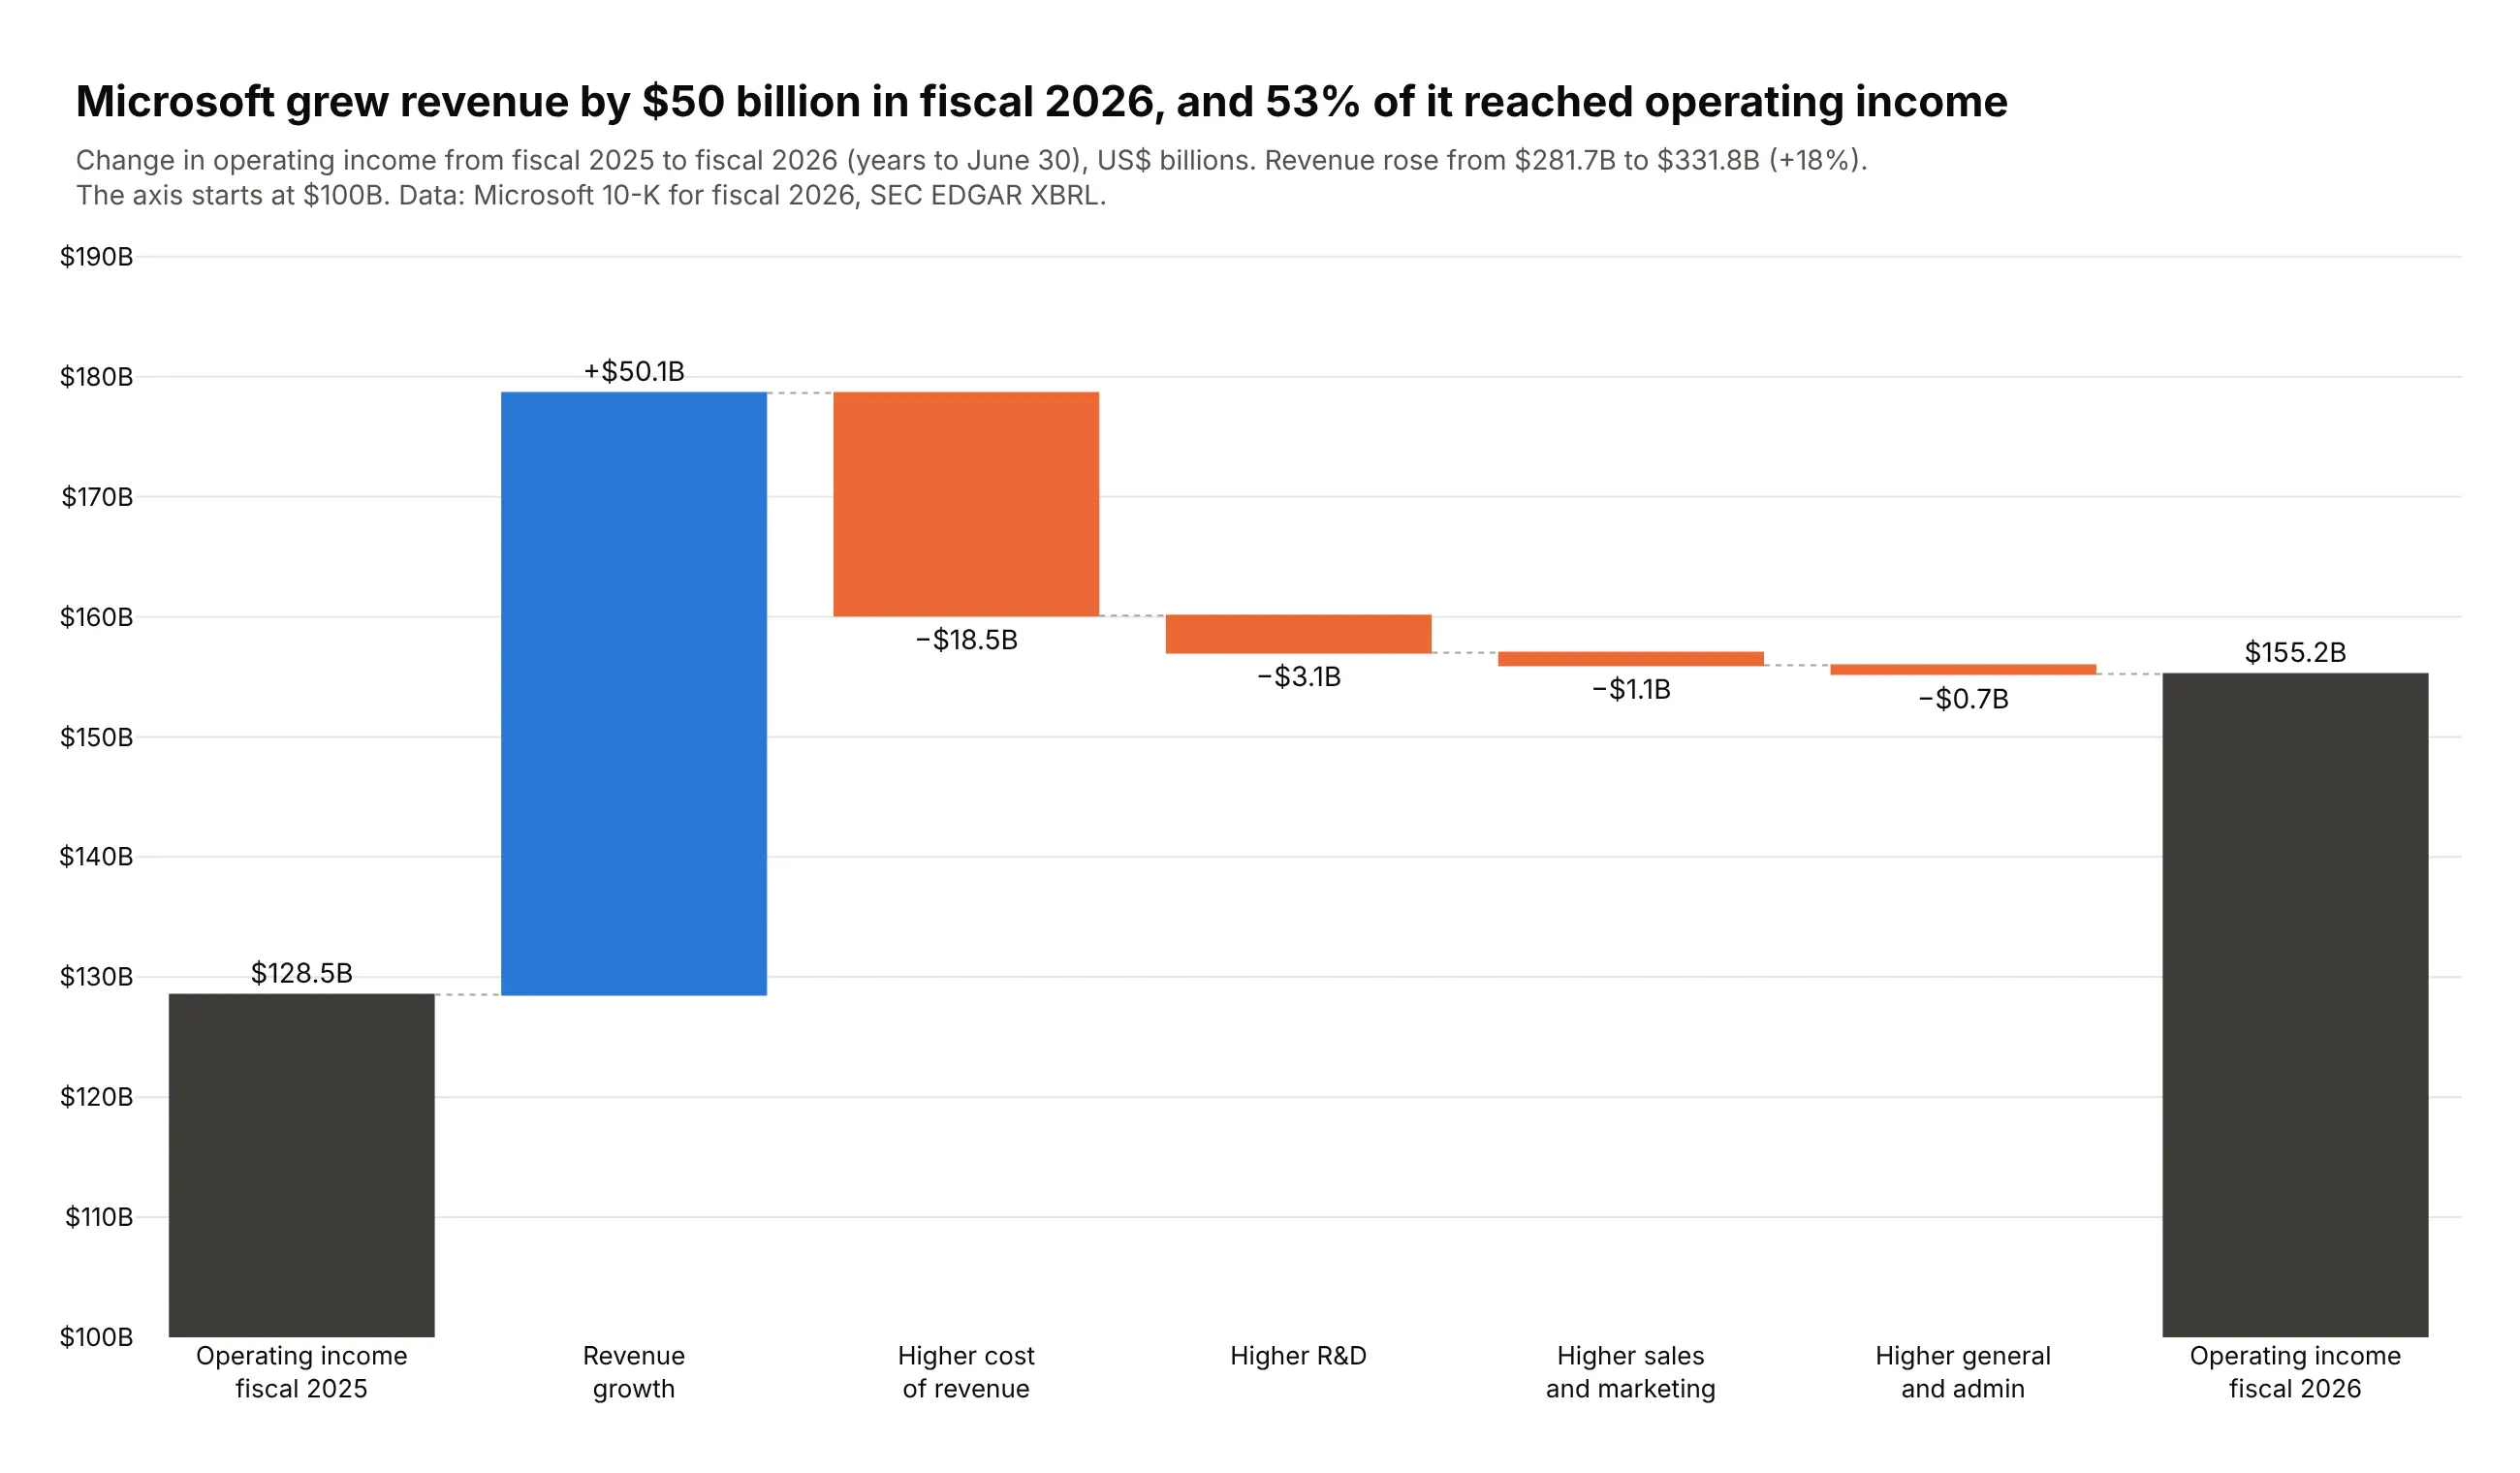
A bridge from last year to this year. Microsoft's revenue grew $50.1 billion in fiscal 2026, and 53% of it reached operating income, which rose from $128.5 billion to $155.2 billion. Data: Microsoft 10-K for fiscal 2026, SEC EDGAR XBRL.
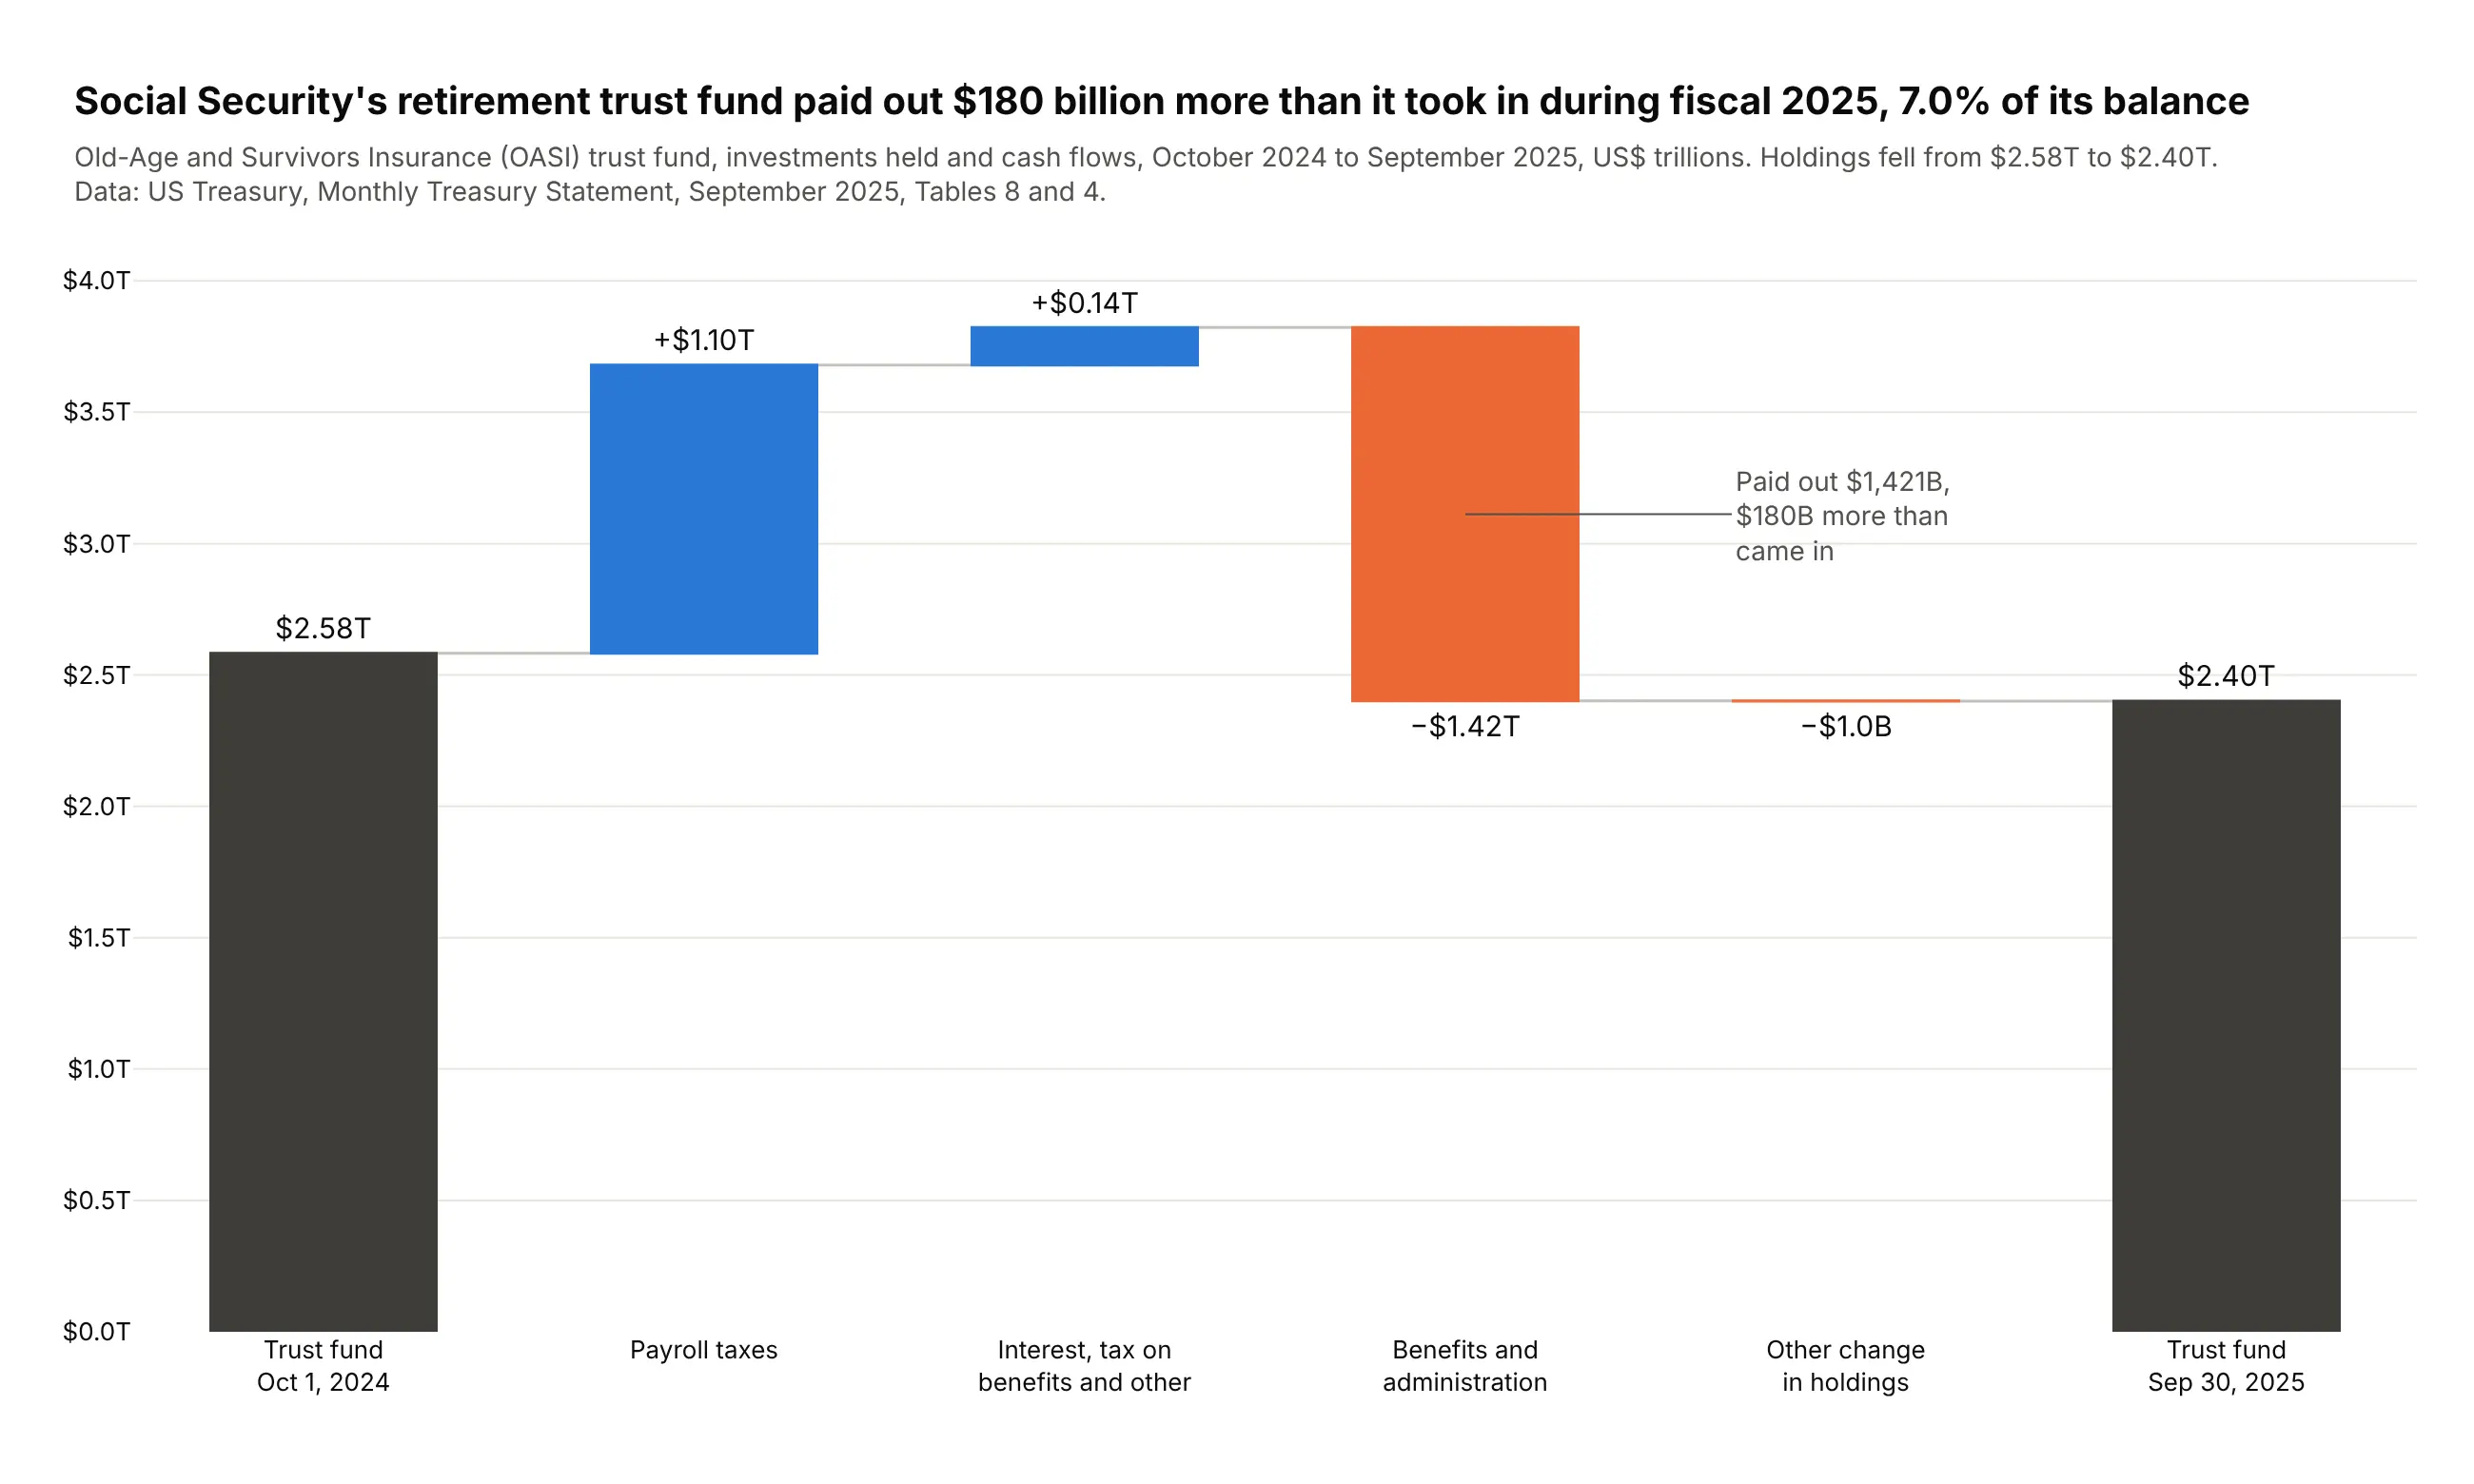
An opening balance, the flows and a closing balance. Social Security's retirement trust fund paid out $1.42 trillion in fiscal 2025, $180 billion more than it took in, so its holdings fell from $2.58 trillion to $2.40 trillion. Data: US Treasury, Monthly Treasury Statement, September 2025, Tables 8 and 4.
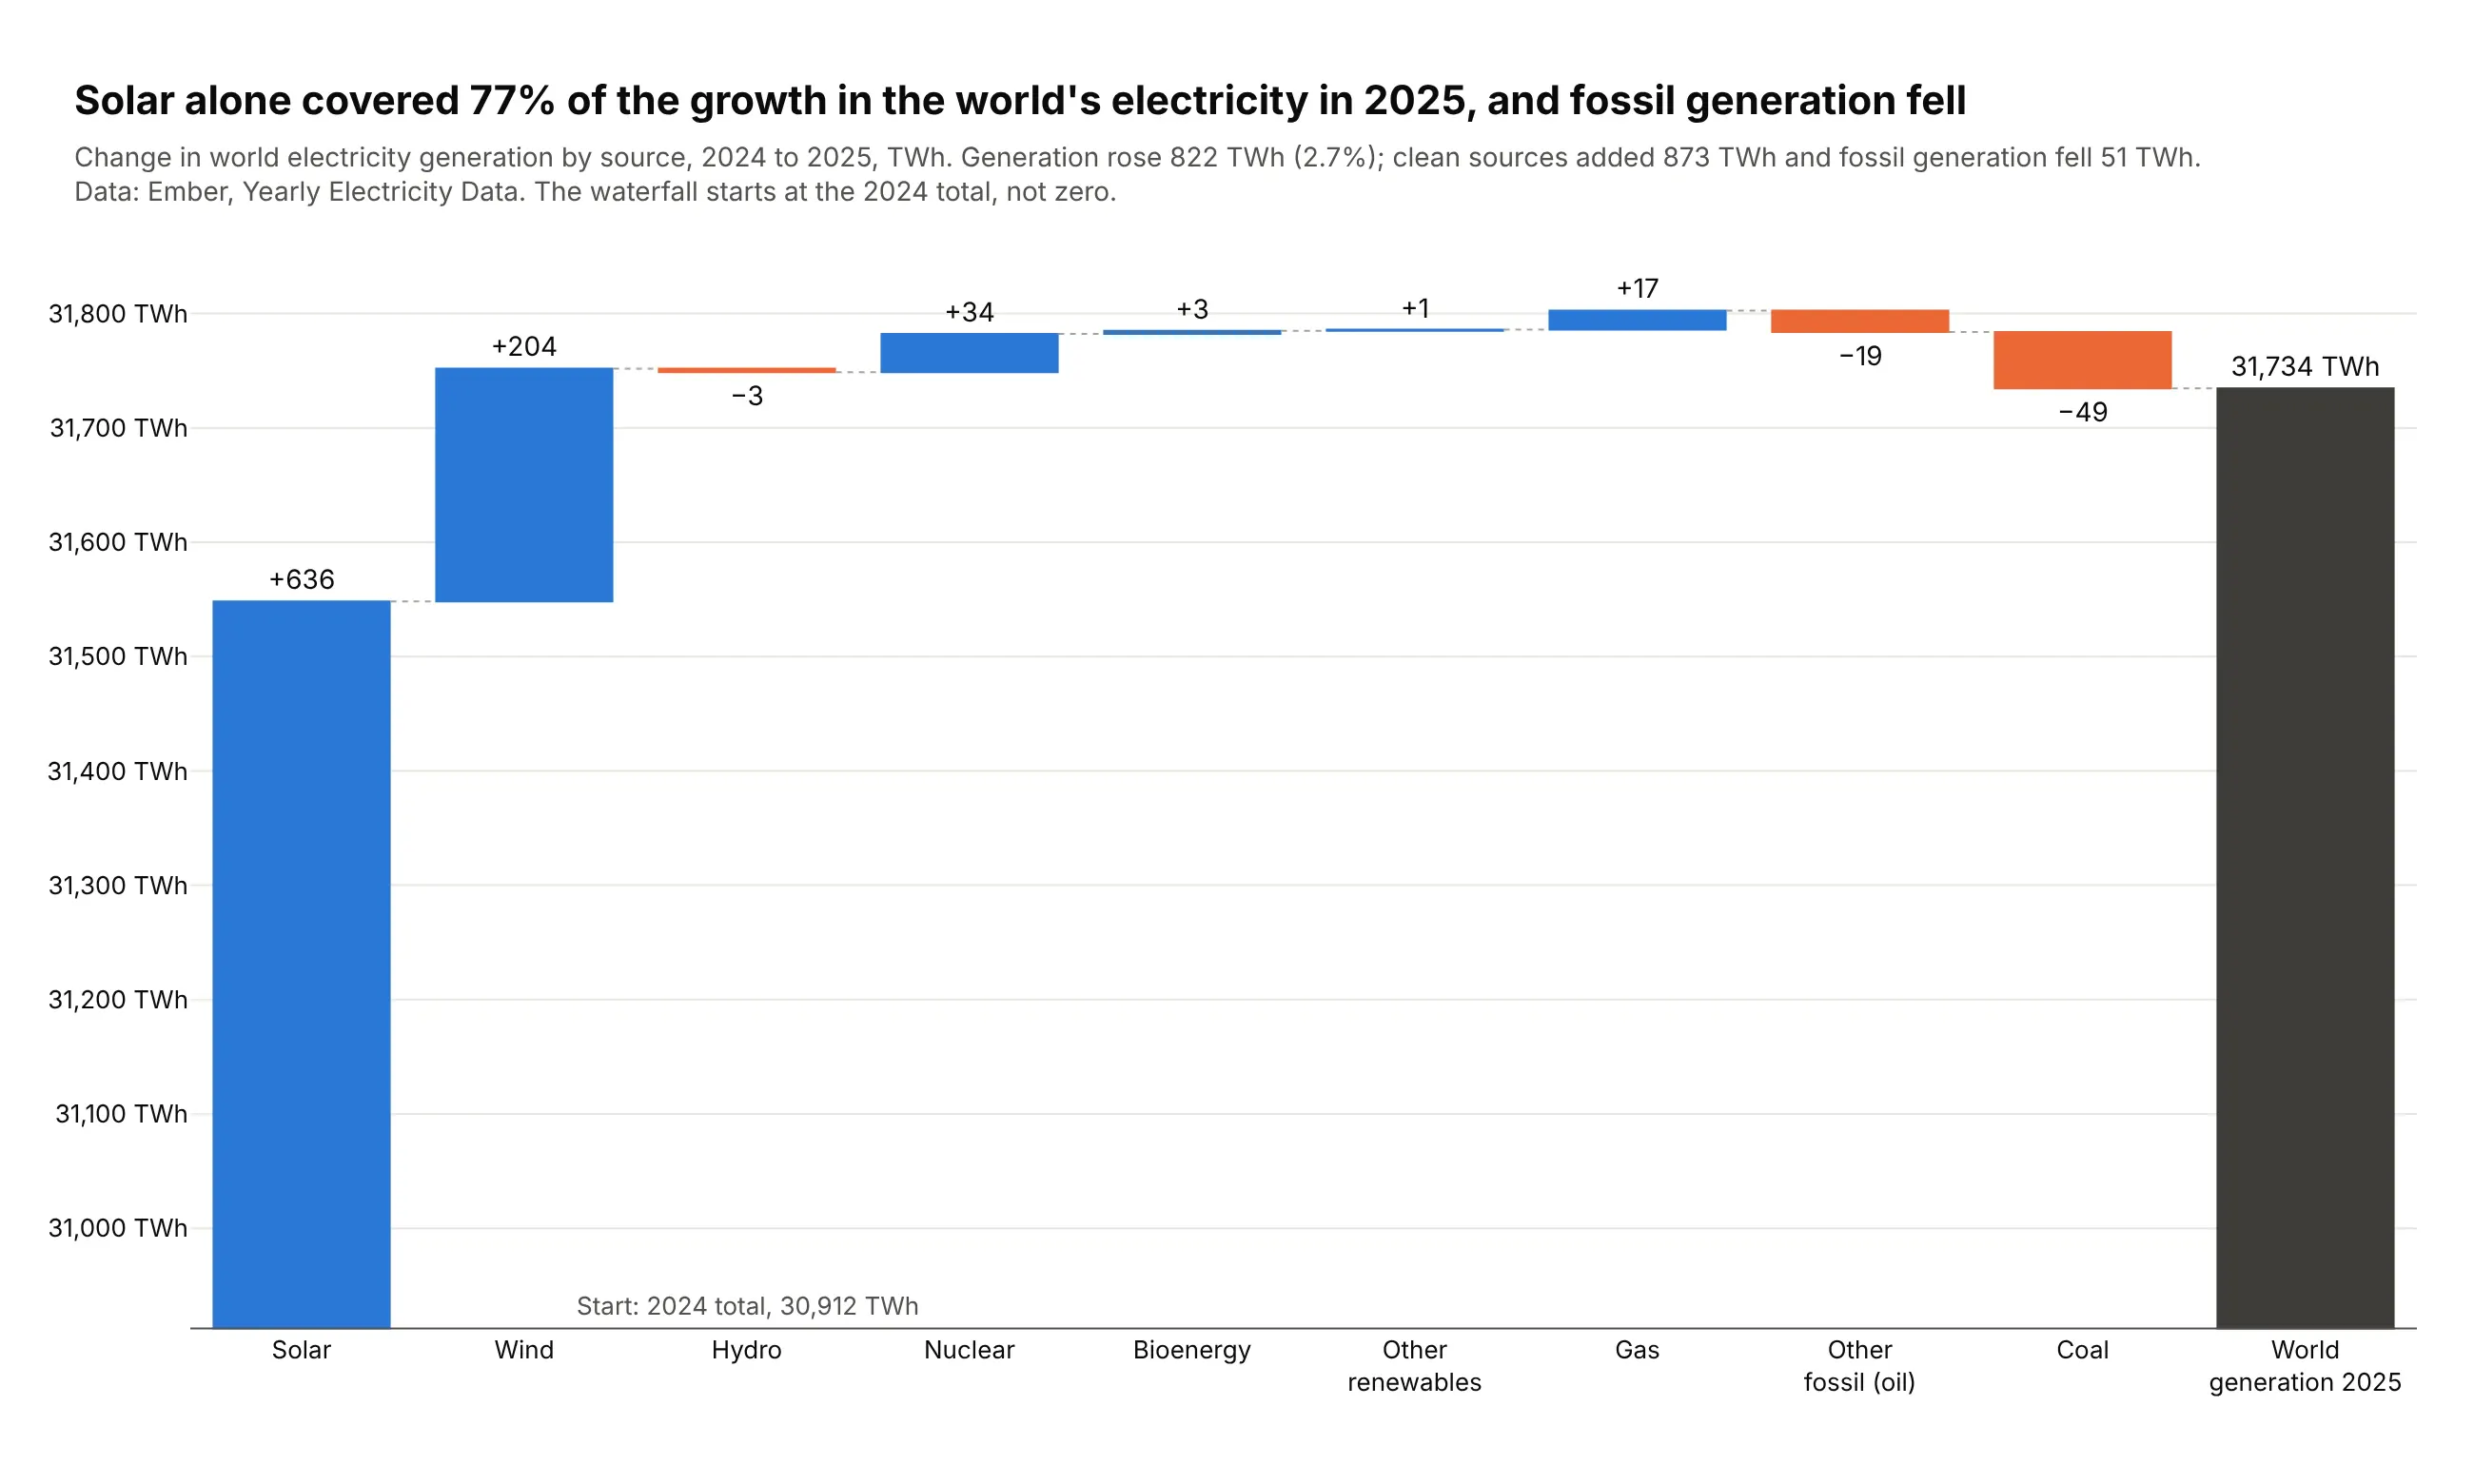
The components of a change. World electricity generation rose 822 TWh in 2025, and solar alone added 636 TWh, 77% of the growth. Data: Ember, Yearly Electricity Data.
A short history
The waterfall chart comes from management consulting and corporate finance, where it is also called a bridge chart, and before charting tools had one built in, people drew it in spreadsheets as a stacked bar chart with an invisible bottom series that lifts each step to the running total:
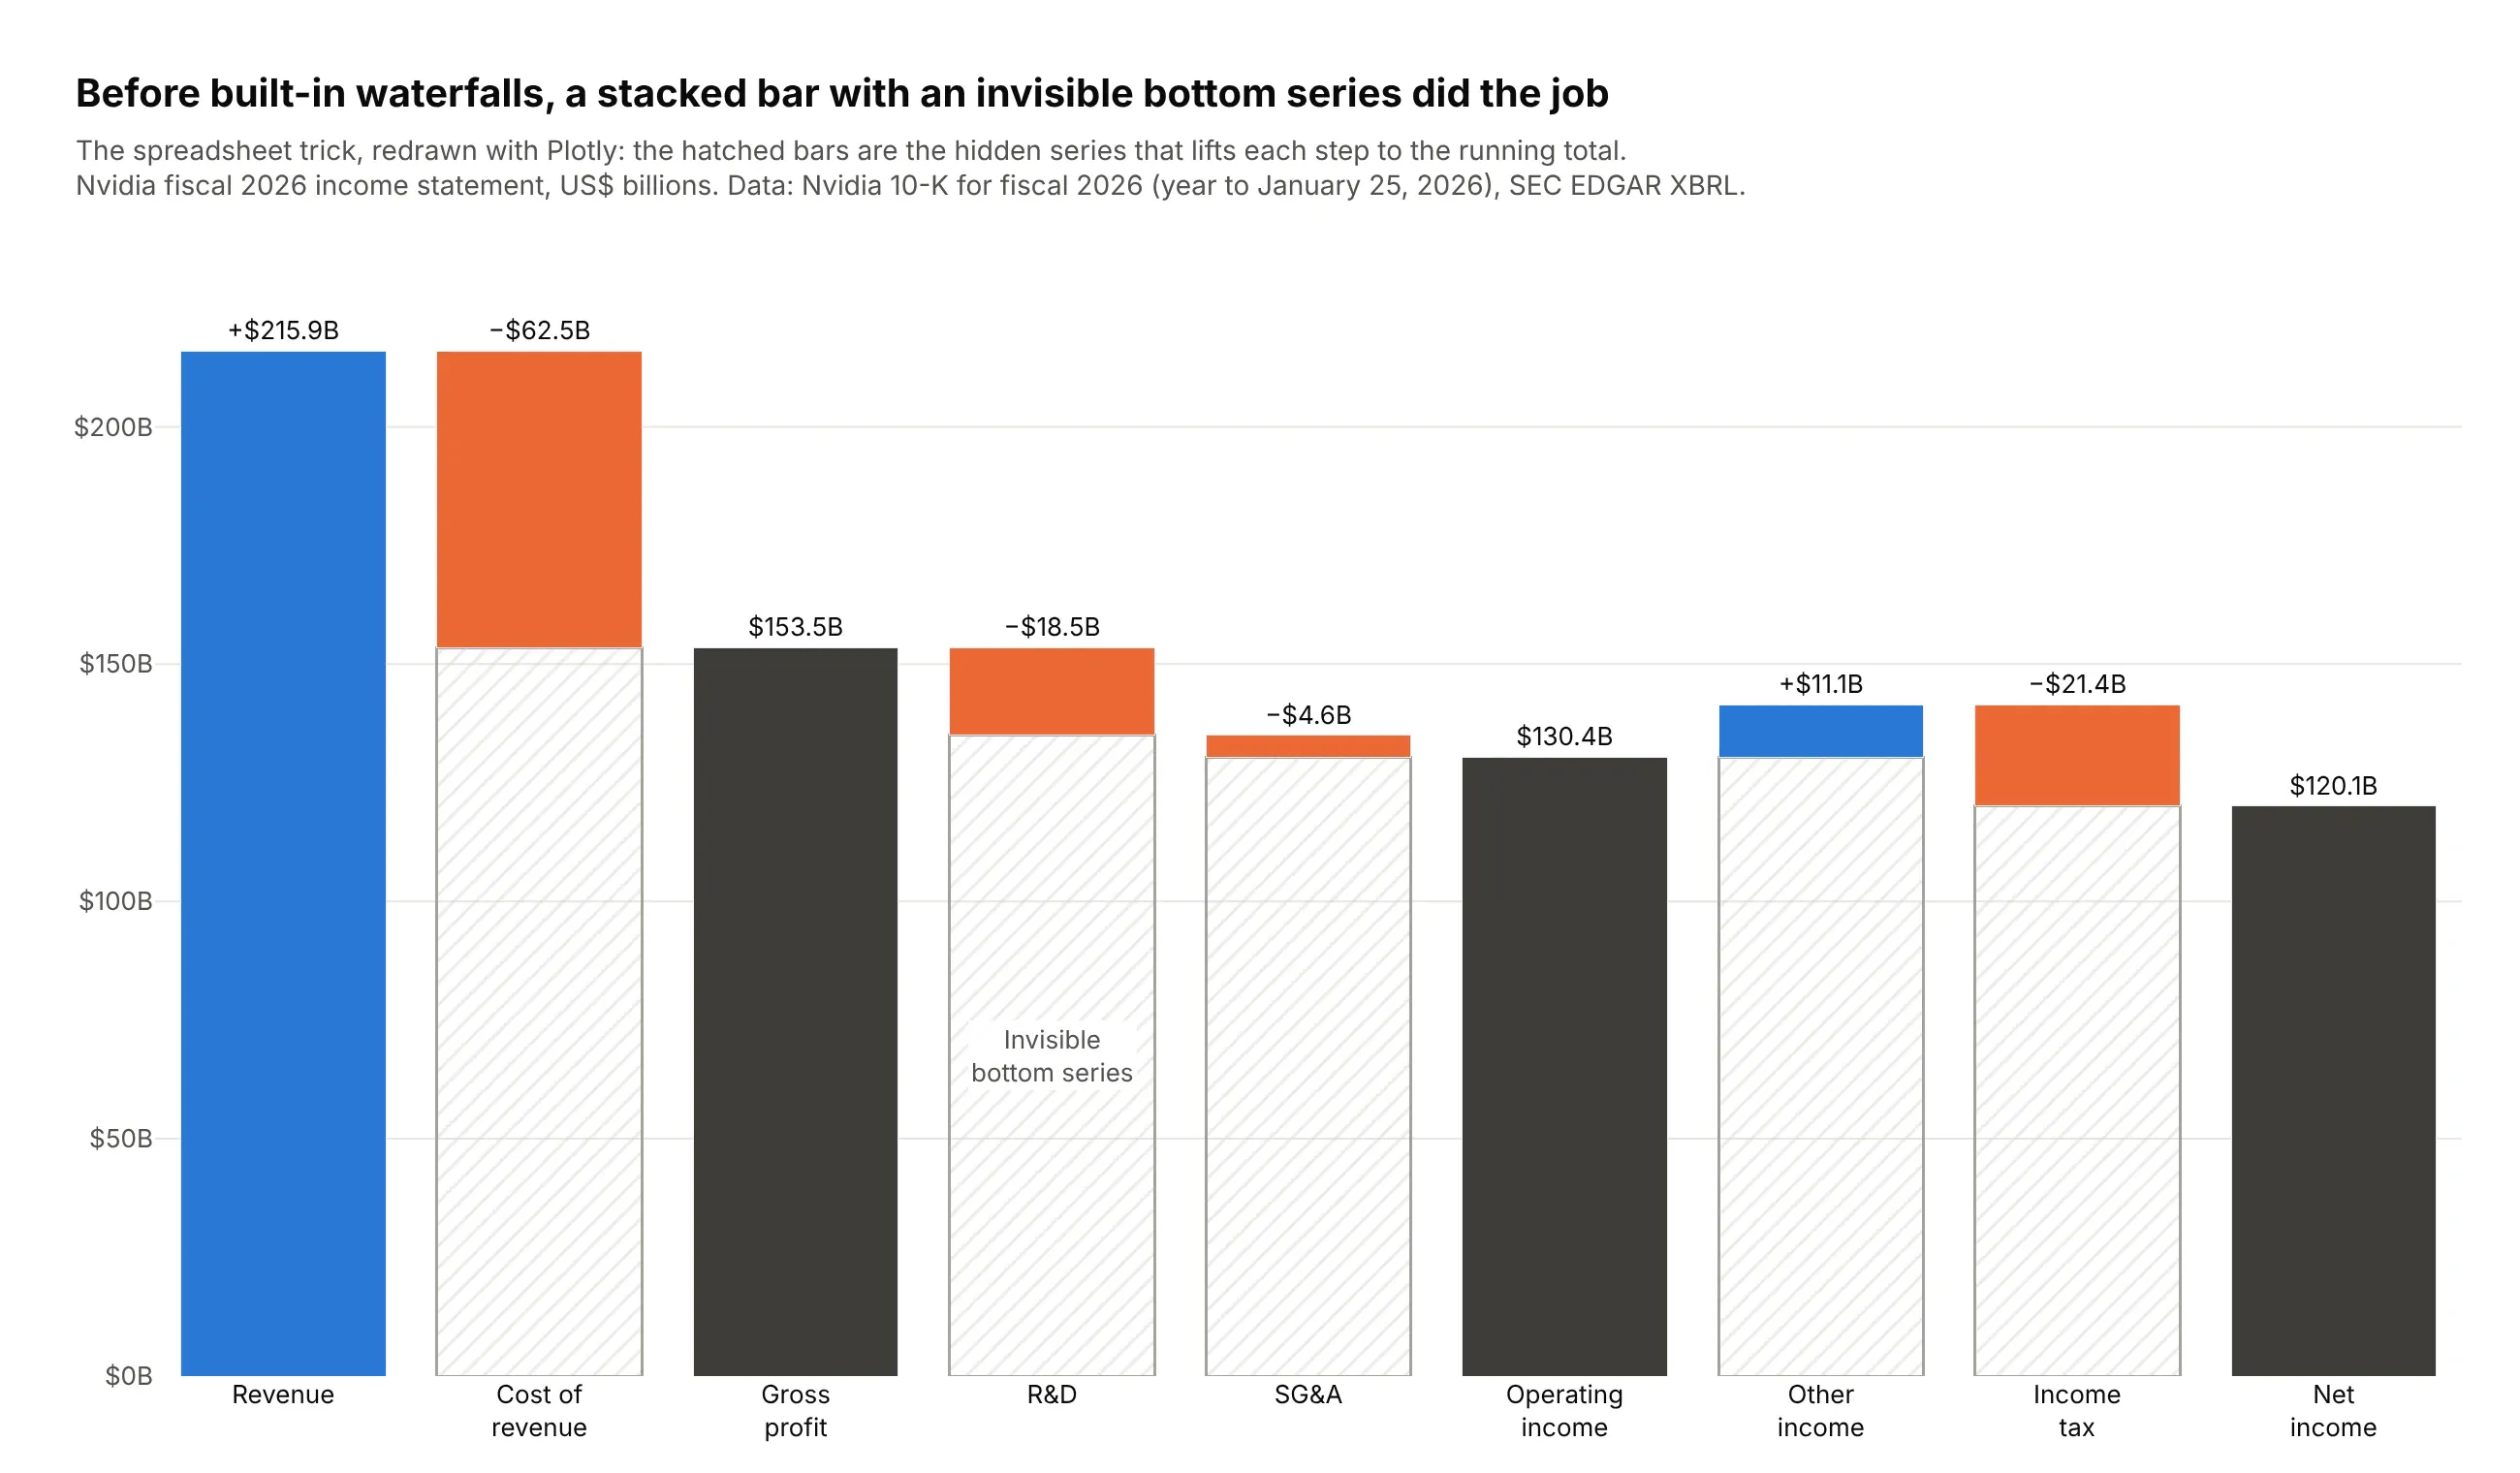
Microsoft added a built-in waterfall chart to Excel 2016, and plotly.js added the waterfall trace in version 1.46.0 on April 1, 2019.
Alternatives to a waterfall chart
Here's the same income statement drawn six ways. Some are better for the question, some worse, some just different:
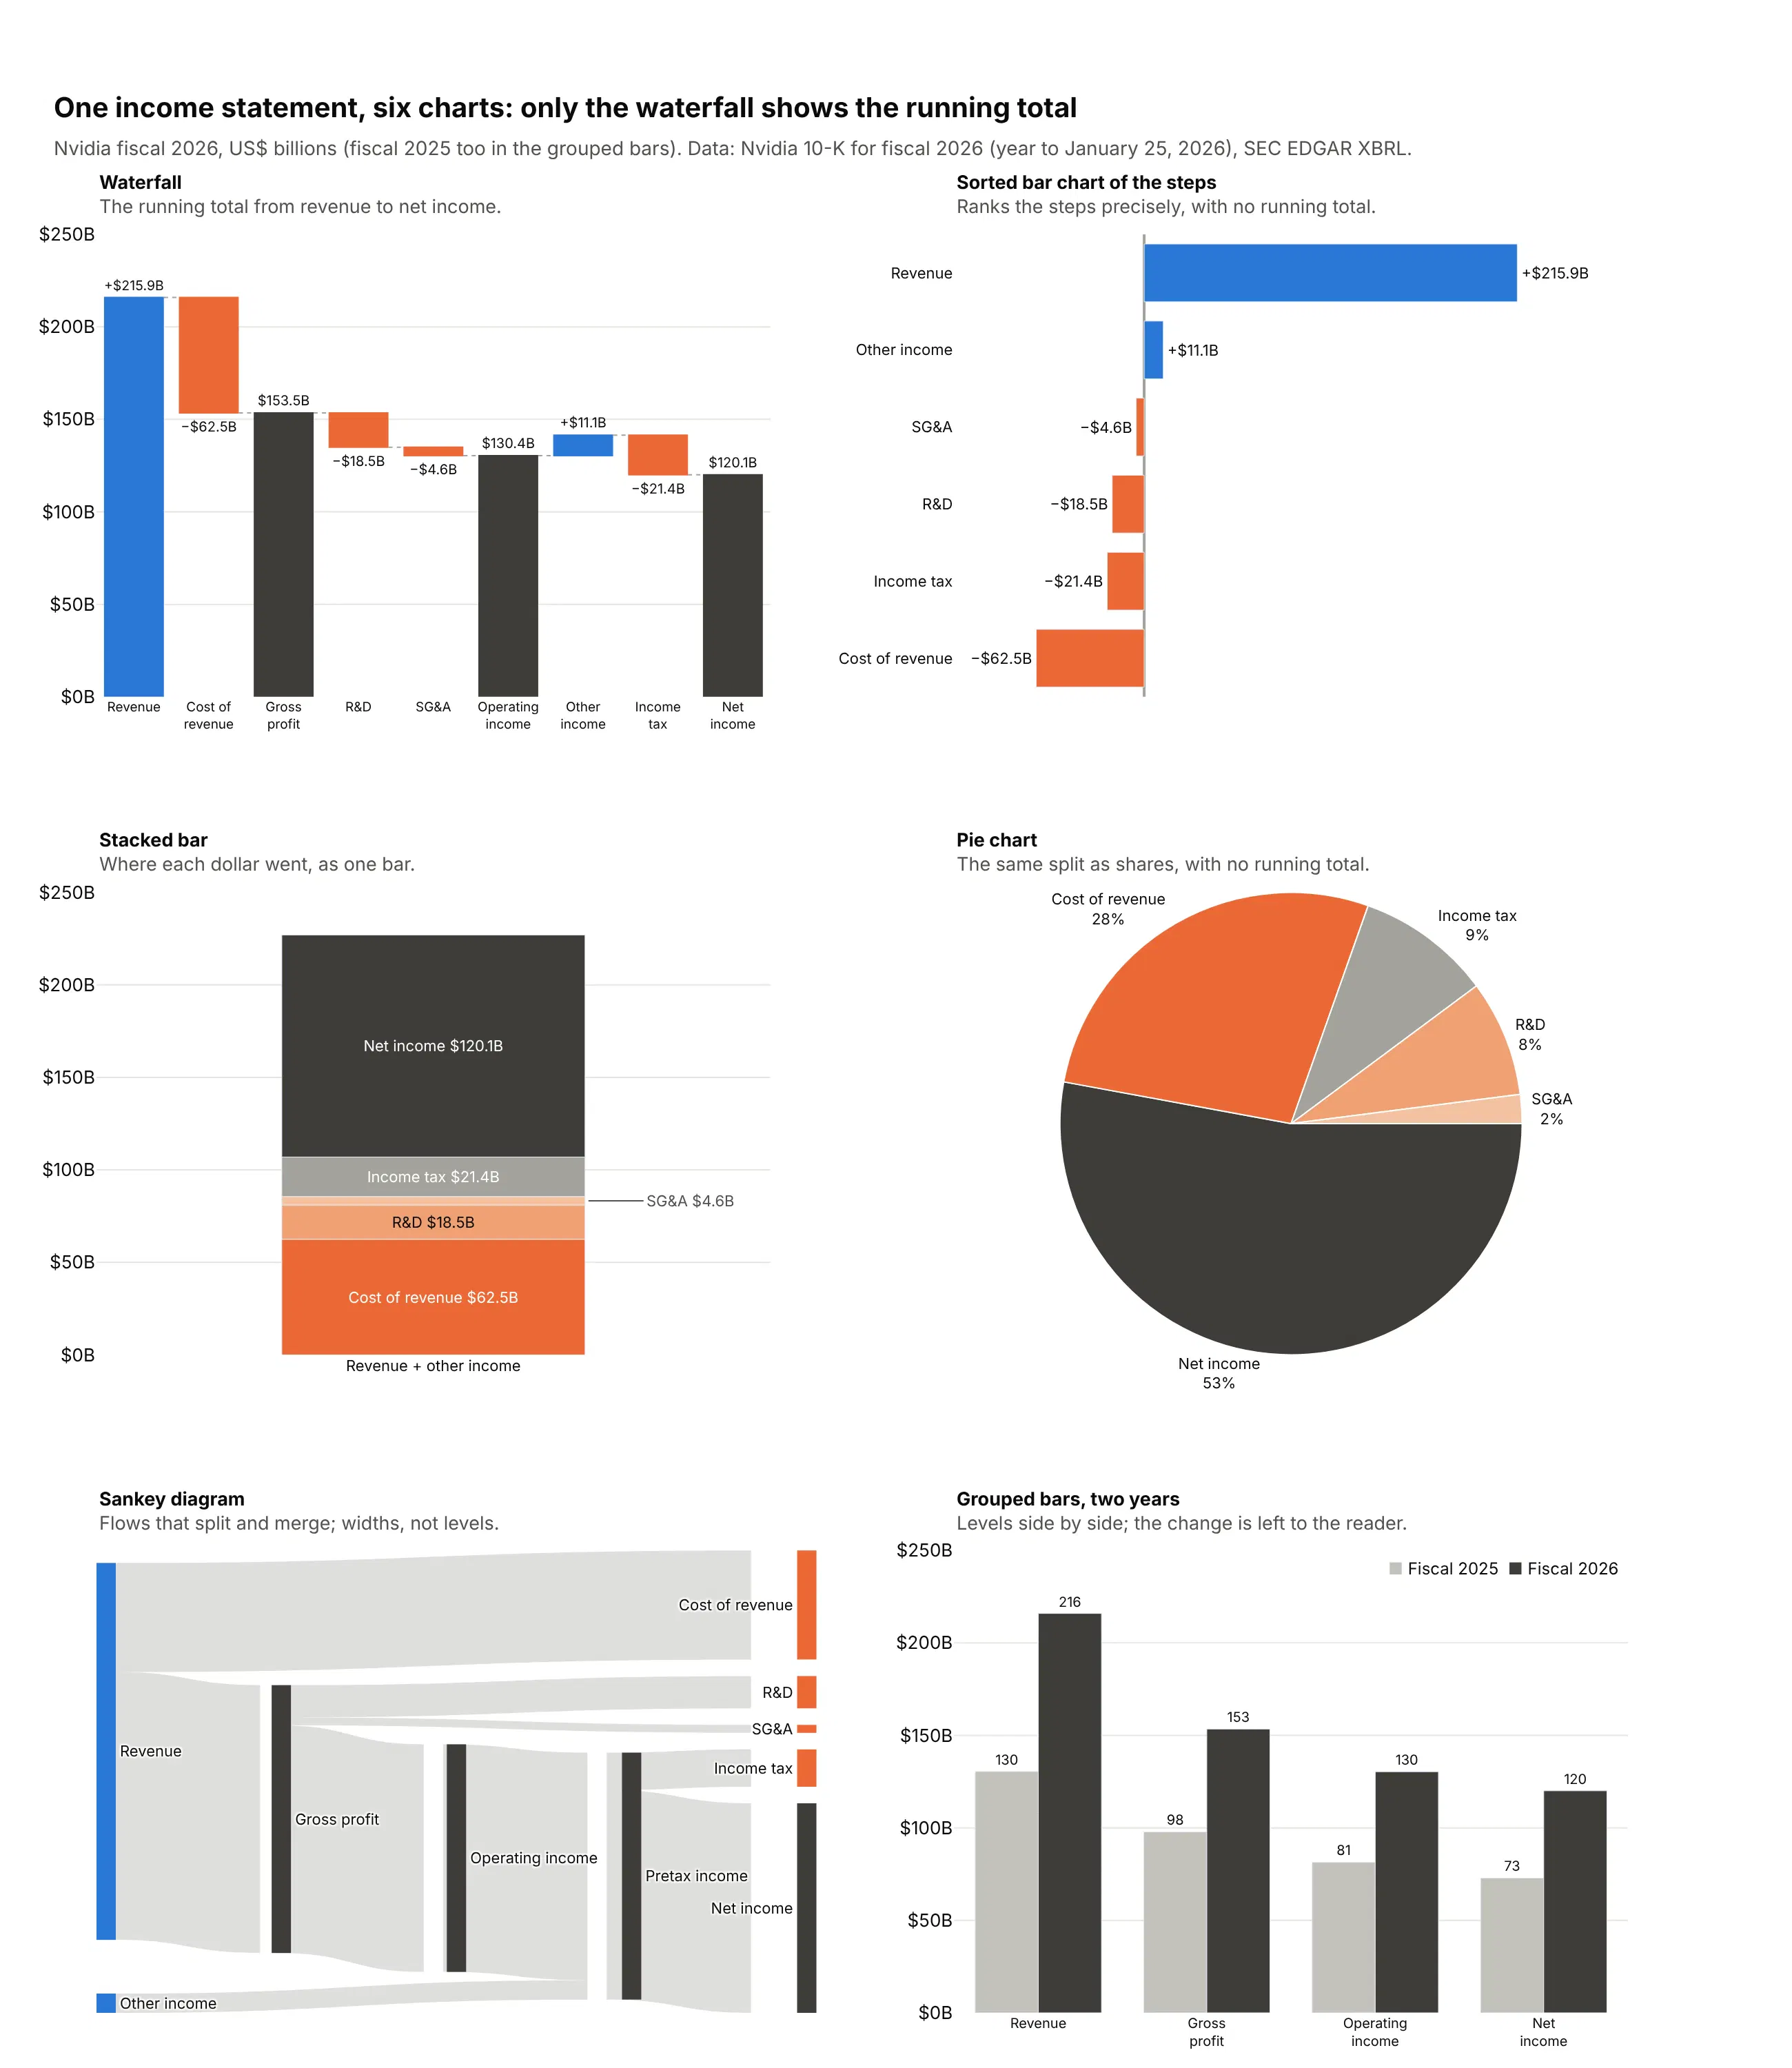
- Sorted bar chart of the steps (better for ranking many changes). Bars on a shared baseline are compared more accurately than floating bars, as Cleveland and McGill (1984) and Heer and Bostock (2010) measured, so use one when the reader needs to rank twenty small changes. You lose the running total.
- Stacked bar (works too, for one split). Shows where each dollar of revenue went, here $120.1 billion of net income out of $227.0 billion of revenue and other income, but not the levels in between.
- Pie chart (worse). The same split as shares of the $227.0 billion. It reads well with five parts, but it can't show subtotals or a negative step, so it answers less of the question than the stacked bar.
- Sankey diagram (different). Shows flows that split and merge, and its levels are link widths rather than positions on an axis. See our Sankey diagram guide.
- Grouped bars for two years (worse for the change). Shows each level in both years side by side, but the reader has to work out what changed and why. A bridge from one year to the next answers that directly.
For a value over many periods with no start and end to explain, a line chart is better, and example 7 below pairs one with a waterfall. For parts of a whole with no running total, a treemap or a sorted bar chart is a better fit, and for counts that only fall from stage to stage, a funnel chart is the usual choice.
How to make a waterfall chart
With AI
ChatGPT, Claude Code, GitHub Copilot, Cursor and other AI tools are excellent at writing Plotly code. Name Plotly in the prompt, describe the start, the steps and the totals, and list the checks you want:
Make a plotly waterfall chart from pl.csv (columns: line, amount_usd_bn, kind).kind is "start", "step" or "subtotal".- go.Waterfall with measure "absolute" for start, "relative" for step, "total" for subtotal.- Costs are positive in the file: make them negative before plotting.- Increases #2a78d6, decreases #eb6834, totals #3d3c39, dotted gray connectors.- Signed value on every step, level on every total, textposition "outside".- Inter font, white background, a title that states the takeaway.- Assert that every subtotal equals the running sum of the steps before it.- Save it as waterfall.html and as a PNG at 2x scale.
With Plotly Studio
Plotly Studio is a desktop app where you point an AI at a dataset and it builds charts and a Dash app around your questions. Ask for a waterfall the same way:
Show a waterfall from last year's operating income to this year's, with one step per line of the income statement. Mark the two ends as totals, color increases blue and decreases orange, print the signed change on every bar, and add a dropdown to pick the company.
Make a waterfall chart in Python or JavaScript
This is the code AI tools write under the hood. In Python, go.Waterfall takes the categories, the values and a measure for each bar:
import plotly.graph_objects as gofig = go.Figure(go.Waterfall(x=["Revenue", "Cost of revenue", "Gross profit", "Operating costs", "Operating income"],y=[215.94, -62.48, 0, -23.08, 0],measure=["relative", "relative", "total", "relative", "total"],texttemplate="%{delta:$,.1f}B",increasing=dict(marker_color="#2a78d6"),decreasing=dict(marker_color="#eb6834"),totals=dict(marker_color="#3d3c39"),))fig.show()
In JavaScript, plotly.js takes the same three arrays:
<div id="chart"></div><script src="https://cdn.plot.ly/plotly-4.1.1.min.js"></script><script>Plotly.newPlot("chart", [{type: "waterfall",x: ["Revenue", "Cost of revenue", "Gross profit", "Operating costs", "Operating income"],y: [215.94, -62.48, 0, -23.08, 0],measure: ["relative", "relative", "total", "relative", "total"],texttemplate: "%{delta:$,.1f}B",increasing: {marker: {color: "#2a78d6"}},decreasing: {marker: {color: "#eb6834"}},totals: {marker: {color: "#3d3c39"}}}]);</script>
Plotly computes the total bars from the steps before them, so their y values are ignored. For a React waterfall chart, pass the same trace and layout to the Plot component of react-plotly.js.
Share it
Every Plotly chart has a Share chart button (the cloud icon in its toolbar) that uploads it to Plotly Cloud and gives you a link. Only you can see it until you change its visibility.
For a live app, put the chart in a Dash app and publish it with the Plotly Cloud CLI. Coding agents can run these commands for you:
pip install "dash[cloud]"plotly user loginplotly app publish
If your data has to stay in your own cloud or data center, publish to Dash Enterprise instead.
Dos and don'ts
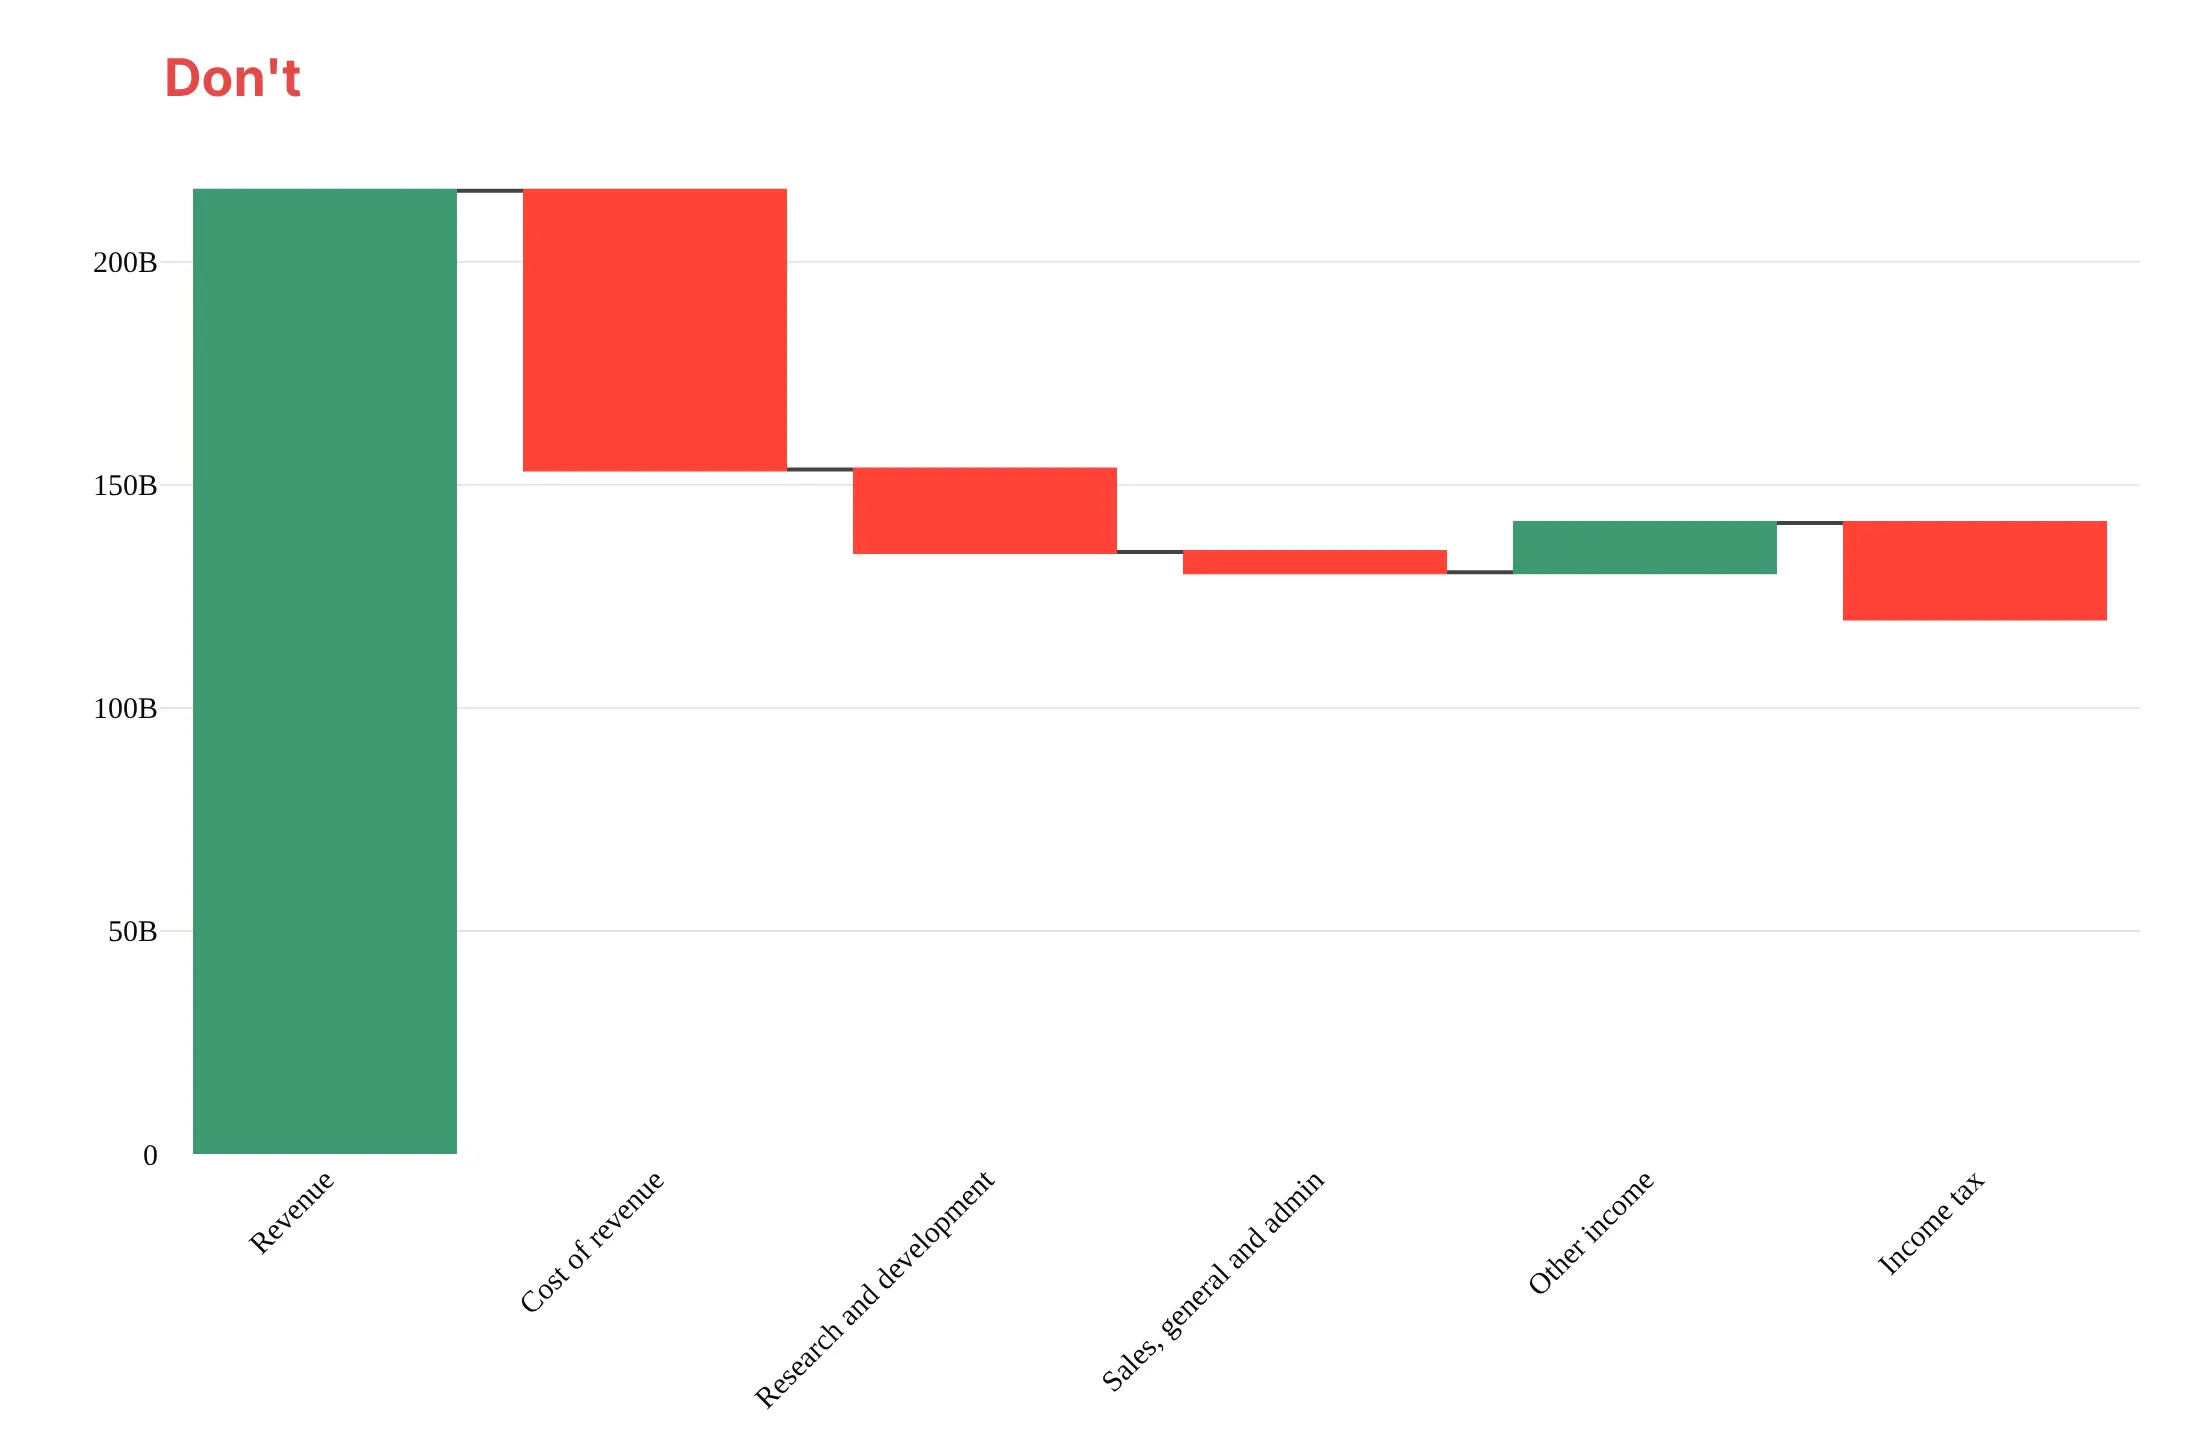
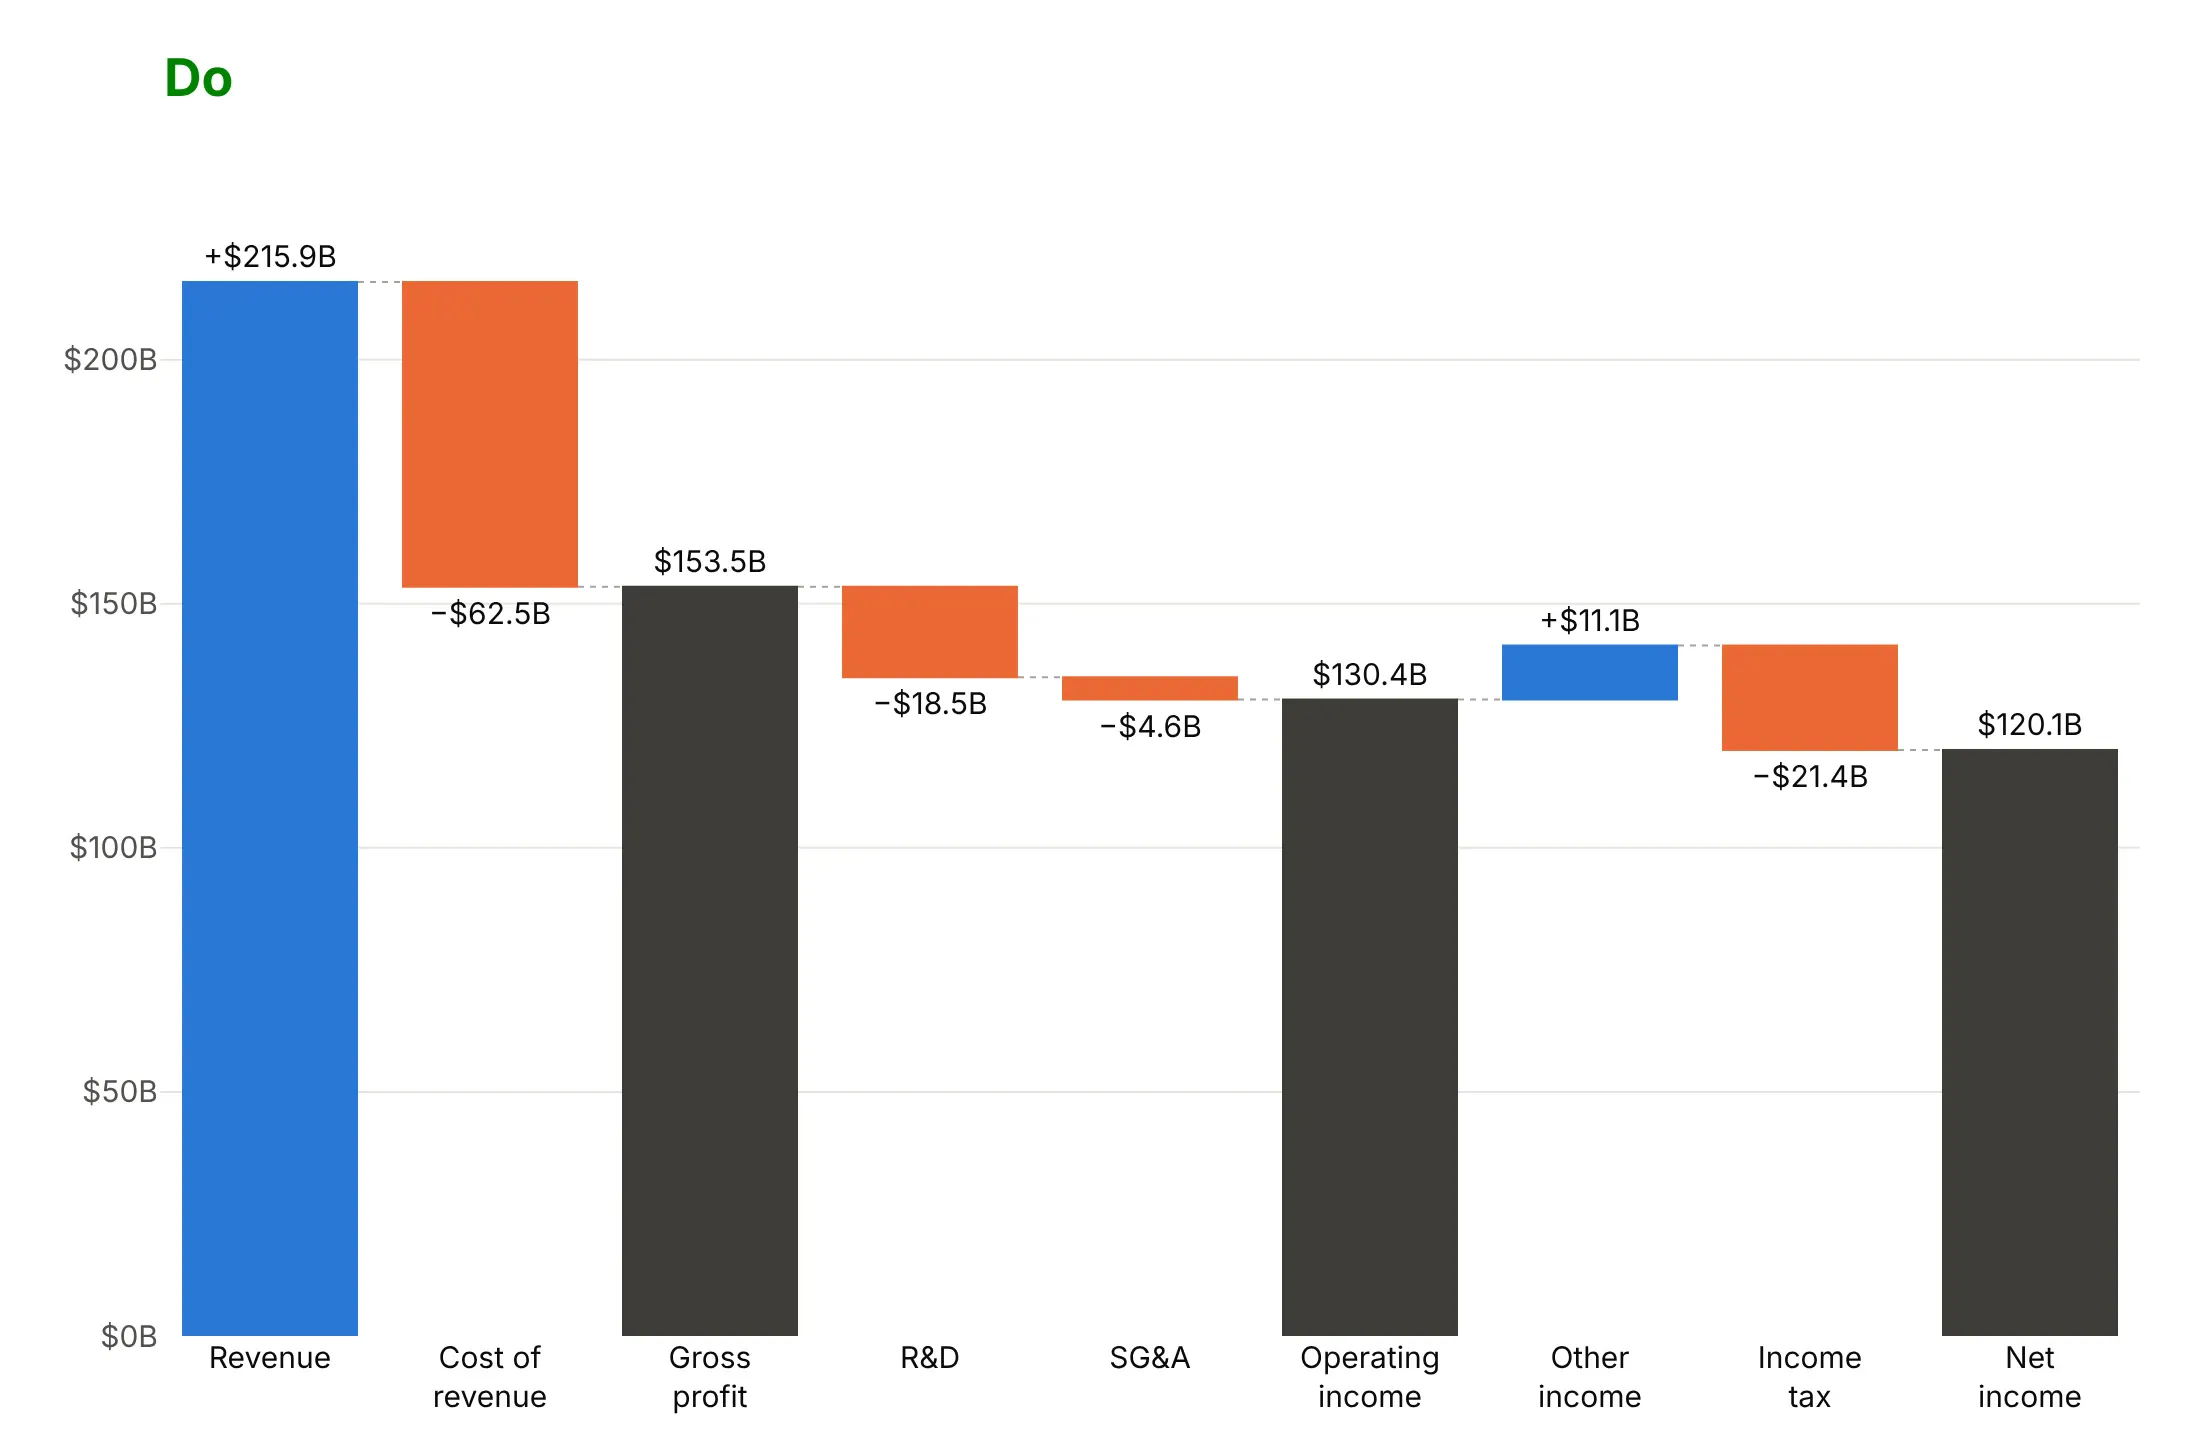
Plotly's defaults color every increase green and every decrease red, show no values and draw no subtotals unless you ask for them. For a published chart, most of the work is choosing which totals to show and what to leave out. Here is Nvidia's fiscal 2026 income statement both ways.
Don't leave out the subtotals, rotate long labels, show raw axis numbers or leave the bars without values:
Do mark gross profit, operating income and net income as totals, use short labels and put the value on every bar:
Pick colors for what they mean
go.Waterfall colors bars by direction and totals only. Here are four options on the same data.
By direction in green and red. The finance convention, but about 8% of men of European ancestry can't tell the two apart (Birch 2012).
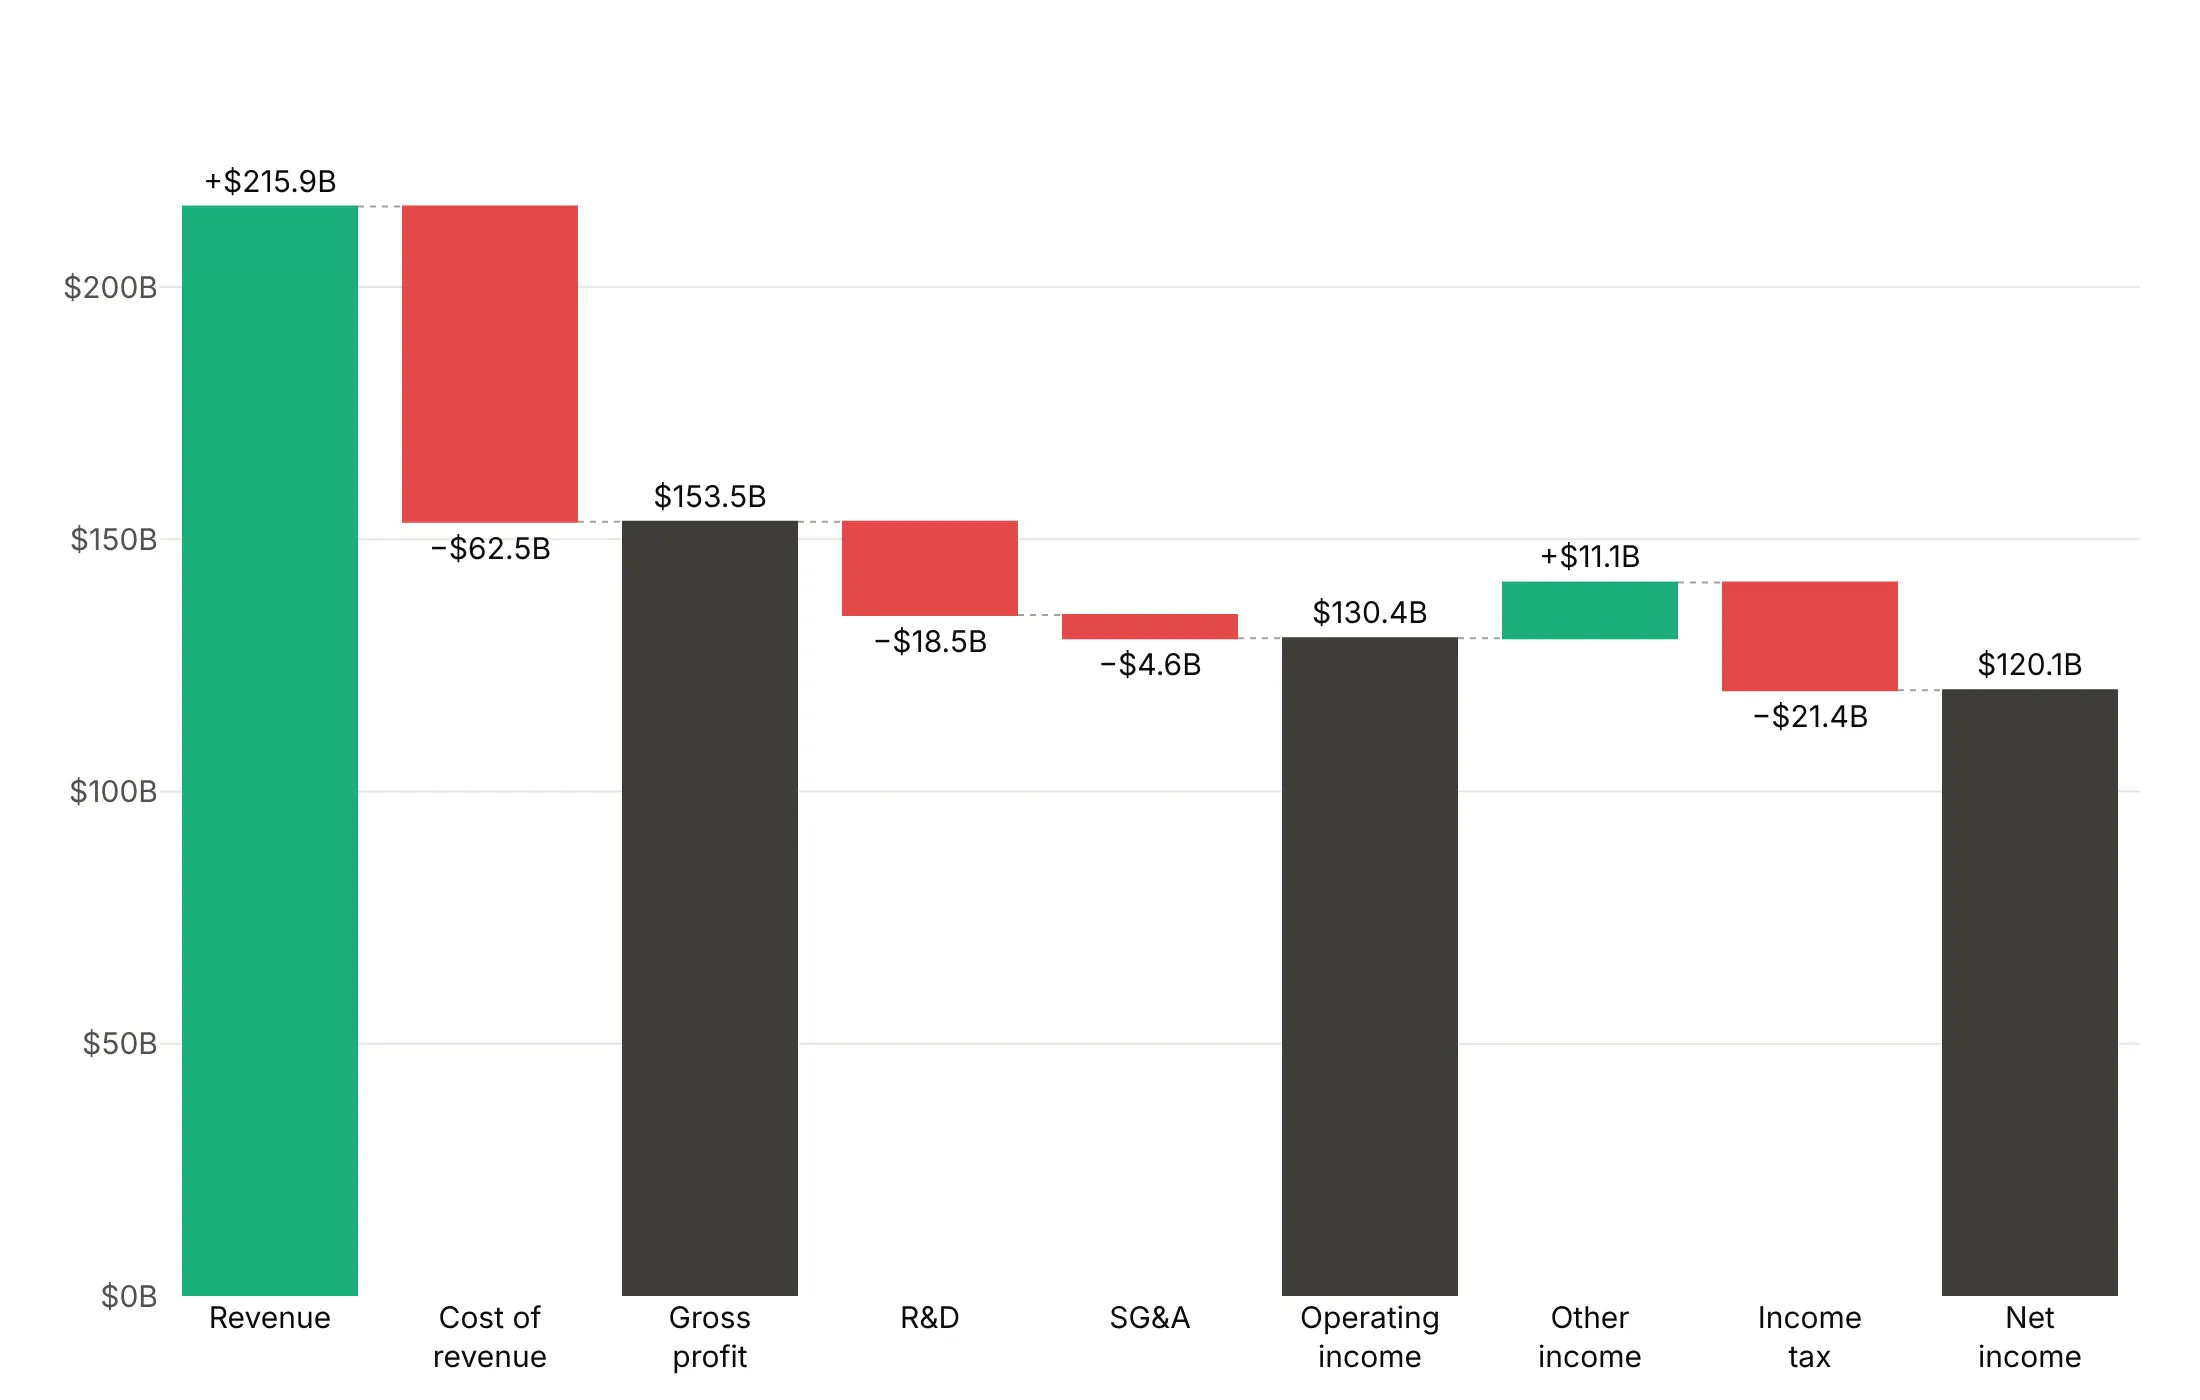
By direction in blue and orange. The same meaning, and readable with red-green color vision deficiency. It's a good default.
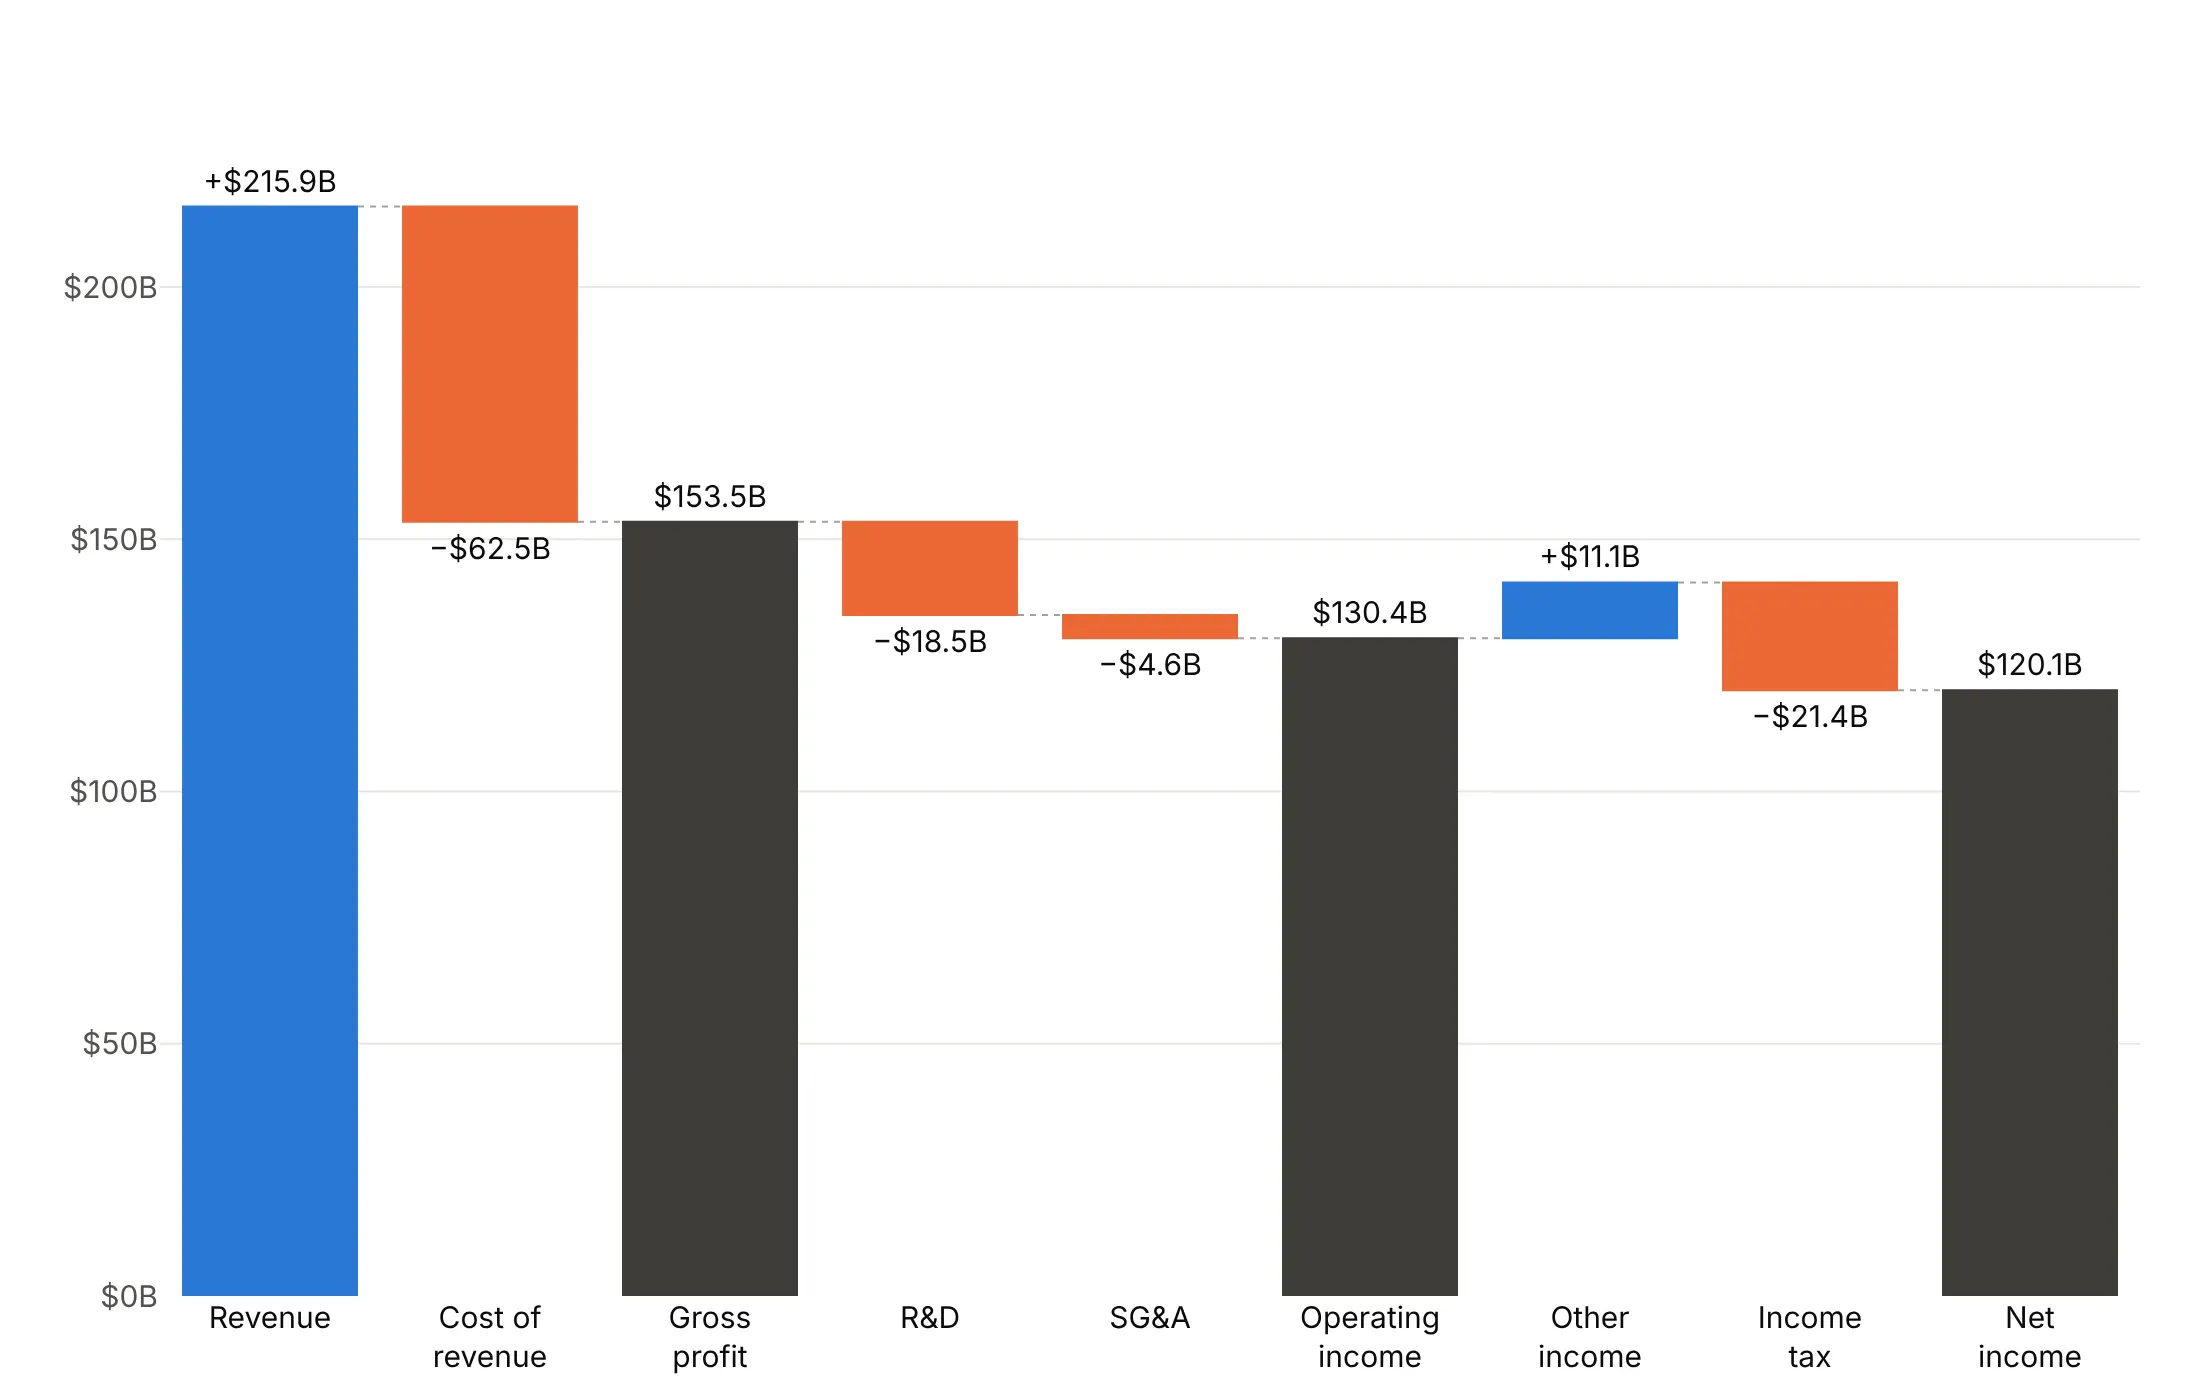
Steps in gray, totals in color. Use it when the levels are the story and the individual steps are not.
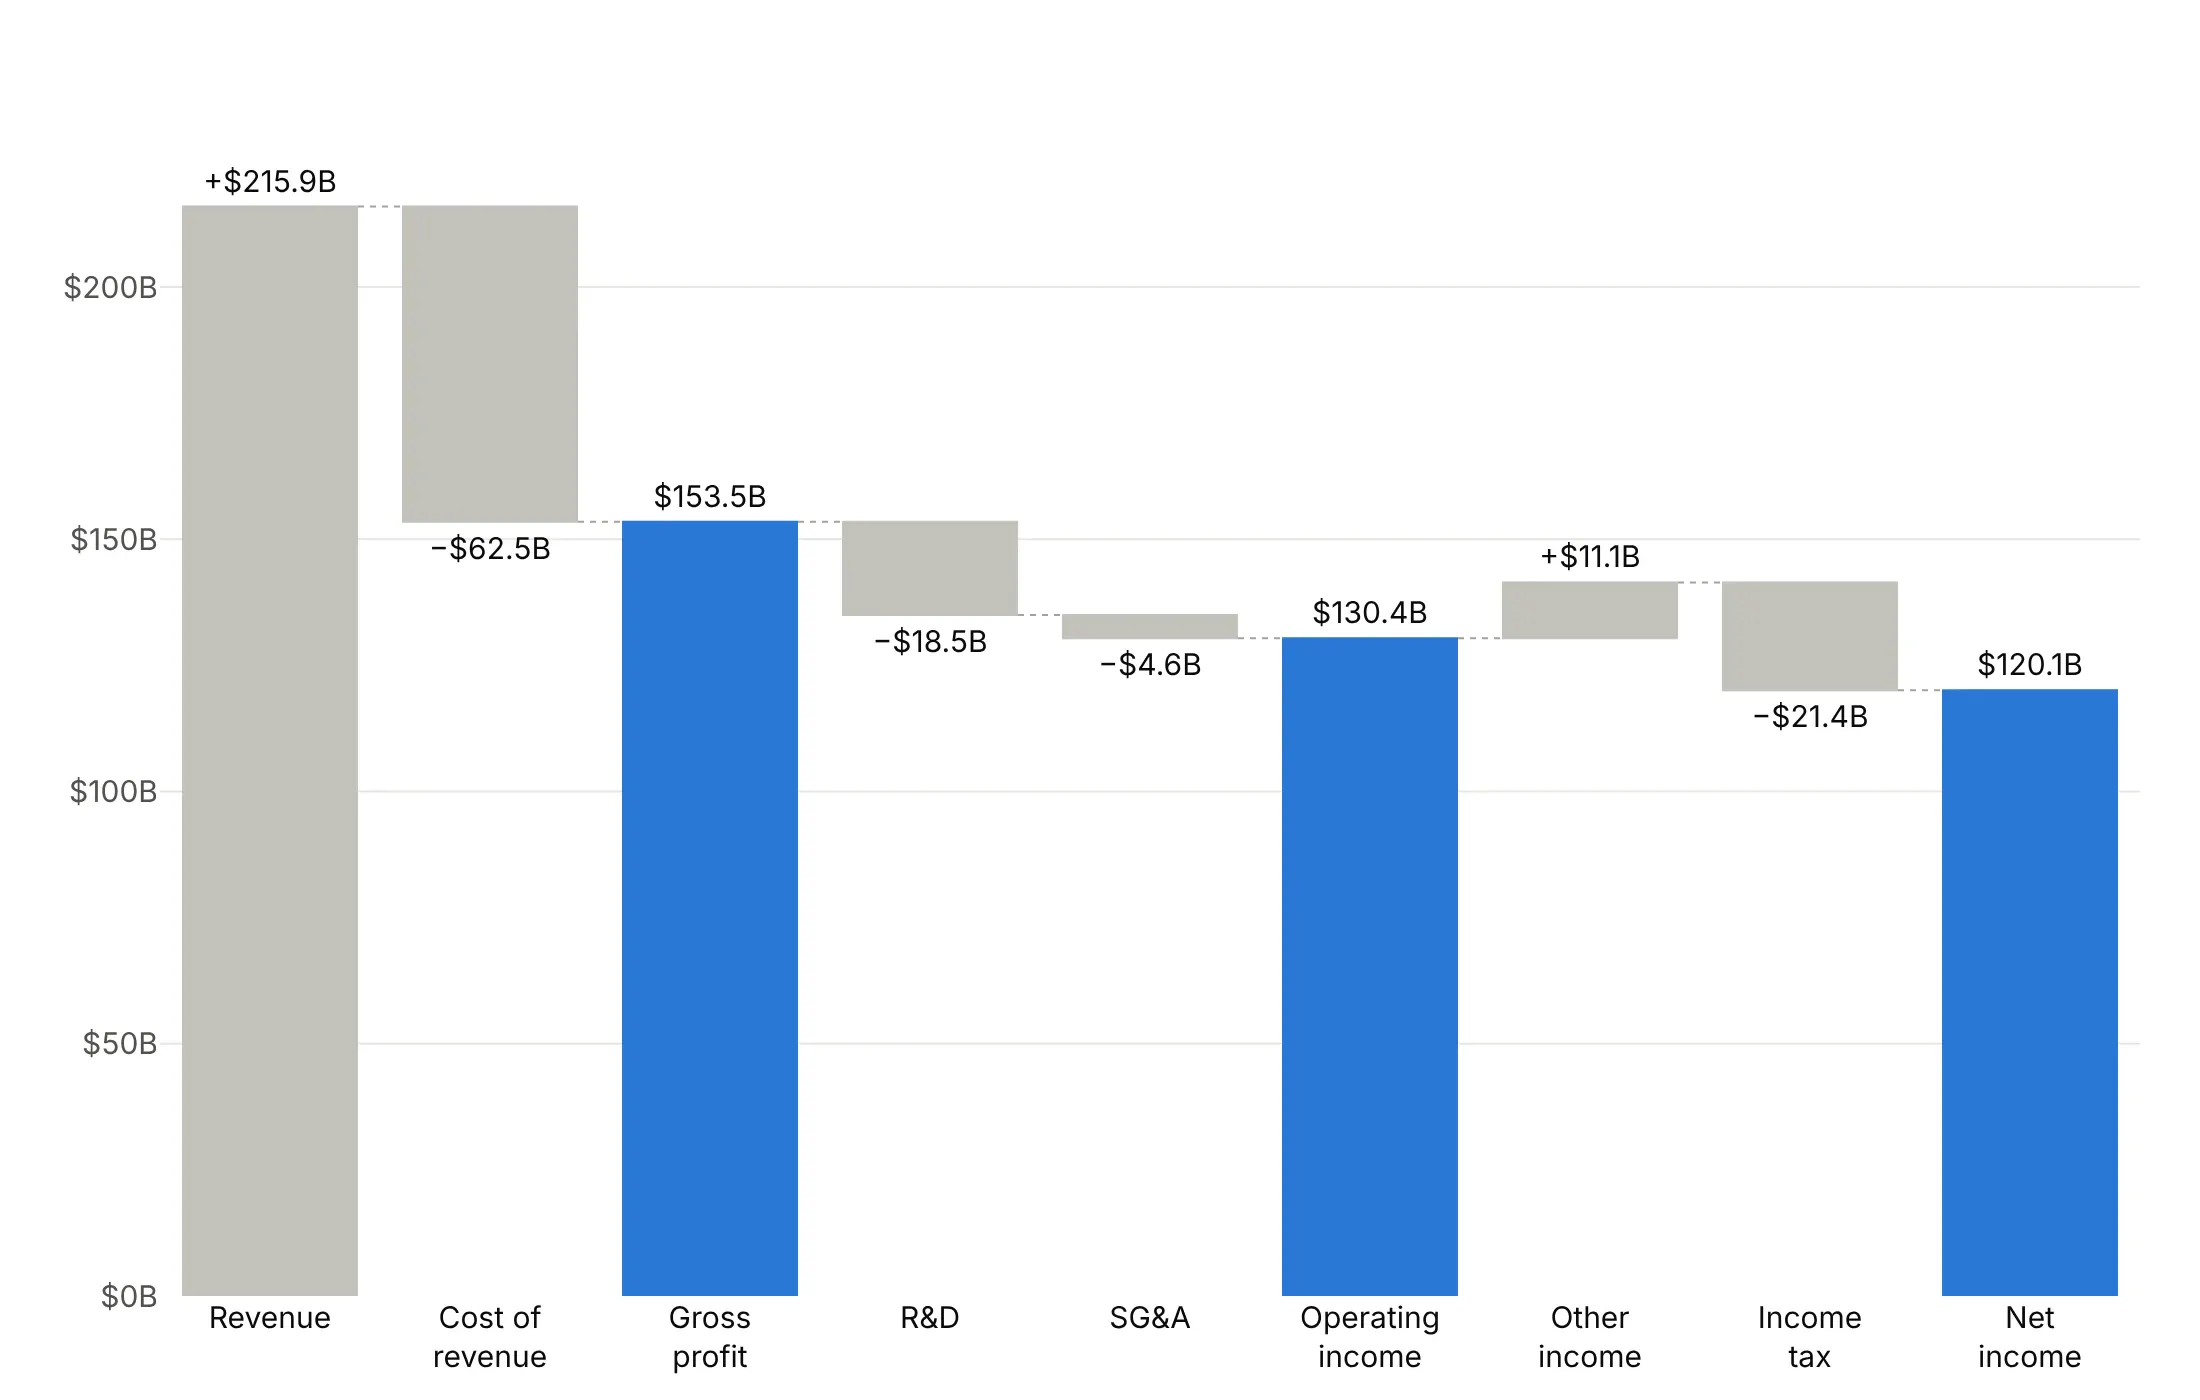
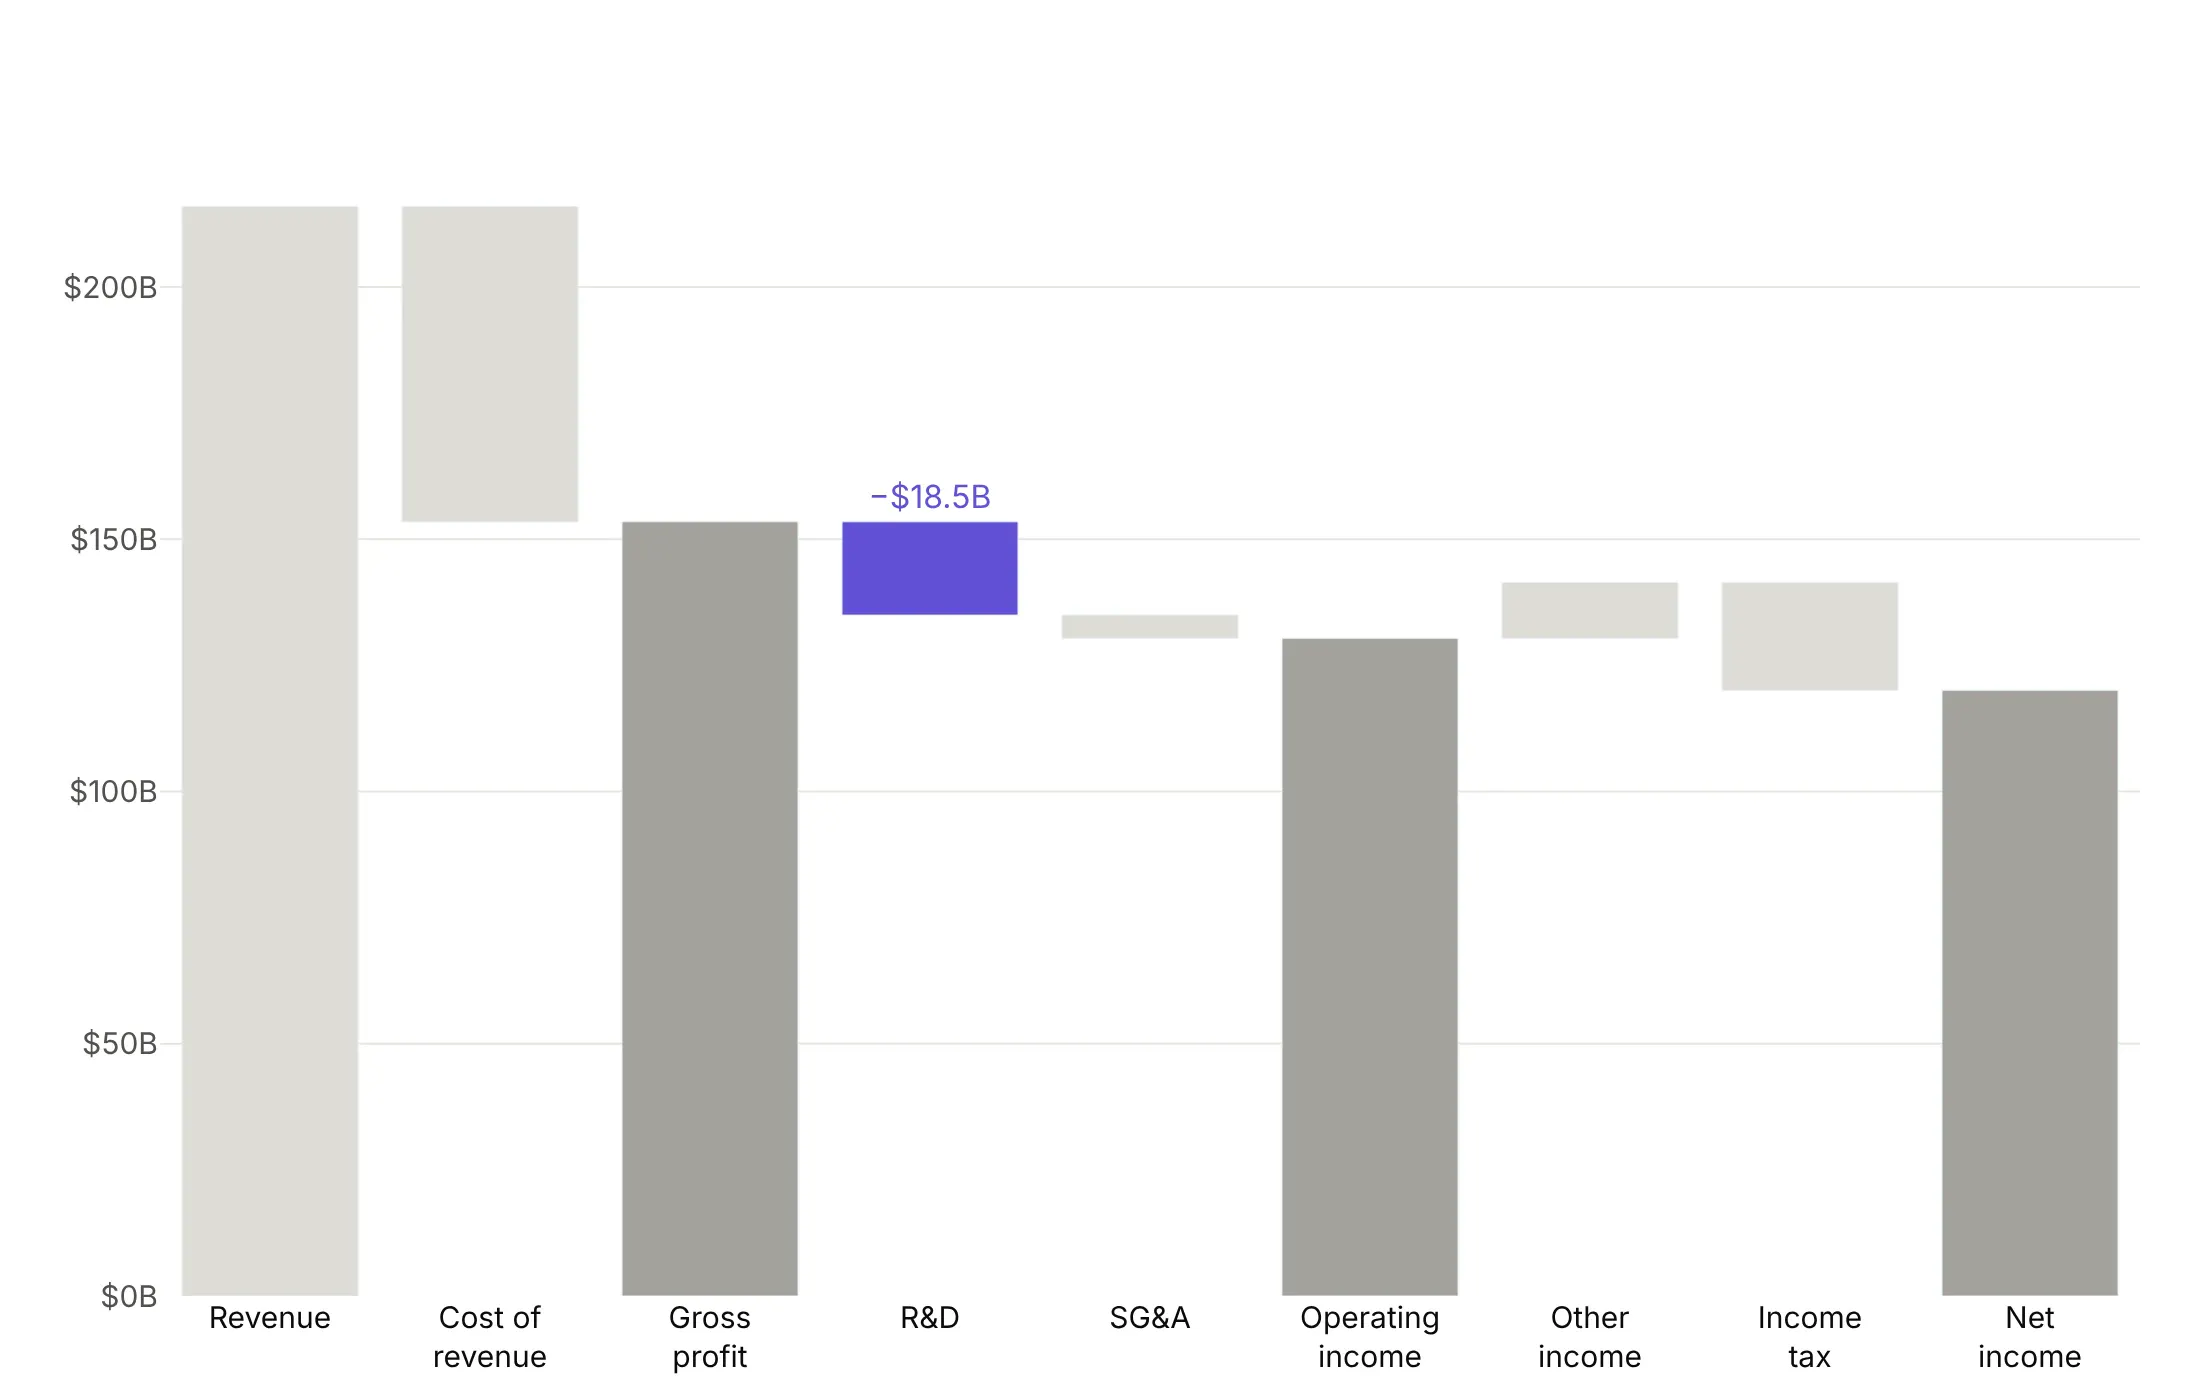
One step highlighted. Here R&D ($18.5 billion) is the only colored bar. This uses go.Bar with base set to the running total, which lets you give any single bar its own color.
Checklist
Do
- Write a title that states the takeaway, such as "Apple kept $112 billion of $416 billion in sales".
- Use measure="total" for subtotals and measure="absolute" for a starting level.
- Print the signed value on every step and the level on every total.
- Color by meaning: when an increase is bad news, such as a rising deficit, make increases red.
- Group small steps into "Other", and sort the rest when their order doesn't matter.
- Say so when the axis doesn't start at zero, or use base to start the bars at a real level.
Don't
- Add subtotals as relative steps, because they get counted twice.
- Use a waterfall for a time series with no start and end.
- Show 30 steps, because nobody reads them.
- Rotate labels. Use line breaks or a horizontal waterfall (orientation="h").
Options to customize
These are the go.Waterfall options that matter most. The full list is in the Plotly waterfall documentation and the figure reference.
- x, y: the categories and the values (swap them for orientation="h").
- measure: relative for a step, total for a running total that plotly computes, and absolute for a level that resets the running total.
- base: shifts the whole waterfall to start at a value, for small changes to a large level.
- orientation: v or h; horizontal is easier to read with long labels.
- increasing.marker, decreasing.marker, totals.marker: colors and outlines by bar type.
- connector.line, connector.mode, connector.visible: connector color, width and dash, between or spanning, or hidden.
- text, texttemplate, textposition: labels with %{delta}, %{initial}, %{final} and %{label}.
- hovertemplate: hover content, with extra fields from customdata.
- offsetgroup, alignmentgroup: put several waterfalls side by side on shared categories.
- waterfallmode, waterfallgap, waterfallgroupgap (layout): group or overlay, and the gaps between bars and groups.
- width, offset: bar width and position, for narrow bars when there are few steps.
- cliponaxis: set to False so outside labels can draw past the plot area.
More waterfall chart examples
Ten more waterfalls built from real public data, each with its source, the technique that makes it work and a prompt to rebuild it.
1. Eli Lilly's revenue bridge
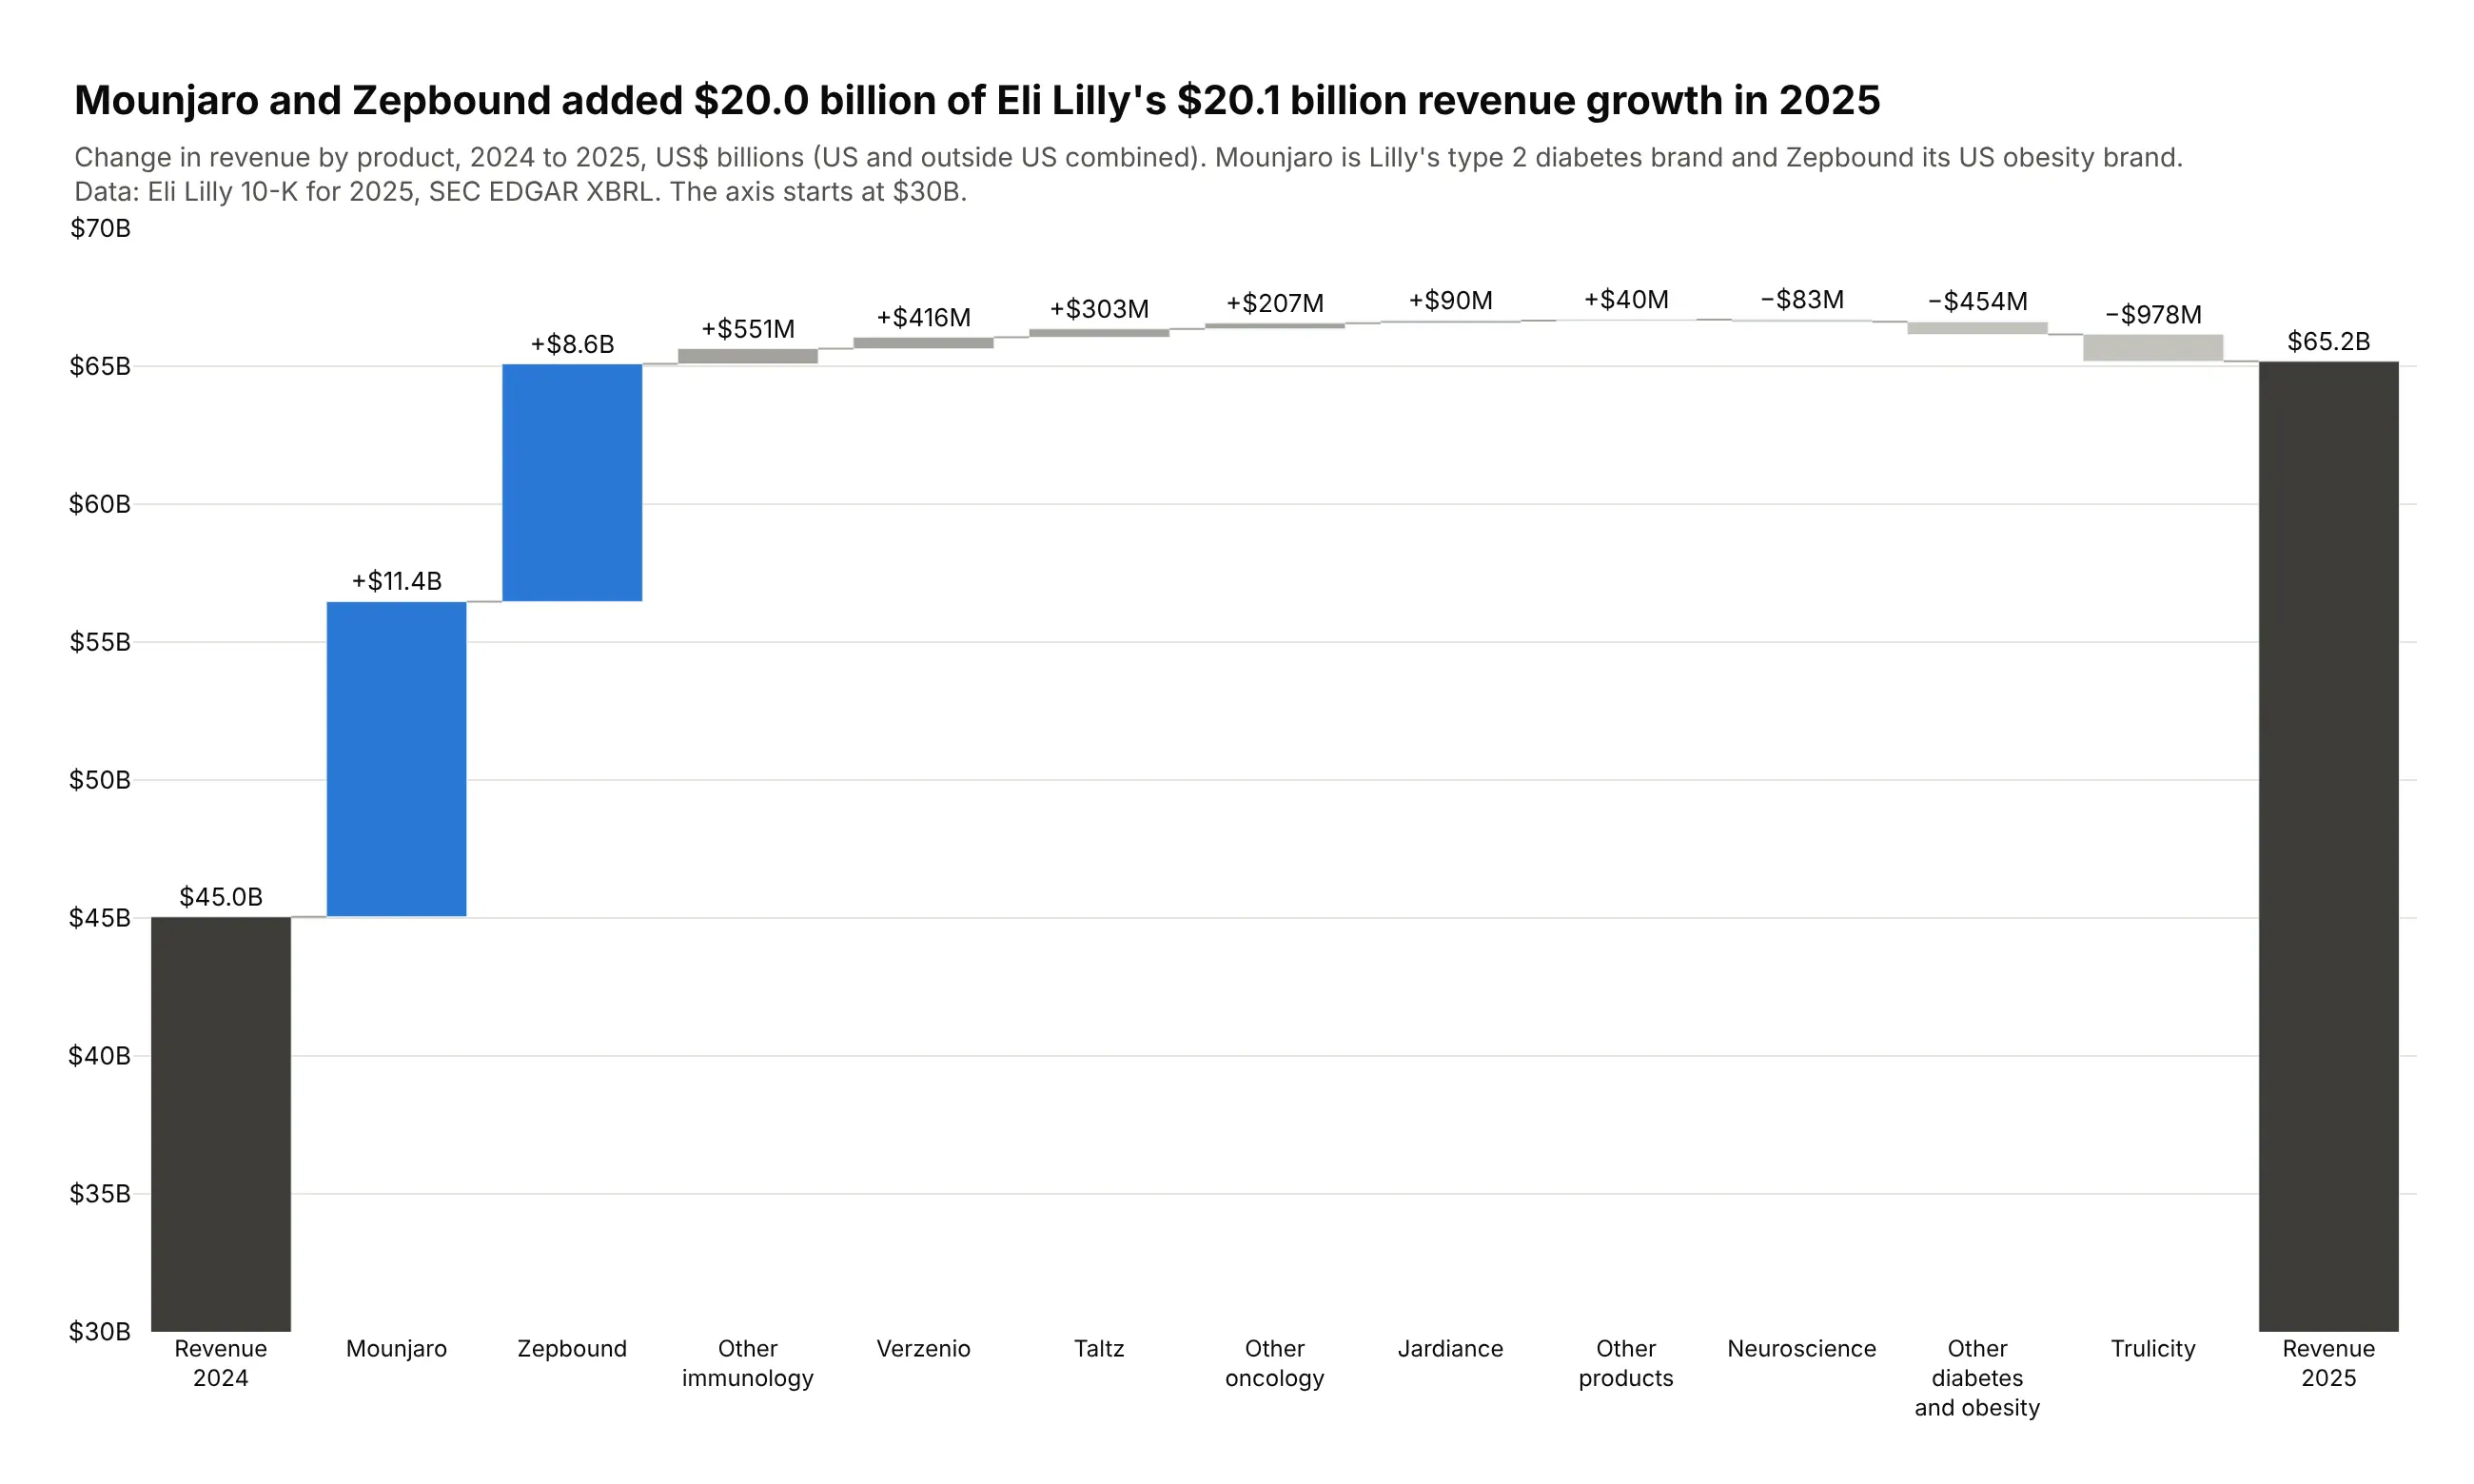
Lilly's revenue grew $20.1 billion in 2025, and Mounjaro (+$11.4 billion) and Zepbound (+$8.6 billion) account for $20.0 billion of it. Everything else roughly cancelled out. Data: Eli Lilly 10-K for 2025, SEC EDGAR XBRL instance.
Tip: drawn with go.Bar and base (the running total), which allows blue for two products and gray for the rest.
Get the data from Eli Lilly's 2025 10-K XBRL instance on SEC EDGAR (revenue by product, US andoutside US) and shape it into a table (columns: step, measure, value_mn, rev_2024_mn, rev_2025_mn).Build a revenue bridge 2024 -> 2025 with go.Bar and base = running total: Mounjaro and Zepboundfirst in blue, other products sorted by change in gray, totals dark gray, thin connector shapes.End on reported 2025 revenue. Start the y axis at $30B and say so.
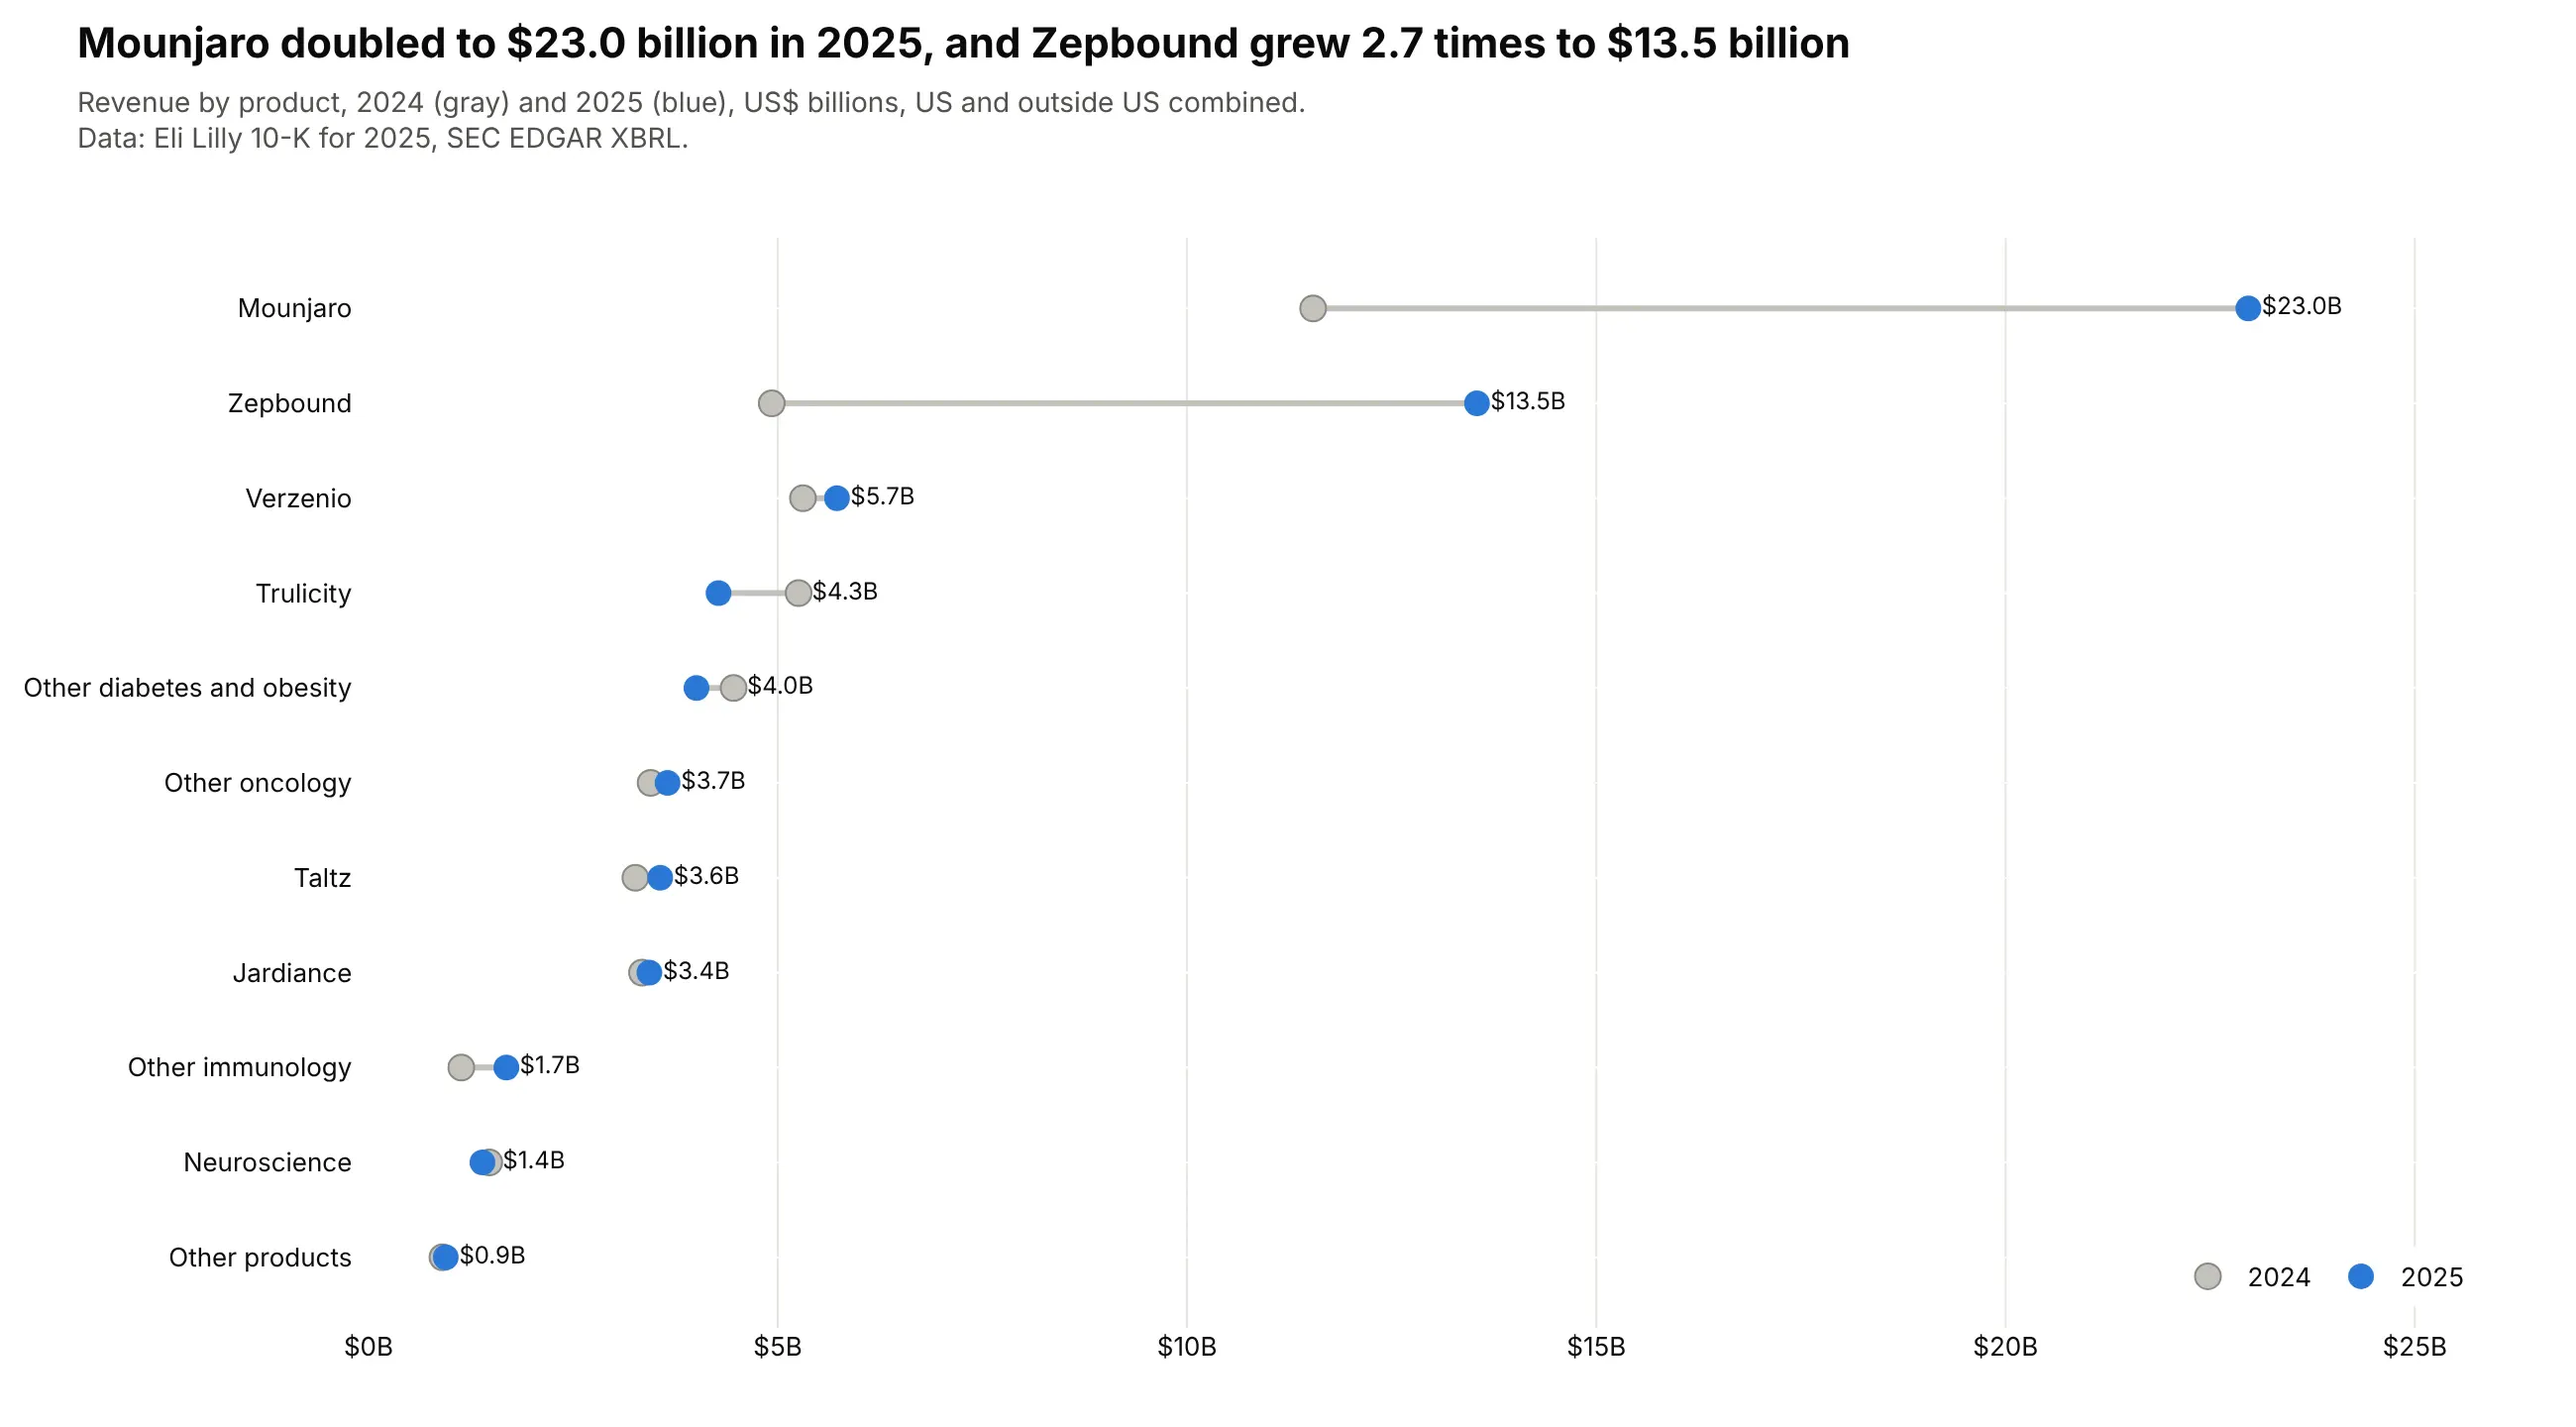
Another way to see it: a dot plot of each product's revenue in both years shows that Mounjaro doubled to $23.0 billion, but not how much of the growth it explains.
2. AbbVie after Humira
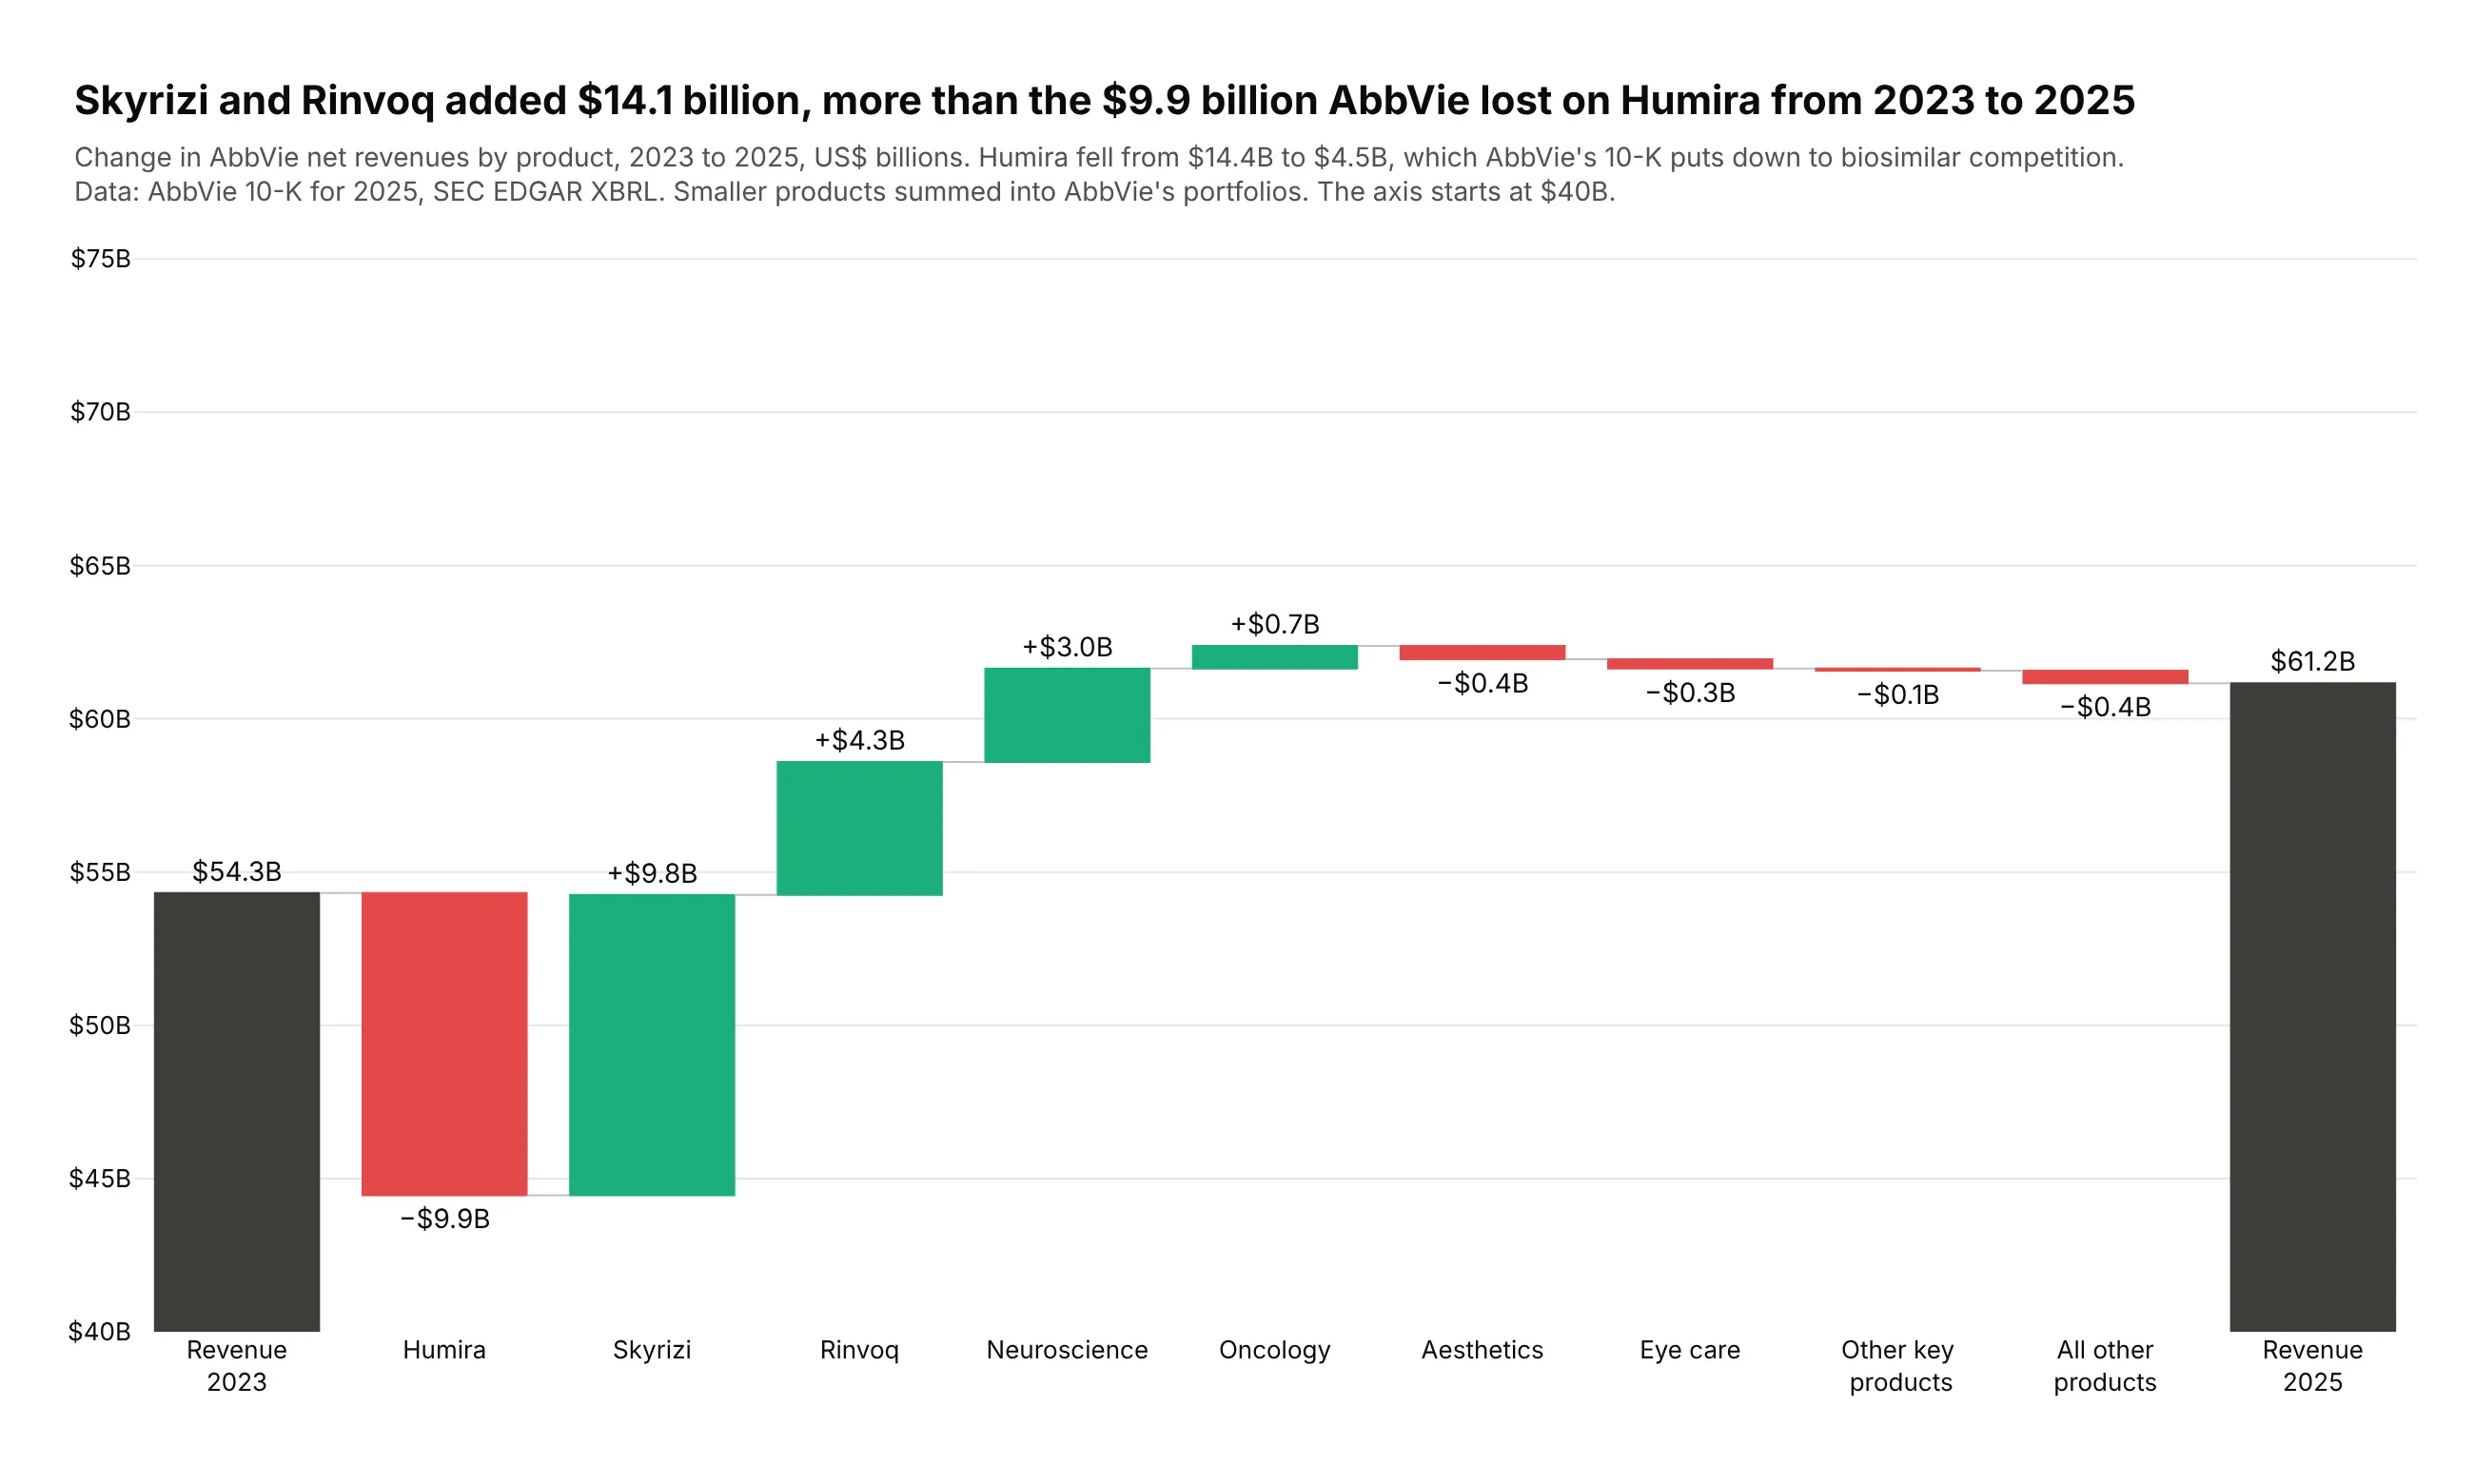
Humira's revenue fell from $14.4 billion in 2023 to $4.5 billion in 2025, which AbbVie's 10-K puts down to biosimilar competition. Skyrizi and Rinvoq added $14.1 billion, more than replacing it. Data: AbbVie 10-K for 2025, SEC EDGAR XBRL instance.
Tip: keep the story's order (the loss, then the replacements) instead of sorting by size.
Get the data from AbbVie's 2025 10-K XBRL instance on SEC EDGAR (worldwide net revenues by productfor 2023 and 2025) and shape it into a table(columns: step, measure, value_mn, rev_2023_mn, rev_2025_mn).Build a plotly revenue bridge 2023 -> 2025: Humira, Skyrizi, Rinvoq, then AbbVie's portfolios.Green increases, red decreases, dark totals. Assert products add up to total revenue.
3. What happened to phase 3 trials
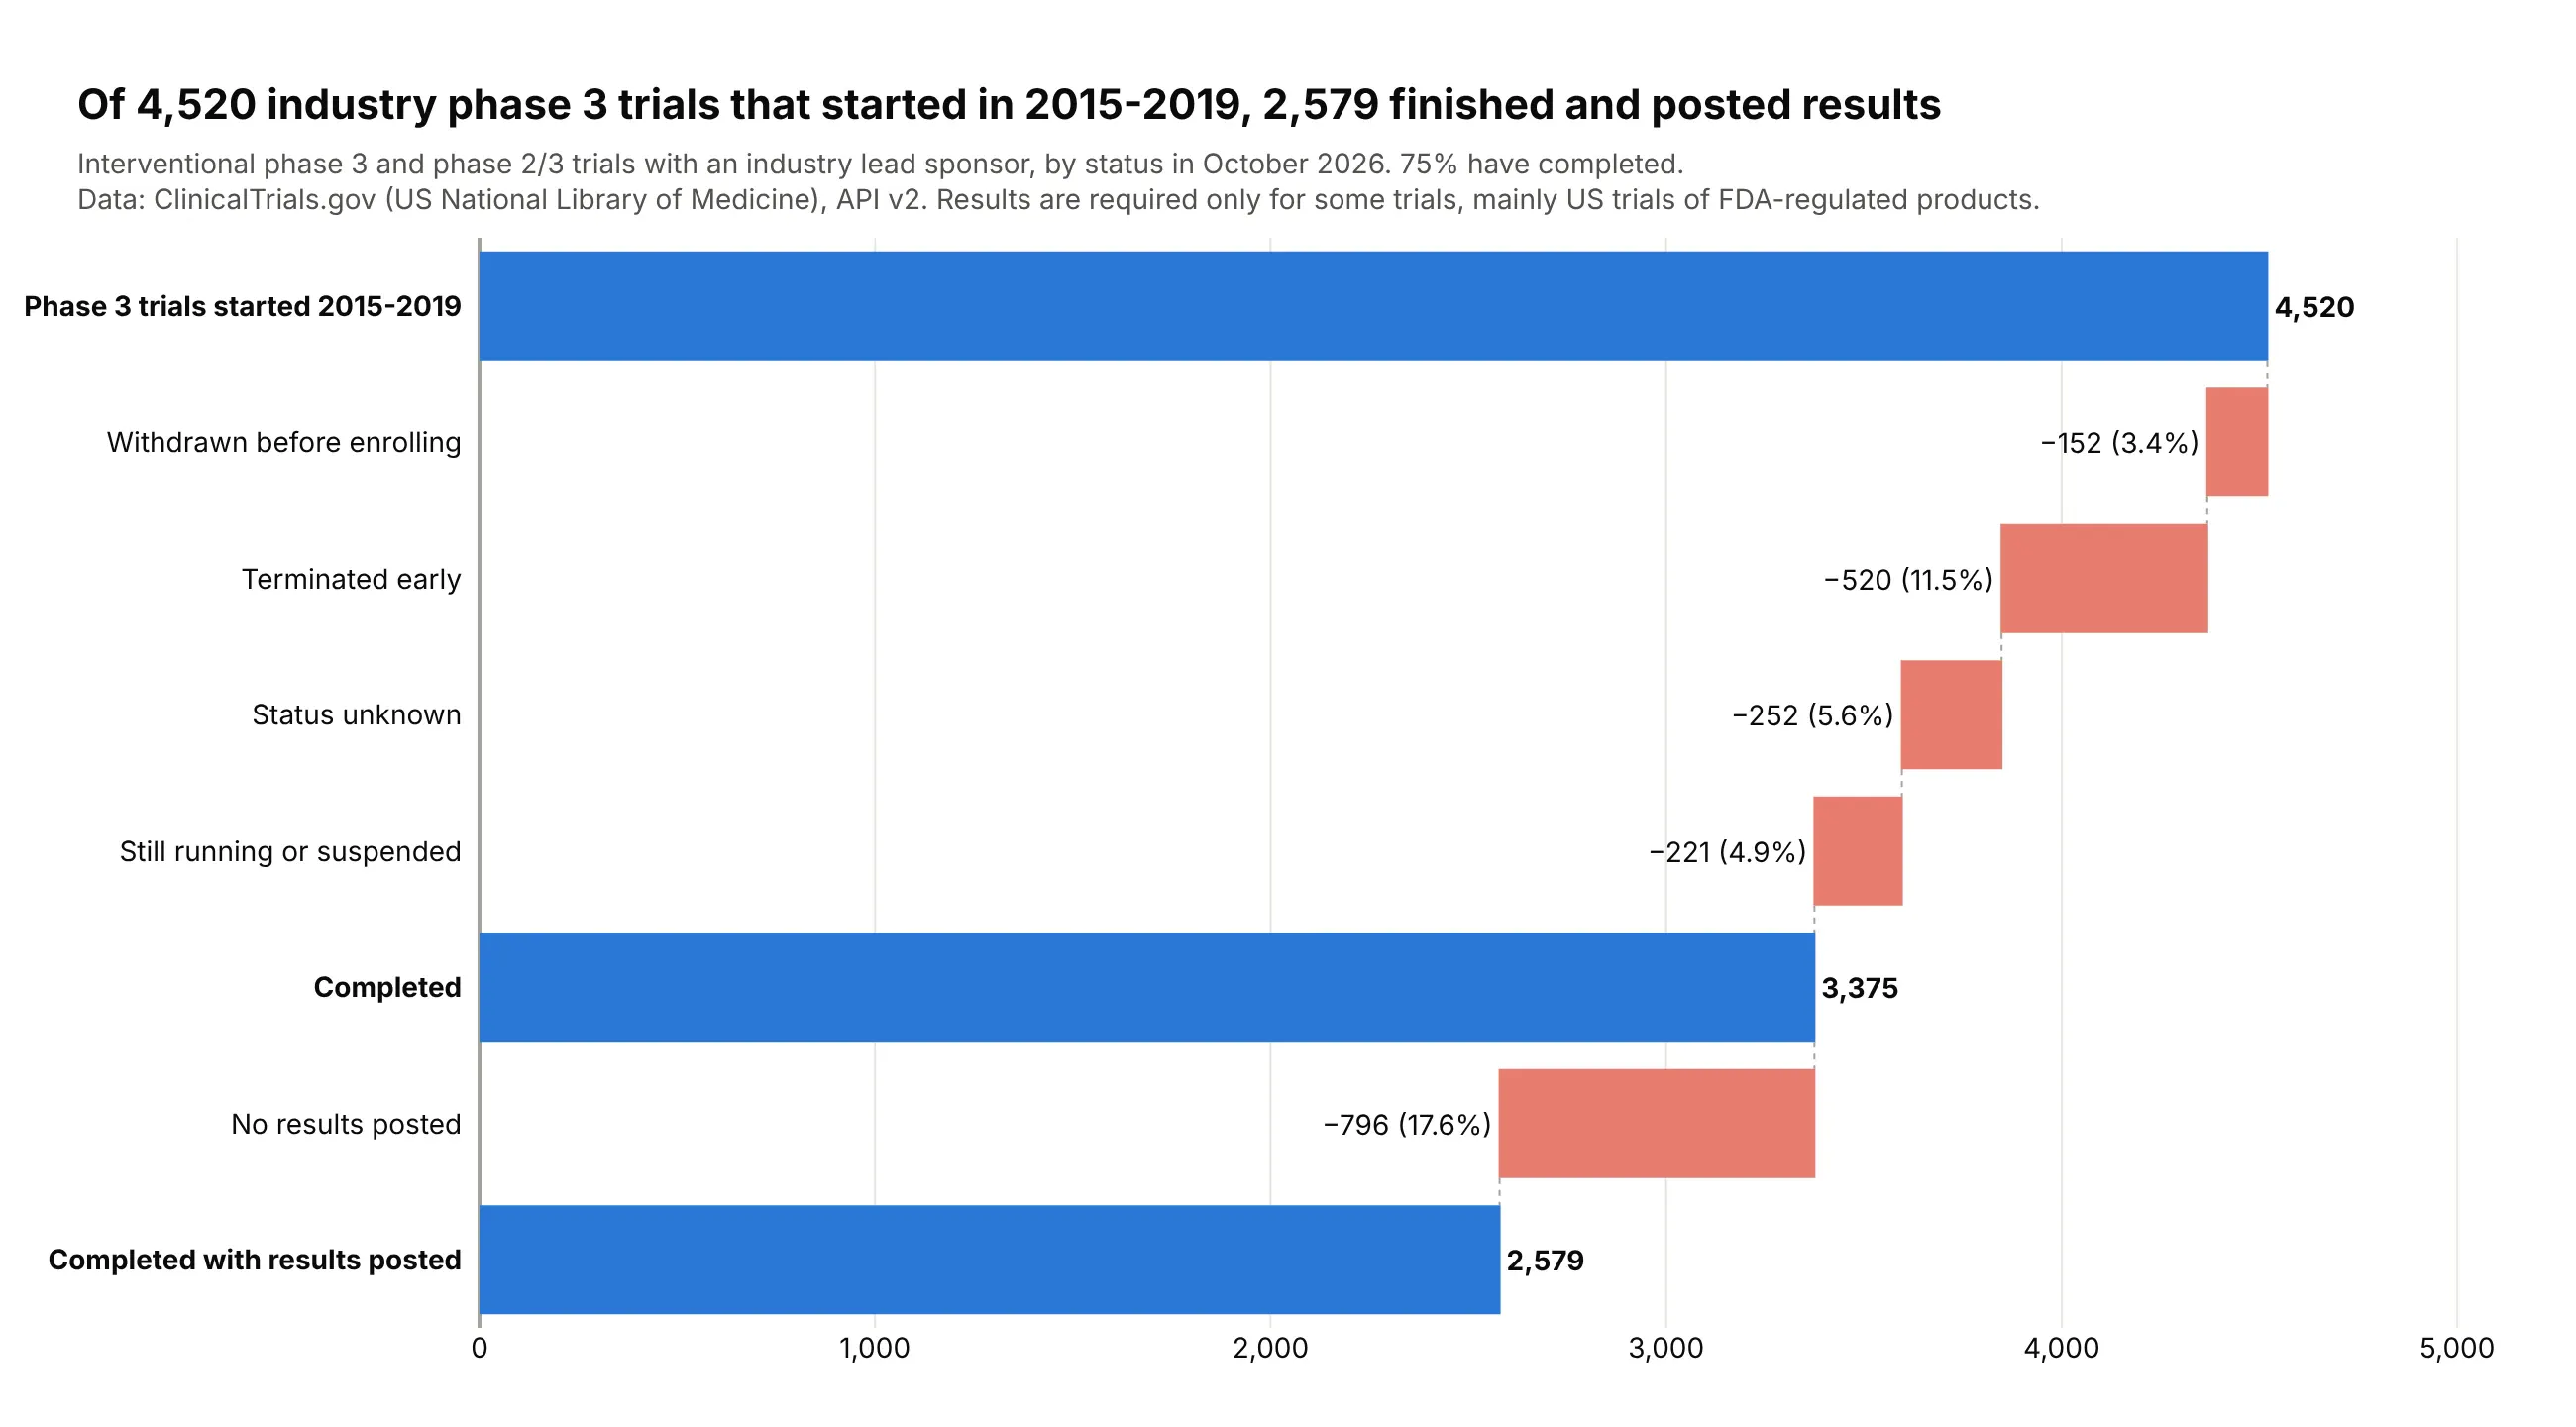
Of 4,520 industry-sponsored phase 3 trials that started in 2015-2019, 3,375 (75%) have completed and 2,579 have posted results. Terminations are the biggest loss (520, 11.5%). Data: ClinicalTrials.gov API v2, statuses as of October 2026.
Tip: every step is a loss, so all steps share one muted red and the two checkpoints are blue totals.
Get the data from the ClinicalTrials.gov API v2 (counts of interventional phase 3 trials with anindustry lead sponsor and a start date in 2015-2019, by overall status and with results) and shapeit into a table (columns: step, measure, trials).Build a horizontal plotly attrition waterfall: start (absolute), each non-completion status as aloss, "Completed" (total), "No results posted" (loss), "Completed with results posted" (total).Label losses with count and share of the start.
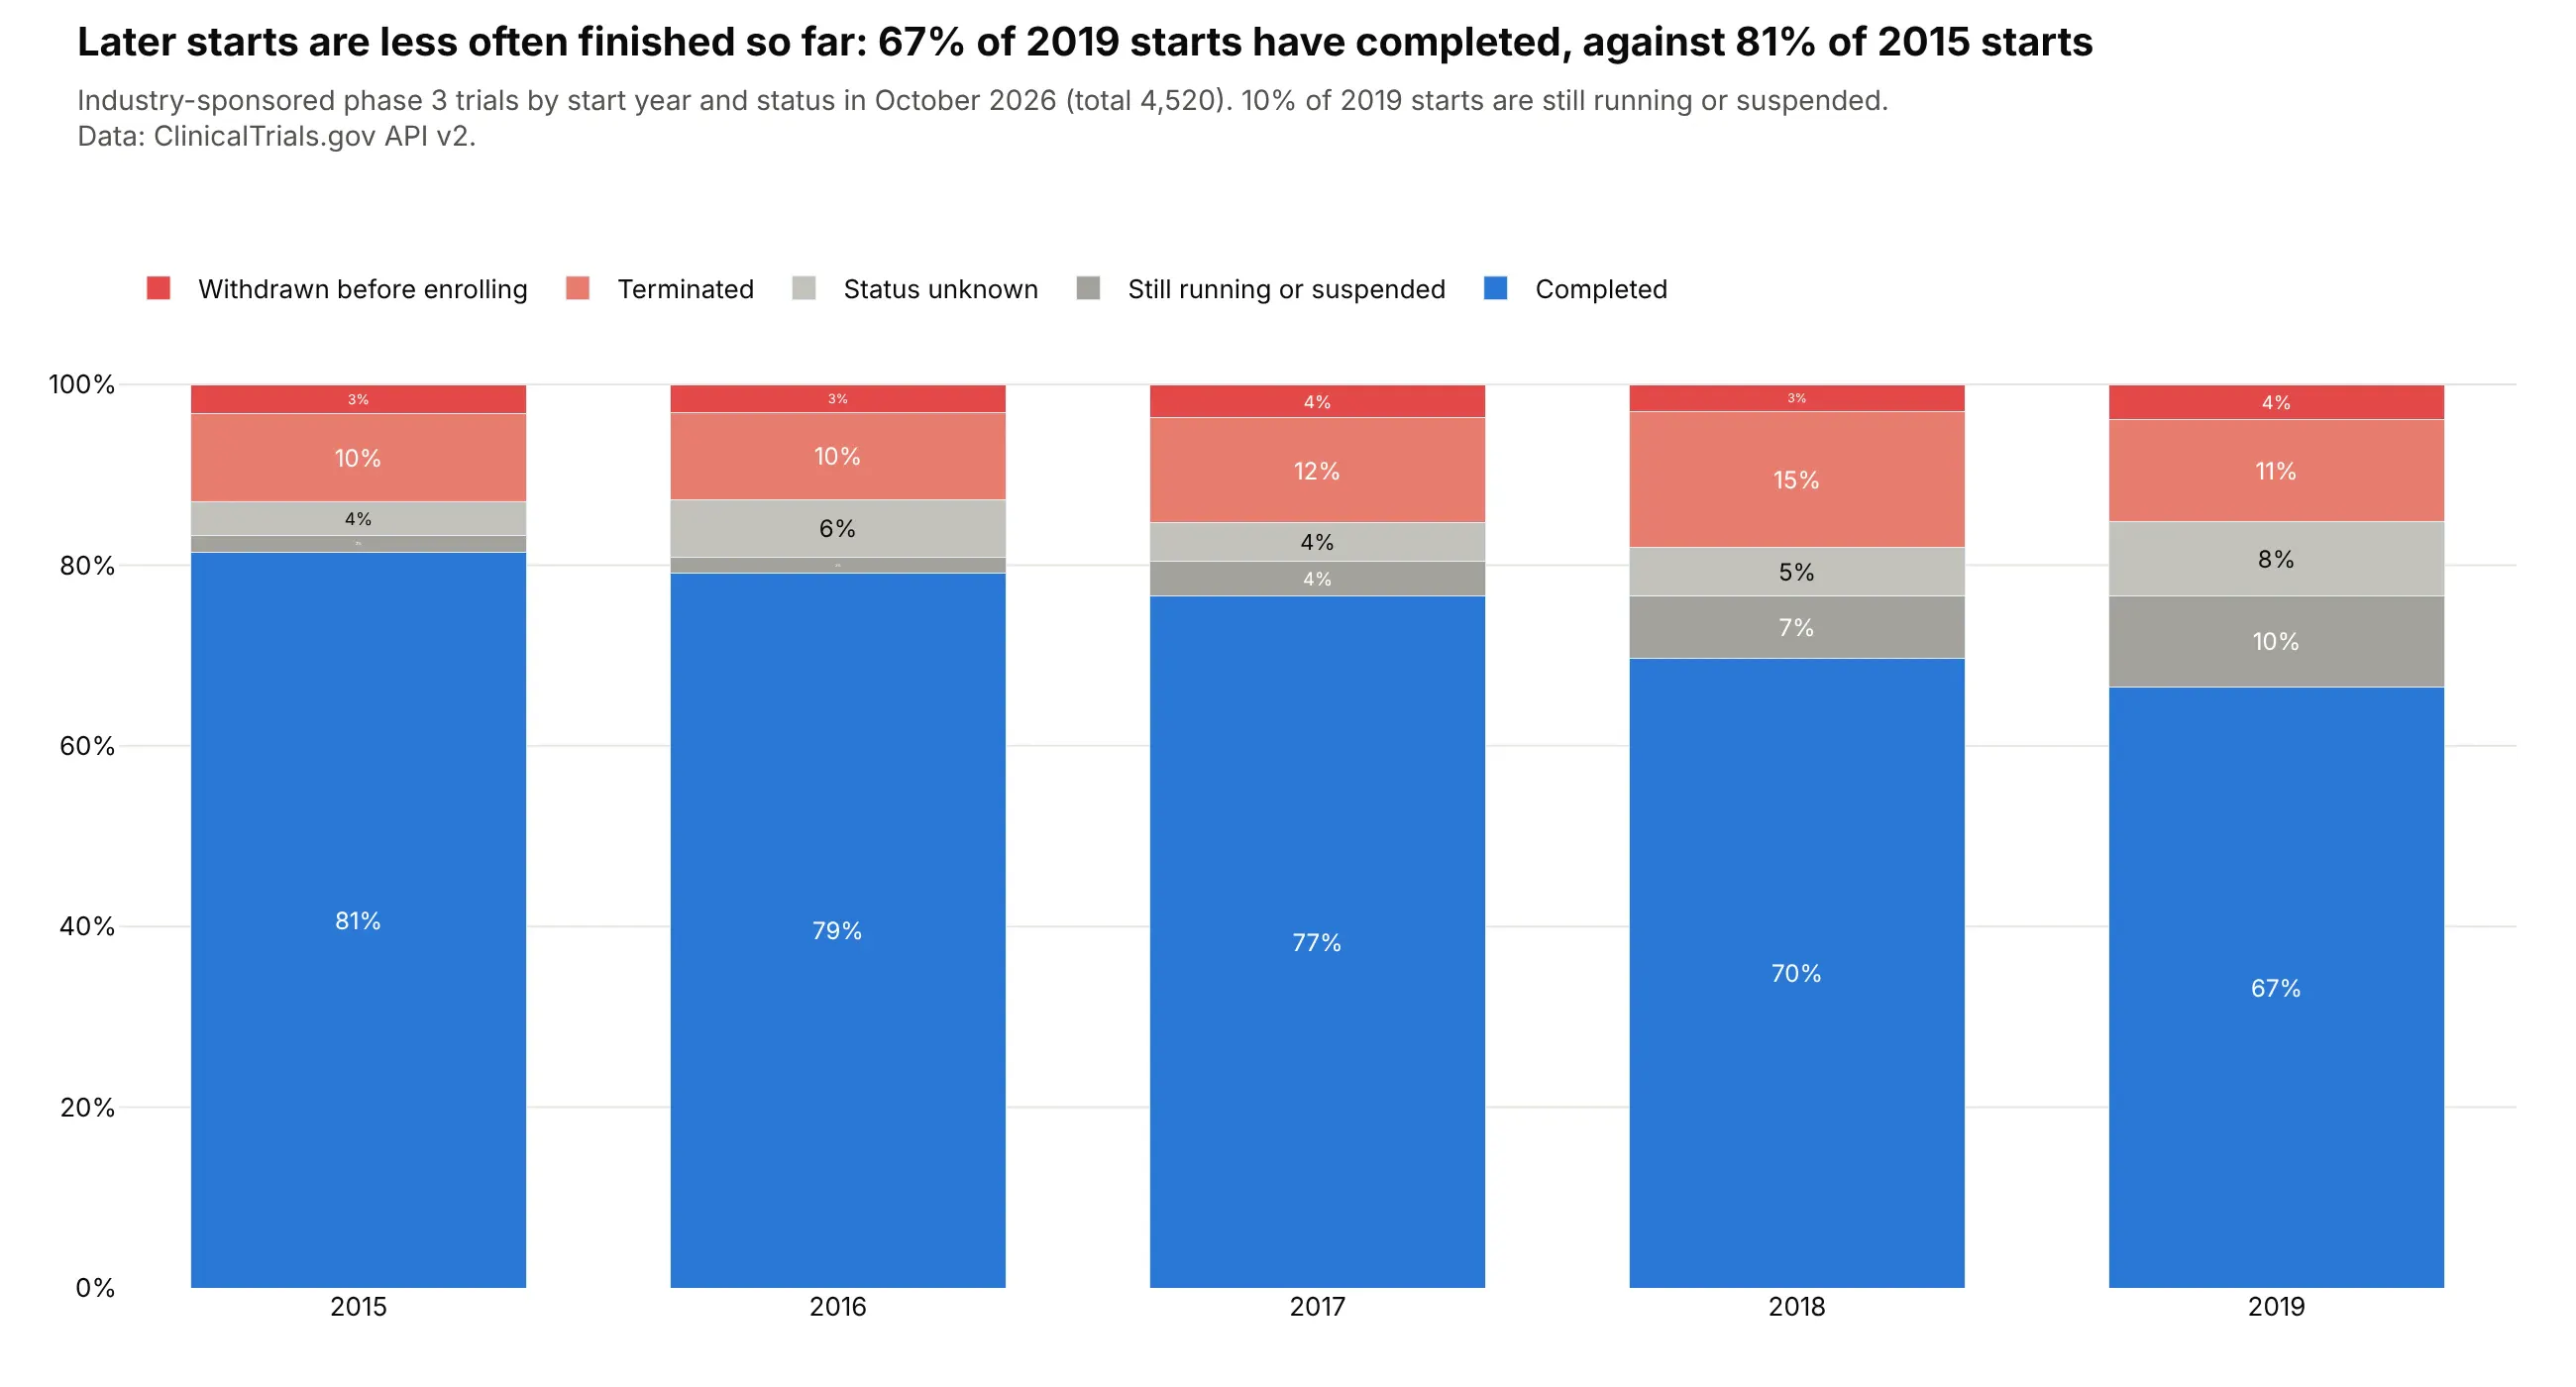
Another way to see it: stacked bars by start year show that the share completed falls from 81% of 2015 starts to 67% of 2019 starts, partly because 10% of 2019 starts are still running.
4. ExxonMobil vs Chevron per $100 of revenue
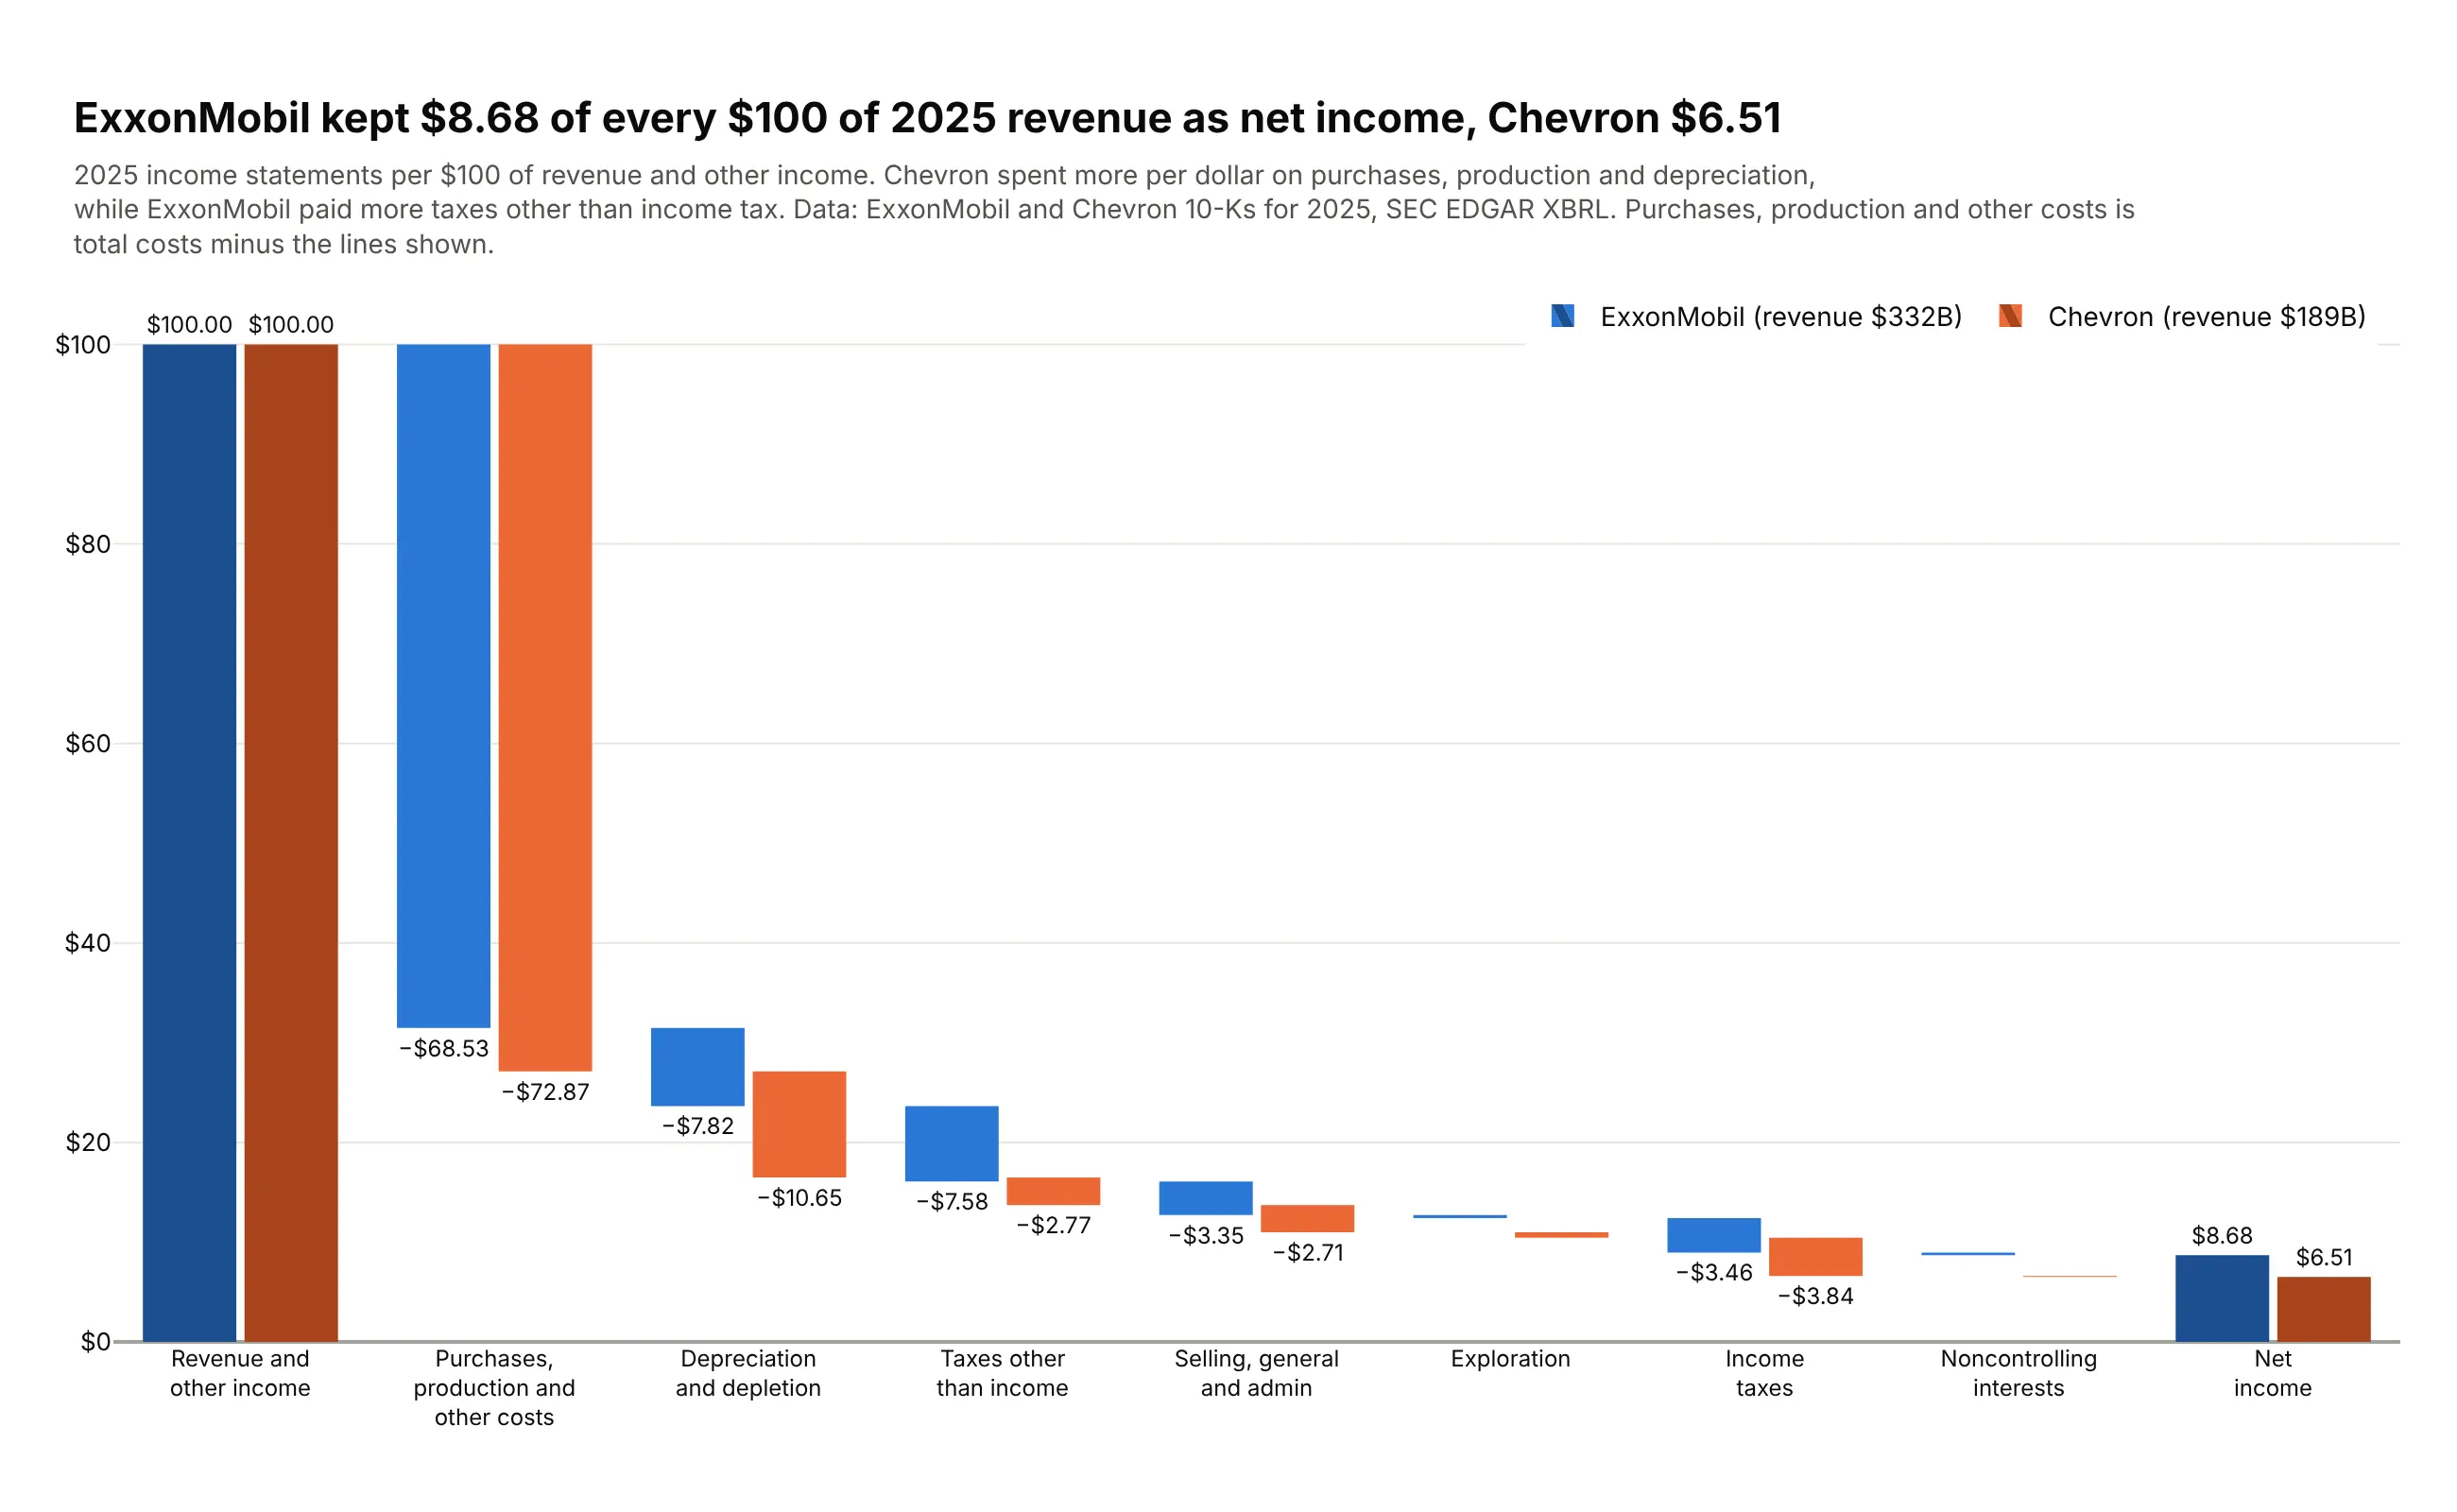
Per $100 of 2025 revenue, ExxonMobil kept $8.68 as net income and Chevron $6.51. Chevron spent more on purchases and production ($72.87 against $68.53) and on depreciation, while ExxonMobil paid more taxes other than income tax. Data: ExxonMobil and Chevron 10-Ks for 2025, SEC EDGAR XBRL.
Tip: two go.Waterfall traces with layout.waterfallmode="group", and connectors hidden so they don't cross the other company's bars.
Get the data from the ExxonMobil and Chevron 2025 10-Ks in SEC EDGAR company facts (revenues,costs and expenses, DD&A, SG&A, taxes other than income, exploration, income taxes,noncontrolling interests, net income) and shape it into a table(columns: company, step, measure, value_bn, per_100).Build a grouped plotly waterfall: one go.Waterfall per company on the same categories, values per$100 of revenue, waterfallmode "group", one hue per company (darker totals), connectors hidden.
5. Alphabet's cash flow
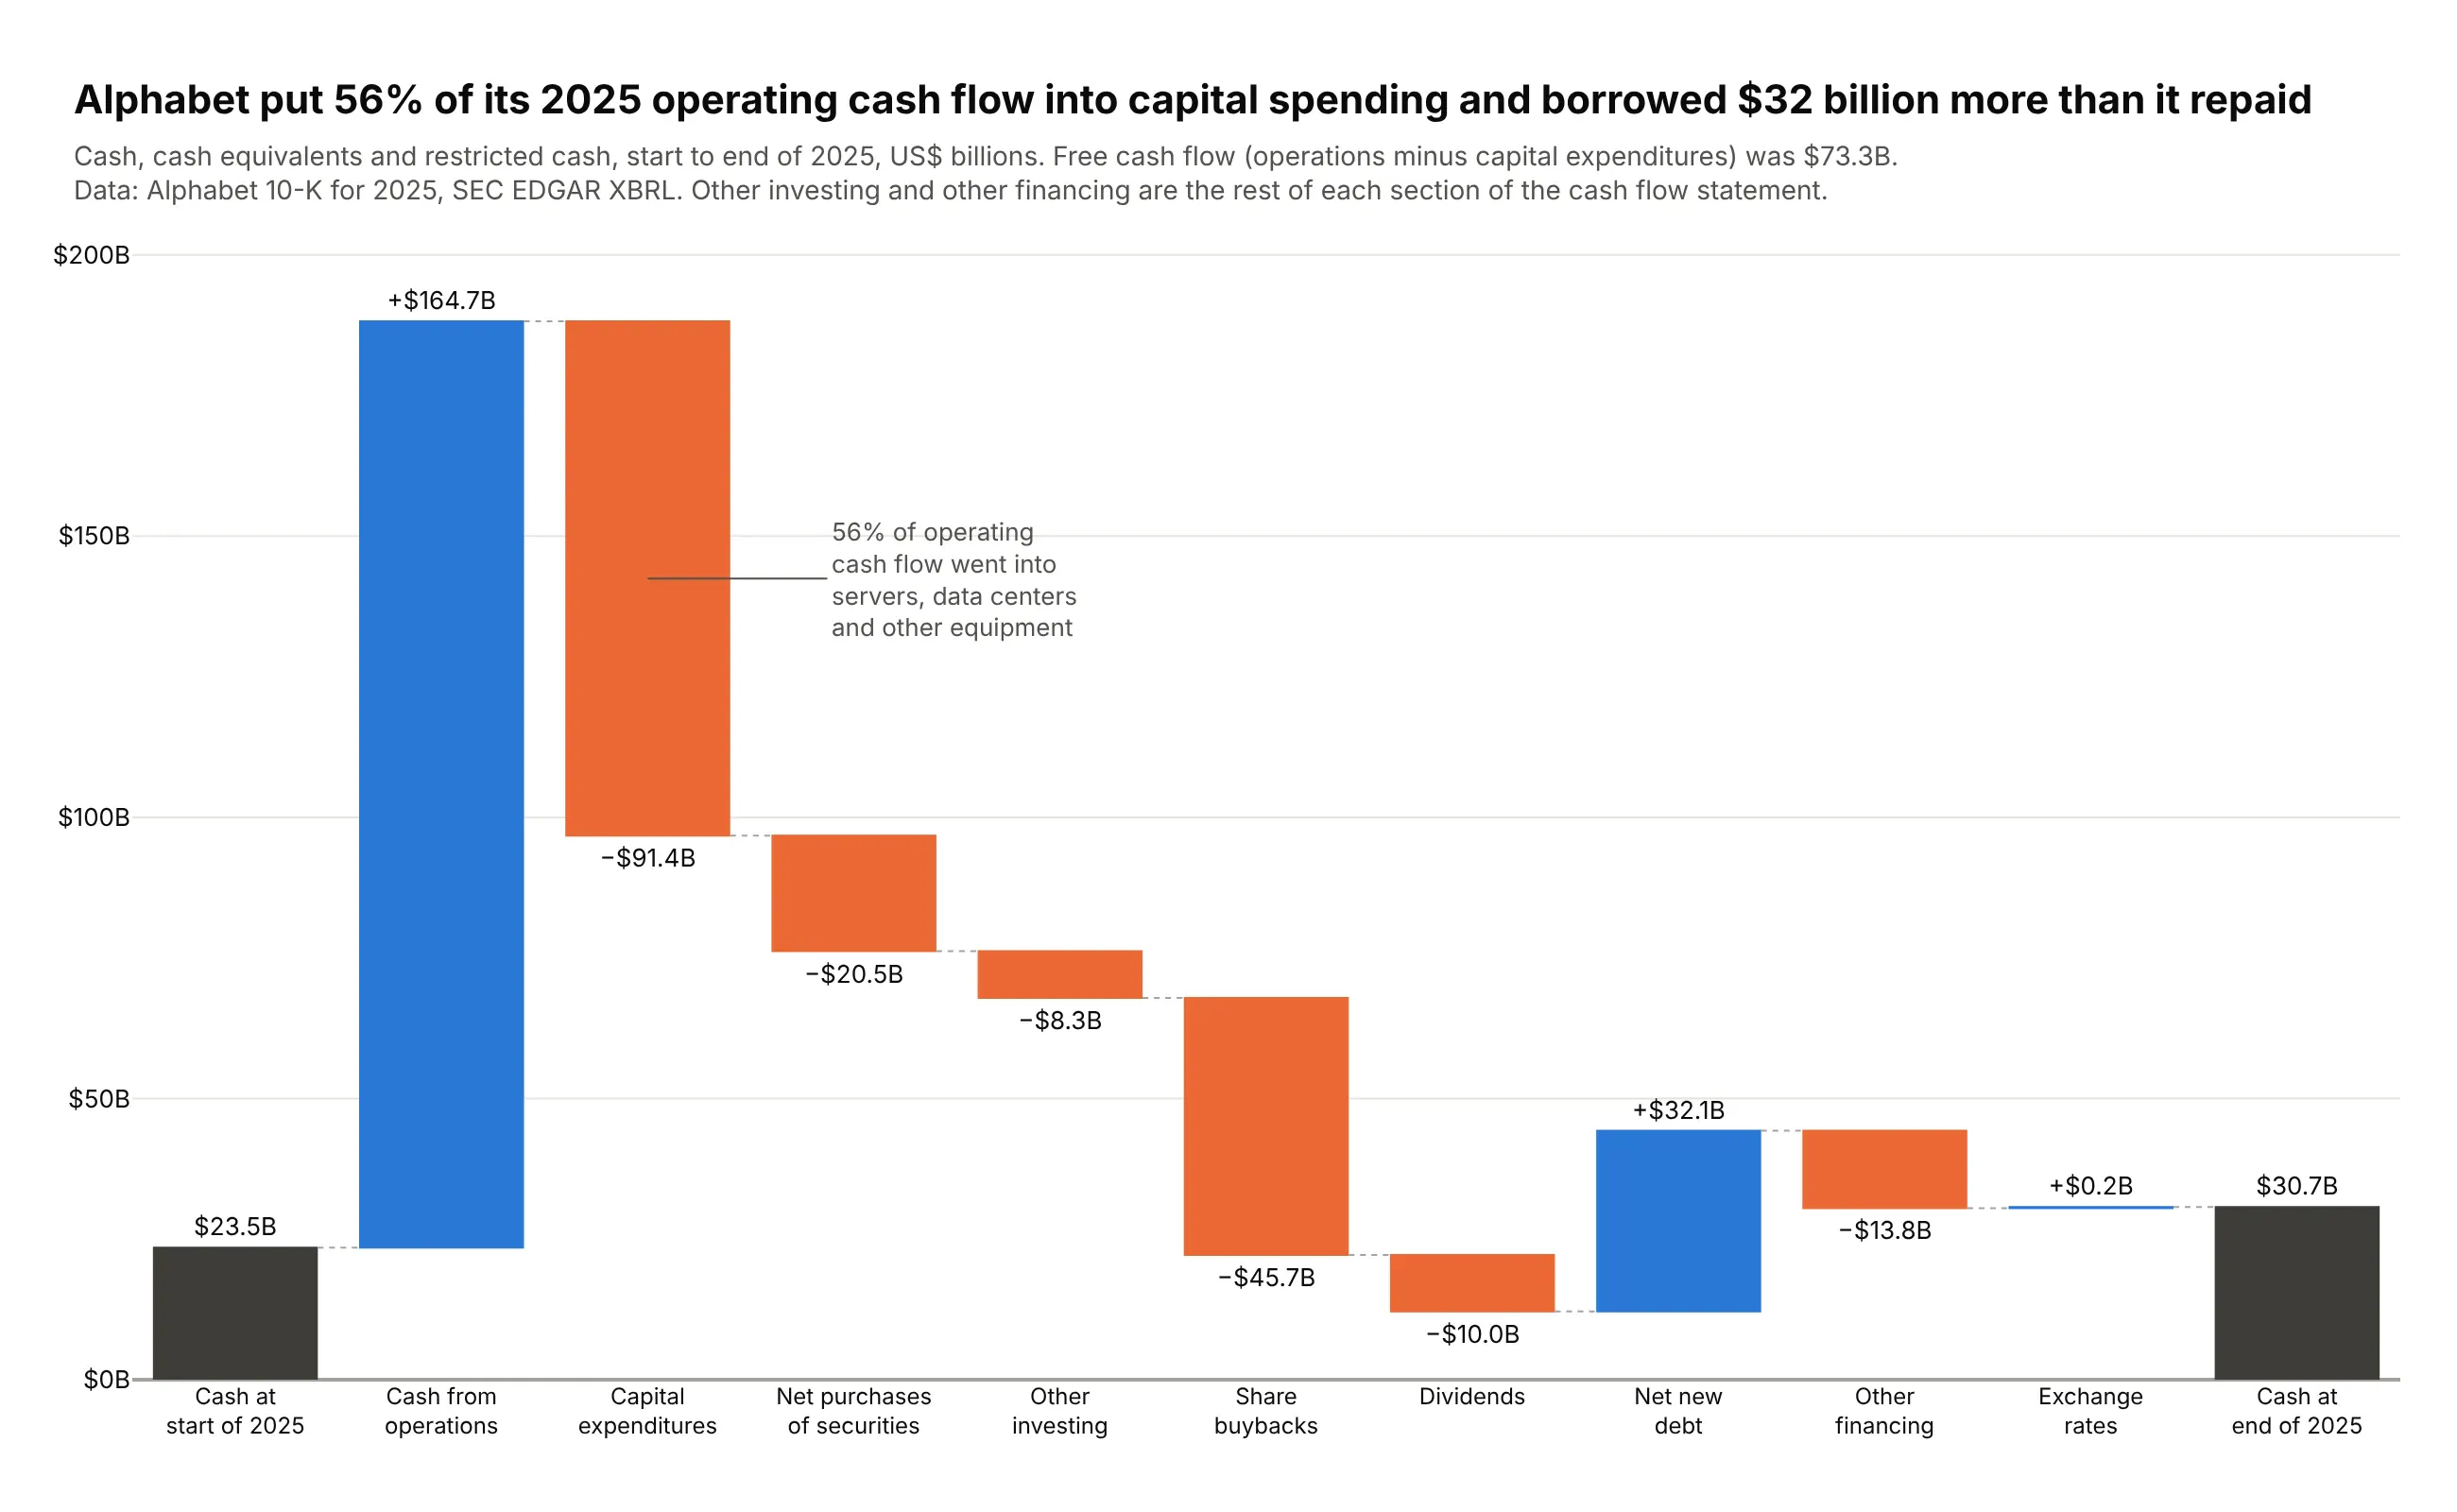
Alphabet generated $164.7 billion of operating cash in 2025 and put 56% of it into capital spending ($91.4 billion). It also borrowed $32.1 billion more than it repaid, and cash ended the year at $30.7 billion. Data: Alphabet 10-K for 2025, SEC EDGAR XBRL.
Tip: an annotation on the capital expenditures bar carries the one number the title is about.
Get the data from Alphabet's 2025 10-K in SEC EDGAR company facts (cash at both ends, operatingcash flow, capex, marketable securities bought and sold, buybacks, dividends, debt issued andrepaid, net investing and financing cash flows, FX effect) and shape it into a table(columns: step, measure, value_bn).Build a plotly cash bridge from opening to closing cash (absolute start, total end). "Otherinvesting" and "Other financing" are what's left of each section. Assert it closes on closing cash.
6. Who added to world CO2 emissions
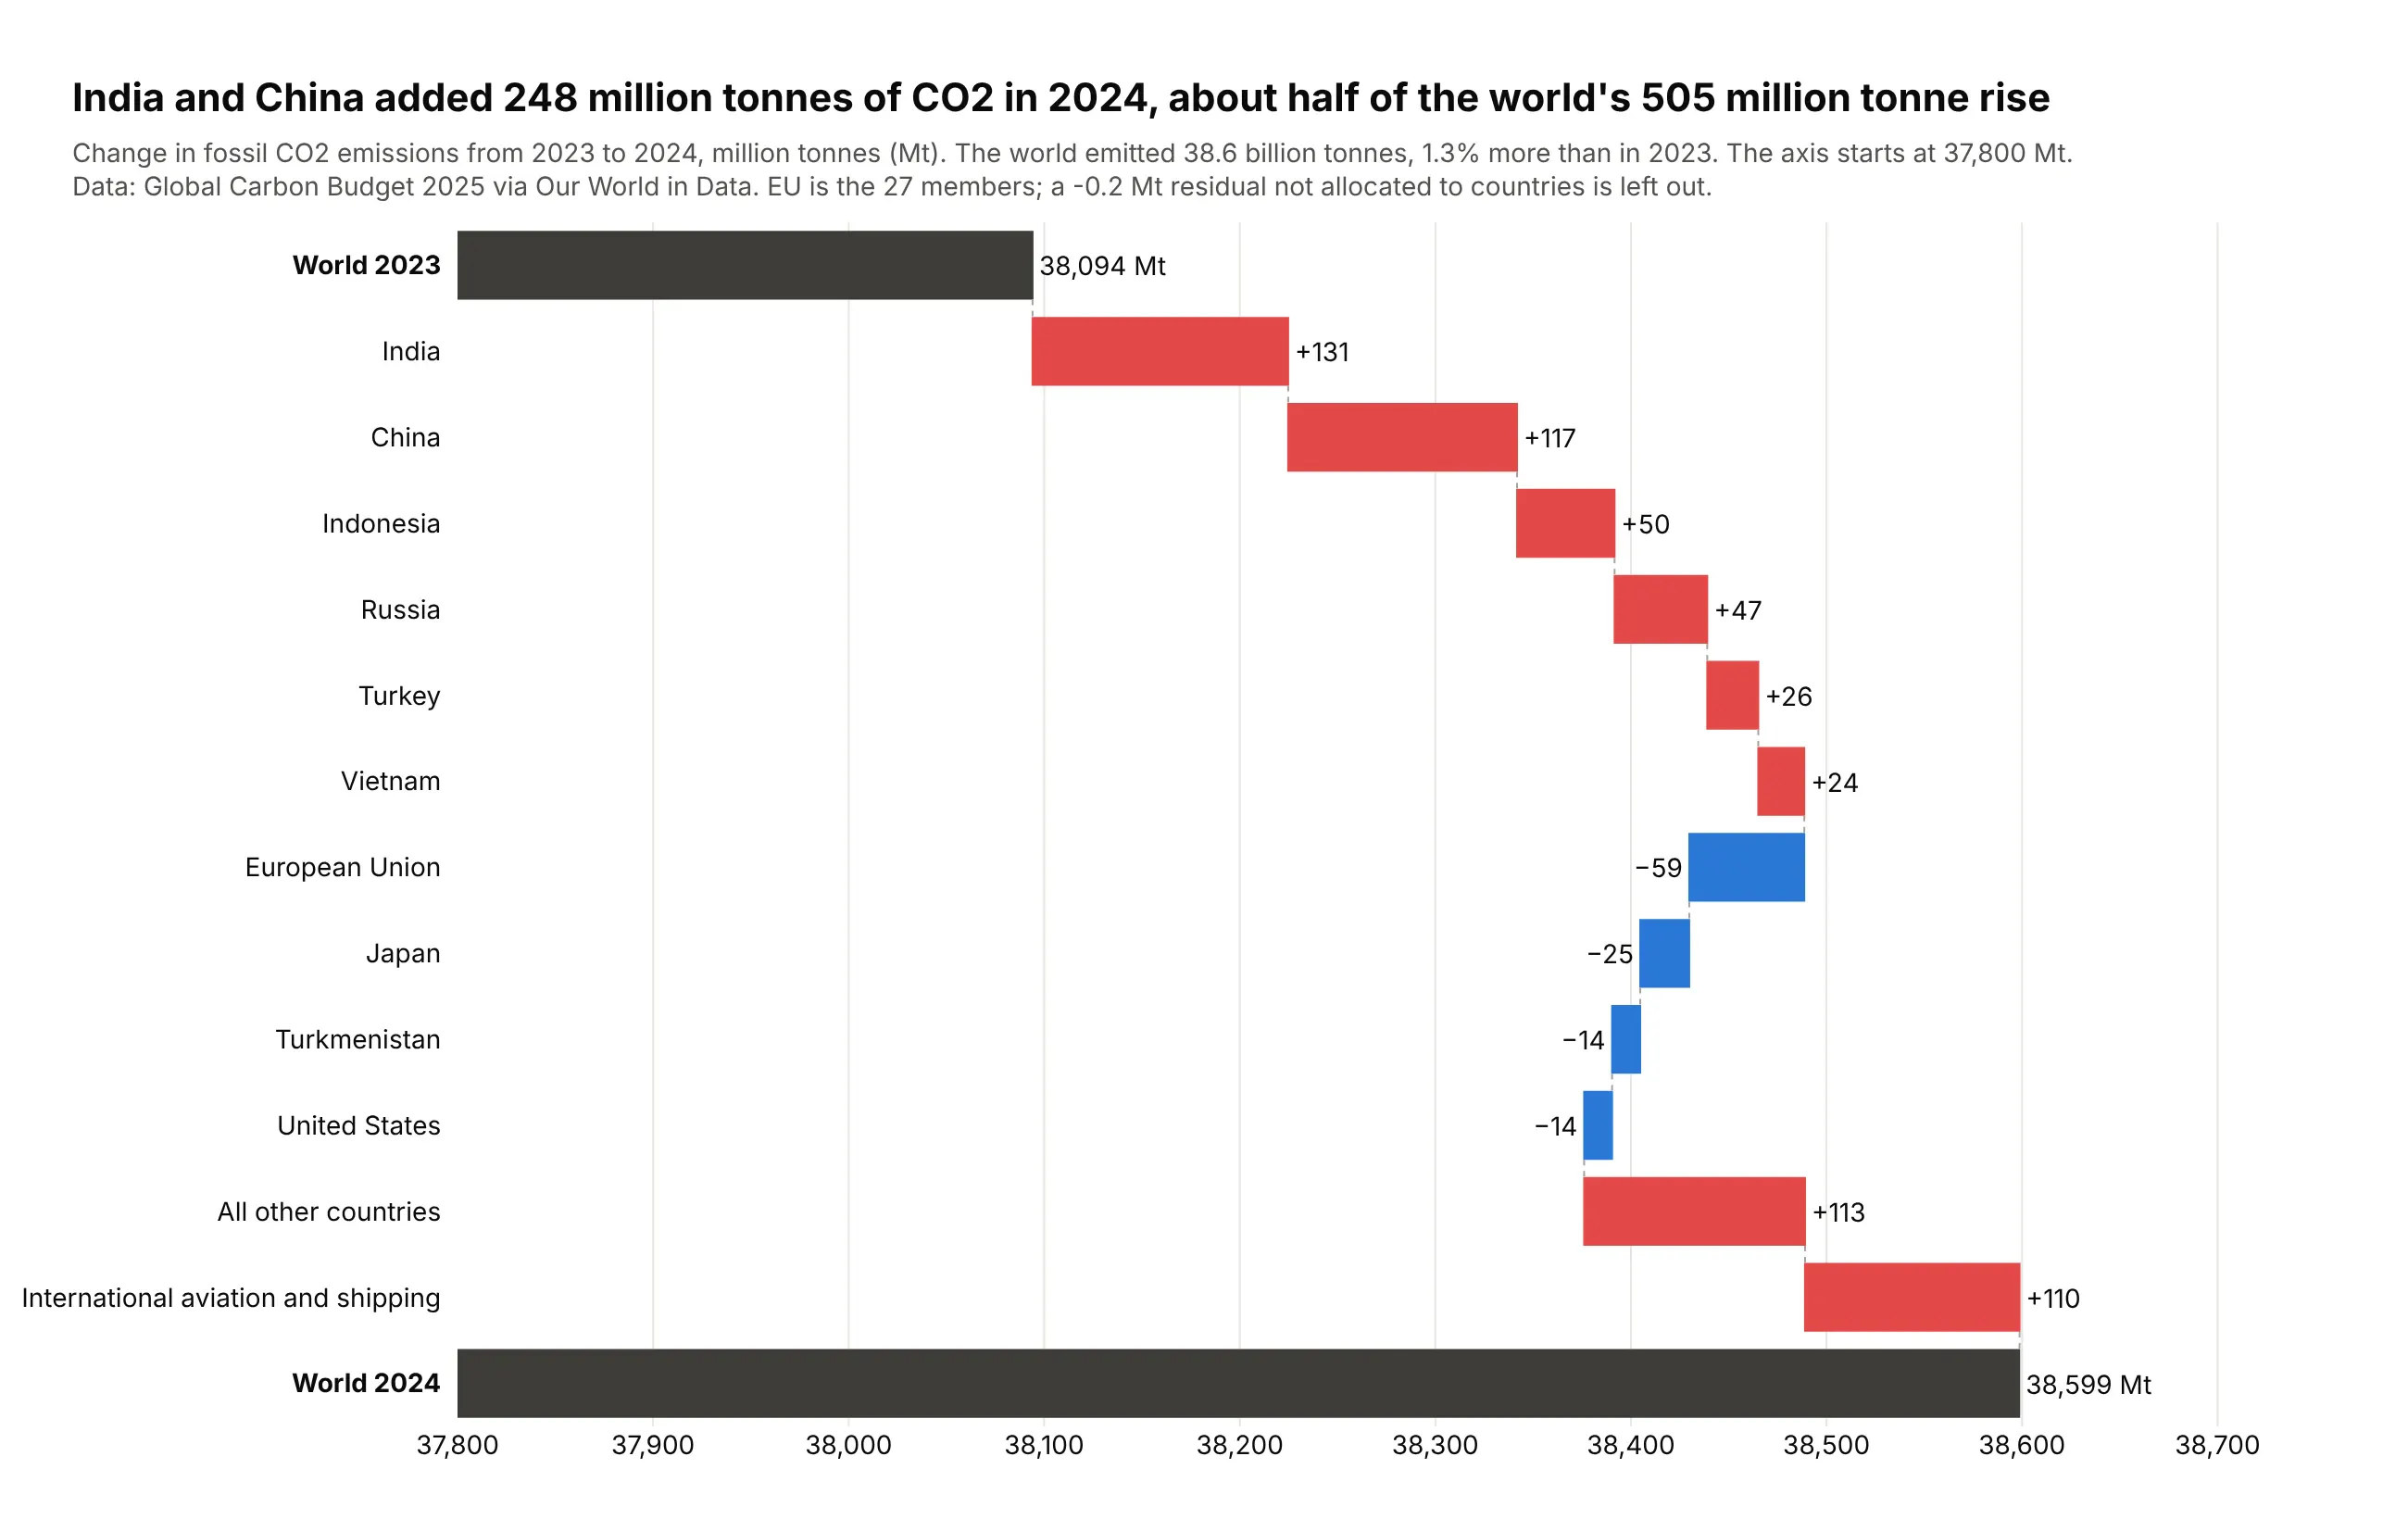
World fossil CO2 emissions rose 505 million tonnes in 2024, to 38.6 billion tonnes. India (+131) and China (+117) added about half of the rise, and international aviation and shipping another 110. Data: Global Carbon Budget 2025 via Our World in Data.
Tip: increases are red and decreases blue, because here a rise is bad news.
Get the data from Our World in Data's CO2 dataset (github.com/owid/co2-data, Global CarbonProject fossil CO2 by country, 2023 and 2024) and shape it into a table(columns: step, measure, mt, mt_2023, mt_2024).Build a horizontal plotly waterfall from World 2023 to World 2024: six biggest increases, fourbiggest decreases (EU as one), all other countries, aviation and shipping. Red up, blue down.
7. The US energy balance
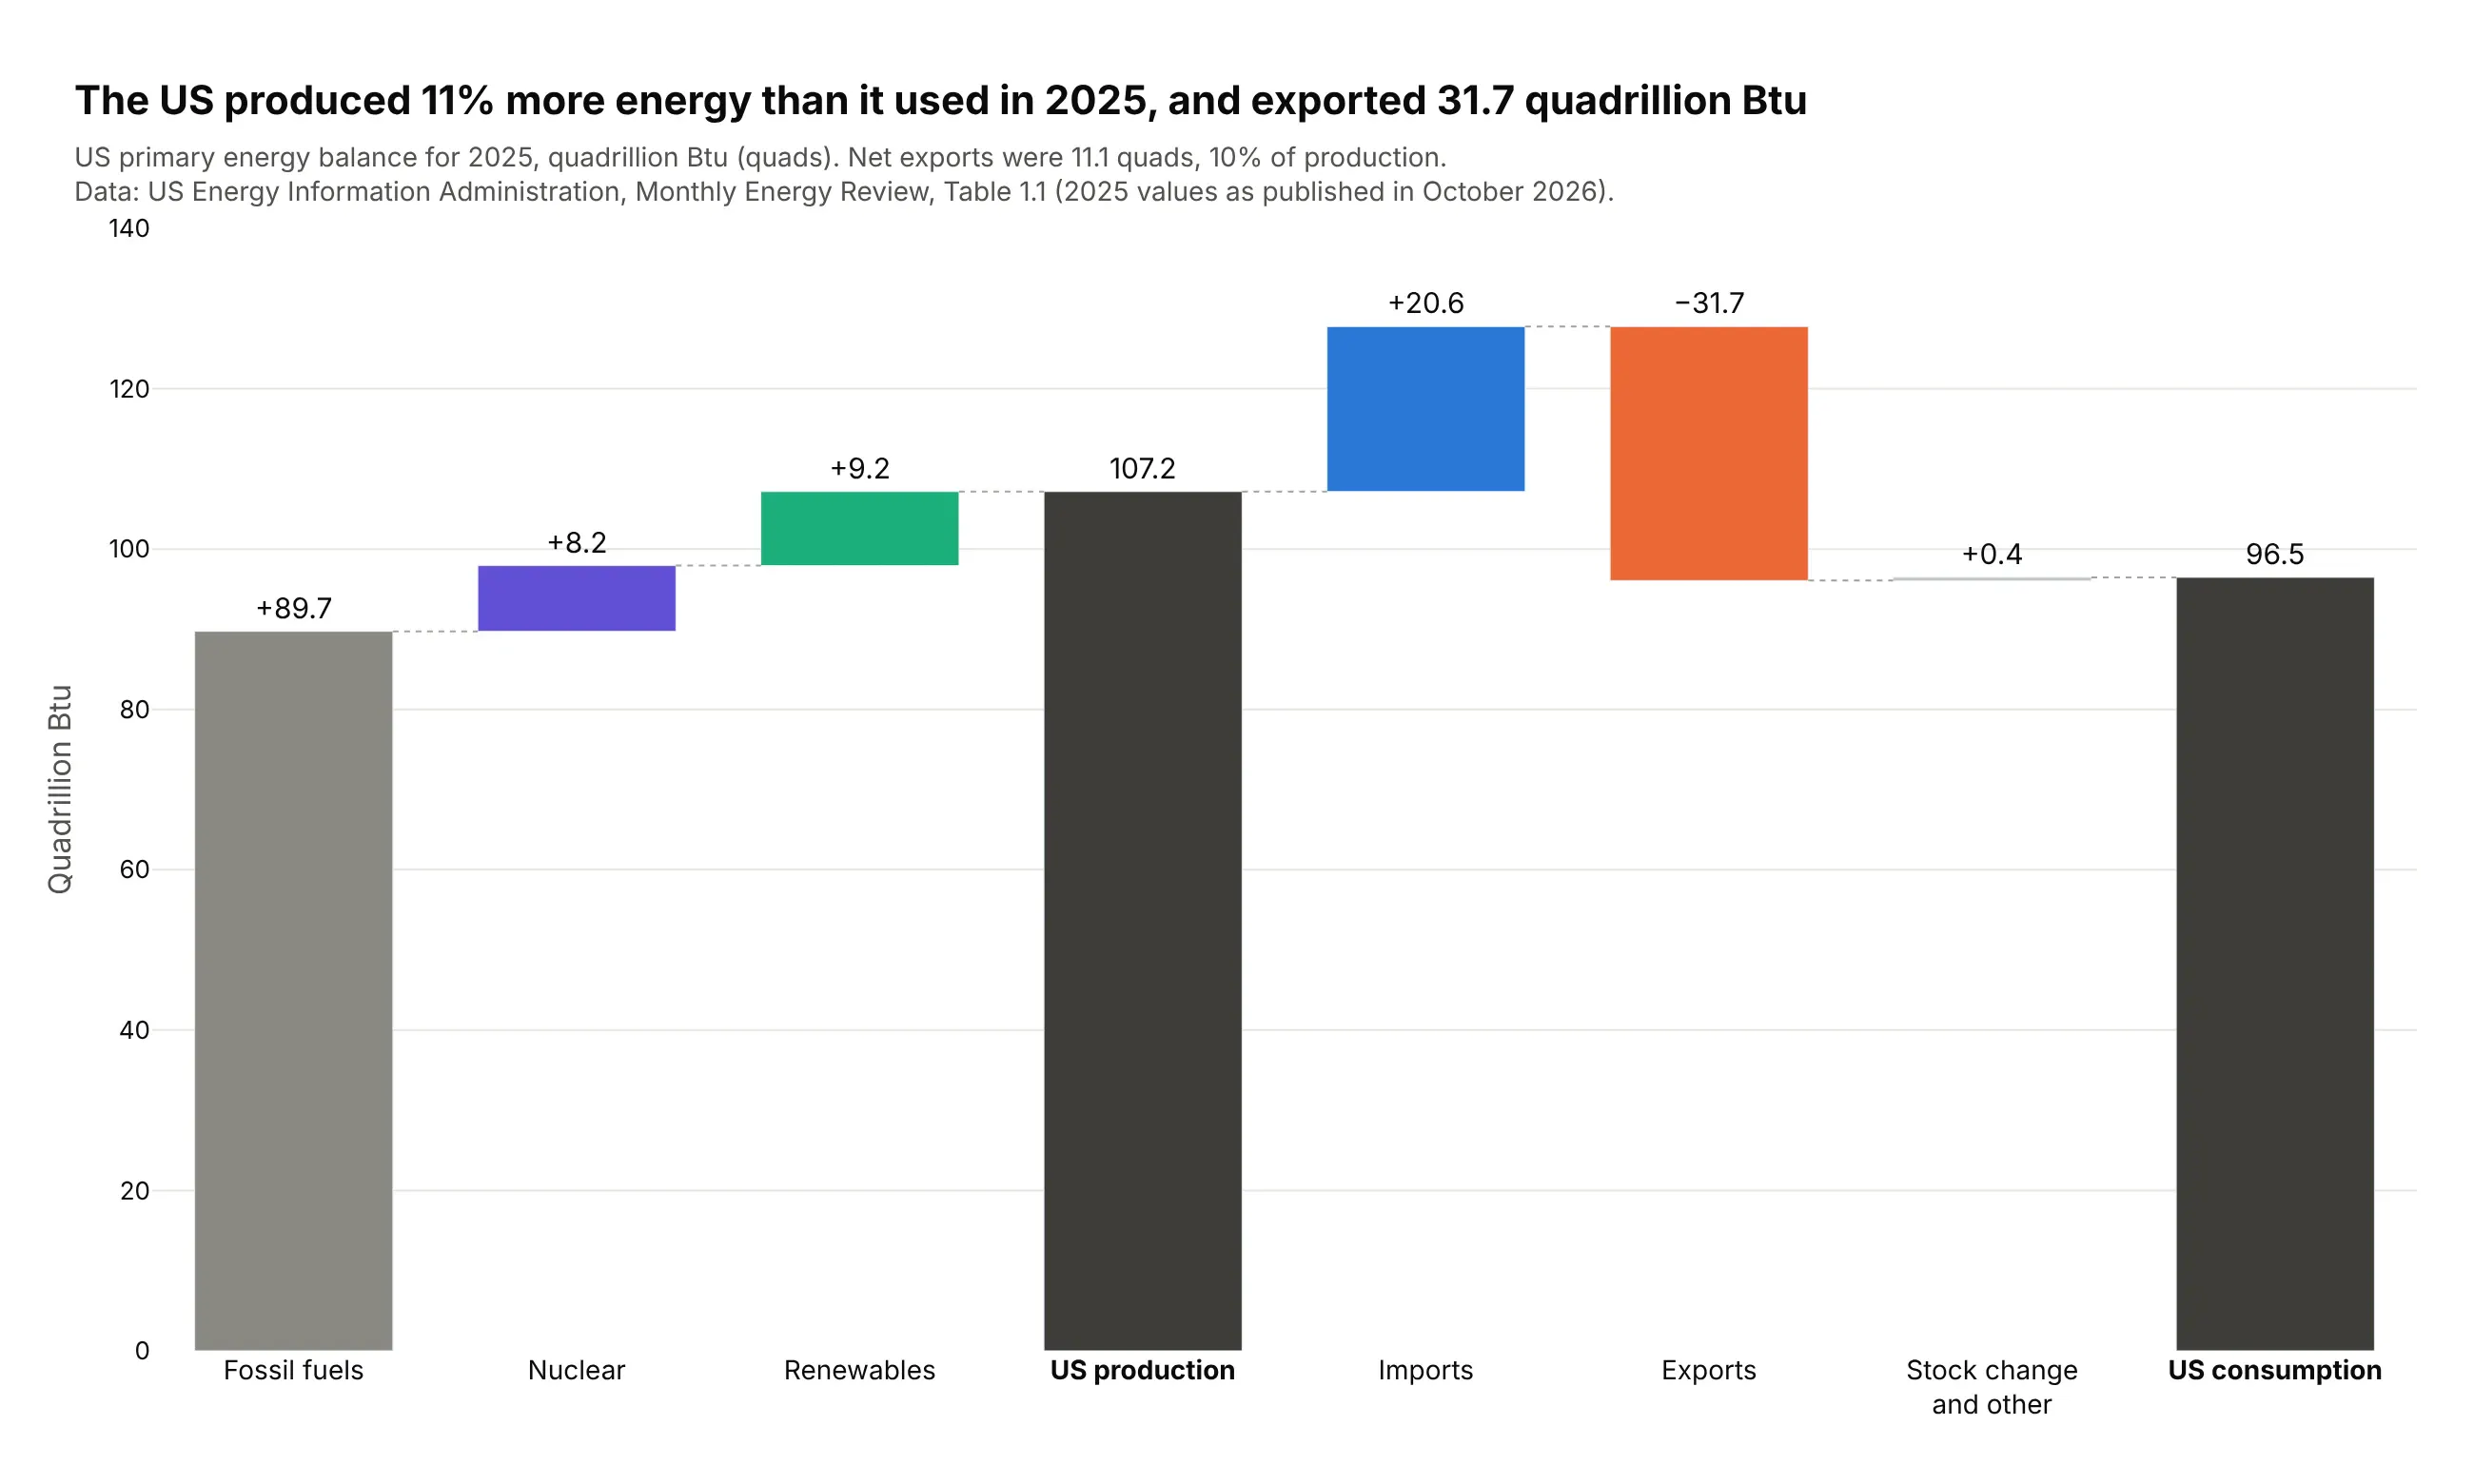
The US produced 107.2 quadrillion Btu of energy in 2025 and used 96.5, so it produced 11% more than it used. It exported 31.7 quads and imported 20.6. Data: US EIA, Monthly Energy Review, Table 1.1.
Tip: each source has its own color, drawn with go.Bar and base, which takes one color per bar.
Get the data from the US EIA Monthly Energy Review, Table 1.1 (eia.gov, annual 2025, quadrillionBtu) and shape it into a table (columns: step, measure, quads).Build a plotly energy balance: fossil, nuclear and renewable production up to "US production"(total), imports, exports and stock change to "US consumption" (total). Use go.Bar with base soeach source has its own color. Assert production + imports - exports + stock change = consumption.
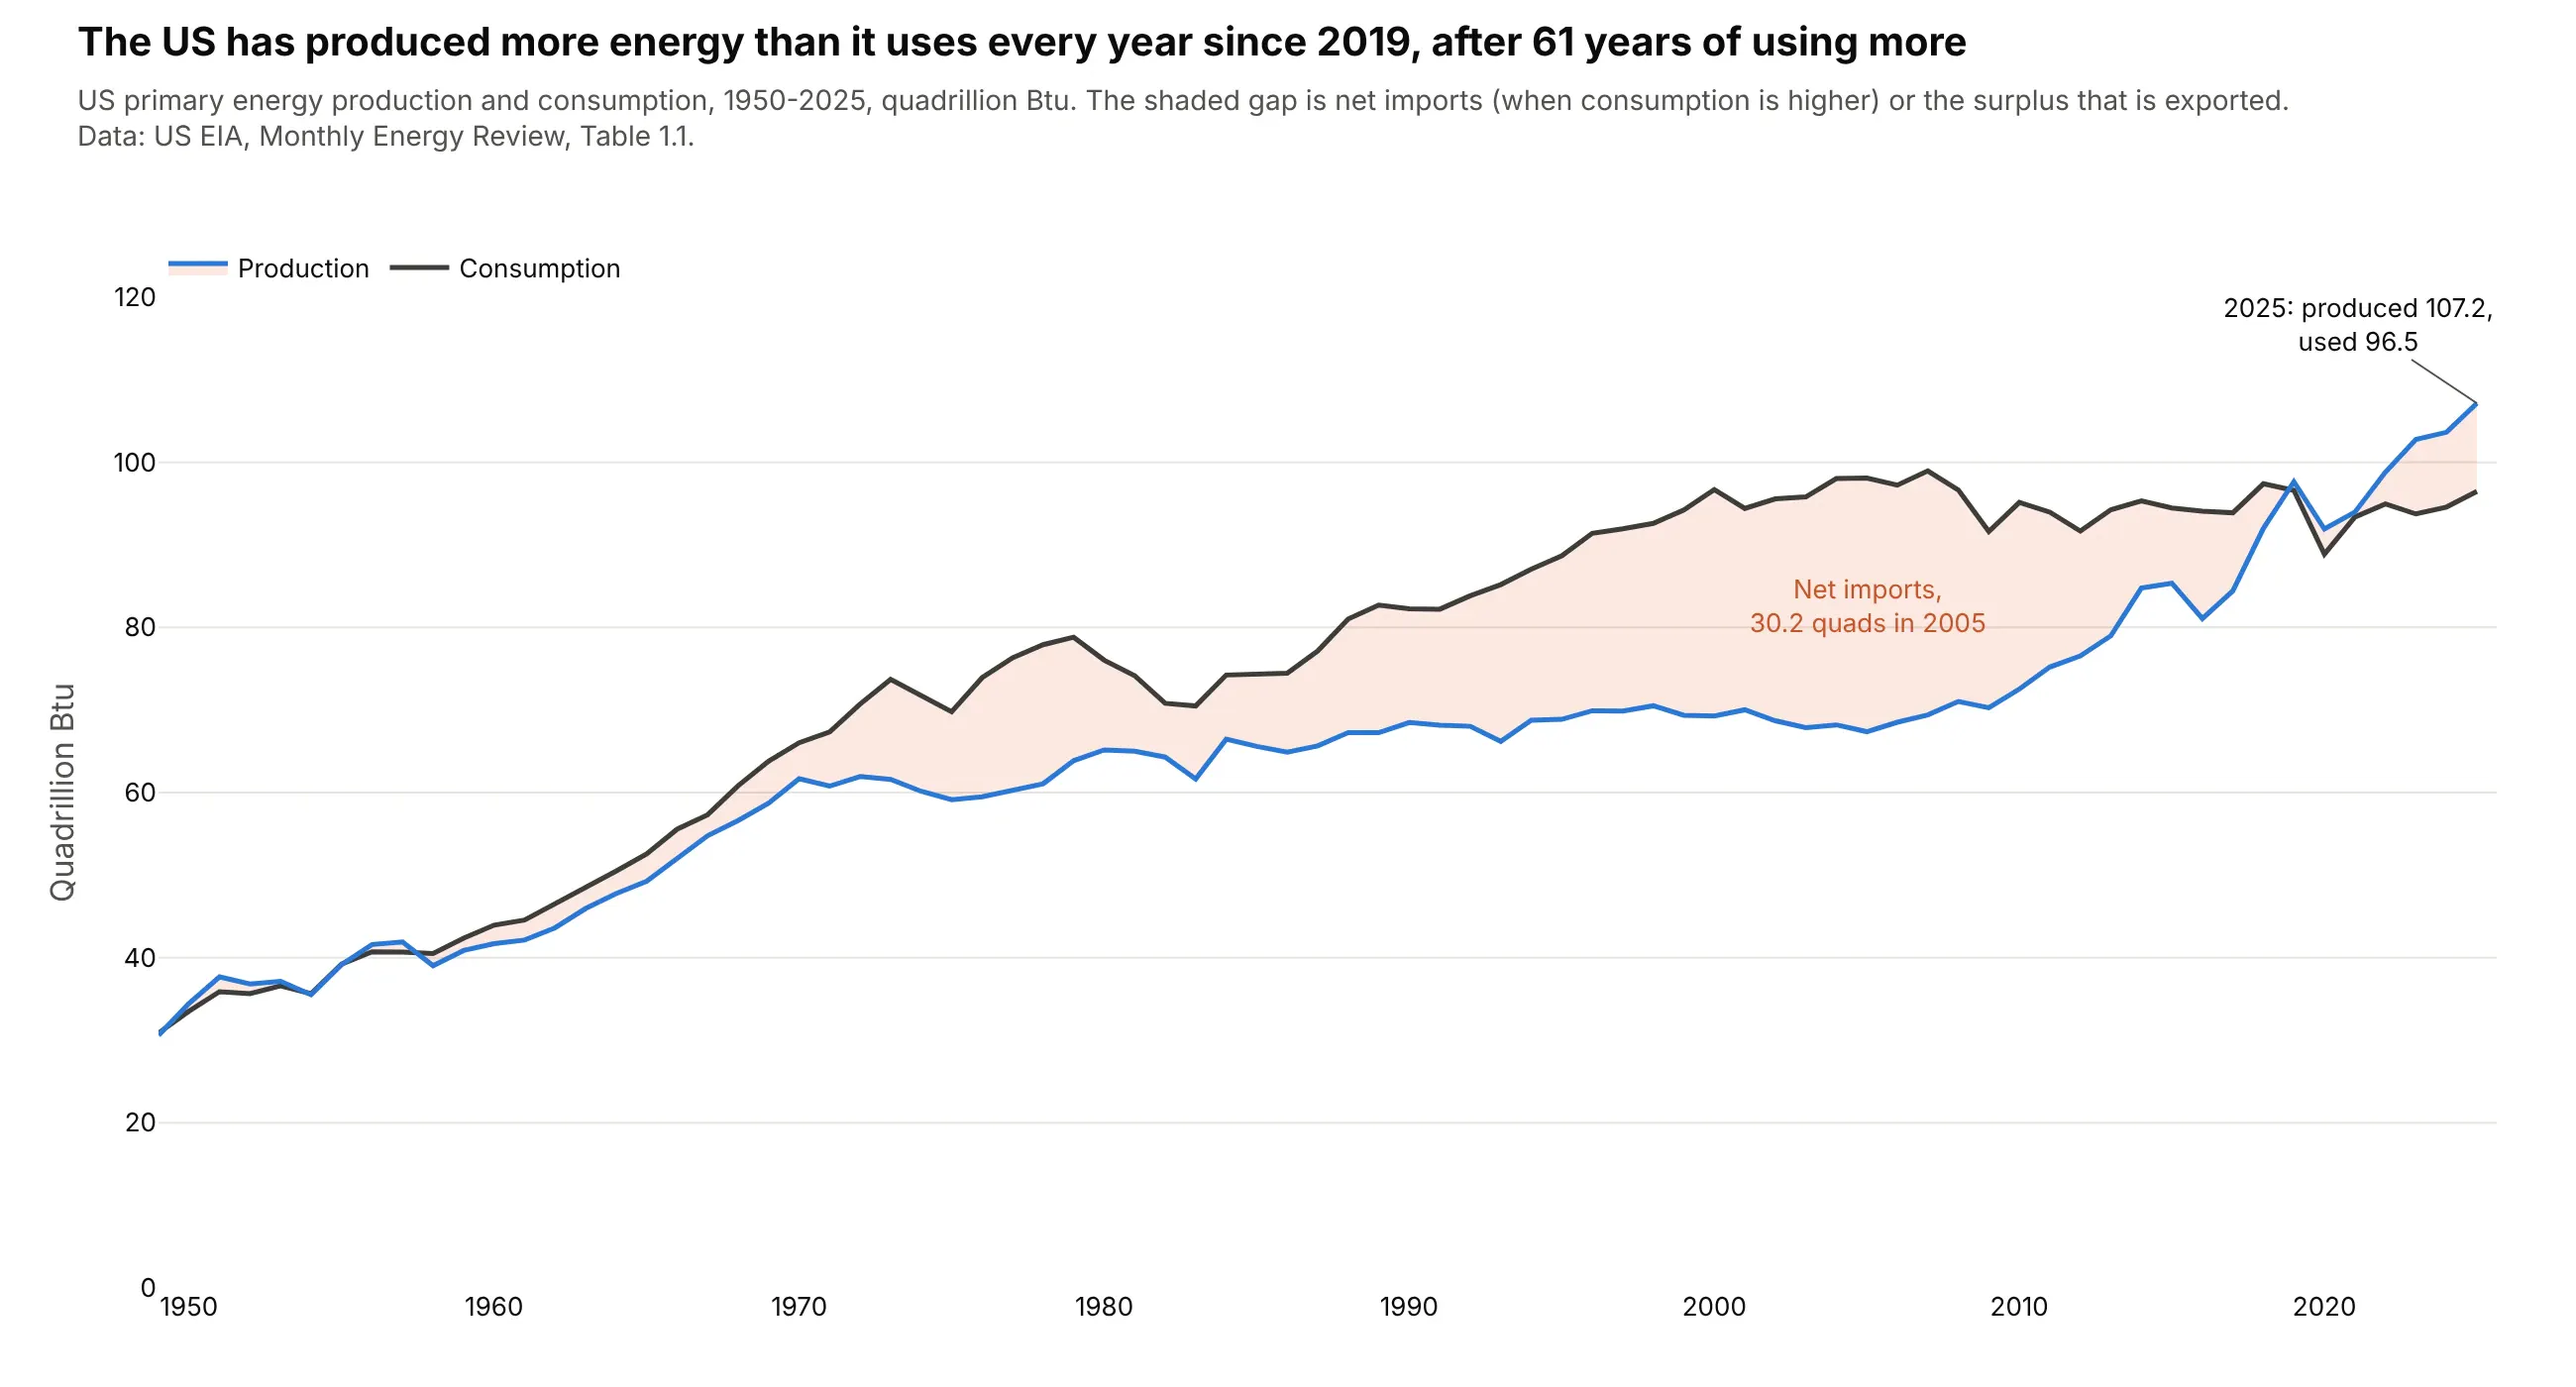
Another way to see it: a line chart of production and consumption since 1950 shows that 2019 was the first year since 1957 that the US produced more than it used.
8. The US federal deficit
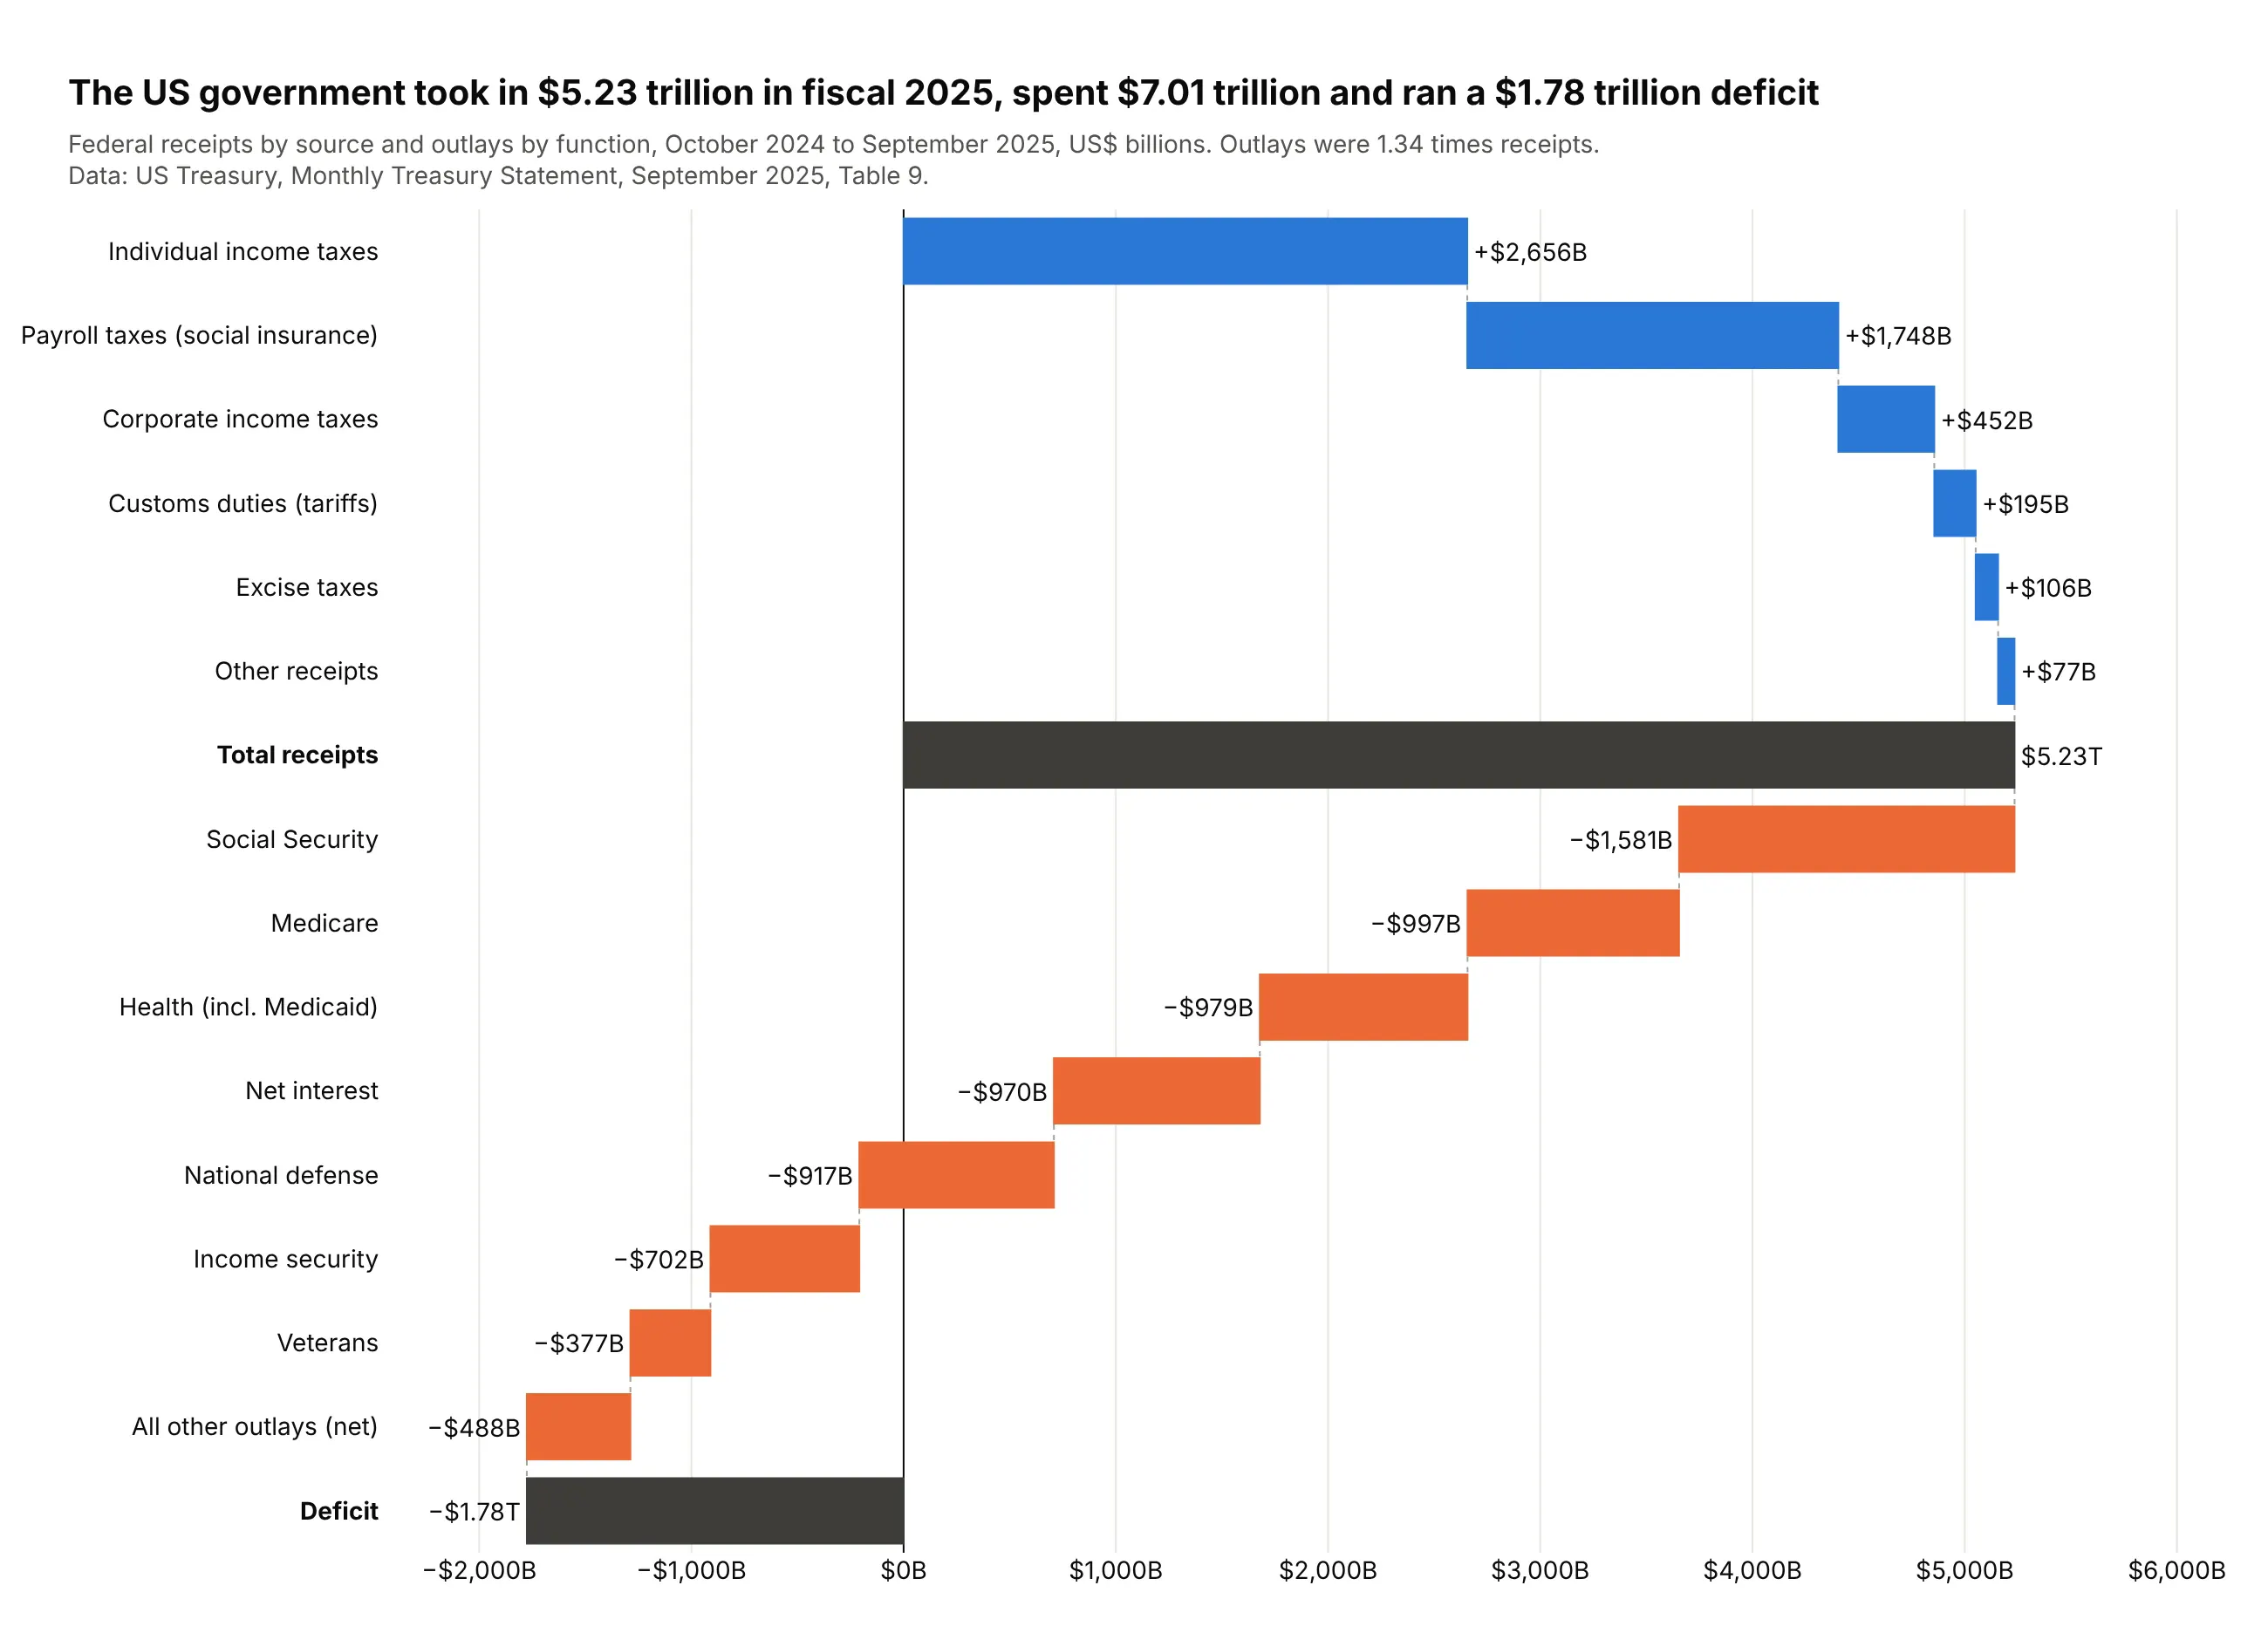
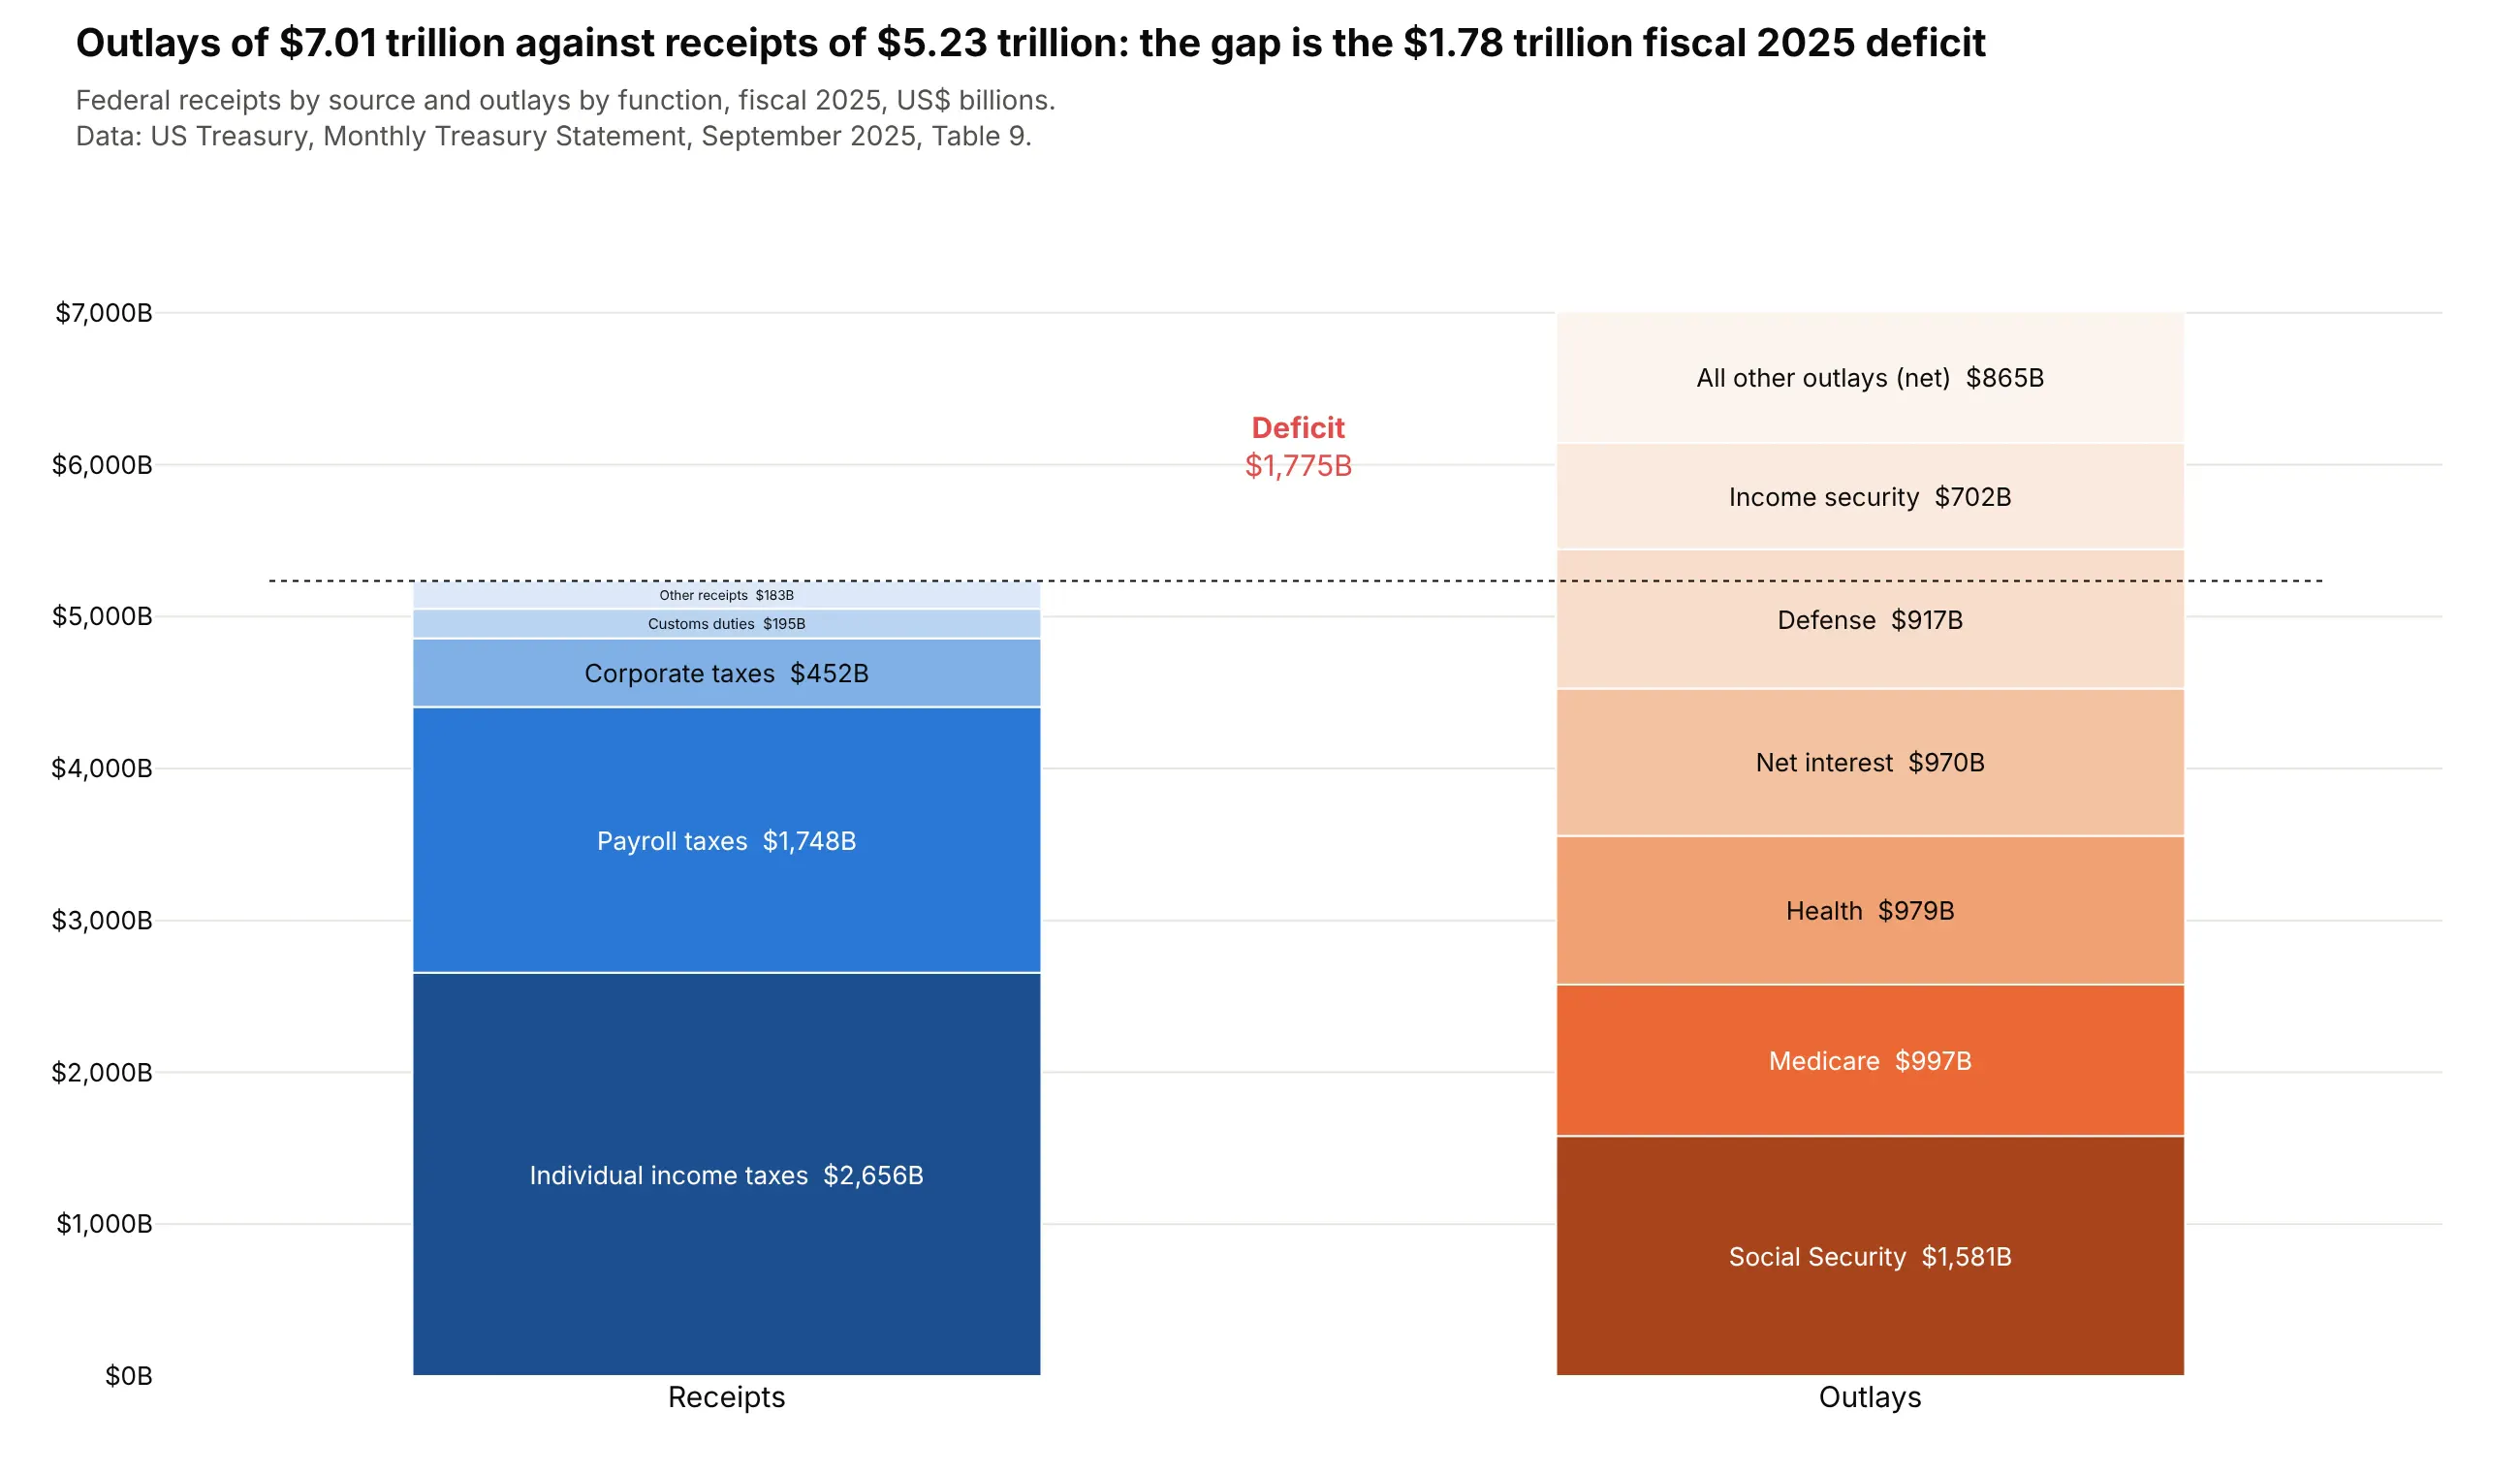
The federal government took in $5.23 trillion in fiscal 2025 and spent $7.01 trillion, a $1.78 trillion deficit. Social Security alone ($1,581 billion) was more than corporate taxes, tariffs, excise and estate taxes combined. Data: US Treasury, Monthly Treasury Statement, September 2025, Table 9.
Tip: receipts build up to a subtotal and outlays take it below zero, so the deficit is the last total bar.
Get the data from the US Treasury's Monthly Treasury Statement, Table 9, September 2025(fiscaldata.treasury.gov API) and shape it into a table (columns: side, line, fy2025_bn, fy2024_bn).Build a horizontal plotly waterfall: receipts by source (sorted), "Total receipts" (total), theseven largest outlay functions and "All other outlays (net)", "Deficit" (total, below zero).
Another way to see it: two stacked bars of receipts and outlays make the gap obvious but hide which outlays push past receipts.
9. US population change
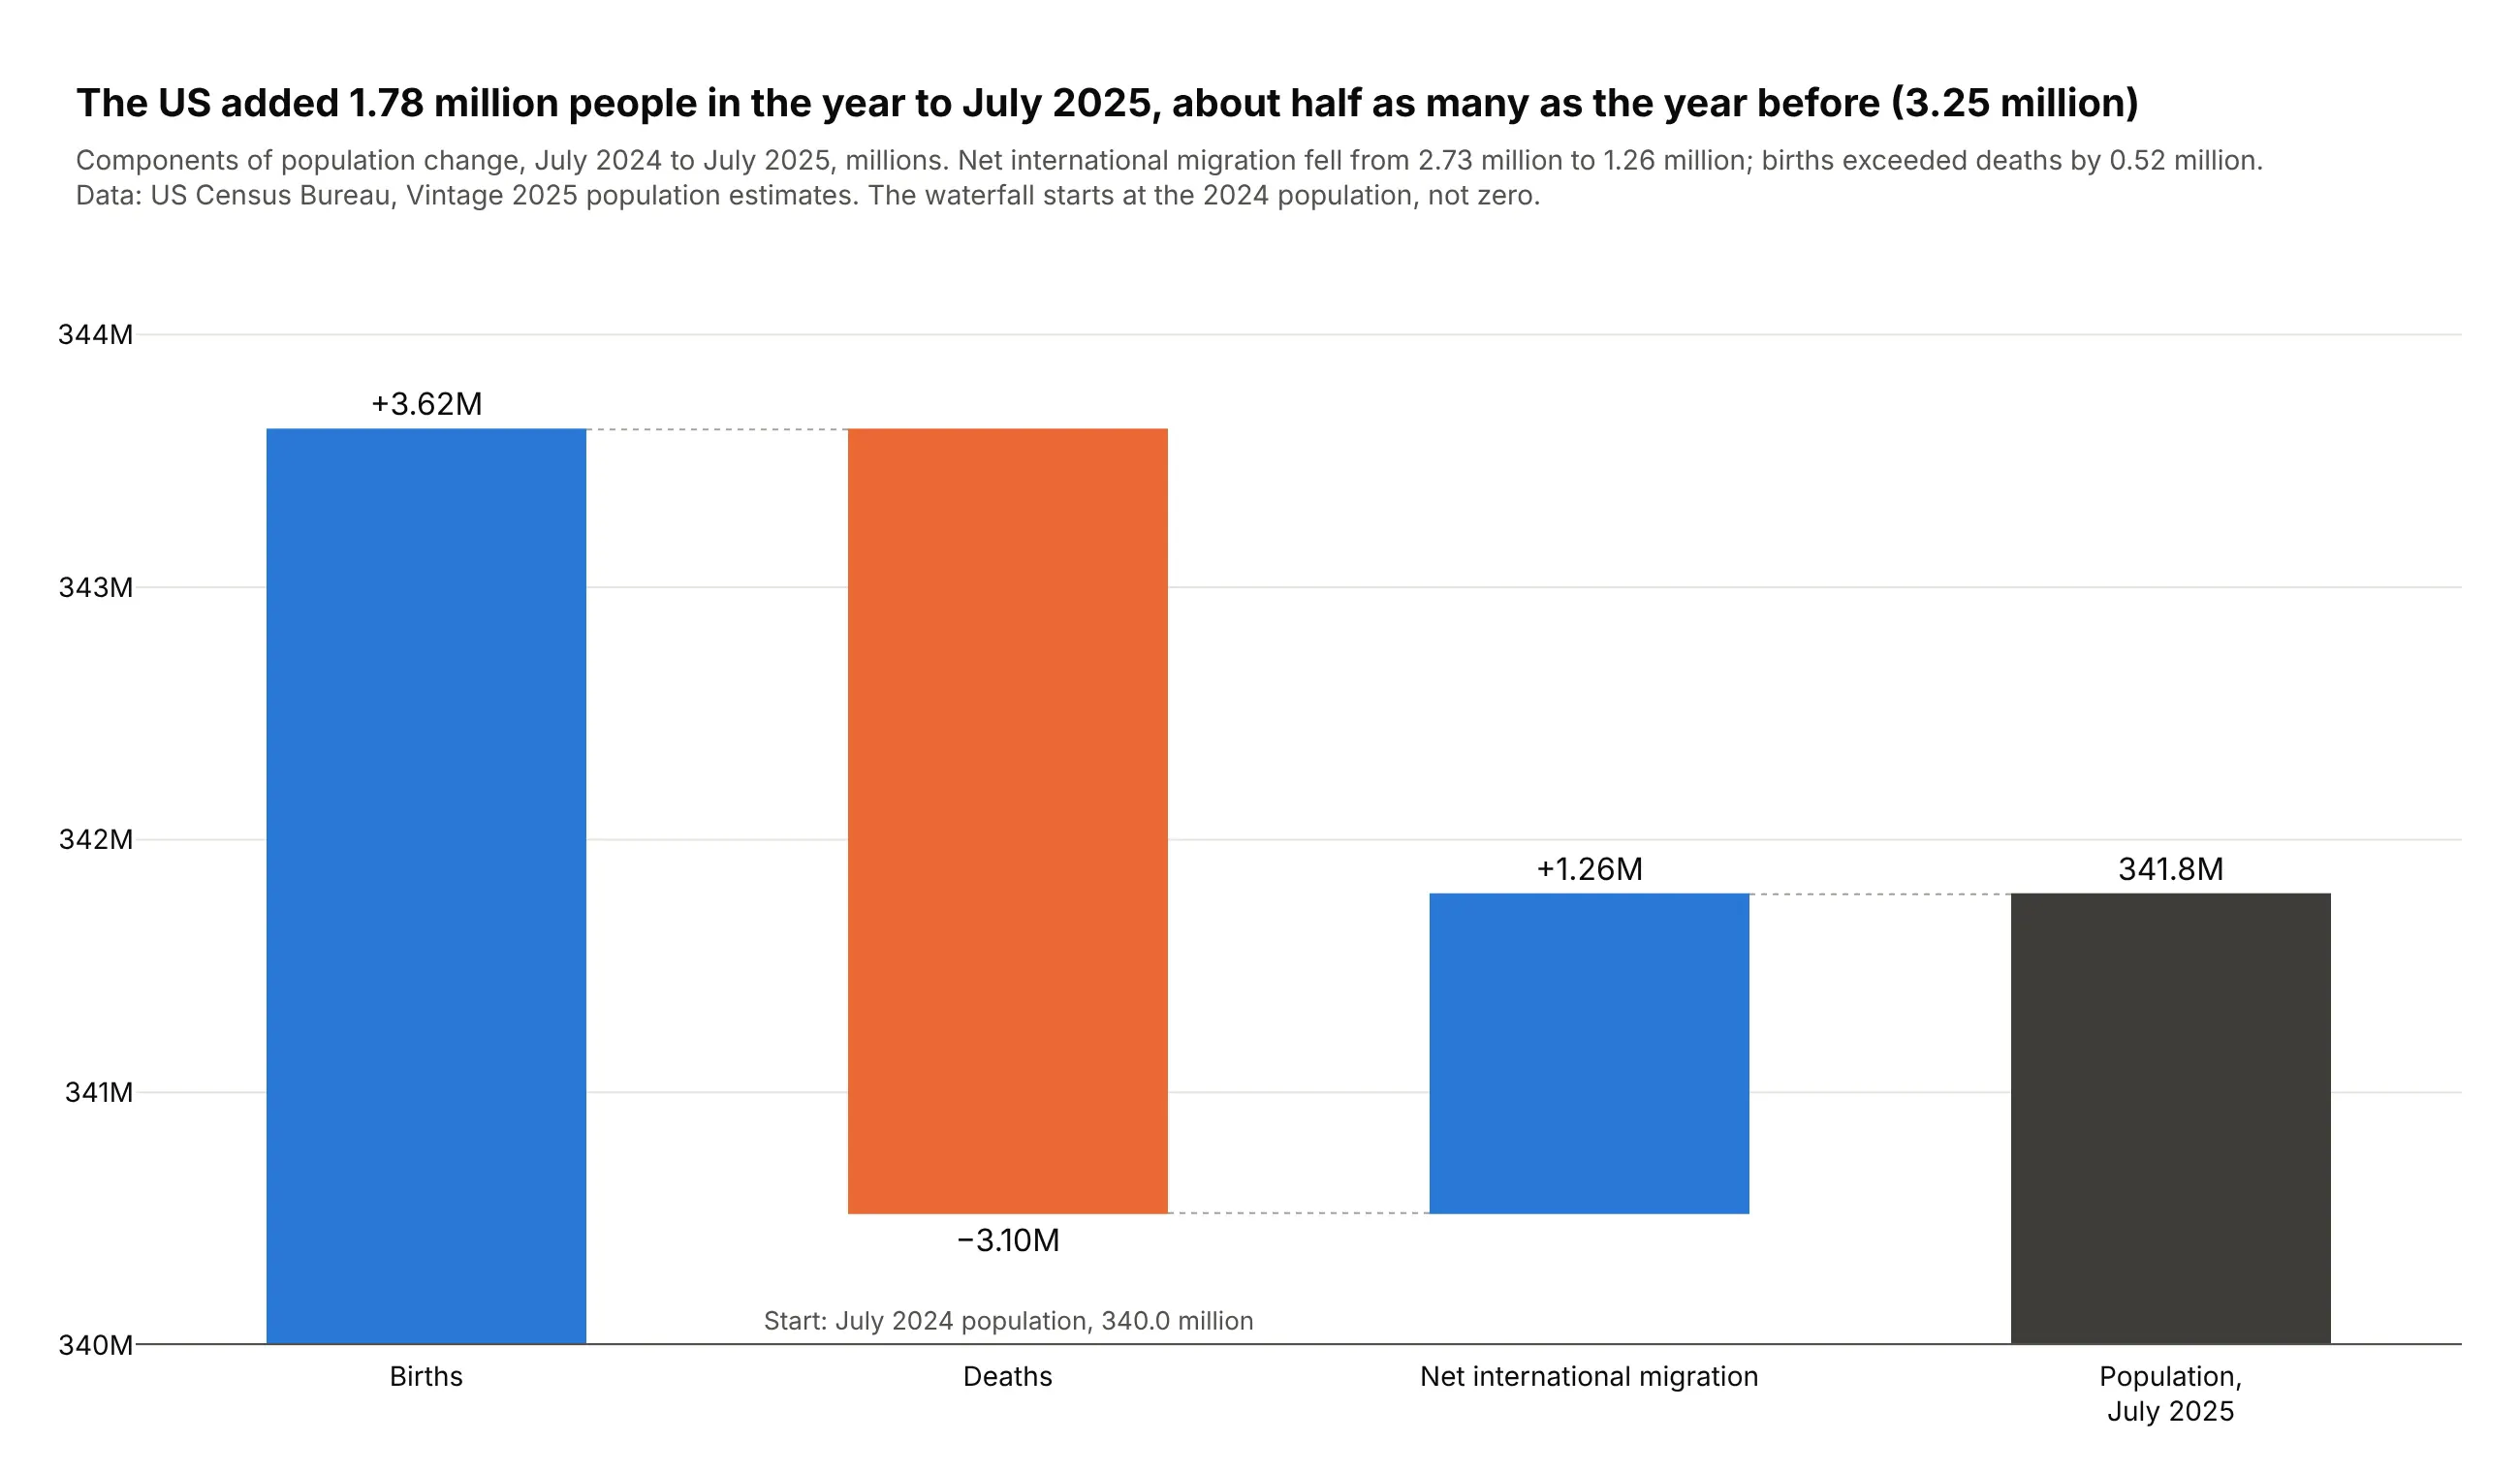
The US added 1.78 million people in the year to July 2025, about half as many as the year before. Births exceeded deaths by 0.52 million, and net international migration fell from 2.73 million to 1.26 million. Data: US Census Bureau, Vintage 2025 population estimates.
Tip: base starts the waterfall at 340.0 million, so no 340-million-person bar flattens the steps.
Get the data from the US Census Bureau's Vintage 2025 state population totals(NST-EST2025-ALLDATA.csv, United States row) and shape it into a table (columns: step, measure, people).Build a plotly waterfall in millions with base = July 2024 population: births, deaths, netinternational migration (relative), July 2025 population (total).
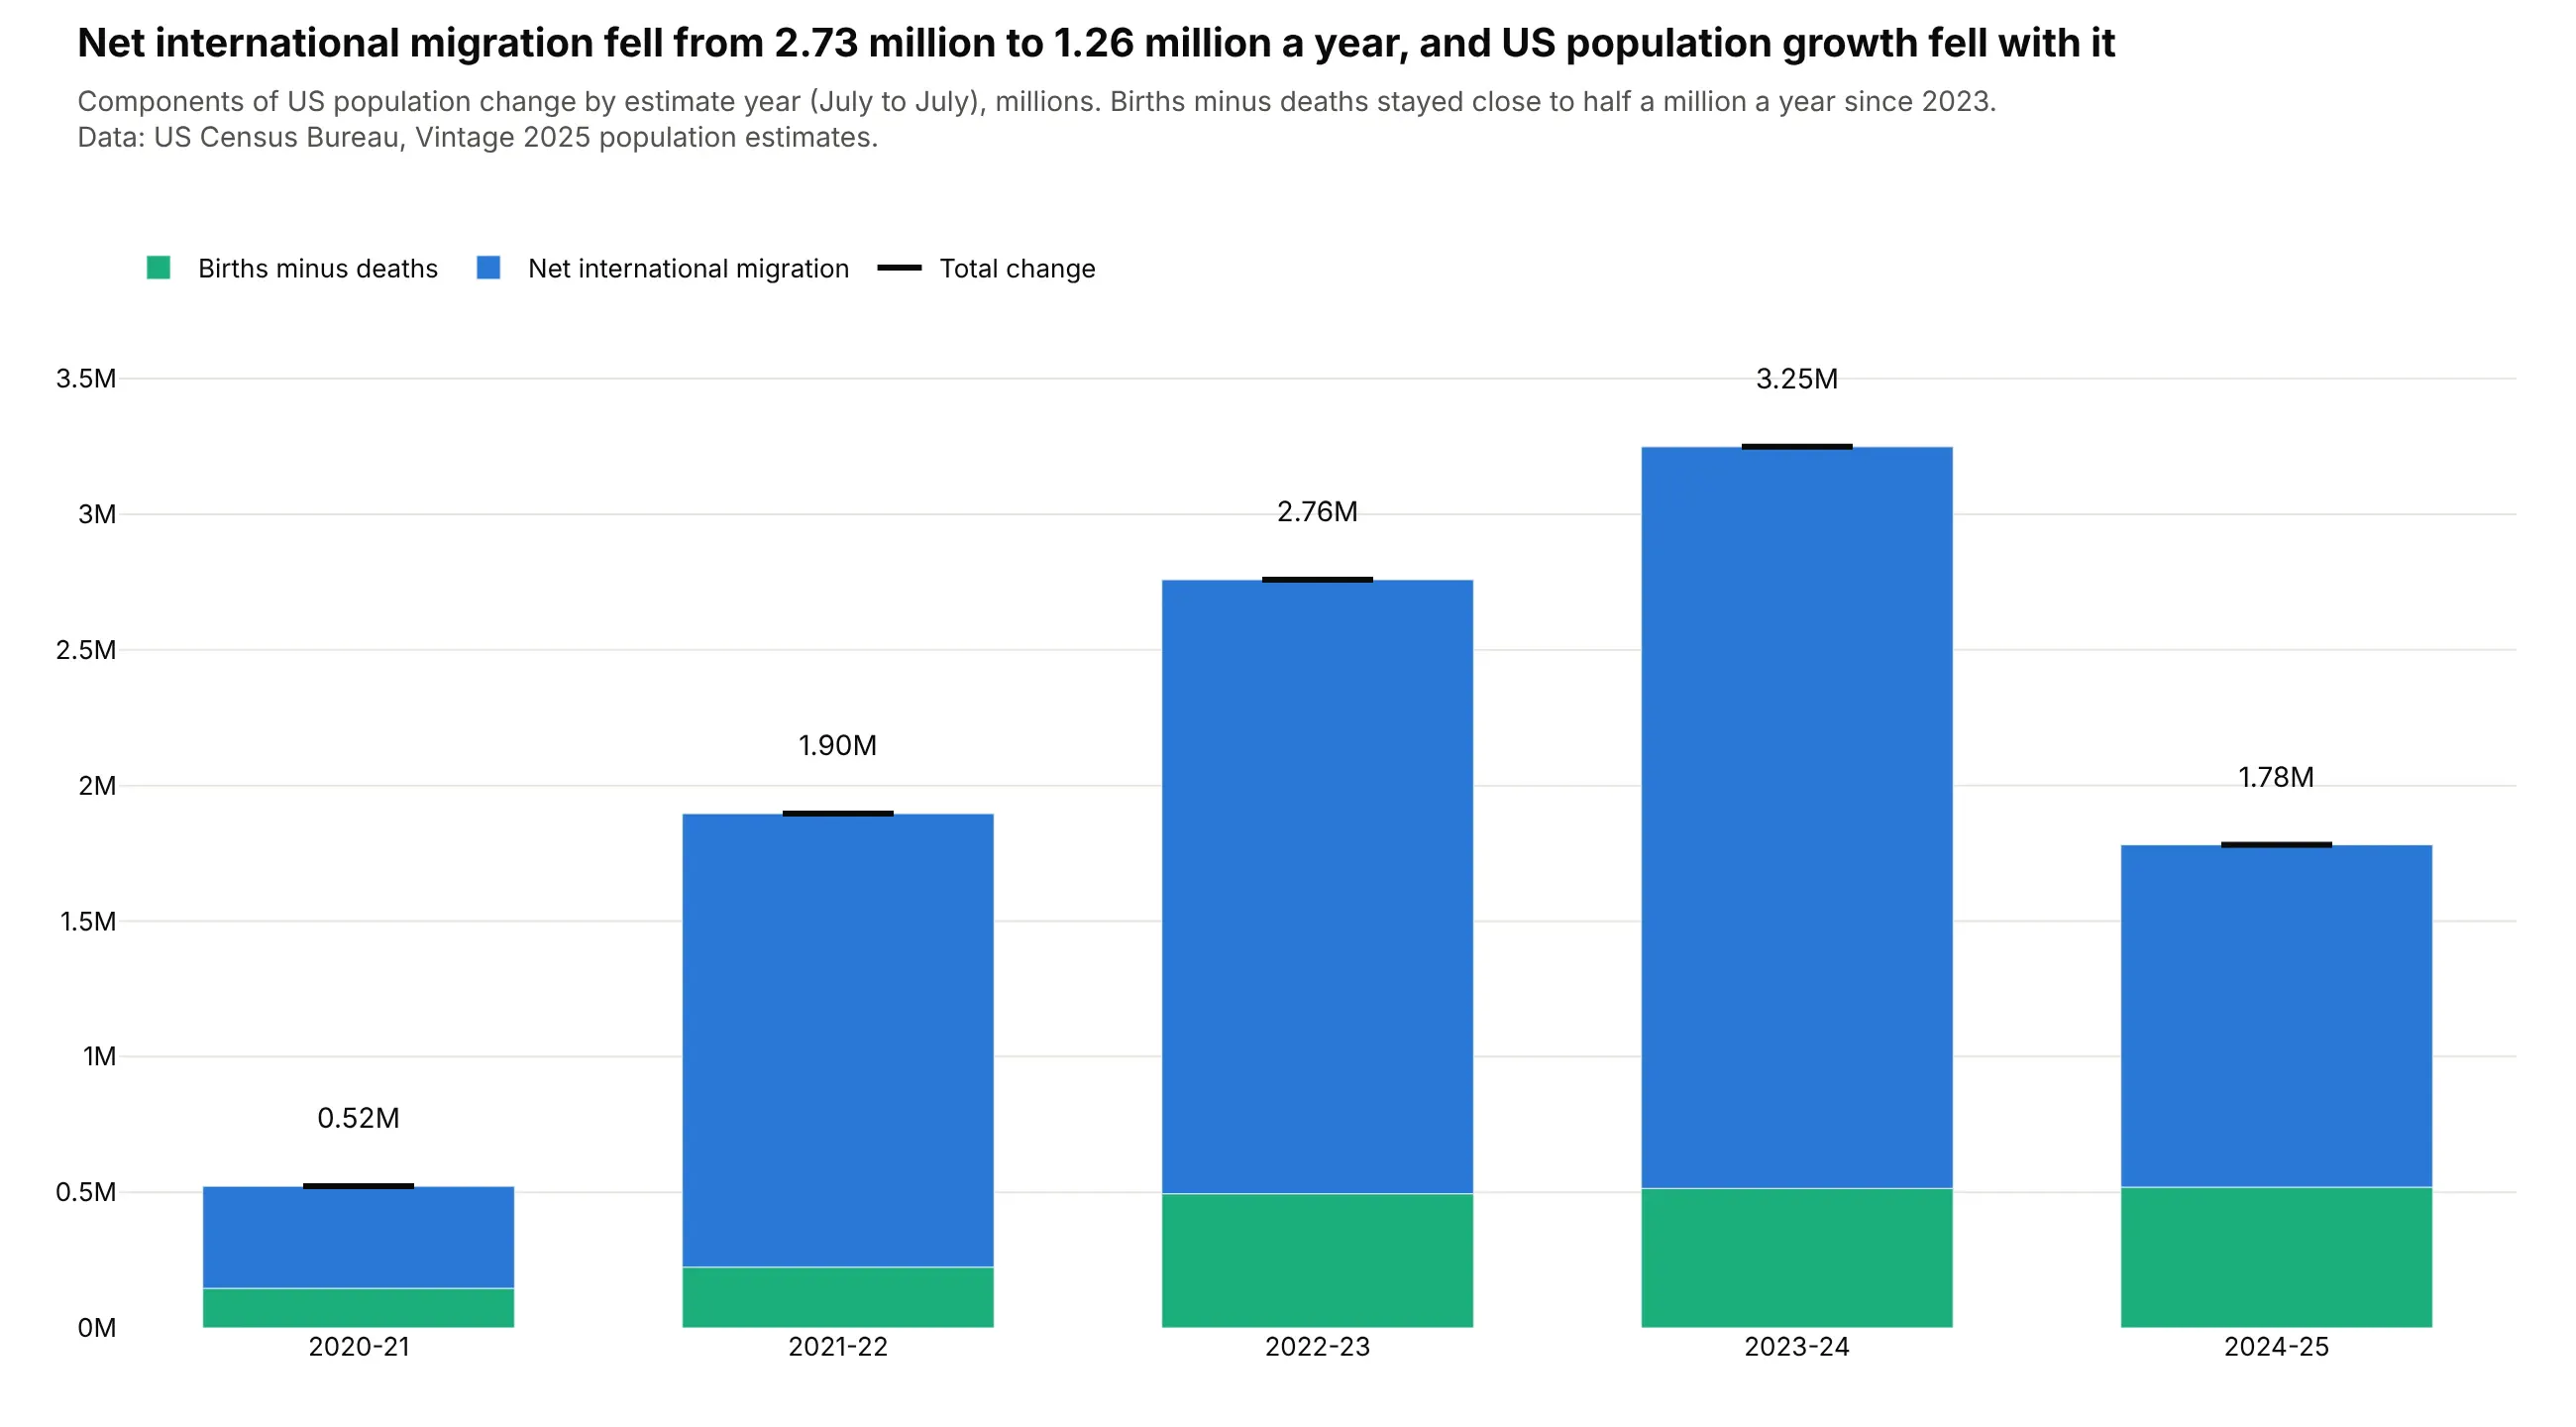
Another way to see it: stacked bars of births minus deaths and migration for 2021-2025 show that migration drove both the rise and the fall in growth.
10. The Dodgers' run differential
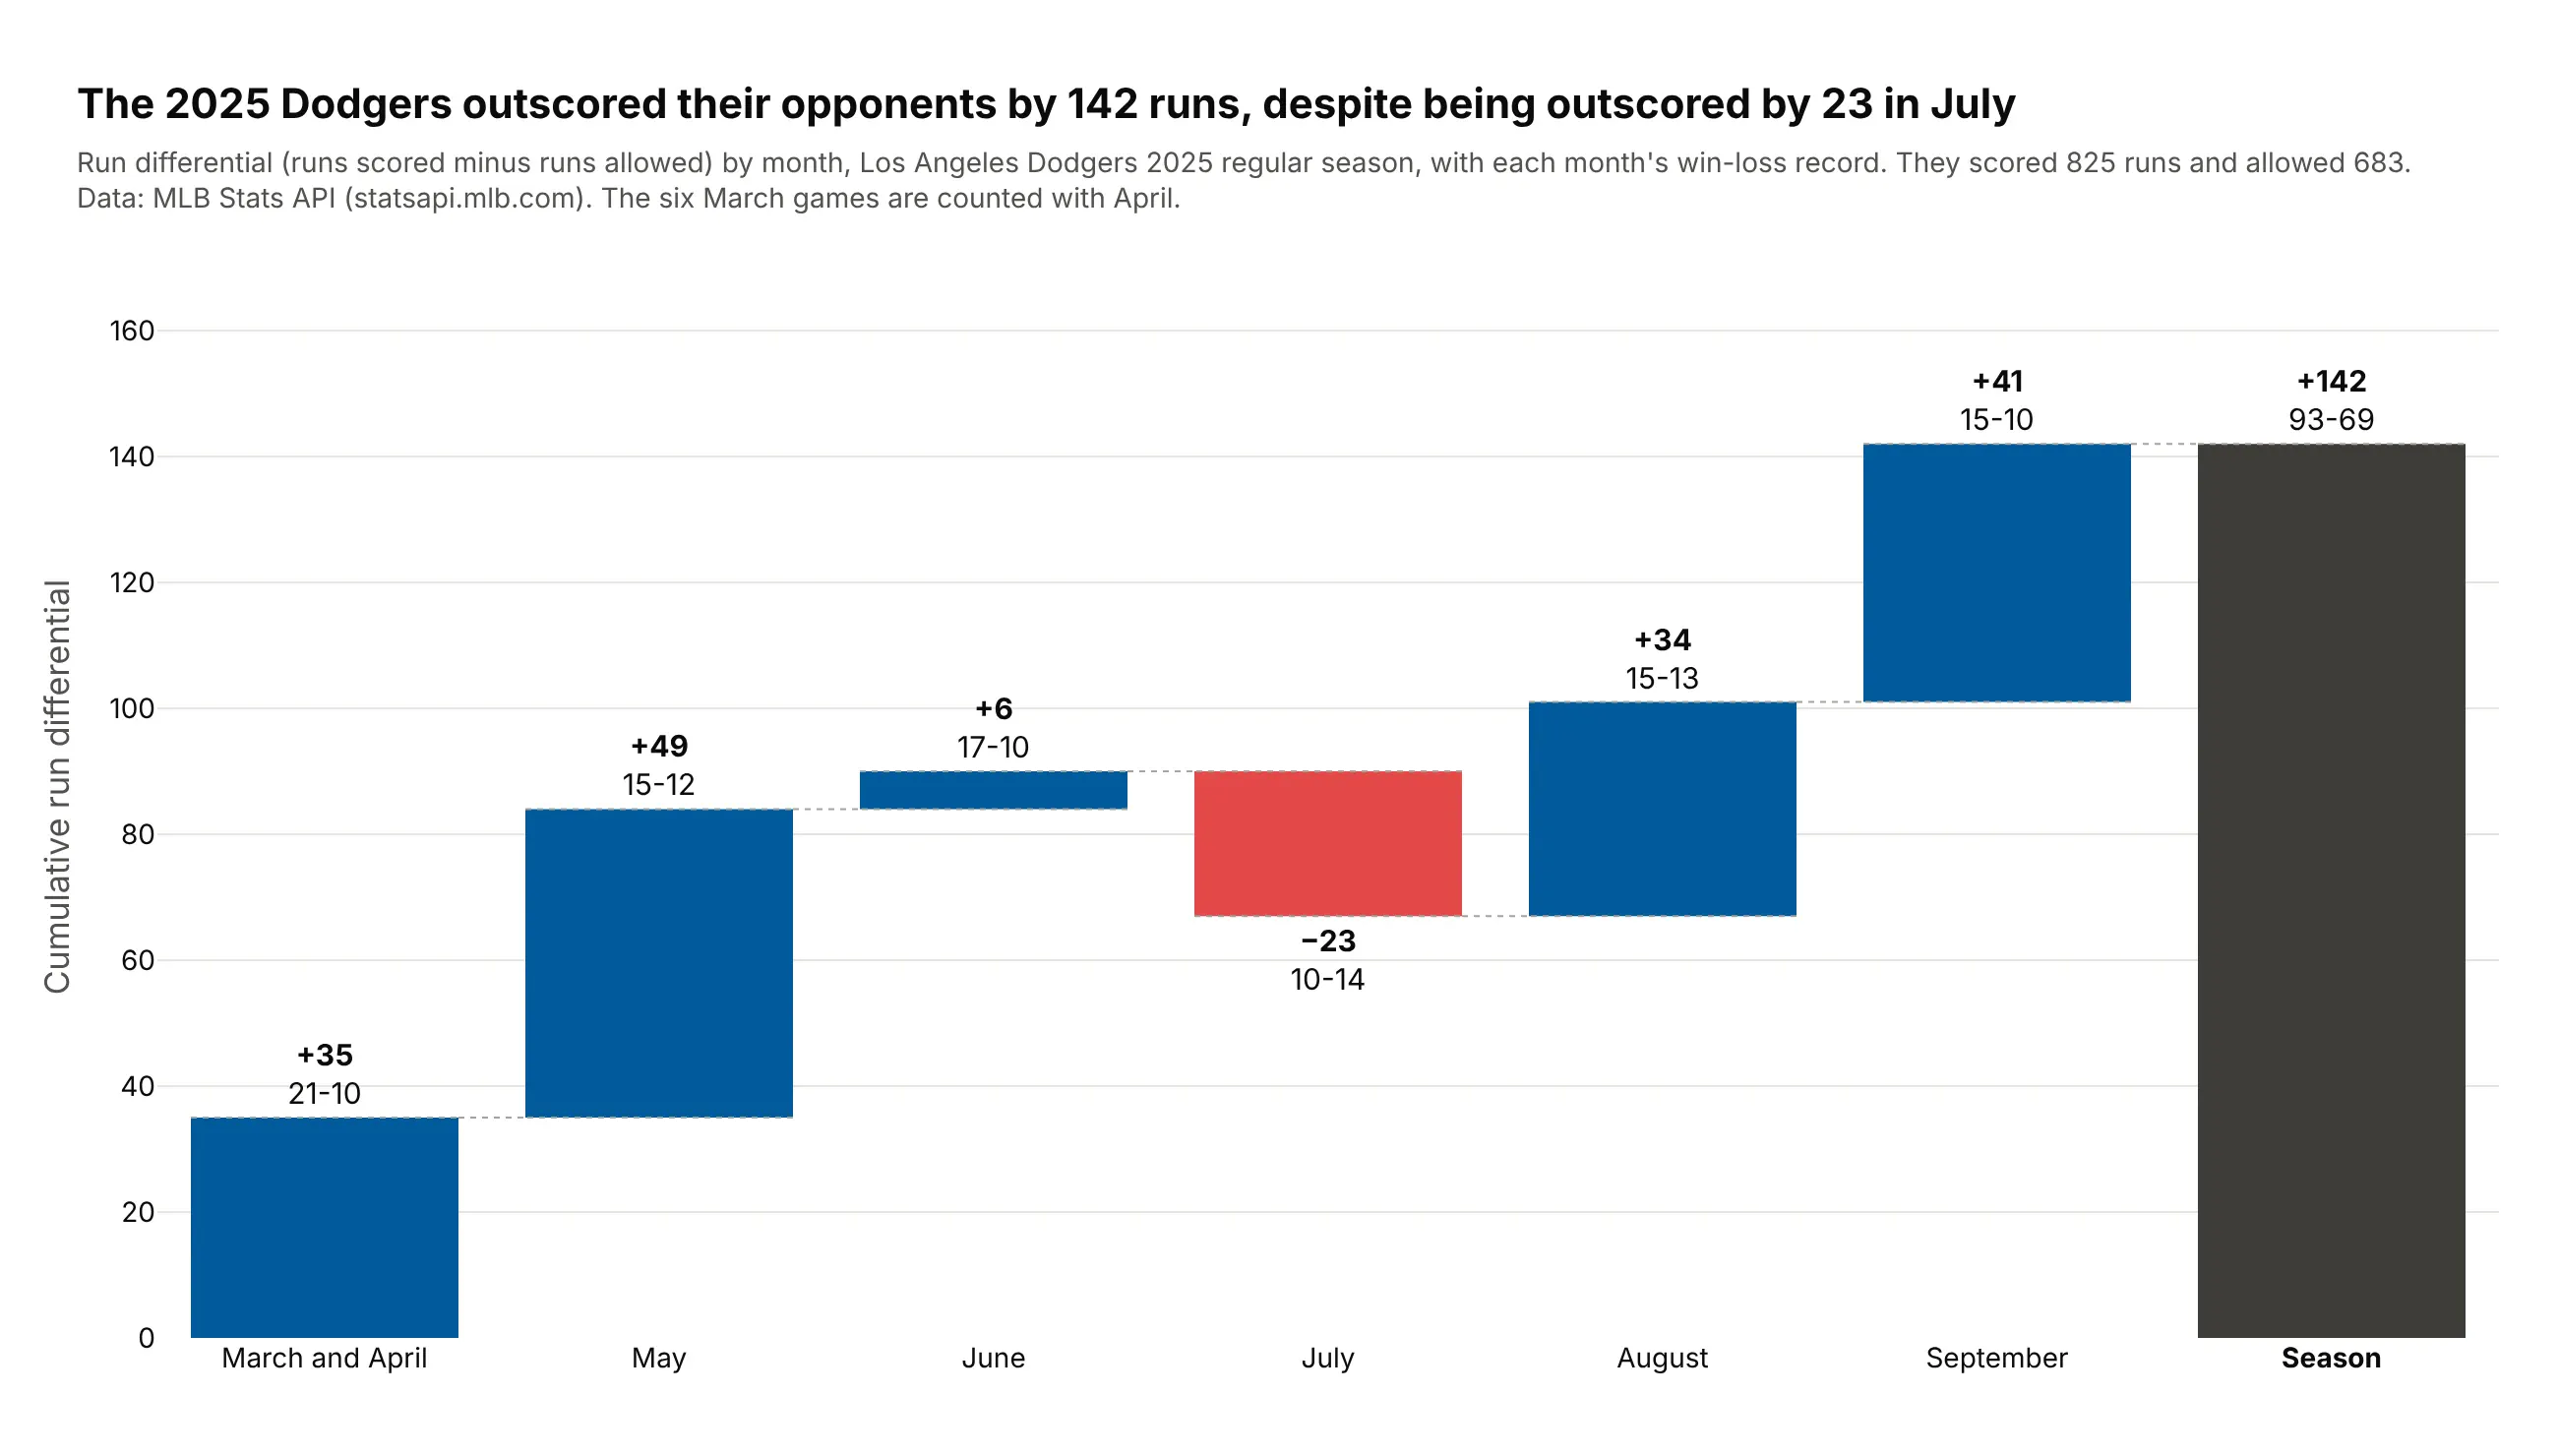
The 2025 Dodgers outscored opponents by 142 runs (825 to 683) and went 93-69. July was the only month they were outscored, by 23 runs. Data: MLB Stats API (statsapi.mlb.com).
Tip: each month's label carries its win-loss record as a second line of text.
Get the data from the MLB Stats API schedule endpoint (statsapi.mlb.com, Los Angeles Dodgers,2025 regular season, final scores) and shape it into a table(columns: month, games, wins, runs_for, runs_against, run_diff).Build a plotly waterfall of monthly run differential with a season total, each label showing thedifferential and the month's record. Team blue for increases, red for decreases.
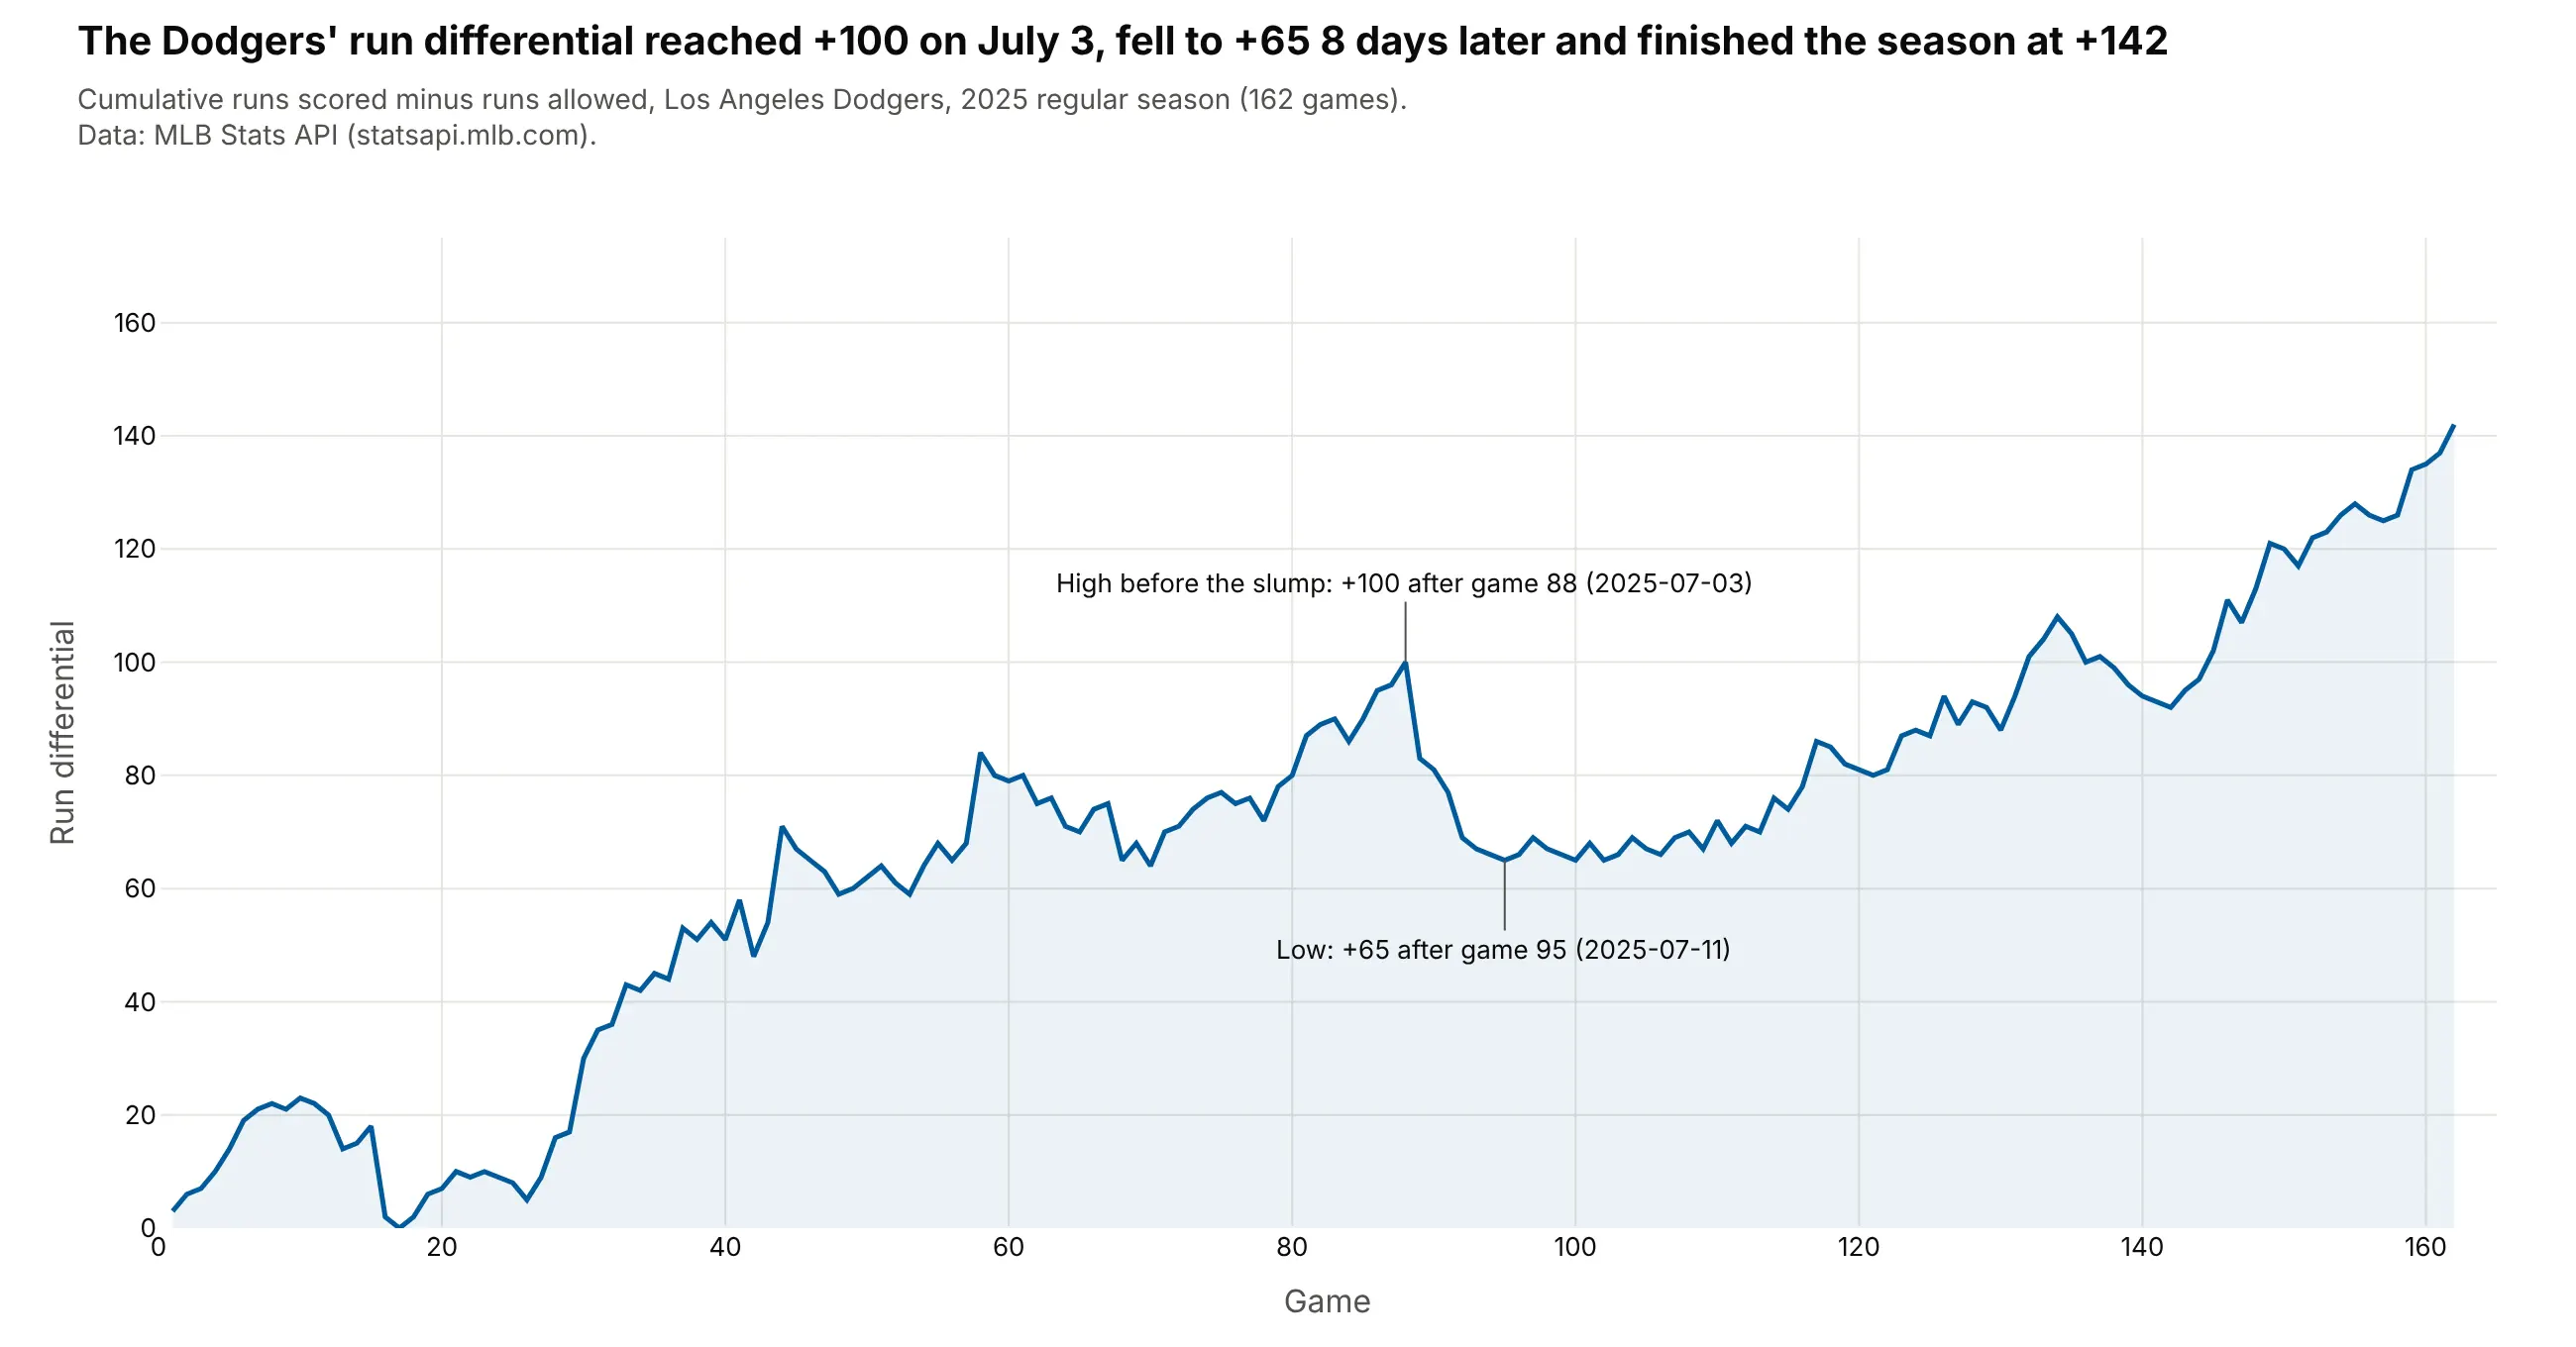
Another way to see it: a game-by-game line shows that the differential peaked at +100 on July 3 and fell to +65 eight days later.