
Chris Parmer
October 27, 2026
Likert Scale Charts - A Complete Guide
TL;DR
- A Likert chart is a diverging stacked bar chart: for each question or group, the negative answers stack to the left of zero, the positive answers to the right, and the neutral answer is split across zero or drawn in its own column.
- Likert charts are also known as diverging stacked bar charts, and are similar to stacked bar charts and population pyramids.
- Use one for any survey answered on an ordered scale (agree to disagree, always to never, 0 to 10) when you want to compare items or groups. Sort the rows by net agreement.
- You can make a Likert chart with Plotly from go.Bar traces with barmode="relative" and the negative answers as negative numbers, and the examples below all use that pattern.
- For a scale with no negative end (how often, how much), use a plain stacked bar from zero instead.
What is a Likert chart?
Likert scale charts look like this:
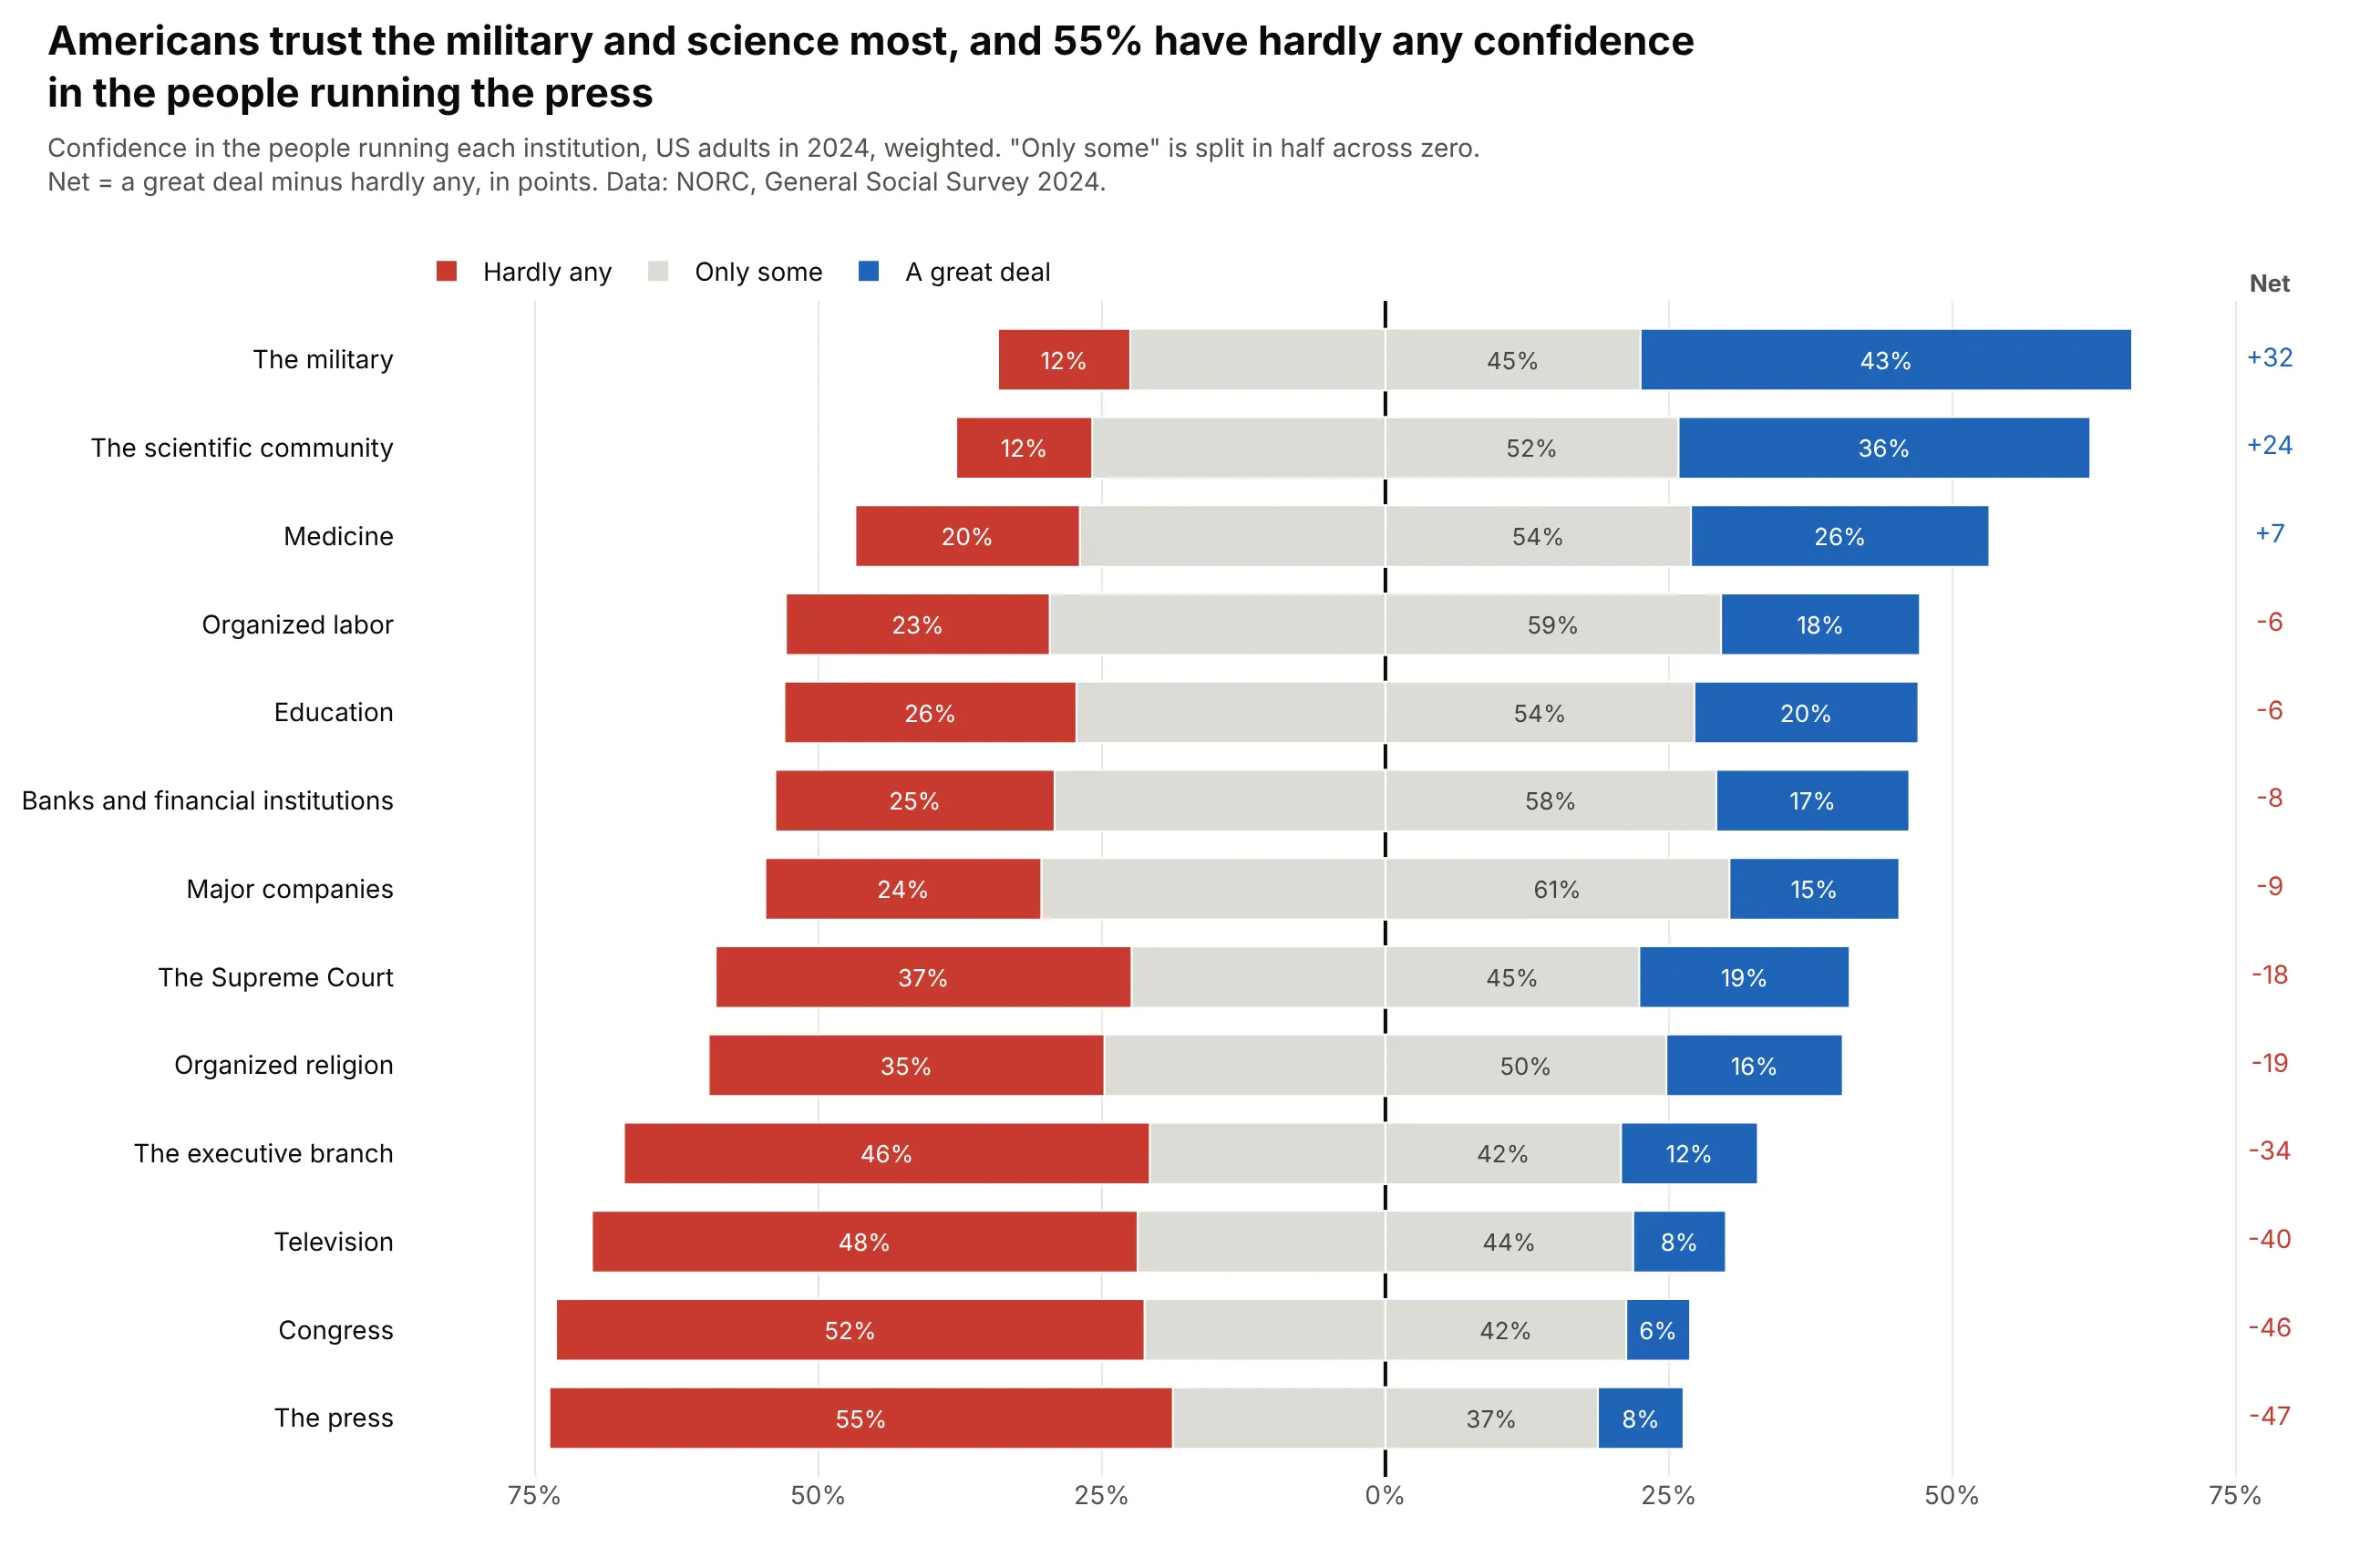
Data: NORC, General Social Survey 2024, weighted.
How do you read a Likert scale chart? In the example above, notice these things:
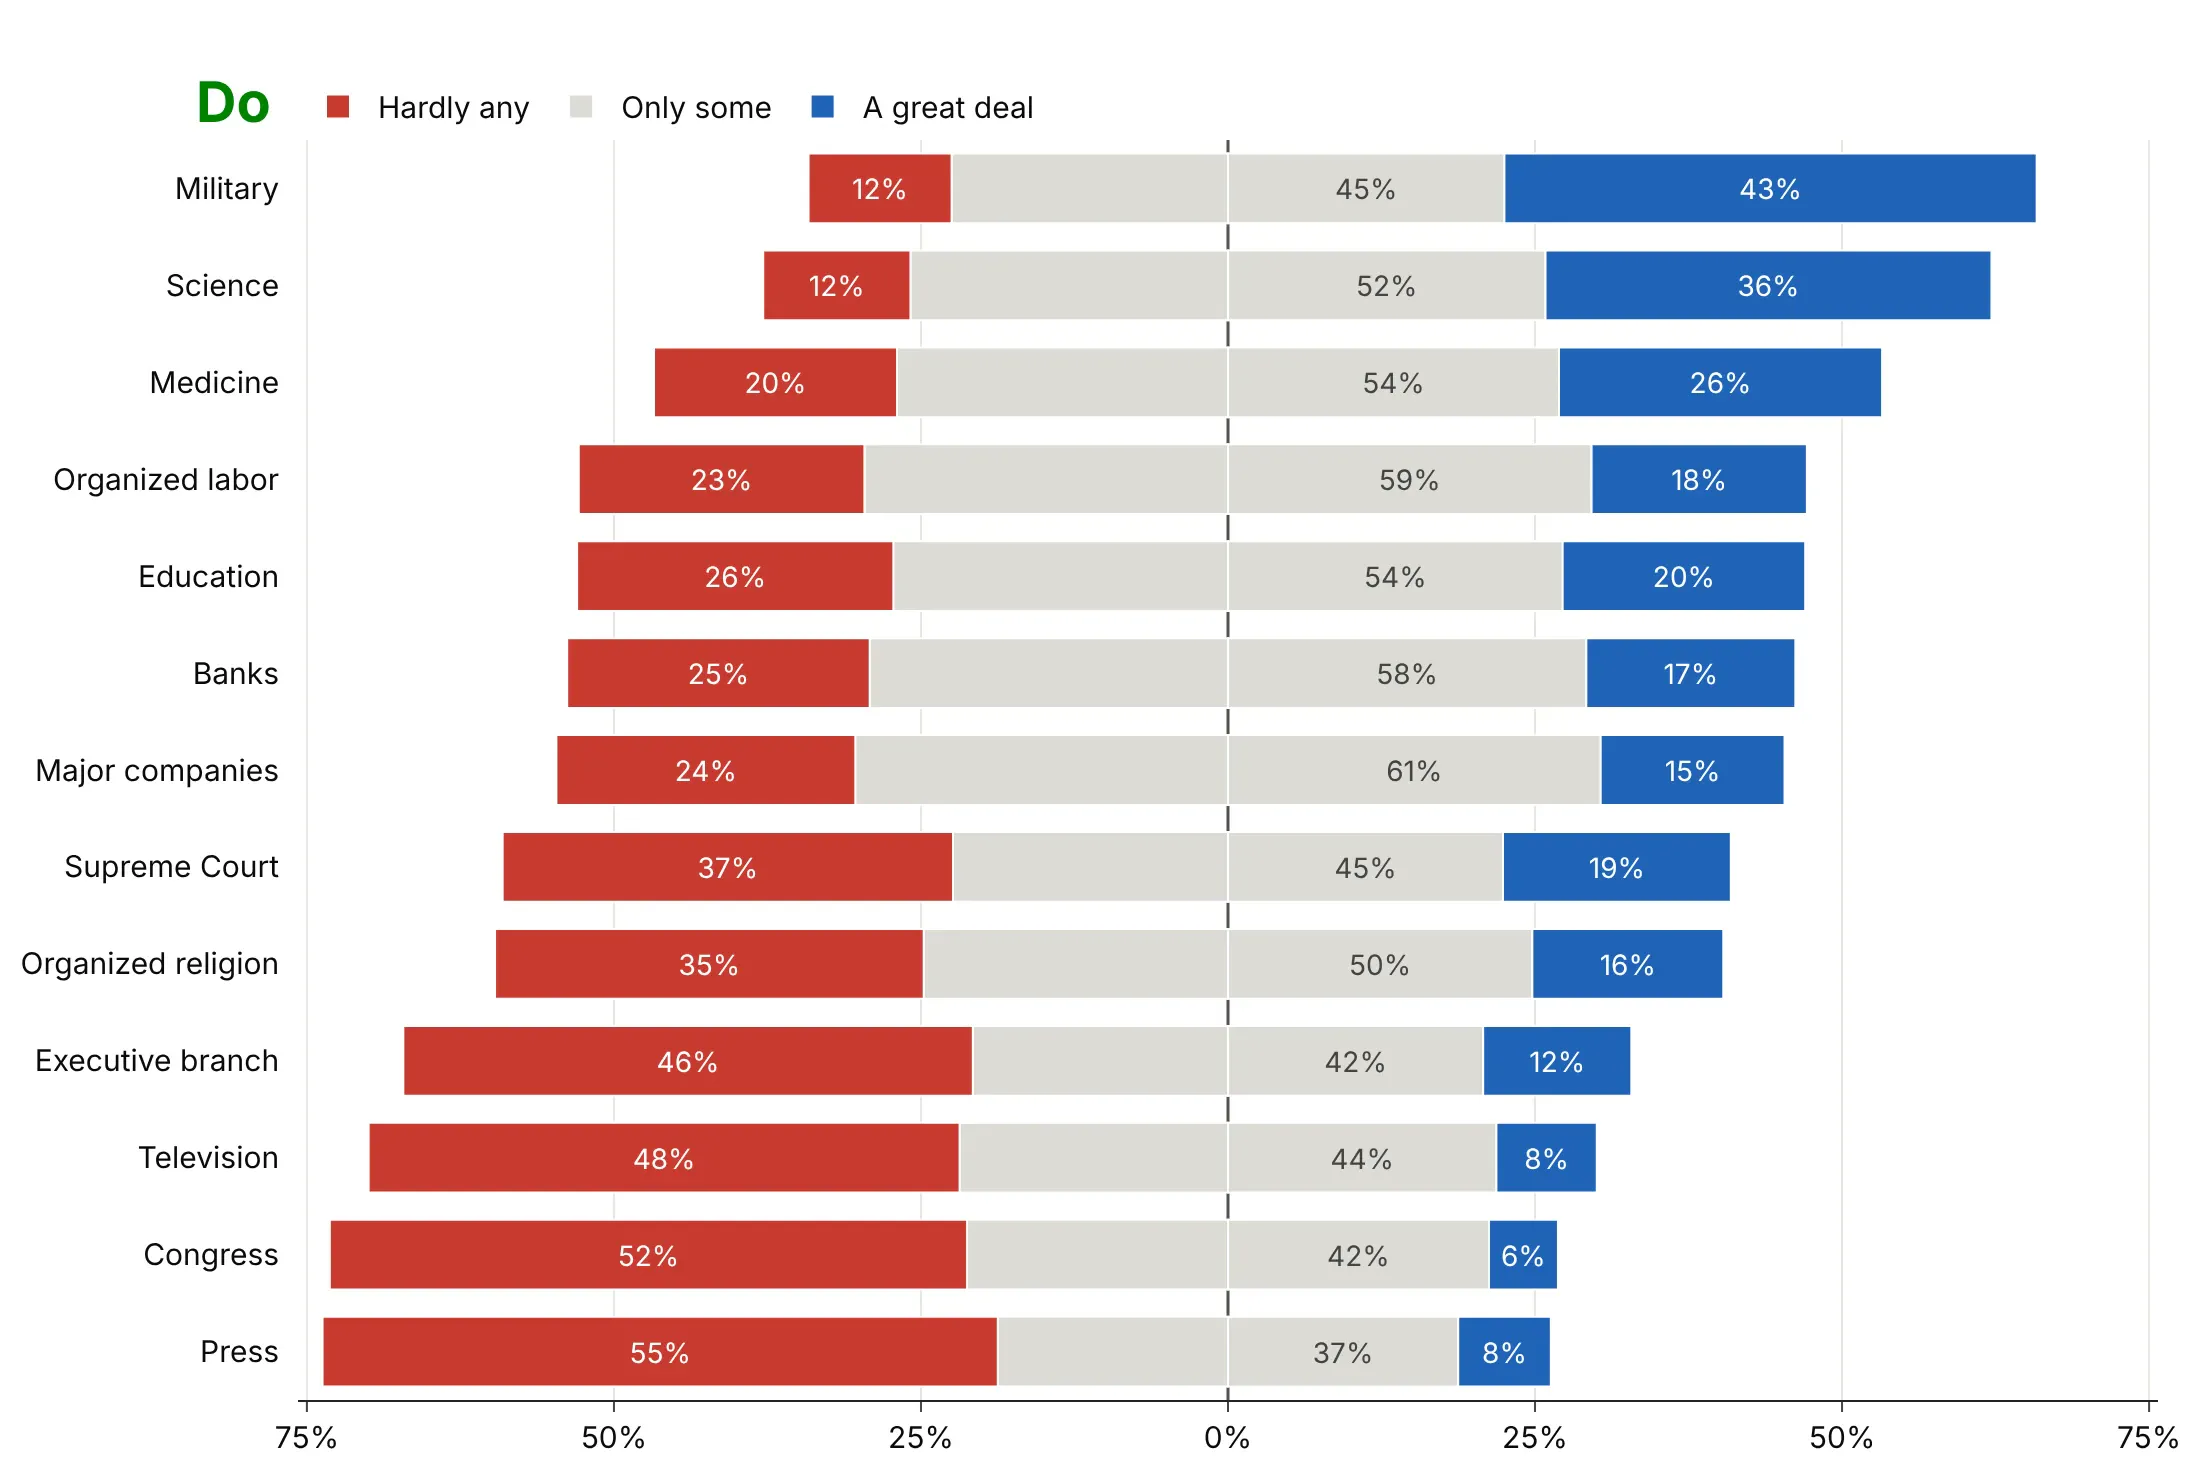
- Each row is one institution, and its bar adds up to everyone who answered the 2024 General Social Survey question about the people running it.
- The three answers stack outward from the center line, with "hardly any" confidence in red to the left and "a great deal" in blue to the right. The longer a red or blue segment, the more people gave that answer, and the military has the longest blue segment.
- The gray middle answer, "only some", is split in half across zero, so every row is centered on the same line and the rows can be compared at a glance.
- The rows are sorted by the net score in the right-hand column, the share with a great deal of confidence minus the share with hardly any. That puts the military and the scientific community at the top and Congress and the press, at -47, at the bottom.
- Don't read the length of a bar to the right of zero as the share of people who are positive, because half of the gray sits on that side too. For most institutions "only some" is the most common answer, so look at the red and blue ends or the net score to see where opinion leans.
It's often used for charts like these:
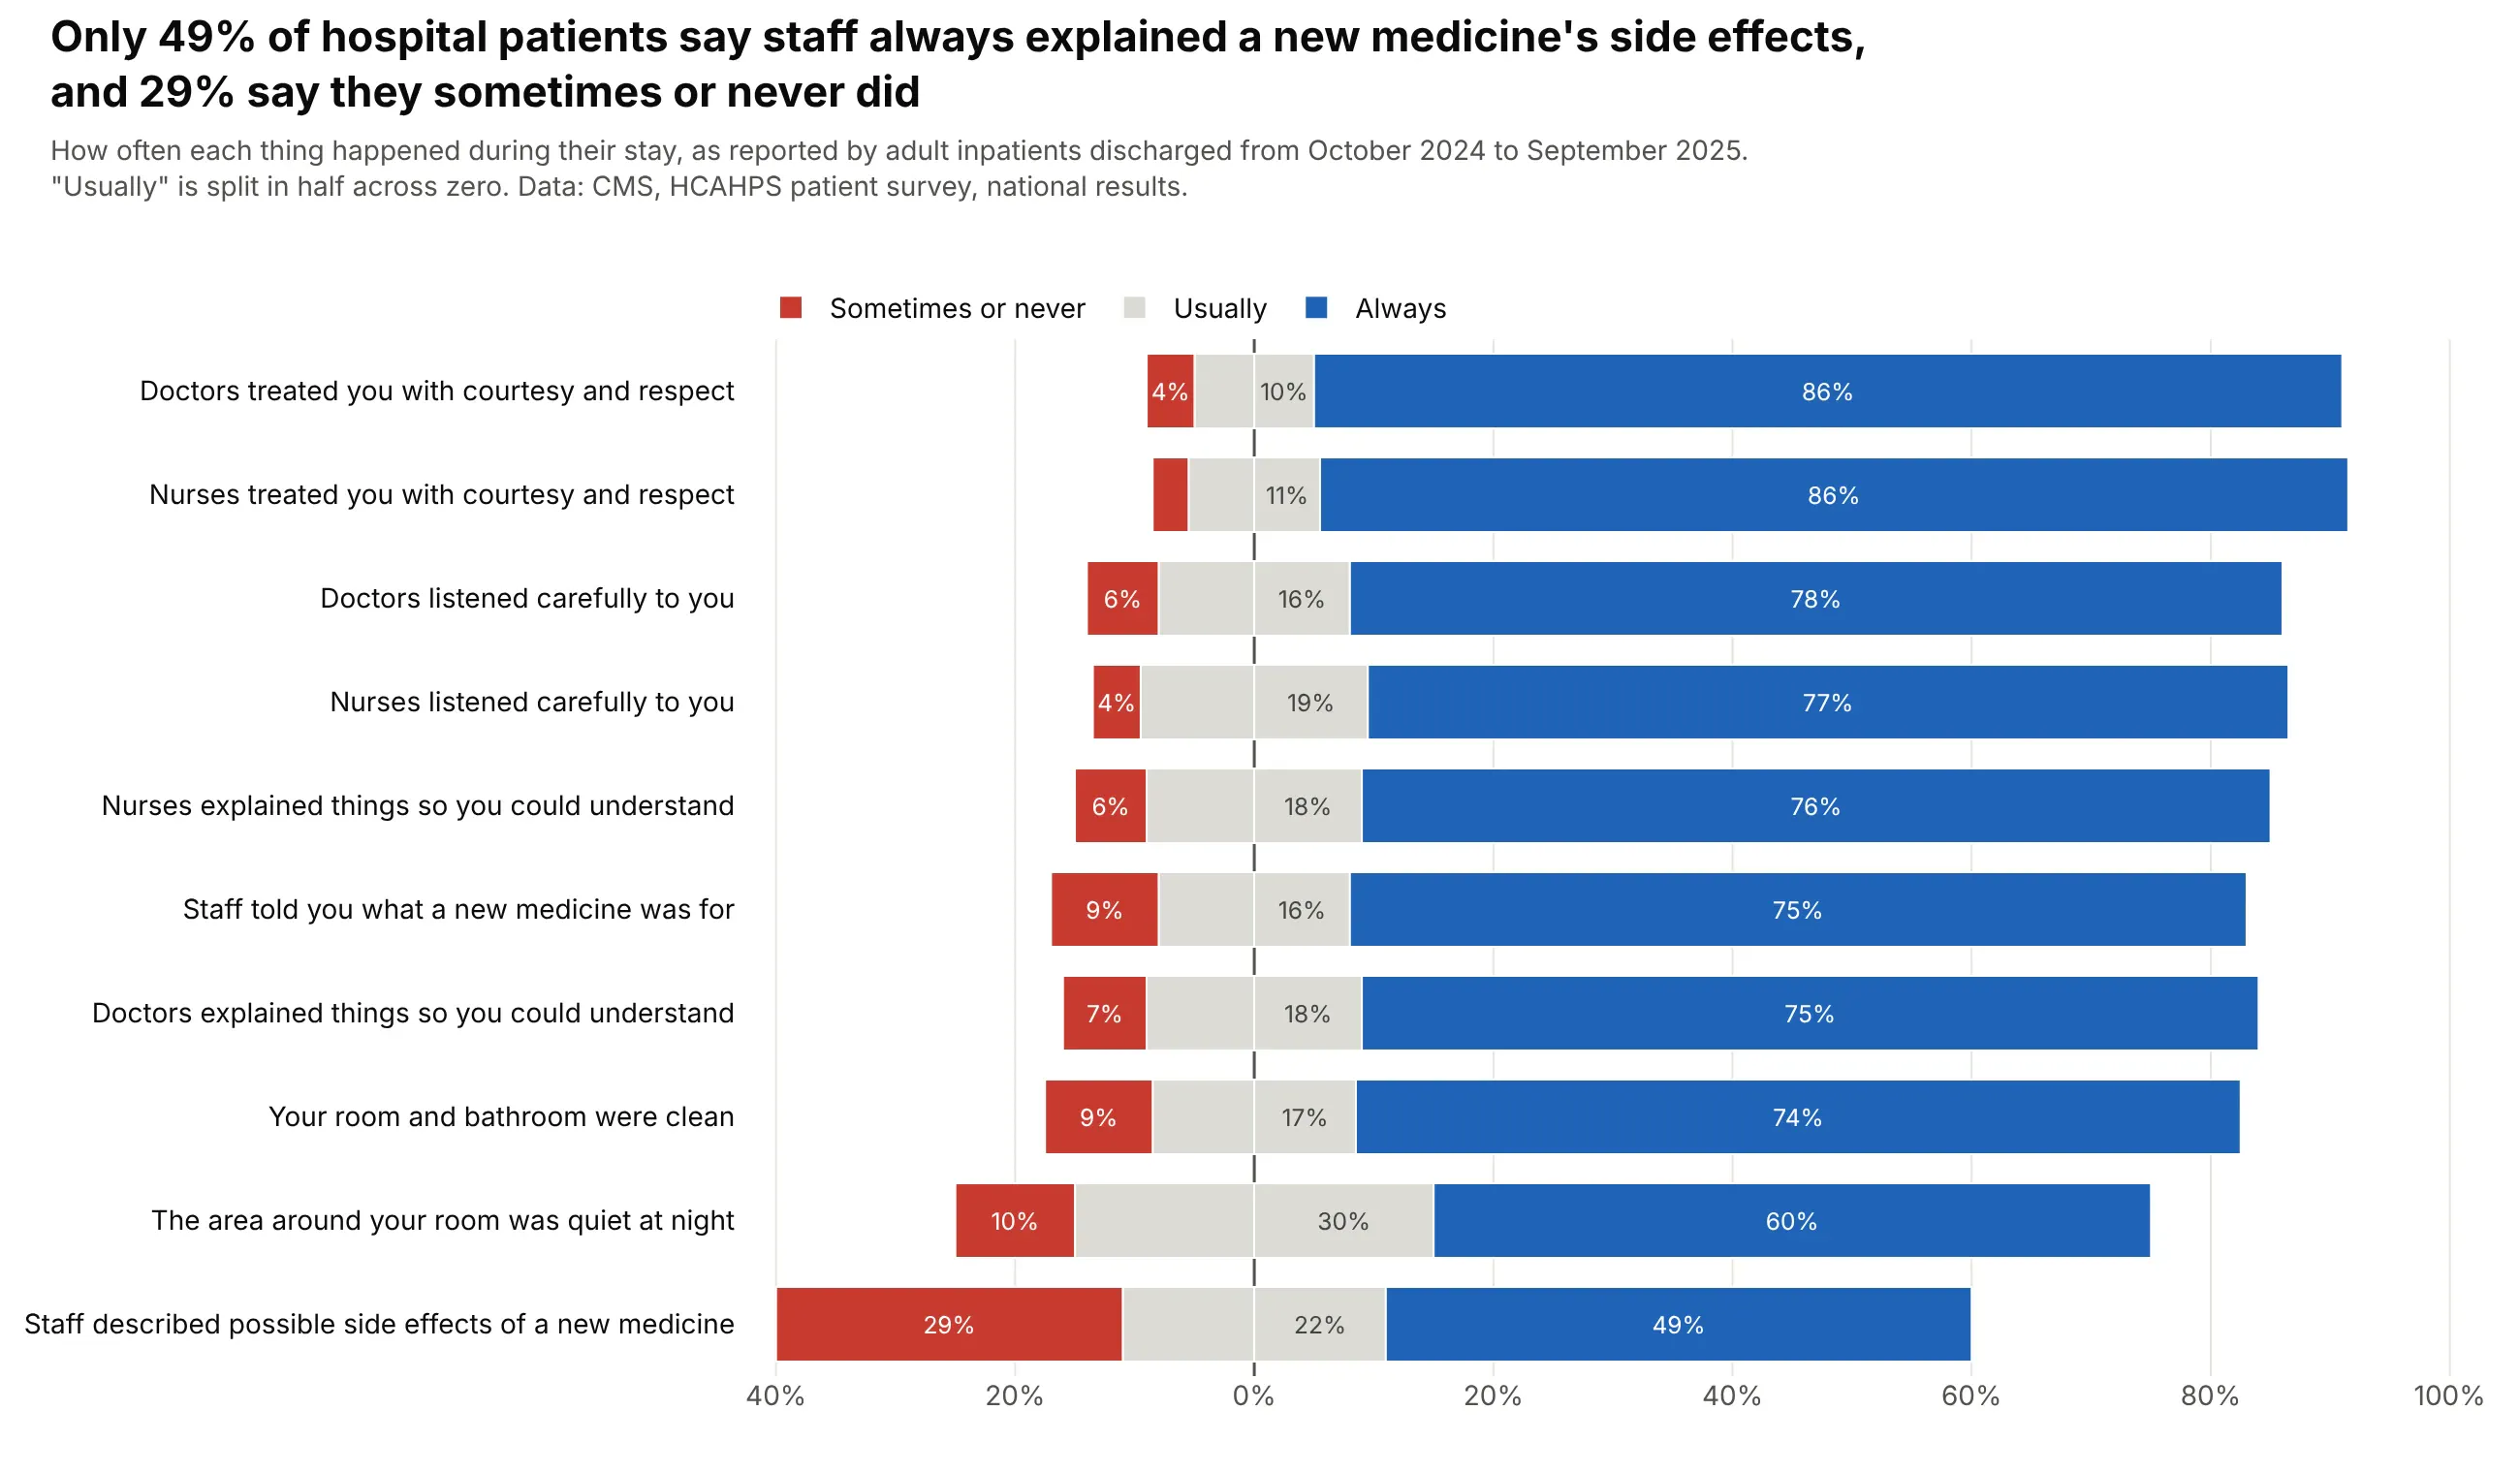
A battery of questions on one scale. Only 49% of US hospital patients said staff always explained a new medicine's side effects, and 29% said they sometimes or never did. Data: CMS, HCAHPS patient survey, national results, discharges from October 2024 to September 2025.
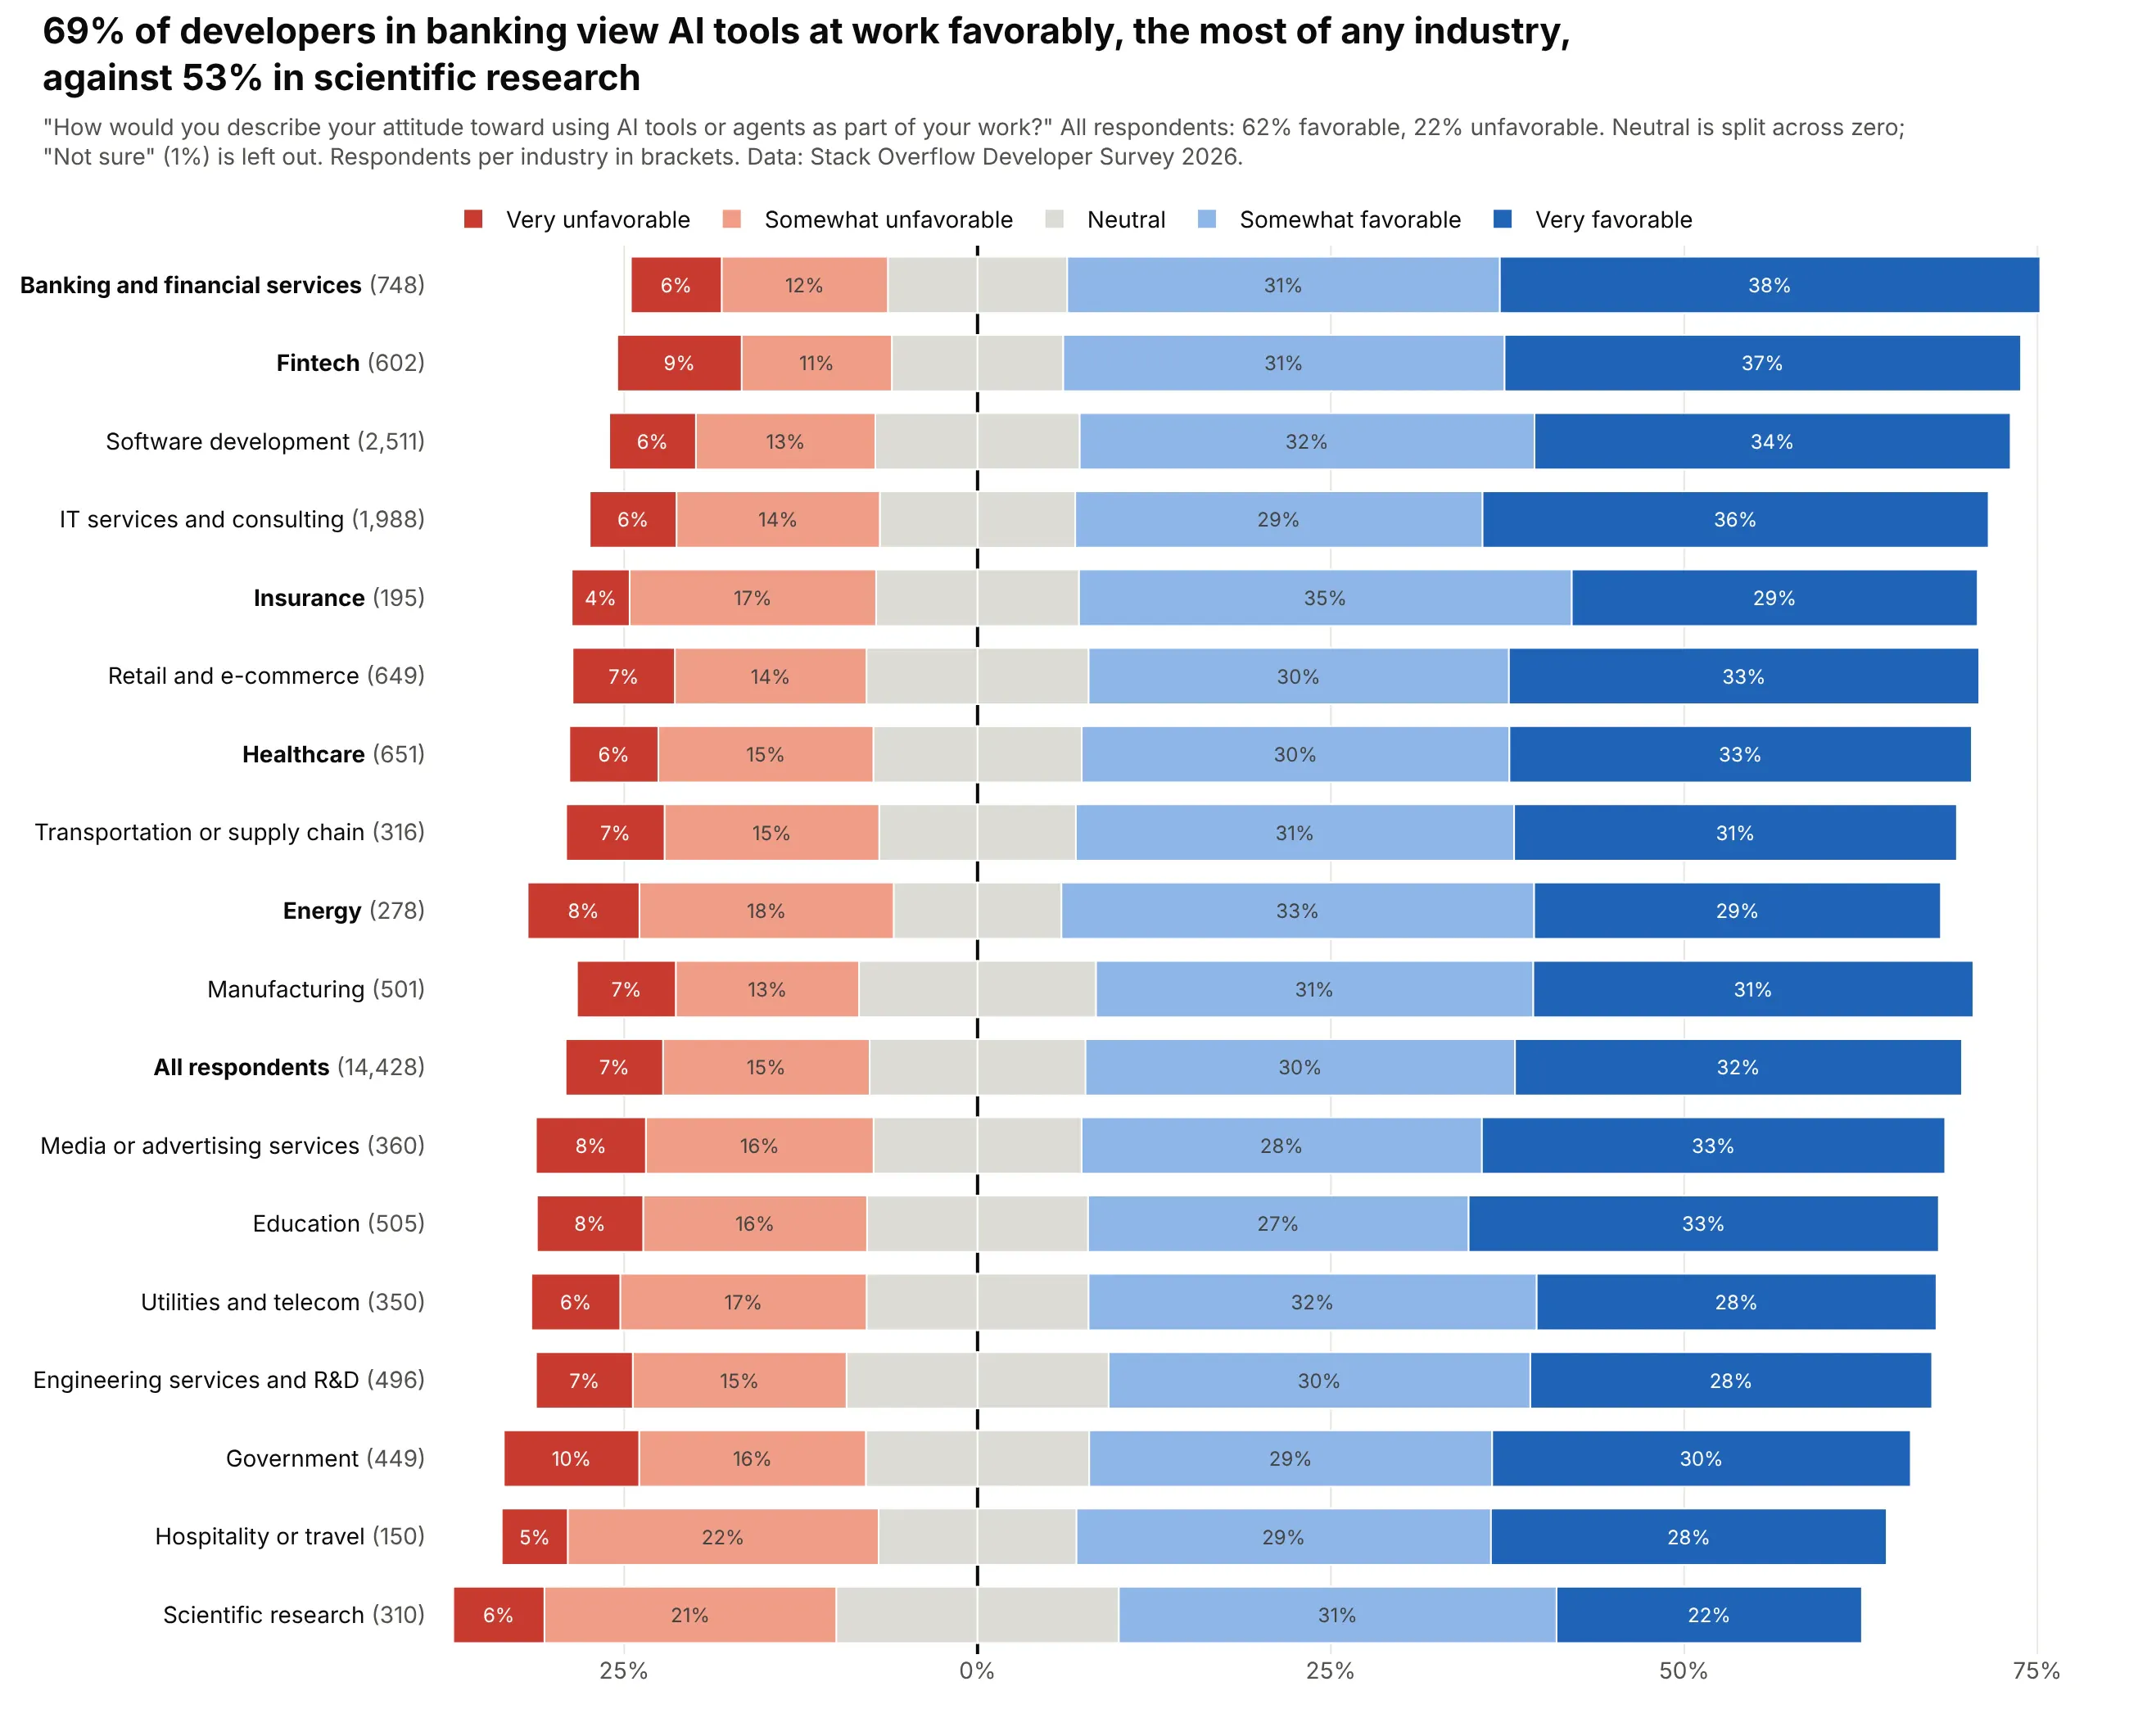
One question, compared across groups. 69% of developers in banking view AI tools at work favorably, against 53% in scientific research. Data: Stack Overflow Developer Survey 2026.
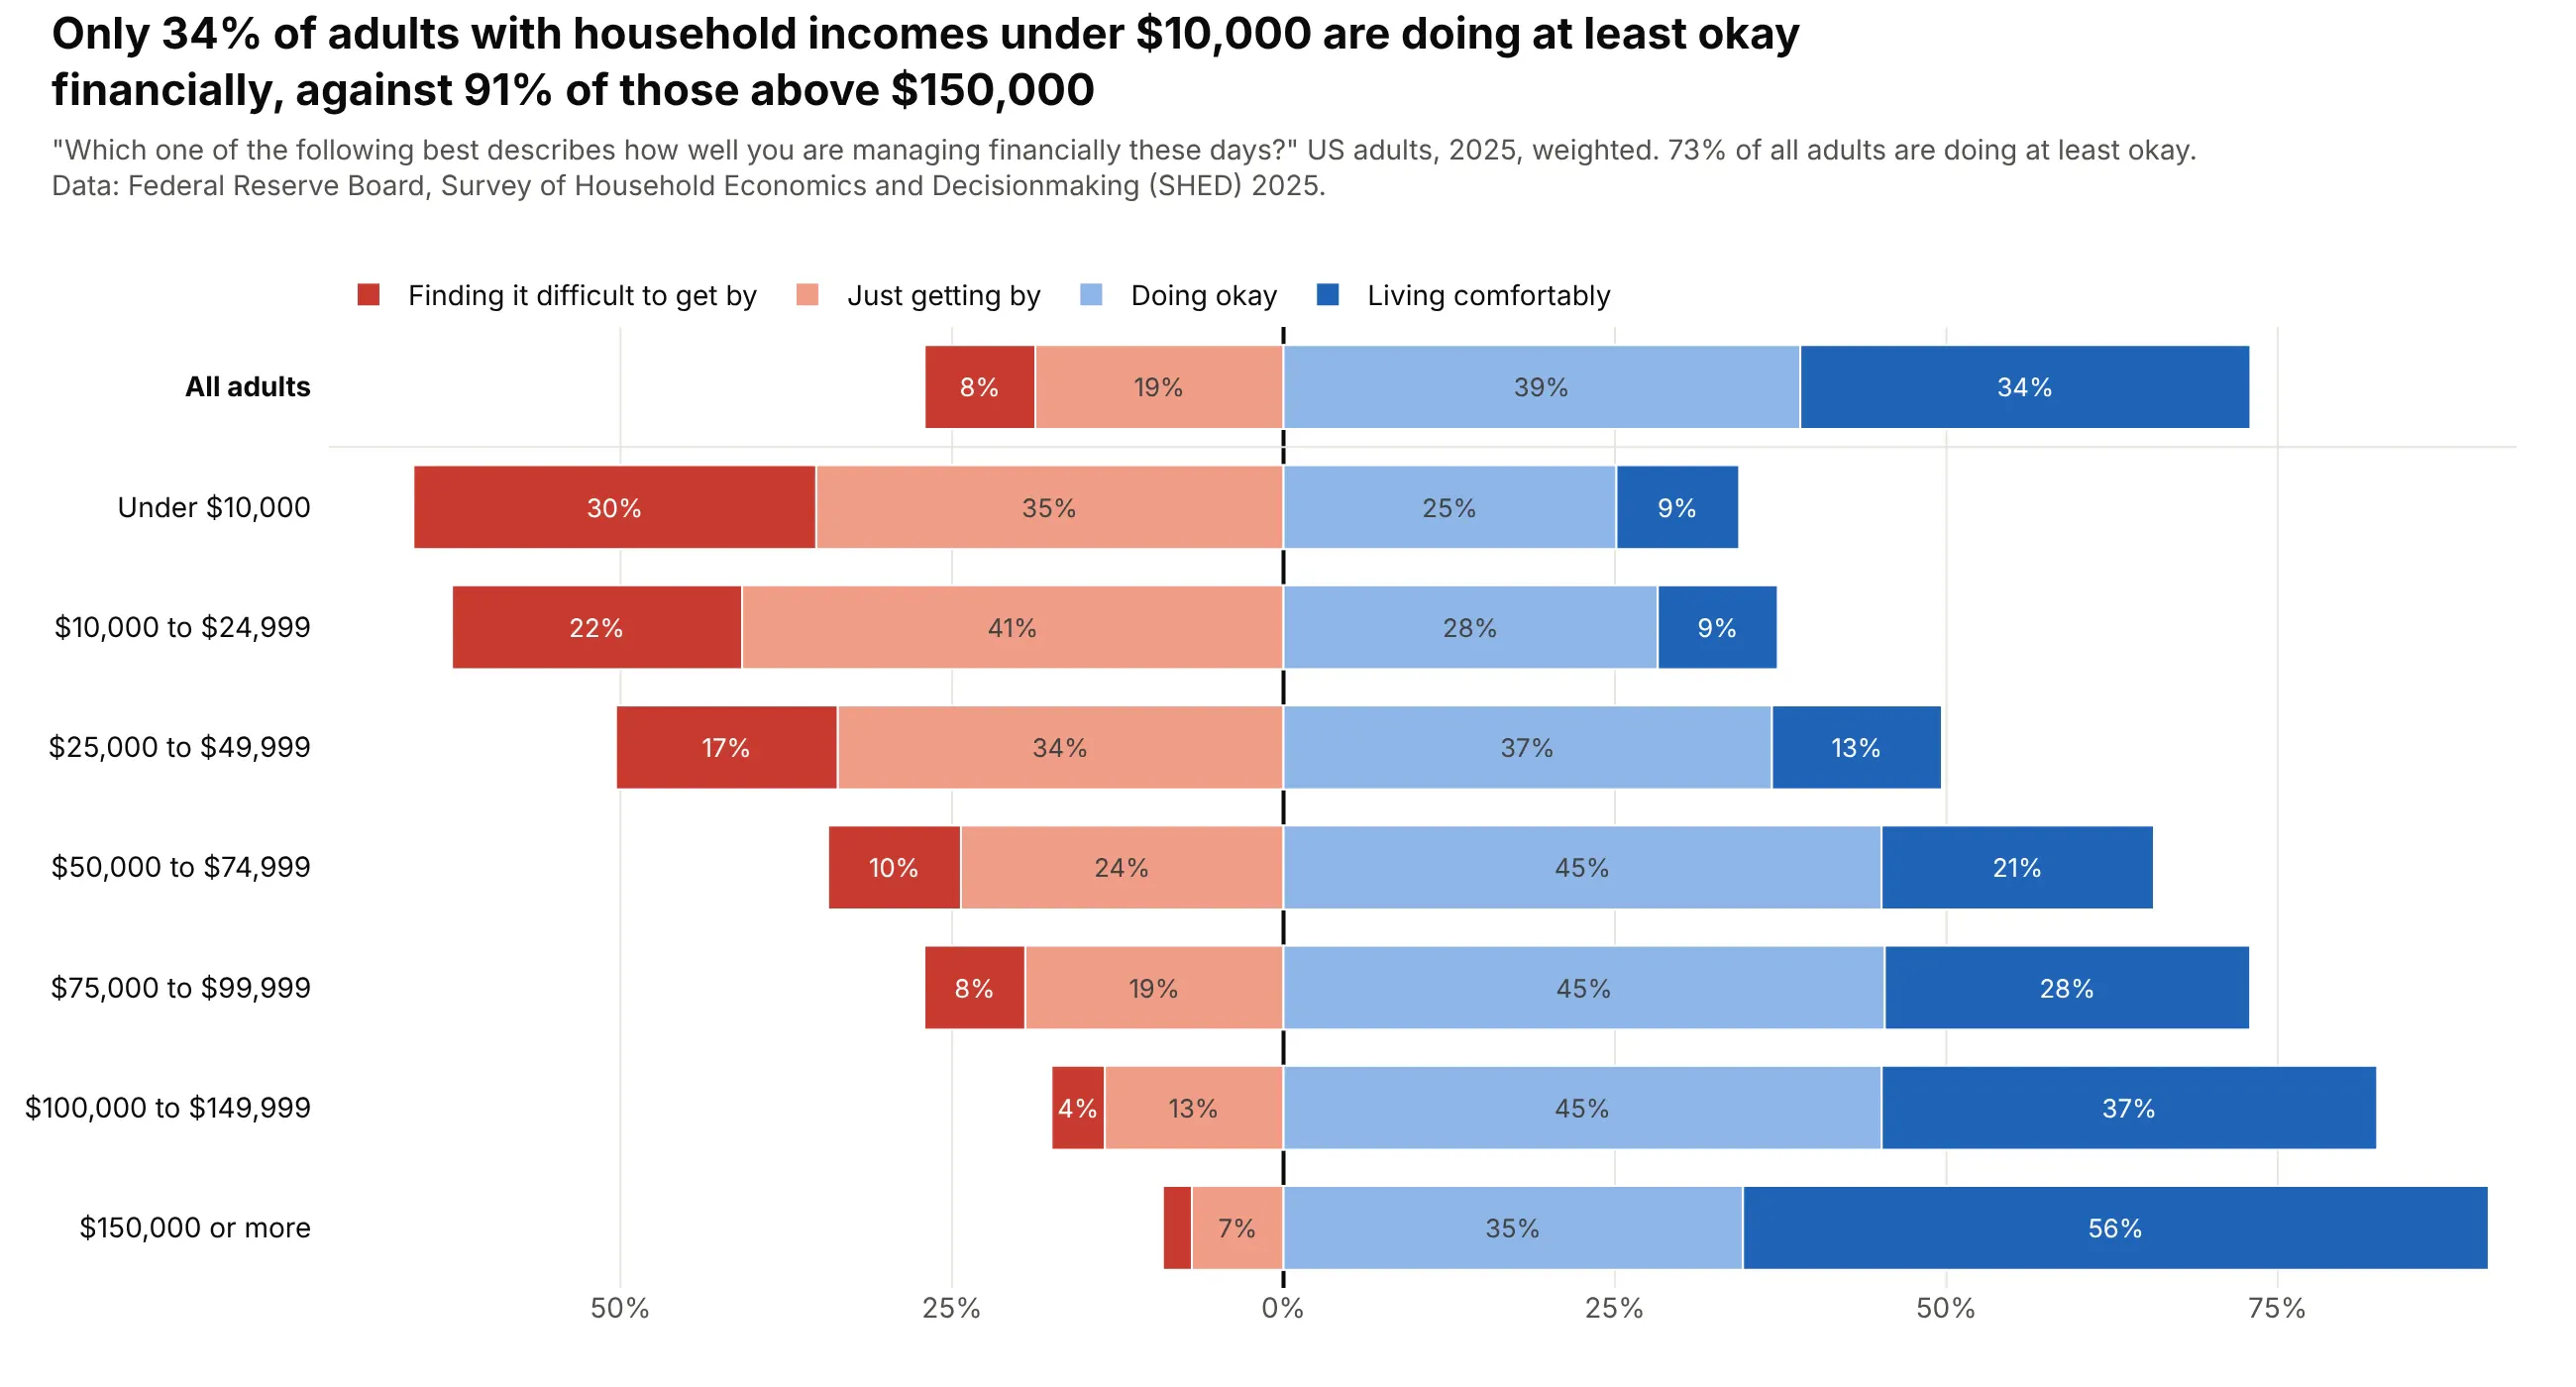
An even scale with no neutral answer. 34% of adults with household incomes under $10,000 say they are doing at least okay financially, against 91% above $150,000. Data: Federal Reserve Board, Survey of Household Economics and Decisionmaking (SHED) 2025.
A short history
Rensis Likert introduced the agree-to-disagree rating scale in 1932, in "A Technique for the Measurement of Attitudes" (Archives of Psychology, no. 140). In 2011 Naomi Robbins and Richard Heiberger made the case for centering the bars instead ("Plotting Likert and Other Rating Scales", JSM Proceedings, Section on Survey Research Methods, pp. 1058-1066), and they followed it with a fuller treatment of diverging stacked bar charts in the Journal of Statistical Software (2014).
Alternatives to a Likert chart
Here's the same confidence data drawn six ways. Some are better for the question, some worse, some just different:
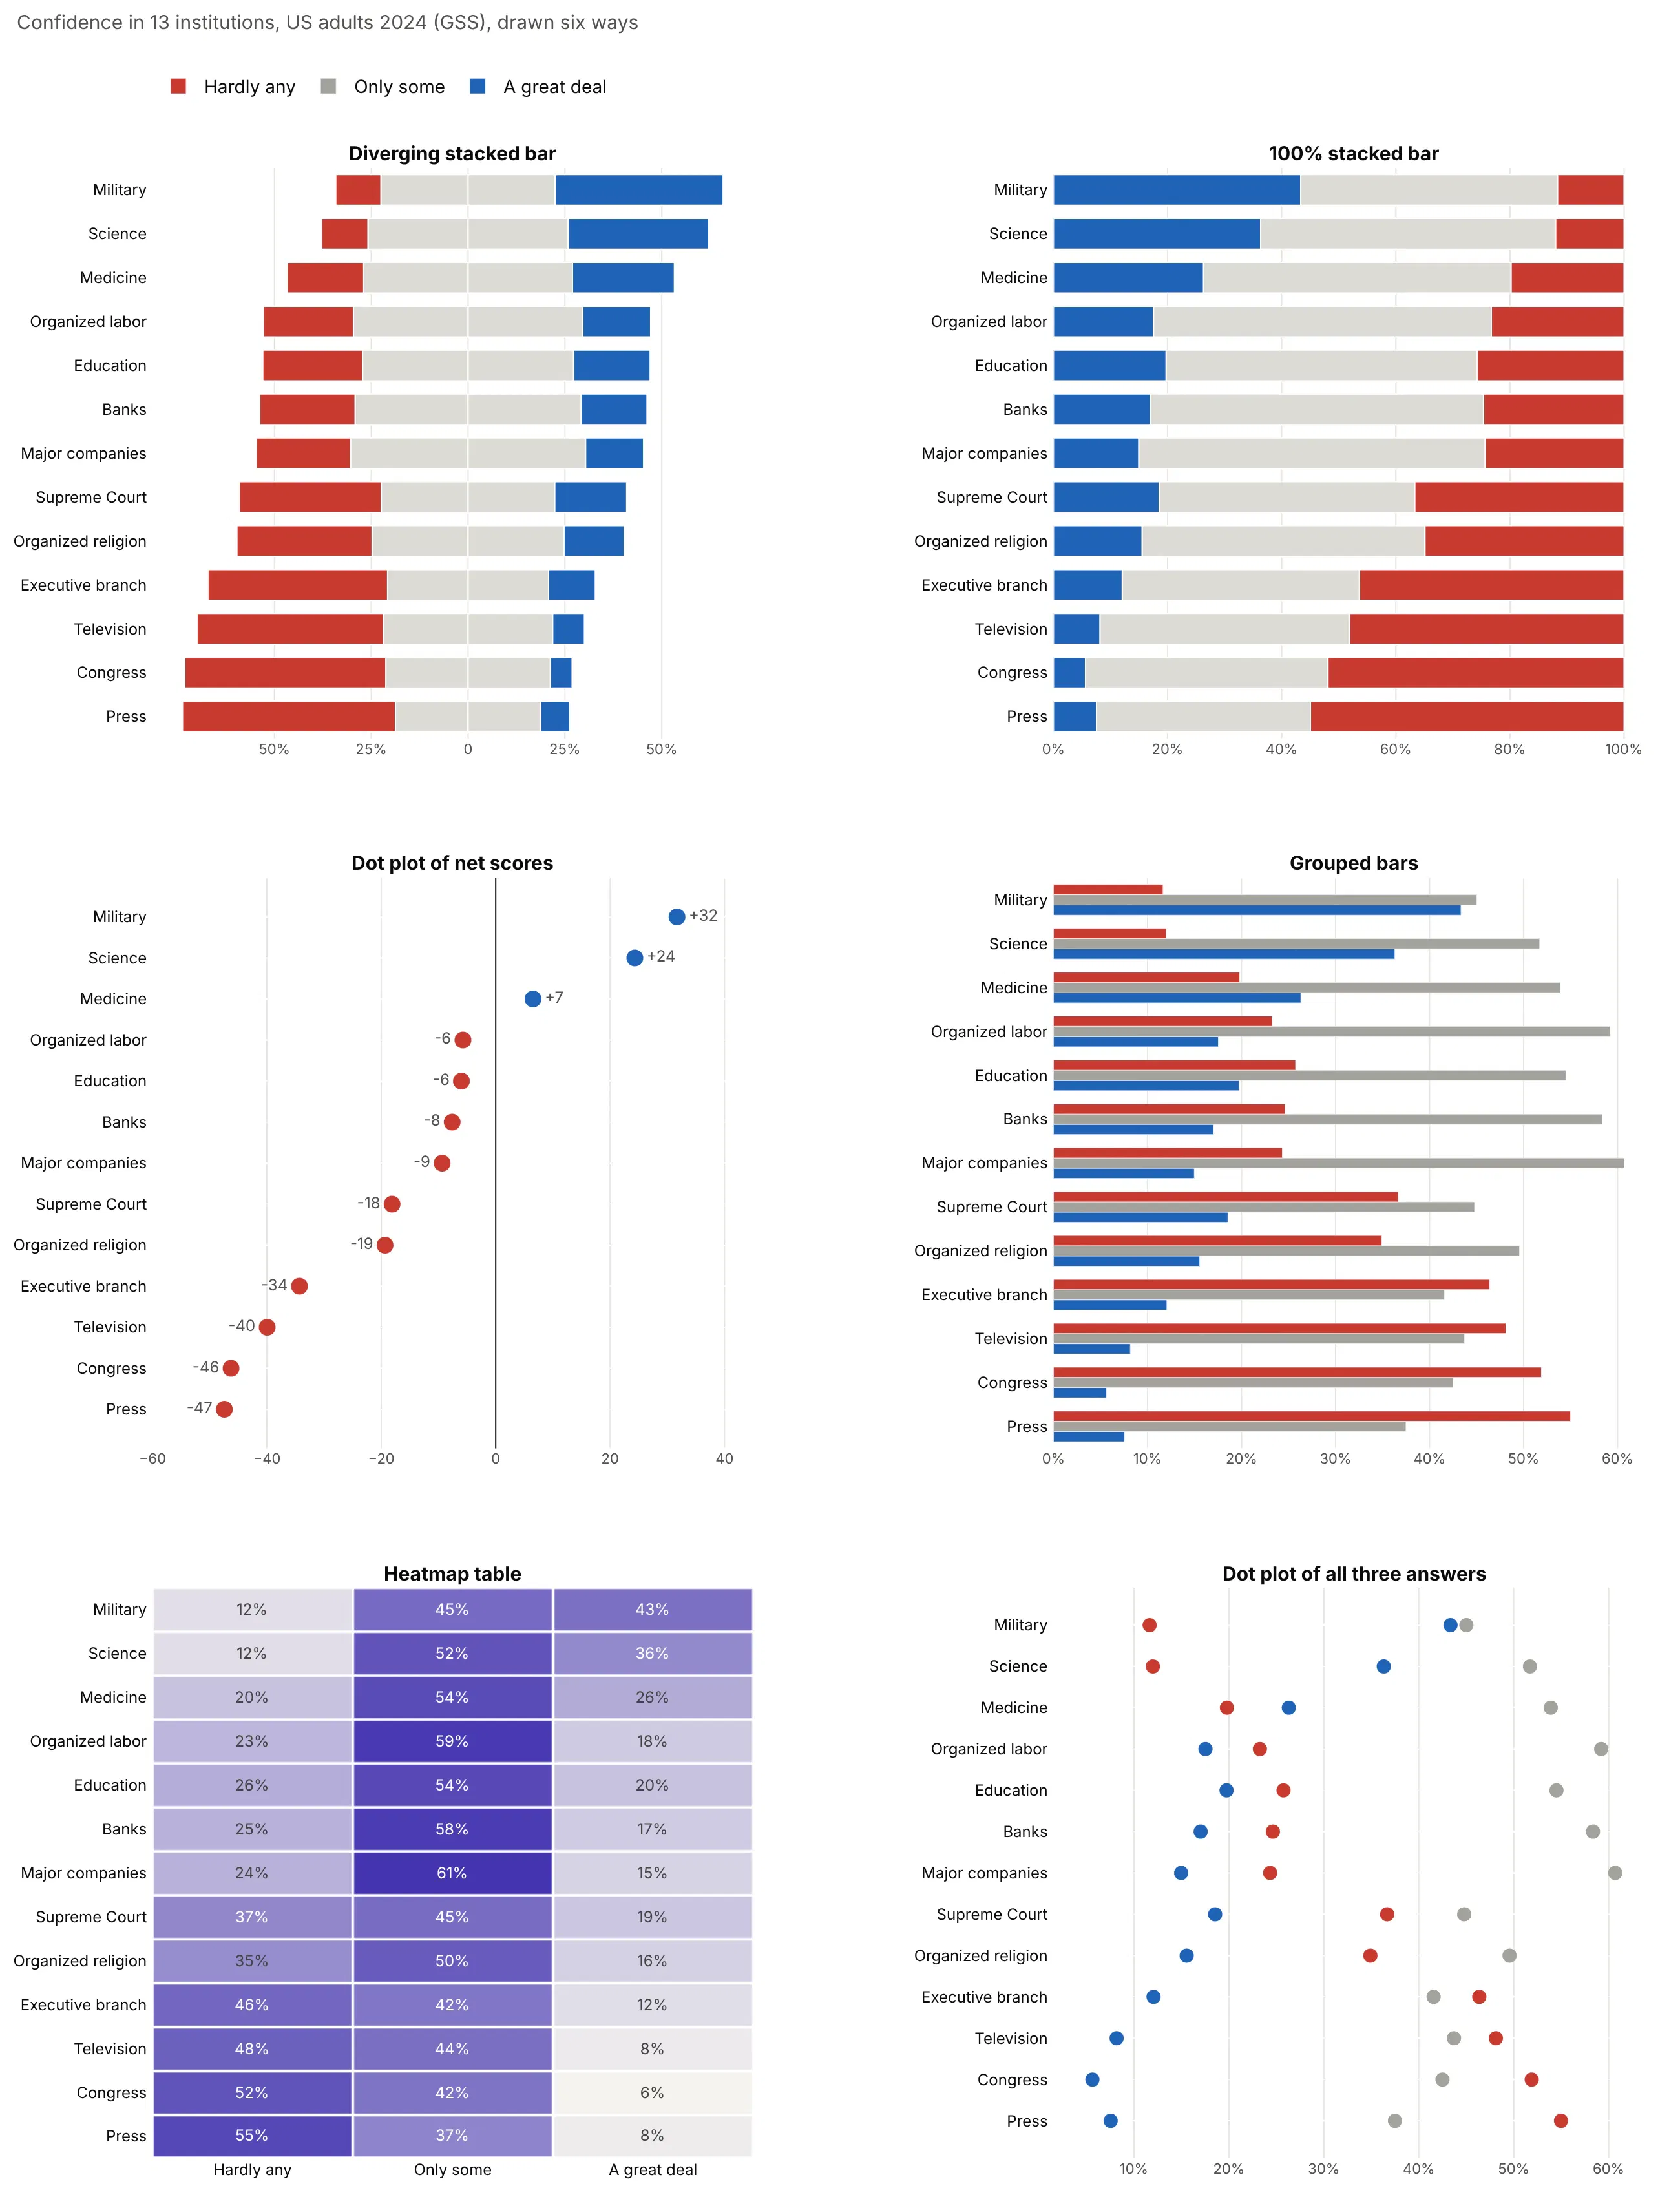
- 100% stacked bar (works too, with fewer rows). Every bar has the same length and the two ends share a baseline, so the extreme answers compare well, but the middle segments float and the point where agreement starts moves from row to row.
- Dot plot of net scores (better for ranking). One number per row, a great deal minus hardly any, is the easiest to rank and fits dozens of rows, but it hides how many people chose the middle. Our dumbbell chart guide shows how to add a second time point.
- Grouped bars (worse). Three bars per row compare each answer to zero, but the reader has to assemble the distribution in their head, and 13 rows become 39 bars.
- Heatmap table (different). Good for many items in a dashboard, where the cells double as a table of numbers, but color is a weaker cue than length. See our heatmap guide.
- Dot plot of all three answers (different). Shows each answer's level on one axis, which works for three or four answers and gets crowded beyond that.
How to make a Likert chart
With AI
ChatGPT, Claude Code, GitHub Copilot, Cursor and other AI tools are excellent at writing Plotly code. Name Plotly in the prompt, say which answers are negative, which are positive and where the neutral goes, and list the checks you want:
Make a plotly diverging stacked bar chart (a Likert chart) from survey.csv(columns: question, strongly_disagree, disagree, neutral, agree, strongly_agree, as percentages).- Use go.Bar with orientation="h" and barmode="relative". Disagree answers are negative x values,agree answers positive, the mildest answer next to zero on each side.- Split neutral in half across zero and show it once in the legend.- Colors: strongly disagree #c8392f, disagree #f09c87, neutral #dcdbd5, agree #8fb6e8, strongly agree #1f63b8.- Sort questions by net agreement (agree + strongly agree - disagree - strongly disagree), highest on top.- Label segments of 4% or more with whole percents; tick labels show 50% on both sides, never -50.- Legend in scale order, from strongly disagree to strongly agree.- A title that states the main takeaway. Assert that each row adds up to 100 within 1 point.- Save it as likert.html and as a PNG at 2x scale.
With Plotly Studio
Plotly Studio is a desktop app where you point an AI at a dataset and it builds charts and a Dash app around your questions. Ask for a Likert chart the same way:
Show a diverging stacked bar chart of the employee survey, one row per question, with disagree answers to the left of zero and agree answers to the right, sorted by net agreement. Add a dropdown to compare departments.
Make a Likert chart in Python or JavaScript
This is the code AI tools write under the hood. A Likert chart is four go.Bar traces stacked with barmode="relative": the negative answers get negative x values, and the middle answer is drawn as two halves:
import plotly.graph_objects as goitems = ["The military", "Science", "Congress"]hardly_any, only_some, great_deal = [12, 12, 52], [45, 52, 42], [43, 36, 6]fig = go.Figure([go.Bar(y=items, x=[-v / 2 for v in only_some], name="Only some", marker_color="#dcdbd5",orientation="h", showlegend=False),go.Bar(y=items, x=[-v for v in hardly_any], name="Hardly any", marker_color="#c8392f", orientation="h"),go.Bar(y=items, x=[v / 2 for v in only_some], name="Only some", marker_color="#dcdbd5", orientation="h"),go.Bar(y=items, x=great_deal, name="A great deal", marker_color="#1f63b8", orientation="h"),])fig.update_layout(barmode="relative", yaxis_autorange="reversed",xaxis=dict(tickvals=[-50, -25, 0, 25, 50], ticktext=["50%", "25%", "0", "25%", "50%"]))fig.show()
Traces stack outward from zero in the order you add them, so add the mildest answer first on each side. For real data, this helper takes a DataFrame of percentages, sorts the rows by net agreement and labels the segments. Every example in this guide builds on the same idea:
import plotly.graph_objects as godef make_likert(df, label, negative, positive, neutral=None, colors=None):"""One diverging bar per row. negative and positive list answer columns from themiddle of the scale outward; neutral (optional) is split across zero."""colors = colors or {}d = df.assign(net=df[positive].sum(axis=1) - df[negative].sum(axis=1)).sort_values("net")fig = go.Figure()def bar(col, sign, half=False, legend=True):x = d[col] / 2 if half else d[col]fig.add_bar(y=d[label], x=sign * x, orientation="h", name=col, showlegend=legend,marker_color=colors.get(col, "#dcdbd5"), customdata=d[col],text=[f"{v:.0f}%" if v >= 4 and not (half and sign < 0) else "" for v in d[col]],hovertemplate="%{y}: %{customdata:.1f}%<extra>" + col + "</extra>")if neutral:bar(neutral, -1, half=True, legend=False)bar(neutral, 1, half=True)for col in negative:bar(col, -1)for col in positive:bar(col, 1)fig.update_layout(barmode="relative", template="simple_white")fig.update_xaxes(tickvals=[-50, -25, 0, 25, 50, 75], ticktext=["50%", "25%", "0", "25%", "50%", "75%"])return fig# fig = make_likert(df, "institution", negative=["hardly_any"], positive=["great_deal"],# neutral="only_some", colors={"hardly_any": "#c8392f", "great_deal": "#1f63b8"})
In JavaScript, plotly.js builds the same chart from four bar traces:
<div id="chart"></div><script src="https://cdn.plot.ly/plotly-4.1.1.min.js"></script><script>const items = ["The military", "Science", "Congress"];const hardlyAny = [12, 12, 52], onlySome = [45, 52, 42], greatDeal = [43, 36, 6];const bar = (x, name, color, showlegend = true) =>({type: "bar", orientation: "h", y: items, x, name, showlegend, marker: {color}});Plotly.newPlot("chart", [bar(onlySome.map(v => -v / 2), "Only some", "#dcdbd5", false),bar(hardlyAny.map(v => -v), "Hardly any", "#c8392f"),bar(onlySome.map(v => v / 2), "Only some", "#dcdbd5"),bar(greatDeal, "A great deal", "#1f63b8"),], {barmode: "relative",yaxis: {autorange: "reversed"},xaxis: {tickvals: [-50, -25, 0, 25, 50], ticktext: ["50%", "25%", "0", "25%", "50%"]},});</script>
Share it
Every Plotly chart has a Share chart button (the cloud icon in its toolbar) that uploads it to Plotly Cloud and gives you a link. Only you can see it until you change its visibility.
For a live app, put the chart in a Dash app and publish it with the Plotly Cloud CLI. Coding agents can run these commands for you:
pip install "dash[cloud]"plotly user loginplotly app publish
If your data has to stay in your own cloud or data center, publish to Dash Enterprise instead.
Dos and don'ts
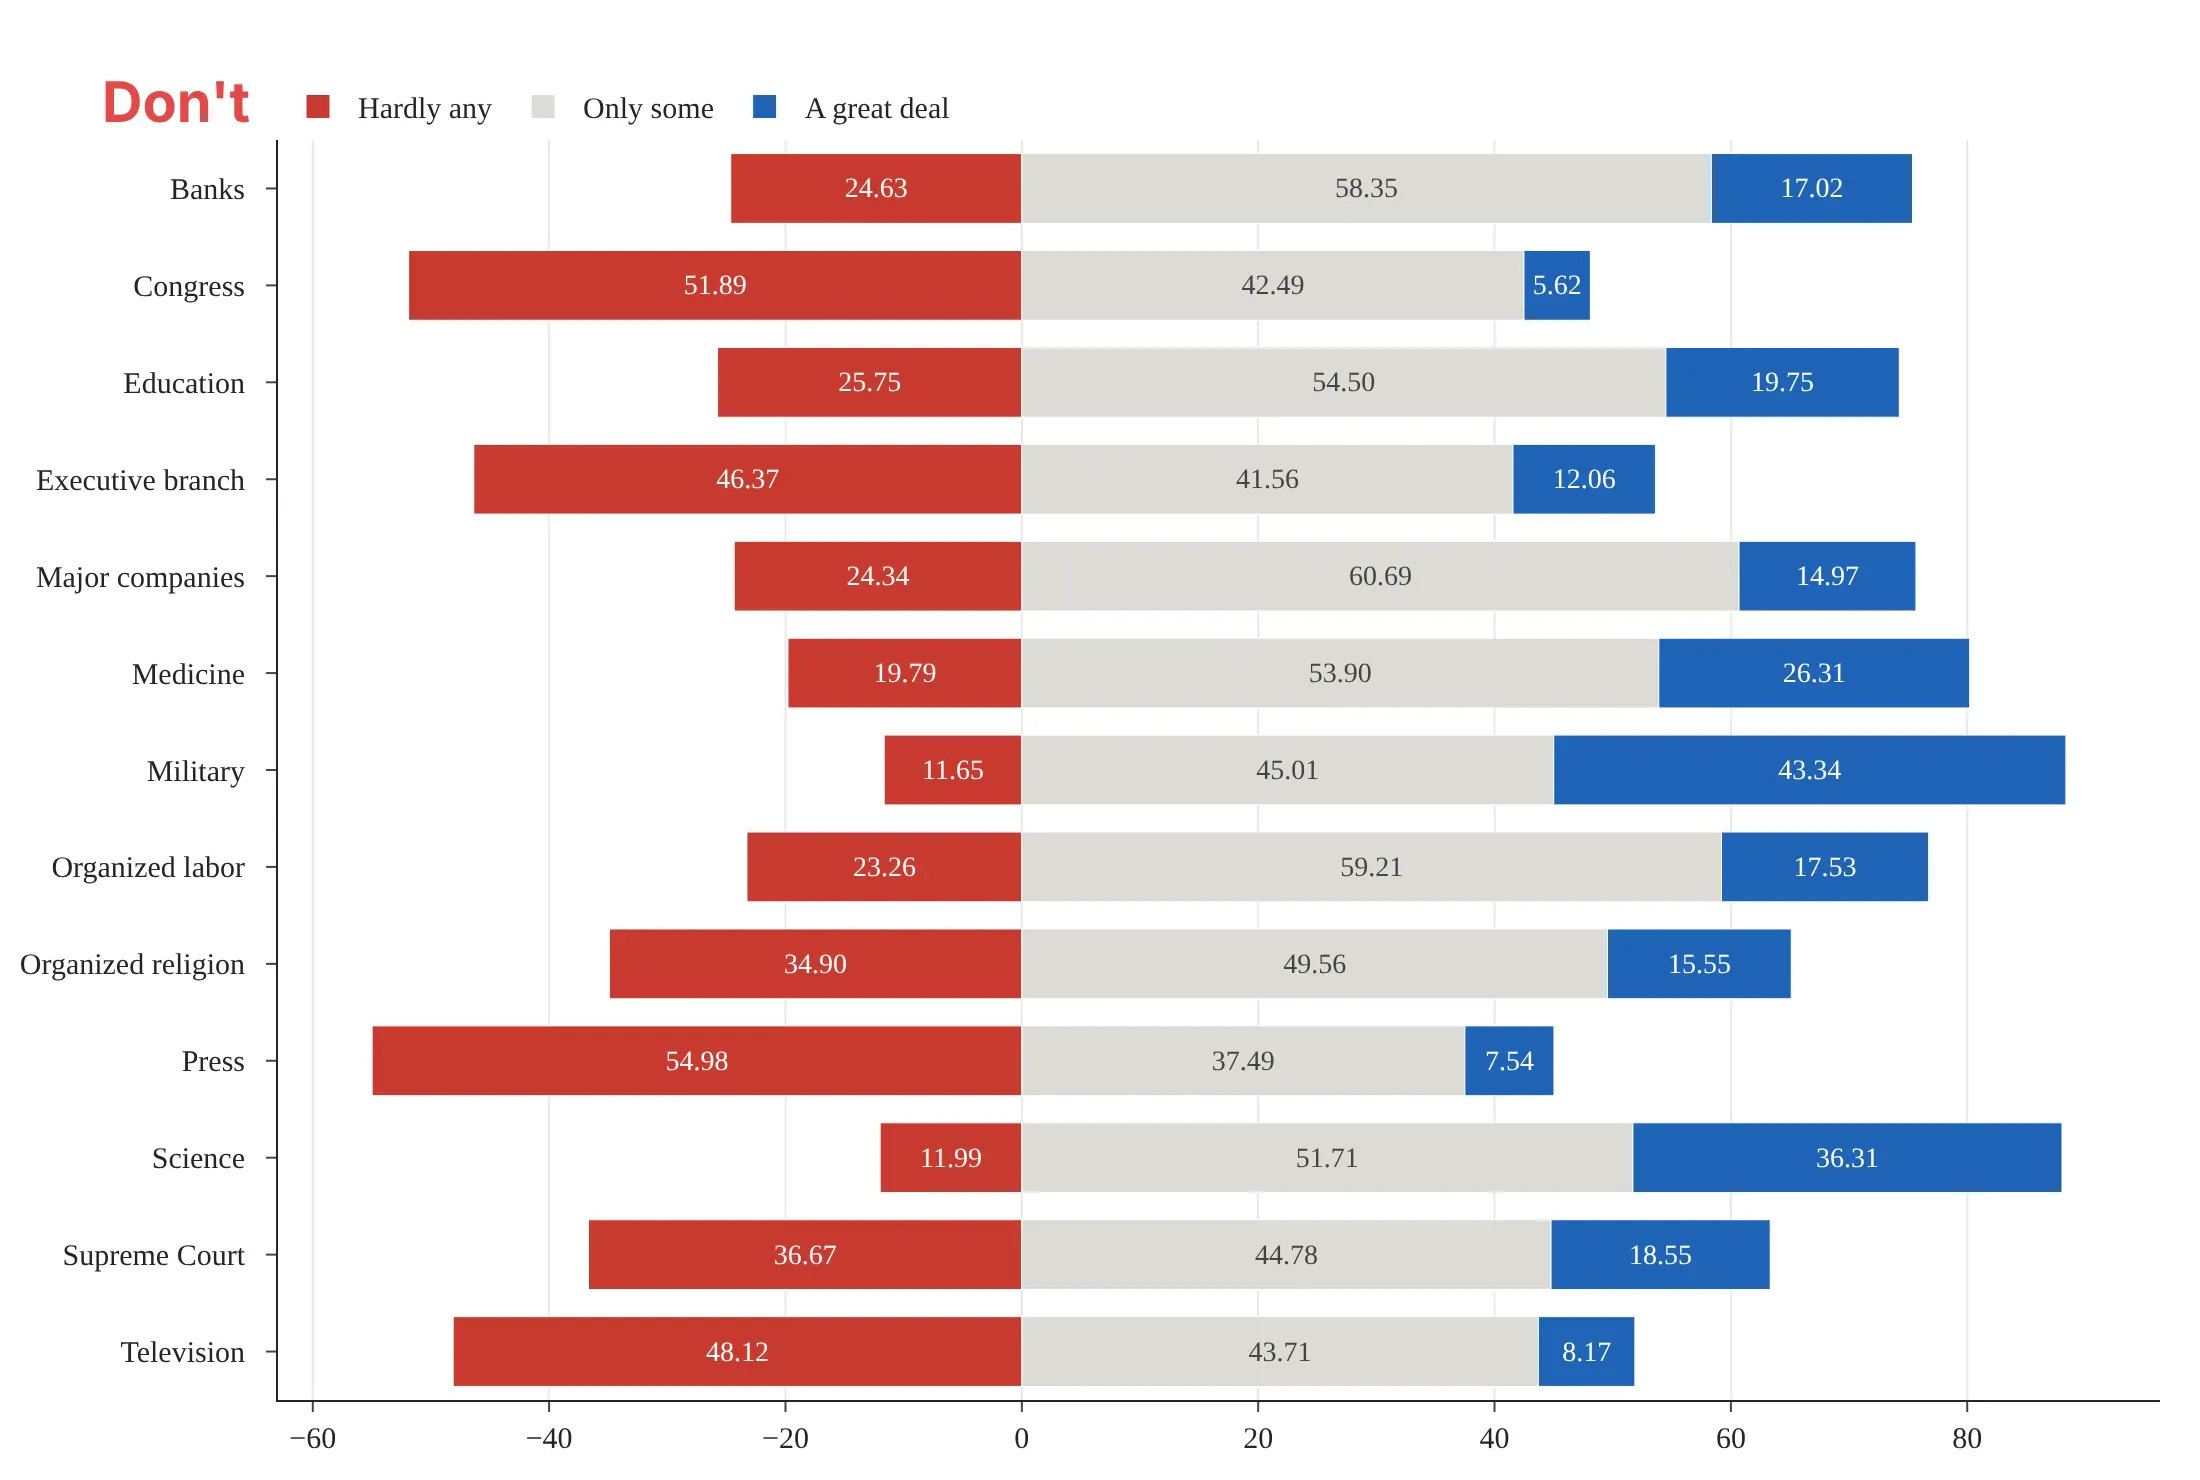
Here is the same confidence data with the same colors twice. The differences are all in the layout and the labels.
Don't sort the rows alphabetically, stack the middle answer on the positive side so the bars no longer meet at a shared zero, print two decimals in every segment, or leave negative numbers on the axis:
Do sort by net confidence, split the middle answer across zero, round to whole percents and label both sides of the axis as positive percentages:
Where to put the neutral answer
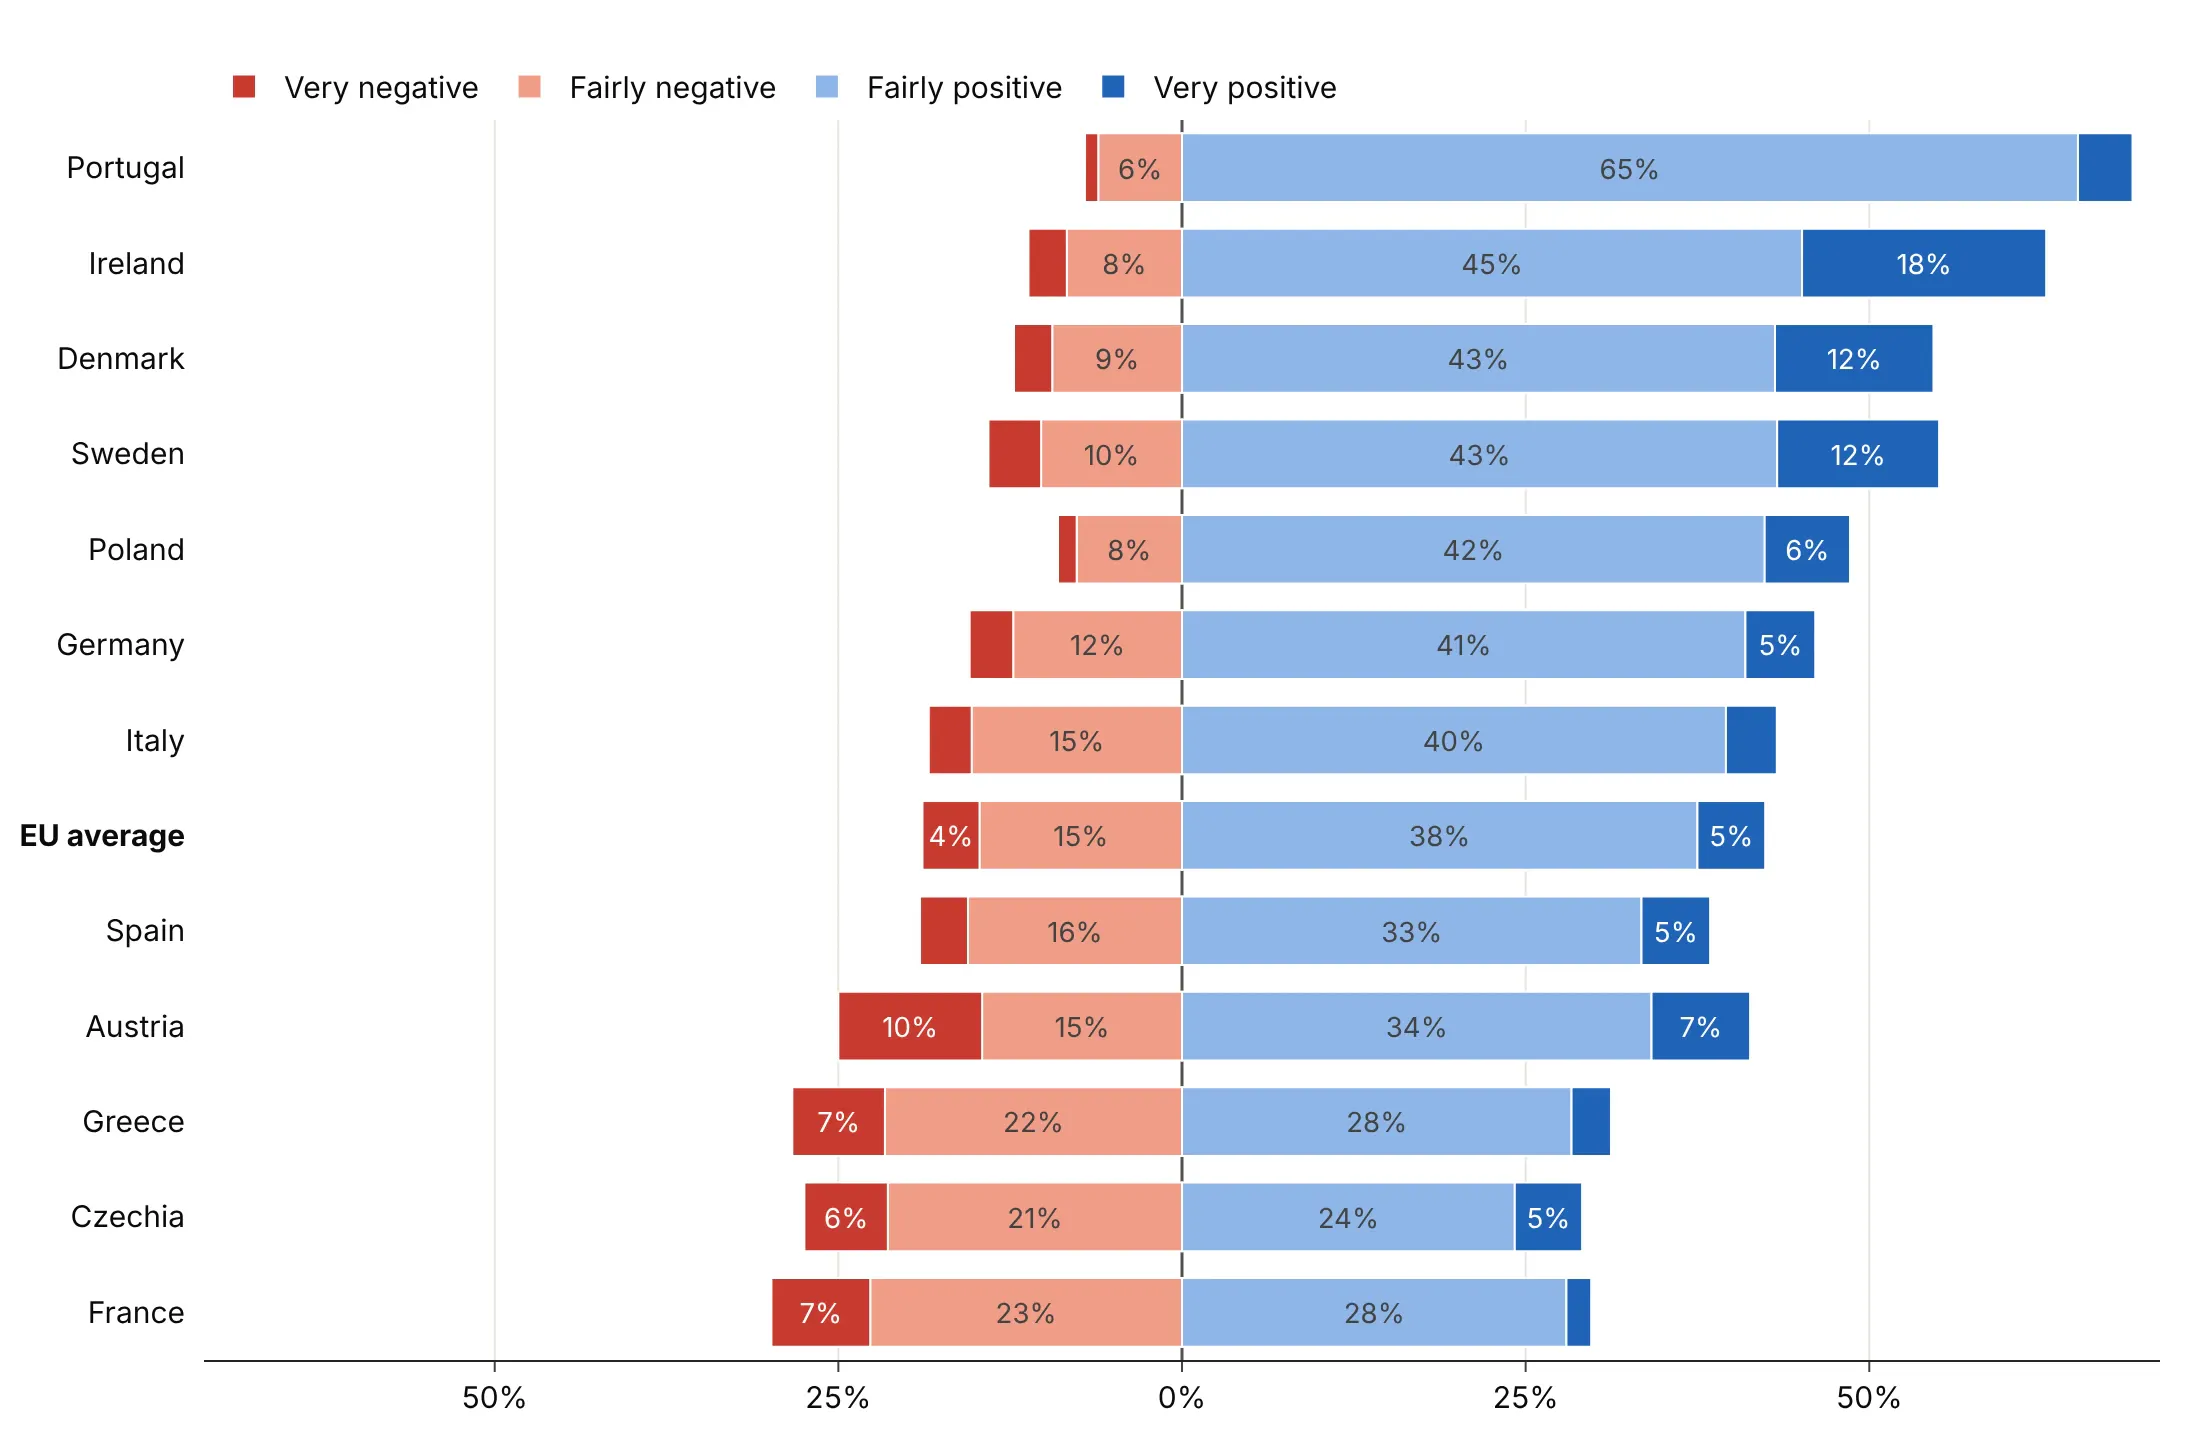
Robbins and Heiberger split the neutral answer across zero, and it's the right default when neutral is a real middle point. Here are three options on the EU's image in 12 countries (Standard Eurobarometer 104, autumn 2025), where neutral is 38% of answers in the EU as a whole.
Split across zero. The bars stay centered, and the width of the gray band shows how many people sit in the middle.
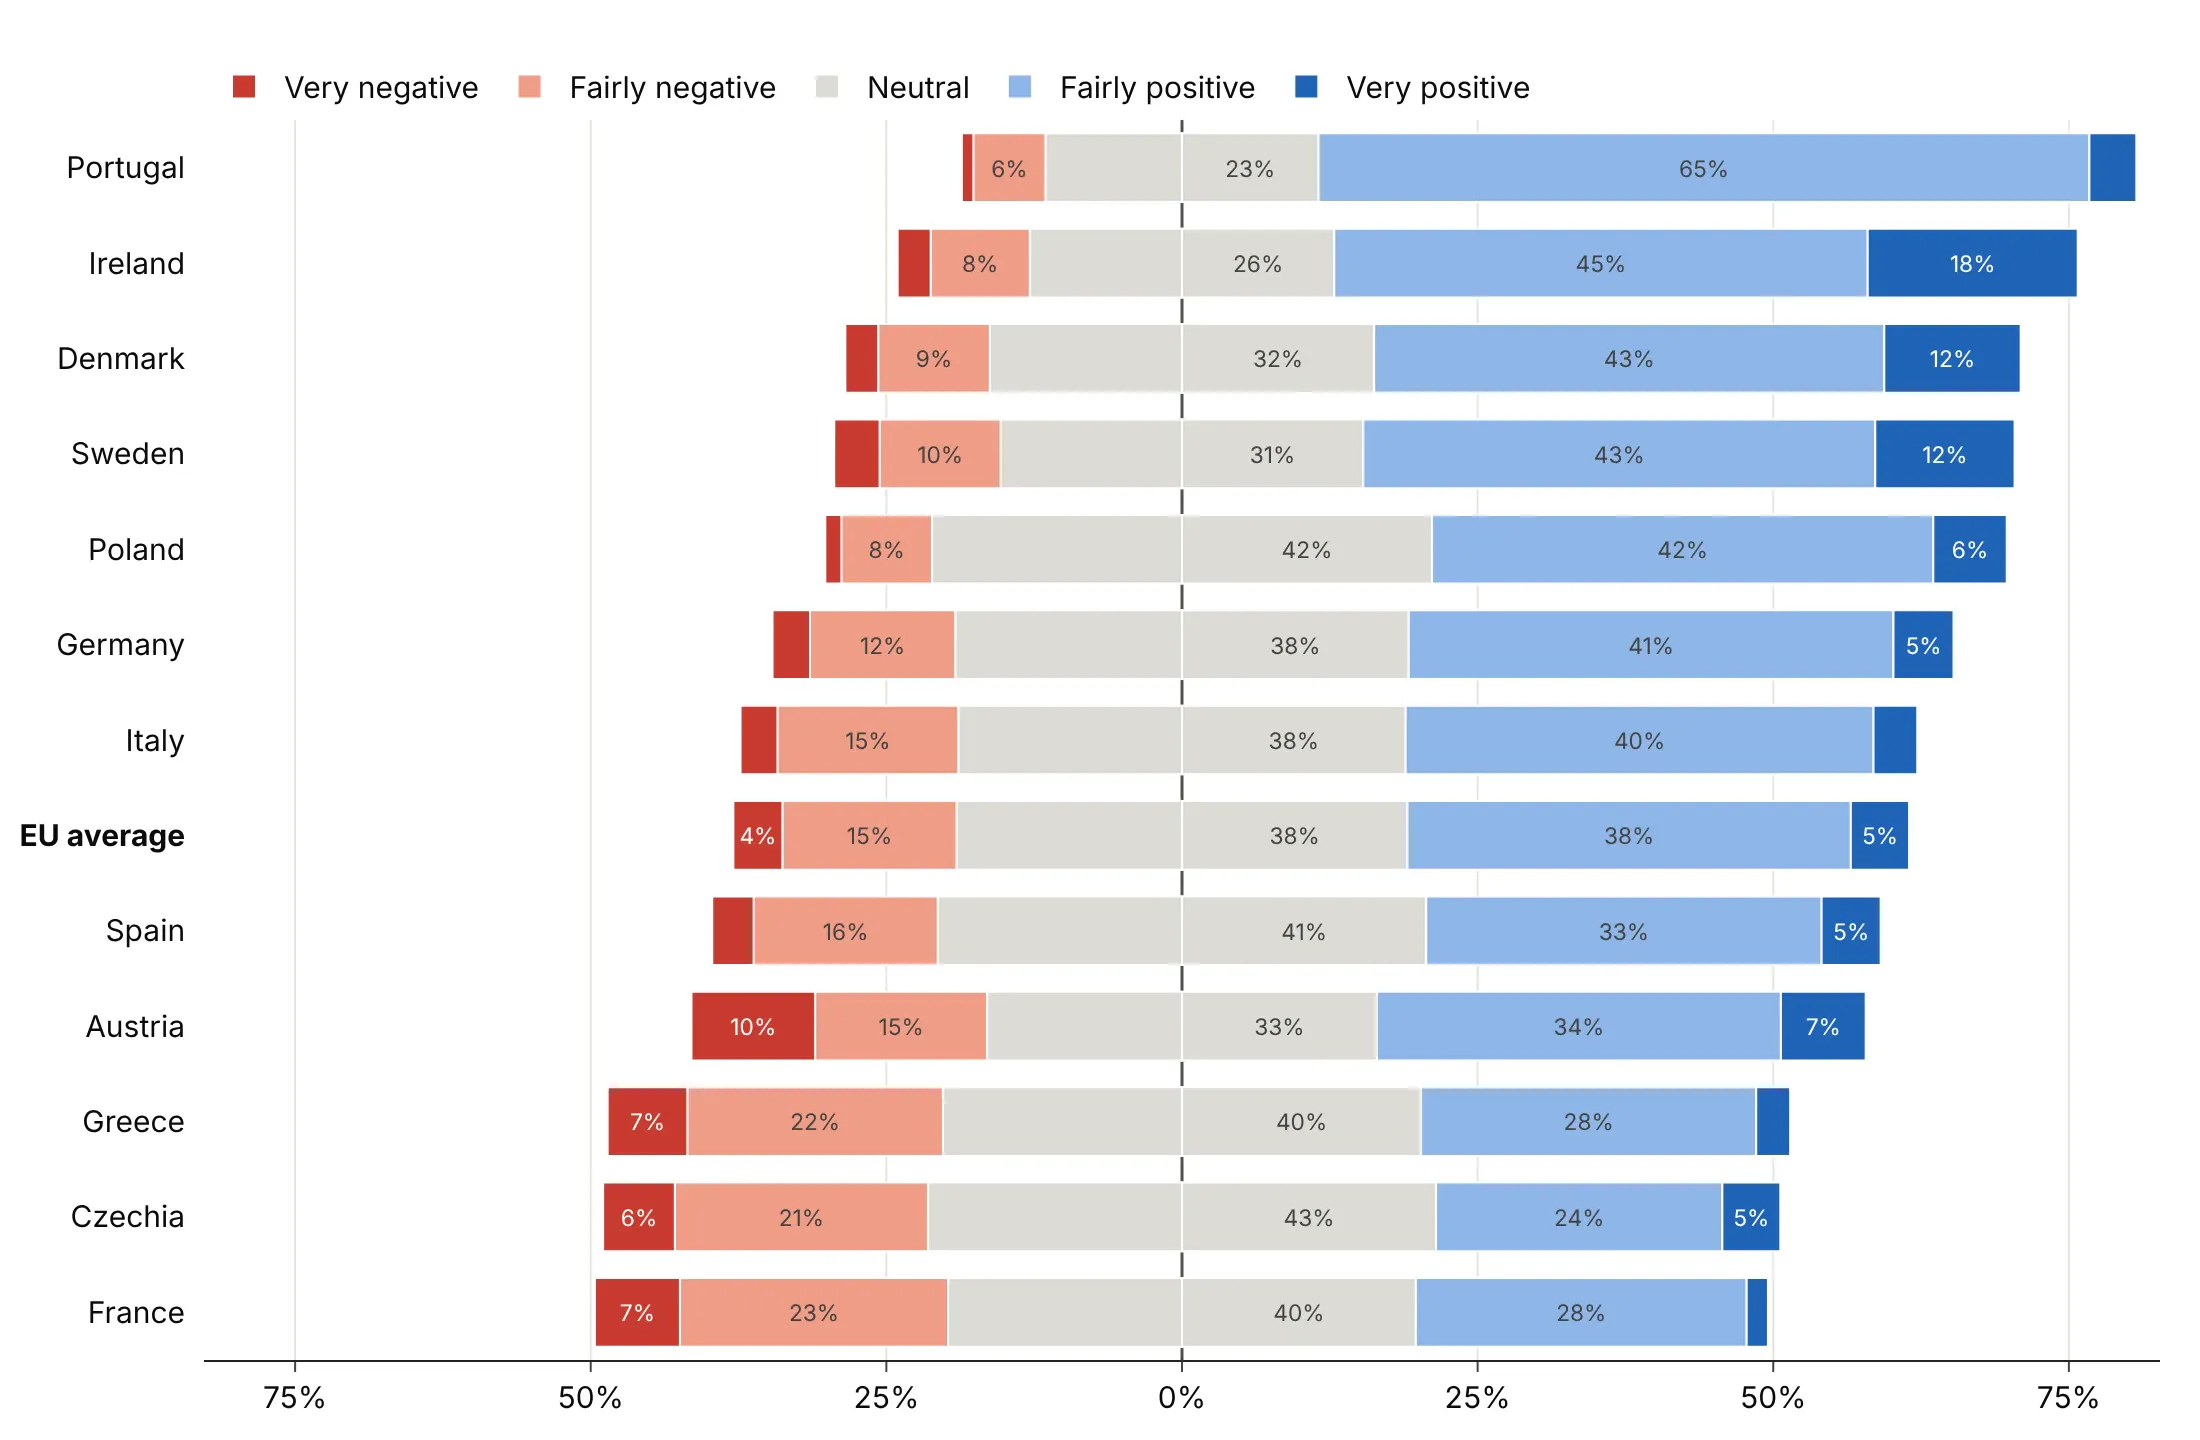
In a separate column. Positive and negative now start exactly at zero, which makes them easier to compare, and neutral gets its own small bar chart on the right. This is also where "Don't know" belongs.
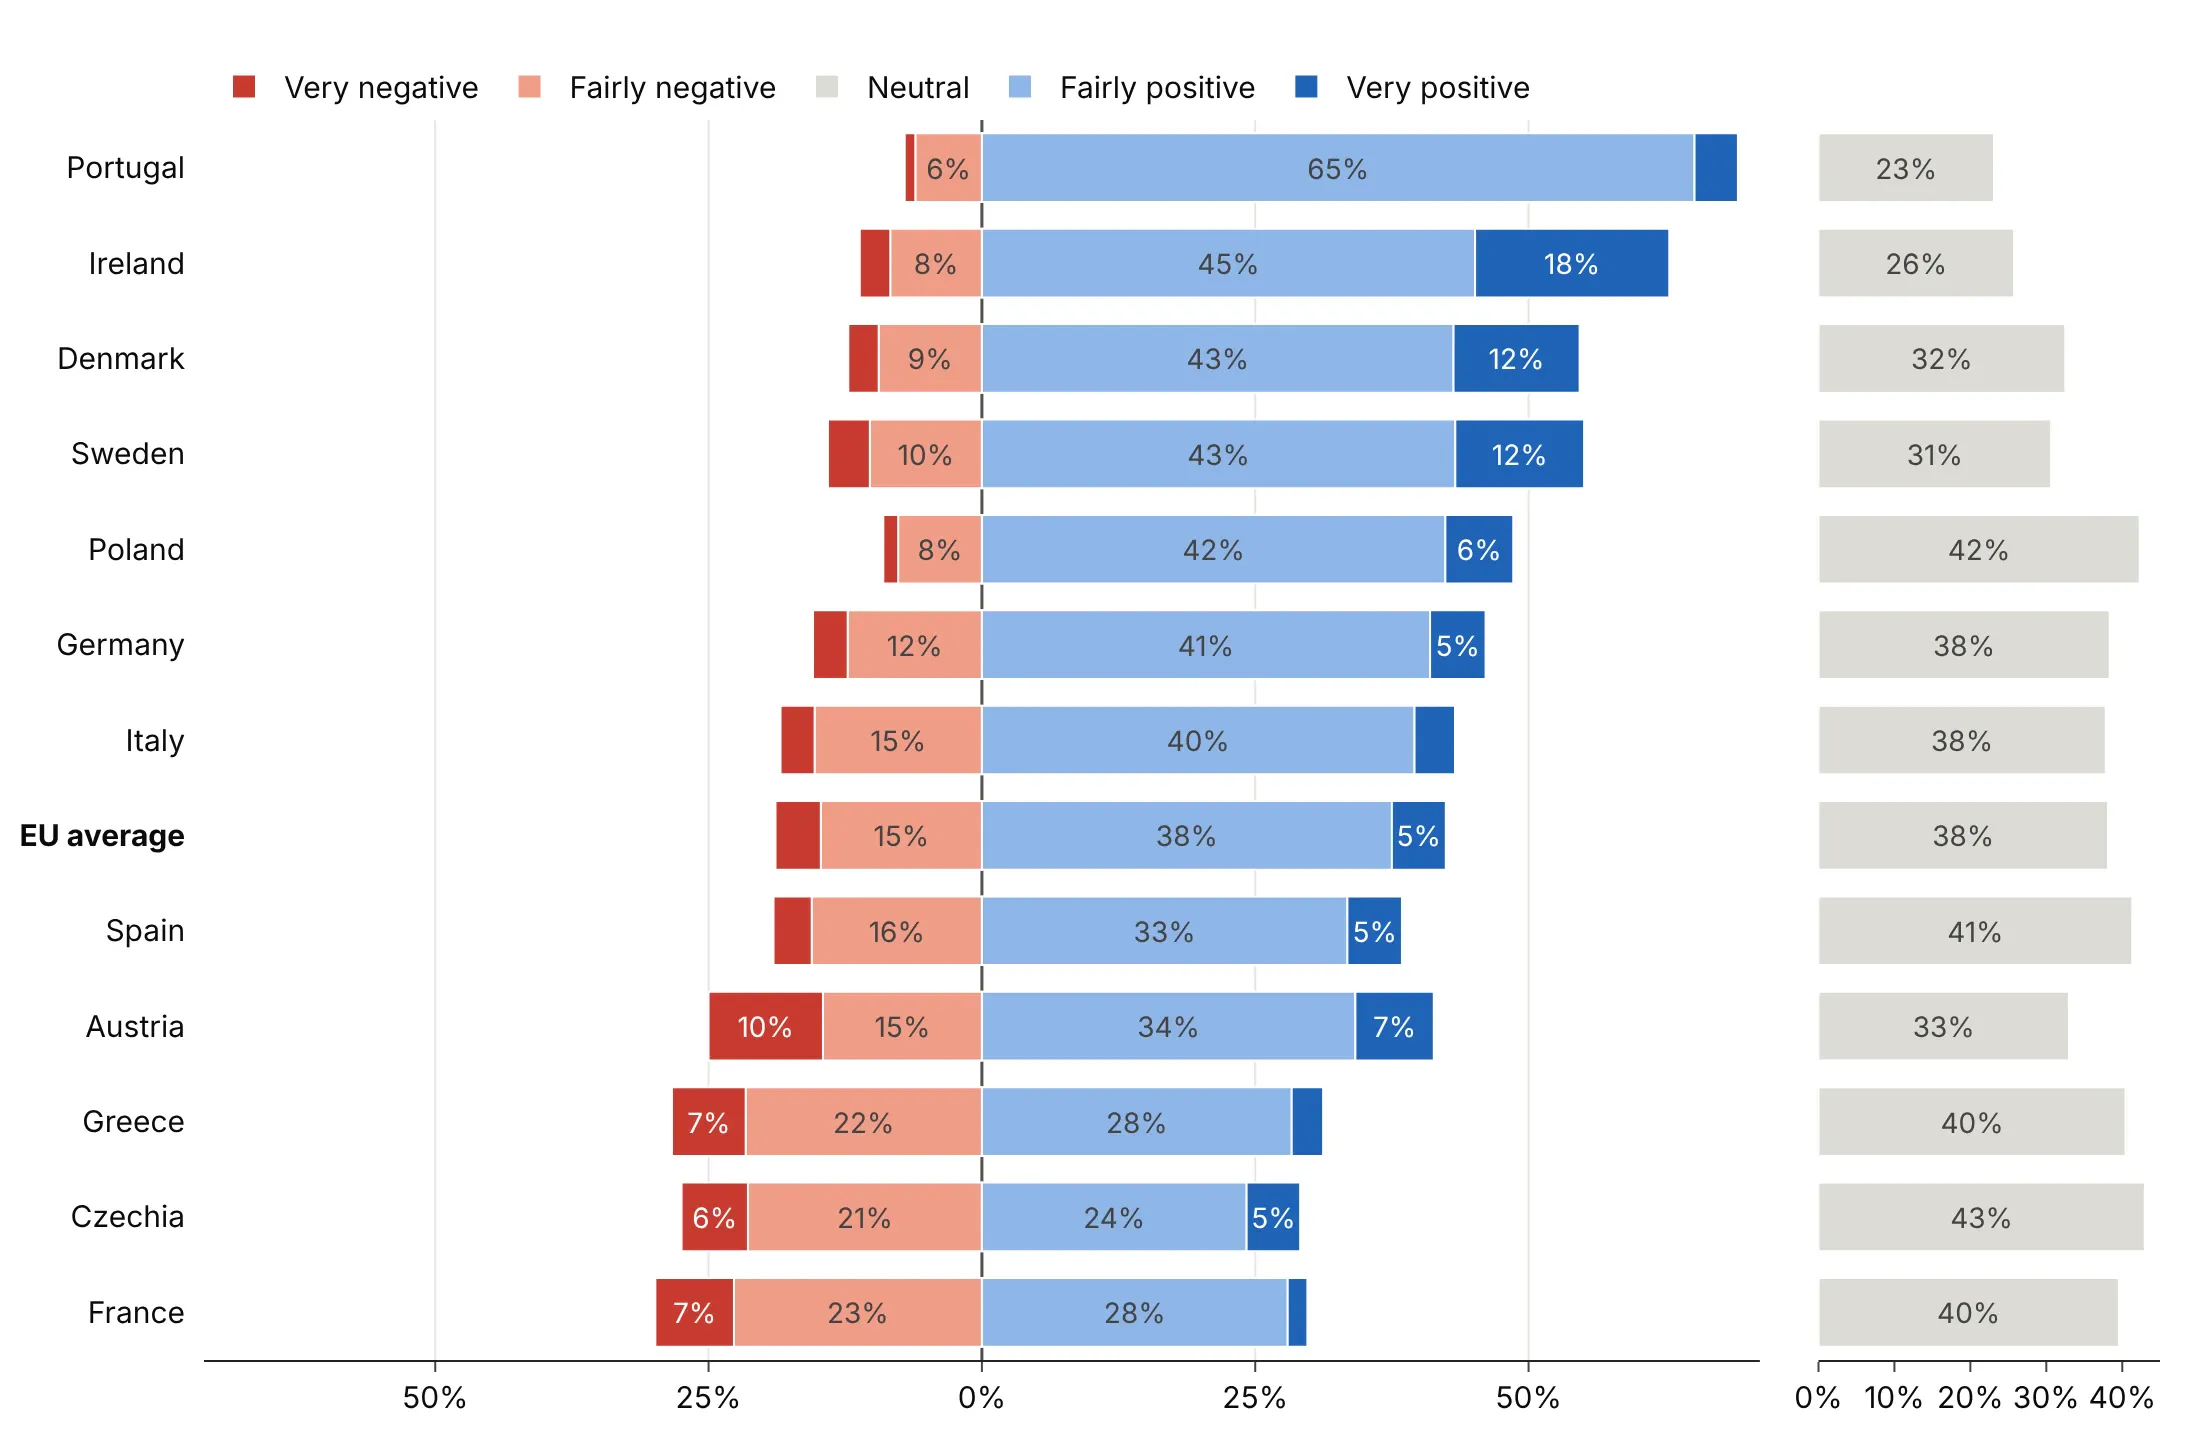
Dropped (avoid unless you say so). Leaving neutral out makes opinion look more decided than it is. In Czechia, 43% chose neutral, and this version hides all of them.
Checklist
Do
- Write a title that states the takeaway with a number.
- Sort rows by net agreement, unless the rows have a natural order like income bands or age groups.
- Use two hues and a gray middle, with the strongest answers darkest on the outside.
- Keep the legend in scale order, from the most negative answer to the most positive.
- Use one hue from light to dark for scales with no negative end (never to always, none to a lot).
- Show "Don't know" and "Not sure" in a separate column, or say in the subtitle that you left them out.
Don't
- Use barmode="stack", which can't put bars on both sides of zero.
- Use a rainbow, or red and green as the only cue for people with color vision deficiency.
- Average the answer codes into a score without showing the distribution.
- Compare groups with very different sample sizes without printing the sizes.
Options to customize
A Likert chart is a set of go.Bar traces plus a few layout settings. These are the ones that matter most; the full list is in the Plotly bar chart documentation and the horizontal bar chart documentation.
- orientation="h": horizontal bars, one row per question or group.
- barmode="relative" (layout): stacks positive values right of zero and negative values left of it.
- Negative x values: put the negative answers on the left; add the mildest answer first so it sits next to zero.
- Two traces for neutral: half the value on each side, with showlegend=False on one of them.
- marker.color: one color per answer, from a diverging palette with a gray middle.
- marker.line: a thin white line between segments.
- text, texttemplate: percent labels; leave the text empty for narrow segments.
- textposition="inside", insidetextanchor="middle", textangle=0: centered, horizontal labels.
- uniformtext (layout): one label size for every segment; mode="hide" drops labels that don't fit.
- customdata, hovertemplate: show the positive percentage on hover for the left-hand segments.
- legendrank, legend.traceorder: keep the legend in scale order whatever order the traces were added.
- xaxis.tickvals, ticktext: show 50% on both sides instead of -50.
- xaxis.zeroline, zerolinecolor: a visible center line.
- yaxis.categoryorder="array", categoryarray: sort rows by net agreement or keep a natural order.
- make_subplots(cols=2, shared_yaxes=True): a separate column for neutral or "Don't know".
- bargap: the space between rows, about 0.25 to 0.35.
More Likert chart examples
Nine more charts built from public survey data, each with its source, the technique that makes it work and a prompt to rebuild it.
1. How often US adults have the nine symptoms of depression
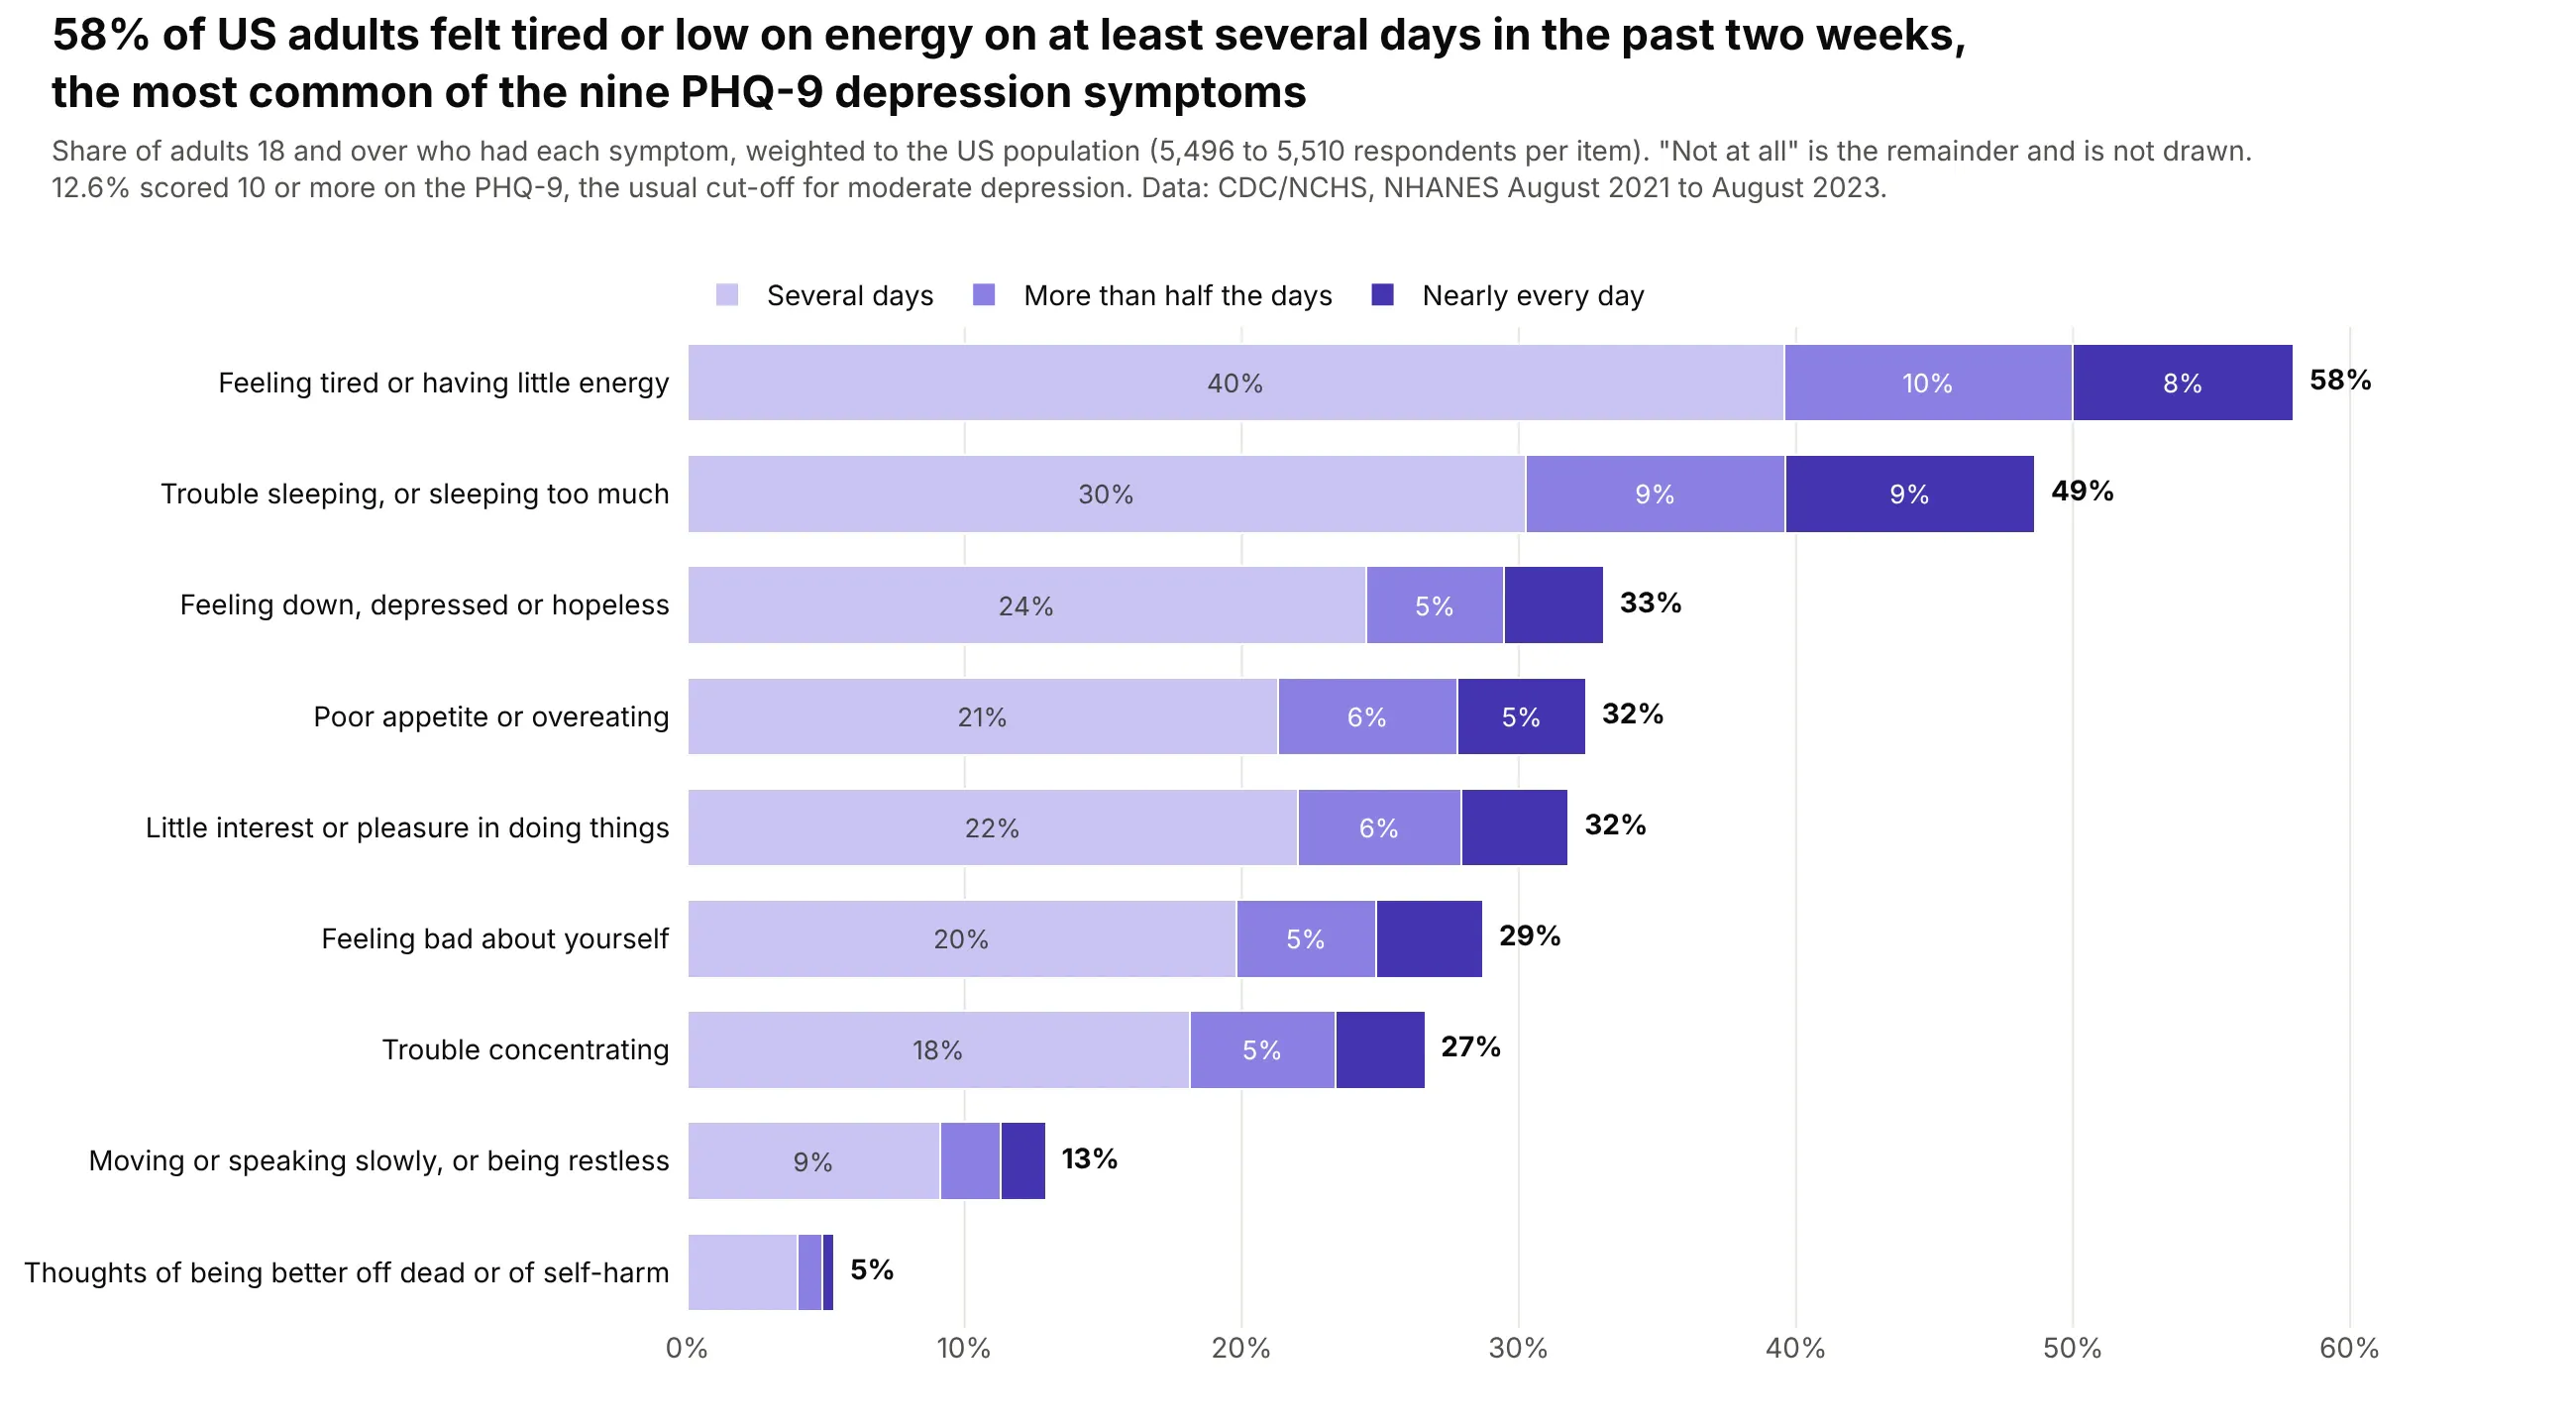
58% of US adults felt tired or low on energy on at least several days in the past two weeks, the most common of the nine PHQ-9 items, and 12.6% scored 10 or more, the usual cut-off for moderate depression. Data: CDC/NCHS, NHANES August 2021 to August 2023, weighted.
Tip: a frequency scale has no negative end, so the answers stack from zero in one hue and "Not at all" is left out as the remainder.
Get the data from the CDC's National Health and Nutrition Examination Survey (NHANES) August 2021 -August 2023, files DPQ_L.xpt (PHQ-9) and DEMO_L.xpt (weights WTMEC2YR), on wwwn.cdc.govand shape it into a table(columns: item, not_at_all, several_days, more_than_half, nearly_every_day, n; weighted percentagesof adults for each of the nine PHQ-9 items, refused and don't know dropped).Make a plotly horizontal stacked bar chart, one row per symptom, sorted by the share with the symptom.- Stack several days, more than half the days and nearly every day from zero in light to dark purple.- Leave out "not at all"; print the total at the end of each bar.- Title with the most common symptom and its share.
2. Self-rated health in 47 states and DC
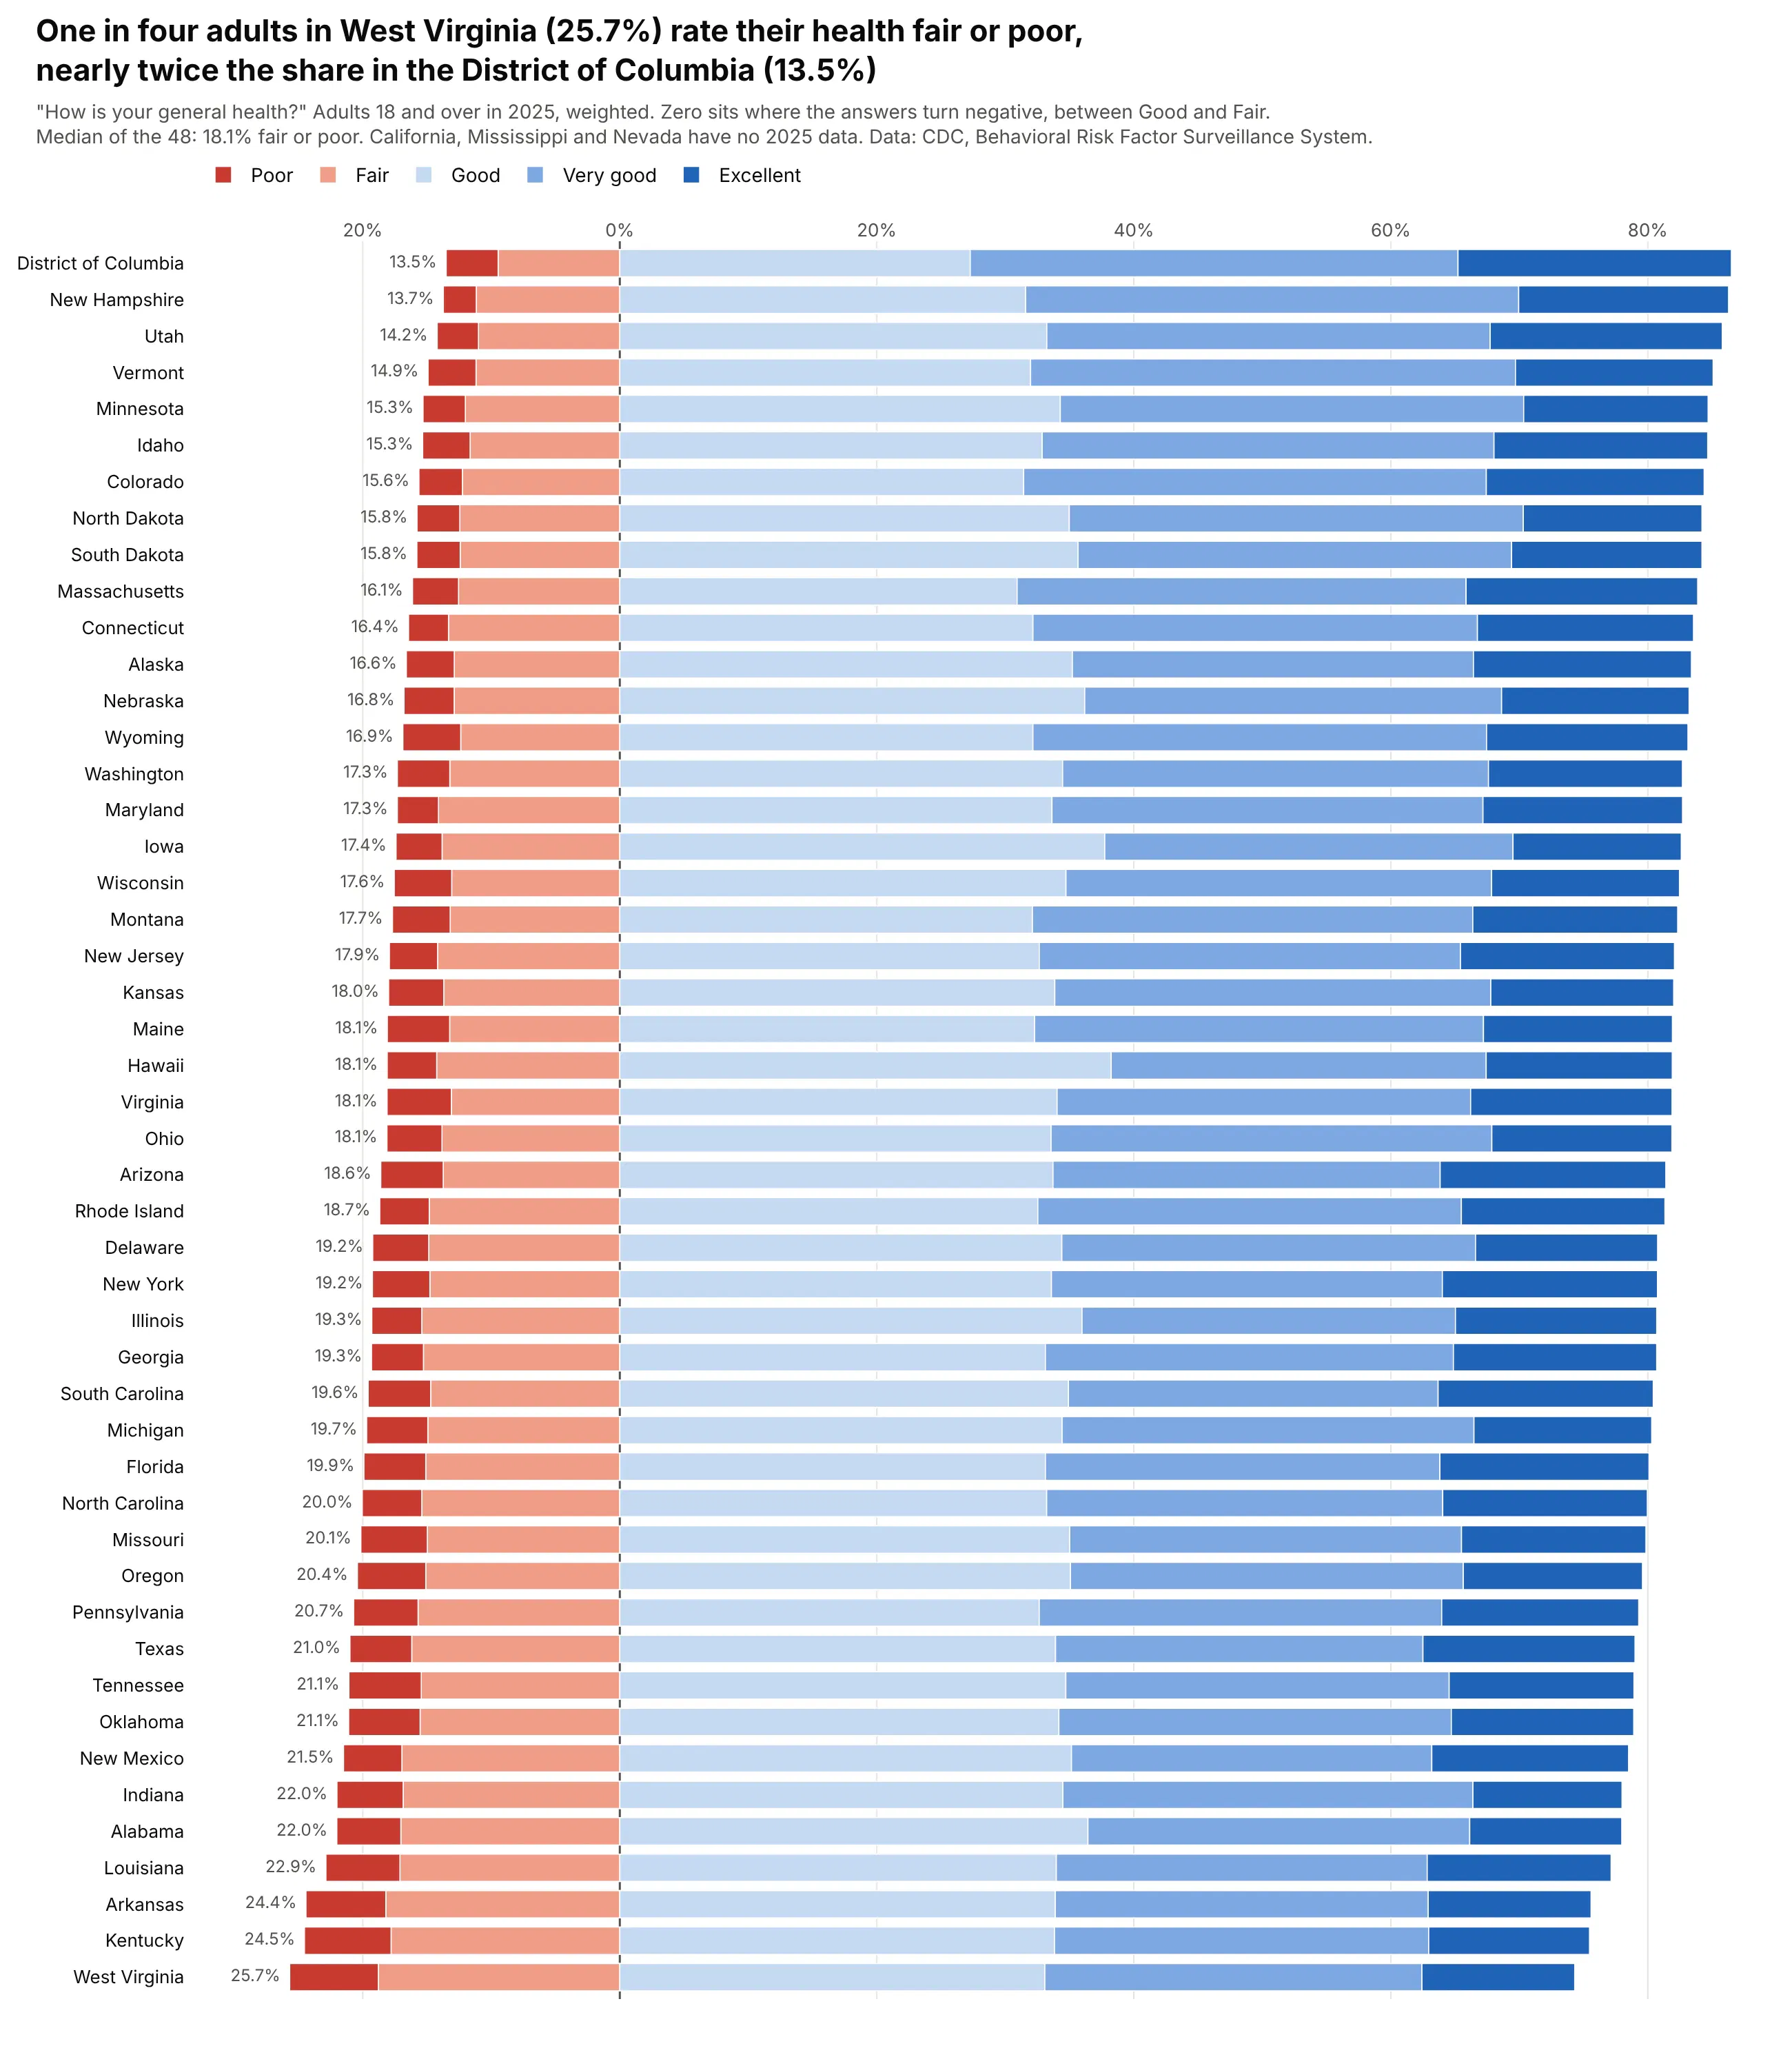
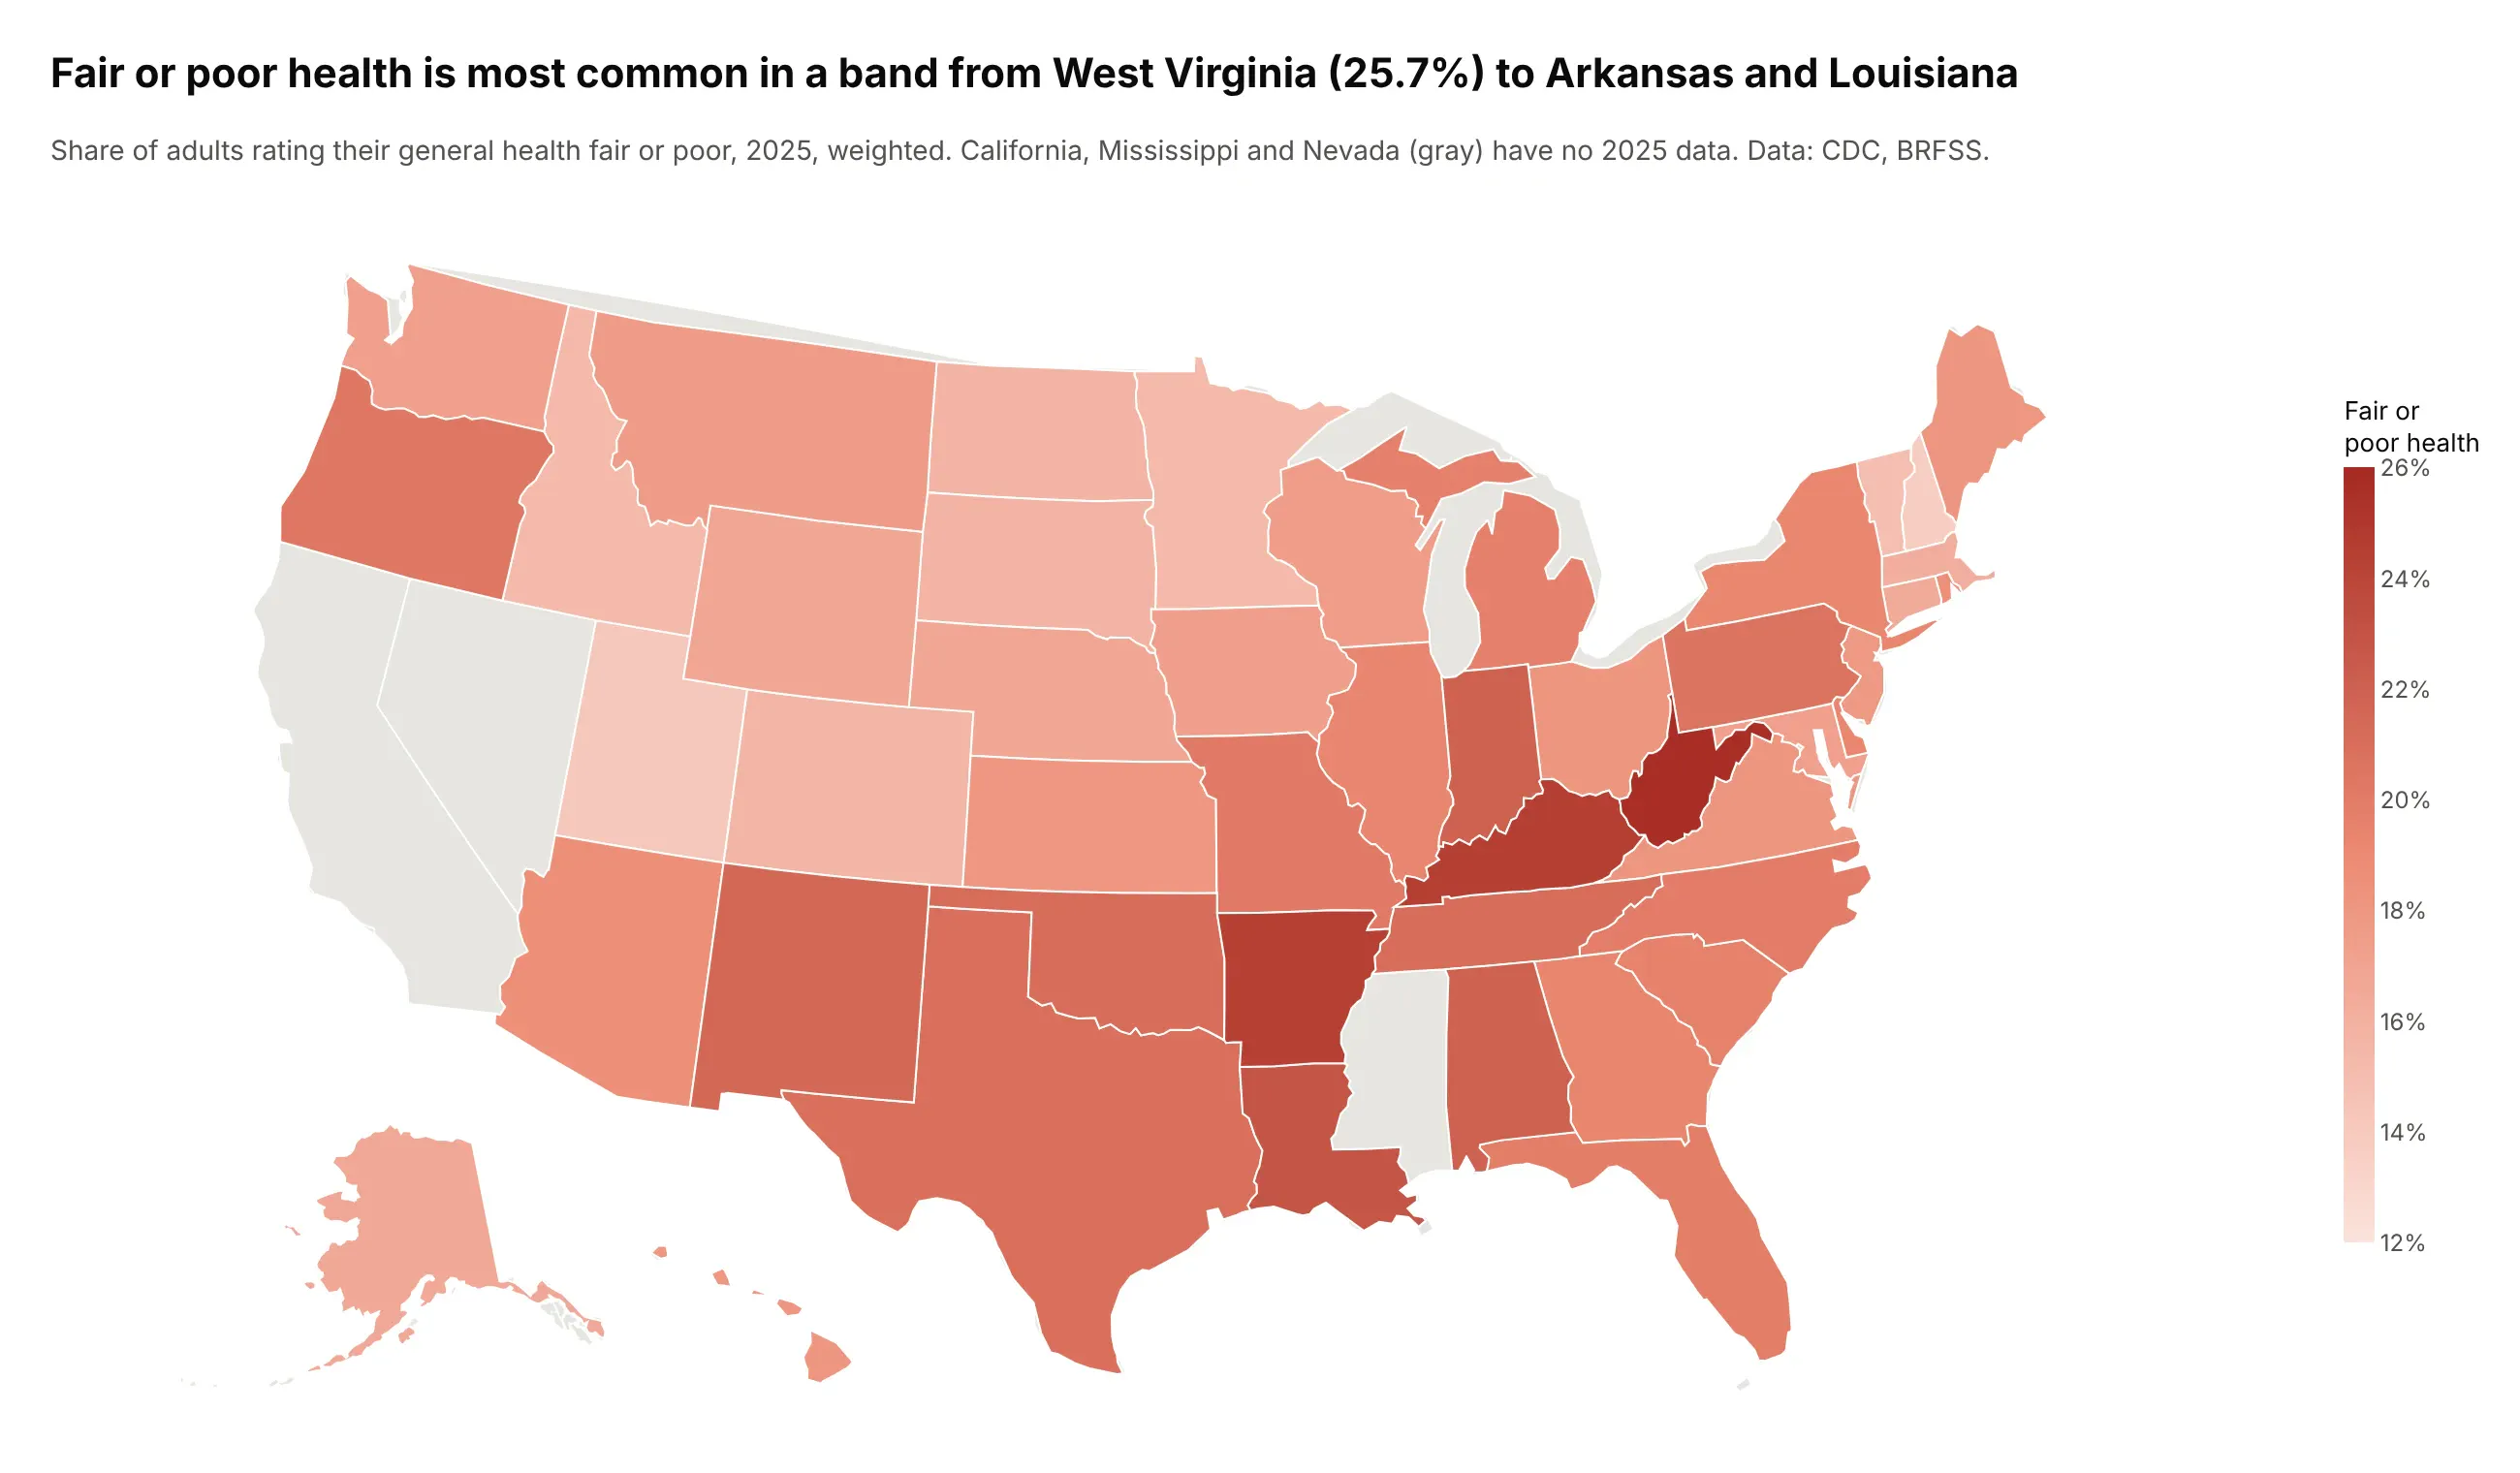
One in four adults in West Virginia (25.7%) rate their health fair or poor, nearly twice the share in the District of Columbia (13.5%), and the median of the 48 is 18.1%. Data: CDC, Behavioral Risk Factor Surveillance System 2025 (California, Mississippi and Nevada have no 2025 data).
Tip: the scale is unbalanced (three positive answers and two negative ones), so zero goes where the answers turn negative, between Good and Fair.
Get the data from the CDC's BRFSS Prevalence & Trends Data (data.cdc.gov dataset dttw-5yxu),question GENHLTH "How is your general health?", year 2025, break_out Overalland shape it into a table(columns: state, abbr, excellent, very_good, good, fair, poor, fair_poor; weighted percentages; 50 states and DC only).Make a plotly diverging stacked bar chart, one row per state, sorted by fair_poor (smallest at the top).- Fair and poor go left of zero (poor outermost, dark red), good, very good and excellent go right(excellent outermost, dark blue).- Print the fair or poor share left of each bar; put the x-axis on top for a tall chart.- Title with the highest and lowest states.
Another way to see it: a map shows that the highest shares form a band from West Virginia and Kentucky to Arkansas and Louisiana, which the sorted bars can't show.
3. Going without necessities to pay an energy bill
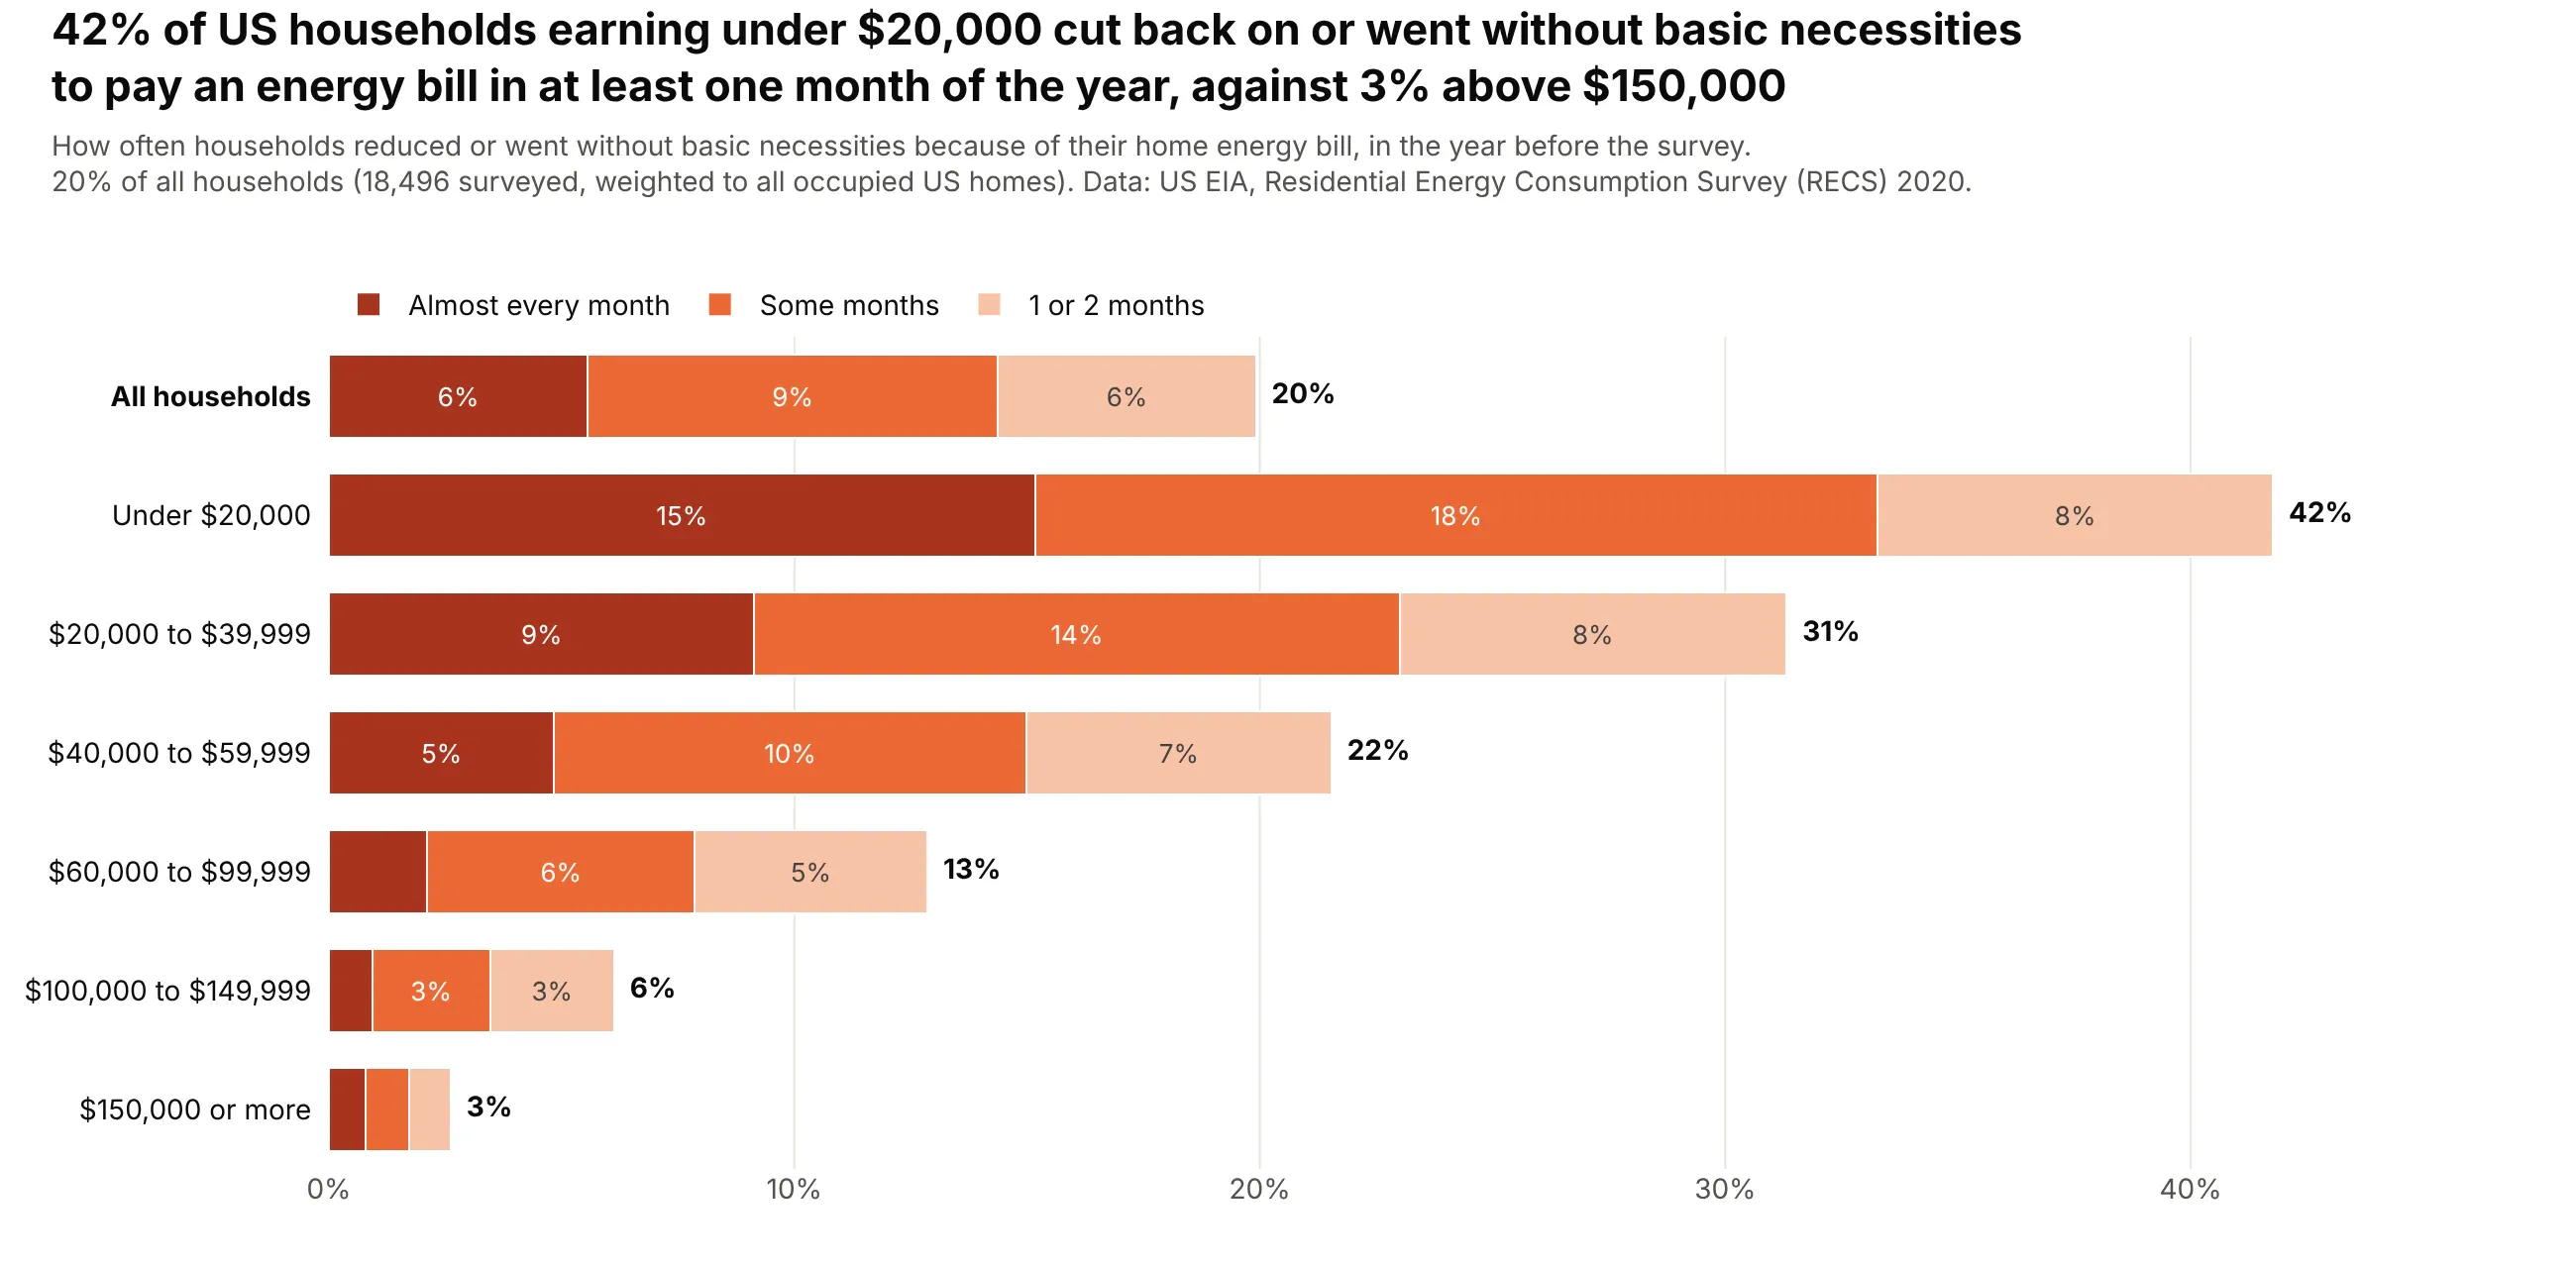
42% of households earning under $20,000 cut back on or went without basic necessities to pay an energy bill in at least one month of the year, against 3% above $150,000 and 20% of all households. Data: US EIA, Residential Energy Consumption Survey (RECS) 2020, weighted to all occupied US homes.
Tip: income bands keep their natural order instead of being sorted, so the steady drop reads as a trend.
Get the data from the US EIA's 2020 Residential Energy Consumption Survey public microdata(recs2020_public_v7.csv on eia.gov), variable SCALEB with weight NWEIGHT and income MONEYPYand shape it into a table(columns: group, almost_every_month, some_months, one_or_two_months, never, any, n;weighted percentages by six income bands plus all households).Make a plotly horizontal stacked bar chart of the hardship answers by income band.- Stack almost every month (darkest), some months and 1 or 2 months from zero in orange shades; leave out never.- Keep the income bands in order with "All households" on top in bold; print the total after each bar.- Write dollar signs as $ so plotly doesn't read them as LaTeX.
4. Renewables and energy security across the EU
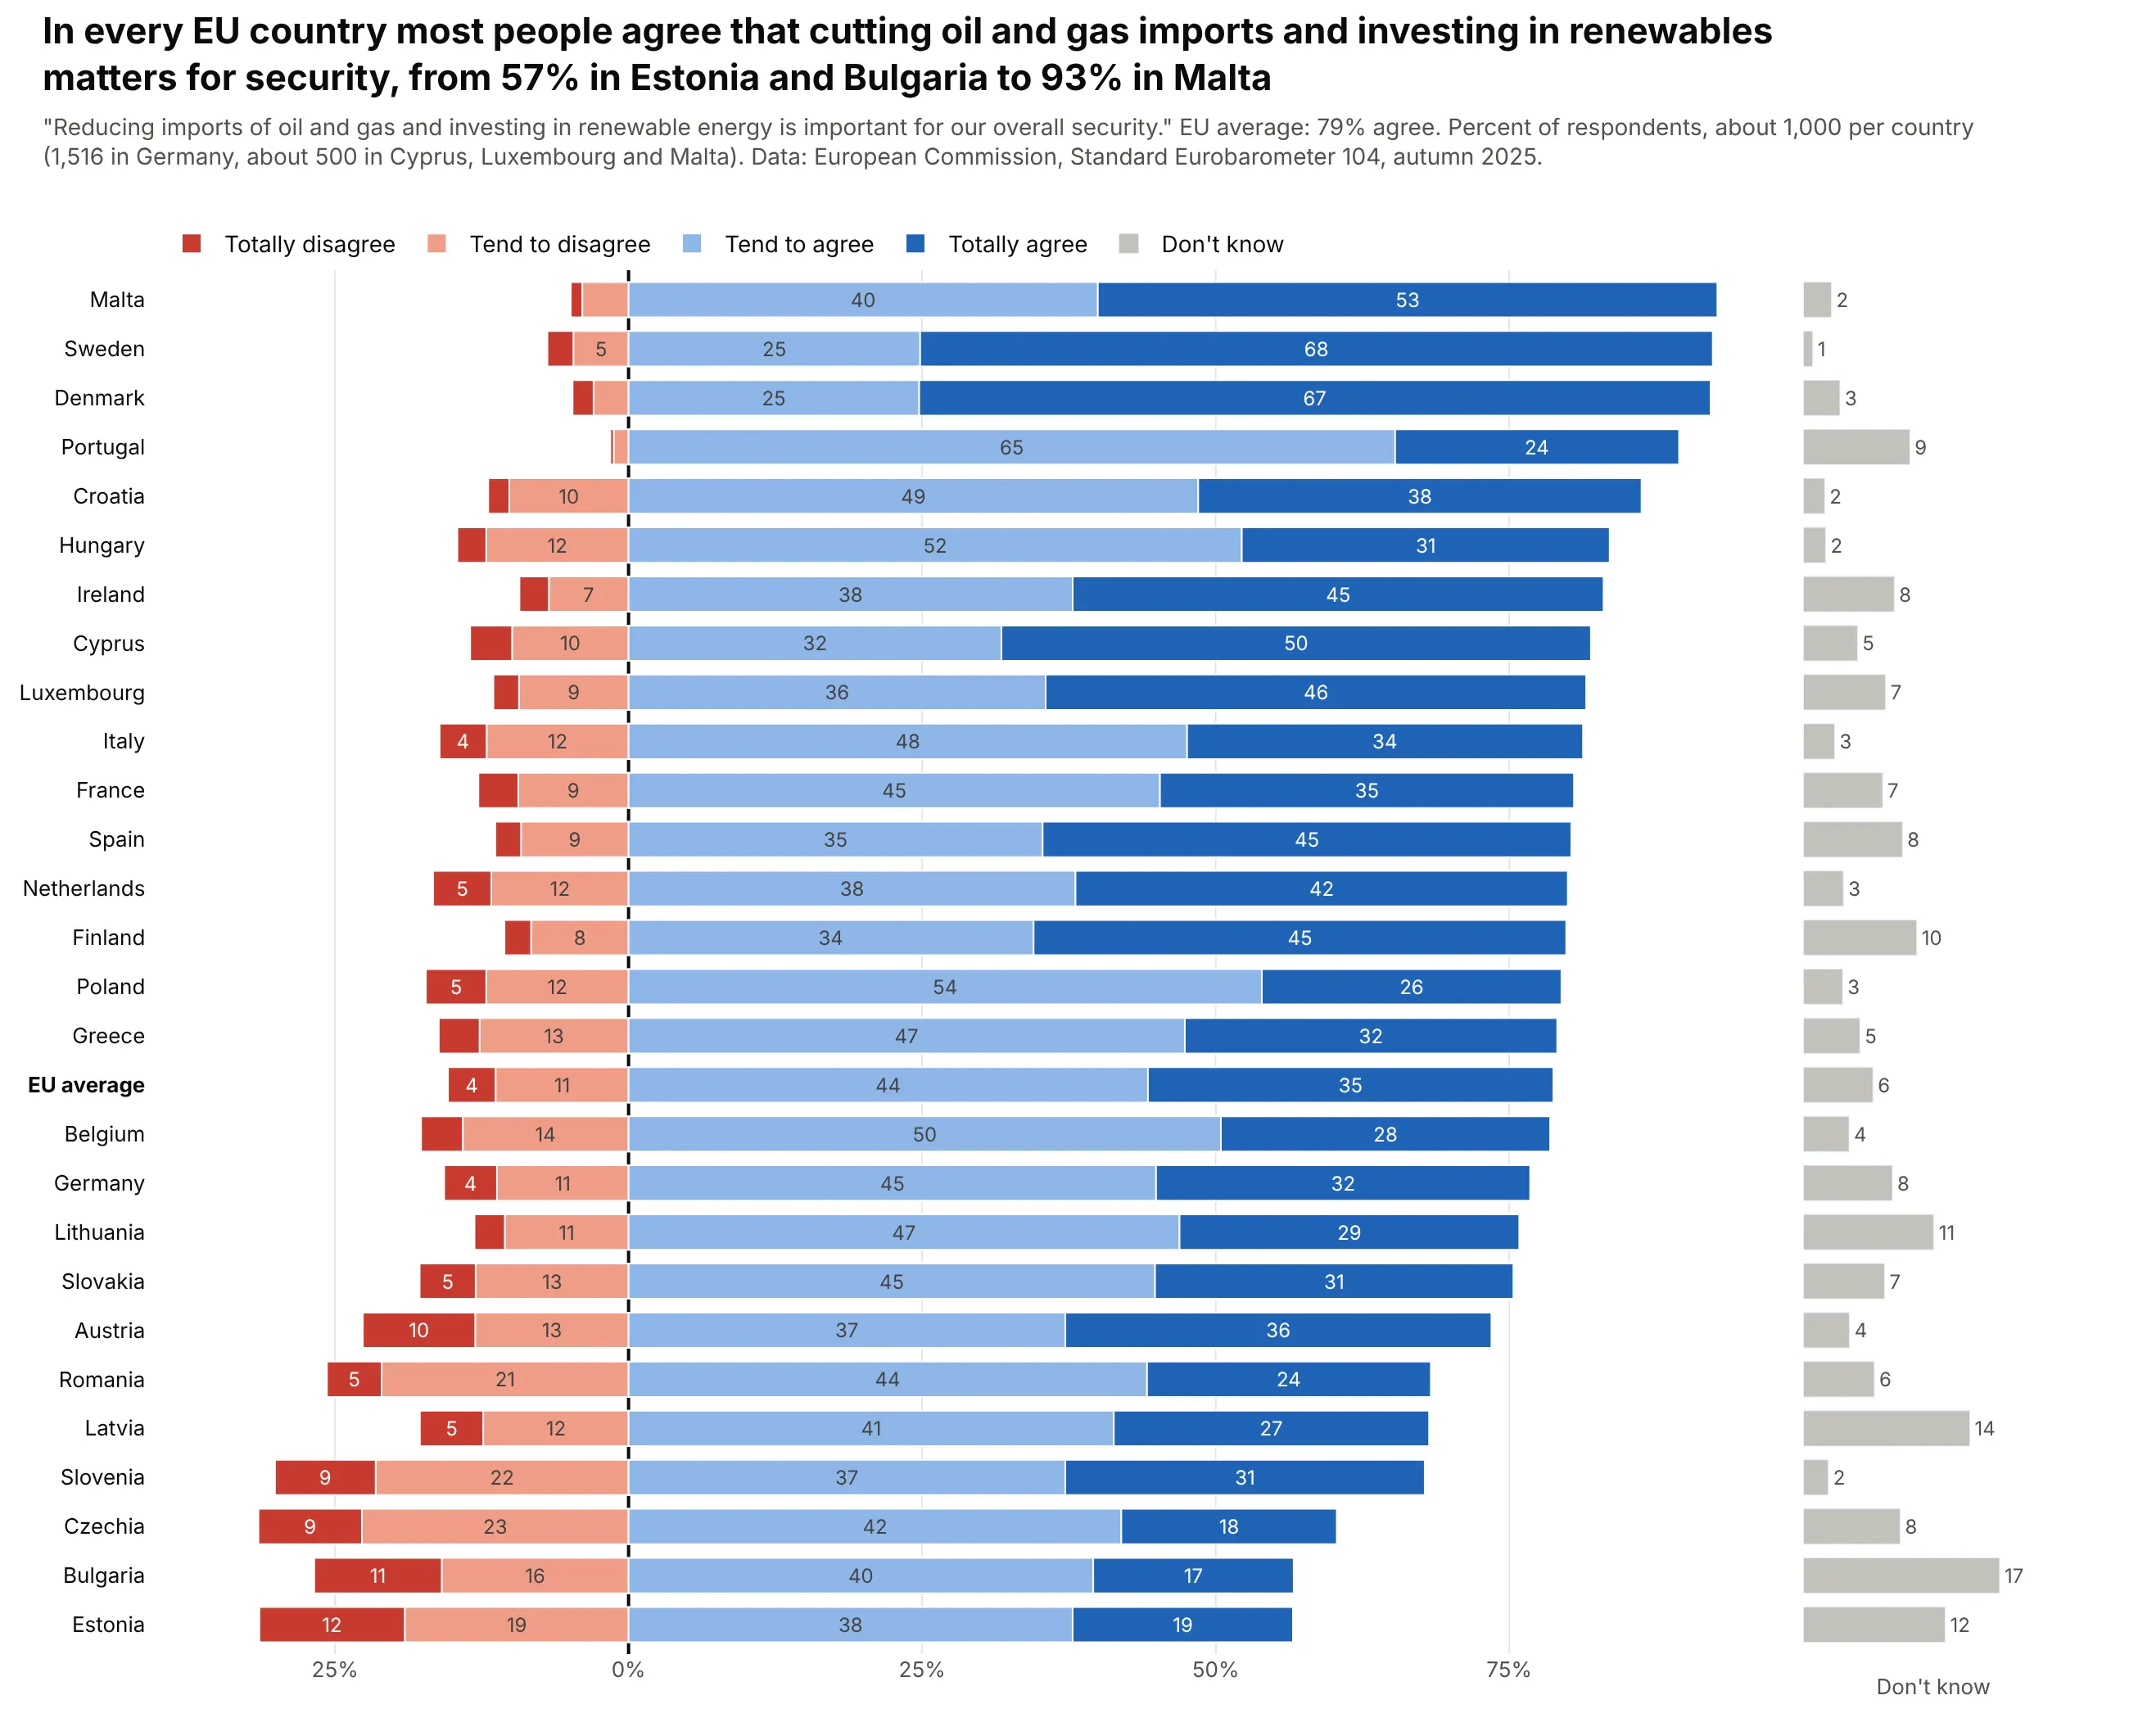
In every EU country most people agree that cutting oil and gas imports and investing in renewables matters for security, from 57% in Estonia and Bulgaria to 93% in Malta, and 79% across the EU. Data: European Commission, Standard Eurobarometer 104, autumn 2025.
Tip: "Don't know" isn't a point on the scale, so it gets its own narrow column with make_subplots(shared_yaxes=True) instead of shifting every bar.
Get the data from the European Commission's Standard Eurobarometer 104 (autumn 2025) country tables("volume AP" on data.europa.eu), question QD3.10and shape it into a table(columns: country, code, totally_agree, tend_agree, tend_disagree, totally_disagree, dont_know, n;percentages computed from the weighted counts, 27 member states plus the EU average).Make a plotly diverging stacked bar chart with a second, narrow panel for don't know.- Disagree answers left of zero, agree answers right; sort countries by total agreement.- Put "Don't know" in a gray column on the right with make_subplots(cols=2, shared_yaxes=True).- Bold the EU average row; label segments of 4 points or more.
5. Confidence in science by party, 1973 to 2024
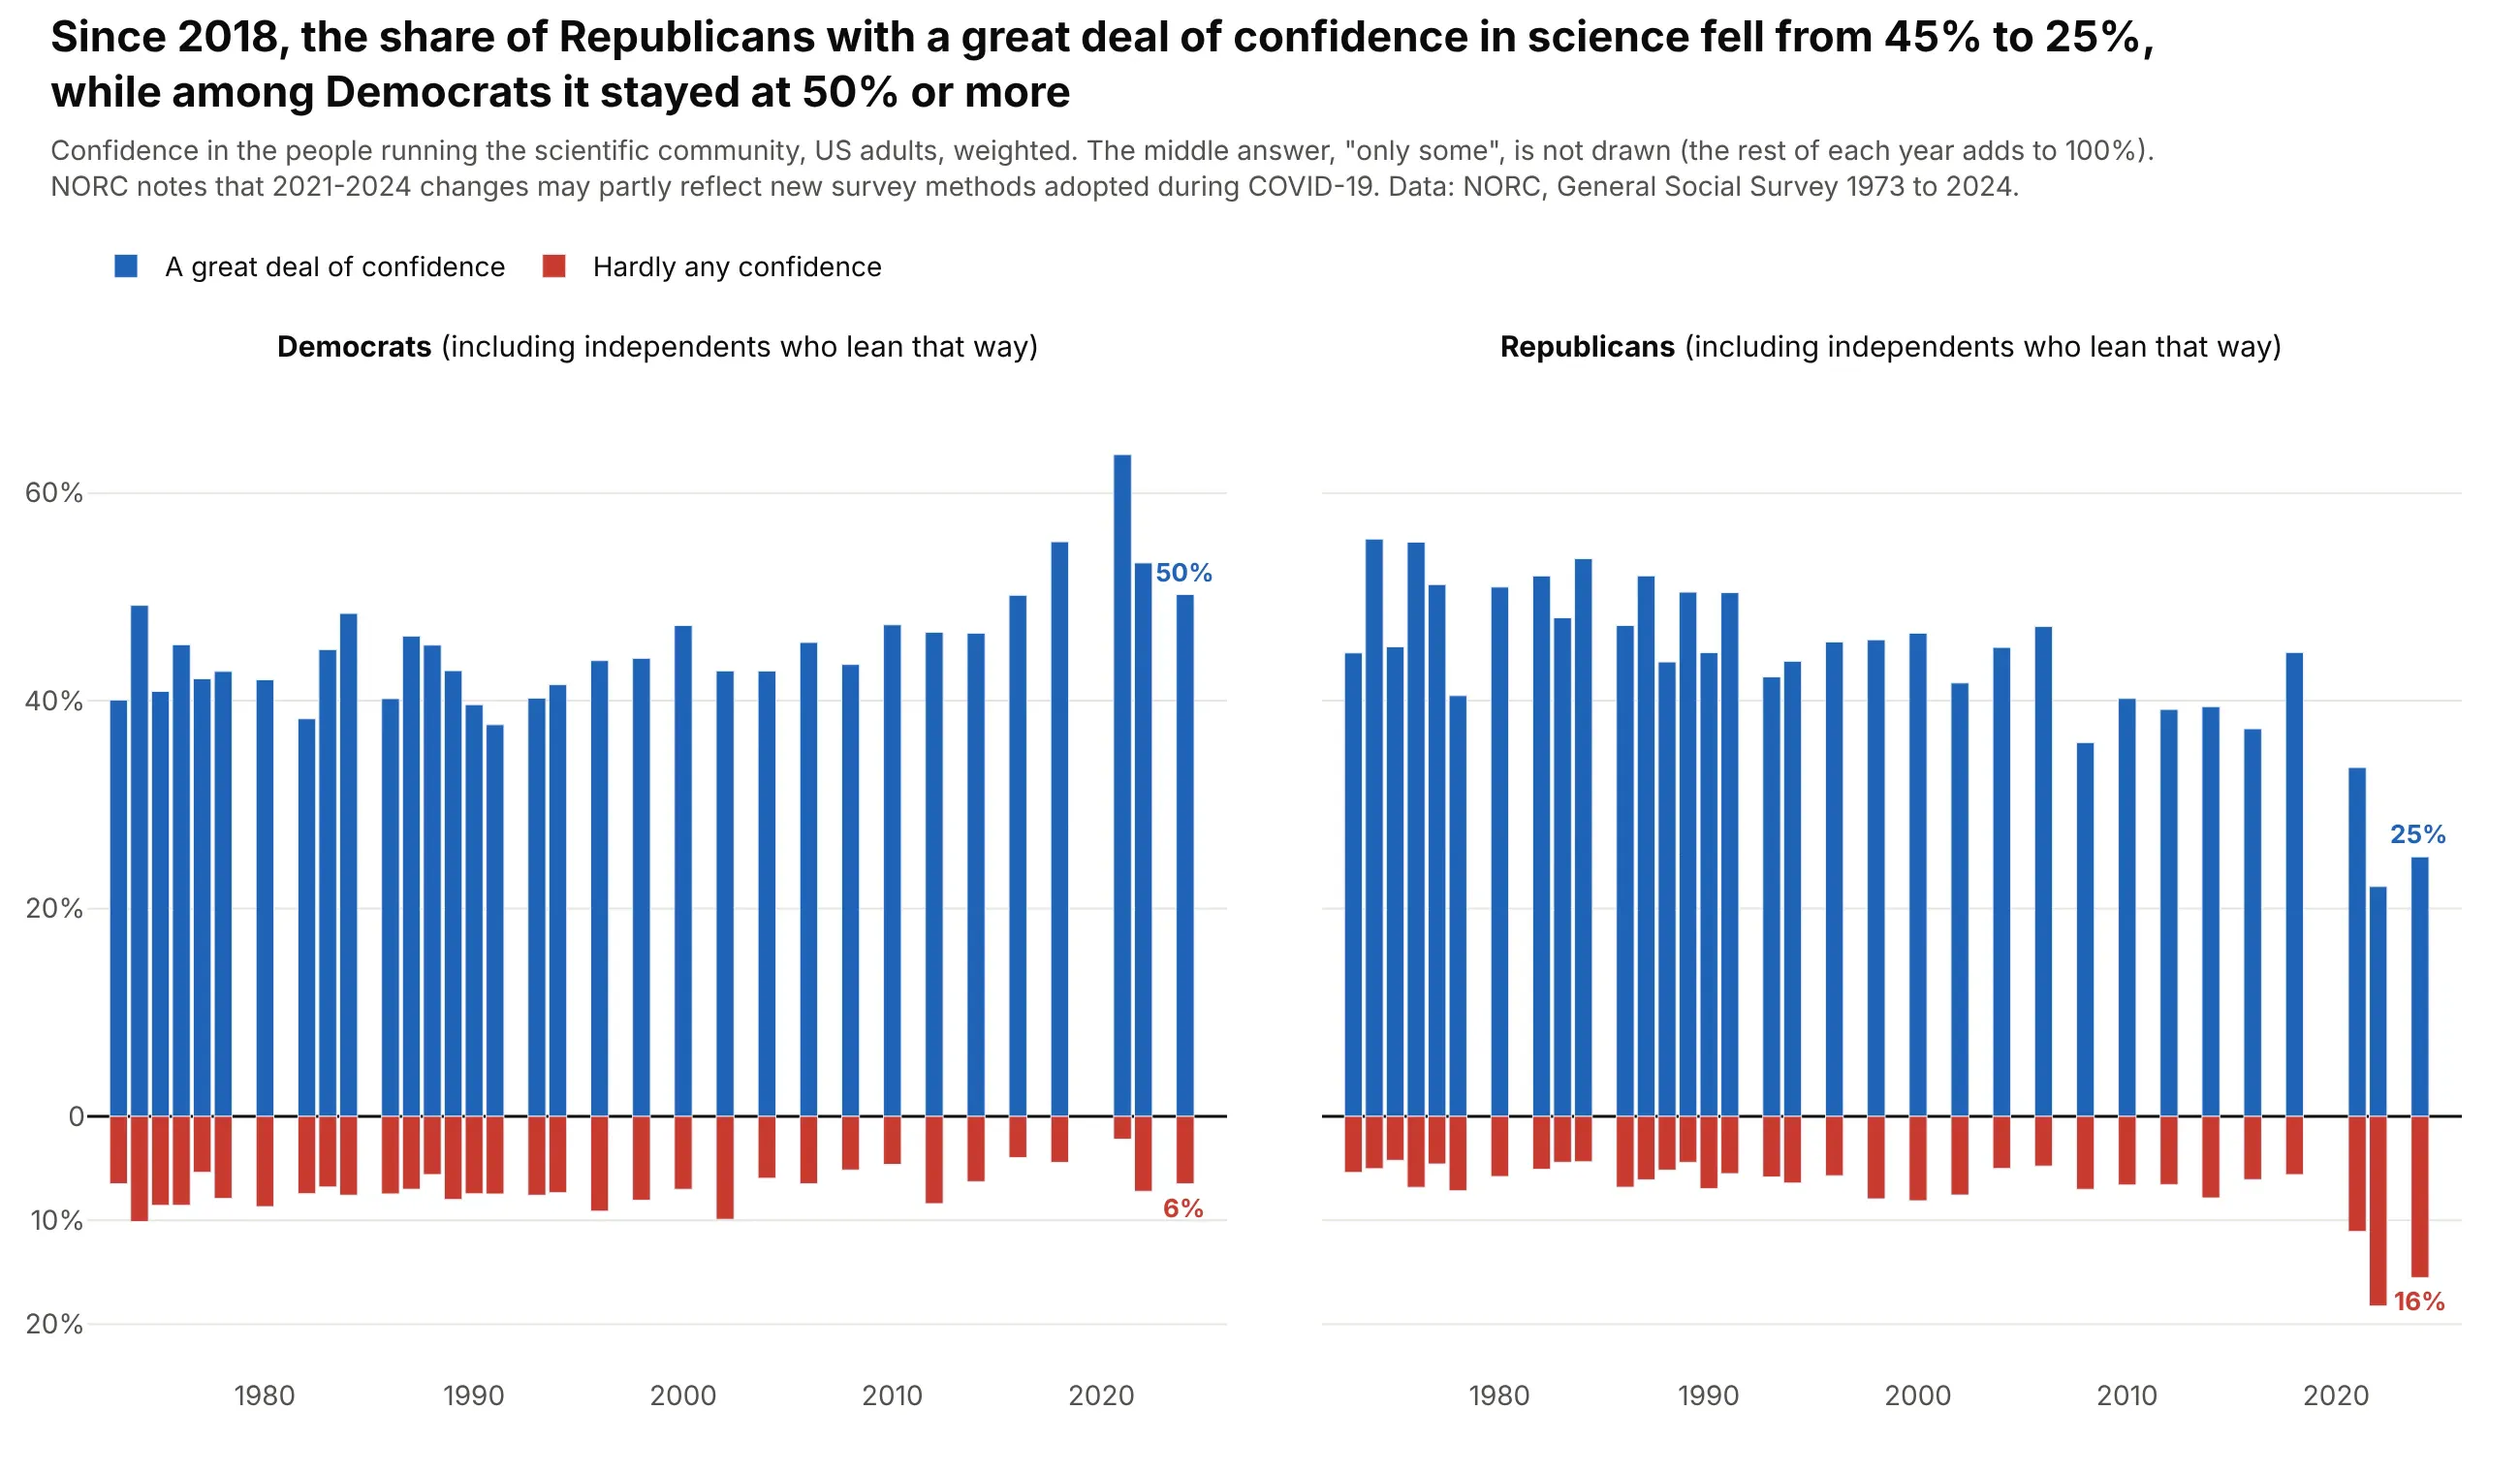
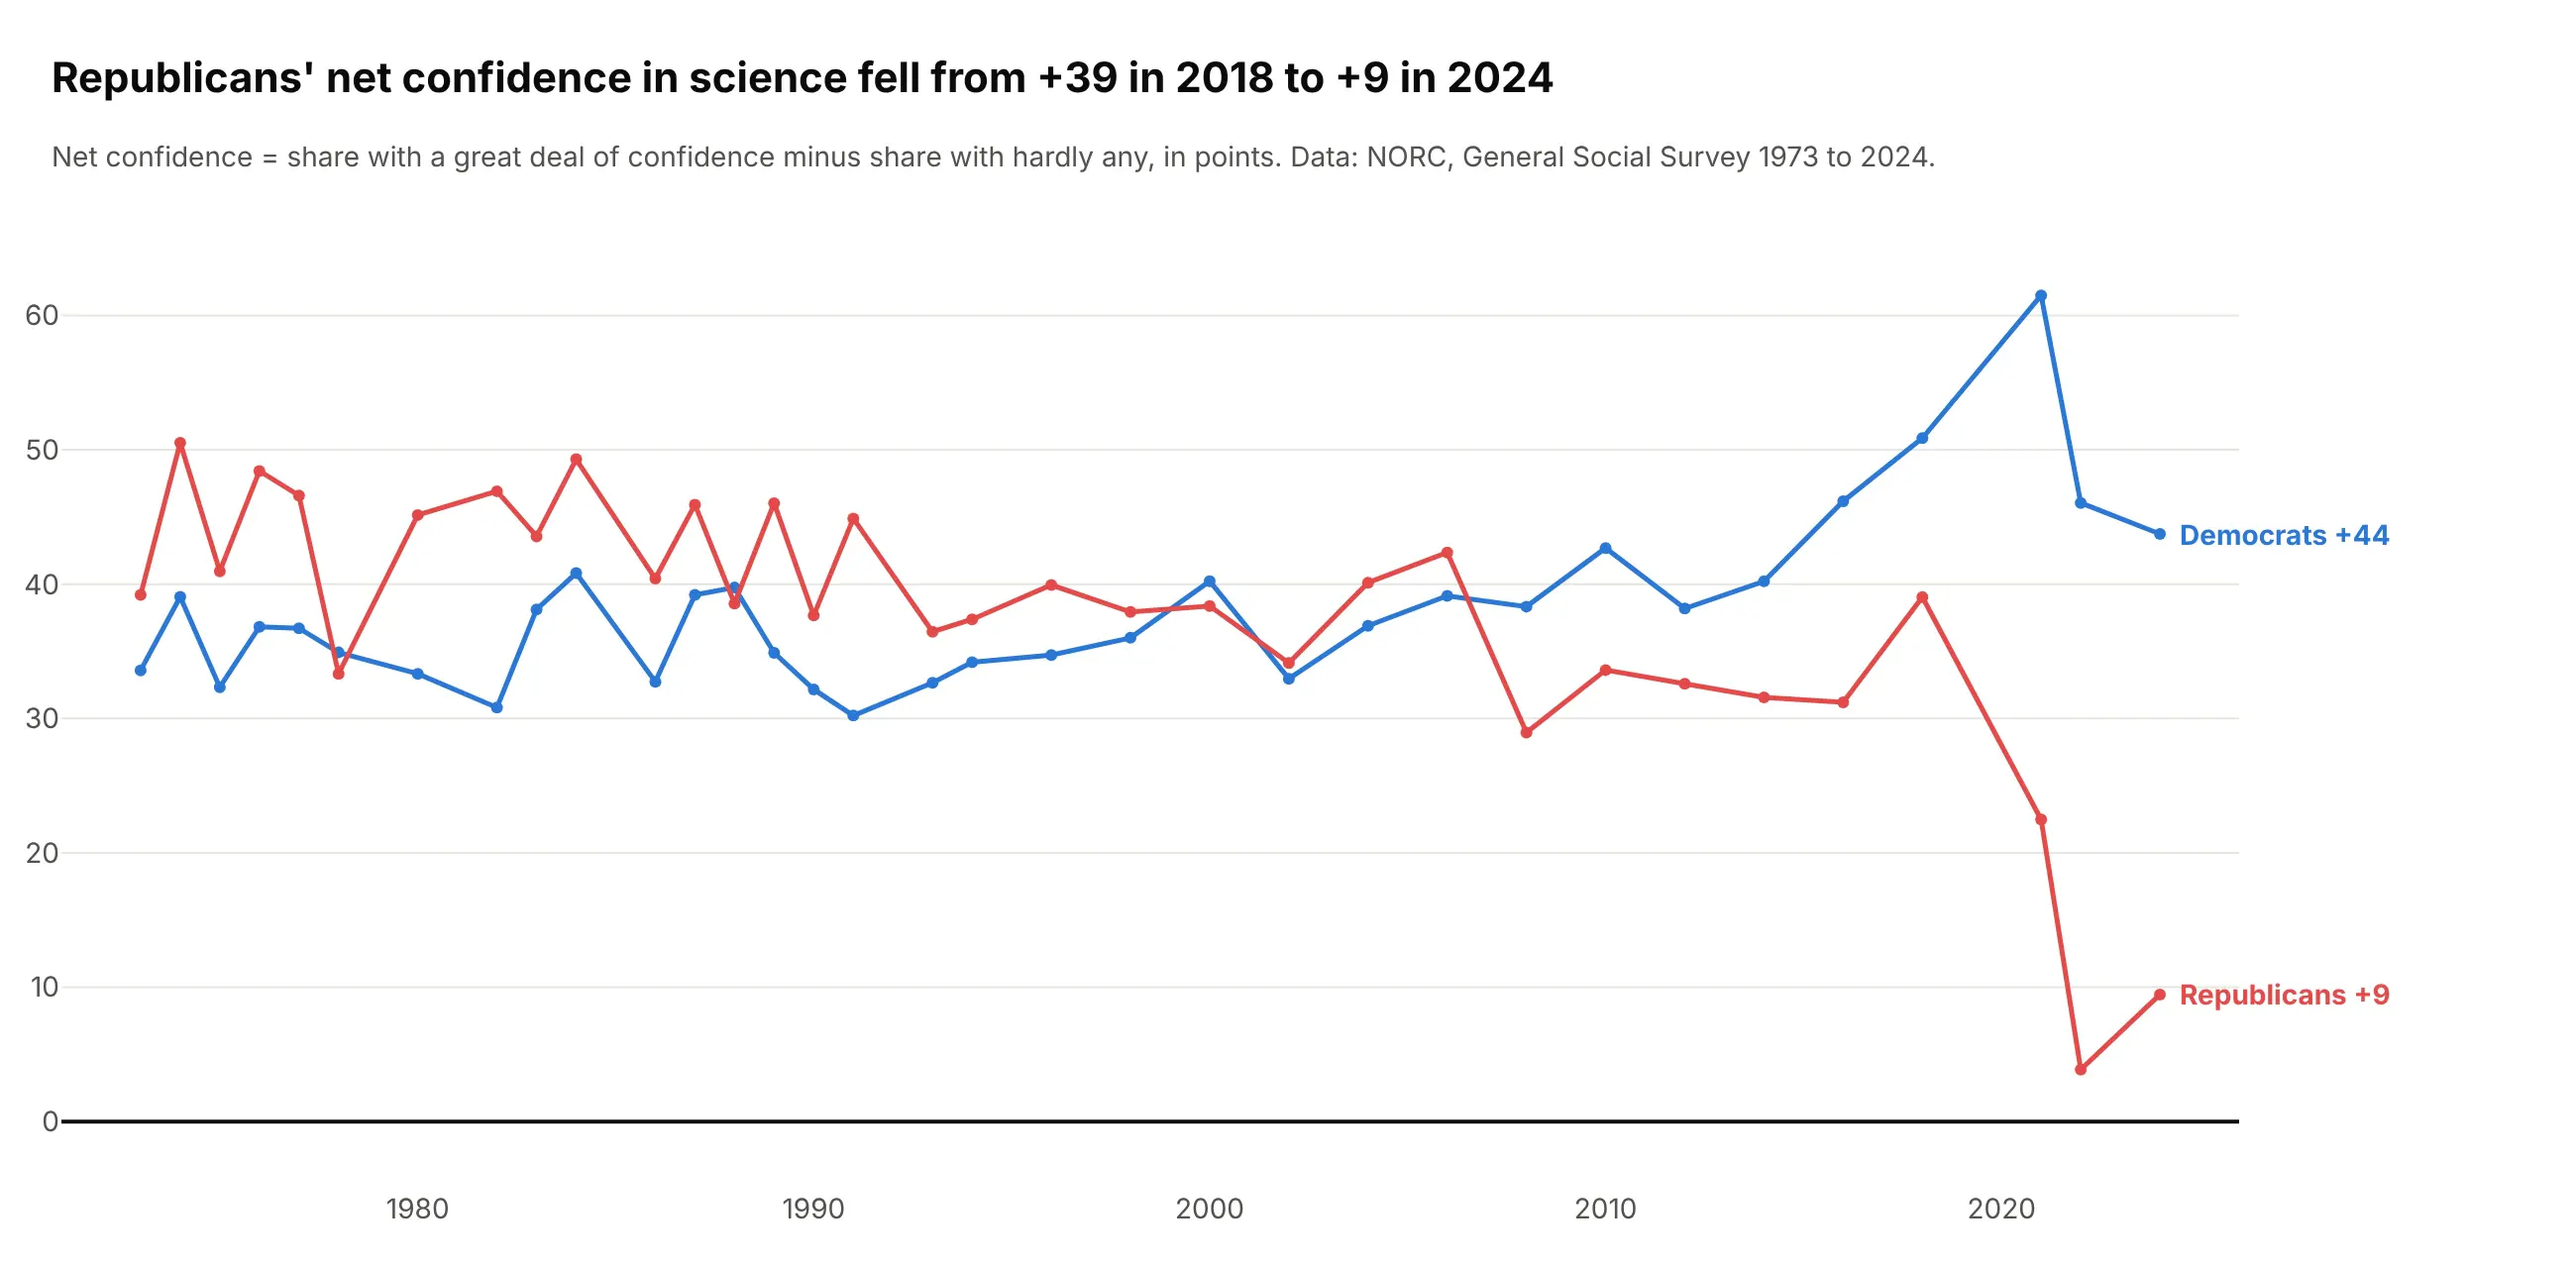
Since 2018, the share of Republicans with a great deal of confidence in the scientific community fell from 45% to 25%, while among Democrats it stayed at 50% or more. NORC notes that changes since 2021 may partly reflect new survey methods. Data: NORC, General Social Survey 1973 to 2024, weighted.
Tip: with time on the x-axis the bars turn vertical, and leaving out the middle answer (said in the subtitle) keeps 33 survey years readable.
Get the data from NORC's General Social Survey cumulative file 1972-2024 (GSS_stata.zip on gss.norc.org),variables consci, partyid and weight wtsspsand shape it into a table(columns: year, party, great_deal, only_some, hardly_any, n; weighted percentages, Democrats = partyid 0-2,Republicans = 4-6).Make a plotly figure with two panels, Democrats and Republicans, sharing the y-axis.- For each year, a blue bar up for a great deal and a red bar down for hardly any (barmode relative).- Label the 2024 values; say in the subtitle that "only some" is not drawn.
Another way to see it: a line of net confidence per party shows that Republicans were more confident than Democrats in most years until 2006, and fell from +39 in 2018 to +9 in 2024.
6. What Americans want the government to spend more on
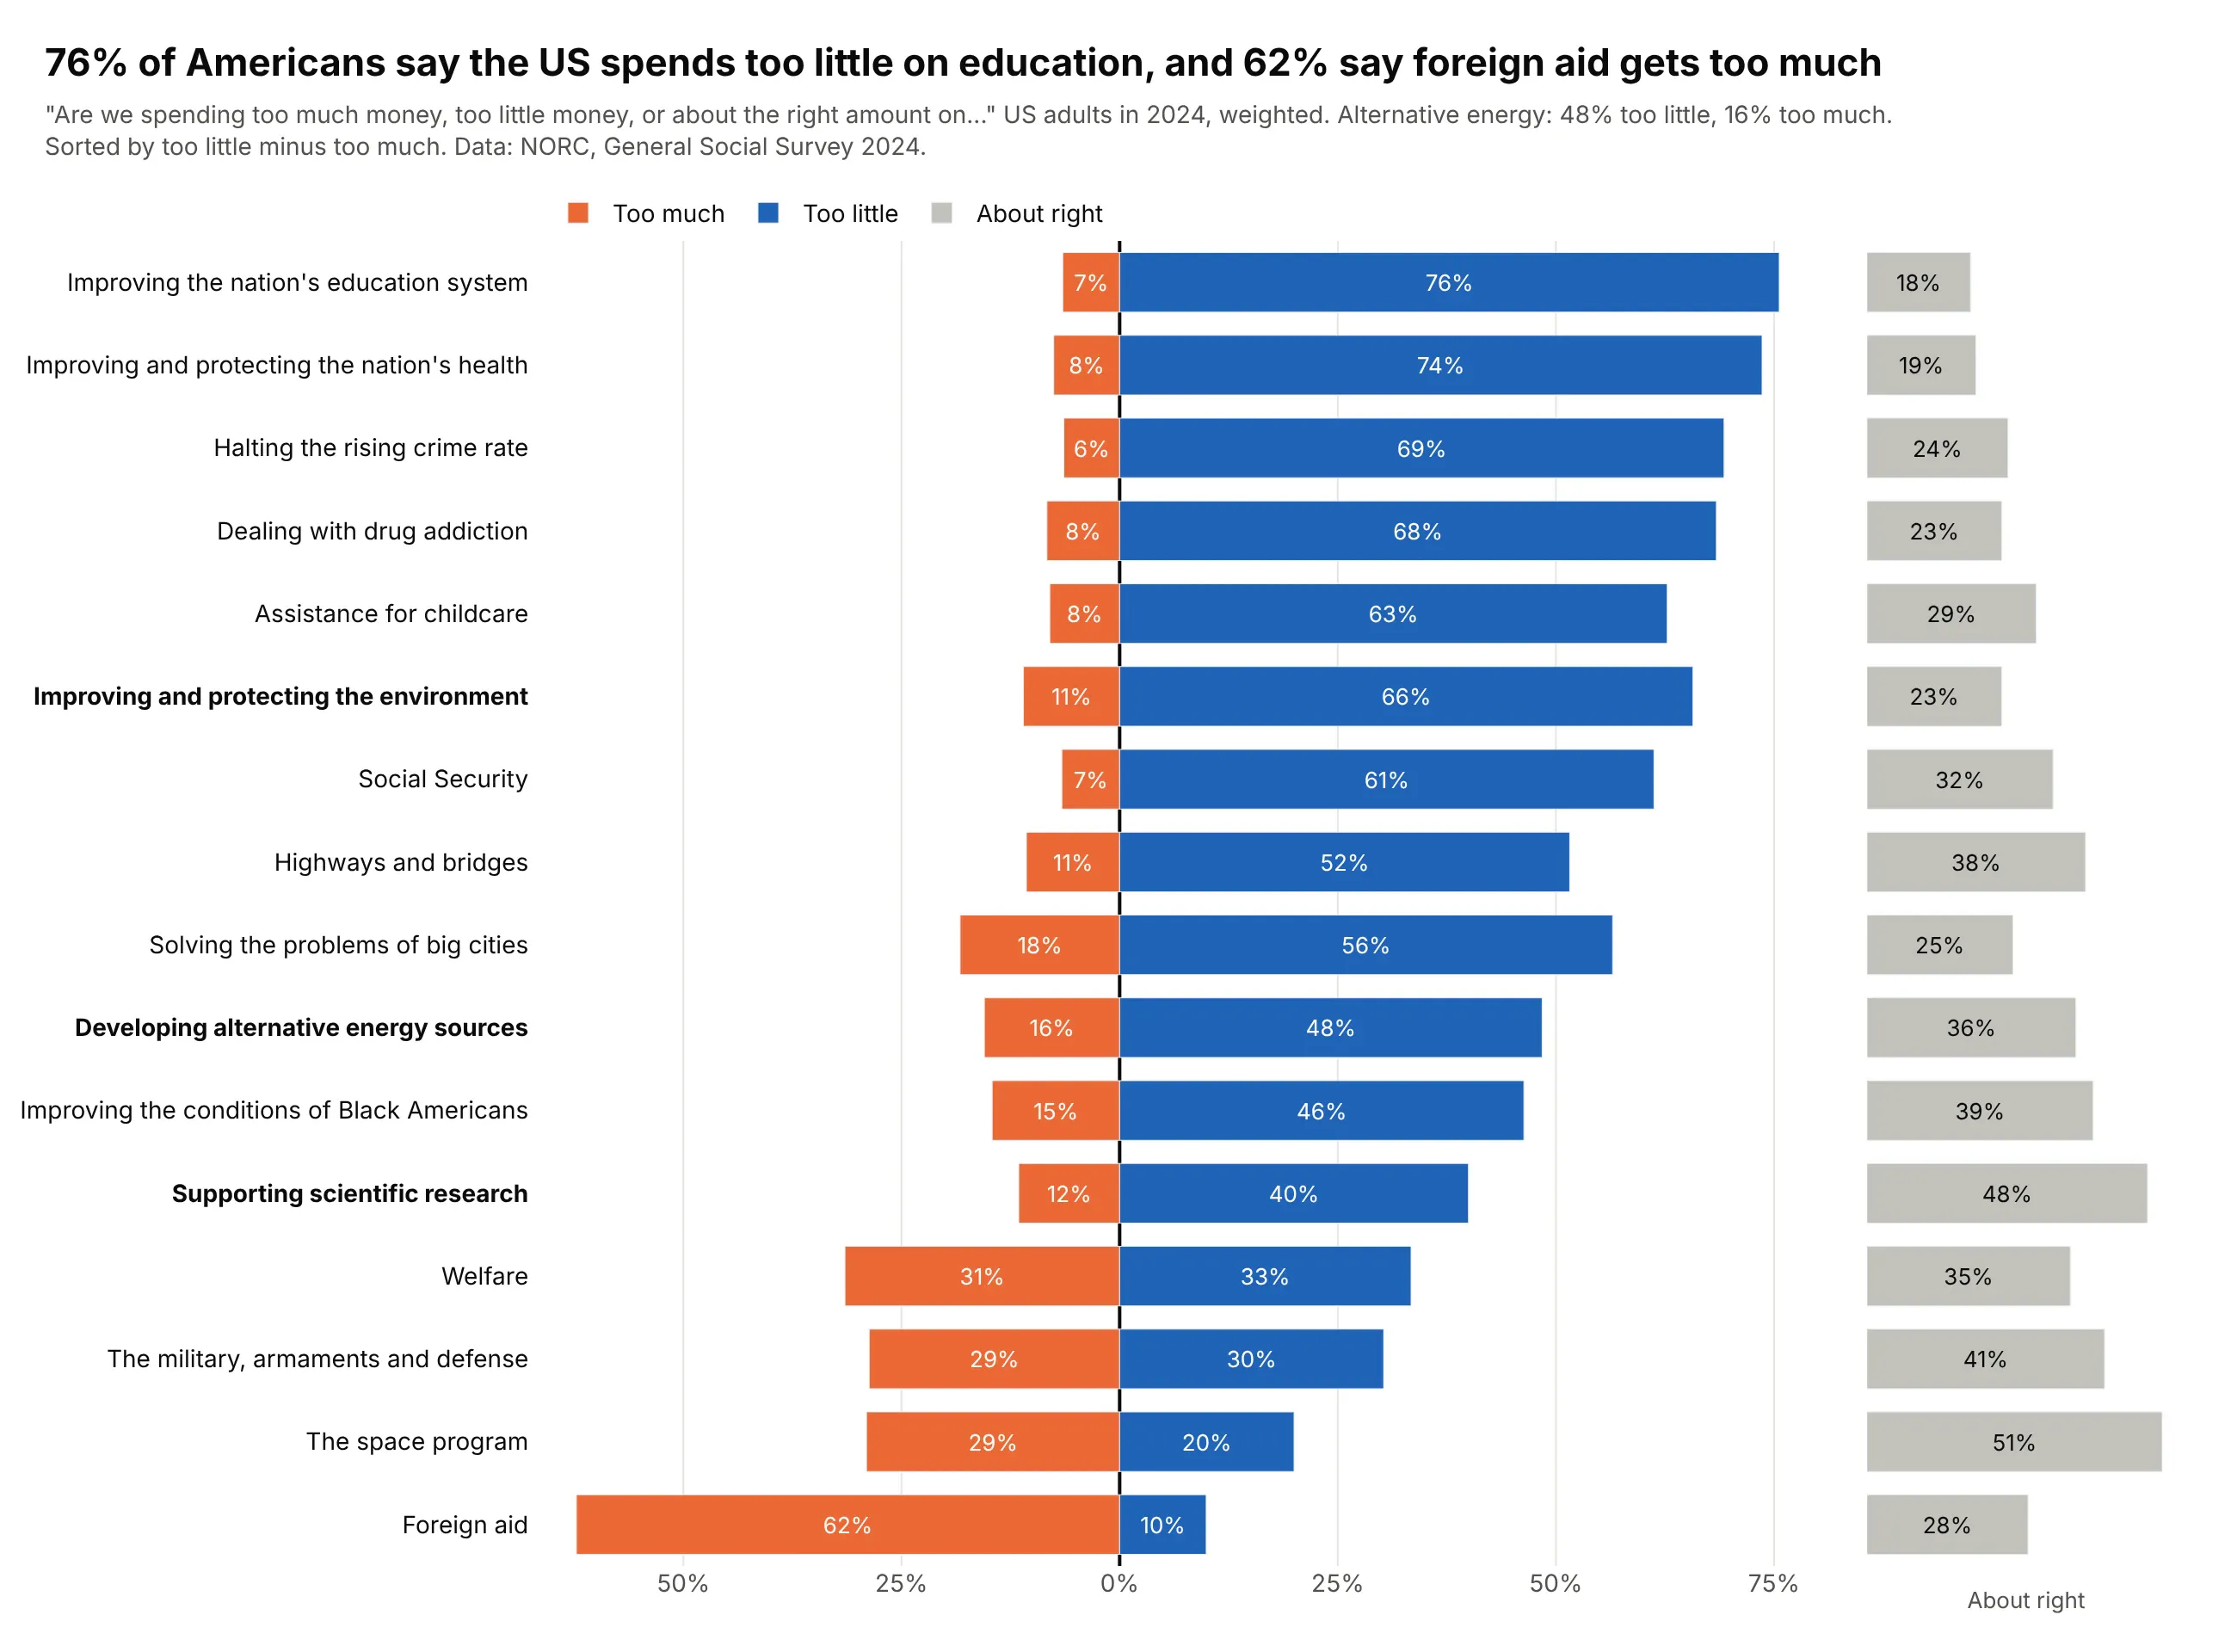
76% of Americans say the US spends too little on education and 62% say foreign aid gets too much, while developing alternative energy splits 48% too little and 16% too much. Data: NORC, General Social Survey 2024, weighted.
Tip: "About right" is a real opinion that ranges from 18% to 51% across items, so it gets its own column and the two sides start exactly at zero.
Get the data from NORC's General Social Survey cumulative file 1972-2024 (gss.norc.org), the 16 nat*spending items asked in 2024, weighted with wtsspsand shape it into a table(columns: item, too_little, about_right, too_much, n, net; weighted percentages).Make a plotly chart with two panels sharing the y-axis.- Left panel: too much left of zero in orange, too little right of zero in blue; sort by too little minus too much.- Right panel: about right as gray bars.- Bold the energy, environment and science rows.
7. How New Yorkers rate the handling of their 311 requests
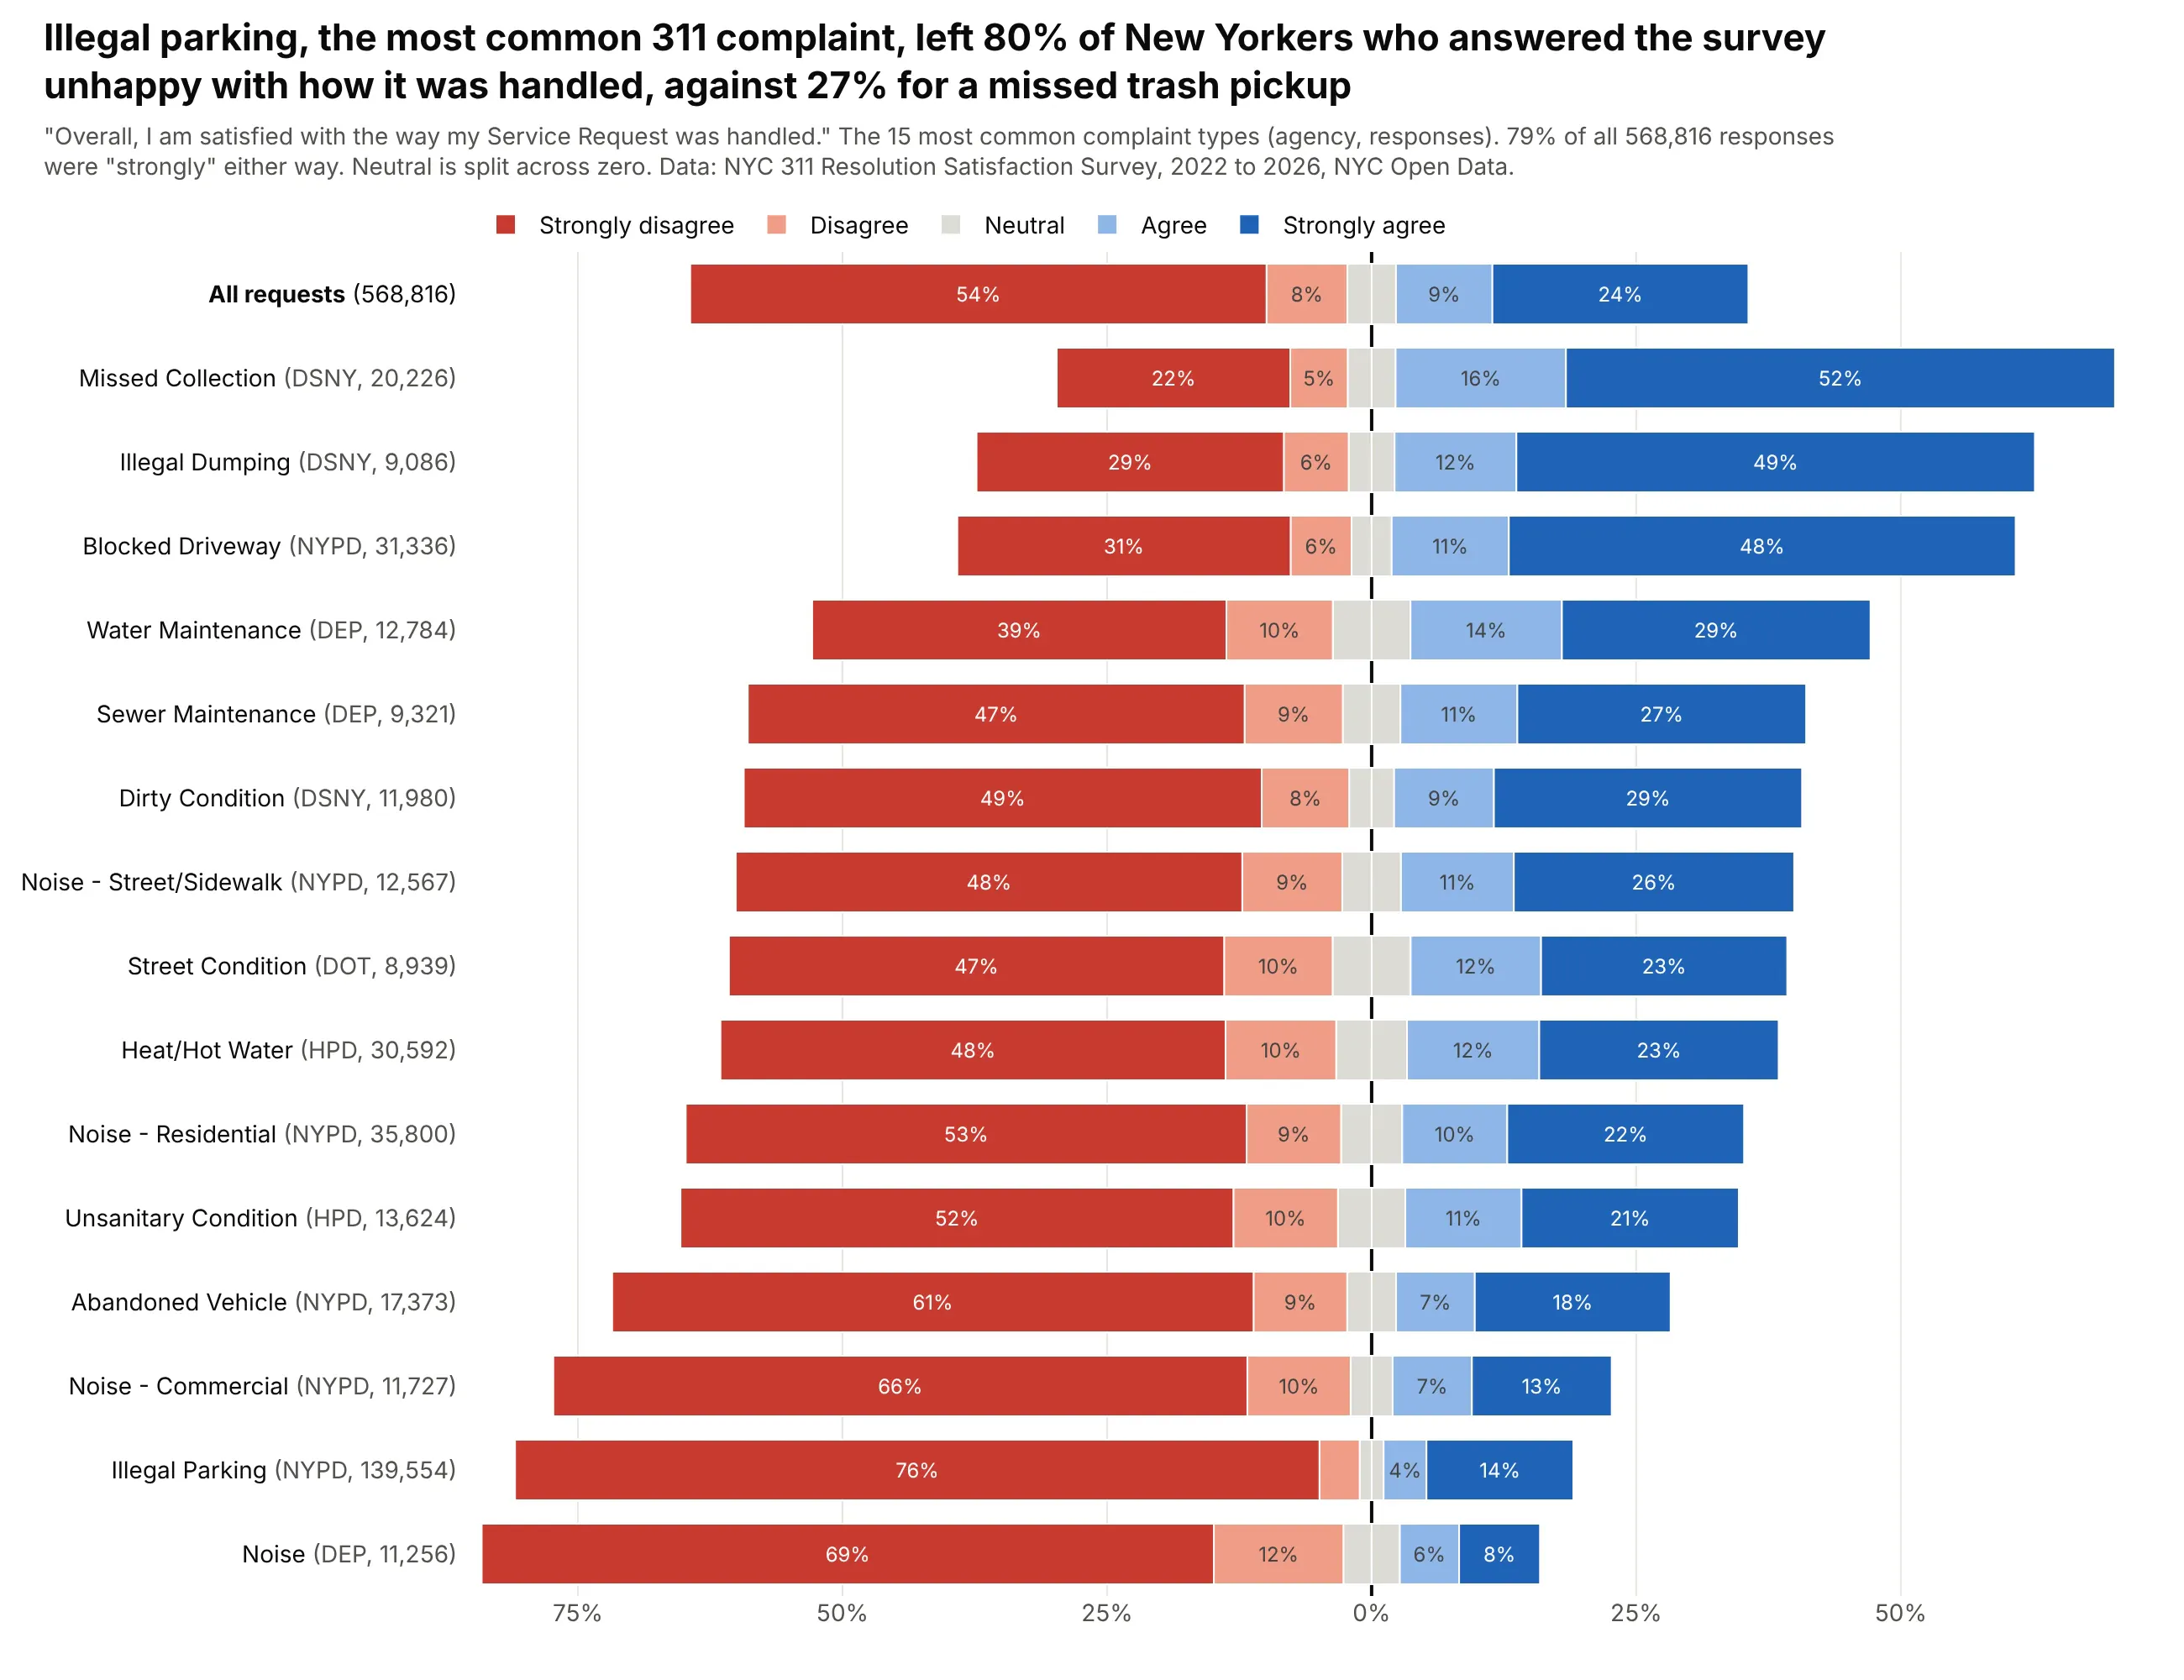
Illegal parking, the most common 311 complaint, left 80% of the New Yorkers who answered unhappy with how it was handled, against 27% for a missed trash pickup. Across all 568,816 responses, 79% picked one of the two extreme answers. Data: NYC 311 Resolution Satisfaction Survey, 2022 to 2026, NYC Open Data.
Tip: a single Socrata API query groups the half-million responses on the server, so the chart is built from 80 rows of counts.
Get the data from the NYC 311 Resolution Satisfaction Survey (NYC Open Data dataset 5ijn-vbdv), grouped on theserver with $select=complaint_type,agency,overall_satisfaction,count(*)and shape it into a table(columns: complaint_type, agency, strongly_disagree, disagree, neutral, agree, strongly_agree, n;percentages per complaint type for the 15 most common types, plus "All requests").Make a plotly diverging stacked bar chart, one row per complaint type, sorted by net satisfaction.- Neutral split across zero; put the agency and number of responses in gray in each row label.- "All requests" on top in bold.
8. Which work AI made more satisfying for developers
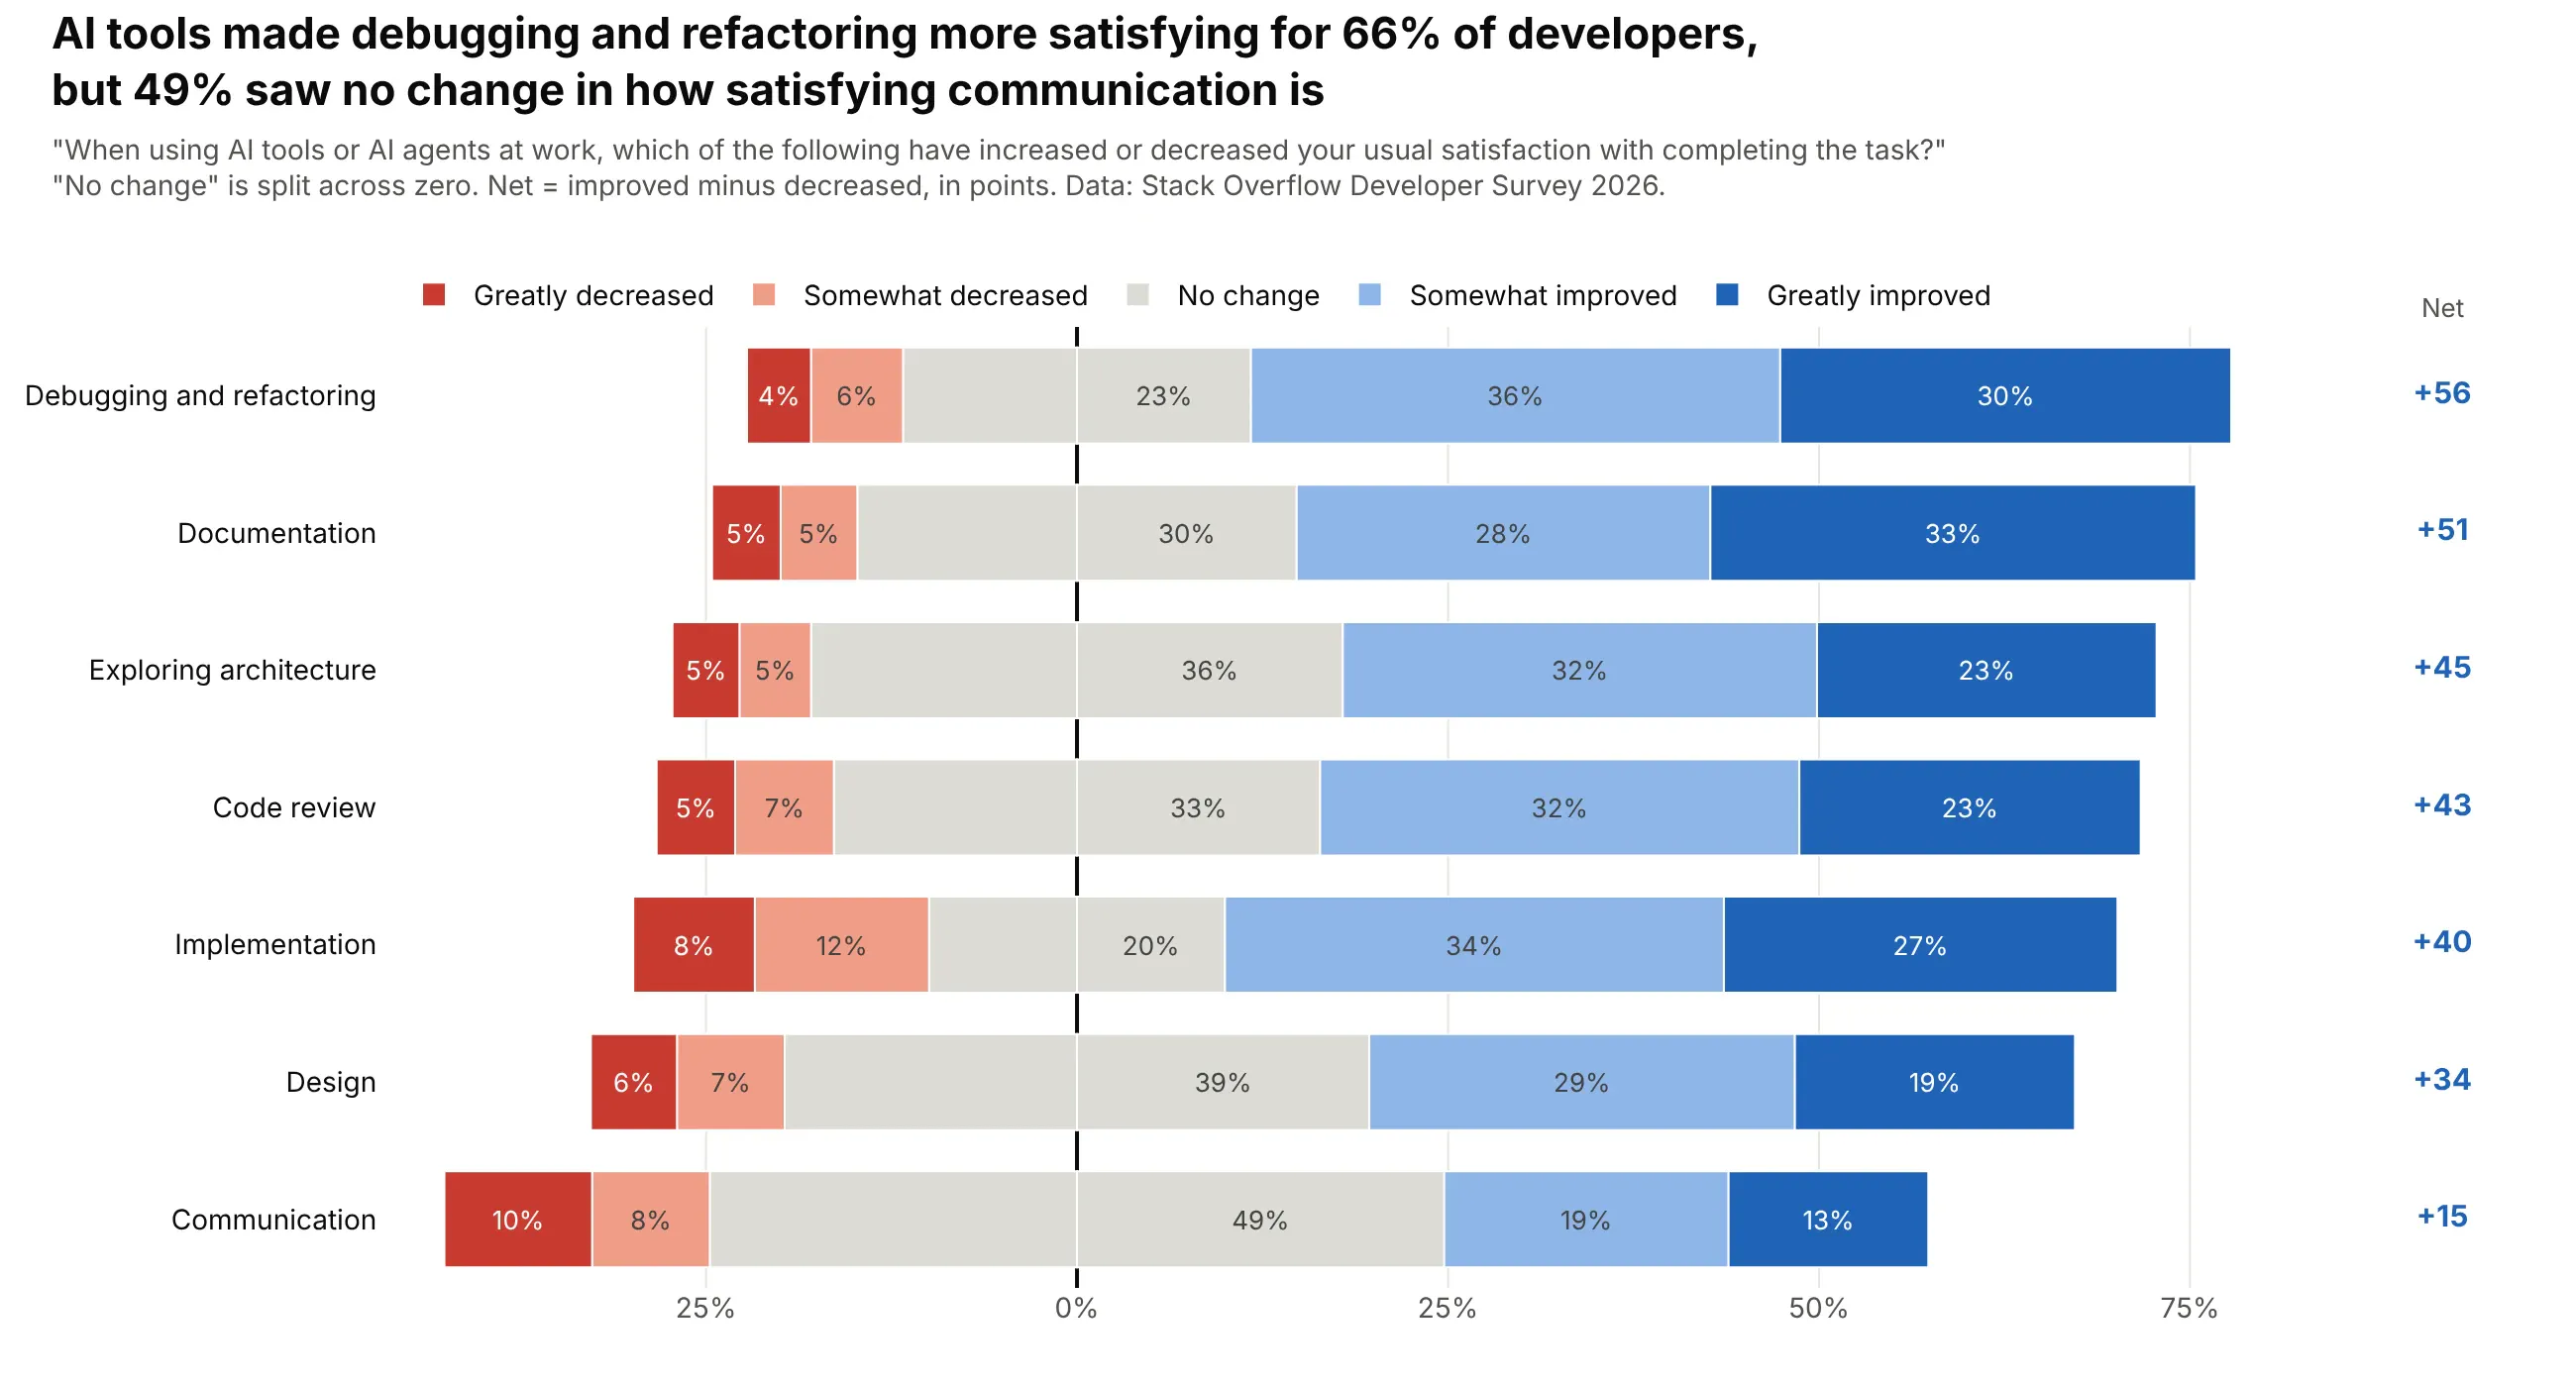
AI tools made debugging and refactoring more satisfying for 66% of developers, but 49% saw no change in how satisfying communication is, and every task has a positive net score, from +56 to +15. Data: Stack Overflow Developer Survey 2026.
Tip: a net score printed in its own column ranks the rows without making the reader subtract.
Get the data from the Stack Overflow Developer Survey 2026 public results (survey_results_public.csv,linked from survey.stackoverflow.co), columns AISat_1 to AISat_7and shape it into a table(columns: task, greatly_decreased, somewhat_decreased, no_change, somewhat_improved, greatly_improved, n, net;shares of developers who answered for each task).Make a plotly diverging stacked bar chart, one row per task, sorted by net (improved minus decreased).- No change split across zero in gray; print the net score in a column right of the bars.
9. Job satisfaction on a 0 to 10 scale
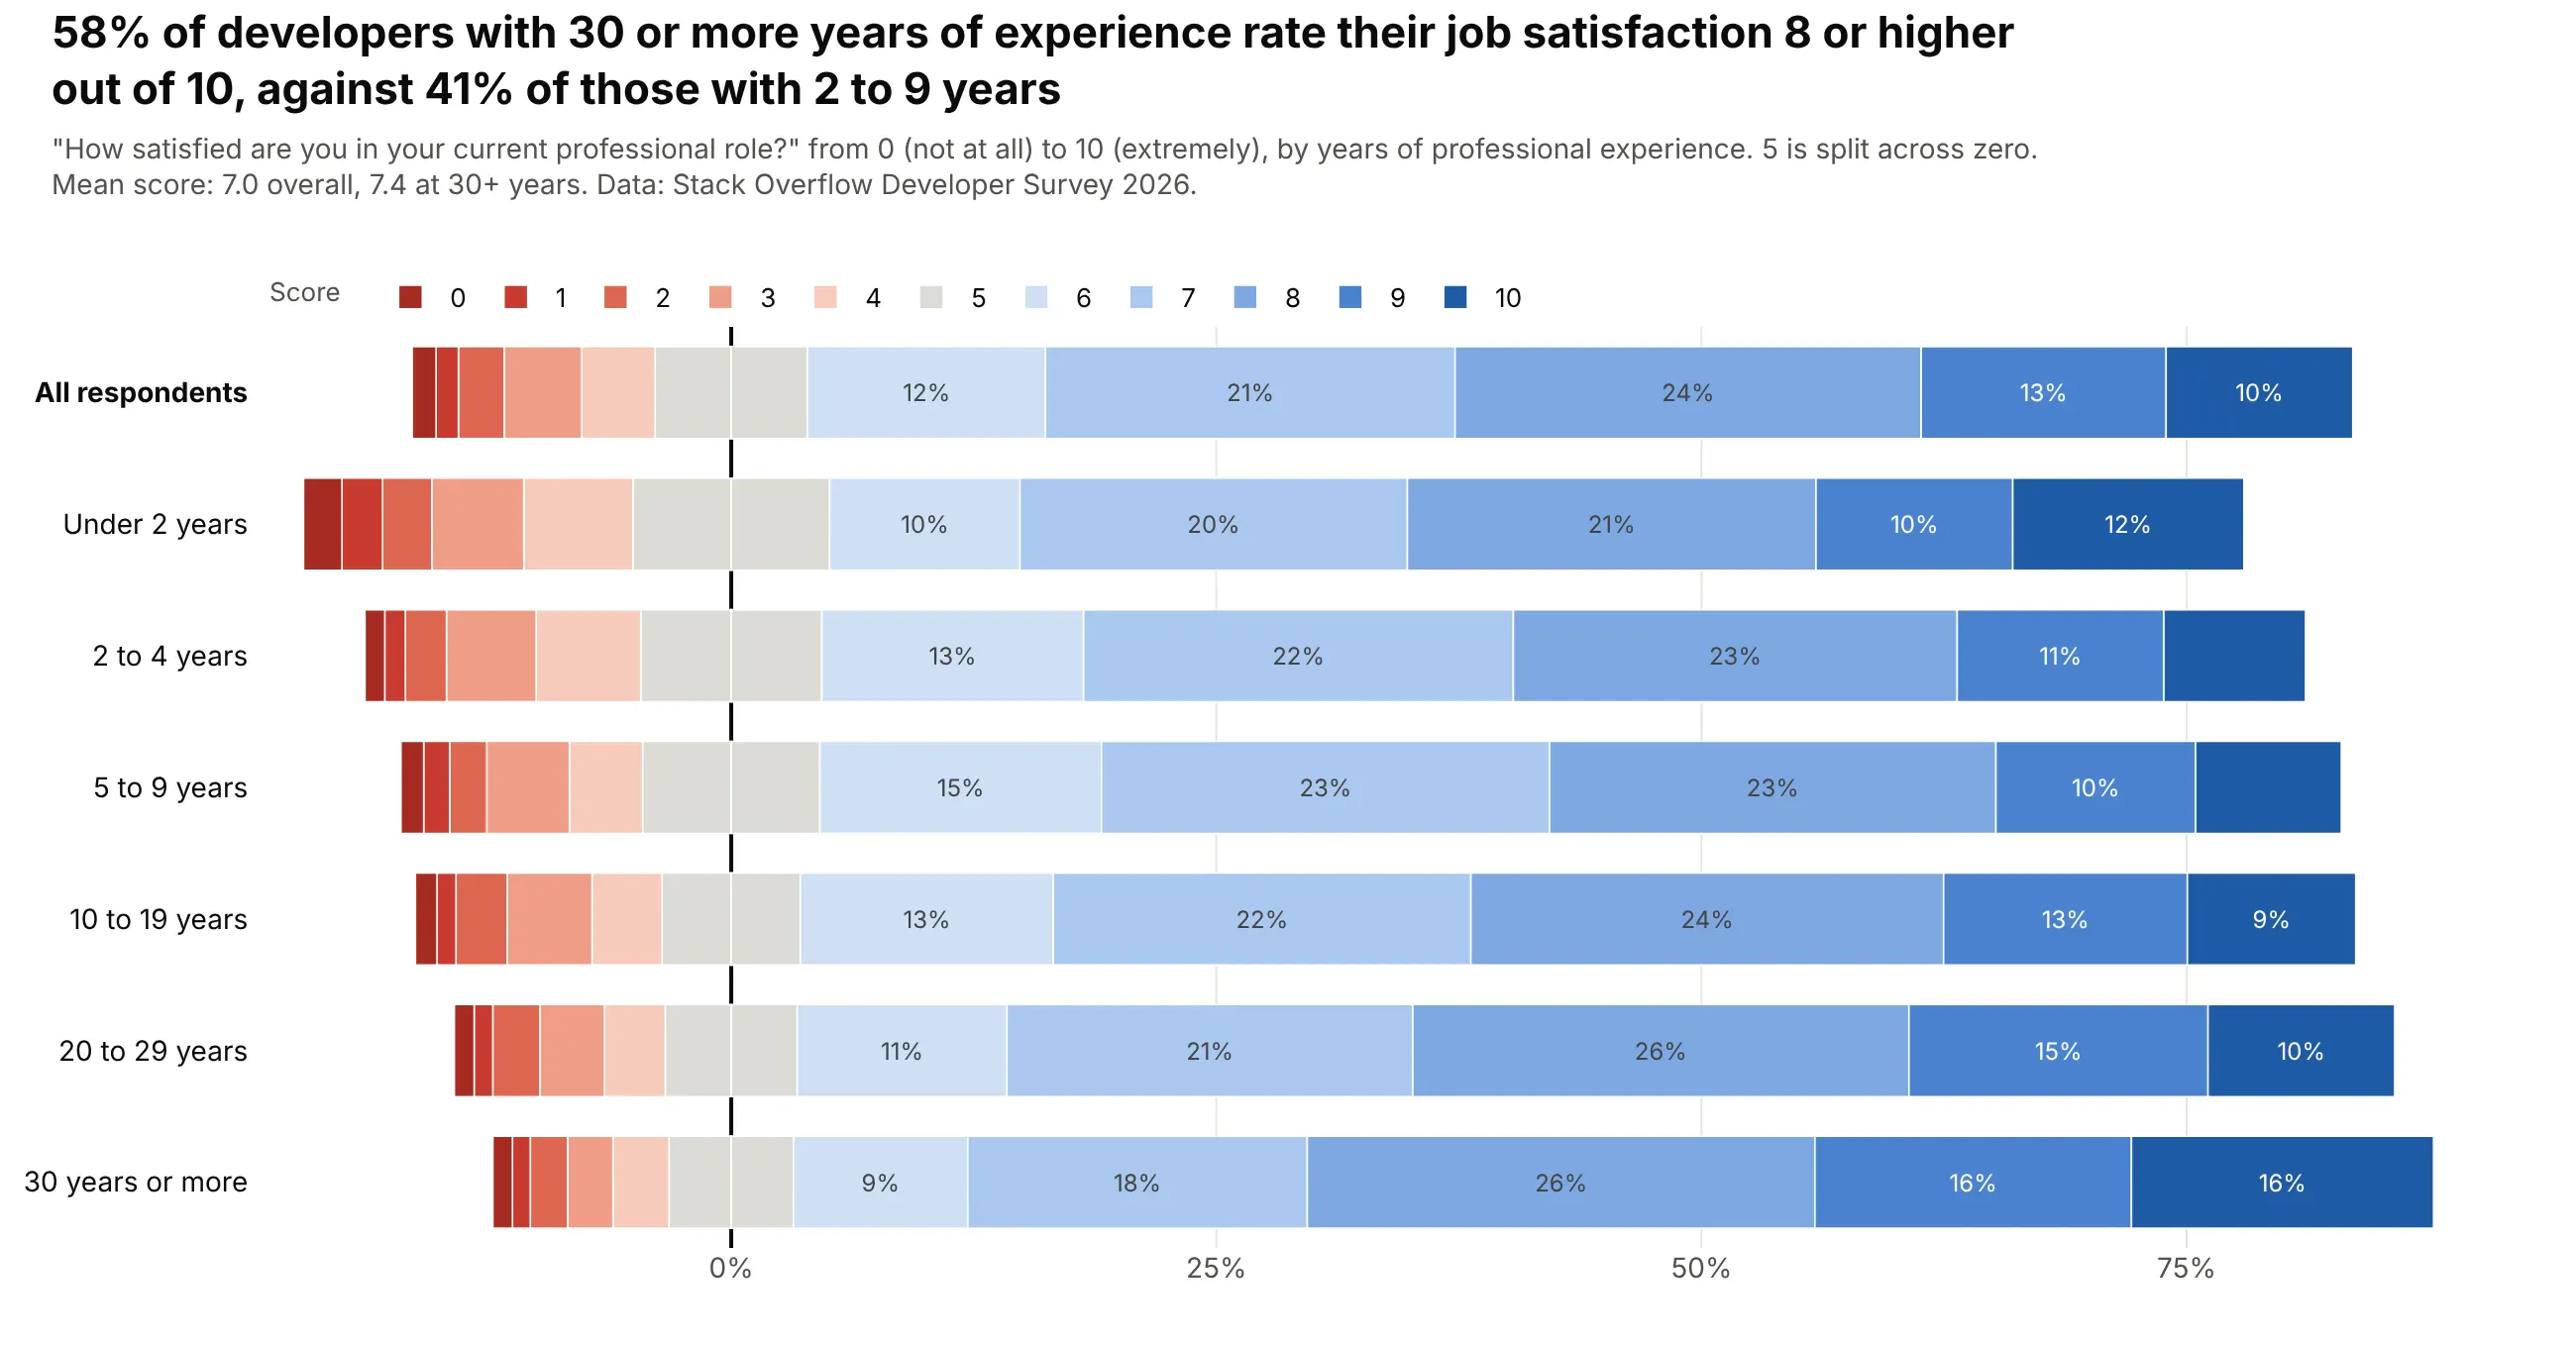
58% of developers with 30 or more years of experience rate their job satisfaction 8 or higher out of 10, against 41% of those with 2 to 9 years. Data: Stack Overflow Developer Survey 2026.
Tip: an 11-point scale is still a Likert scale: 5 is the neutral, and an 11-step palette with a gray middle keeps the order readable.
Get the data from the Stack Overflow Developer Survey 2026 public results (survey.stackoverflow.co),columns JobSat (0-10) and WorkExp (years)and shape it into a table(columns: group, s0 ... s10, n, mean, high_8_10; percent giving each score, by six experience bands plus all respondents).Make a plotly diverging stacked bar chart: scores 0-4 left of zero, 5 split across zero, 6-10 right.- An 11-step palette from dark red through gray to dark blue; label only segments of 8% or more.- Keep the experience bands in order with "All respondents" on top.