
Chris Parmer
November 9, 2026
Packed Bubble Charts - A Complete Guide
TL;DR
- A packed bubble chart draws each item as a circle whose area is its value and packs the circles together without axes, so it shows which items are big and how many small ones there are, but not exact values.
- Packed bubble charts are also known as packed bubbles and circle packing, and when circles nest inside group circles, as circular treemaps. They are similar to bubble charts, treemaps and sunburst charts.
- Size circles by area, not radius: a value 13 times bigger should look 13 times bigger, not 170 times.
- Use one for an overview of many parts (a budget, a stock index, a code base) where precise comparison doesn't matter, and a sorted bar chart when it does.
- You can make a packed bubble chart with Plotly in Python or JavaScript: a short packing function (or d3.packSiblings in JavaScript) places the circles, and layout shapes with type="circle" draw them at their exact size.
What is a packed bubble chart?
Packed bubble charts look like this:
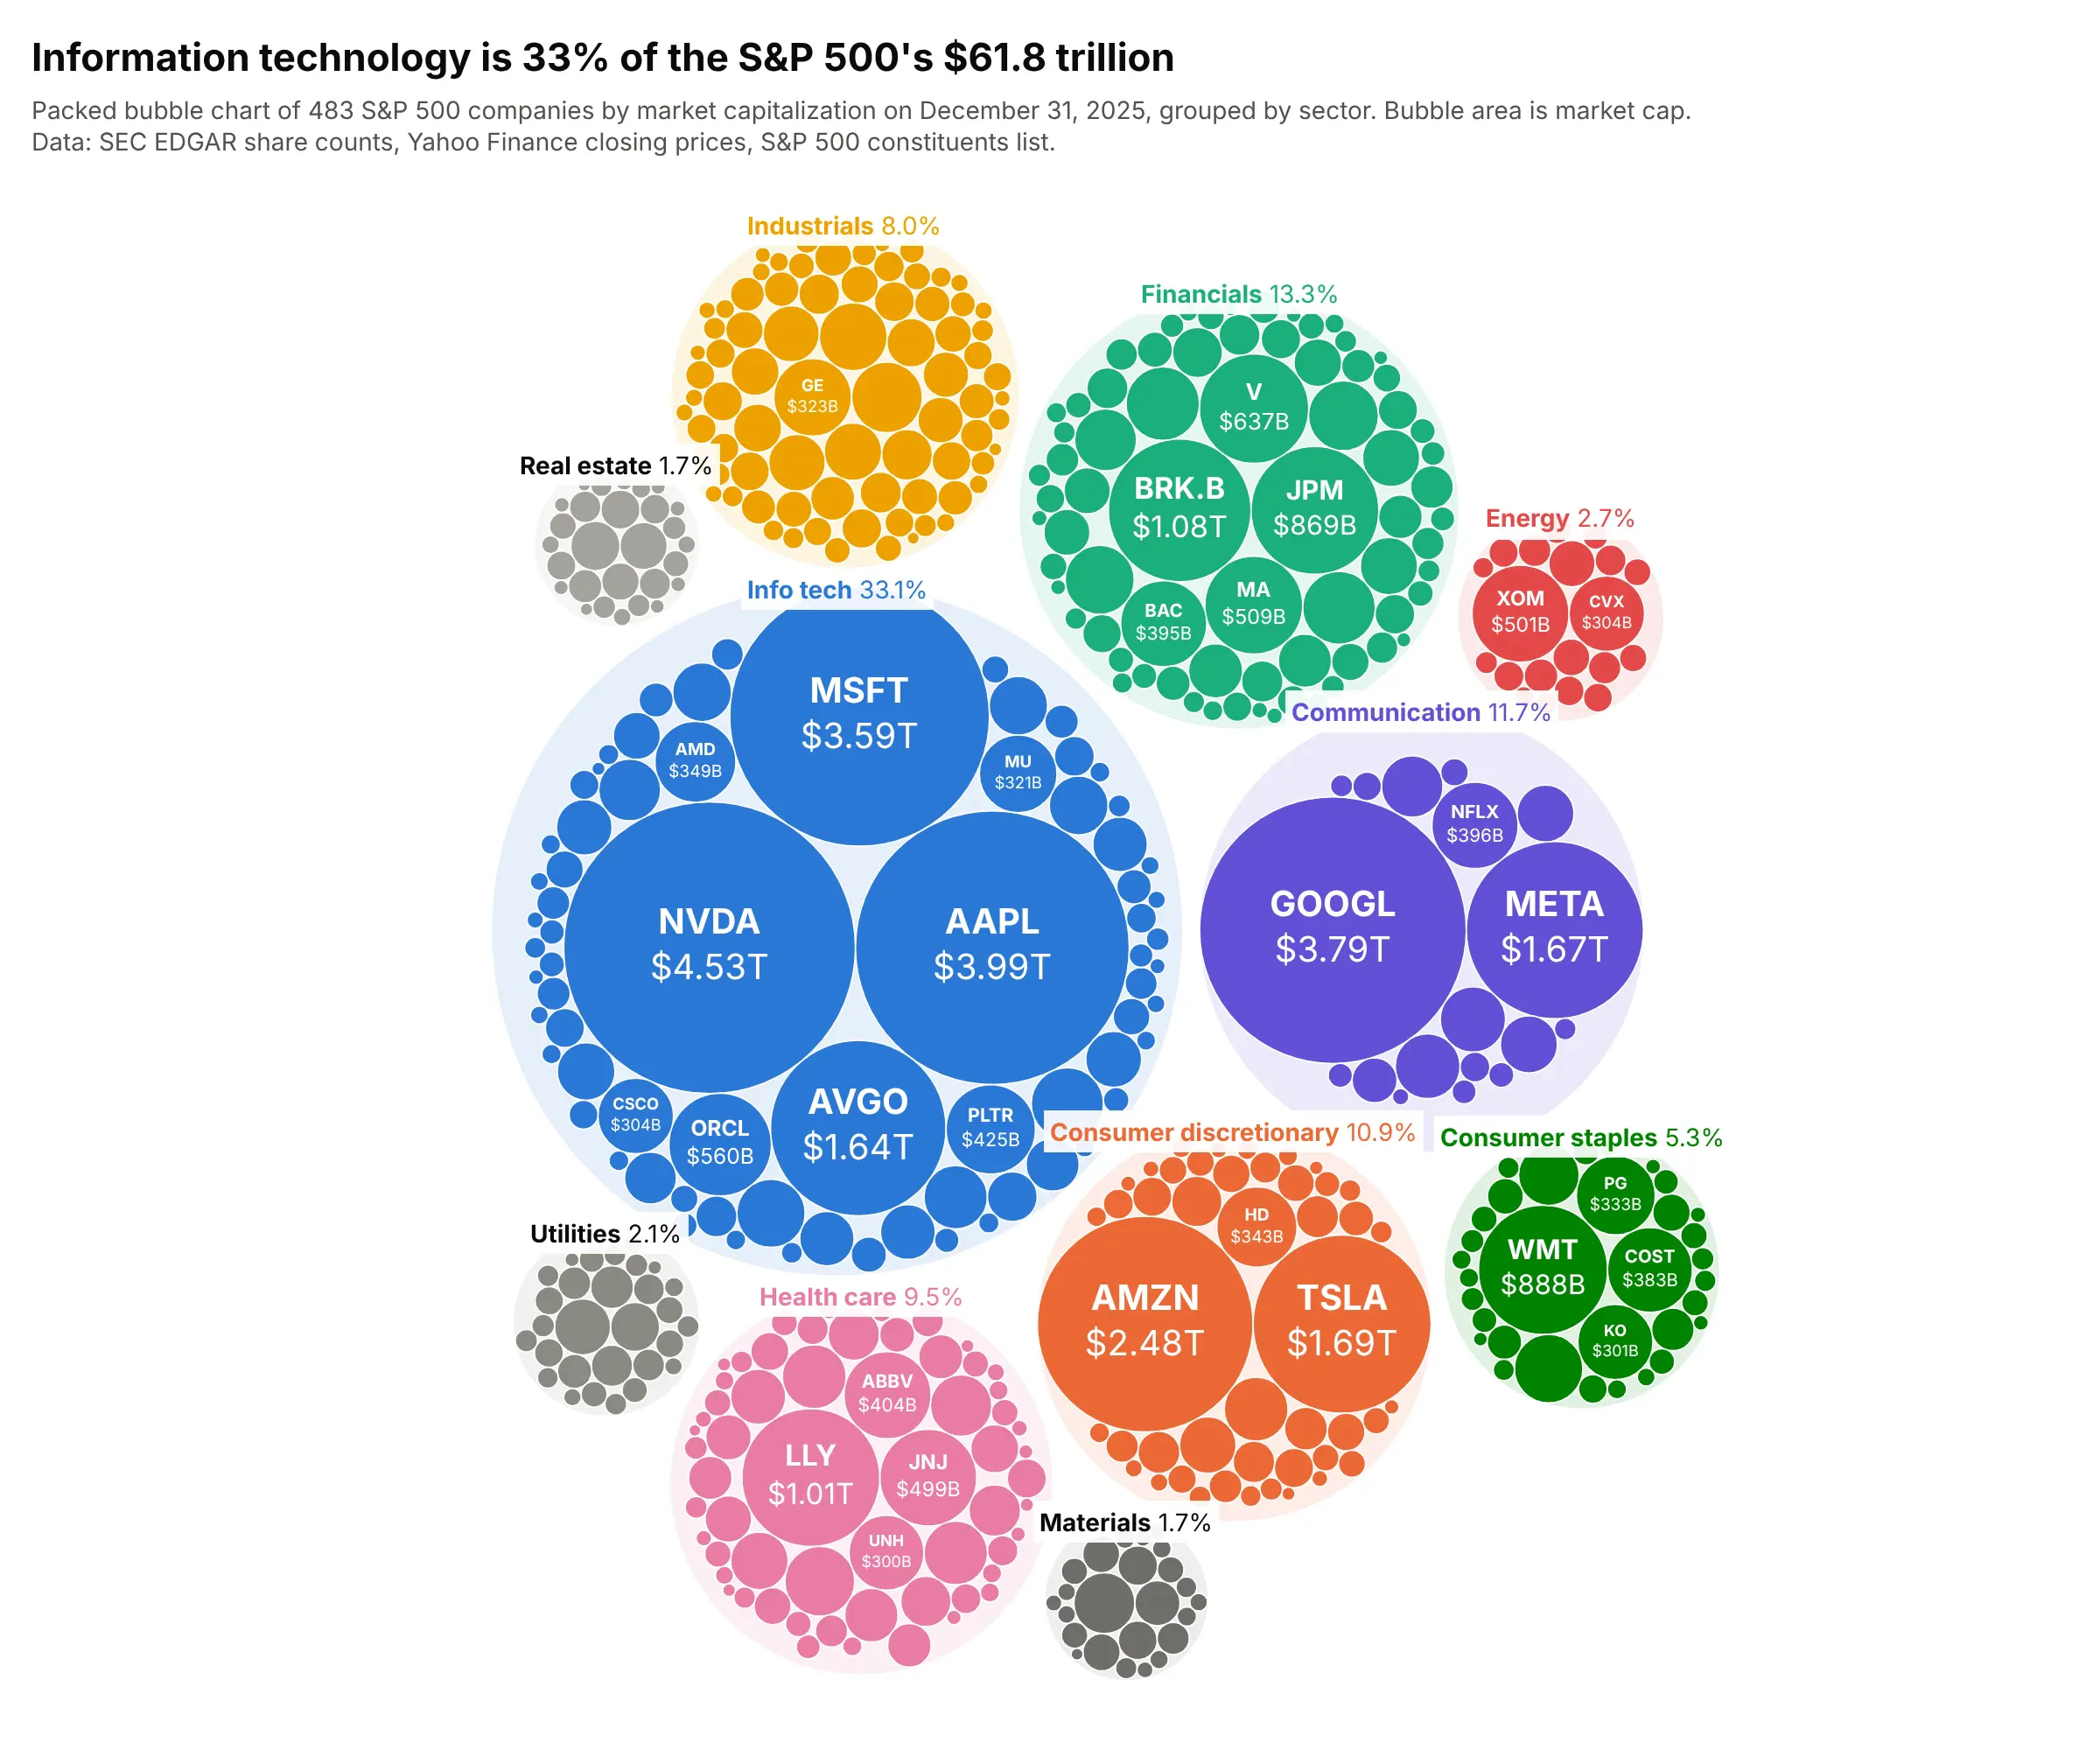
Data: SEC EDGAR share counts, Yahoo Finance closing prices on December 31, 2025, and the S&P 500 constituents list.
How do you read a packed bubble chart? In the example above, notice these things:
- Each of the 483 small circles is one company, and its area is the company's market value (its share price times its number of shares), so a circle twice the area is worth twice as much.
- The circles sit inside 11 larger, lightly shaded circles, one per sector, and the tab on each gives the sector's share of the $61.8 trillion total: 33.1% for information technology and 1.7% for materials.
- There are no axes, so a circle's position means nothing beyond the group it is in. The biggest circles land in the middle of each group because the packing places them first.
- The few giants and the long tail are visible at once: Nvidia's $4.53 trillion is 113 times the median company's $40.1 billion, and most circles are too small to hold a label, which is why the chart shows names only where they fit and puts the rest in the hover text.
It's often used for charts like these:
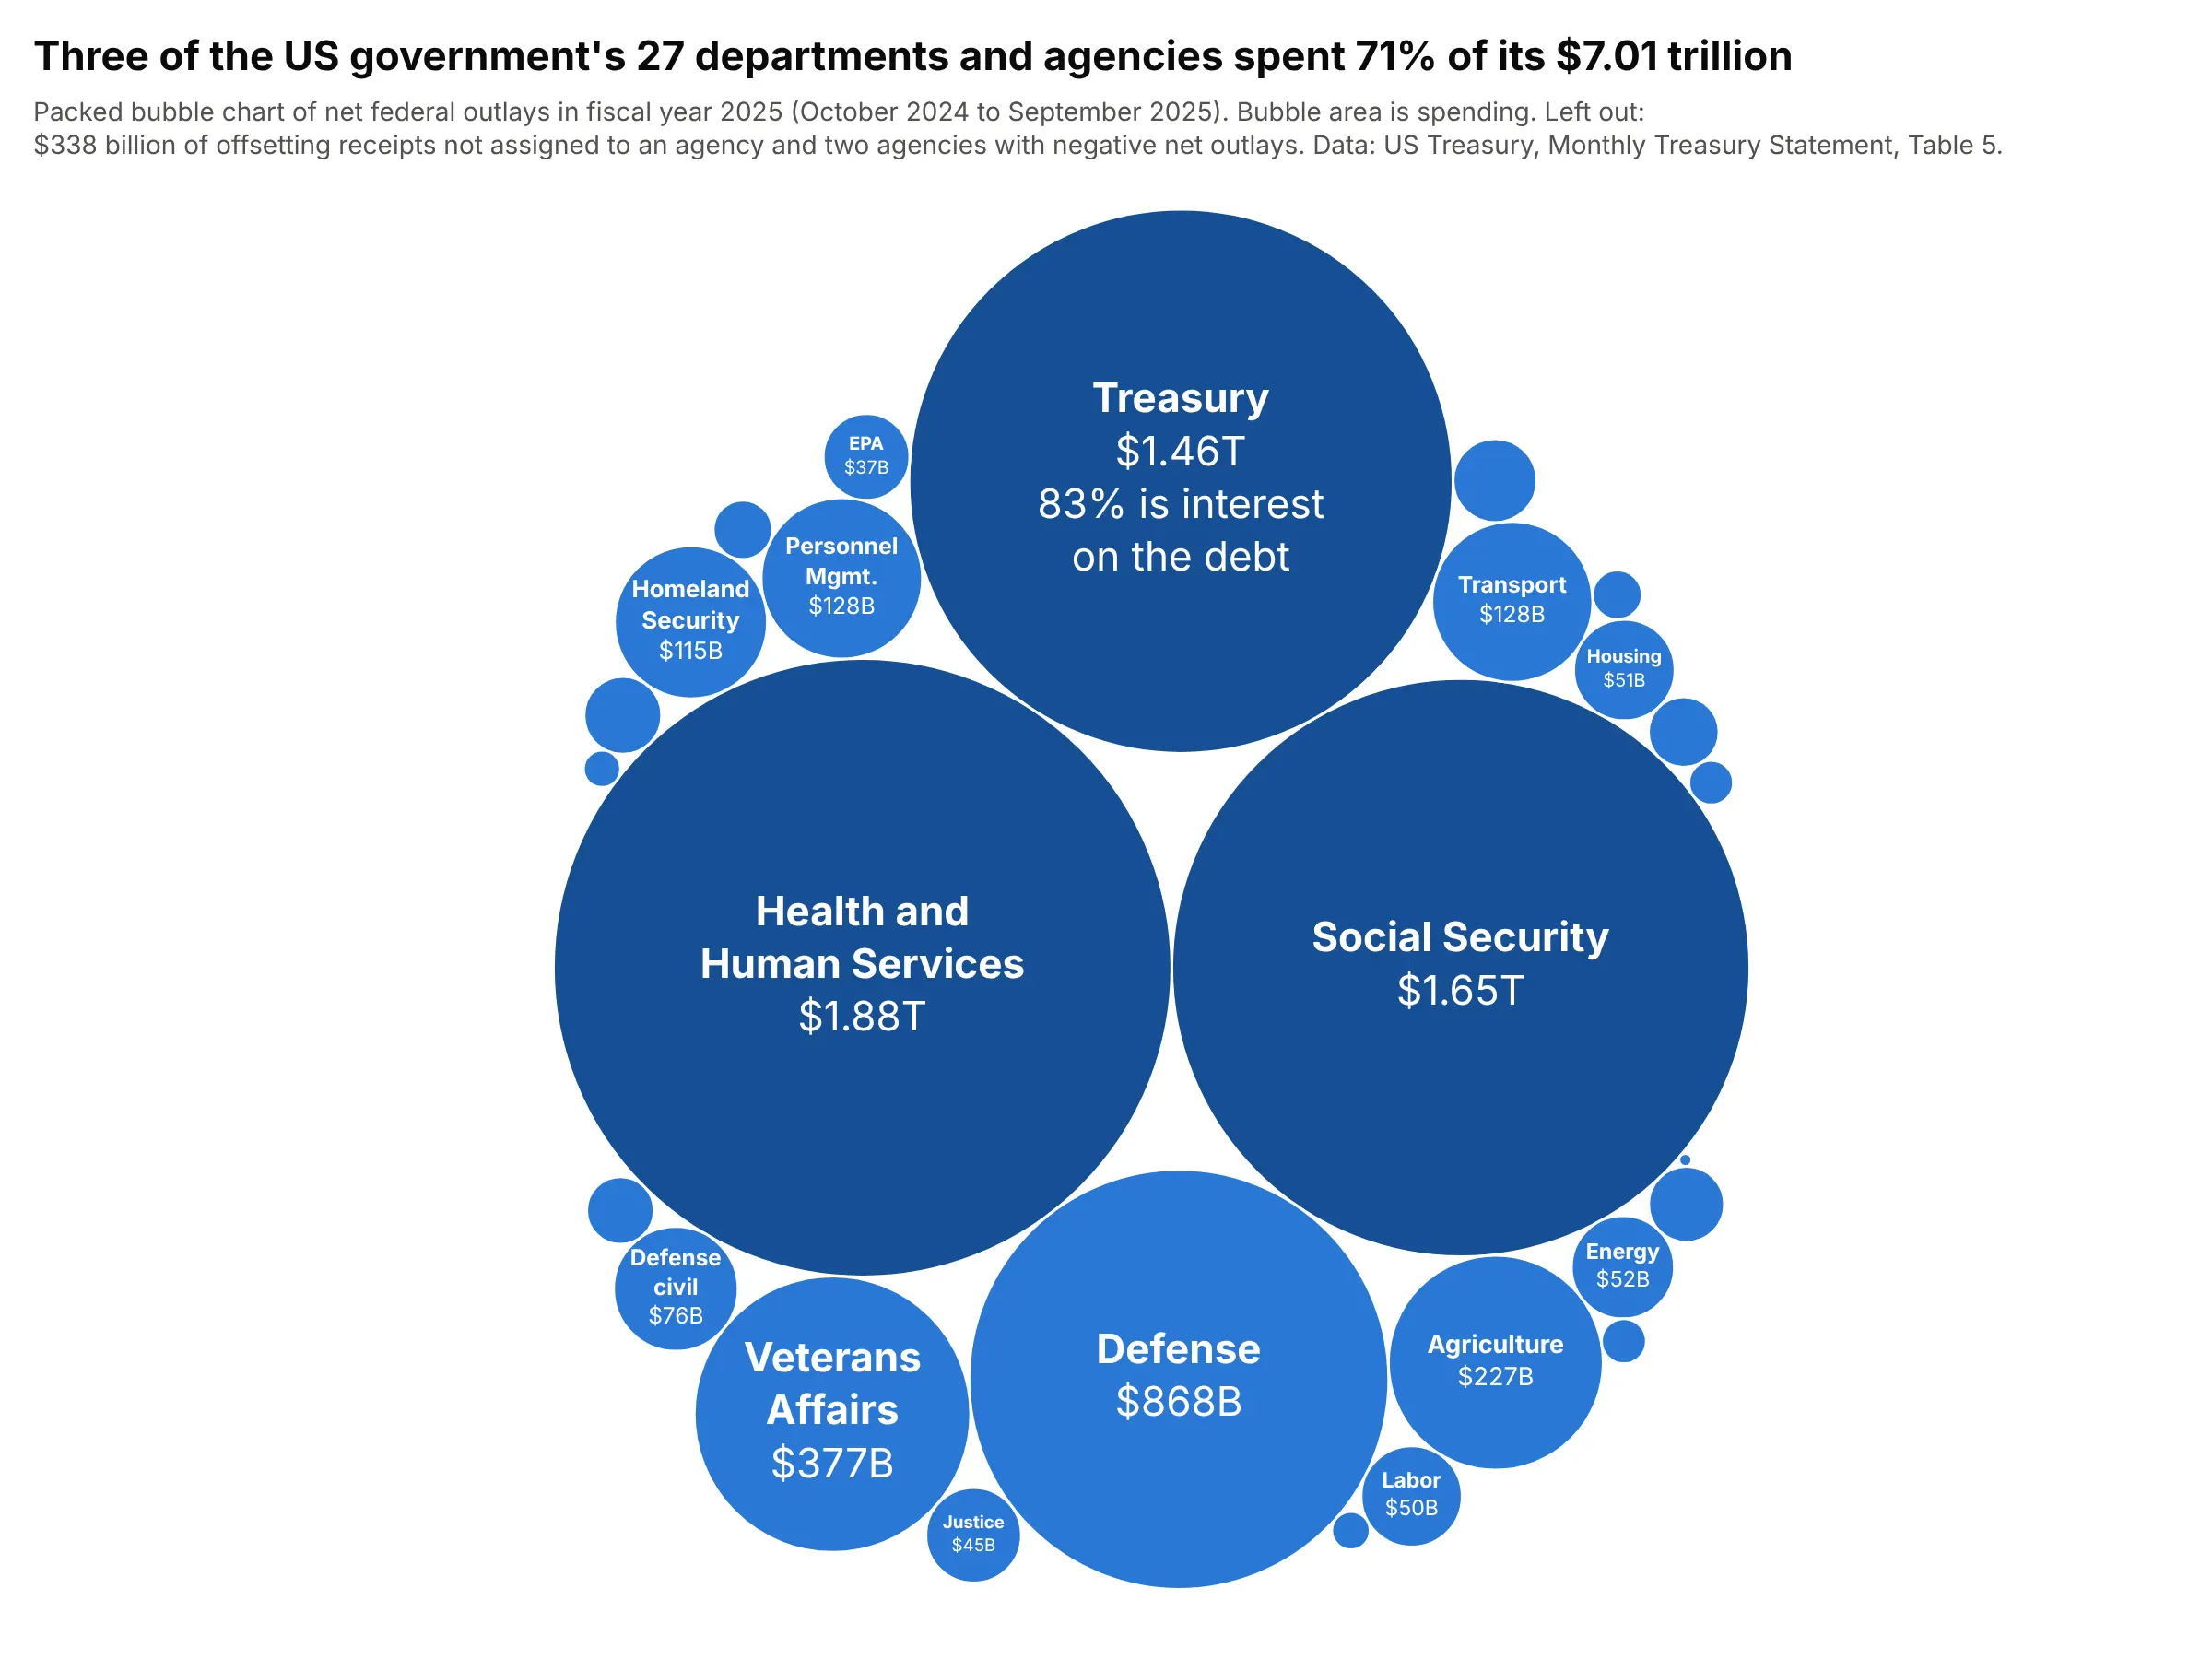
Government budgets. Three of the 27 departments and agencies spent 71% of the federal government's $7.01 trillion in fiscal year 2025, the view The New York Times made famous with its 2012 budget bubbles. Data: US Treasury, Monthly Treasury Statement, Table 5.
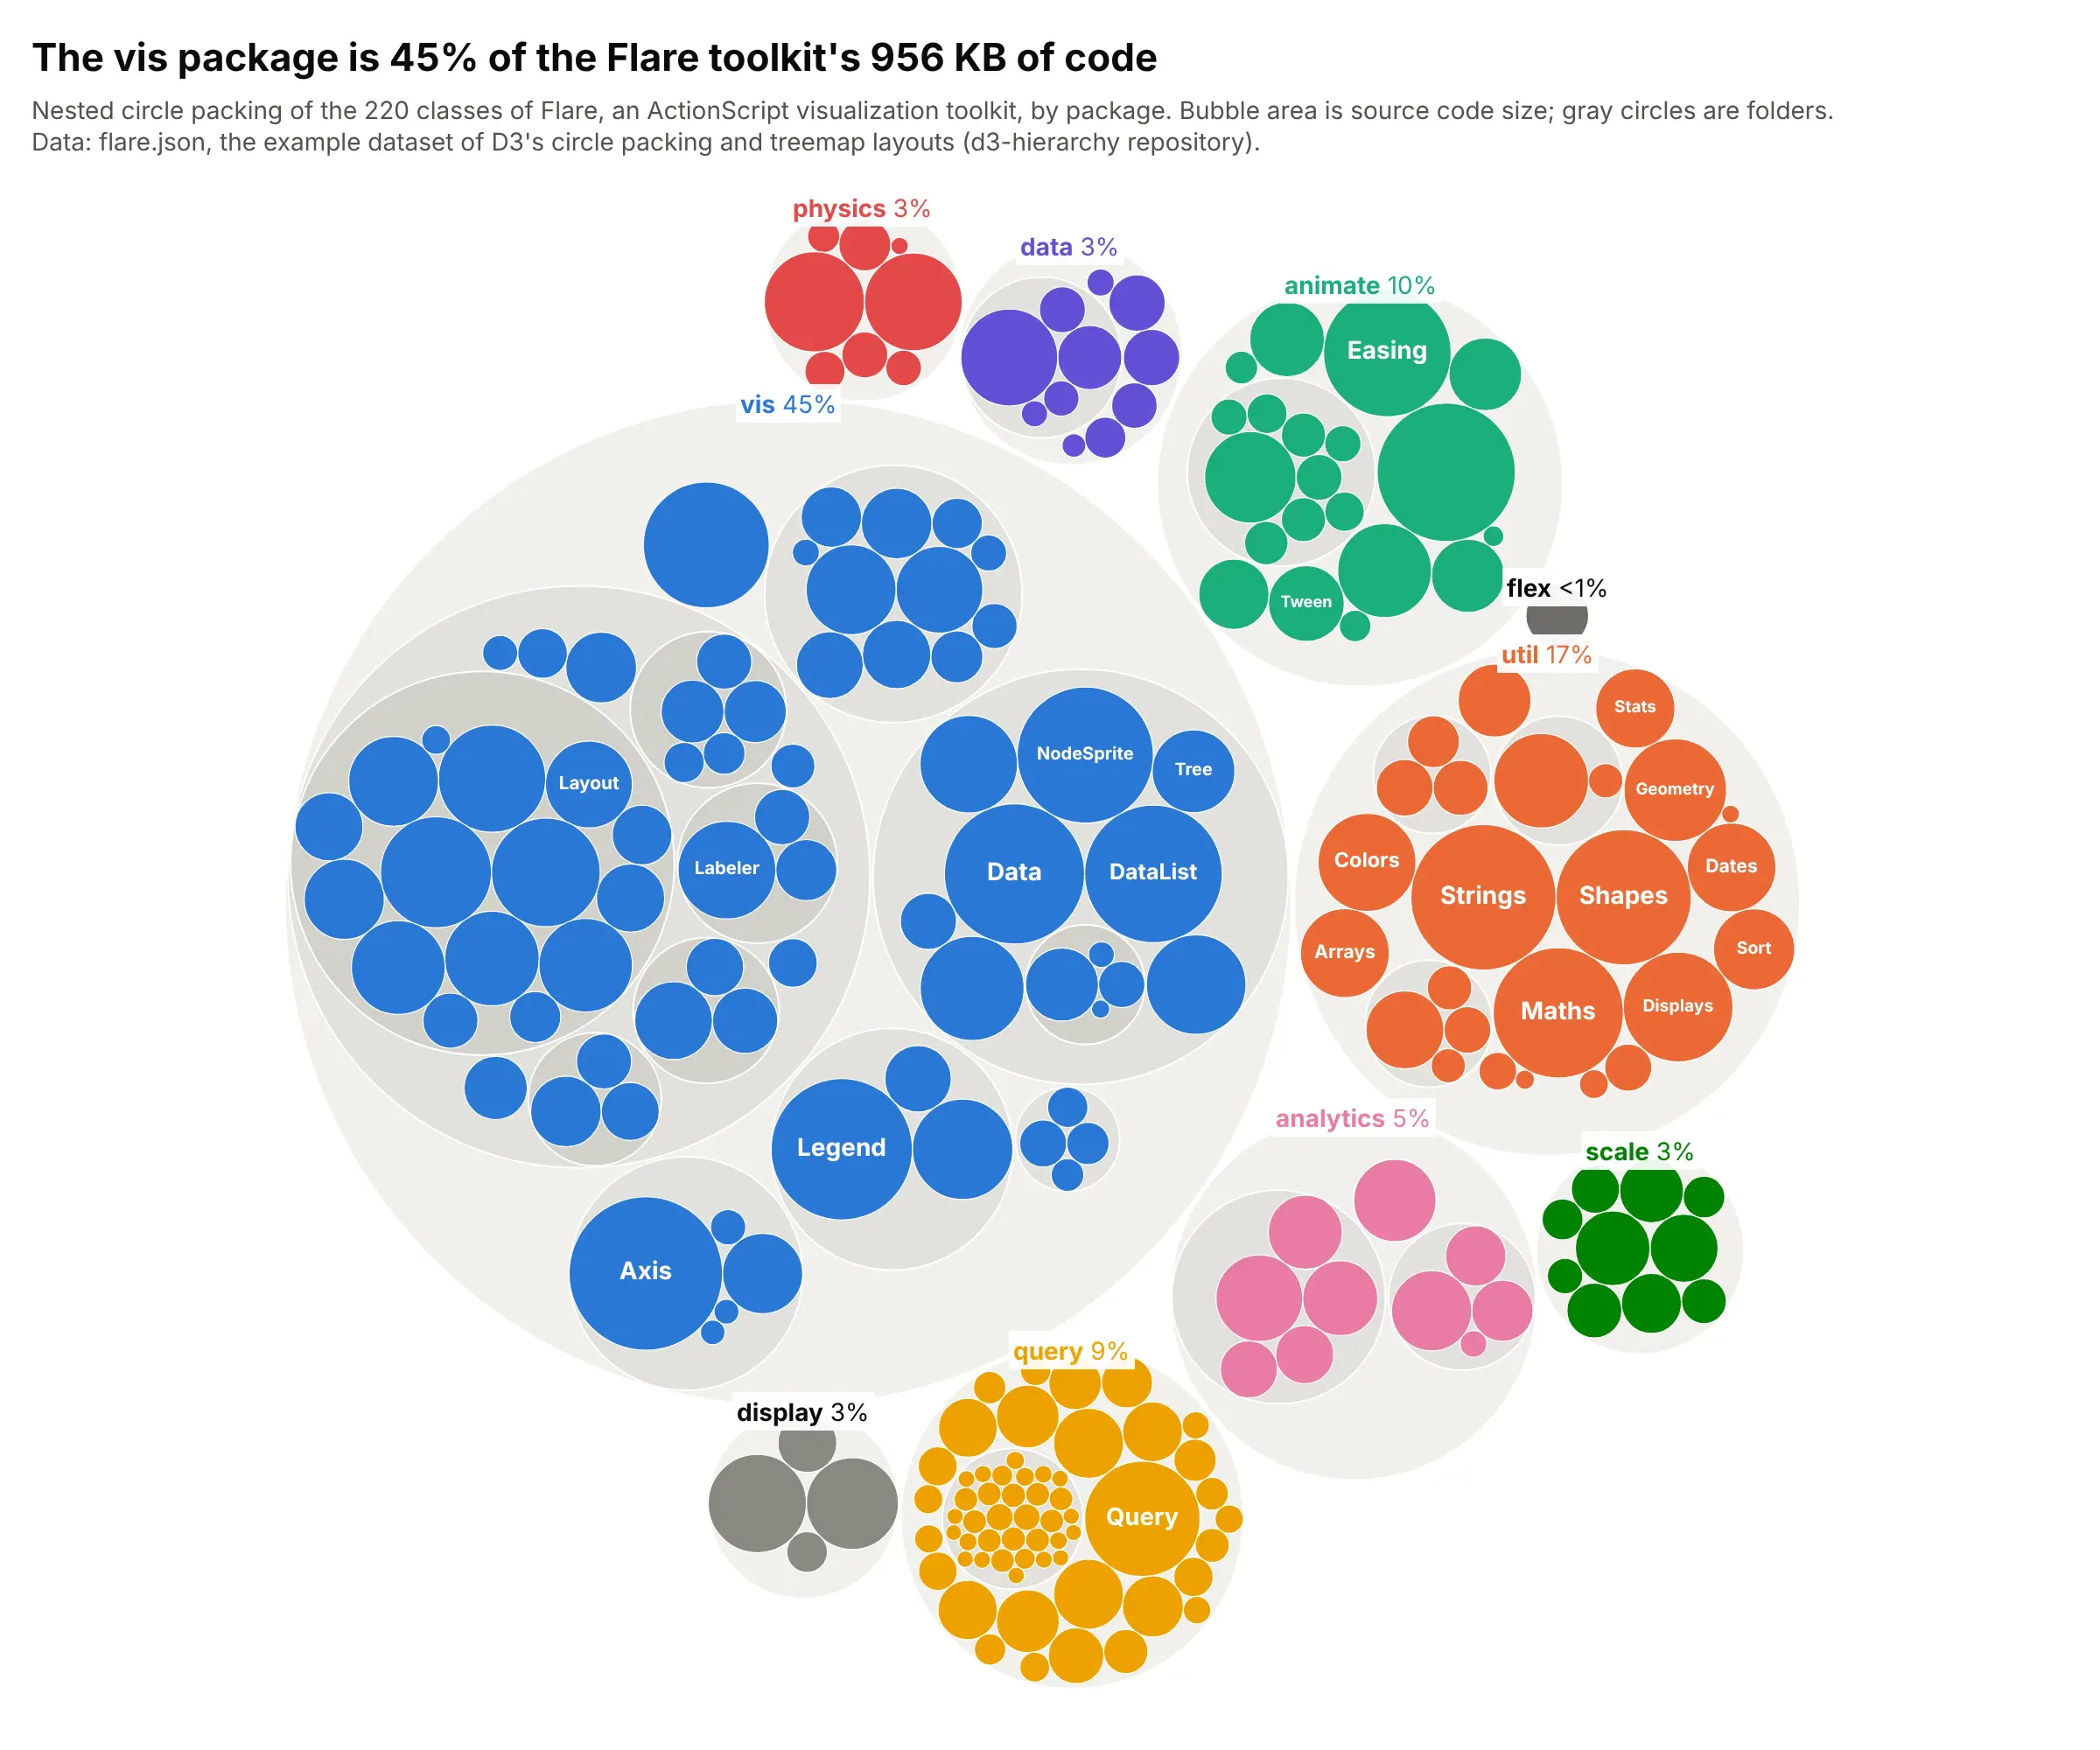
Folders and code bases. The vis package is 45% of the 956 KB of source code in Flare, the dataset of D3's own circle packing examples, and the nested gray circles show its folders. Data: flare.json from the d3-hierarchy repository.
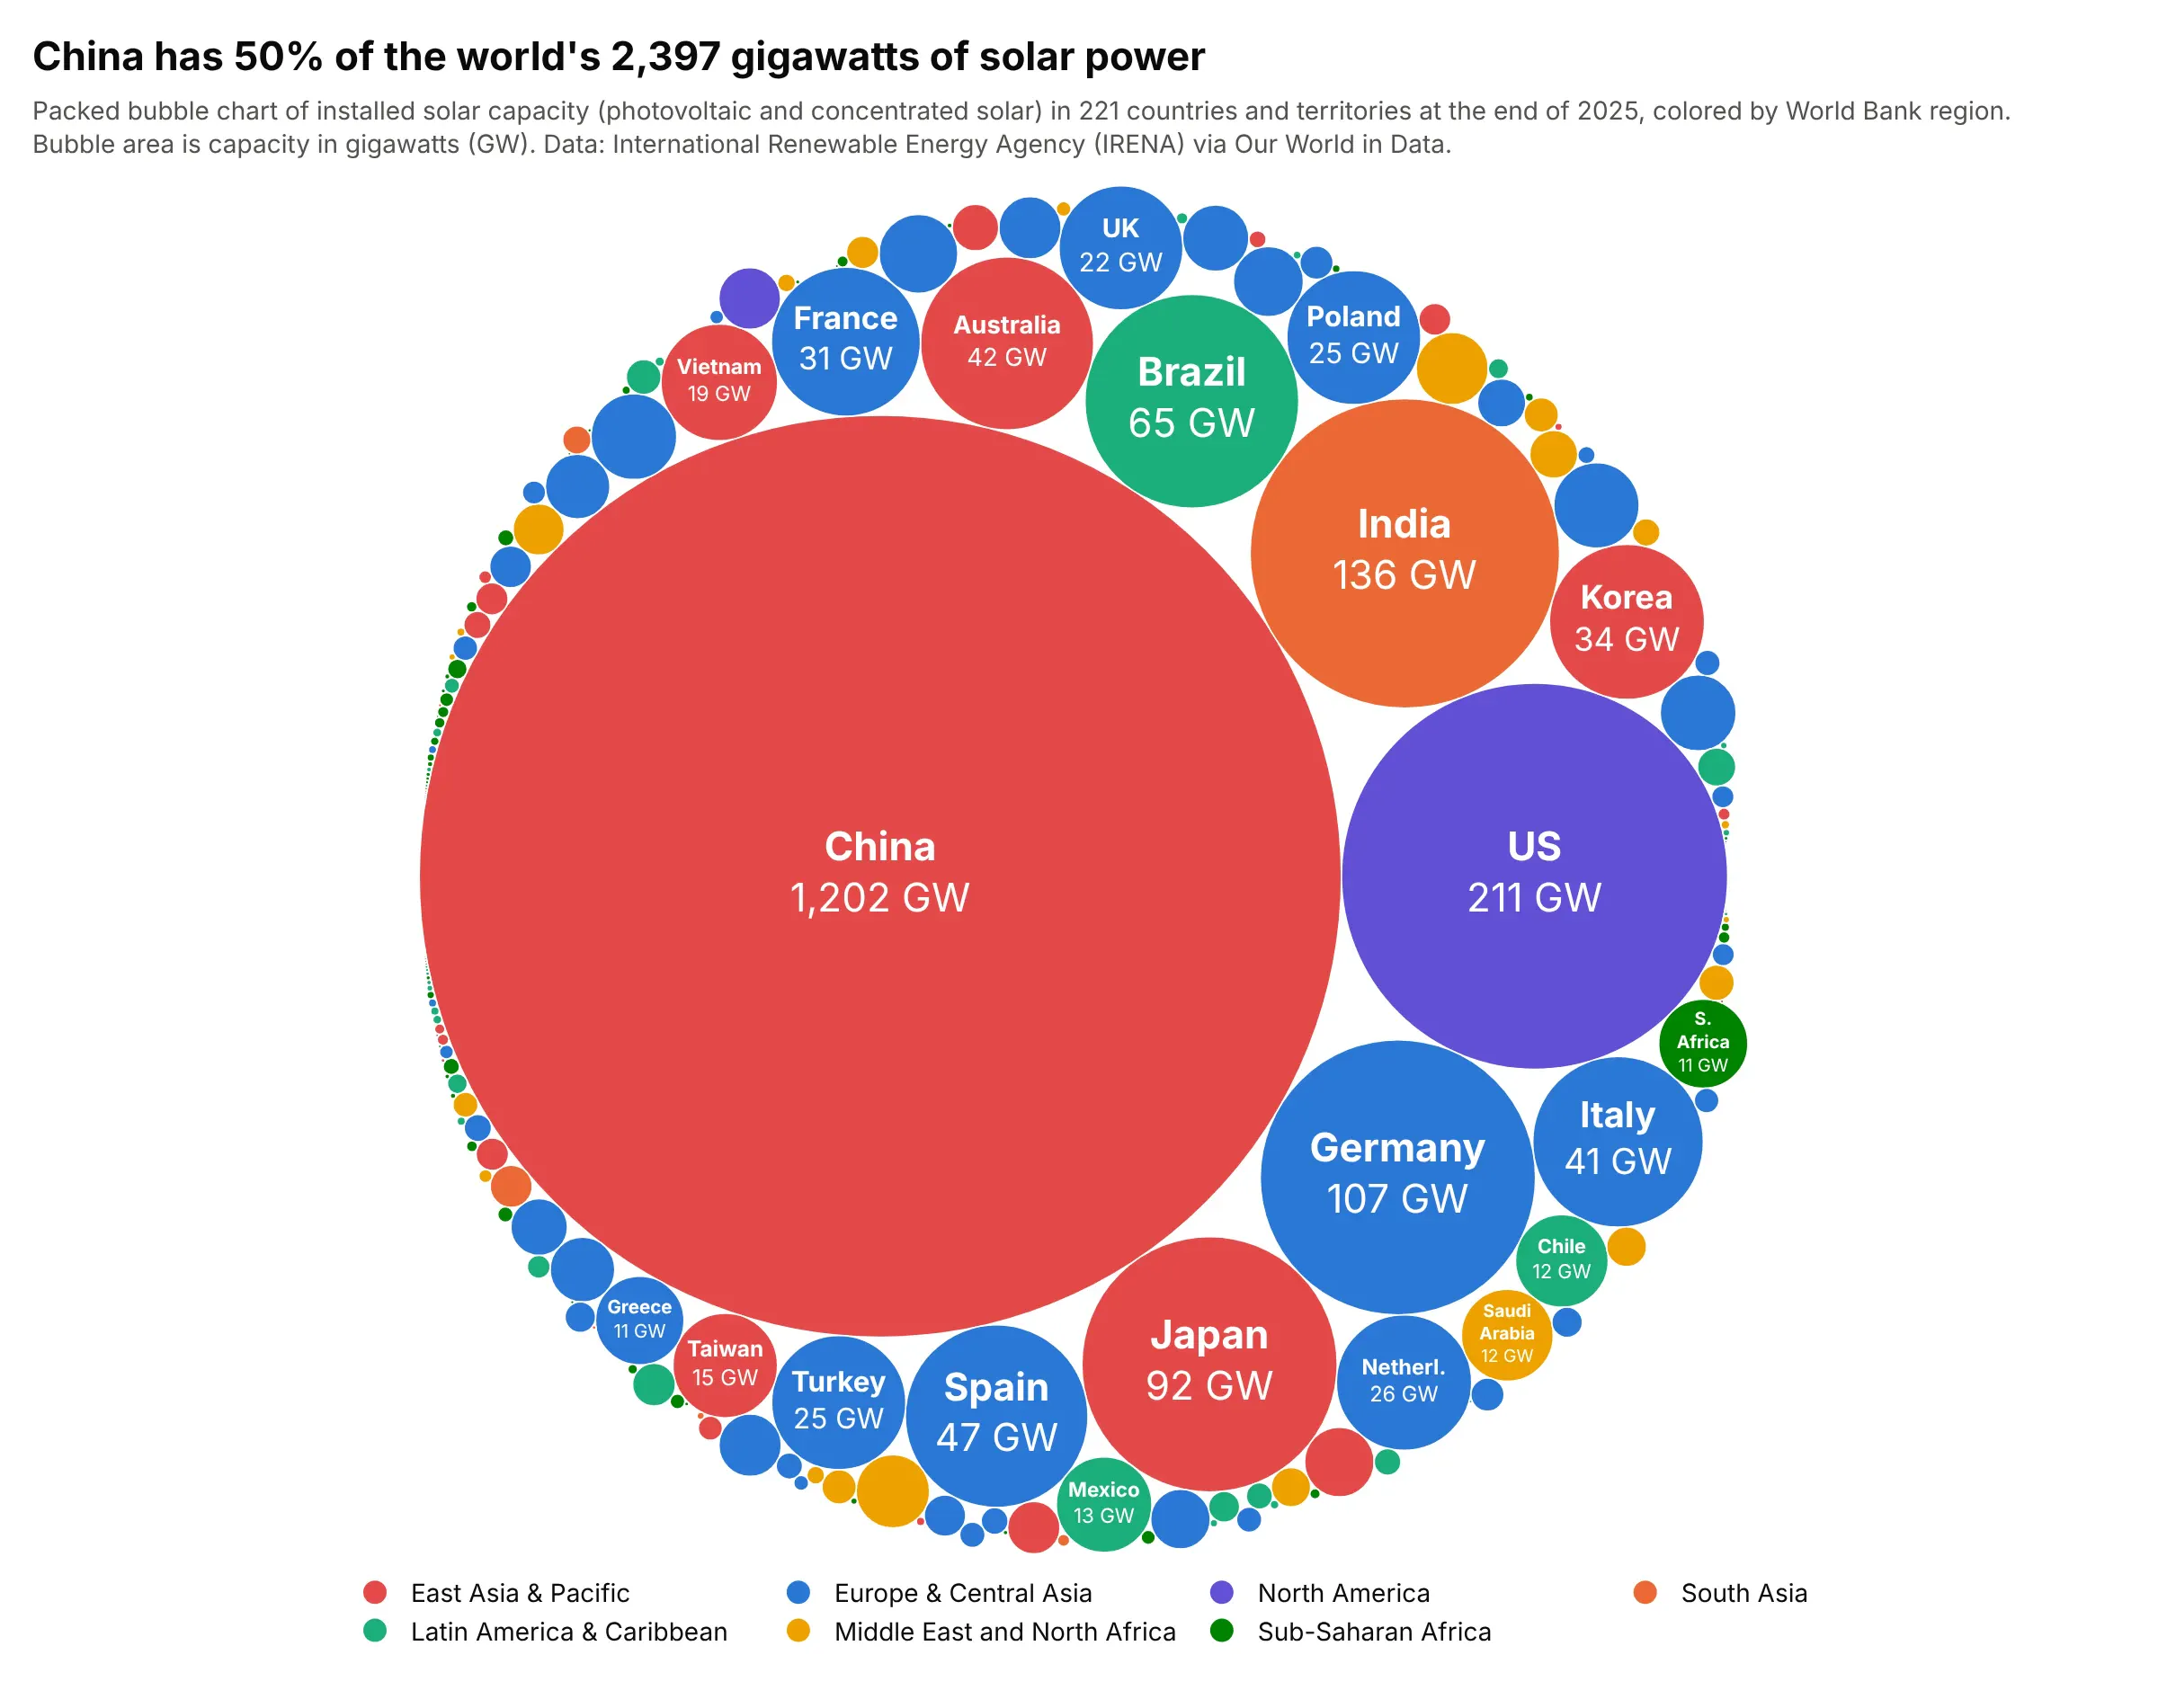
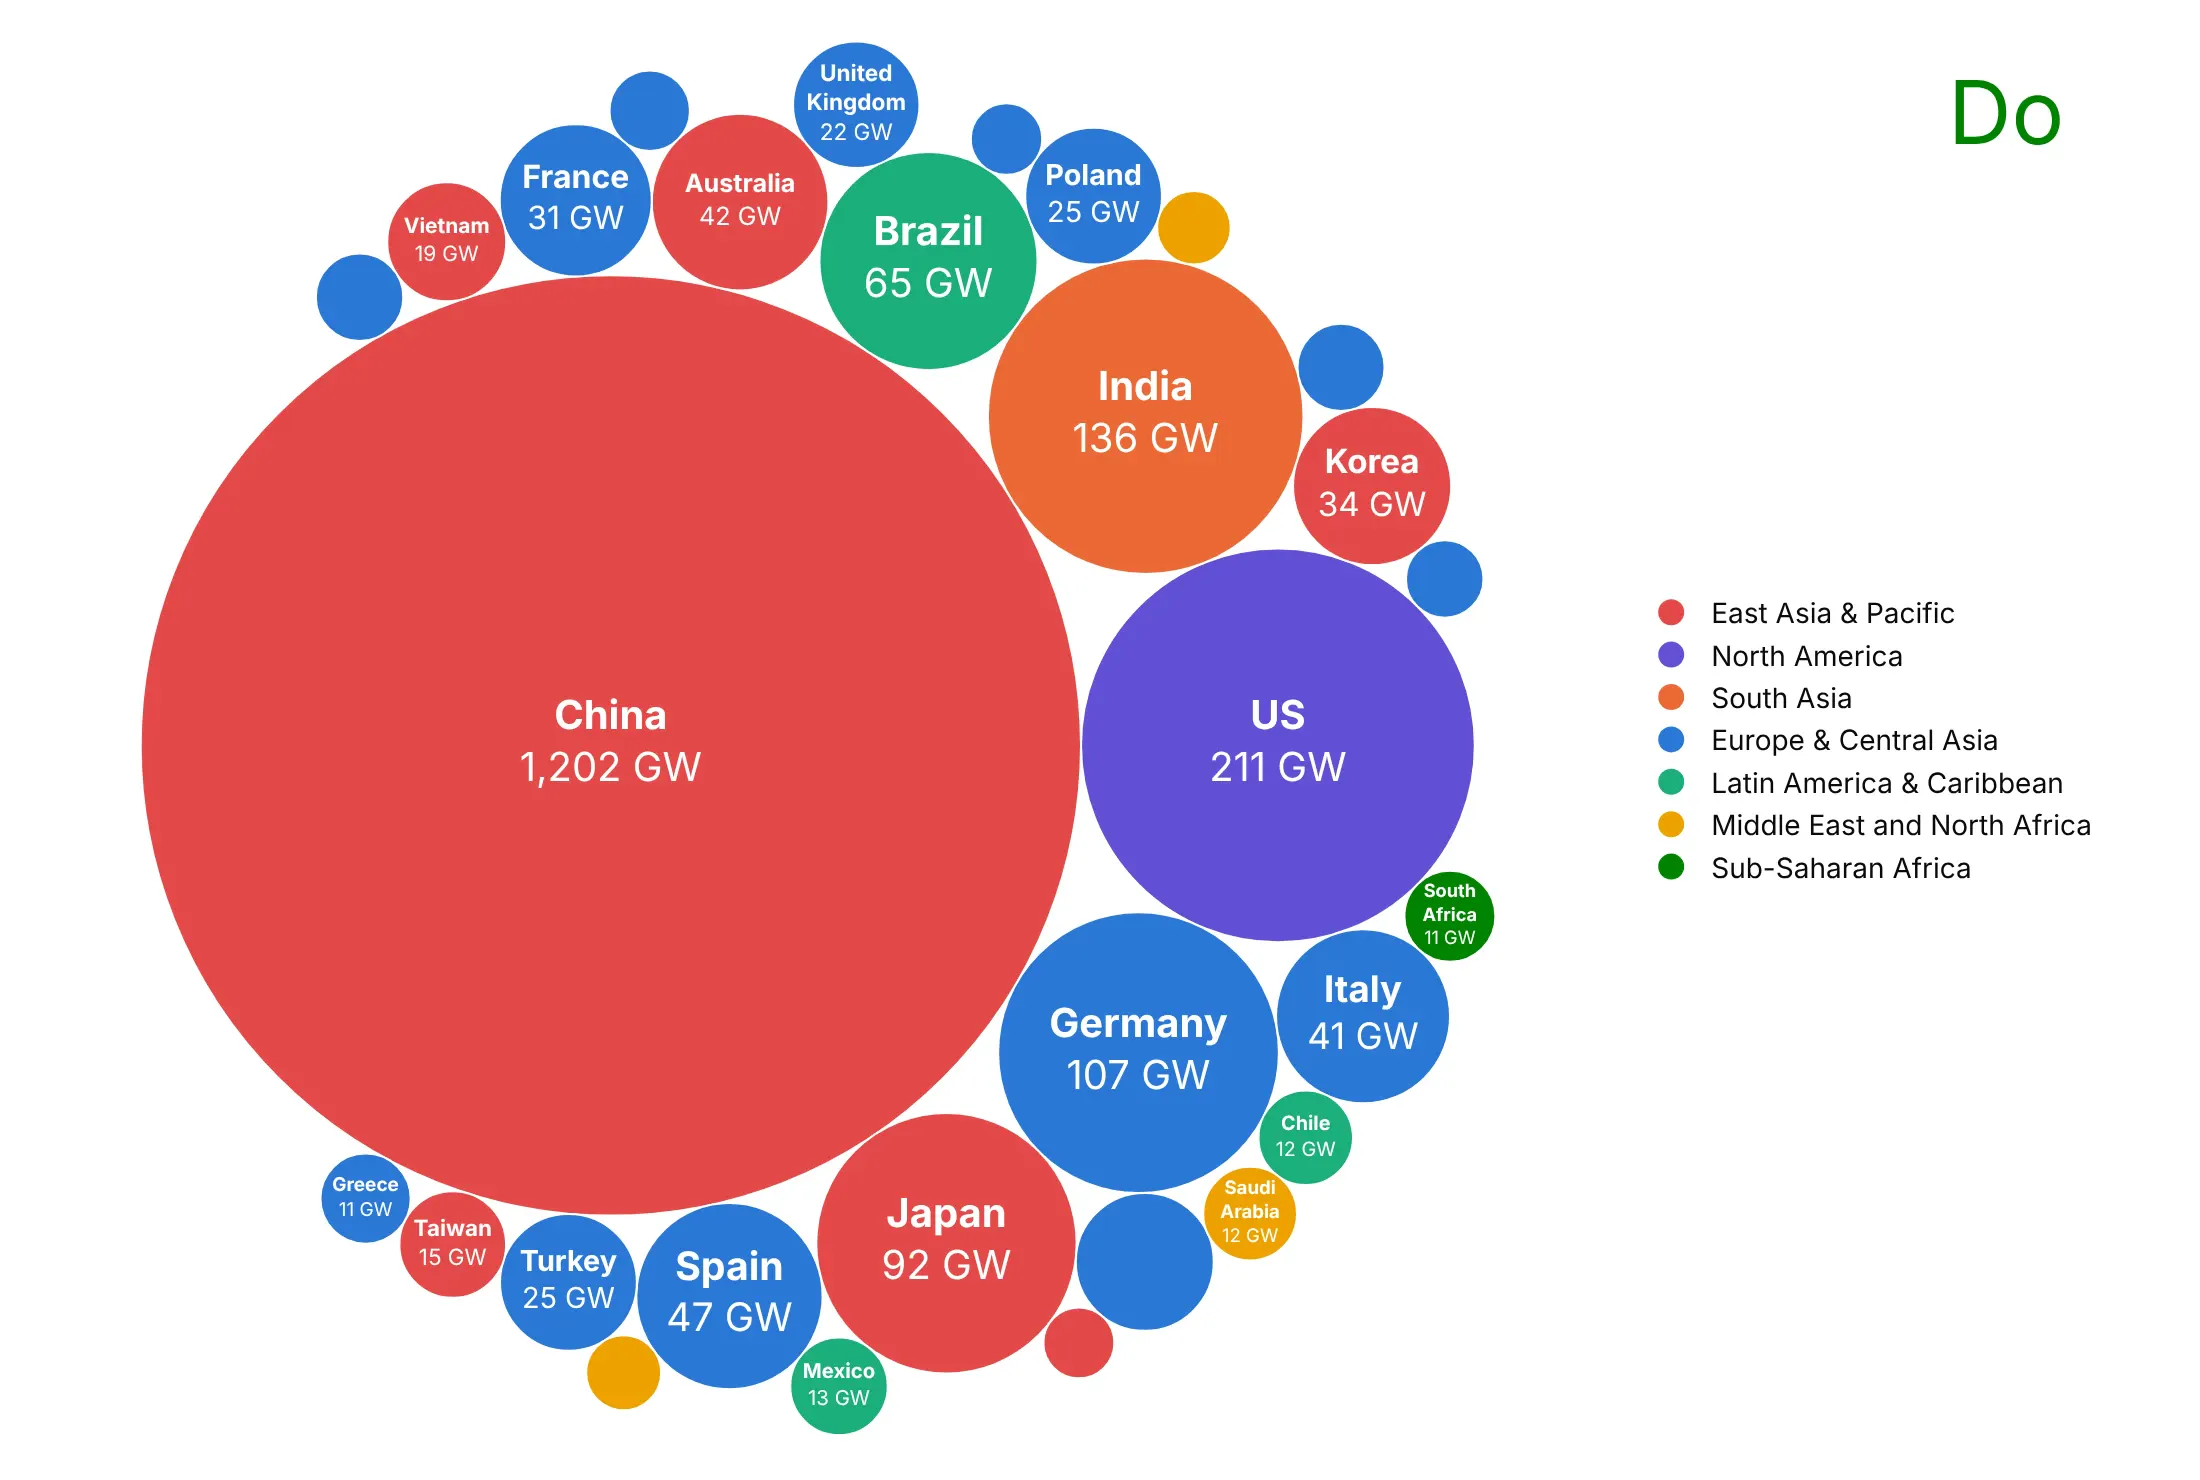
Countries by capacity. China had 1,202 of the world's 2,397 gigawatts (GW) of solar power at the end of 2025, as much as every other country put together. Data: International Renewable Energy Agency (IRENA), via Our World in Data.
Size bubbles by area, not radius
A circle's area grows with the square of its radius, so if you set the radius in proportion to the value, a value 13 times bigger gets a circle 170 times bigger. China has 13 times Japan's solar capacity, and here are both ways of drawing it:
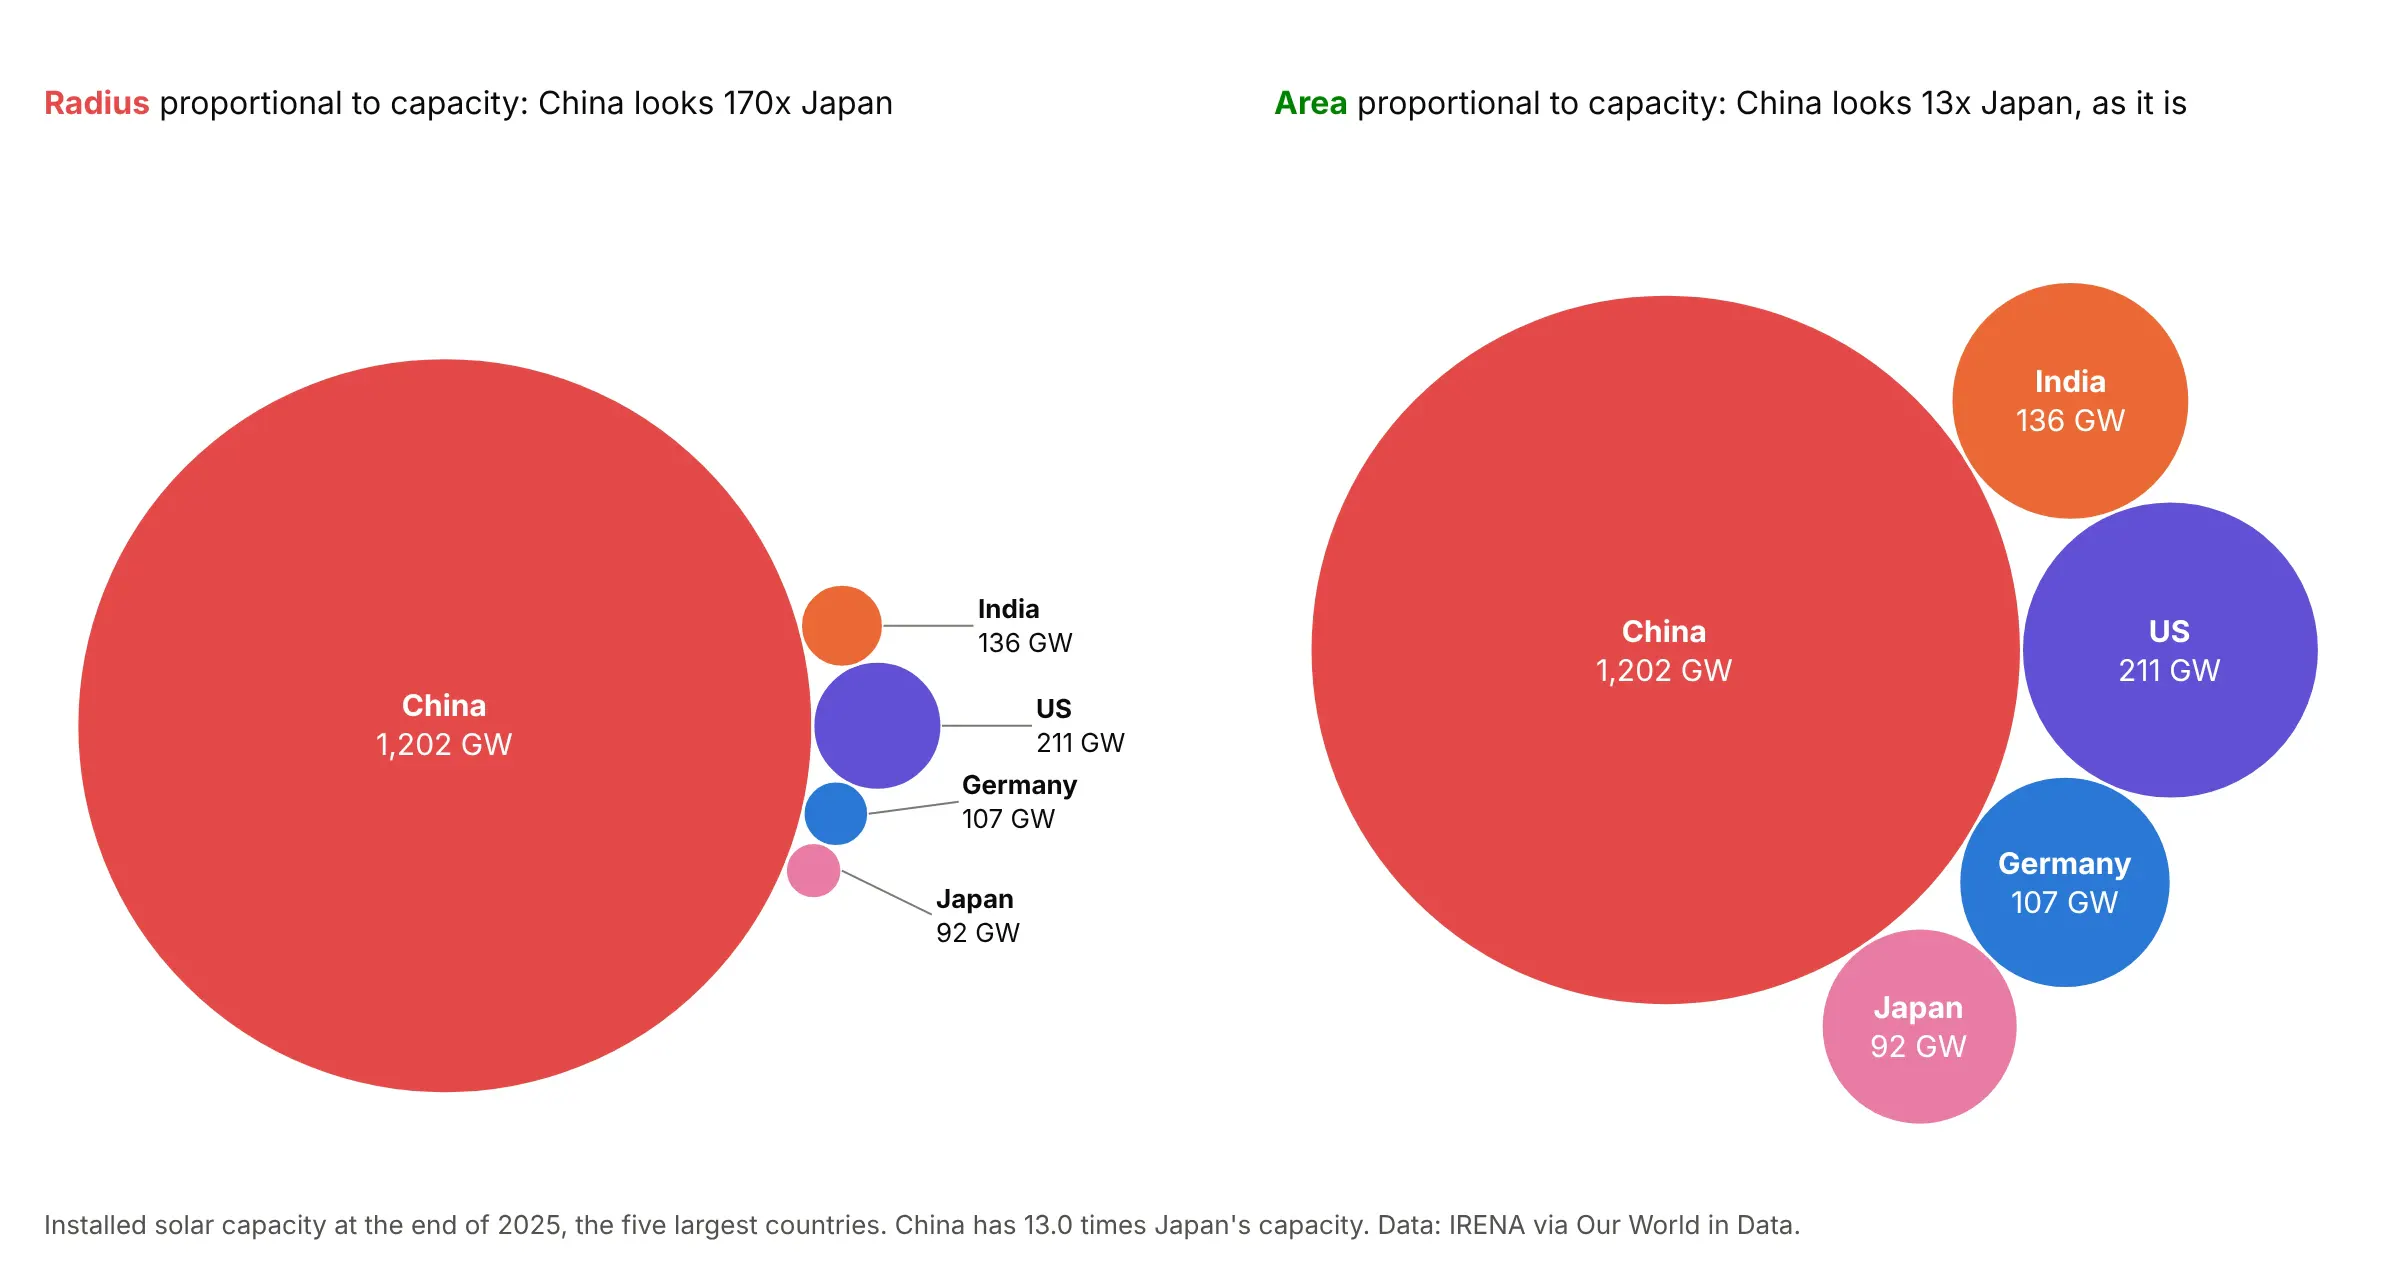
Use the square root of the value as the radius, which makes the area proportional to the value. Even then, people tend to underestimate how much bigger the larger of two circles is (Flannery 1971), which is one reason to print the value inside big circles. The one case where the radius should follow the data is when the circles are round things whose radius you know, like the moons in example 3 below.
How a packing is computed
Packing circles as tightly as possible is a hard geometry problem, so charting tools use quick rules that give a good packing instead of the best one. The most common is the front-chain algorithm of Wang et al. (2006), which D3's d3.pack and d3.packSiblings use. It sorts the circles from biggest to smallest, puts the first two side by side and the third touching both, and keeps a ring of the circles on the outside (the front chain). Each new circle goes against two neighbors on that ring, at the gap closest to the center; if it would overlap another circle on the ring, the ring skips past that circle and it tries again.
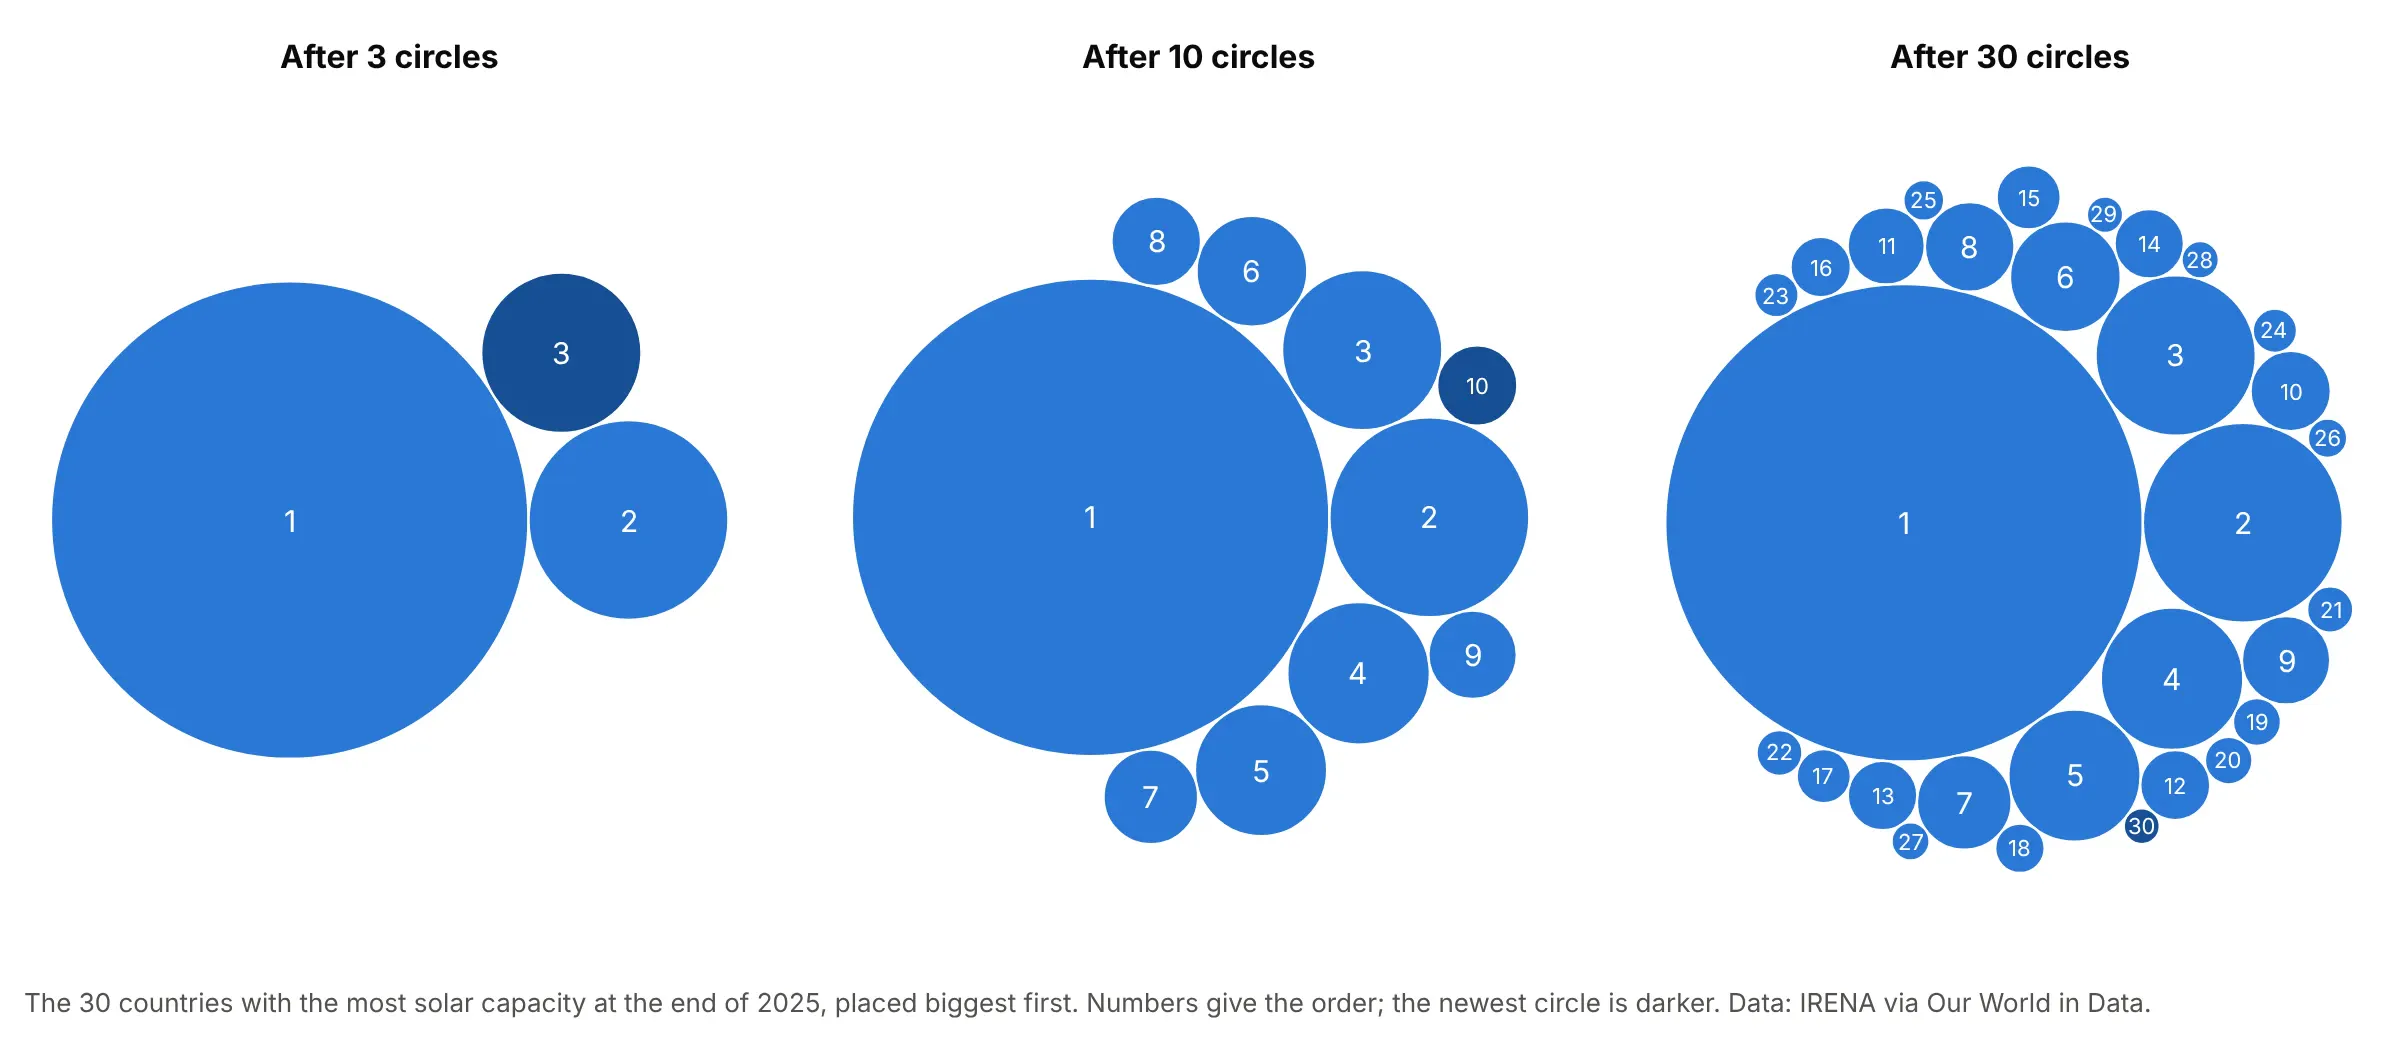
Because each circle only looks at the outer ring, 1,000 circles pack in about a third of a second in Python, as the FAQ shows. The open-source Python package circlify (MIT license) uses a different rule that tries many more positions per circle; in our test it took 18 seconds for 200 circles and filled 54% to 60% of the enclosing circle, where the front-chain code below filled 74% to 84%. For groups, pack each group's circles first, draw a circle around each group, and then pack those group circles, so that every leaf circle keeps the same scale. D3's documentation says the same: only the leaf circles can be compared accurately, because the space around them makes the group circles larger than their totals.
A short history
Charts of circles sized by quantity go back to William Playfair's 1801 Statistical Breviary, which Wikipedia credits with what were likely the first pie chart and circle graph. Packing many circles together became practical with computers: Wang, Wang, Dai and Wang (2006) introduced the front-chain layout for showing large hierarchies as nested circles, and D3's pack layout uses it. In February 2012, The New York Times' Four Ways to Slice Obama's 2013 Budget Proposal sized one circle per budget item by its proposed spending. We didn't redraw that graphic, which is The Times' own work; example 2 above draws the 2025 federal budget the same way from Treasury data. Today Tableau calls the chart a packed bubble chart, and Highcharts has a packed bubble series.
Alternatives to a packed bubble chart
Here's the same S&P 500 data drawn six ways. Some are better for the question, some worse, some just different:
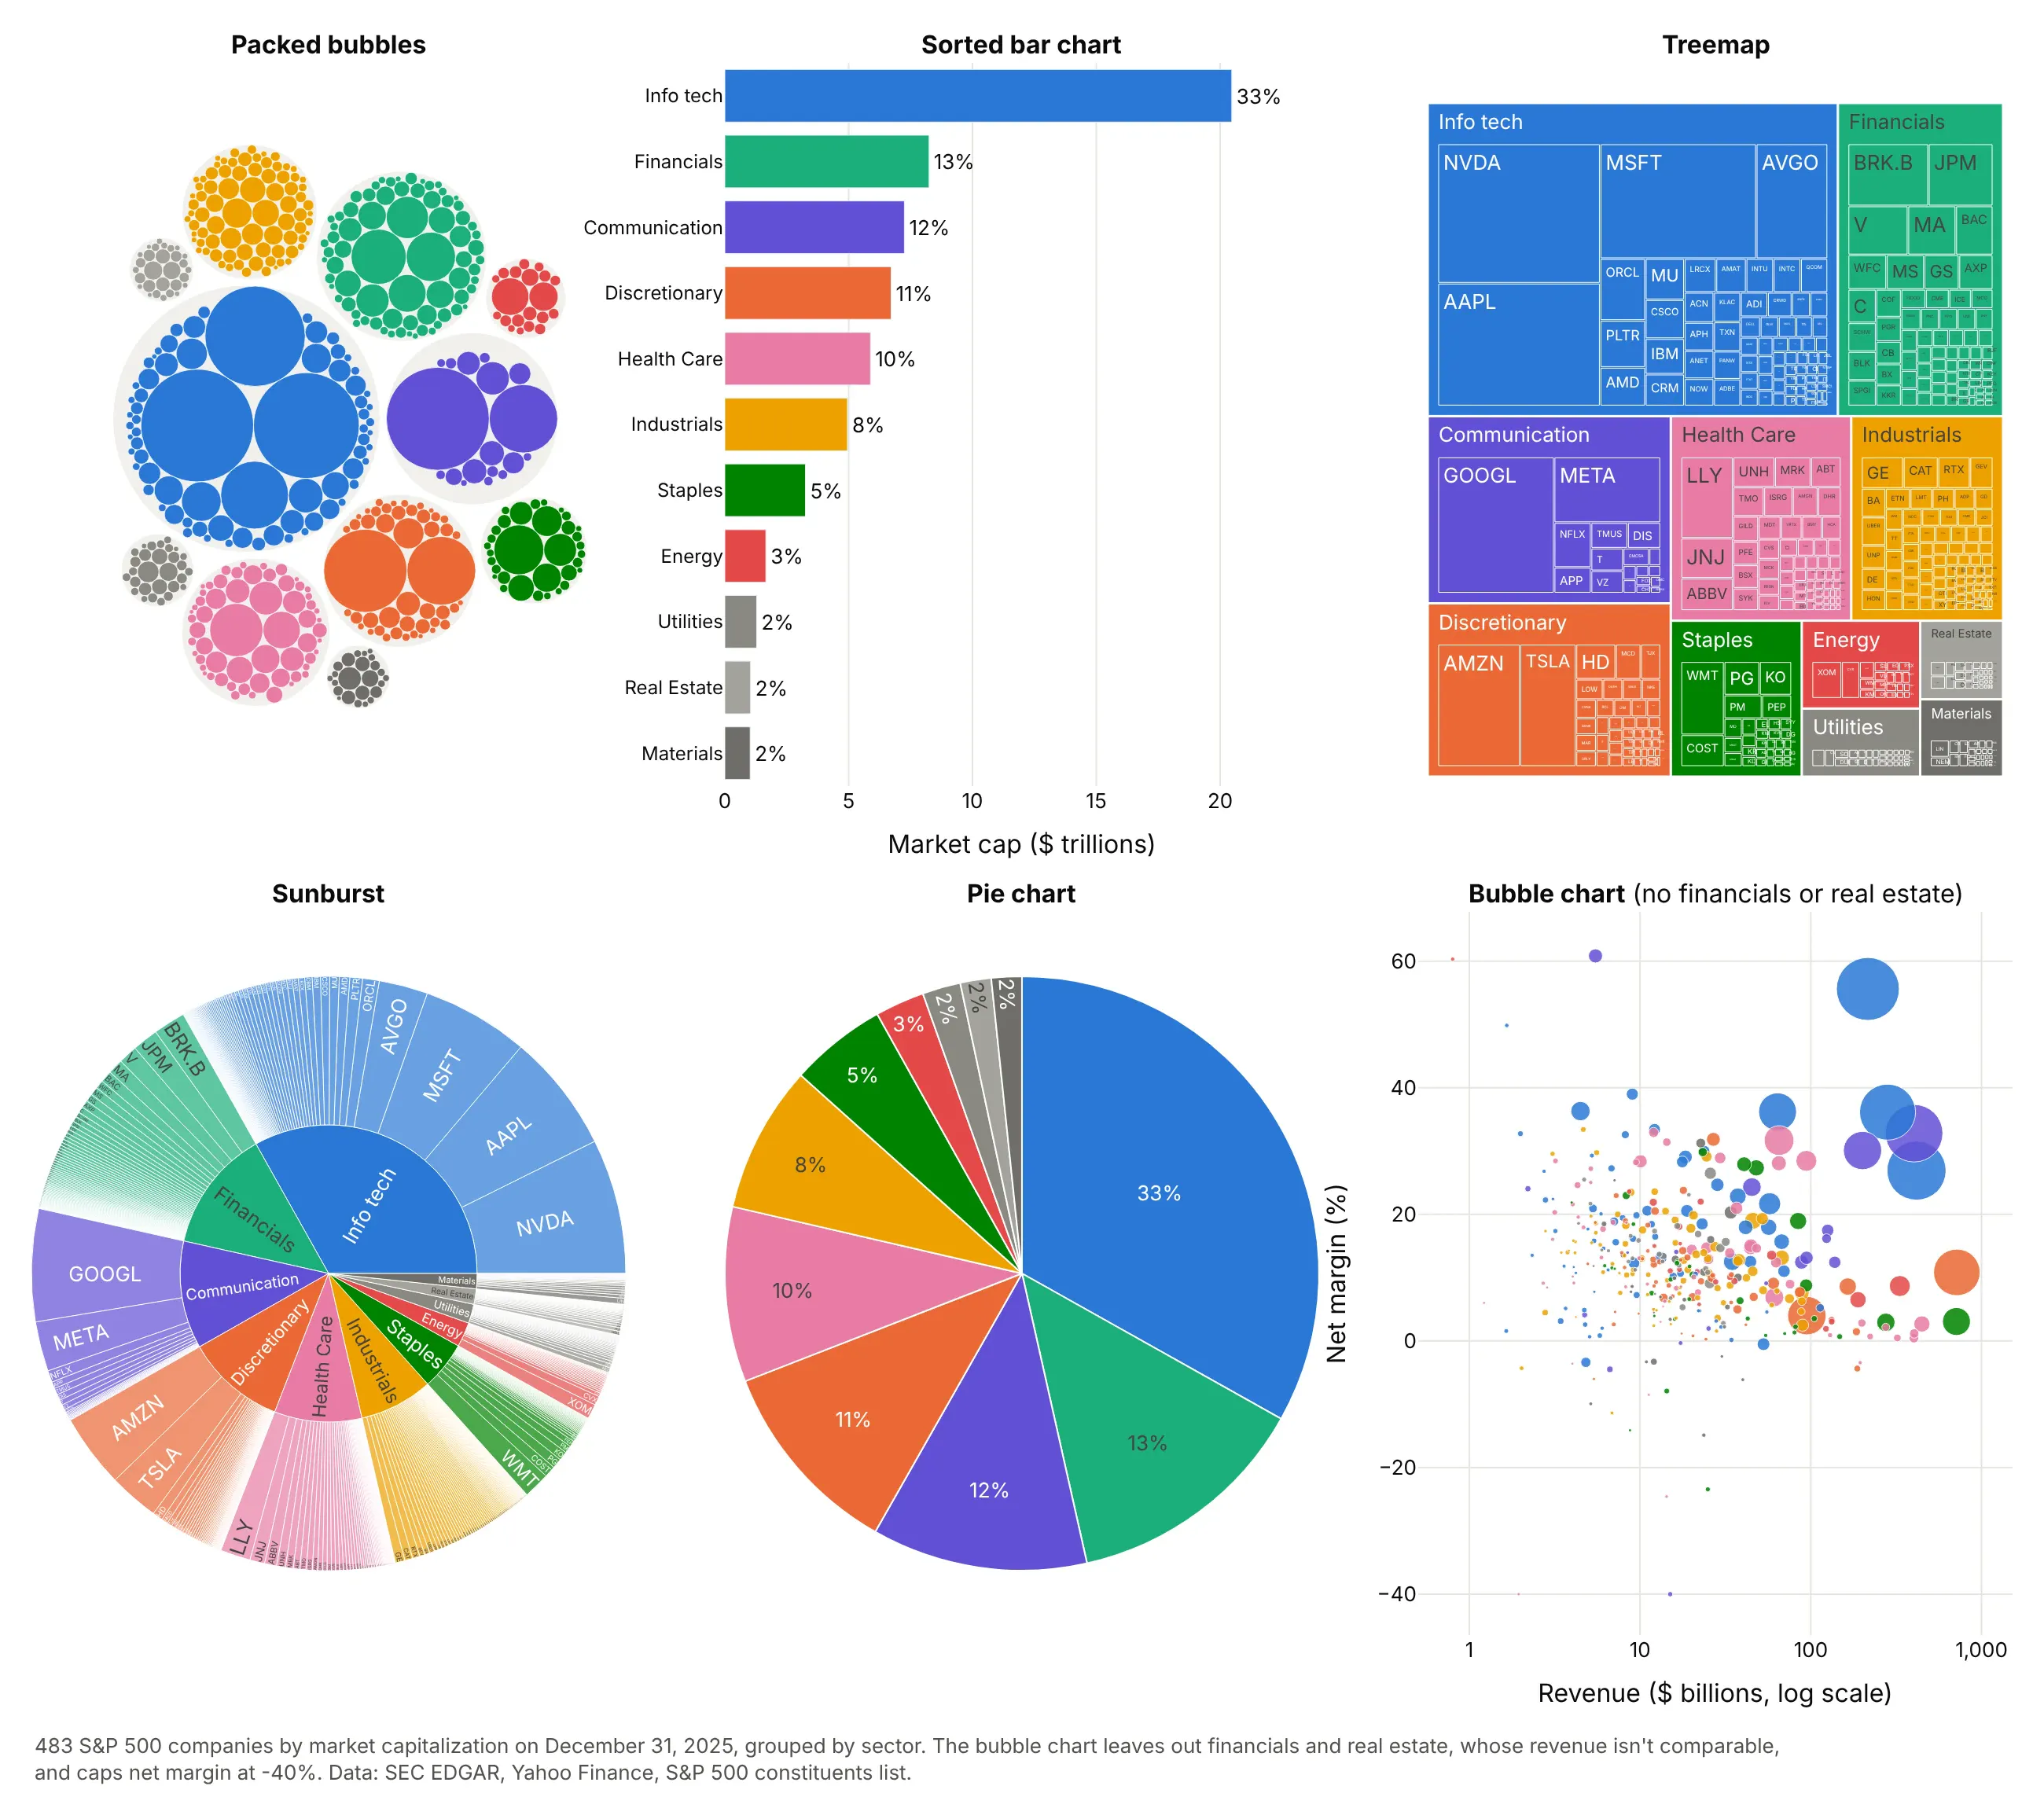
- Sorted bar chart (better for precise comparisons). Length on a common baseline is the most accurate way to compare values, so the bar chart shows that financials (13%) are a bit bigger than communication (12%), which the bubbles can't. It shows one level, though, not 483 companies. See the bar chart guide.
- Treemap (better for part-to-whole). Rectangles fill all the space, so the areas of the sectors add up exactly and more companies get a label. Packed bubbles leave gaps, which makes group circles bigger than their totals.
- Sunburst (different). Rings show the hierarchy level by level and are good for drilling down, but the outer ring of 483 thin slices is hard to read.
- Pie chart (works too, for one level). Eleven sectors fit in a pie, but 483 companies don't, and small slices are hard to compare.
- Bubble chart (different). Putting the same bubbles on x and y axes, here revenue and net margin, adds two more numbers per company, at the cost of overlap and empty space.
Packed bubbles win when the point is an overview: many items, a few big ones, groups you can see at a glance, and a chart people want to look at. When readers have to compare values precisely, use a bar chart.
How to make a packed bubble chart
With AI
ChatGPT, Claude Code, GitHub Copilot, Cursor and other AI tools are excellent at writing Plotly code. Name Plotly in the prompt, and say how the circles should be sized and placed:
Make a plotly packed bubble chart from solar.csv (columns: country, region, solar_gw).- Size circles by area: radius = sqrt(solar_gw).- Place them with a front-chain circle packing function (like d3.packSiblings), biggest first,and draw each circle as a layout shape with type="circle" and layer="below".- Hide both axes and set yaxis scaleanchor="x", so circles stay round.- Color by region with a legend, and put "name" and "value GW" only inside circles big enough to hold them.- Add invisible markers the size of each circle so hovering anywhere shows the country and its value.- Check: no two circles overlap, and the circle areas are proportional to the values.
With Plotly Studio
Plotly Studio is a desktop app where you point an AI at a dataset and it builds charts and a Dash app around your questions. Ask for a packed bubble chart the same way:
Show the S&P 500 as packed bubbles: one circle per company sized by market cap, packed inside a circle per sector, with tickers inside the big circles, a dropdown to pick a date, and a sorted bar chart of sector totals next to it.
Make a packed bubble chart in Python or JavaScript
This is the code AI tools write under the hood. Plotly has no packing function, so the Python version starts with a short one: a port of the front-chain algorithm D3 uses, which returns a center for every circle. packed_bubbles() then draws each circle as a layout shape in data units, so the sizes are exact at any zoom, and labels the circles with room for text:
import mathimport pandas as pdimport plotly.graph_objects as godef pack_circles(radii):"""Front-chain circle packing (Wang et al. 2006, as in d3.packSiblings), biggest circle first.Returns one (x, y) center per radius, in input order, with the pack centered on (0, 0)."""order = sorted(range(len(radii)), key=lambda i: -radii[i])r = [radii[i] for i in order]x, y = [0.0] * len(r), [0.0] * len(r)def place(b, a, c): # put circle c next to circles a and b, touching bothdx, dy = x[b] - x[a], y[b] - y[a]d2, ra, rb = dx * dx + dy * dy, (r[a] + r[c]) ** 2, (r[b] + r[c]) ** 2if ra > rb:u = (d2 + rb - ra) / (2 * d2)v = math.sqrt(max(0, rb / d2 - u * u))x[c], y[c] = x[b] - u * dx - v * dy, y[b] - u * dy + v * dxelse:u = (d2 + ra - rb) / (2 * d2)v = math.sqrt(max(0, ra / d2 - u * u))x[c], y[c] = x[a] + u * dx - v * dy, y[a] + u * dy + v * dxdef hits(a, b):return (r[a] + r[b]) * (1 - 1e-9) > math.hypot(x[b] - x[a], y[b] - y[a])def score(a): # how far the gap after circle a is from the centerb, ab = nxt[a], r[a] + r[nxt[a]]return math.hypot((x[a] * r[b] + x[b] * r[a]) / ab, (y[a] * r[b] + y[b] * r[a]) / ab)if len(r) > 1:x[0], x[1] = -r[1], r[0]if len(r) > 2:place(1, 0, 2)nxt, prv = {0: 1, 1: 2, 2: 0}, {1: 0, 2: 1, 0: 2} # the outer ring of circlesa, b, i = 0, 1, 3while i < len(r):place(a, b, i)j, k, sj, sk, hit = nxt[b], prv[a], r[b], r[a], Falsewhile not hit: # does the new circle overlap one on the ring? then skip past it and retryif sj <= sk:if hits(j, i):b, hit = j, Truesj, j = sj + r[j], nxt[j]else:if hits(k, i):a, hit = k, Truesk, k = sk + r[k], prv[k]if j == nxt[k]:breakif hit:nxt[a], prv[b] = b, acontinueprv[i], nxt[i], nxt[a], prv[b] = a, b, i, iring, c = [a], nxt[i]while c != i: # next, start from the gap on the ring closest to the centerring.append(c)c = nxt[c]a = min(ring, key=score)b, i = nxt[a], i + 1cx = sum(xi * ri ** 2 for xi, ri in zip(x, r)) / sum(ri ** 2 for ri in r)cy = sum(yi * ri ** 2 for yi, ri in zip(y, r)) / sum(ri ** 2 for ri in r)centers = [None] * len(r)for pos, i in enumerate(order):centers[i] = (x[pos] - cx, y[pos] - cy)return centersdef packed_bubbles(df, label, value, color=None):"""Packed bubble chart: circle area proportional to df[value], drawn as exact layout shapes."""r = (df[value] ** 0.5).tolist() # area ~ value, so radius ~ square root of valuecenters = pack_circles(r)R = max(math.hypot(cx, cy) + ri for (cx, cy), ri in zip(centers, r))colors = df[color].tolist() if color else ["#2a78d6"] * len(df)fig = go.Figure()for (cx, cy), ri, c in zip(centers, r, colors):fig.add_shape(type="circle", x0=cx - ri, x1=cx + ri, y0=cy - ri, y1=cy + ri,fillcolor=c, line=dict(color="white", width=1), layer="below")big = [i for i, ri in enumerate(r) if ri > 0.12 * R] # label only the circles with room for textfig.add_trace(go.Scatter(x=[centers[i][0] for i in big], y=[centers[i][1] for i in big], mode="text",text=[f"<b>{df[label].iloc[i]}</b><br>{df[value].iloc[i]:,.0f}" for i in big],textfont=dict(color="white"), hoverinfo="skip"))fig.update_xaxes(visible=False, range=[-R, R])fig.update_yaxes(visible=False, range=[-R, R], scaleanchor="x") # 1:1, so circles stay roundfig.update_layout(width=700, height=700, plot_bgcolor="white", showlegend=False)return figdf = pd.read_csv("solar.csv") # country, solar_gw: one row per countryfig = packed_bubbles(df, label="country", value="solar_gw")fig.show()
The shapes go on layer="below" so the text trace draws on top of them, and scaleanchor="x" keeps one unit the same length on both axes, so circles stay round when the chart is resized. Layout shapes don't show hover labels; the examples in this guide add a scatter trace of invisible markers, one per circle, with the marker size set to the circle's diameter in pixels. For groups, call pack_circles once per group, take the circle around each group's circles as that group's radius, pack the groups, and shift each group's circles by its center.
In JavaScript, d3-hierarchy's d3.packSiblings (ISC license) computes the packing and plotly.js draws it:
<div id="chart"></div><script src="https://cdn.plot.ly/plotly-4.1.1.min.js"></script><script src="https://cdn.jsdelivr.net/npm/d3-hierarchy@3.1.2/dist/d3-hierarchy.min.js"></script><script>// Installed solar capacity at the end of 2025, GW (IRENA via Our World in Data), the 12 largest countriesconst data = [["China", 1202], ["US", 211], ["India", 136], ["Germany", 107], ["Japan", 92], ["Brazil", 65],["Spain", 47], ["Australia", 42], ["Italy", 41], ["Korea", 34], ["France", 31], ["Netherlands", 26]];// d3.packSiblings places circles side by side (front-chain algorithm); radius = sqrt(value), so area ~ valueconst circles = d3.packSiblings(data.map(([name, gw]) => ({name, gw, r: Math.sqrt(gw)})));const {x: cx, y: cy, r: R} = d3.packEnclose(circles); // the circle around them allPlotly.newPlot("chart", [{x: circles.map(c => c.x - cx), y: circles.map(c => c.y - cy), mode: "text",text: circles.map(c => c.r > 6 ? `<b>${c.name}</b><br>${c.gw} GW` : ""),textfont: {color: "white"}, hoverinfo: "skip"}], {width: 700, height: 700, showlegend: false, plot_bgcolor: "white",xaxis: {visible: false, range: [-R, R]},yaxis: {visible: false, range: [-R, R], scaleanchor: "x"},shapes: circles.map(c => ({type: "circle", layer: "below", fillcolor: "#2a78d6", line: {color: "white", width: 1},x0: c.x - cx - c.r, x1: c.x - cx + c.r, y0: c.y - cy - c.r, y1: c.y - cy + c.r}))});</script>
For a hierarchy, d3.hierarchy(data).sum(d => d.value) followed by d3.pack().size([w, h]).padding(3) gives every node's x, y and r in one call.
Share it
Every Plotly chart has a Share chart button (the cloud icon in its toolbar) that uploads it to Plotly Cloud and gives you a link. Only you can see it until you change its visibility.
For a live app, put the chart in a Dash app and publish it with the Plotly Cloud command-line interface (CLI). Coding agents can run these commands for you:
pip install "dash[cloud]"plotly user loginplotly app publish
If your data has to stay in your own cloud or data center, publish to Dash Enterprise instead.
Dos and don'ts
Most of what goes wrong in a packed bubble chart is the sizing and the labels. Here are the 30 countries with the most solar capacity both ways, in the same region colors.
Don't set the radius in proportion to the value, which makes China look 170 times Japan, leave the axes and gridlines on (positions in a packing mean nothing), print every name and raw number like 1202.1787 in every circle until they pile up, or use a default serif font:
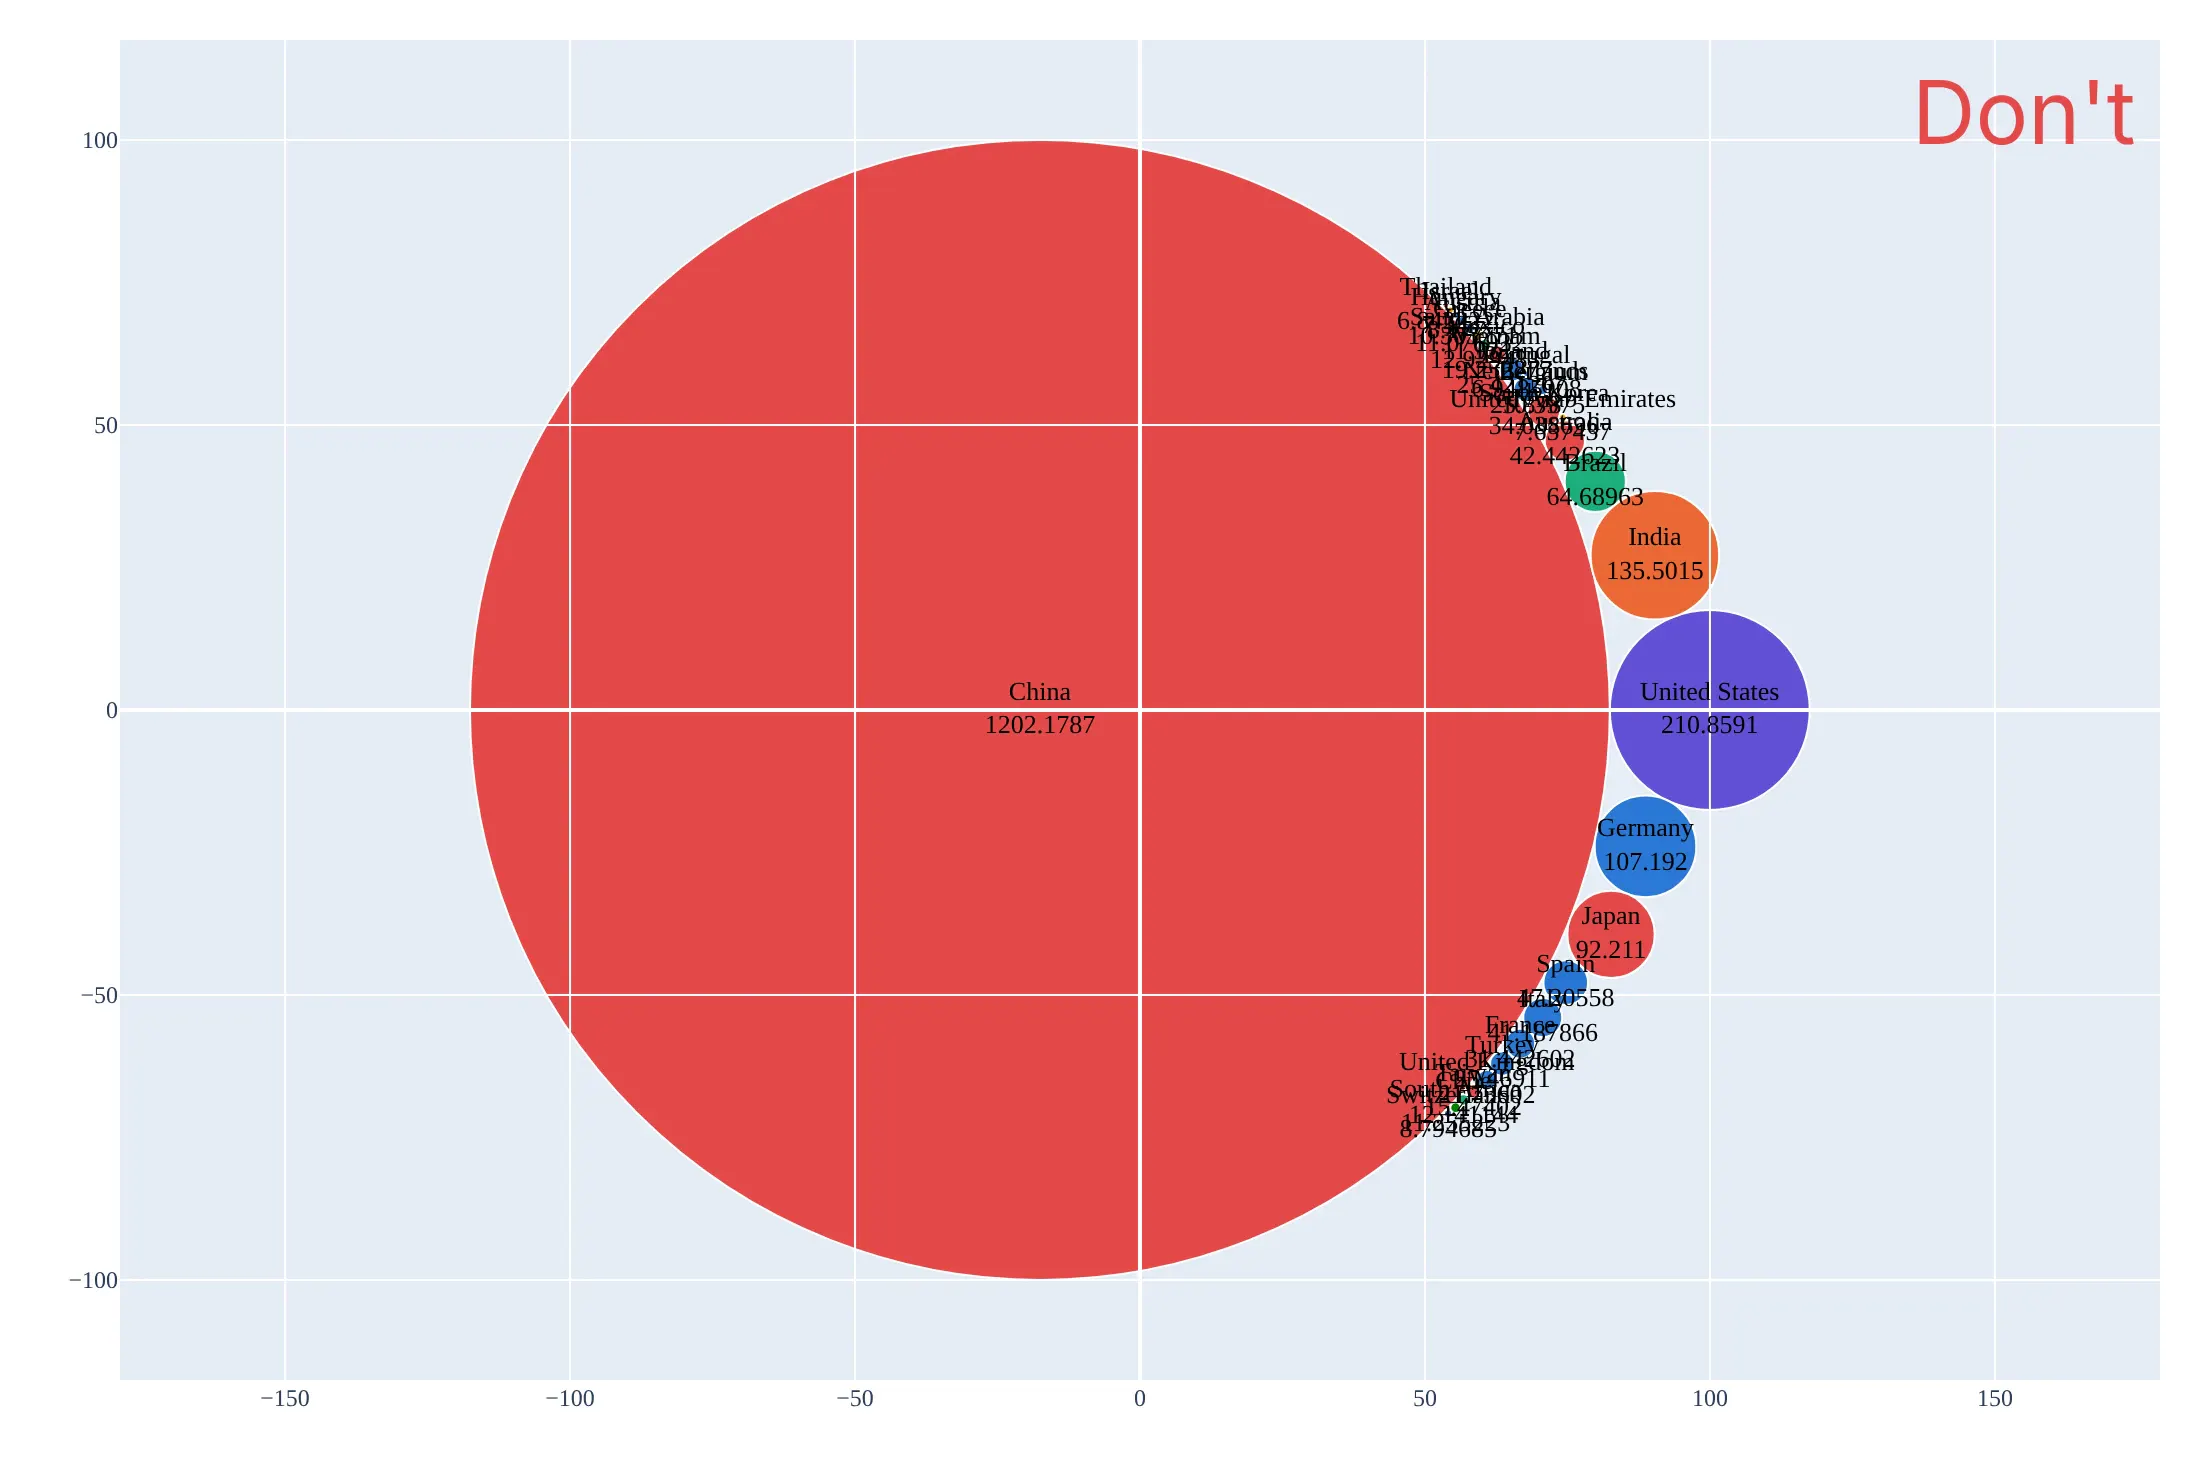
Do size by area, hide the axes, put names and rounded values only in circles that have room, leave the rest to hover, and add a legend for the colors:
Checklist
Do
- Make the area proportional to the value (radius = square root of the value).
- Use layout shapes in data units, or markers sized in pixels from the same scale, and scaleanchor so circles stay round.
- Label only the circles that can hold a label, and put every value in the hover text.
- Use color for groups or for one highlighted category, with a legend or a colored word in the subtitle.
- Say in the subtitle what the area is ("Bubble area is market cap") and what's left out.
Don't
- Read precise differences between similar circles; use a bar chart for that.
- Draw negative values or values that overlap as if they were parts of a whole.
- Compare group circles in a nested packing as if their areas were their totals; the gaps make them bigger.
- Use thousands of layout shapes; above a few thousand circles, draw them as one scatter trace.
Options to customize
A packed bubble chart in Plotly is a packing function plus shapes or markers, so these are the options that matter most. The full lists are in the layout shapes reference, the scatter trace reference and the d3-hierarchy pack documentation.
- layout.shapes with type="circle": one circle per item between x0, x1, y0, y1 in data units, so its size is exact and zooms with the chart.
- layer="below": draws shapes under the traces, so text and hover markers stay on top.
- yaxis.scaleanchor="x", scaleratio=1: one data unit is the same length on both axes, which keeps circles round.
- xaxis.visible=False, yaxis.visible=False: hides axes and gridlines, which mean nothing in a packing.
- go.Scatter(mode="markers") with marker.size in pixels: the fast way to draw thousands of circles (diameter = 2 × radius × pixels per unit), and the hover layer when you draw shapes.
- mode="text" with textfont.size as a list: labels whose font size grows with the circle.
- hovertemplate and customdata: the name and value of each circle on hover, for the circles too small to label.
- fillcolor and line: a white outline of 0.5 to 1.5 px separates touching circles.
- add_annotation with bgcolor: a group name on a white tab at the top of each group circle.
- d3.packSiblings, d3.packEnclose, d3.pack().padding() (JavaScript): the packing itself, the circle around a group, and the space between nested circles.
More packed bubble chart examples
Six more packed bubble charts built from real public data, each with its source, the technique that makes it work and a prompt to rebuild it.
1. Medicare's spending on GLP-1 drugs
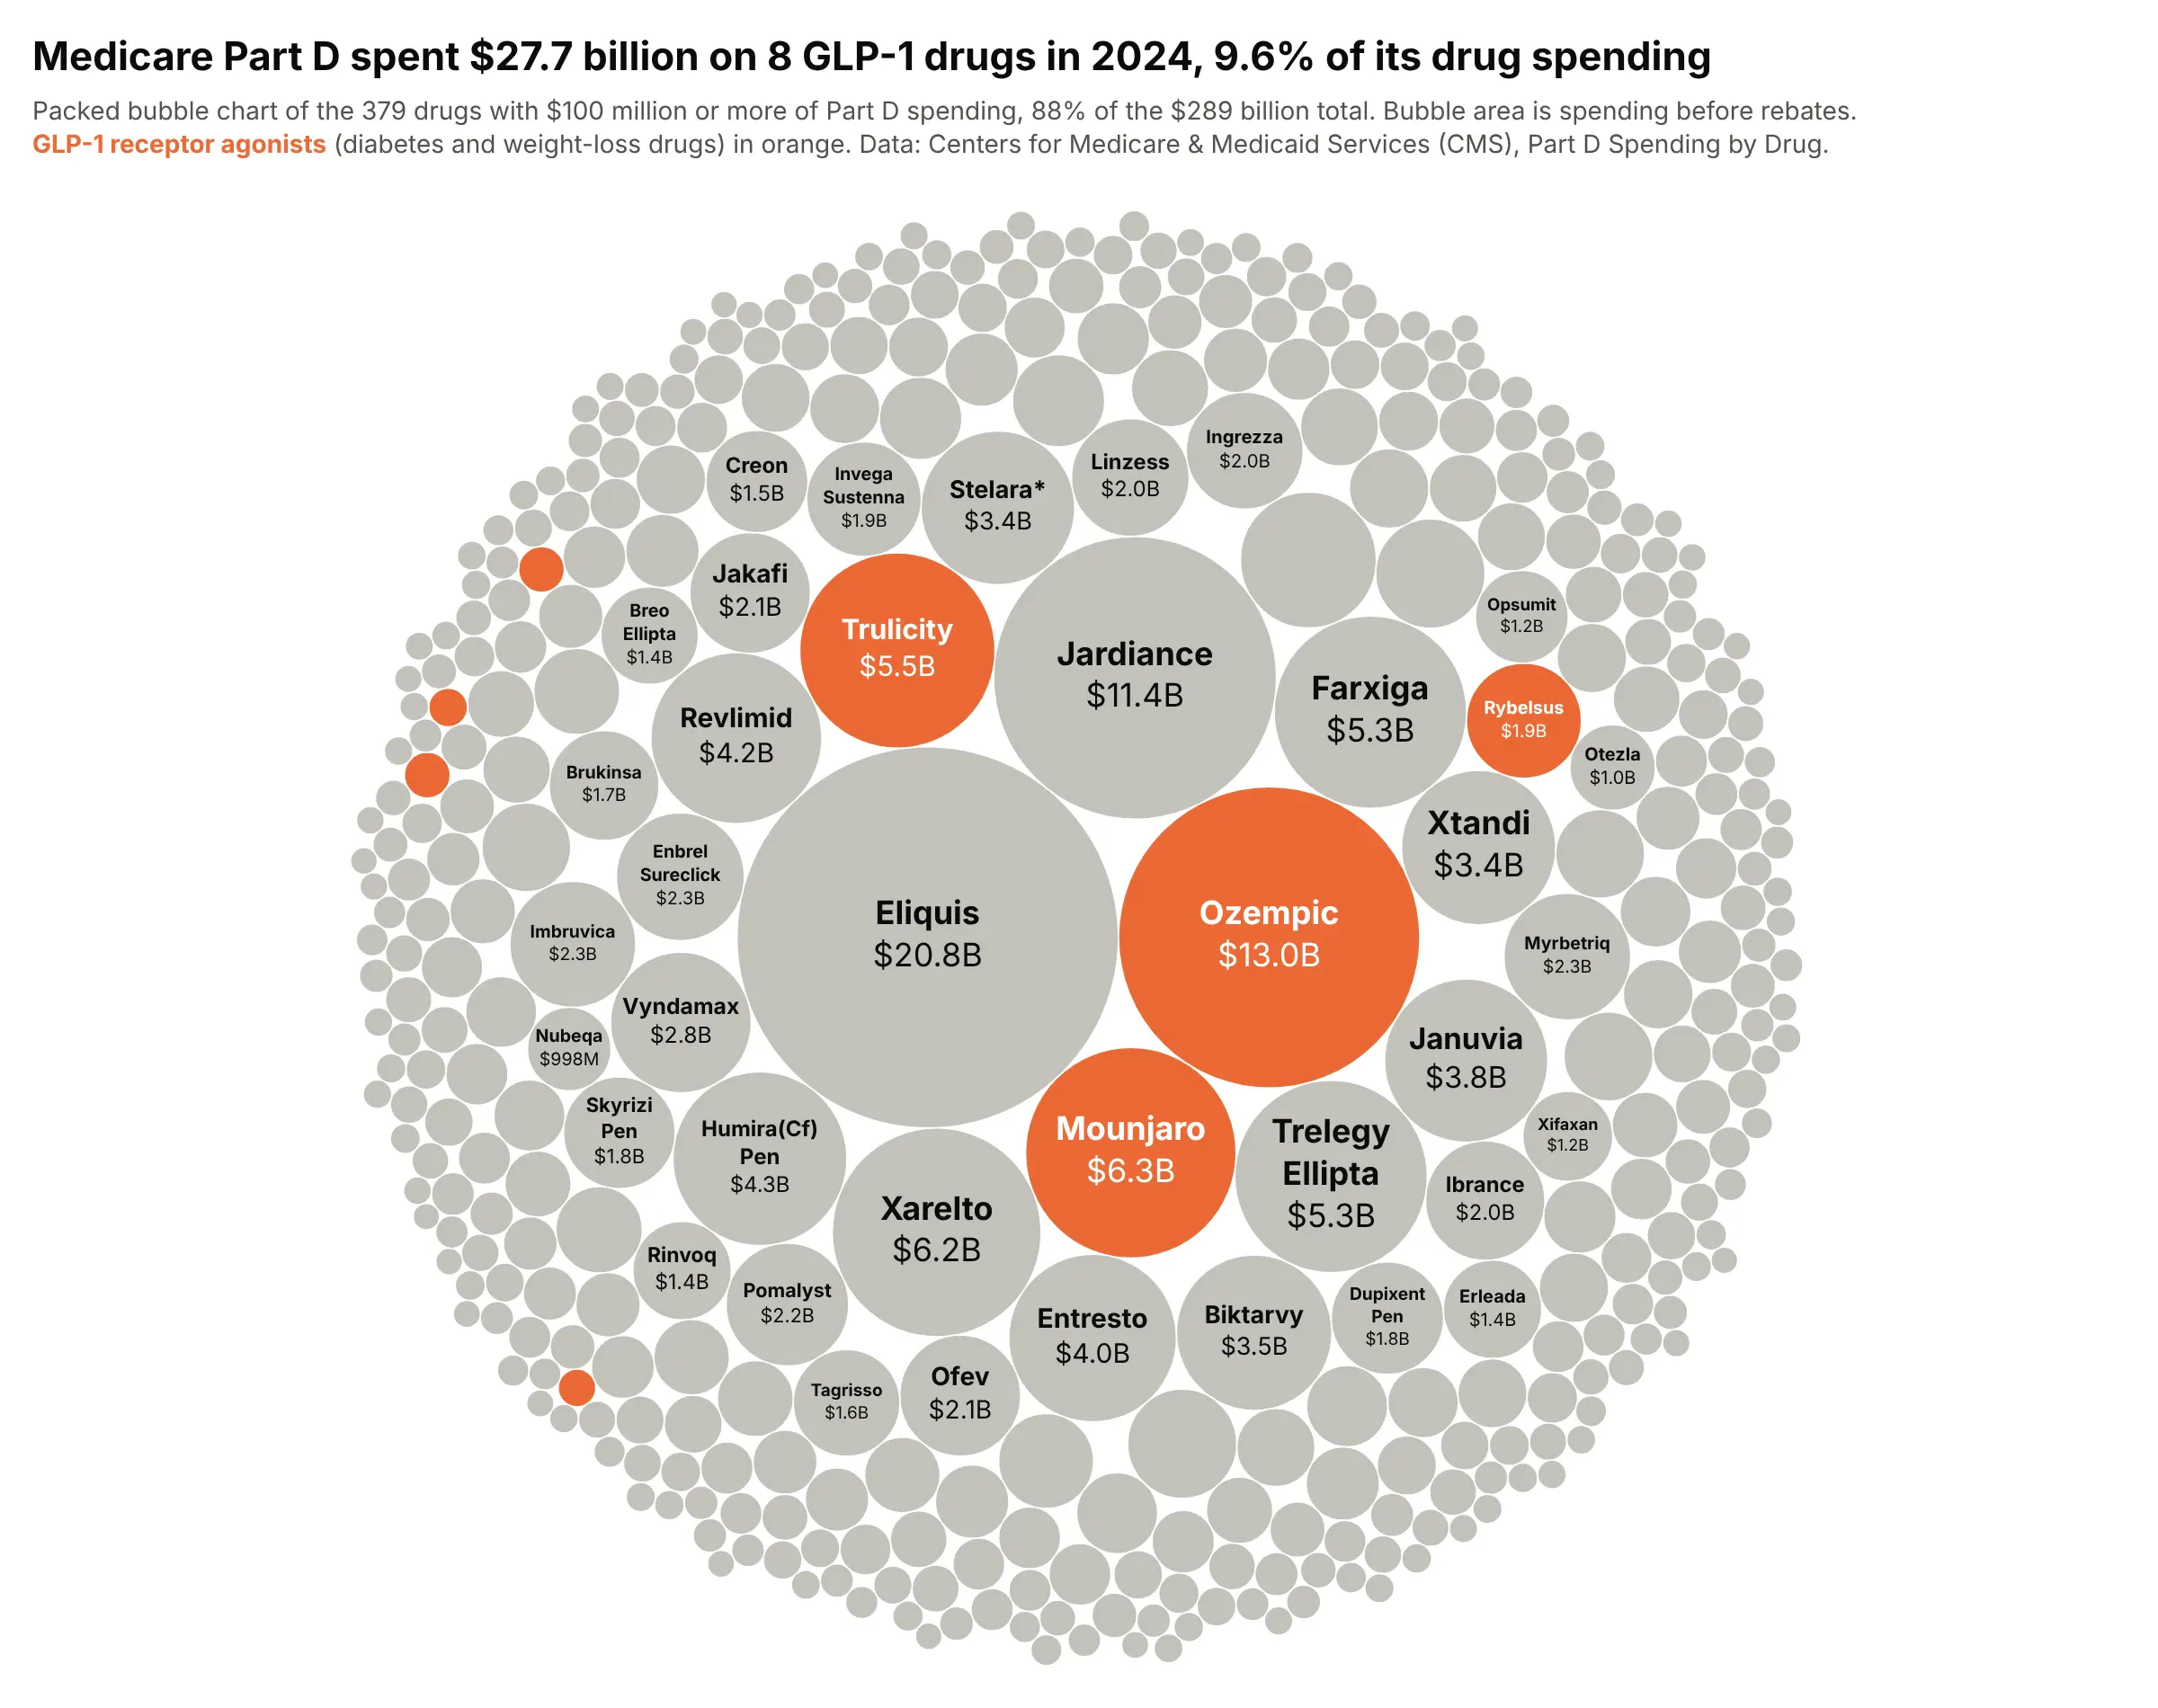
Eight GLP-1 drugs, used for diabetes and weight loss, cost Medicare Part D $27.7 billion in 2024, 9.6% of its $289 billion drug bill. Ozempic alone was $13.0 billion, second only to Eliquis. Data: Centers for Medicare & Medicaid Services (CMS), Medicare Part D Spending by Drug, 2024, before rebates.
Tip: to highlight one class among hundreds of items, color it and make everything else light gray, then name the color in the subtitle instead of adding a legend.
Get the data from the CMS "Medicare Part D Spending by Drug" dataset for 2024 (data.cms.gov), the"Overall" row per brand (columns: brand, generic, spending_mn, beneficiaries, claims), drugs with$100 million or more, plus a glp1 flag for semaglutide, tirzepatide, dulaglutide, liraglutide, exenatideand lixisenatide.Build a plotly packed bubble chart with area proportional to spending: GLP-1 drugs in orange, others inlight gray, brand and spending inside the circles that fit, and patients in the hover text.
2. All 13,832 US power plants by fuel
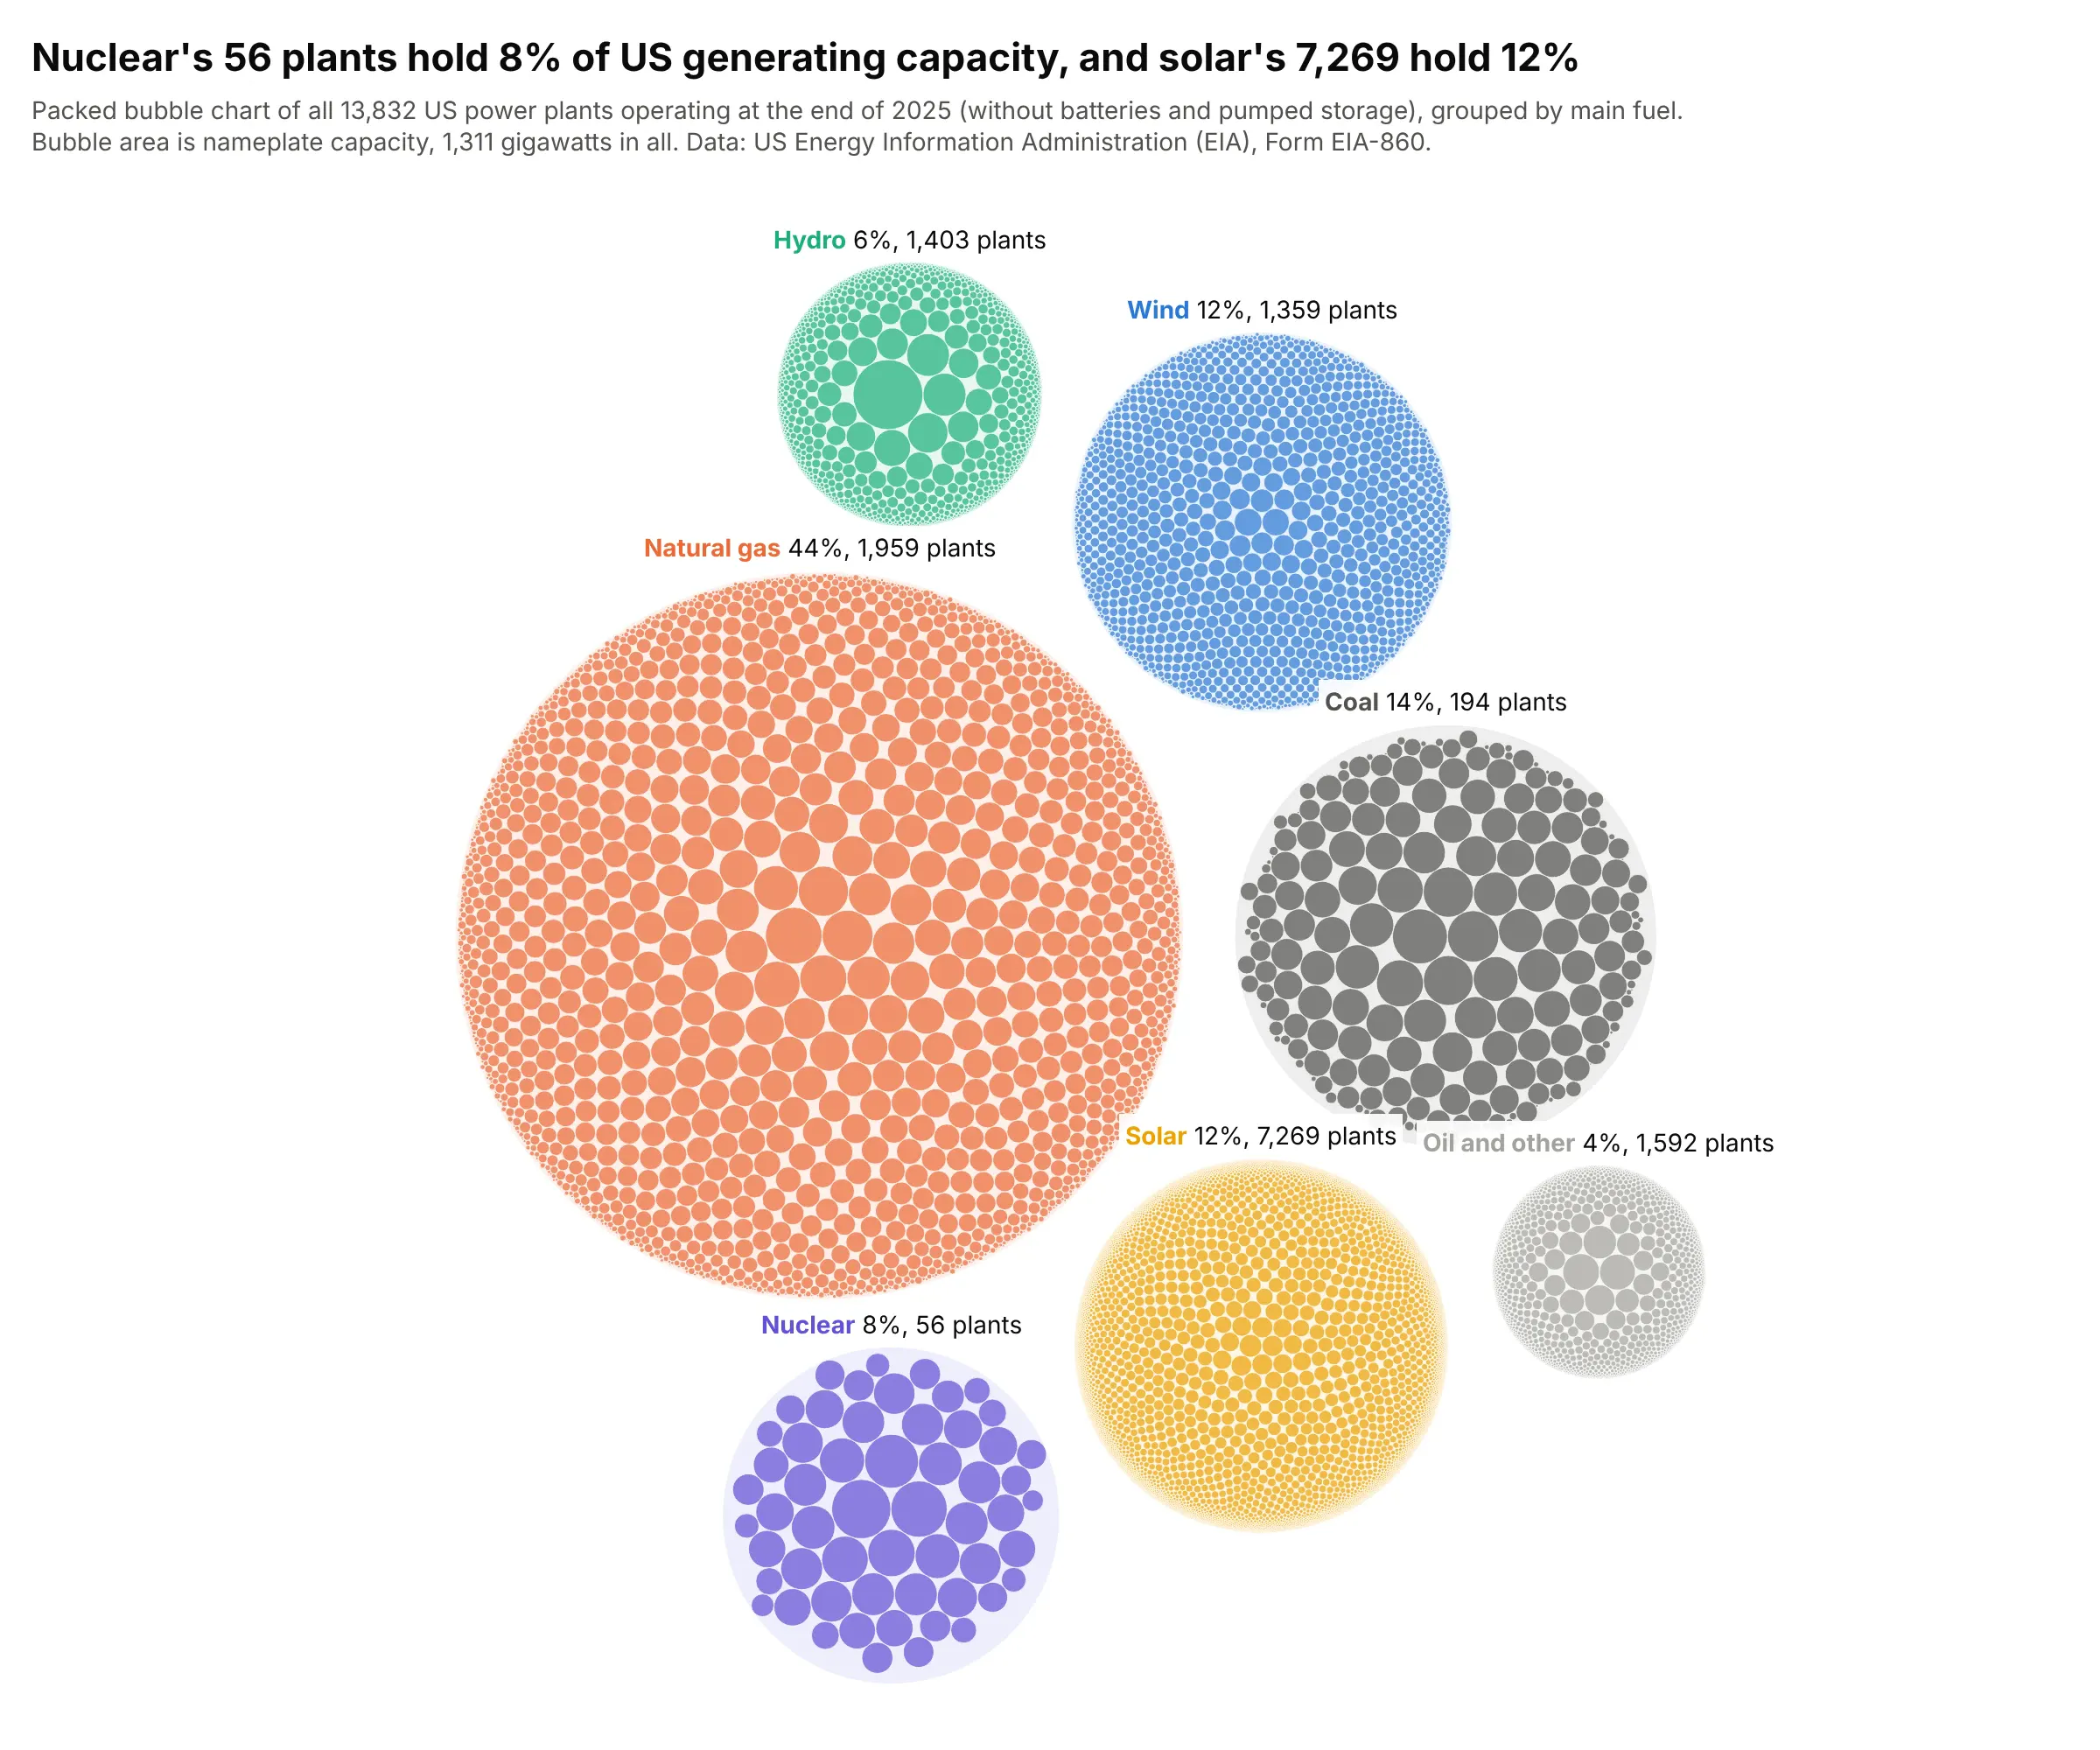
Nuclear's 56 plants hold 8% of US generating capacity, and solar needs 7,269 plants for 12%, so the nuclear circle is a few big bubbles and the solar circle is a fine dust. Natural gas is 44% of the 1,311 gigawatts. Data: US Energy Information Administration (EIA), Form EIA-860, 2025.
Tip: for thousands of circles, draw them as one scatter trace whose marker size is the diameter in pixels, which plotly.js draws several times faster than layout shapes.
Get the data from the US Energy Information Administration (EIA) Form EIA-860 2025 files (3_1_Generator_Y2025.xlsx,sheet Operable) and sum nameplate capacity per plant, assigning each plant the fuel group with the most MW(columns: plant_id, plant_name, state, fuel, capacity_mw). Leave out batteries and pumped storage.Build a plotly two-level packed bubble chart: pack each fuel's plants (radius = sqrt(MW)), draw a lightcircle around each fuel, pack the fuel circles, draw the plants as one scatter trace with marker sizes inpixels, and label each fuel with its share of capacity and number of plants.
3. The solar system's moons to scale
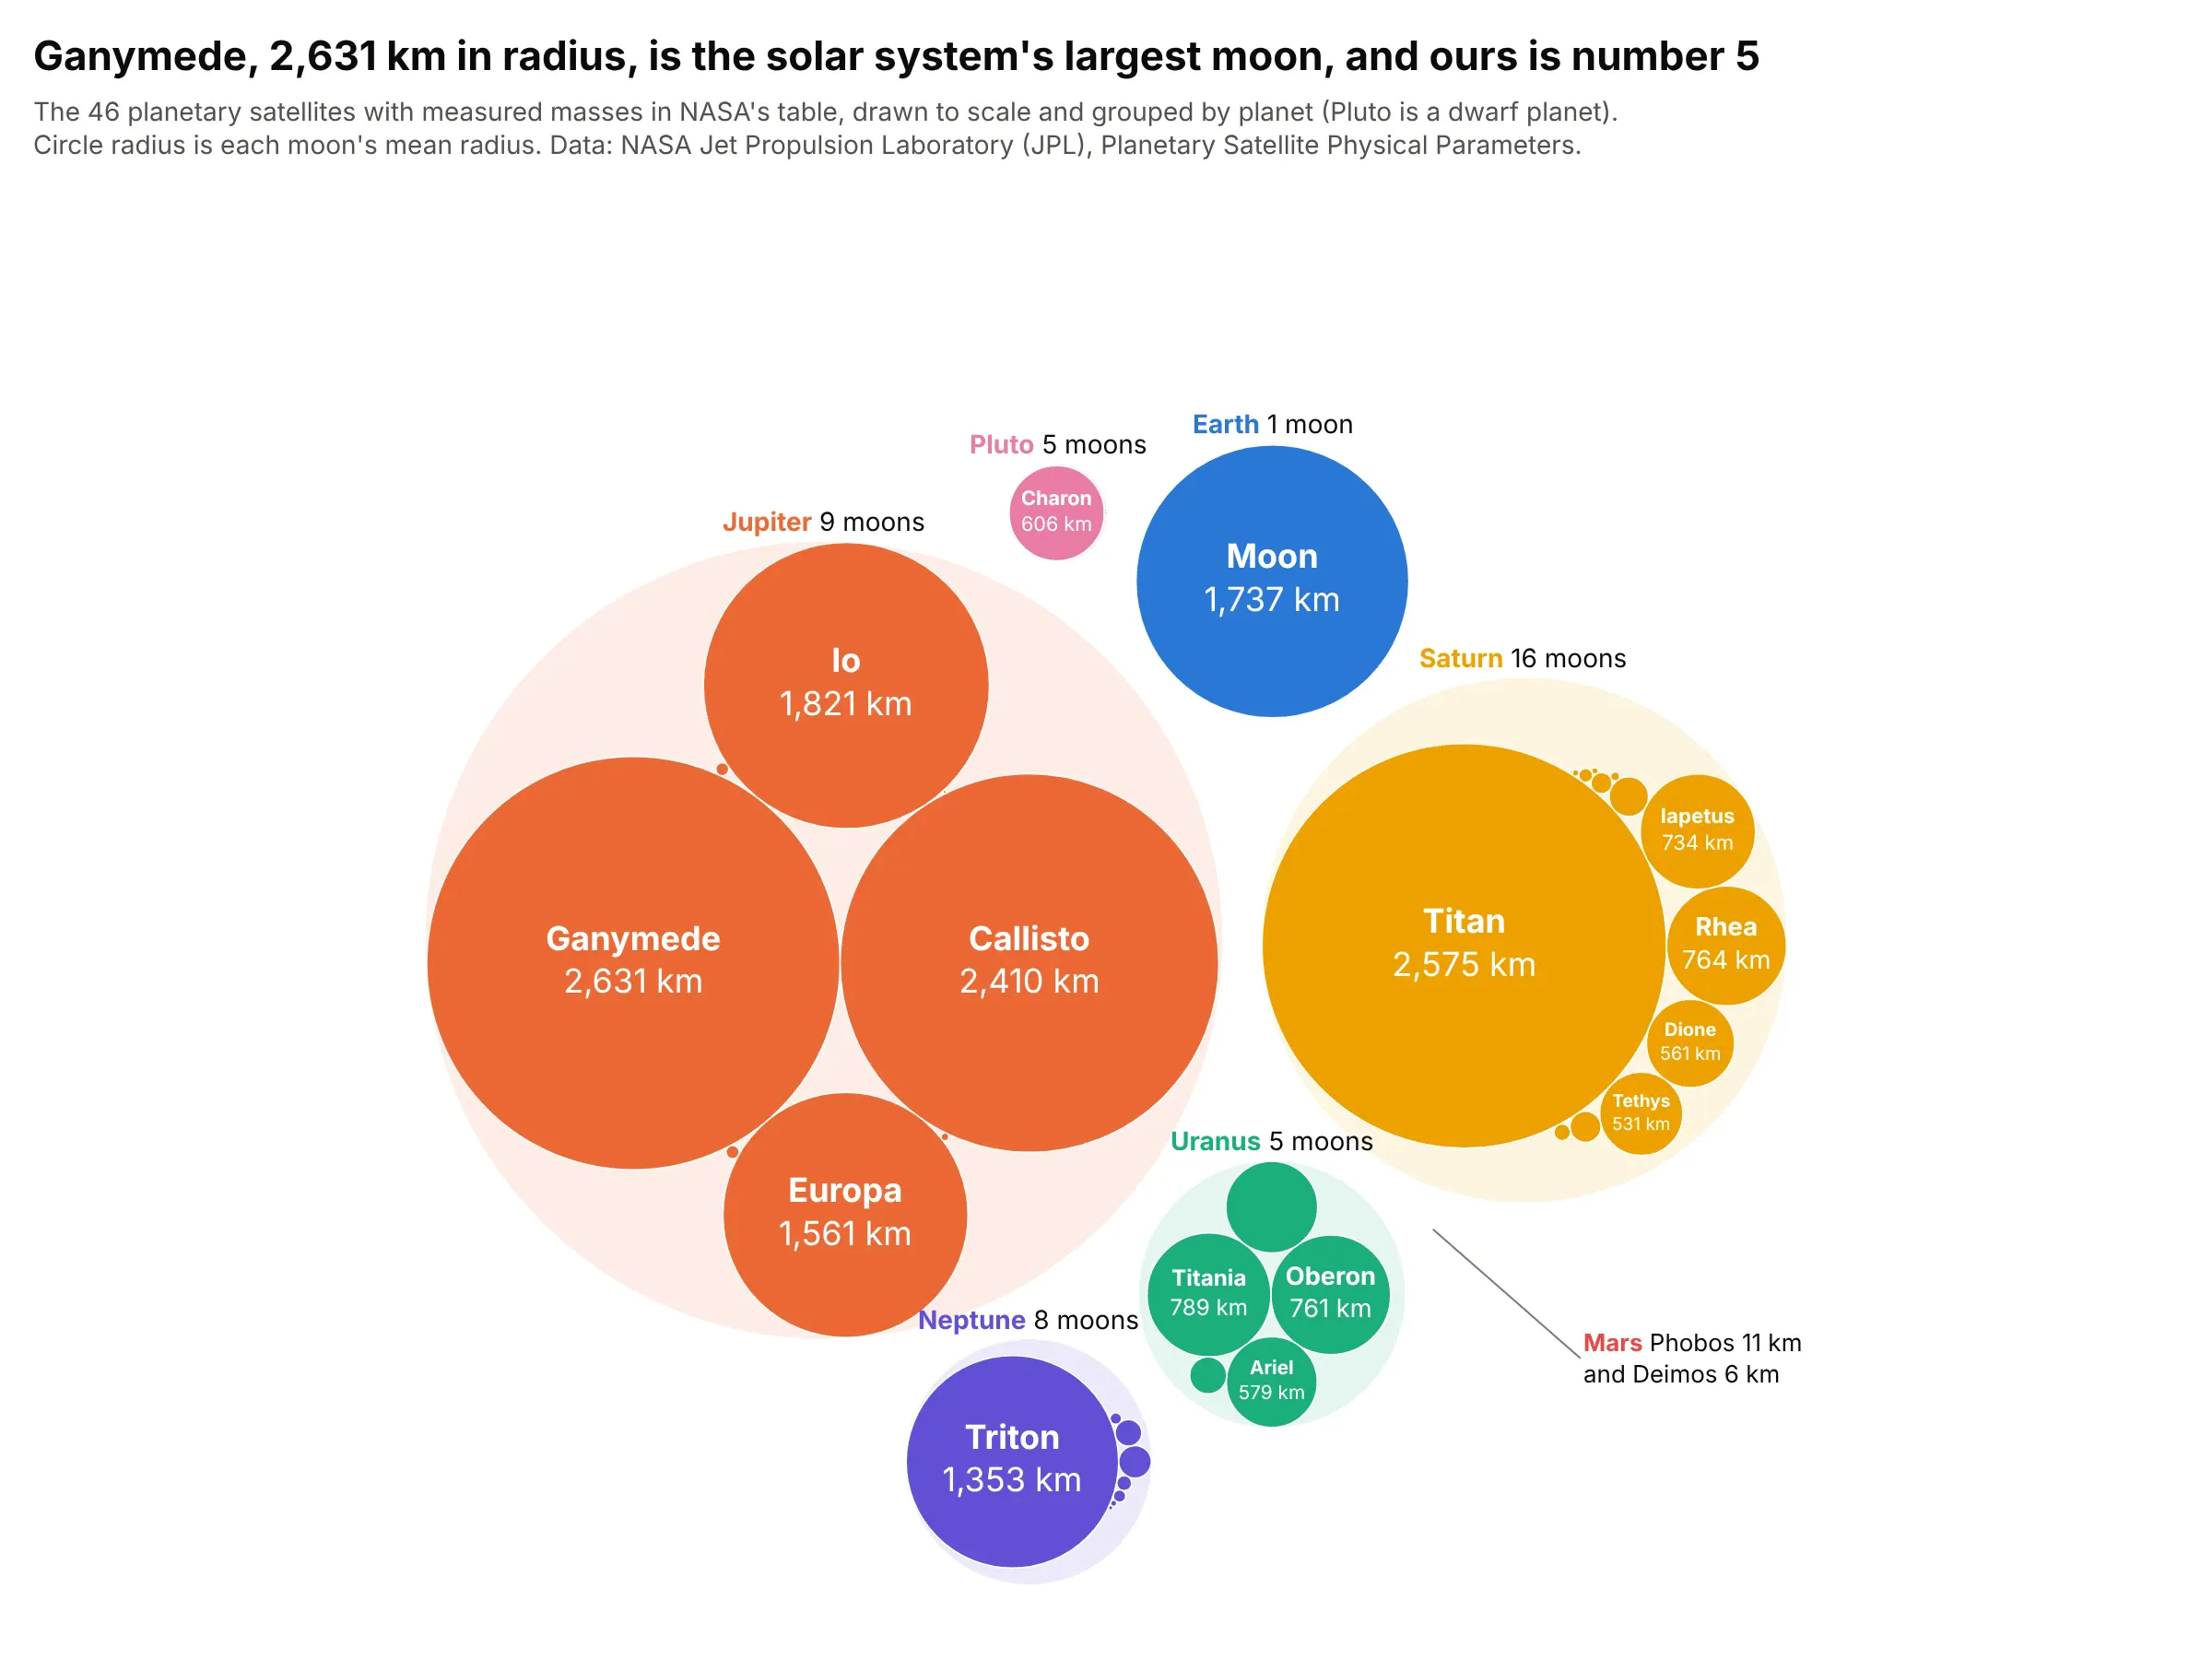
Ganymede, 2,631 km in radius, is the solar system's largest moon, and ours is the fifth largest of the 46 in NASA's table. Jupiter's four big moons take most of the space, and Mars' two moons are too small to see. Data: NASA Jet Propulsion Laboratory (JPL) Solar System Dynamics, Planetary Satellite Physical Parameters.
Tip: when the circles are round objects, set the radius to their real radius (pass radius² as the value), so the chart is a scale model.
Get the data from NASA JPL Solar System Dynamics "Planetary Satellite Physical Parameters" (the table ofsatellites with GM, mean radius and density) (columns: planet, moon, radius_km).Build a plotly nested packed bubble chart with each moon's circle radius equal to its mean radius, a lightcircle per planet, moon names and radii inside the circles that fit, and an annotation with a leader linefor Mars' moons, which are too small to see.
4. Which telescopes found the exoplanets
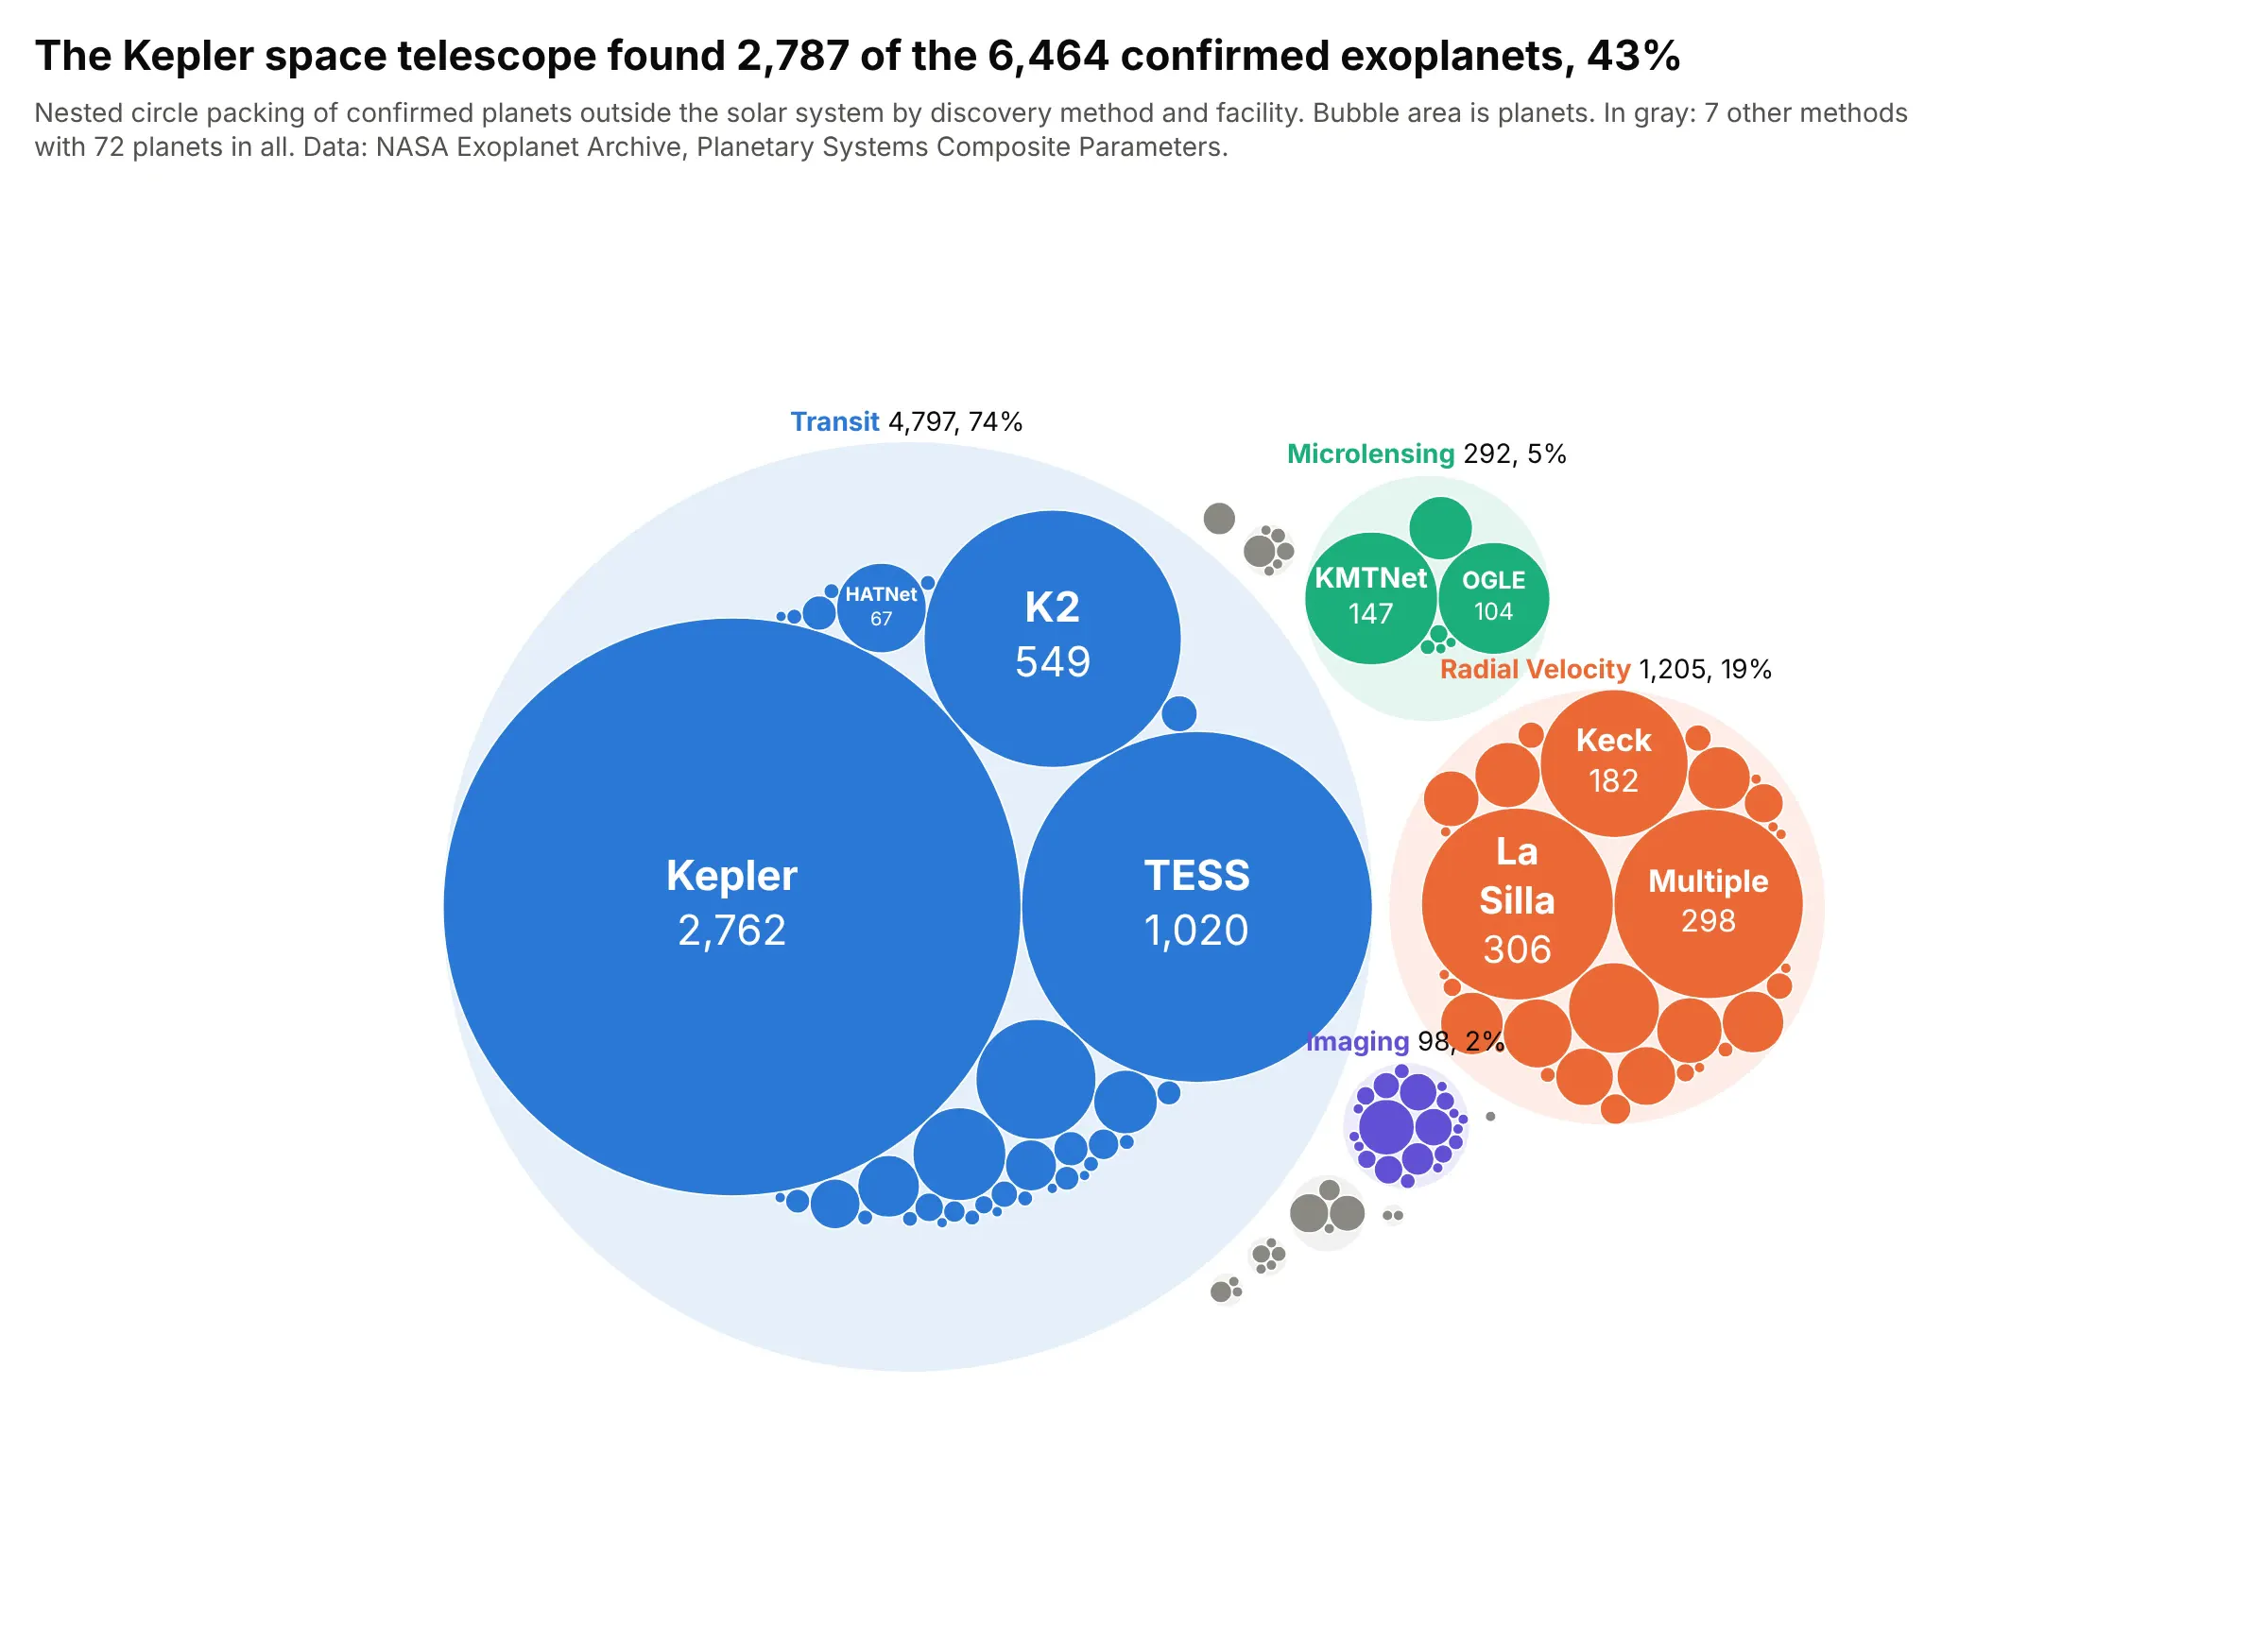
The Kepler space telescope found 2,787 of the 6,464 confirmed exoplanets, 43%, almost all of them by watching stars dim as a planet crossed in front (the transit method). Radial velocity, which measures a star's wobble, found 19%. Data: NASA Exoplanet Archive, Planetary Systems Composite Parameters.
Tip: with a long tail of tiny groups, color the big groups, put the small ones in one gray, and give their count and total in the subtitle.
Get the data from the NASA Exoplanet Archive TAP service, table pscomppars, grouped by discoverymethodand disc_facility with a count of planets (columns: method, facility, planets).Build a plotly nested packed bubble chart: one circle per method (light tint) holding a circle perfacility sized by planets, the four largest methods in color and the rest gray, facility names and countswhere they fit, and method name, count and share on a tab at the top of each method circle.
5. Electricity in the 20 biggest producers, by source
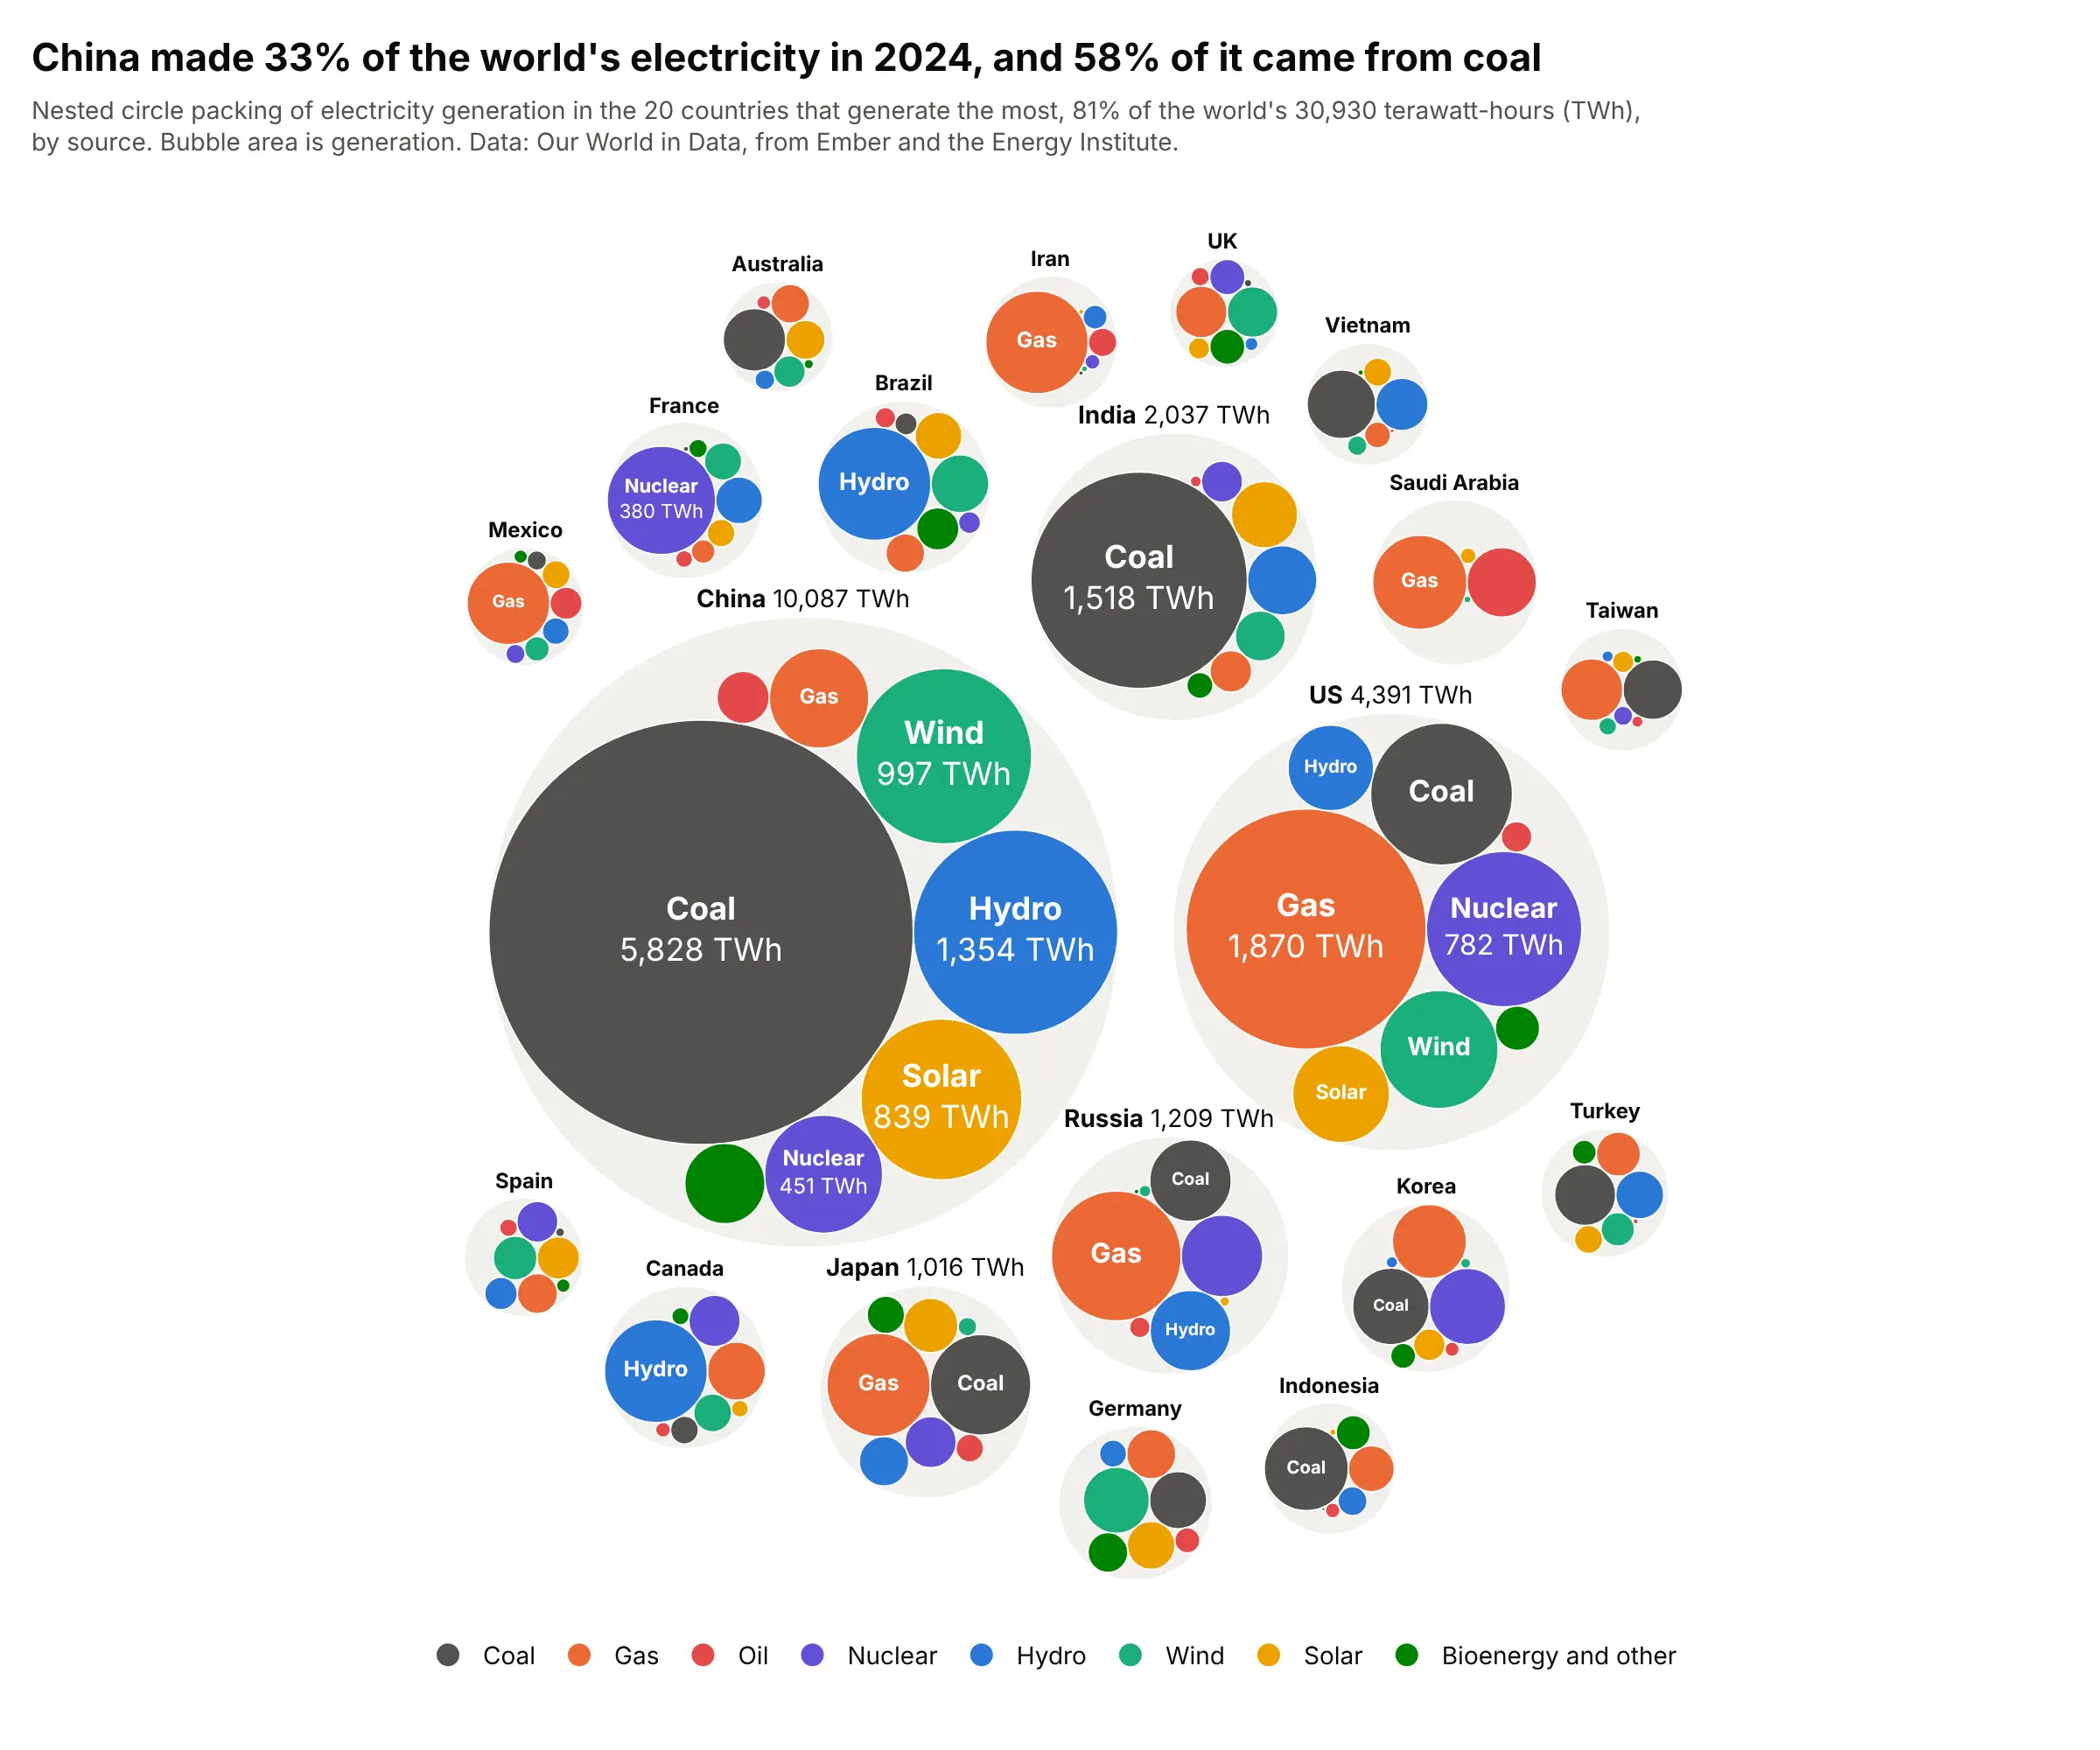
China made 33% of the world's 30,930 terawatt-hours (TWh) of electricity in 2024, and 58% of it came from coal, so China's coal circle alone is bigger than the US circle. Unlike 20 pie charts, every source here is on one scale. Data: Our World in Data energy dataset, from Ember and the Energy Institute.
Tip: give each source one color across every country and keep the legend in that order, so the eye can compare coal circles across the whole chart.
Get the data from the Our World in Data energy dataset (owid-energy-data.csv, from Ember and the EnergyInstitute), year 2024, the 20 countries with the highest electricity_generation, with coal, gas, oil, nuclear,hydro, wind, solar and other renewable electricity in TWh (columns: country, source, twh).Build a plotly nested packed bubble chart: a light gray circle per country holding one circle per sourceat one common scale, one color per source with a legend, and country names and totals above each country.
6. What new clinical trials target
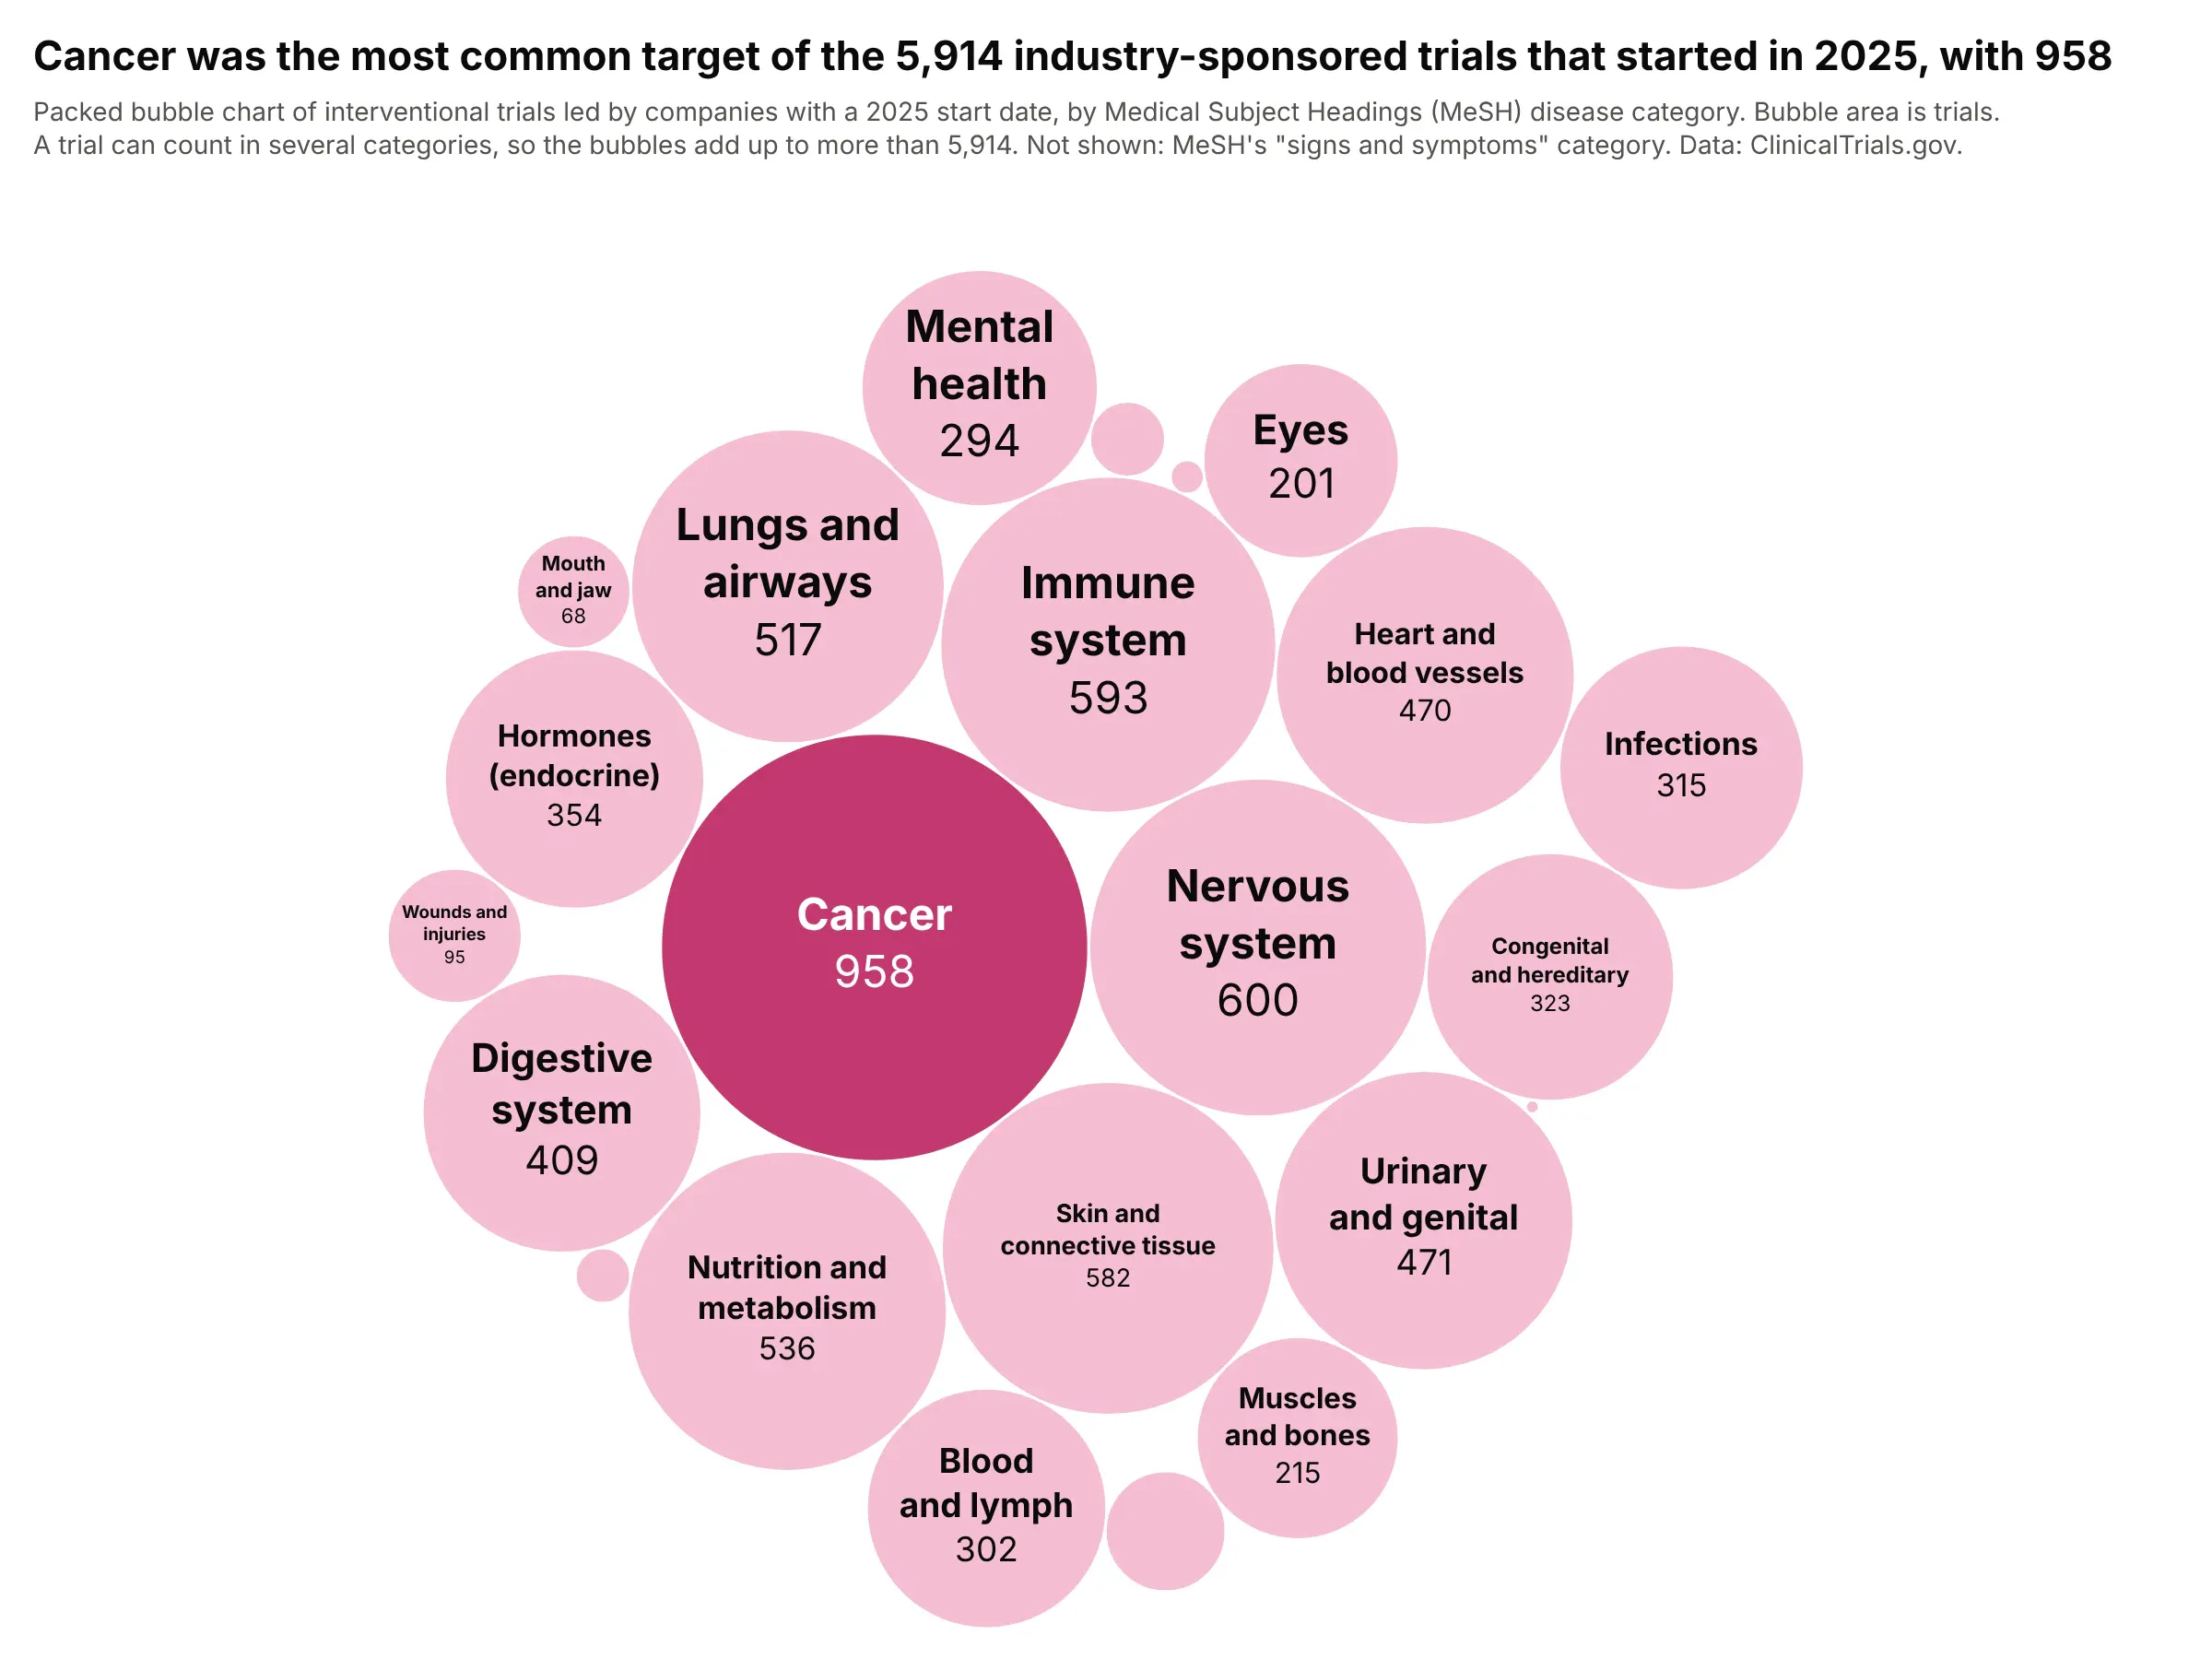
Cancer was the most common target of the 5,914 industry-sponsored trials that started in 2025, with 958, followed by the nervous system and the immune system at about 600 each. A trial can count in several categories, so the circles are not parts of a whole. Data: ClinicalTrials.gov API, by Medical Subject Headings (MeSH) disease category.
Tip: let long category names wrap onto two lines inside the circle, so you don't have to abbreviate them.
Get the data from the ClinicalTrials.gov API v2 (clinicaltrials.gov/api/v2/studies): interventional studieswith lead sponsor class INDUSTRY and a start date in 2025, with their condition MeSH terms and ancestors,counted by top-level MeSH disease category (columns: category, trials).Build a plotly packed bubble chart with area proportional to trials, the largest category in dark pink andthe rest light pink, category names wrapped on two lines and counts inside, and a subtitle saying that atrial can count in several categories.