
Chris Parmer
October 24, 2026
Funnel Charts - A Complete Guide
TL;DR
- A funnel chart shows how many items reach each stage of a process, one bar per stage in order, so you can see where they drop out.
- Use one when every stage is a subset of the one before: applications that become loans, drugs that reach approval, visitors who buy. When the process branches, a Sankey diagram shows where people went.
- Label each bar with the numbers that answer your question, such as the count and the share of the stage before, and use a bar or dot chart of the rates to compare many groups.
- Any coding agent can make one with Plotly in a minute. In Python it's go.Funnel(y=stages, x=counts).
What is a funnel chart?
Funnel charts look like this:
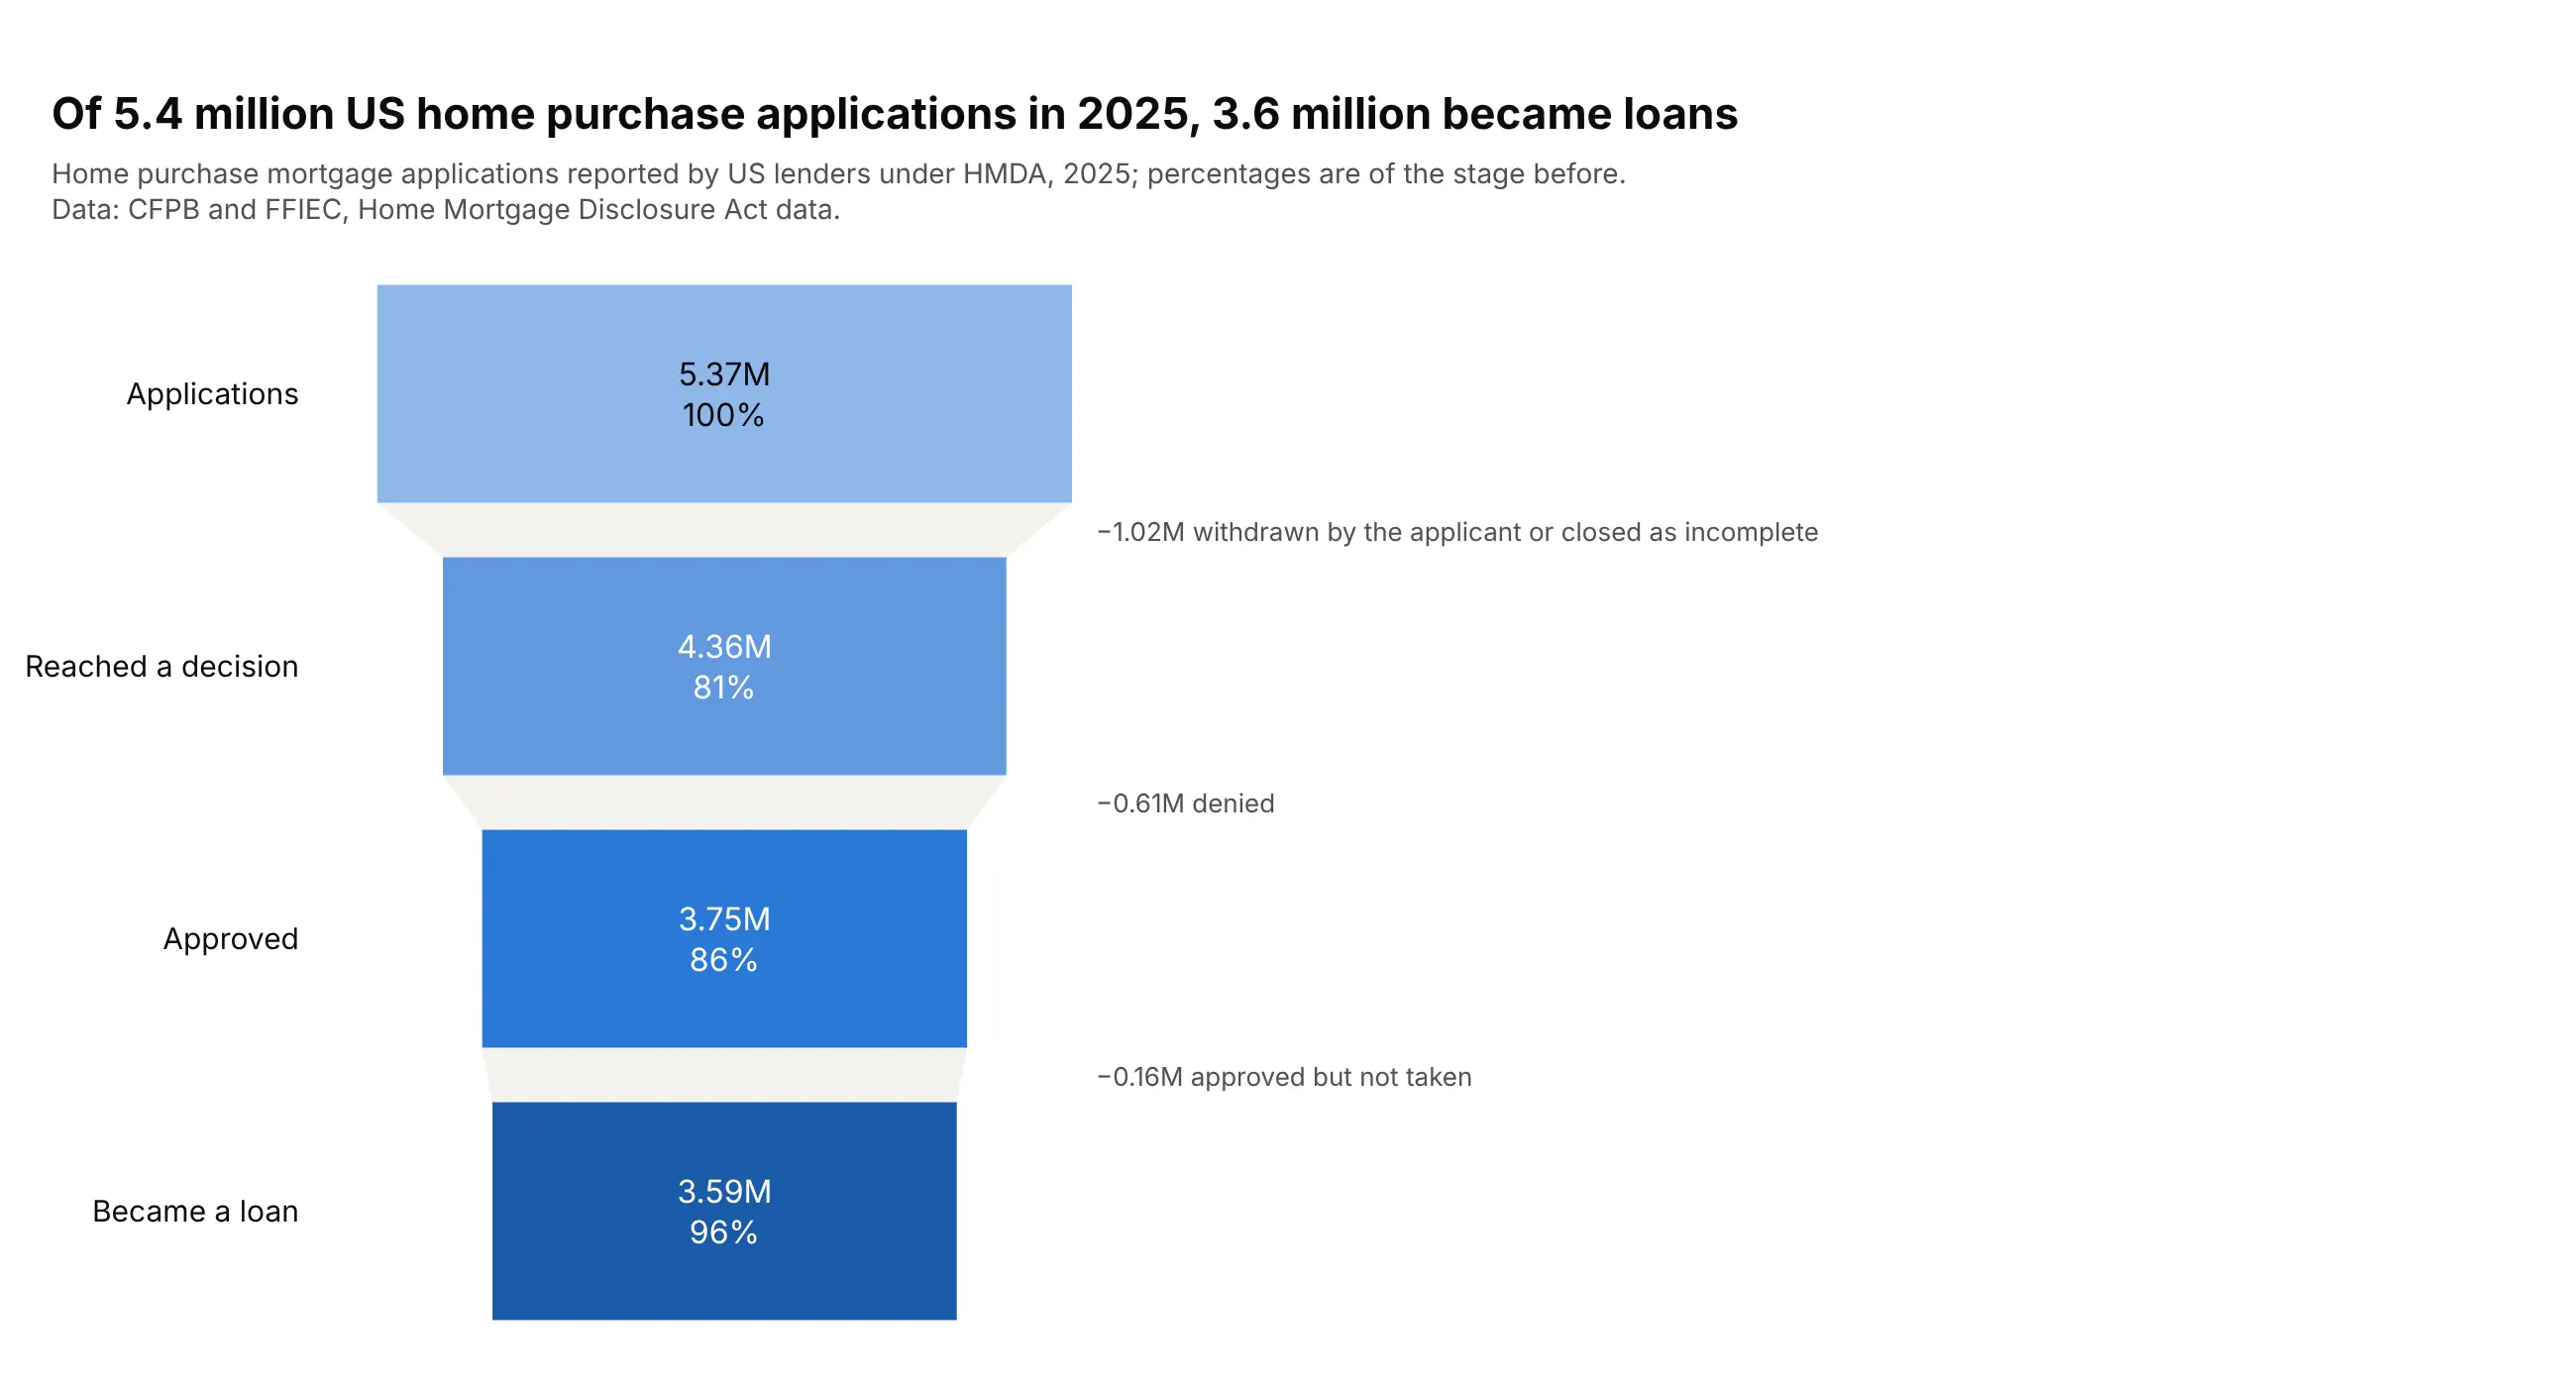
Data: CFPB and FFIEC, Home Mortgage Disclosure Act data.
How do you read a funnel chart? In the example above, notice these things:
- Each bar is one stage of the 2025 US home purchase mortgage process, from applications at the top to loans at the bottom, and its length is the number of applications that got that far.
- Every stage is a subset of the one above it, so the bars only get shorter, and the gray band between two bars is the applications lost at that step.
- The percentage on each bar is the conversion from the stage before, which points you to the leakiest step. The 81% on "Reached a decision" is the lowest, so the biggest loss happens before a lender decides anything.
- The labels on the right say what dropped out at each step, and they show that more applications were withdrawn or closed as incomplete than were denied.
- Watch which base a percentage uses. The 96% on the last bar is a share of approved applications, so to get the share of all applications that became loans you divide the last bar by the first.
It's often used for charts like these:
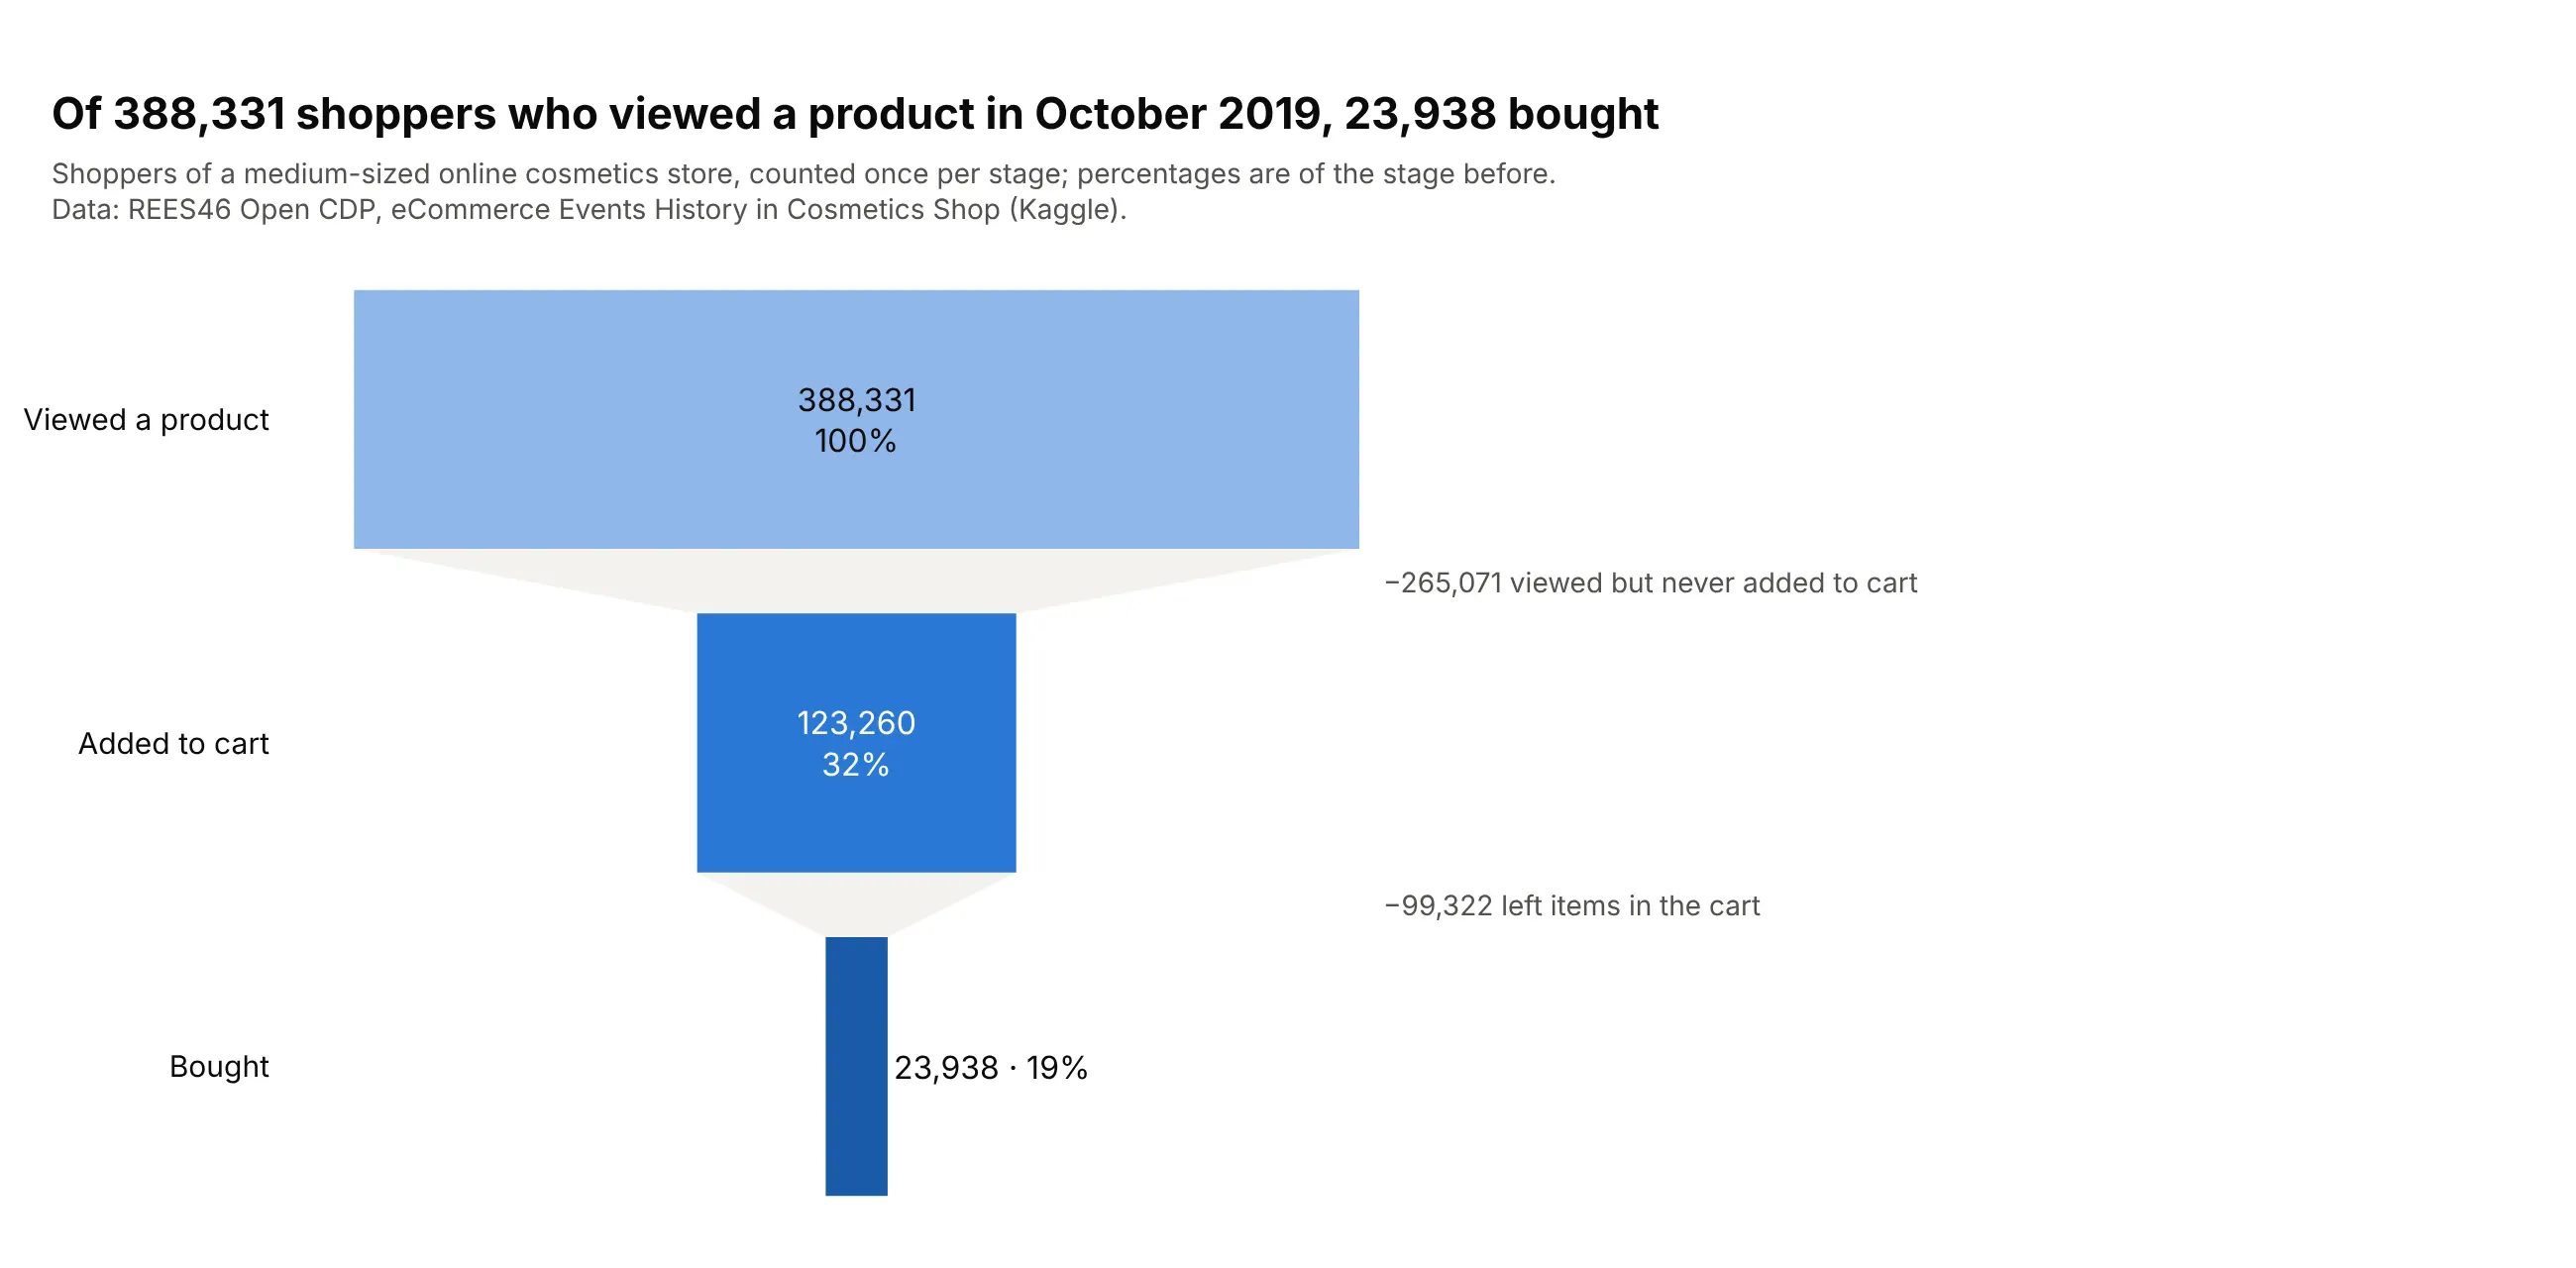
A website conversion funnel. Of 388,331 shoppers who viewed a product in an online cosmetics store in October 2019, 23,938 (6.2%) bought, and four in five of the shoppers who added something to the cart left without buying. Data: REES46 Open CDP, eCommerce Events History in Cosmetics Shop.
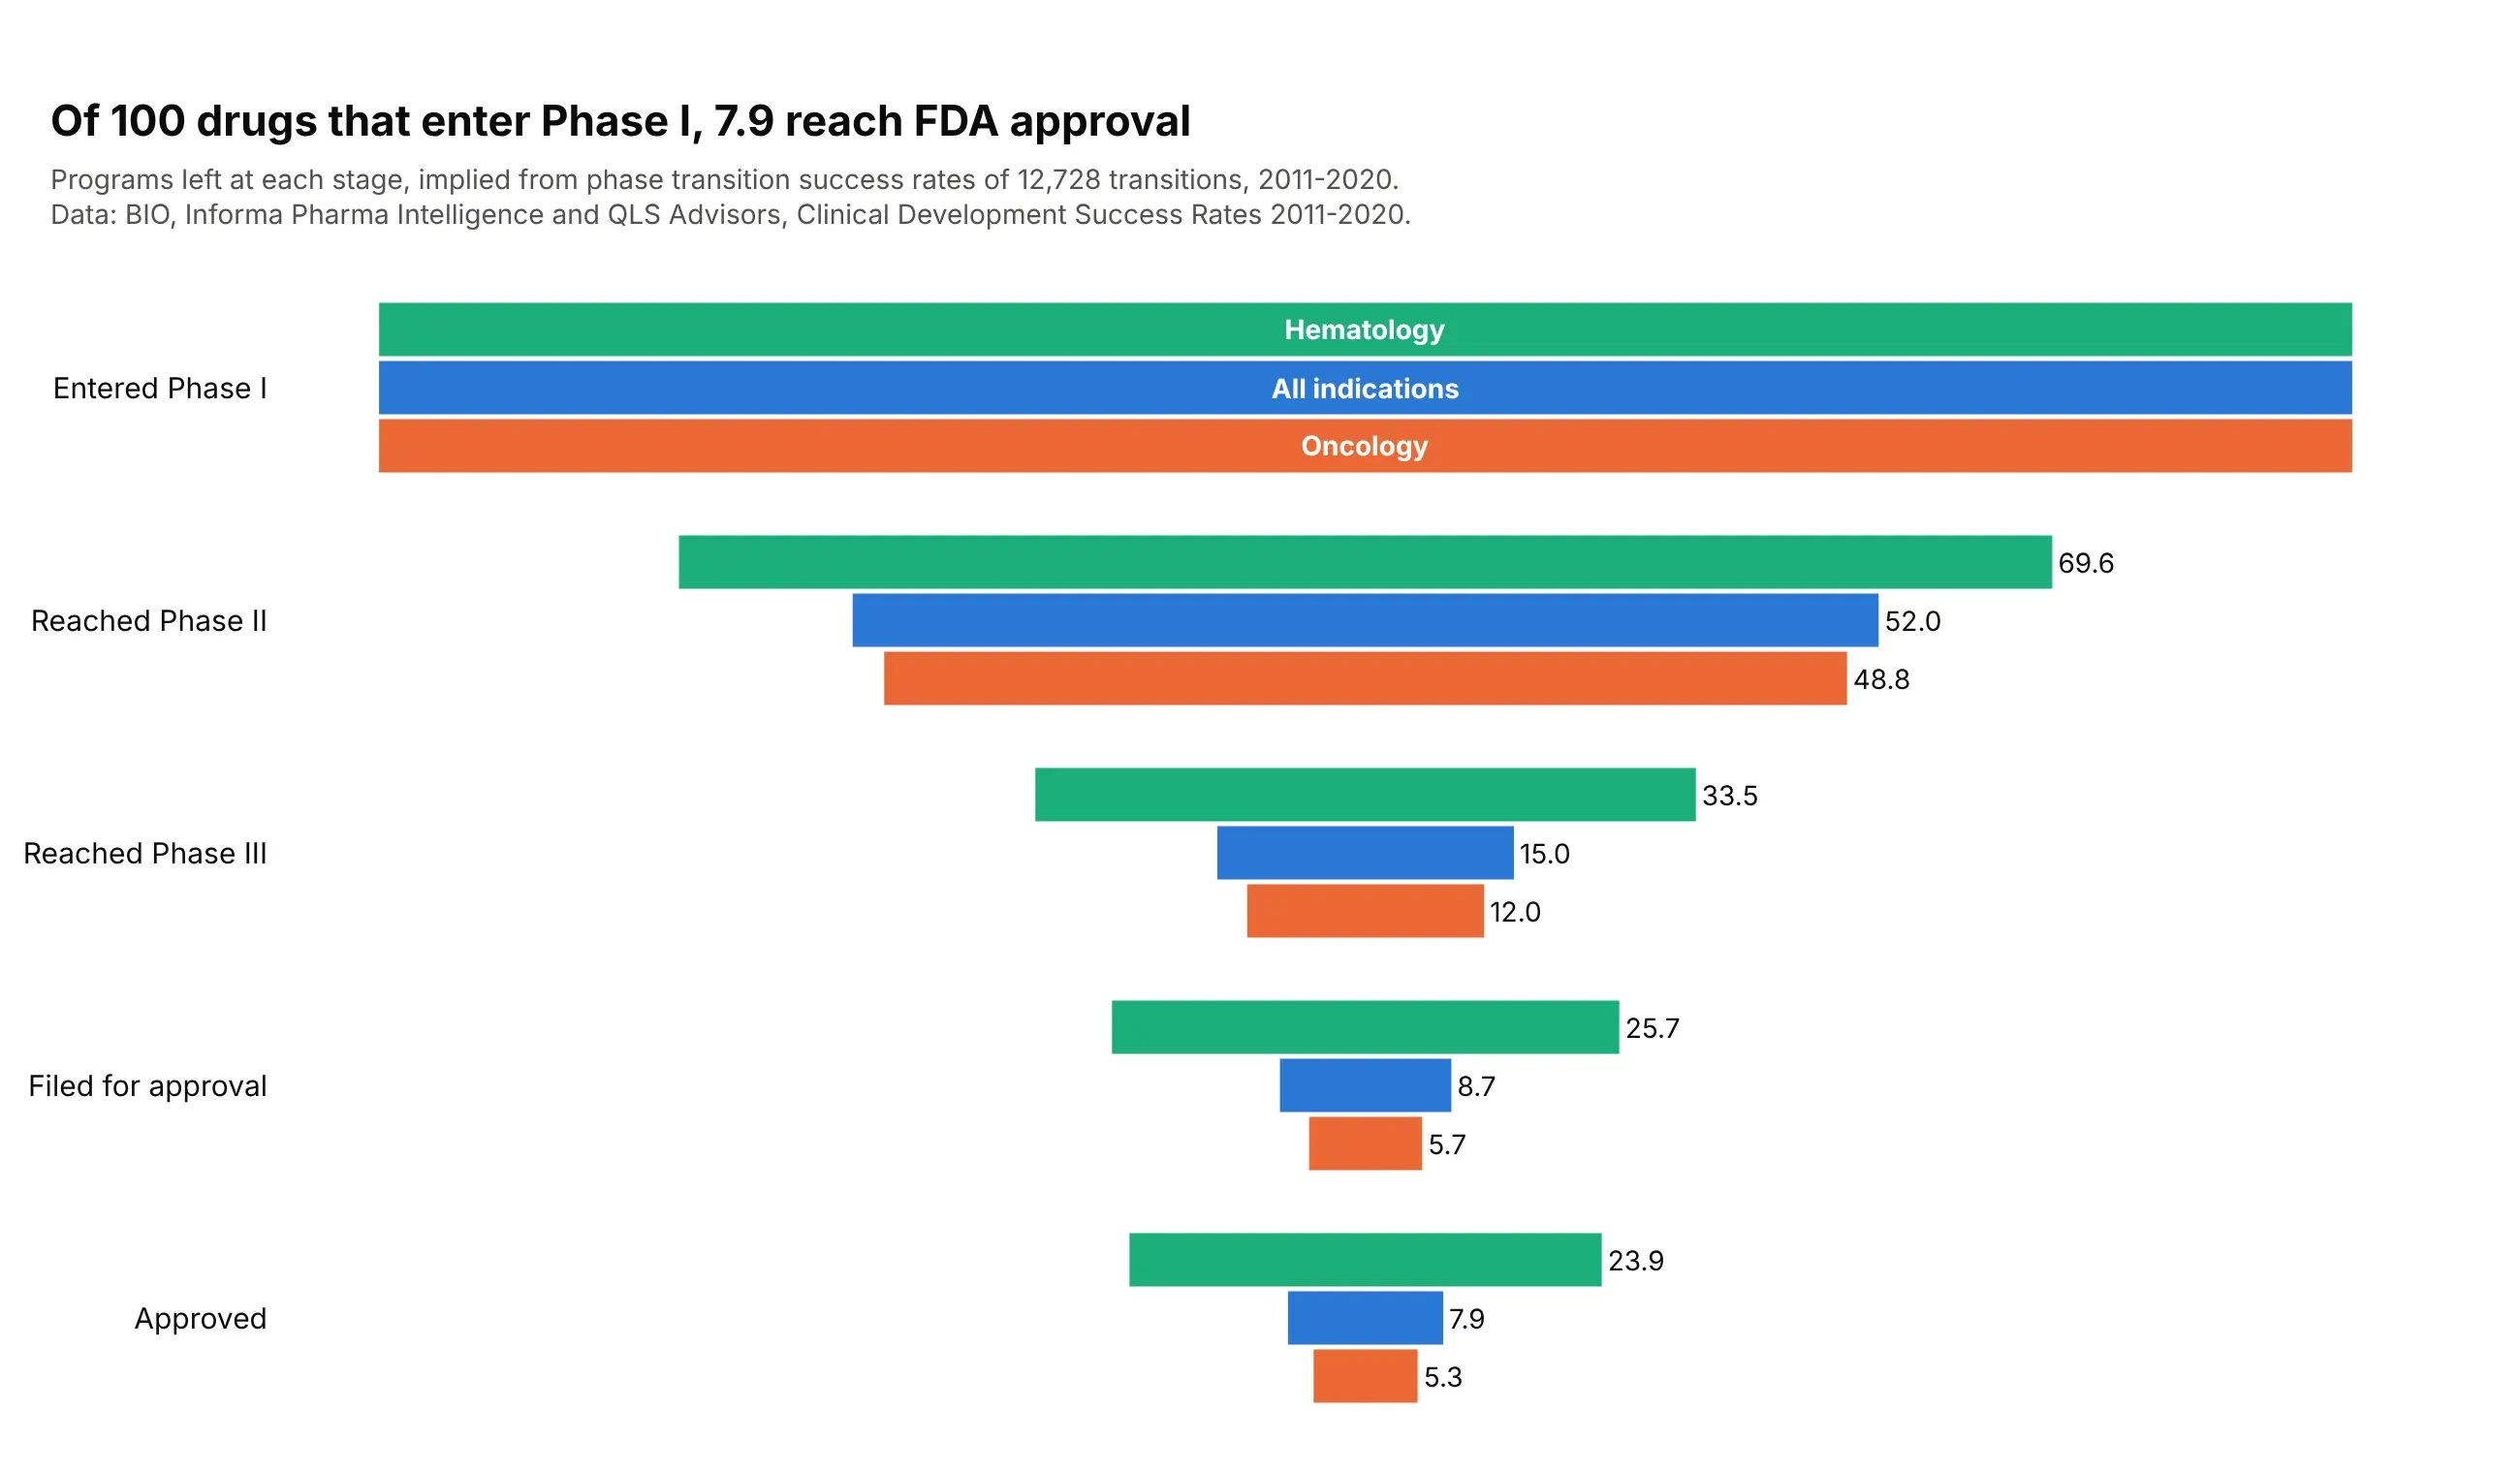
A drug development pipeline. Of 100 drug programs that enter Phase I, 7.9 reach FDA approval, and Phase II is the biggest drop (only 28.9% advance), with oncology ending at 5.3 approvals against hematology's 23.9. Data: BIO, Informa Pharma Intelligence and QLS Advisors, Clinical Development Success Rates 2011-2020.
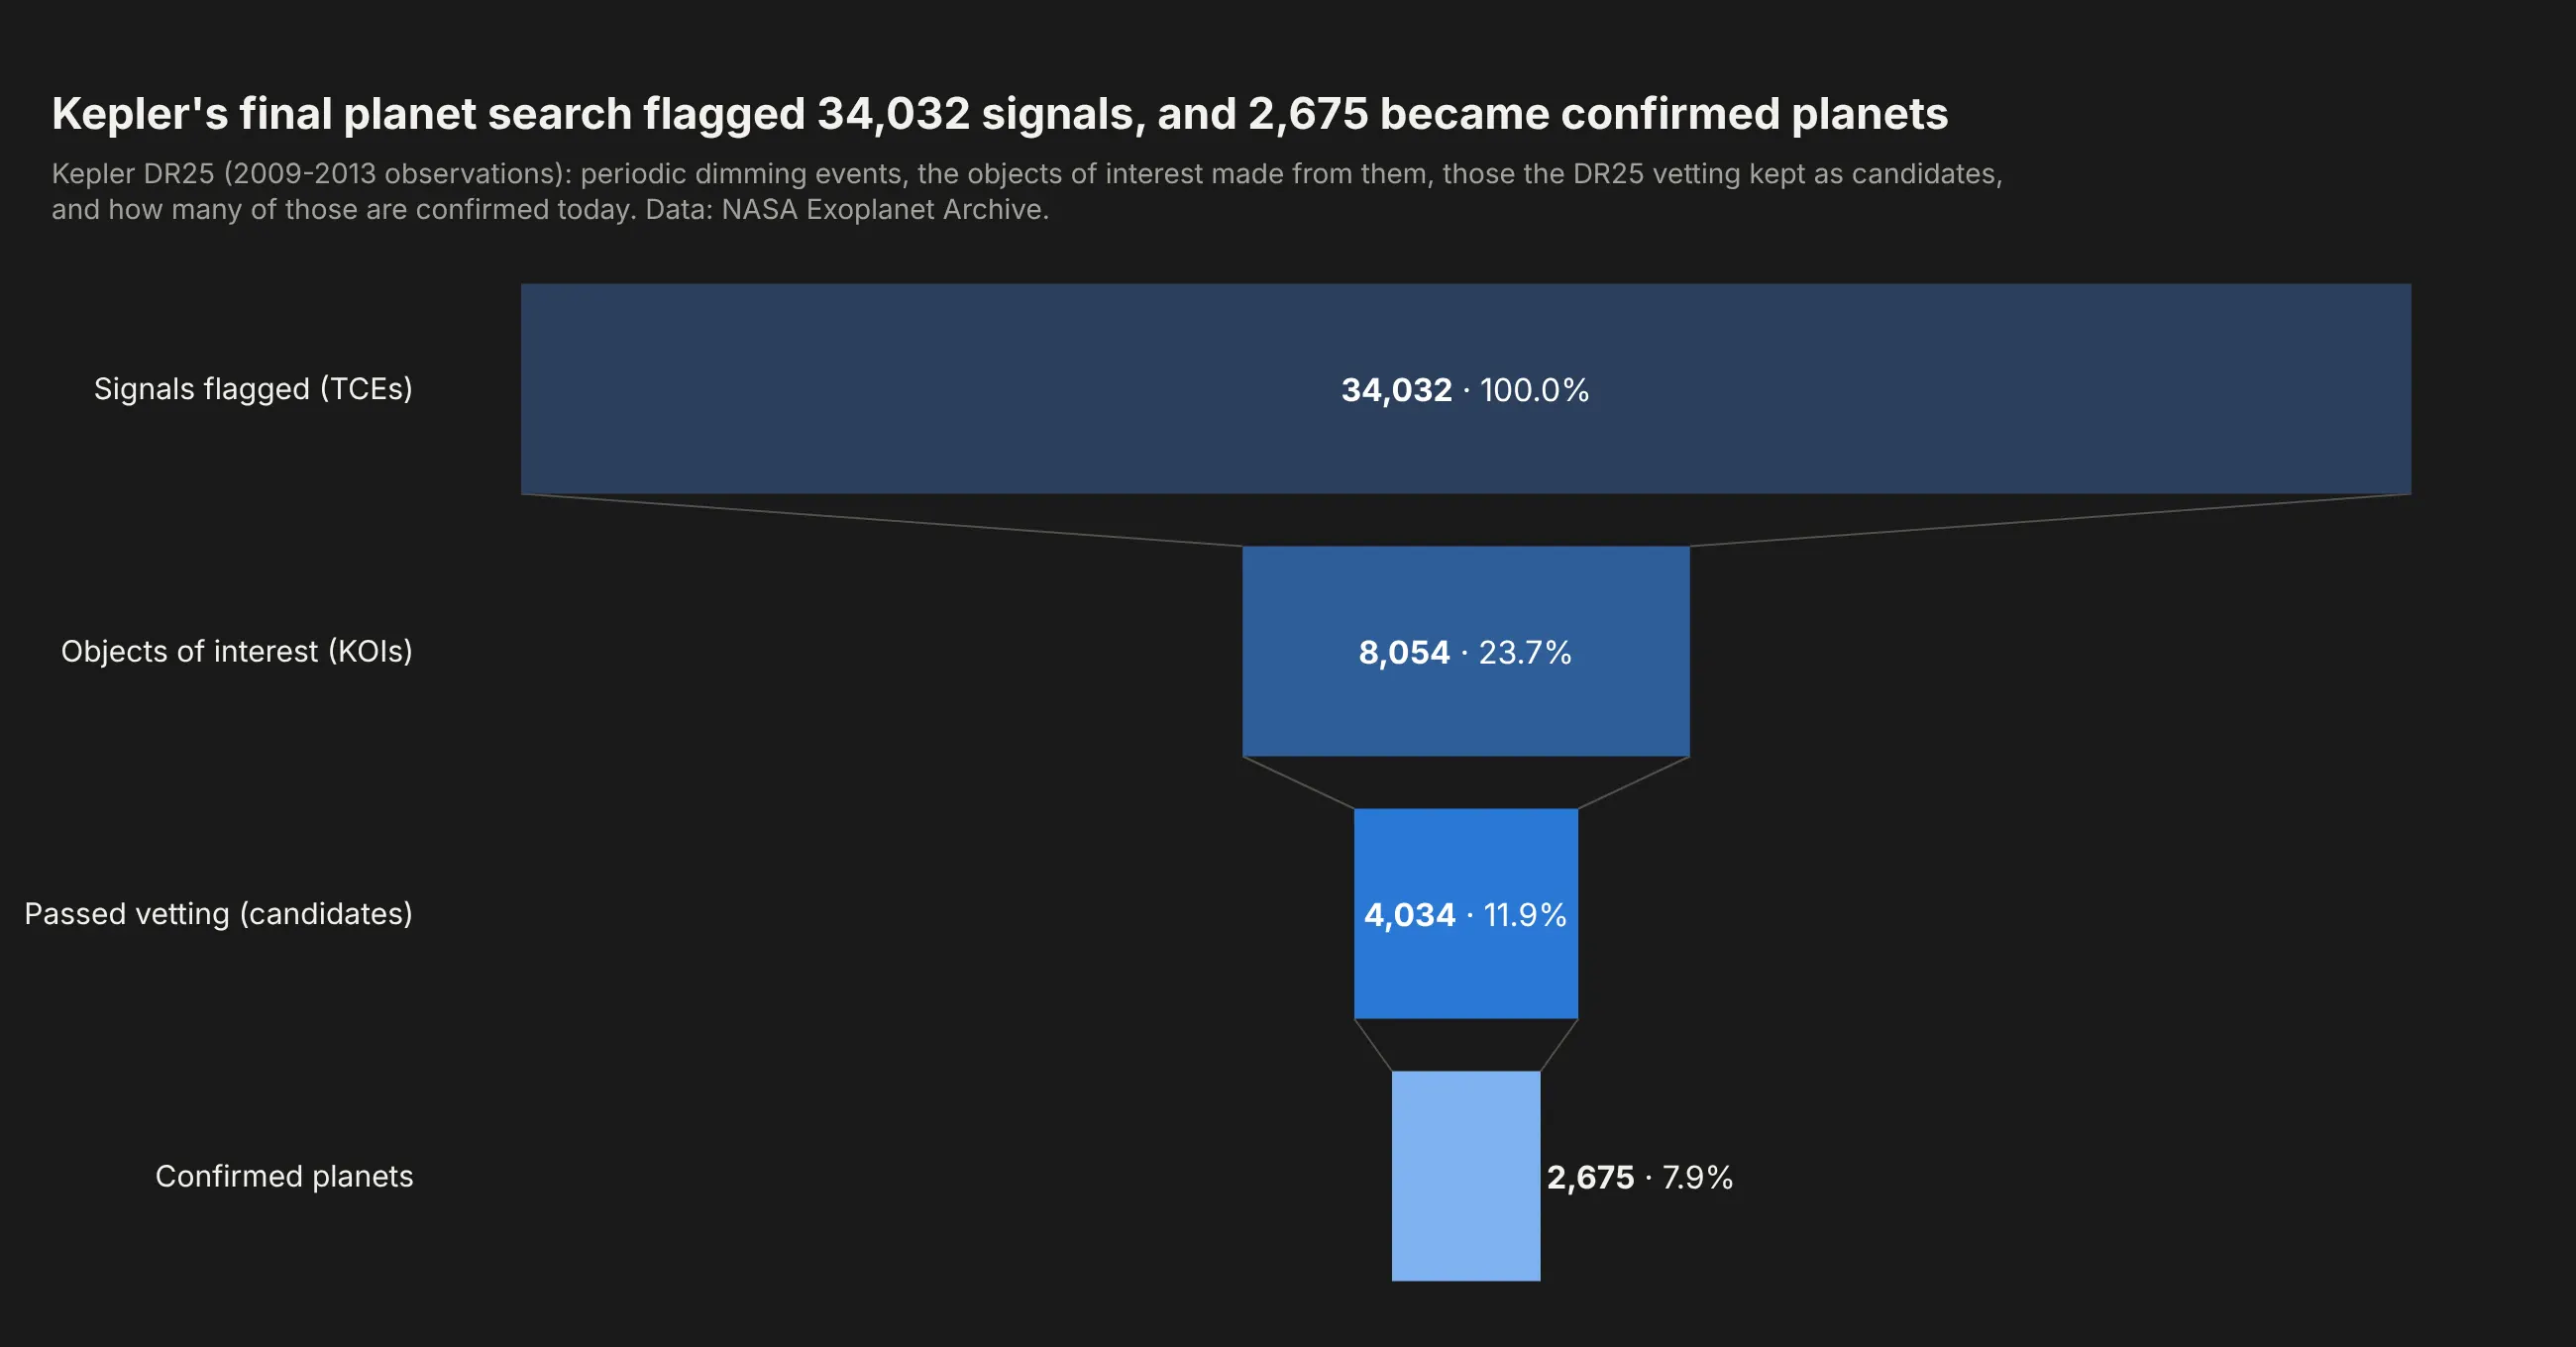
A search for rare things. Kepler's final pipeline run flagged 34,032 periodic dimming signals, and 2,675 of them (7.9%) are confirmed planets today. Data: NASA Exoplanet Archive, Kepler DR25 (Thompson et al., 2018).
A short history
The idea is older than the chart. In 1925 E. K. Strong described the AIDA formula for selling (attention, interest, desire, action) in "Theories of selling", crediting it to the advertiser E. St. Elmo Lewis, and staged models like it are what marketing teams now call the sales funnel. Medicine drew its version as boxes and arrows: the CONSORT 2010 statement asks every randomized trial to report a participant flow diagram from enrollment to analysis, like this one for the SURMOUNT-1 obesity trial:
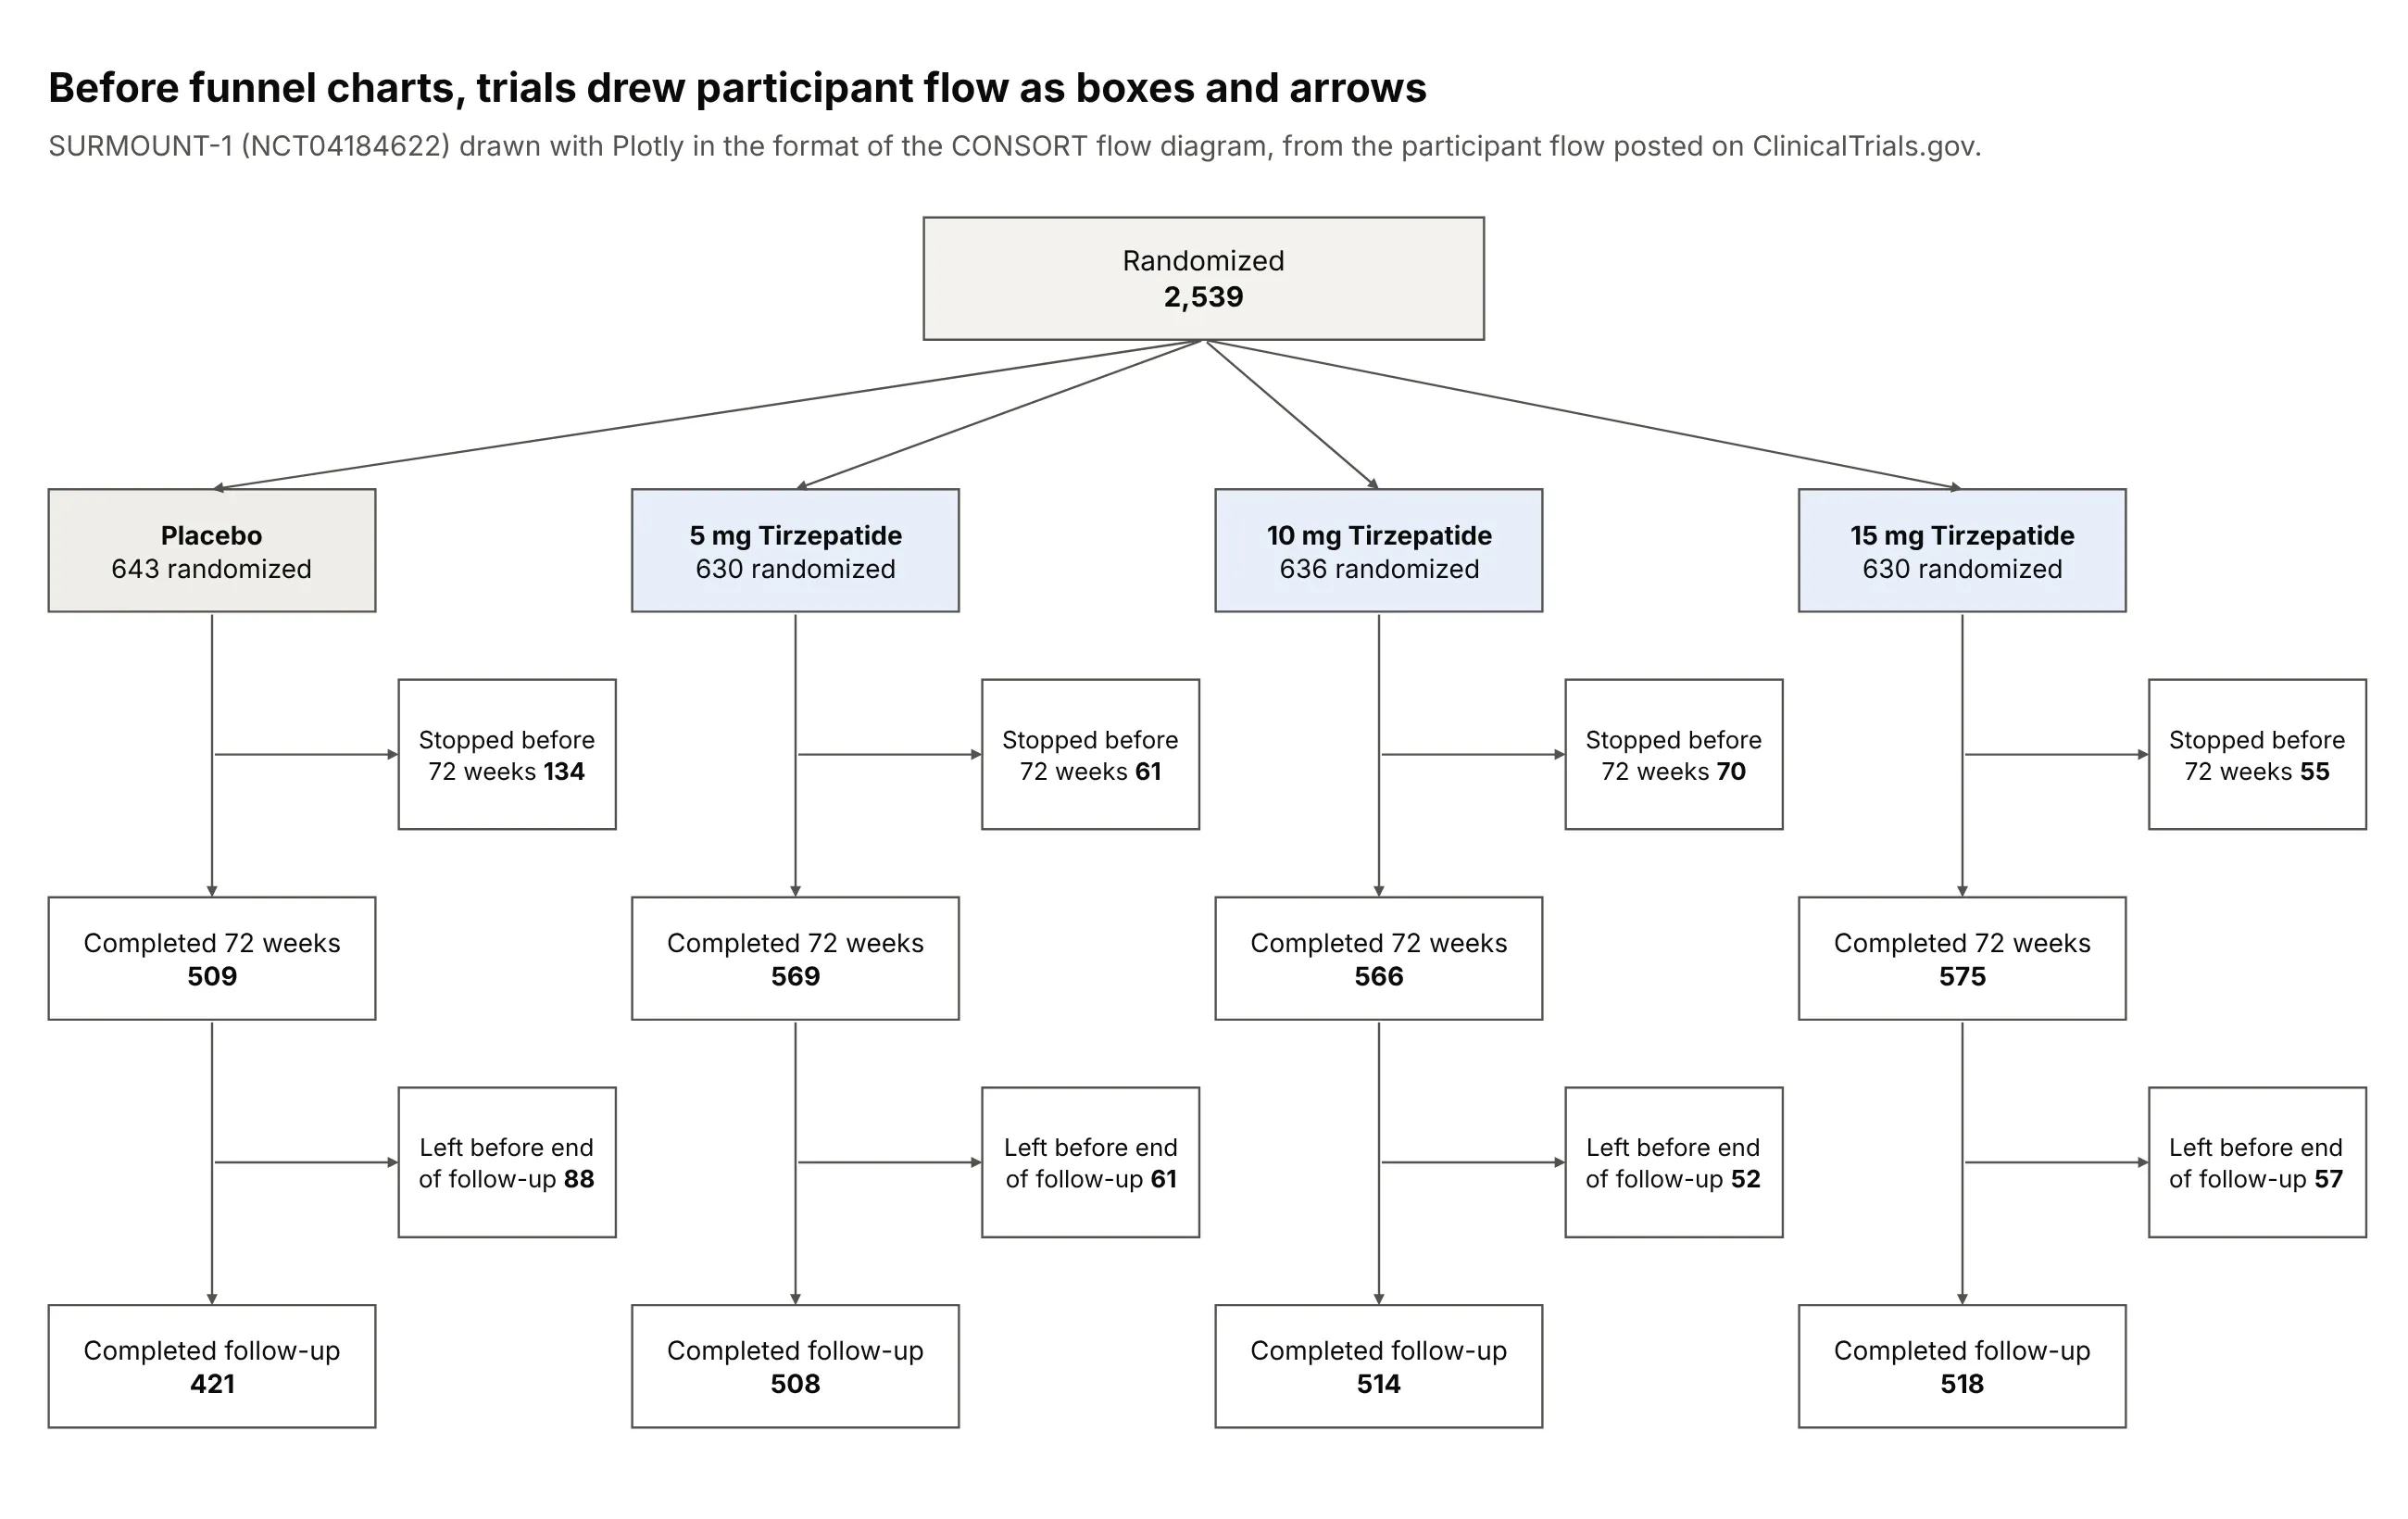
Plotly added the funnel and funnelarea traces in plotly.js 1.48.0, released in May 2019, which turned that kind of flow into one bar per stage.
Alternatives to a funnel chart
Here's the same mortgage pipeline drawn six ways. Some are better for the question, some worse, some just different:
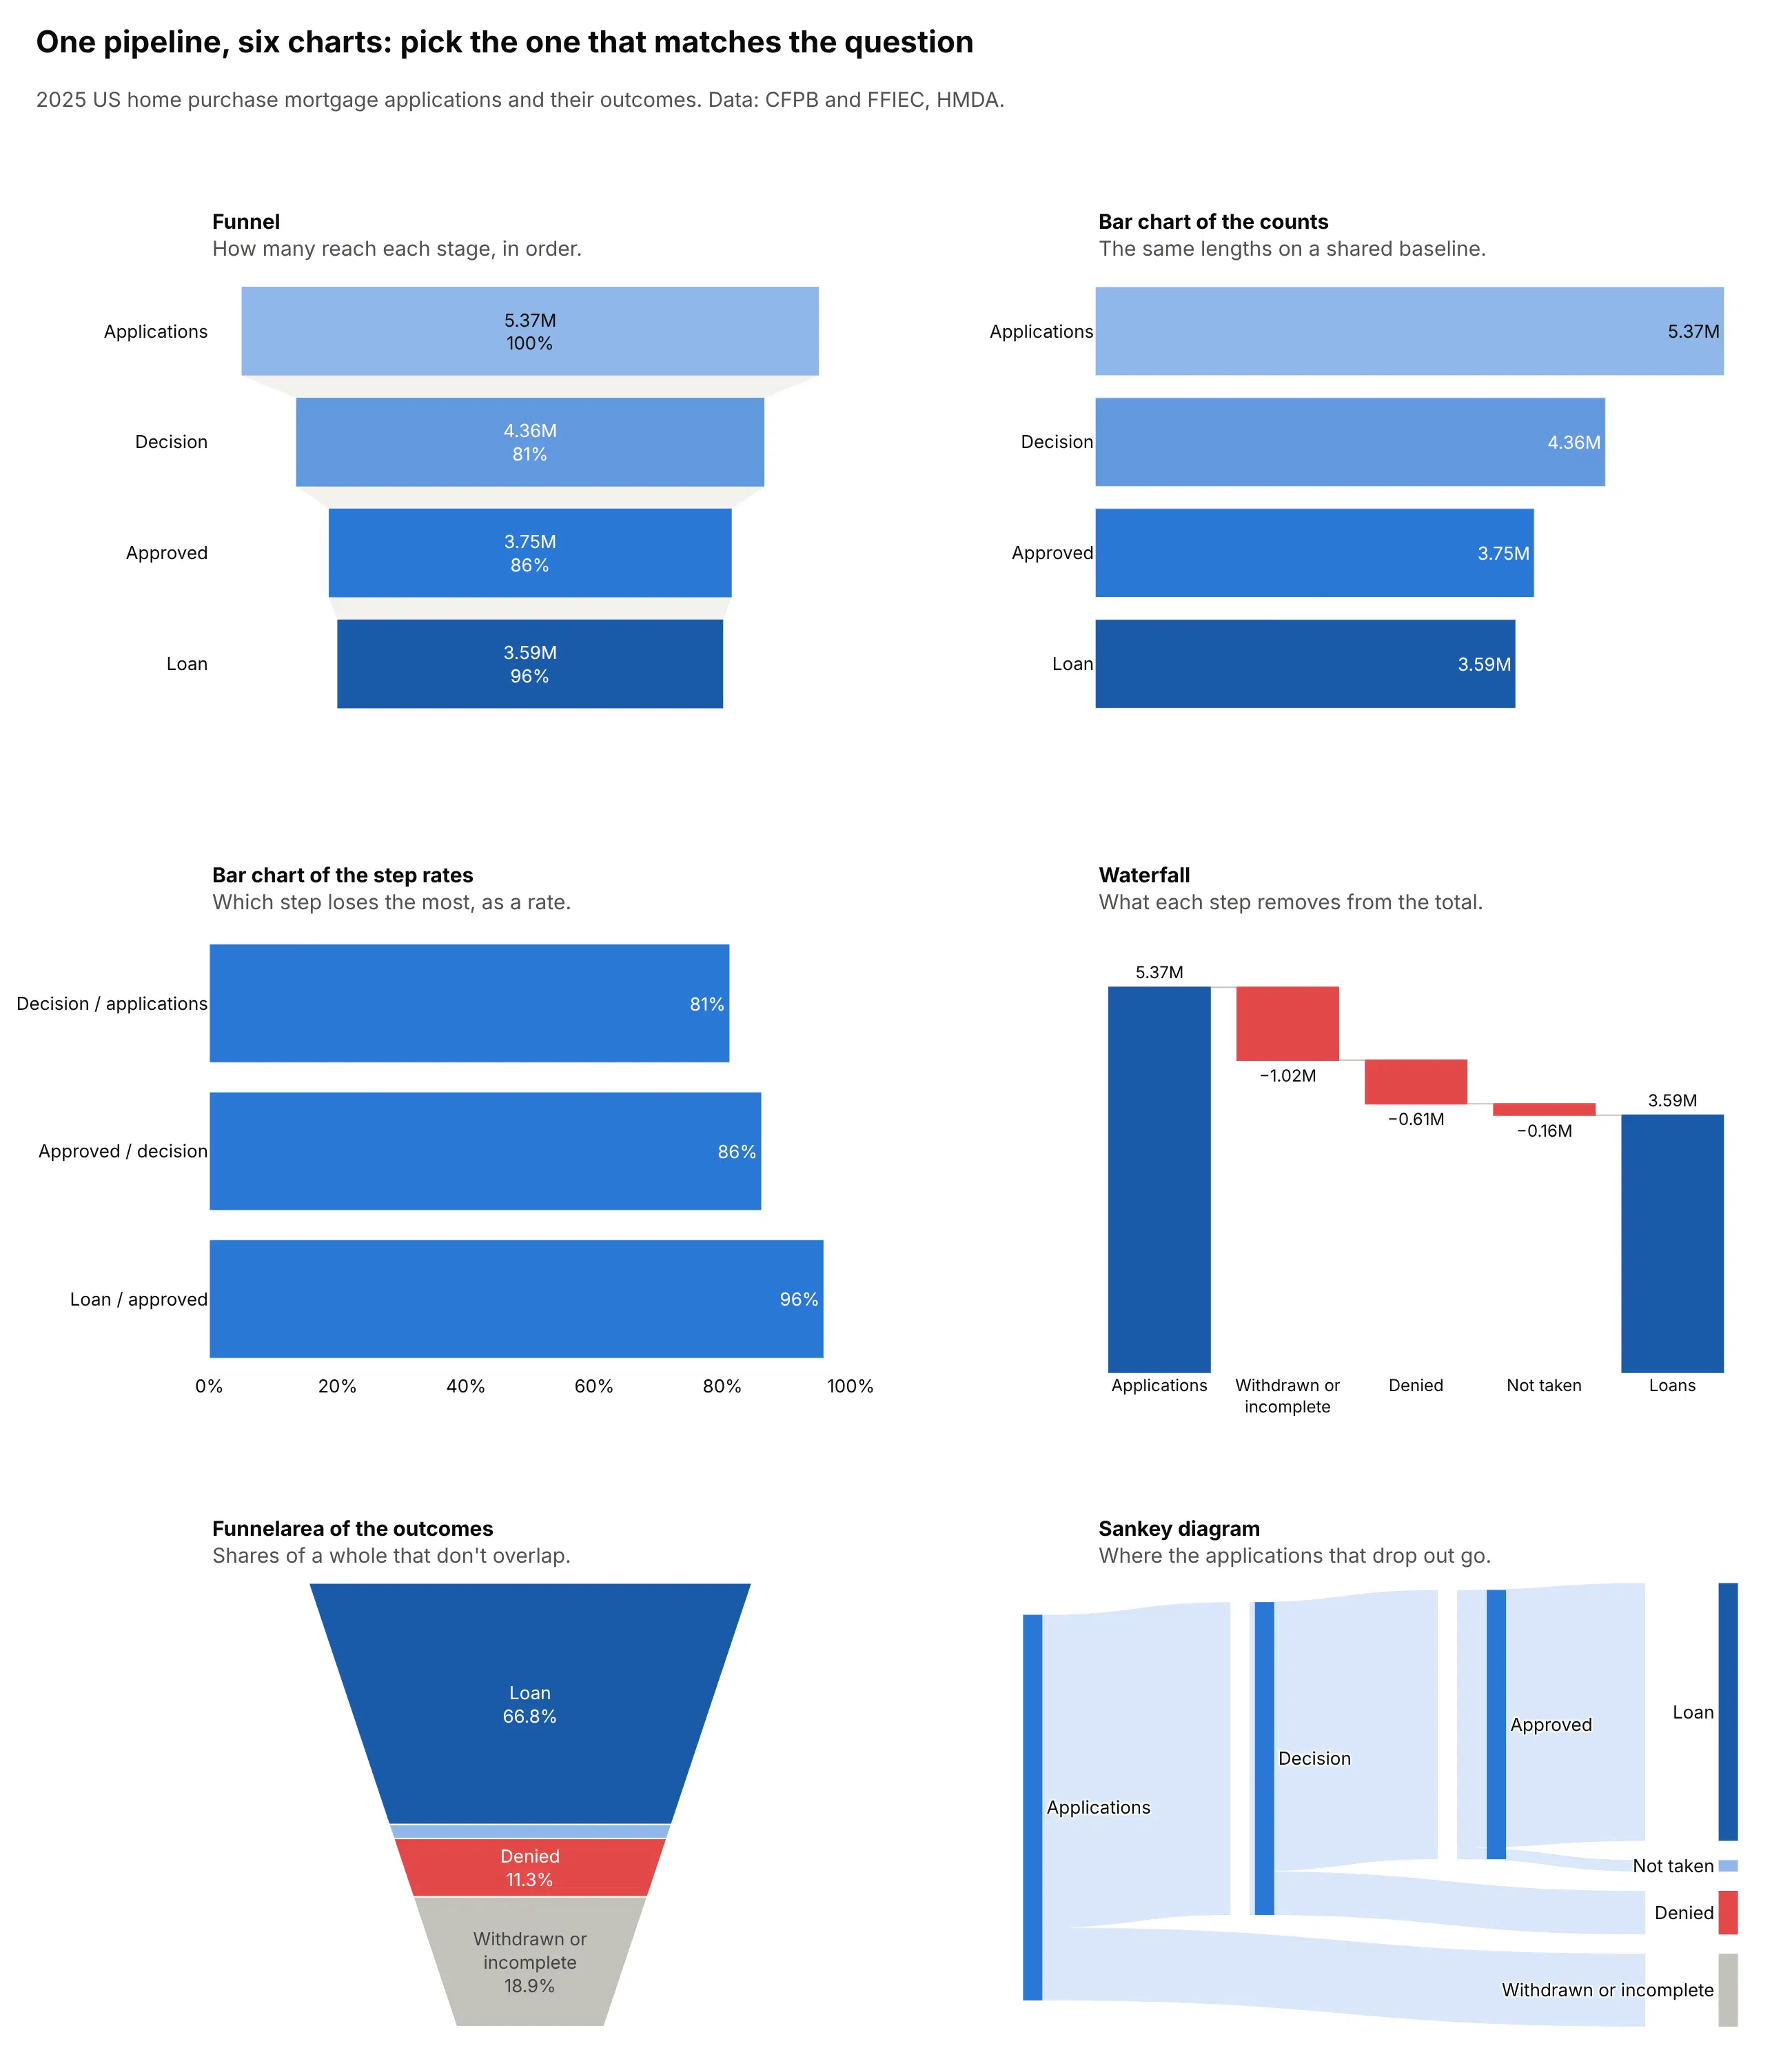
- Bar chart of the counts (better for precise comparisons). A funnel centers its bars, so they don't share a baseline, and people judge lengths far more accurately on a common baseline, as Cleveland and McGill (1984) measured. Left-aligned bars in stage order read as a process too.
- Bar chart of the step rates (better for finding the leaky step, and for comparing groups). Charting 81%, 86% and 96% directly shows that the first step loses the most. To compare conversion across many groups or dates, a bar or dot chart of the rates is clearer than several funnels side by side.
- Waterfall chart (works too). It starts from all applications and subtracts what each step removes, so the losses get their own bars and labels. See our waterfall chart guide.
- Funnelarea (worse for nested stages). Plotly's go.Funnelarea cuts a fixed funnel shape into slices whose areas are shares of the total, like a pie chart, so it suits outcomes that don't overlap (here 66.8% of applications became loans) and misleads for stages that contain each other.
- Sankey diagram (different). It also shows where the applications that dropped out went: withdrawn, denied or not taken. See our Sankey diagram guide.
How to make a funnel chart
With AI
ChatGPT, Claude Code, GitHub Copilot, Cursor and other AI tools are excellent at writing Plotly code. Name Plotly in the prompt, spell out the stages and how to count them, and list the checks you want:
Make a plotly funnel chart from events.csv (columns: visitor_id, timestamp, event with valuesview, addtocart, transaction).- Stages: viewed a product, added to cart, purchased. Count unique visitors, nested:a visitor counts at a stage only if they also reached every earlier stage.- Assert the counts never increase from one stage to the next.- go.Funnel with textinfo "value+percent previous"; put text outside bars under 25% of the first.- One color, Inter font, white background, a light gray connector.- Title states the main conversion rate; subtitle names the data and the period.- Save as funnel.html and as a PNG at 2x scale.
With Plotly Studio
Plotly Studio is a desktop app where you point an AI at a dataset and it builds charts and a Dash app around your questions. Ask for a funnel chart the same way:
Show a funnel chart of mortgage applications by stage: applications, reached a decision, approved, became a loan. Label each bar with the count in millions and the conversion from the previous stage, add a dropdown for loan purpose, and annotate how many were withdrawn and denied.
Make a funnel chart in Python or JavaScript
This is the code AI tools write under the hood. In Python, go.Funnel takes the stage names and the counts:
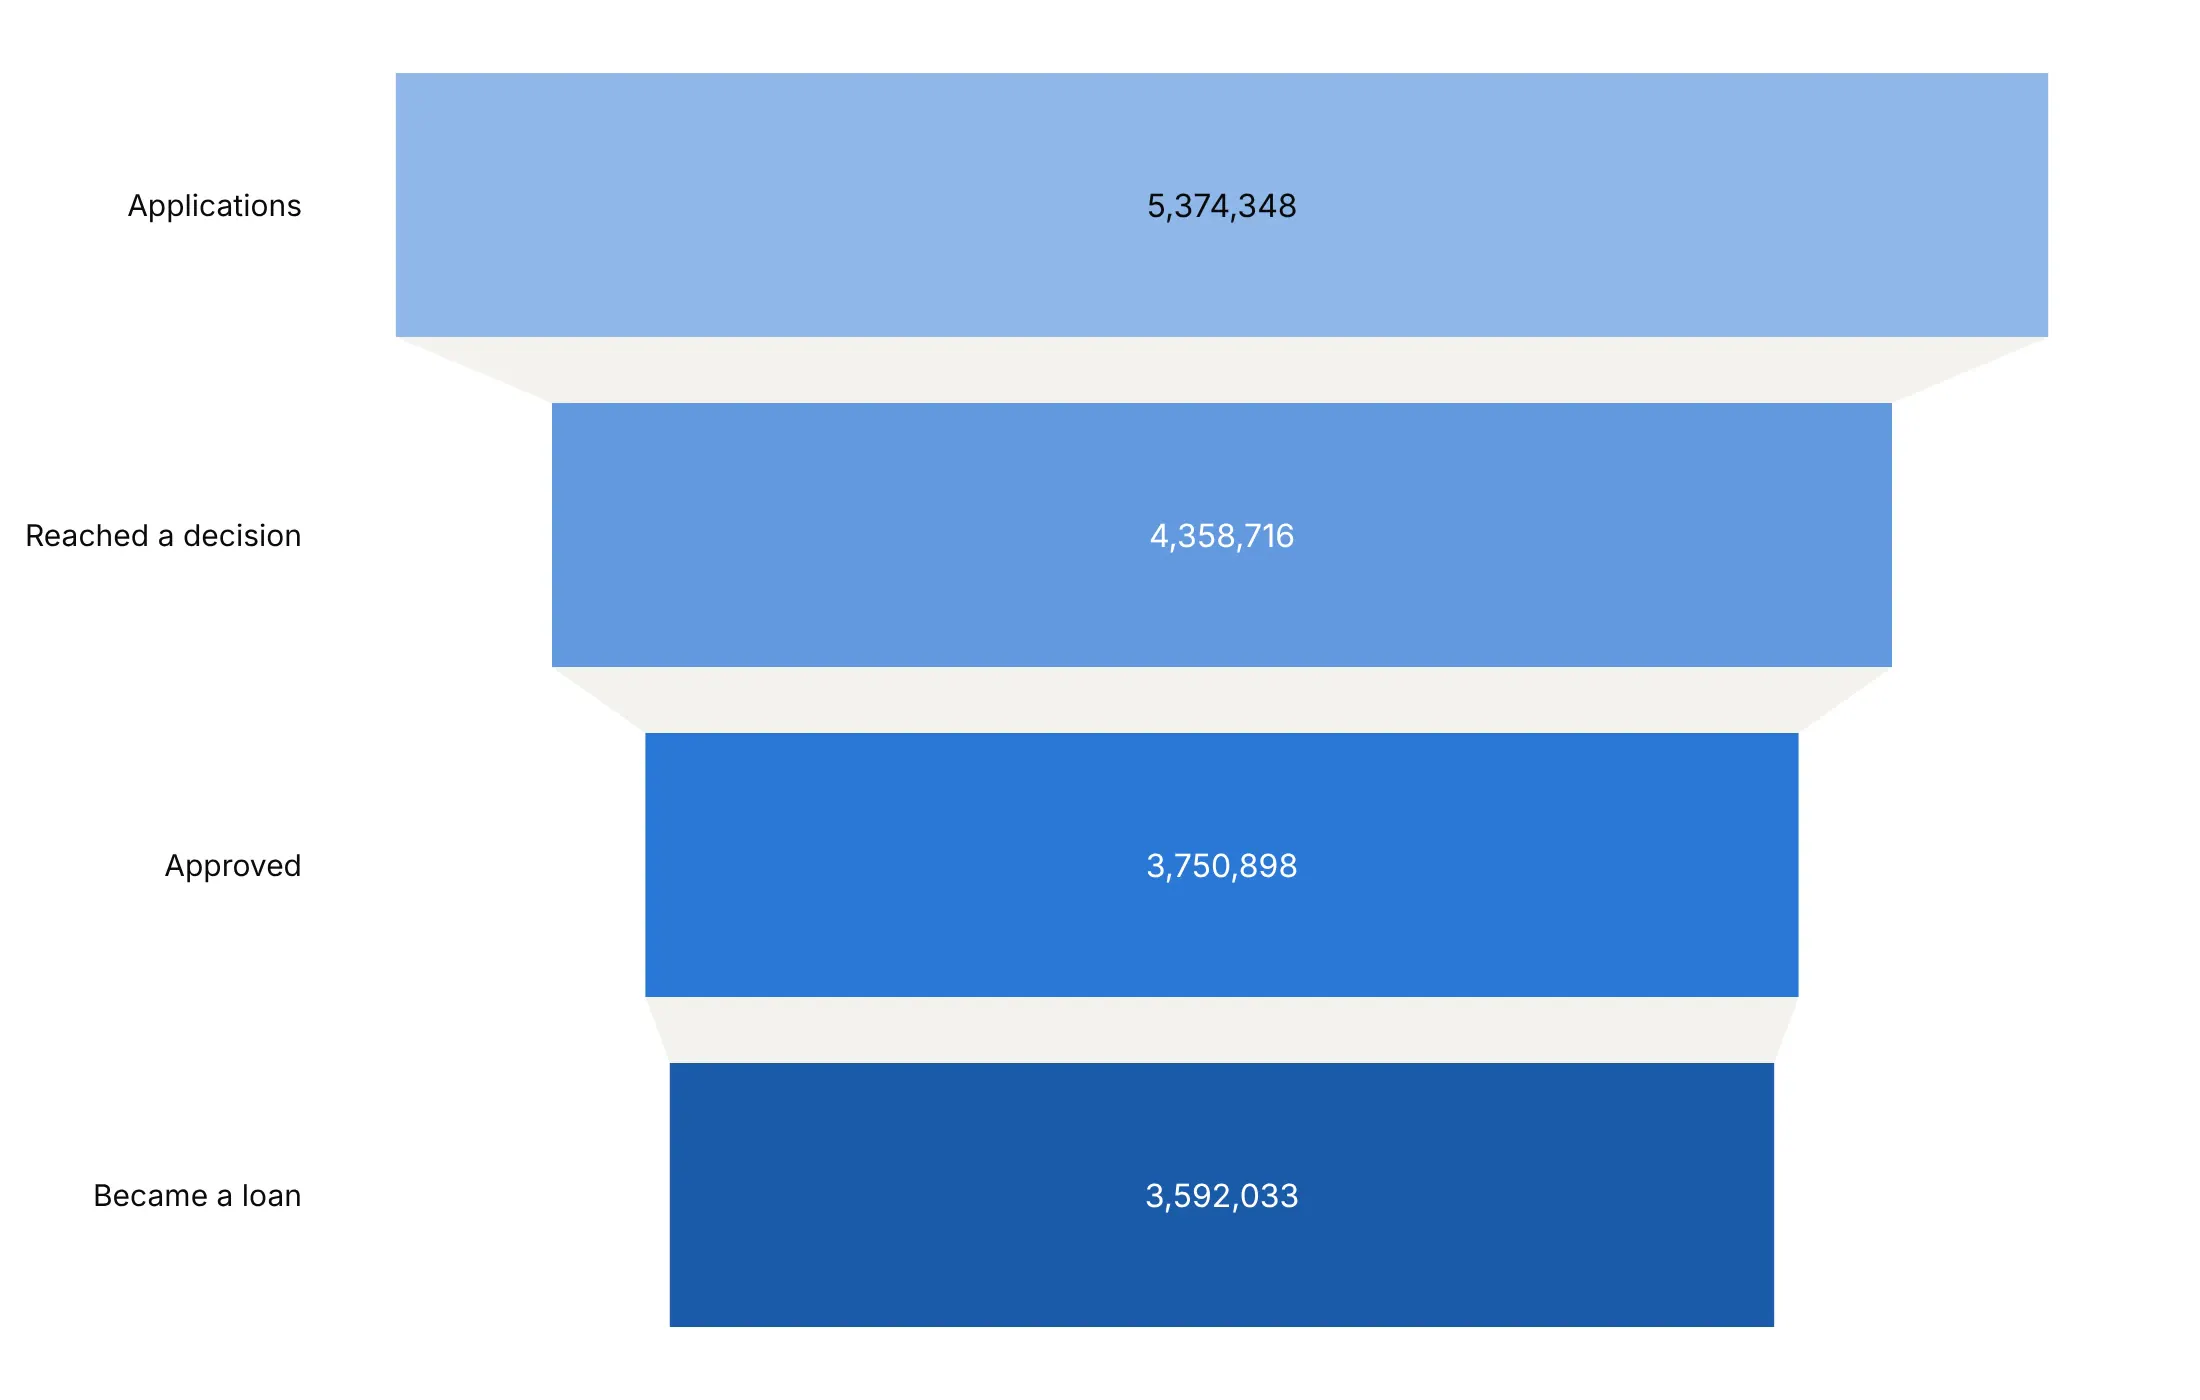
import plotly.graph_objects as gofig = go.Figure(go.Funnel(y=["Applications", "Reached a decision", "Approved", "Became a loan"],x=[5374348, 4358716, 3750898, 3592033],textinfo="value+percent previous",))fig.show()
Real data usually arrives as an event log, one row per user and event. This function counts nested stages, so a user counts at a stage only if they also reached every stage before it:
import pandas as pdimport plotly.graph_objects as godef funnel_from_events(events, user, step, stages):"""Nested counts: users who reached each stage and all stages before it."""reached = events.groupby(user)[step].agg(set)counts, mask = [], pd.Series(True, index=reached.index)for s in stages:mask &= reached.map(lambda done: s in done)counts.append(int(mask.sum()))return go.Figure(go.Funnel(y=stages, x=counts, textinfo="value+percent previous"))events = pd.DataFrame({"visitor": [1, 1, 1, 2, 2, 3], "event": ["view", "cart", "buy", "view", "cart", "view"]})funnel_from_events(events, "visitor", "event", ["view", "cart", "buy"]).show()
In JavaScript, plotly.js takes the same two arrays:
<div id="chart"></div><script src="https://cdn.plot.ly/plotly-4.1.1.min.js"></script><script>Plotly.newPlot("chart", [{type: "funnel",y: ["Applications", "Reached a decision", "Approved", "Became a loan"],x: [5374348, 4358716, 3750898, 3592033],textinfo: "value+percent previous"}], {yaxis: {automargin: true}});</script>
Add more traces with the same y to compare groups, and set layout.funnelmode to "group" (side by side), "stack" (segments of one bar) or "overlay" (one in front of another). For a React funnel chart, pass the same trace and layout to the Plot component of react-plotly.js.
Share it
Every Plotly chart has a Share chart button (the cloud icon in its toolbar) that uploads it to Plotly Cloud and gives you a link. Only you can see it until you change its visibility.
For a live app, put the chart in a Dash app and publish it with the Plotly Cloud CLI. Coding agents can run these commands for you:
pip install "dash[cloud]"plotly user loginplotly app publish
If your data has to stay in your own cloud or data center, publish to Dash Enterprise instead. In a Dash app, the clickData of a funnel in a dcc.Graph gives the clicked stage, so a callback can show the records that dropped out there.
Dos and don'ts
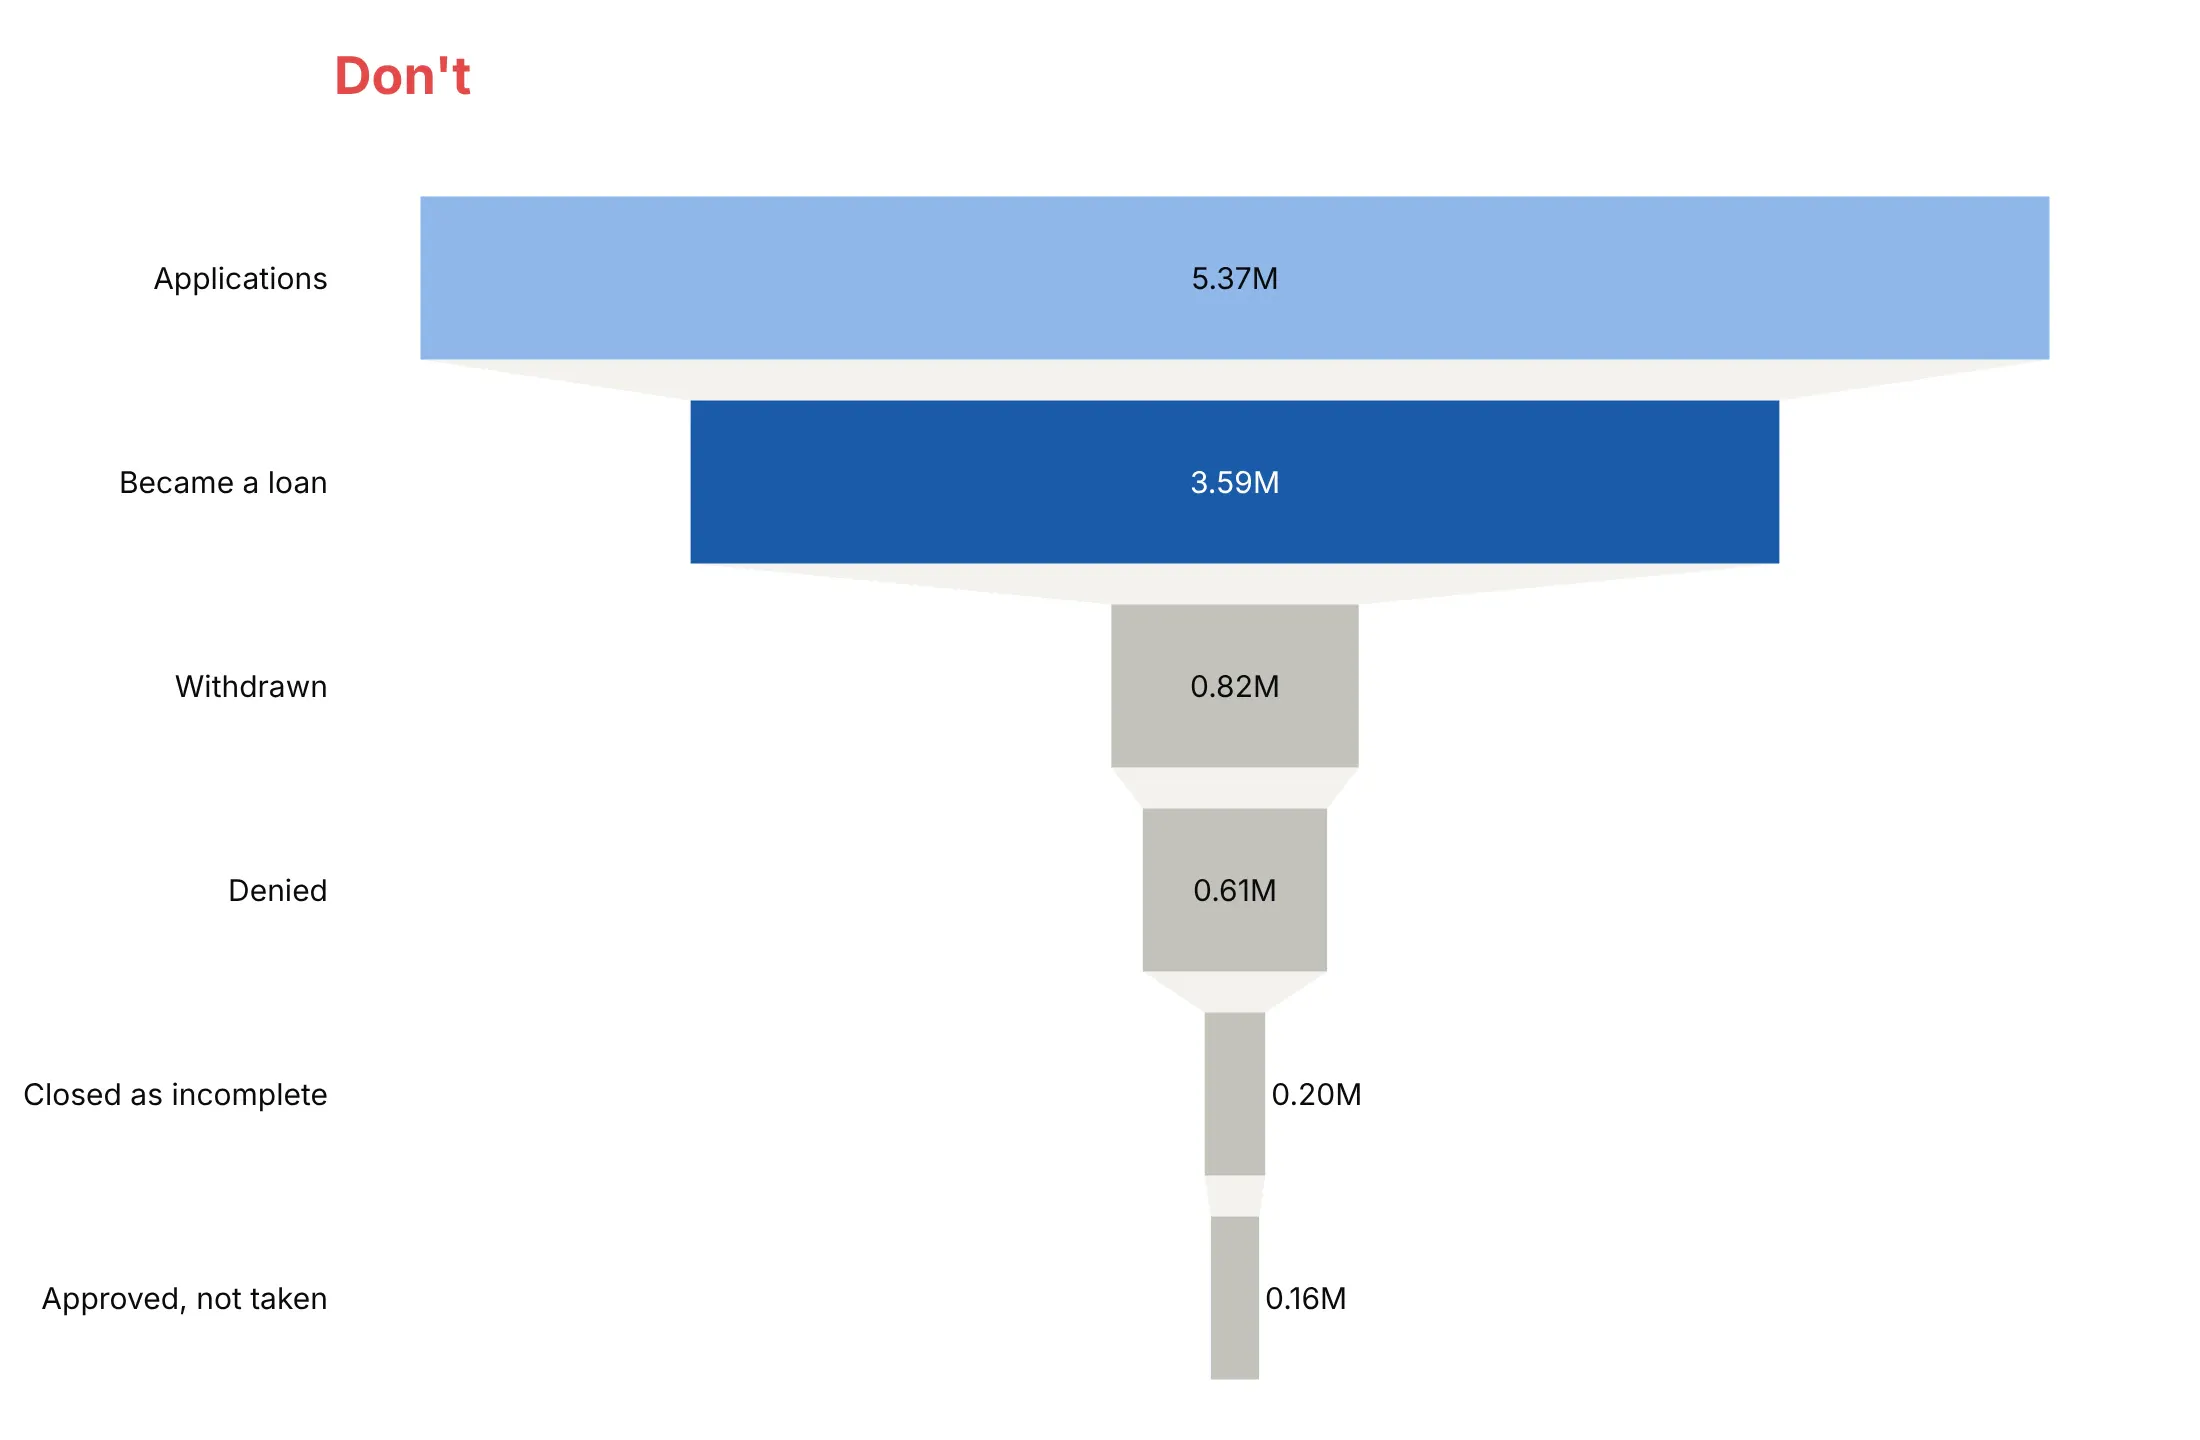
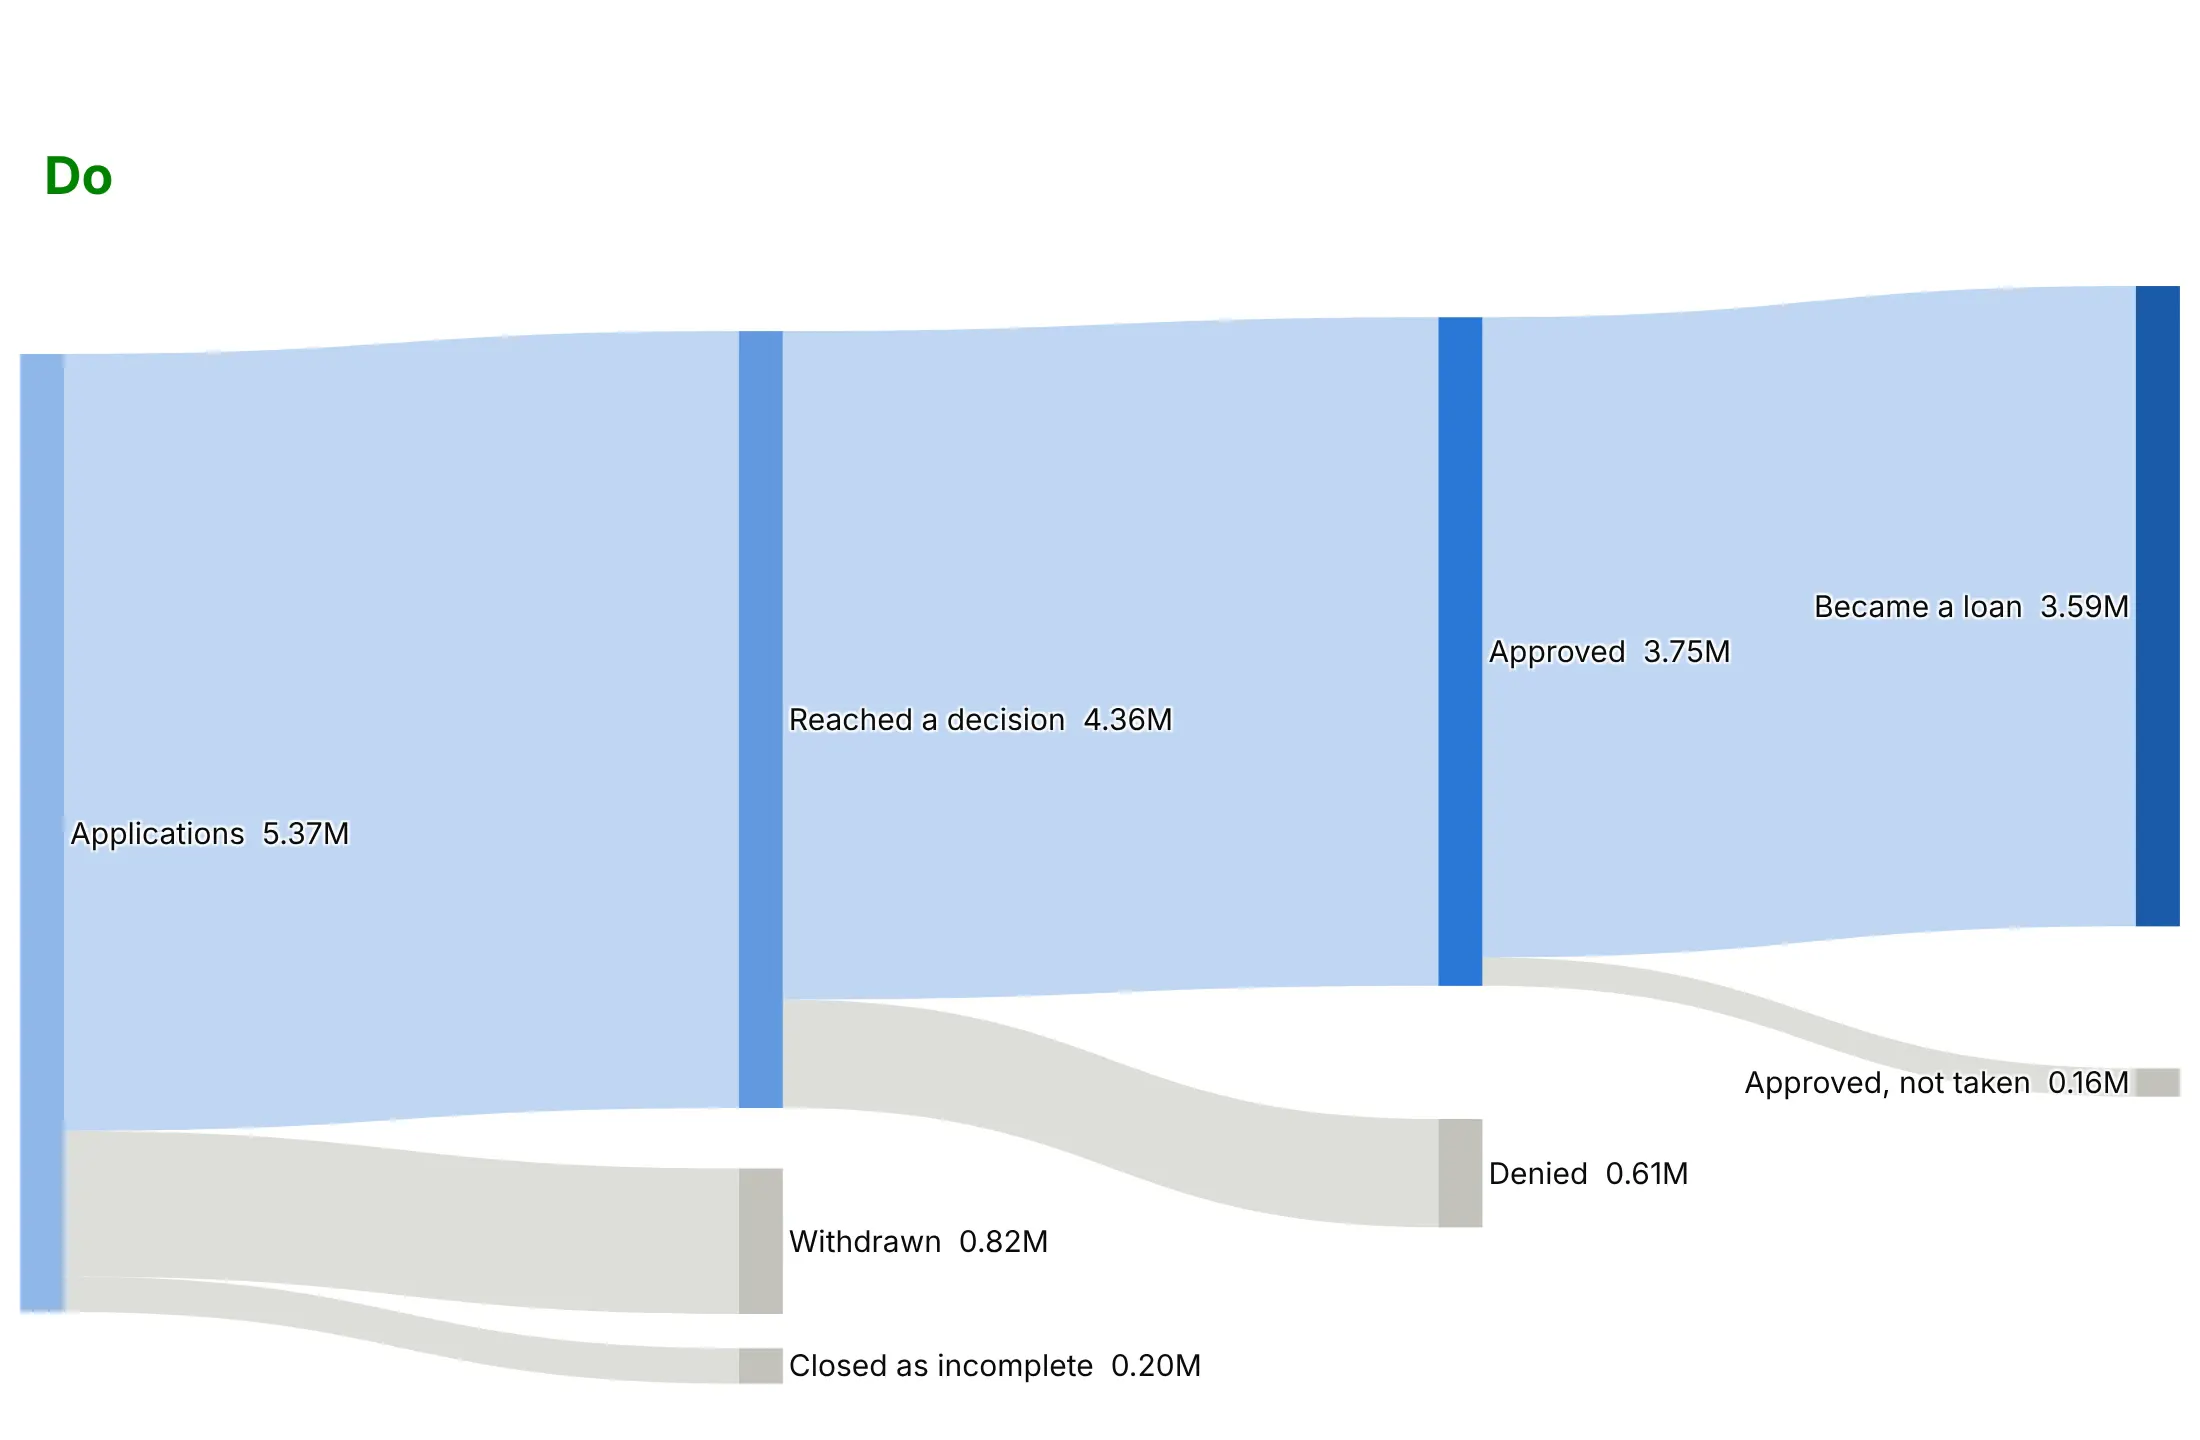
A funnel chart assumes a single path: everyone who reaches a stage also passed every stage before it, so each bar is a subset of the bar above. Many processes don't work that way, because people leave by different exits or the stages branch, and a funnel makes those processes look simpler than they are. Here is the same 2025 mortgage data both ways, in the same colors: blues for the path to a loan and gray for the ways out.
Don't draw a funnel for stages that aren't nested. These are the five ways the 5.37 million home purchase applications ended, sorted by size. The funnel shape says that the denied applications were part of the withdrawn ones and that the withdrawn ones were part of the loans, when they are separate exits that add up to the applications, and it hides the step at which each one left:
Do use a Sankey diagram when the process branches. Each exit now leaves the path at the step where it happened: withdrawn and incomplete applications before a decision, denials at the decision, and approved loans the borrower didn't take at the end. Keep the funnel for processes where every stage is a subset of the one before, like the four nested stages at the top of this guide, which are the blue path through this Sankey:
Choose the number for the question
textinfo decides which numbers each bar carries, and each option answers a different question. You can show more than one when the reader needs both: the chart at the top of this guide prints the count and the conversion from the stage before on every bar (text+percent previous, with the counts shortened in text; value+percent previous does the same with full counts). Here are the four options on the same data.
value answers "how many reached each stage", from 5,374,348 applications down to 3,592,033 loans.
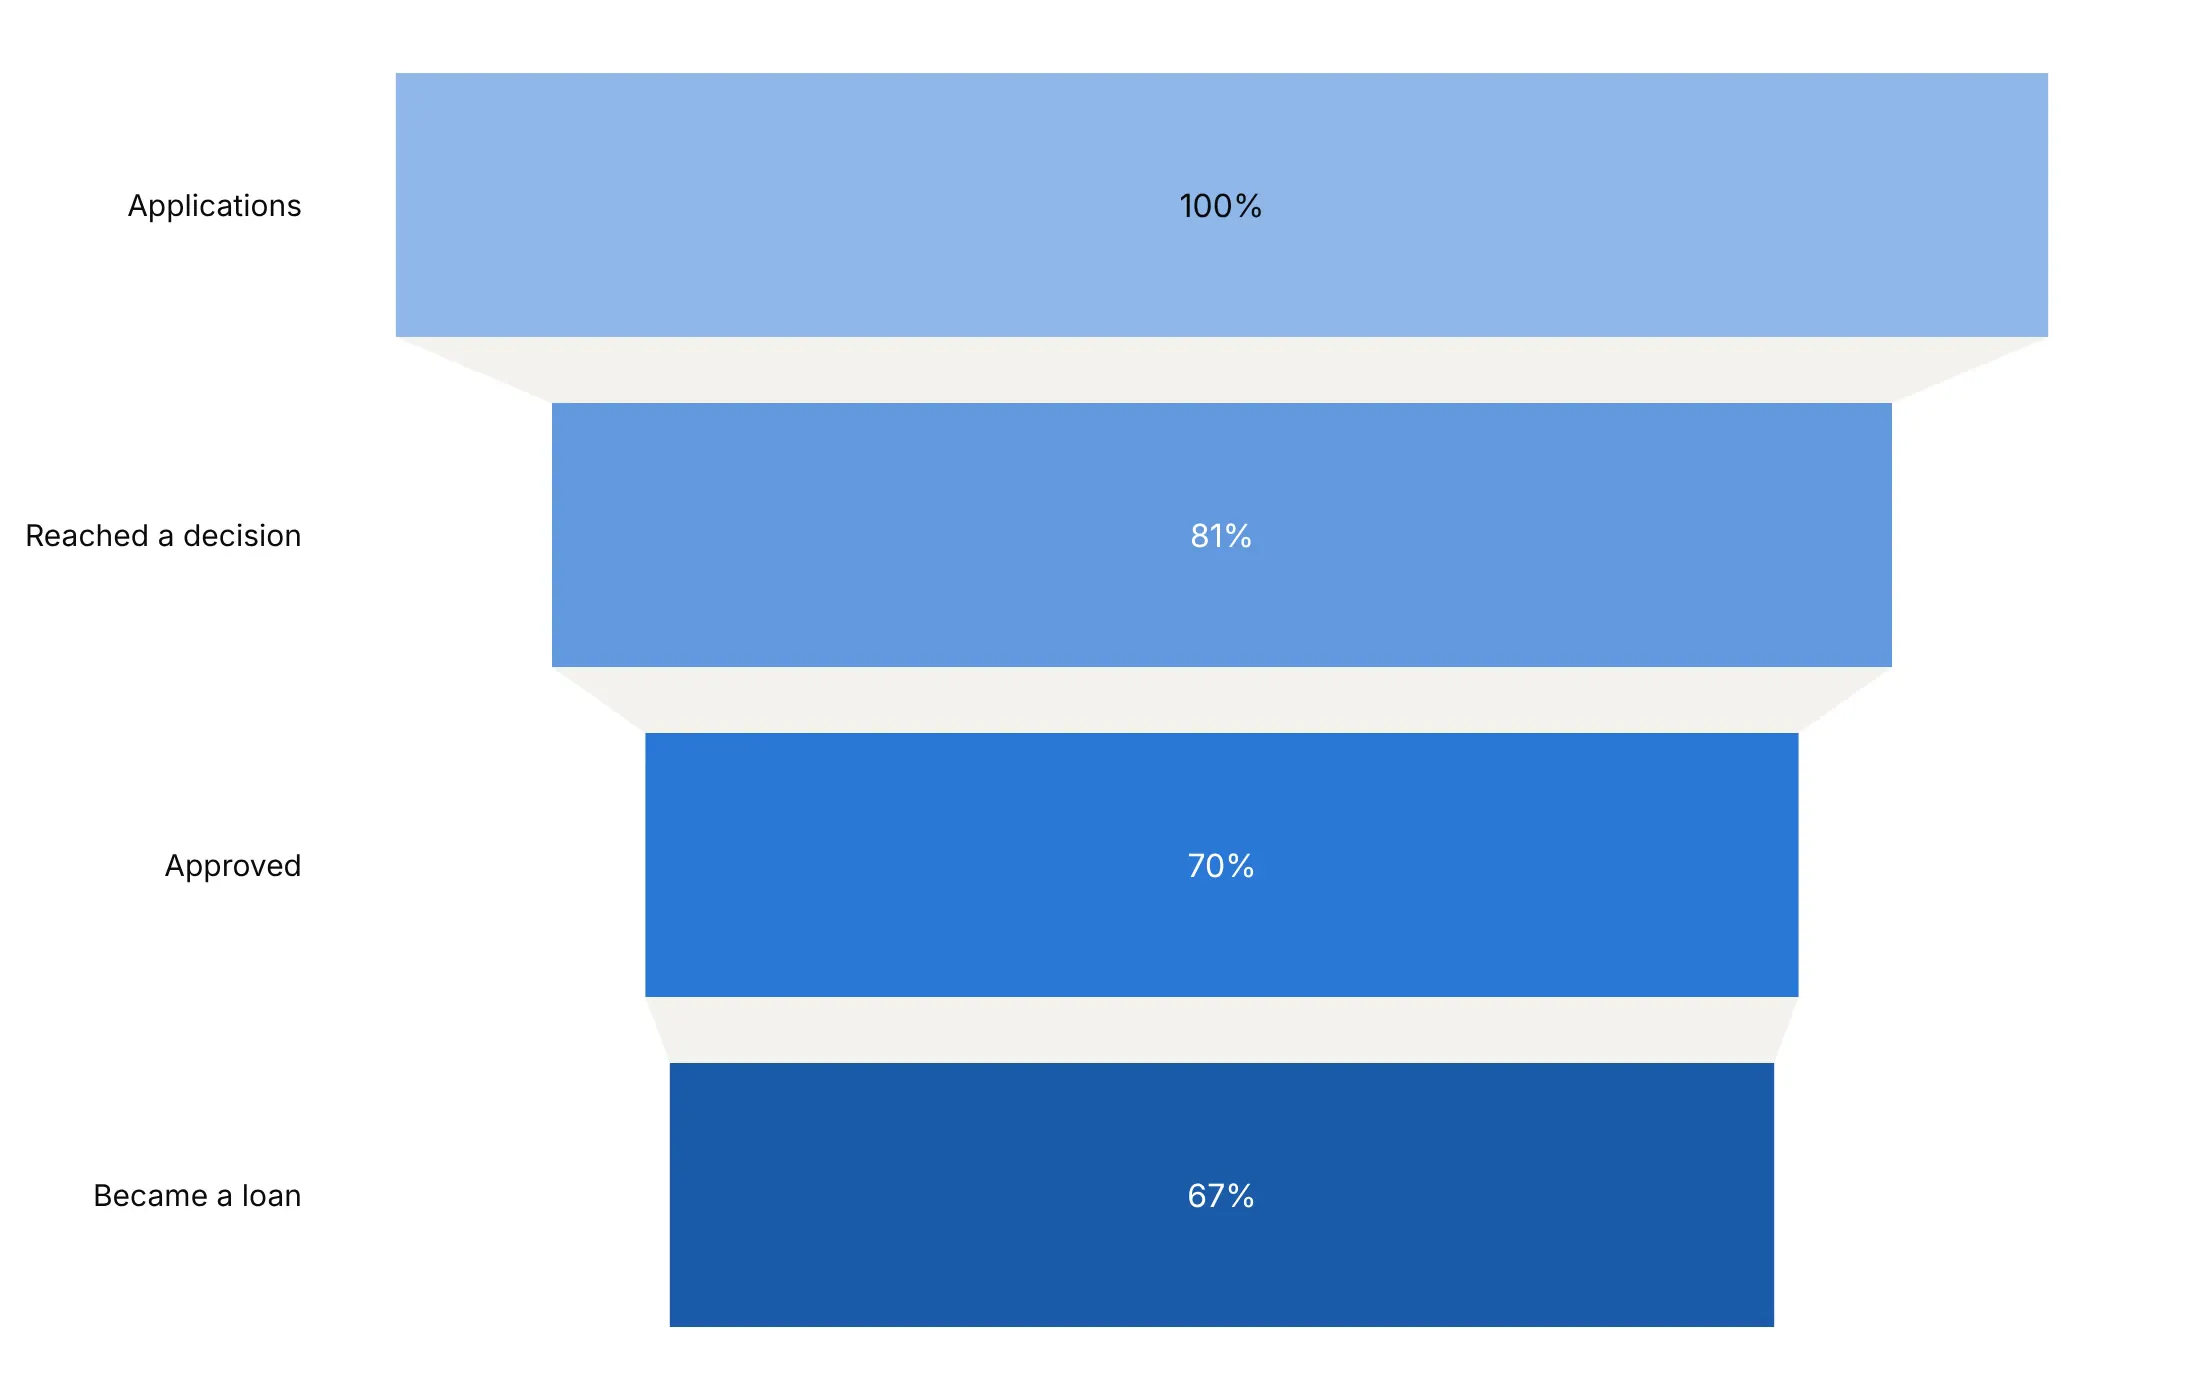
percent initial answers "how much of the start is left", here 67% of applications by the last stage.
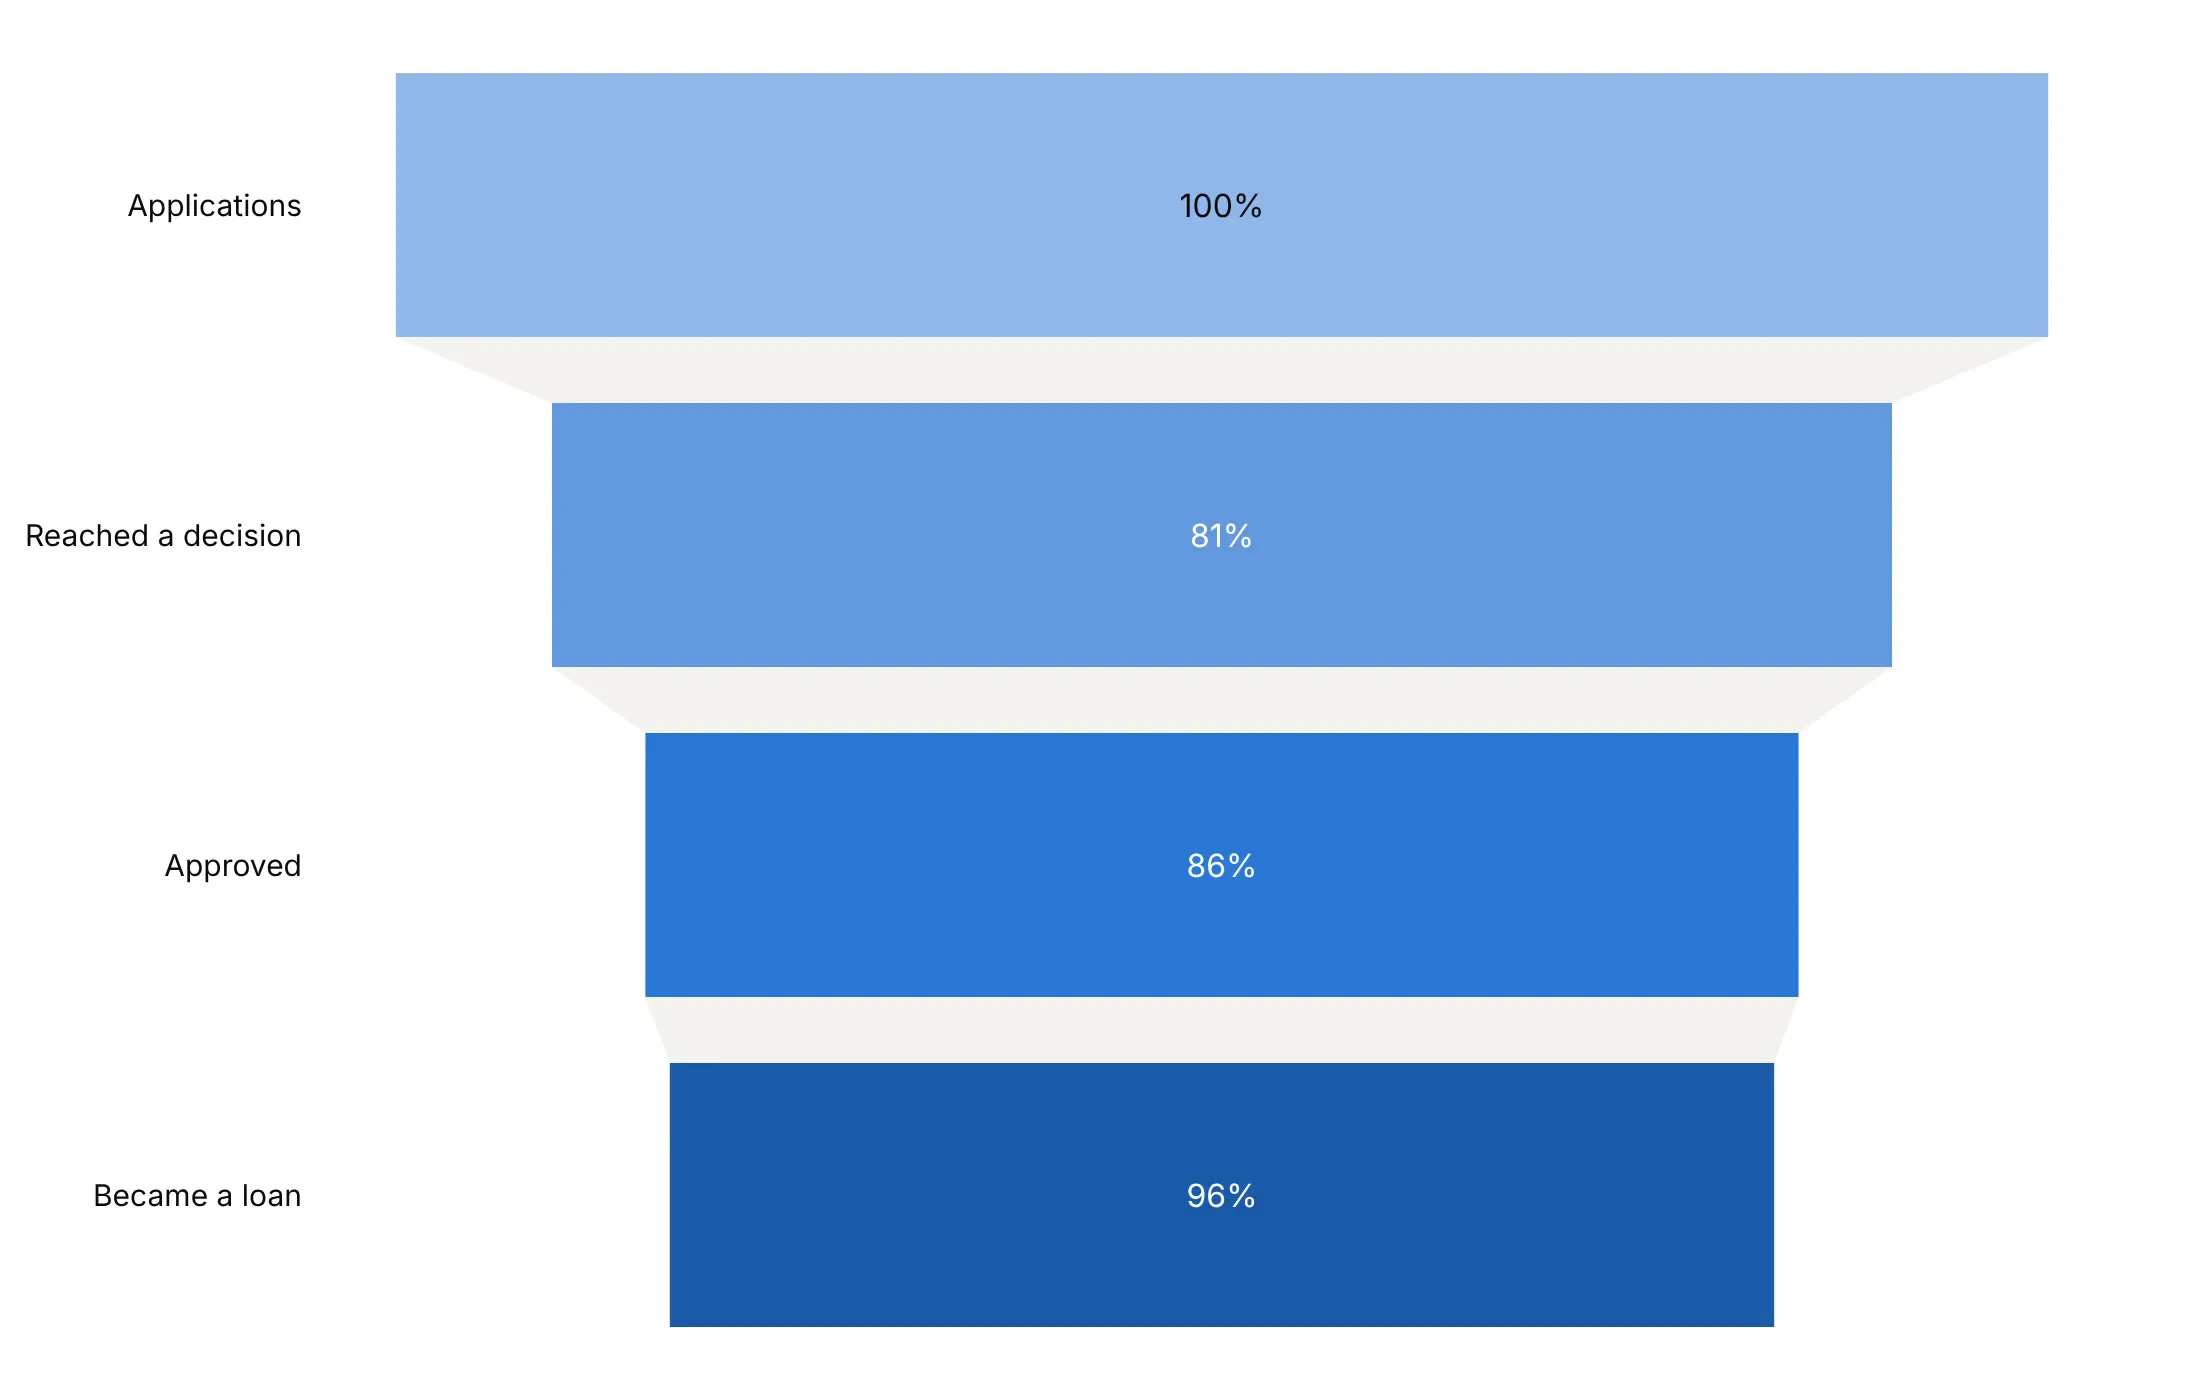
percent previous answers "which step leaks the most": 81% of applications reached a decision, the lowest of the three steps.
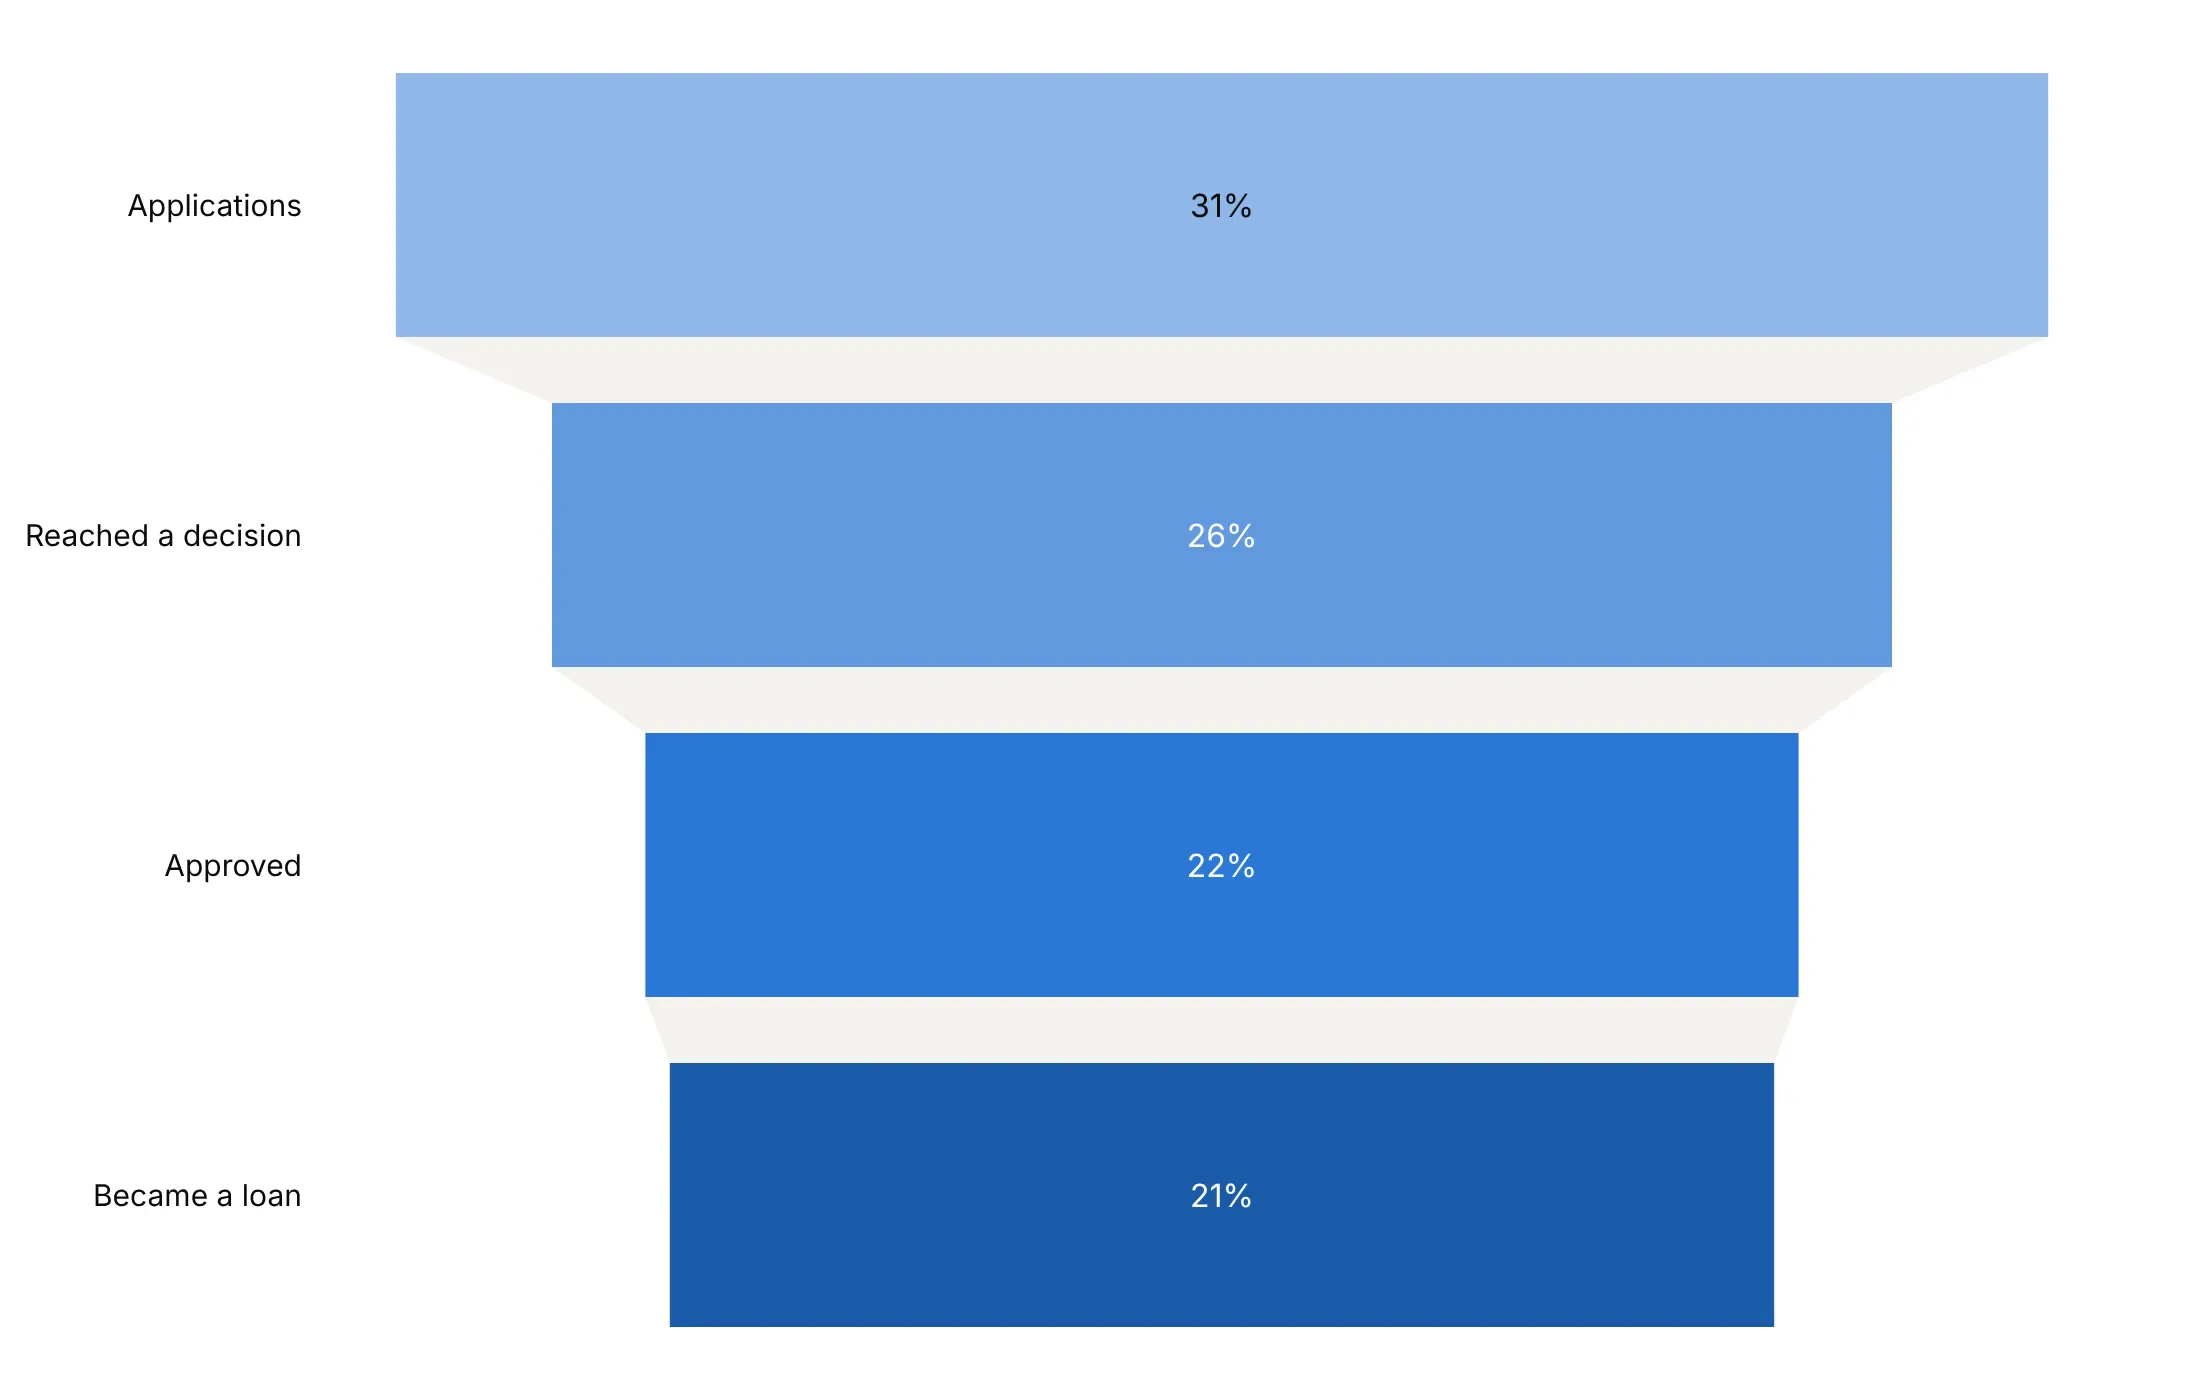
percent total answers "what share of the sum of all bars is this bar". It divides each bar by the total of the four bars, 17.1 million here, so it gives 31%, 26%, 22% and 21%. Because these stages are nested, an application that became a loan is counted in all four bars, so for a share of the starting applications use percent initial, and keep percent total for bars that are separate parts of one whole.
Checklist
Do
- Use a funnel only when every stage is a subset of the one before.
- Use a Sankey diagram when the stages branch or people leave by different exits.
- Write a title that states the takeaway, with the number.
- Show the numbers that answer the question, combine them with + when the reader needs more than one, and say in the subtitle what each percentage is of.
- Use one hue, darker towards the outcome, or gray with one highlighted stage.
- Name the leaks with annotations between bars when the drop is the story.
- Put small bars' text outside with a per-bar textposition list.
- Normalize groups to 100 when you compare funnels of very different sizes.
Don't
- Stack outcomes or branches as funnel stages. A funnel that widens is a bar chart, and one that branches is a Sankey diagram.
- Mix time windows. Count every stage for the same cohort or period.
- Compare many groups as funnels. Chart the rates instead.
Options to customize
These are the go.Funnel and go.Funnelarea options that matter most. The full list is in the Plotly funnel chart documentation and the funnel trace reference.
- y, x: the stage names and the counts; orientation="v" swaps them.
- textinfo: value, percent initial, percent previous, percent total, label or text, combined with +. Each answers a different question, so choose the ones the reader needs.
- texttemplate: custom text with %{value}, %{percentInitial}, %{percentPrevious} and %{customdata}, for short numbers, units or extra fields.
- textposition: inside, outside, auto or none; a list sets it per bar, so small bars can have their text outside.
- insidetextanchor: start, middle or end, to keep text centered or move it aside.
- marker.color, marker.line: the bar fill (one color or one per stage) and outline, for one hue or a highlighted stage.
- connector.fillcolor, connector.line, connector.visible: the shape between bars; a light fill, a dashed outline, or hidden in grouped funnels.
- funnelmode (layout): stack, group or overlay for several traces, to compare groups or years.
- funnelgap, funnelgroupgap (layout): the space between stages and between grouped bars.
- customdata, hovertemplate: extra fields and hover text, such as the raw counts behind normalized values.
- uniformtext (layout): a minimum text size; mode="hide" drops text that won't fit, which helps stacked funnels with small segments.
- values, labels (go.Funnelarea): slices of a fixed funnel shape whose areas are shares of the total, for outcomes that don't overlap.
- aspectratio, baseratio (go.Funnelarea): the funnel's height-to-width ratio and the width of its bottom.
- scalegroup, domain (go.Funnelarea): size several funnelareas by their totals and place them side by side.
More funnel chart examples
Eleven more funnel charts built from real public data, each with its source, the technique that makes it work and a prompt to rebuild it.
1. Industry posted results for 63% of its Phase 3 trials, other sponsors for 15%
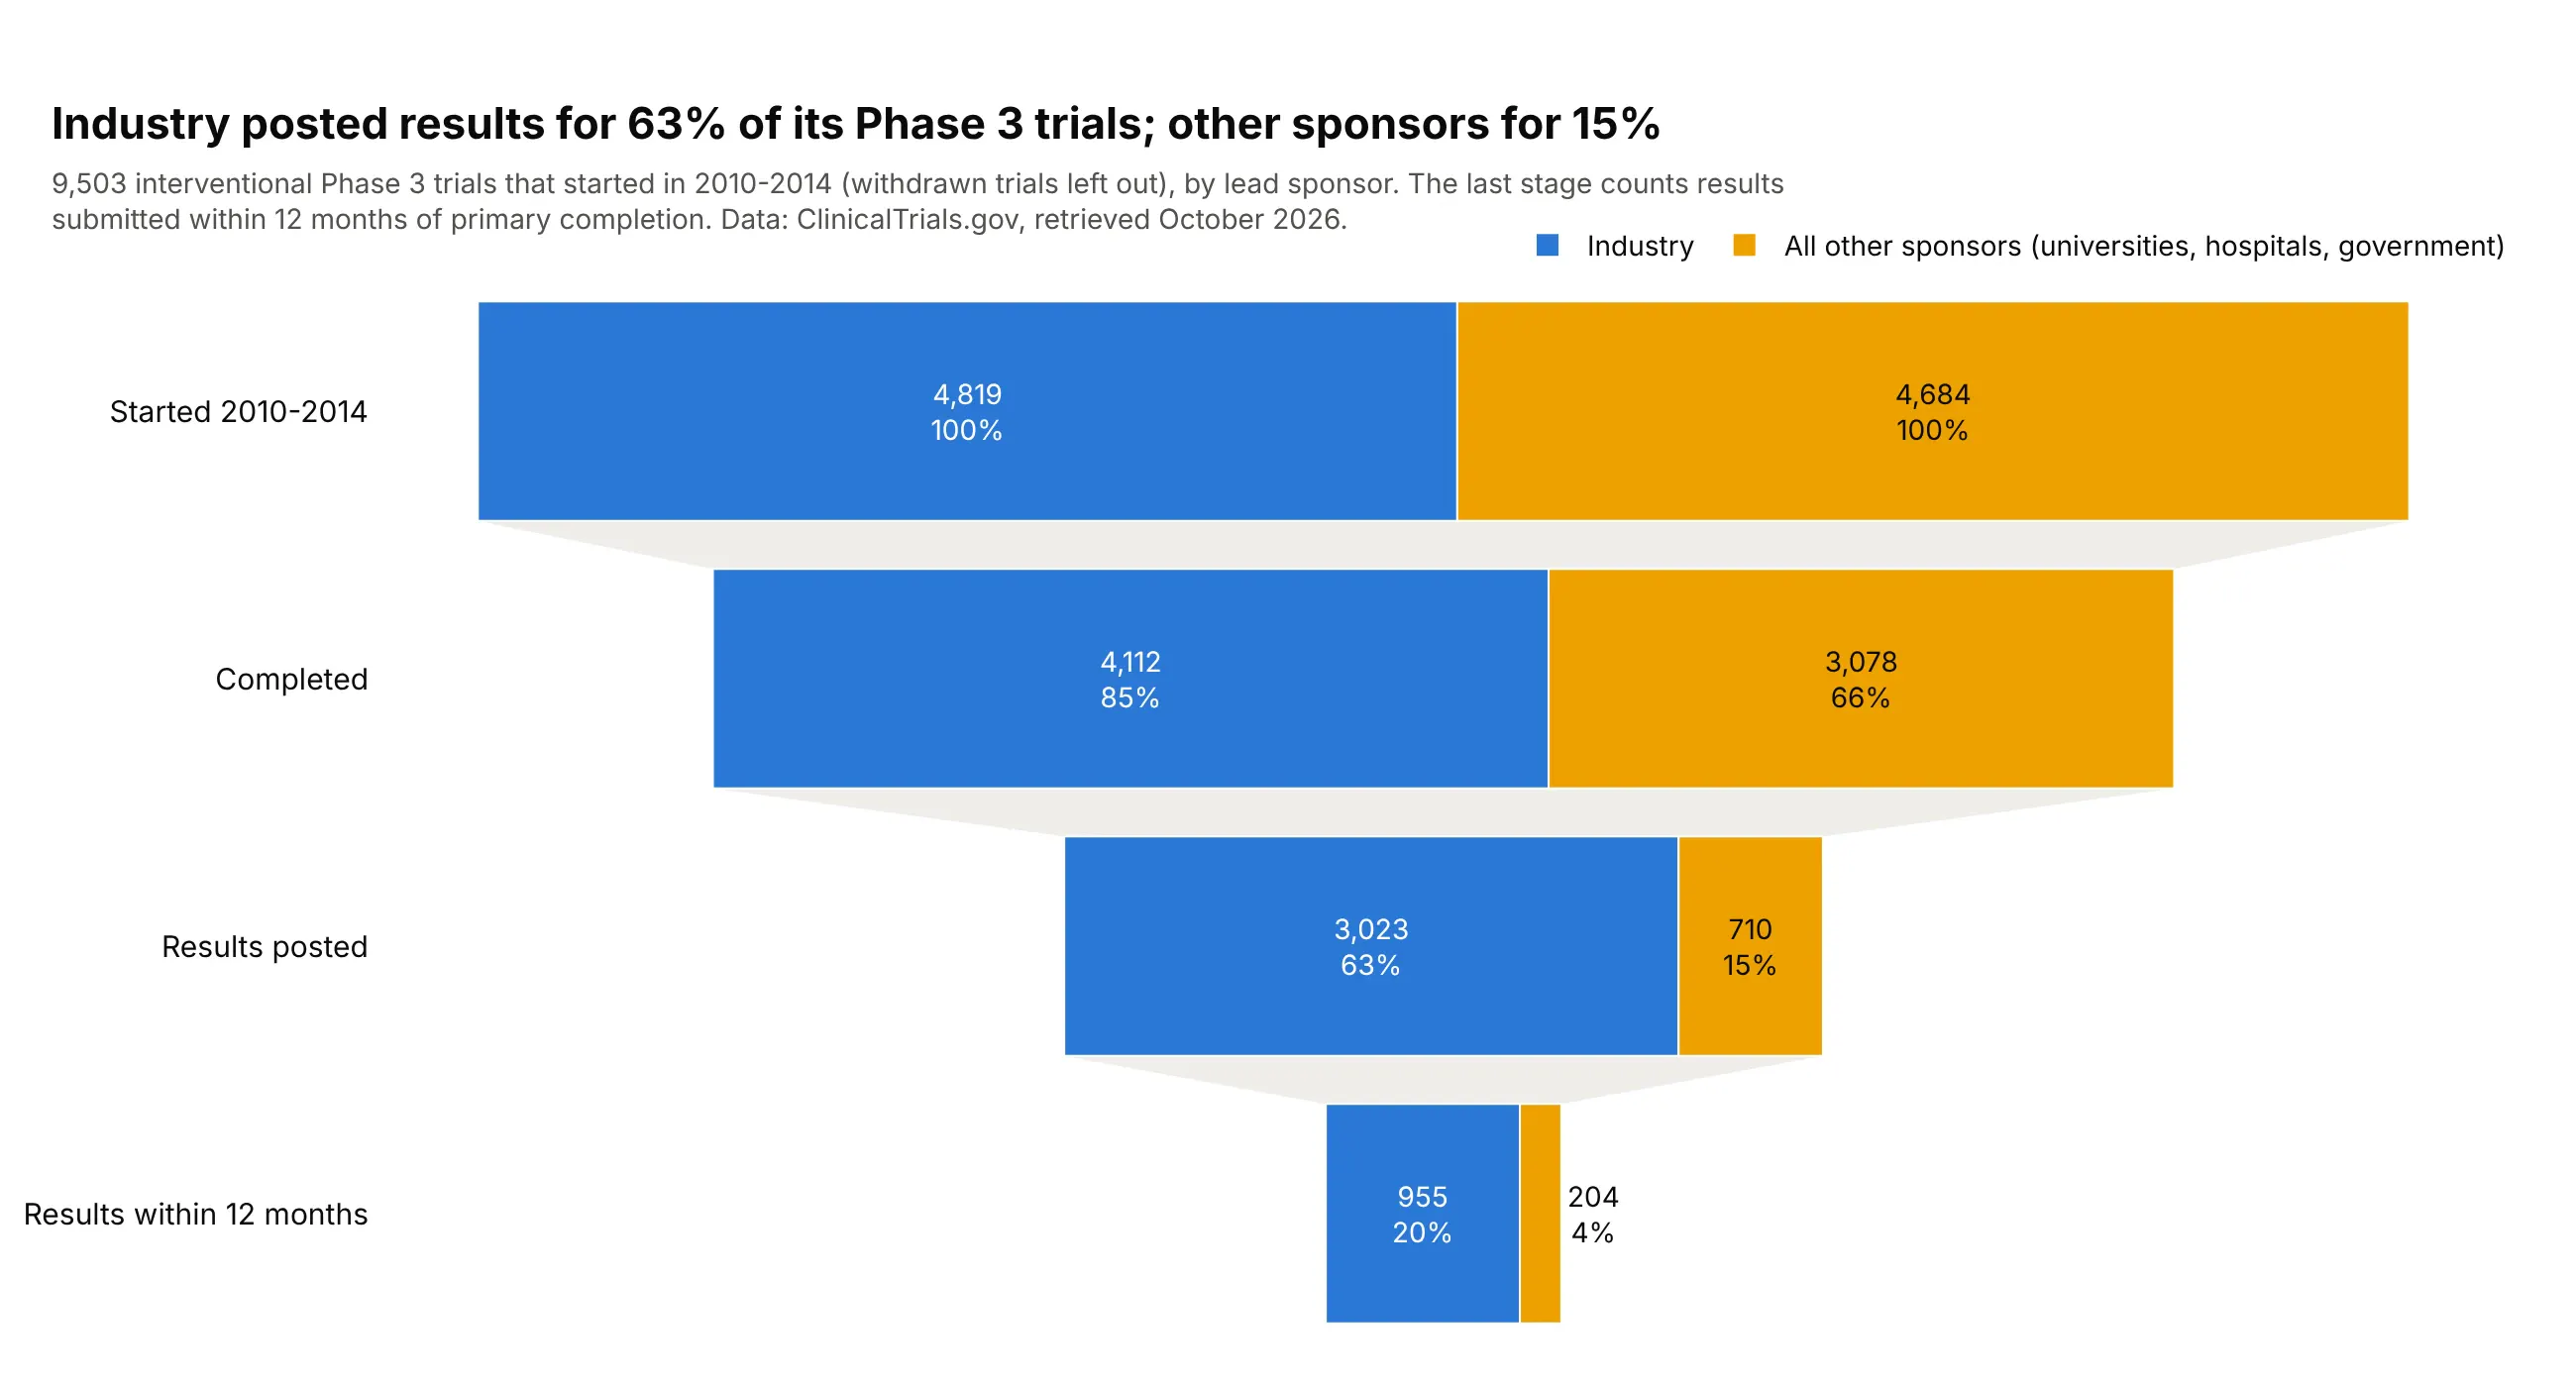
Of 4,819 industry-sponsored Phase 3 trials that started in 2010-2014, 63% have posted results, compared with 15% of 4,684 trials run by universities, hospitals and governments. Only 20% of industry trials submitted results within 12 months of primary completion. Data: ClinicalTrials.gov API.
Tip: with funnelmode="stack", %{percentInitial} is per trace, so each segment shows its own sponsor's share.
Get the data from the ClinicalTrials.gov API v2 (every interventional Phase 3 trial with a startdate in 2010-2014) and shape it into a table(columns: nct_id, sponsor_class, status, has_results, primary_completion, results_first_submitted).Build a plotly stacked funnel (funnelmode="stack"), industry vs all other sponsors.- Drop withdrawn trials. Stages: started, completed, results posted (completed trials only),results submitted within 12 months of primary completion.- Text: count and %{percentInitial} per segment; legend at the top right.
2. In SURMOUNT-1, 21% of placebo patients stopped early, vs 9% on tirzepatide
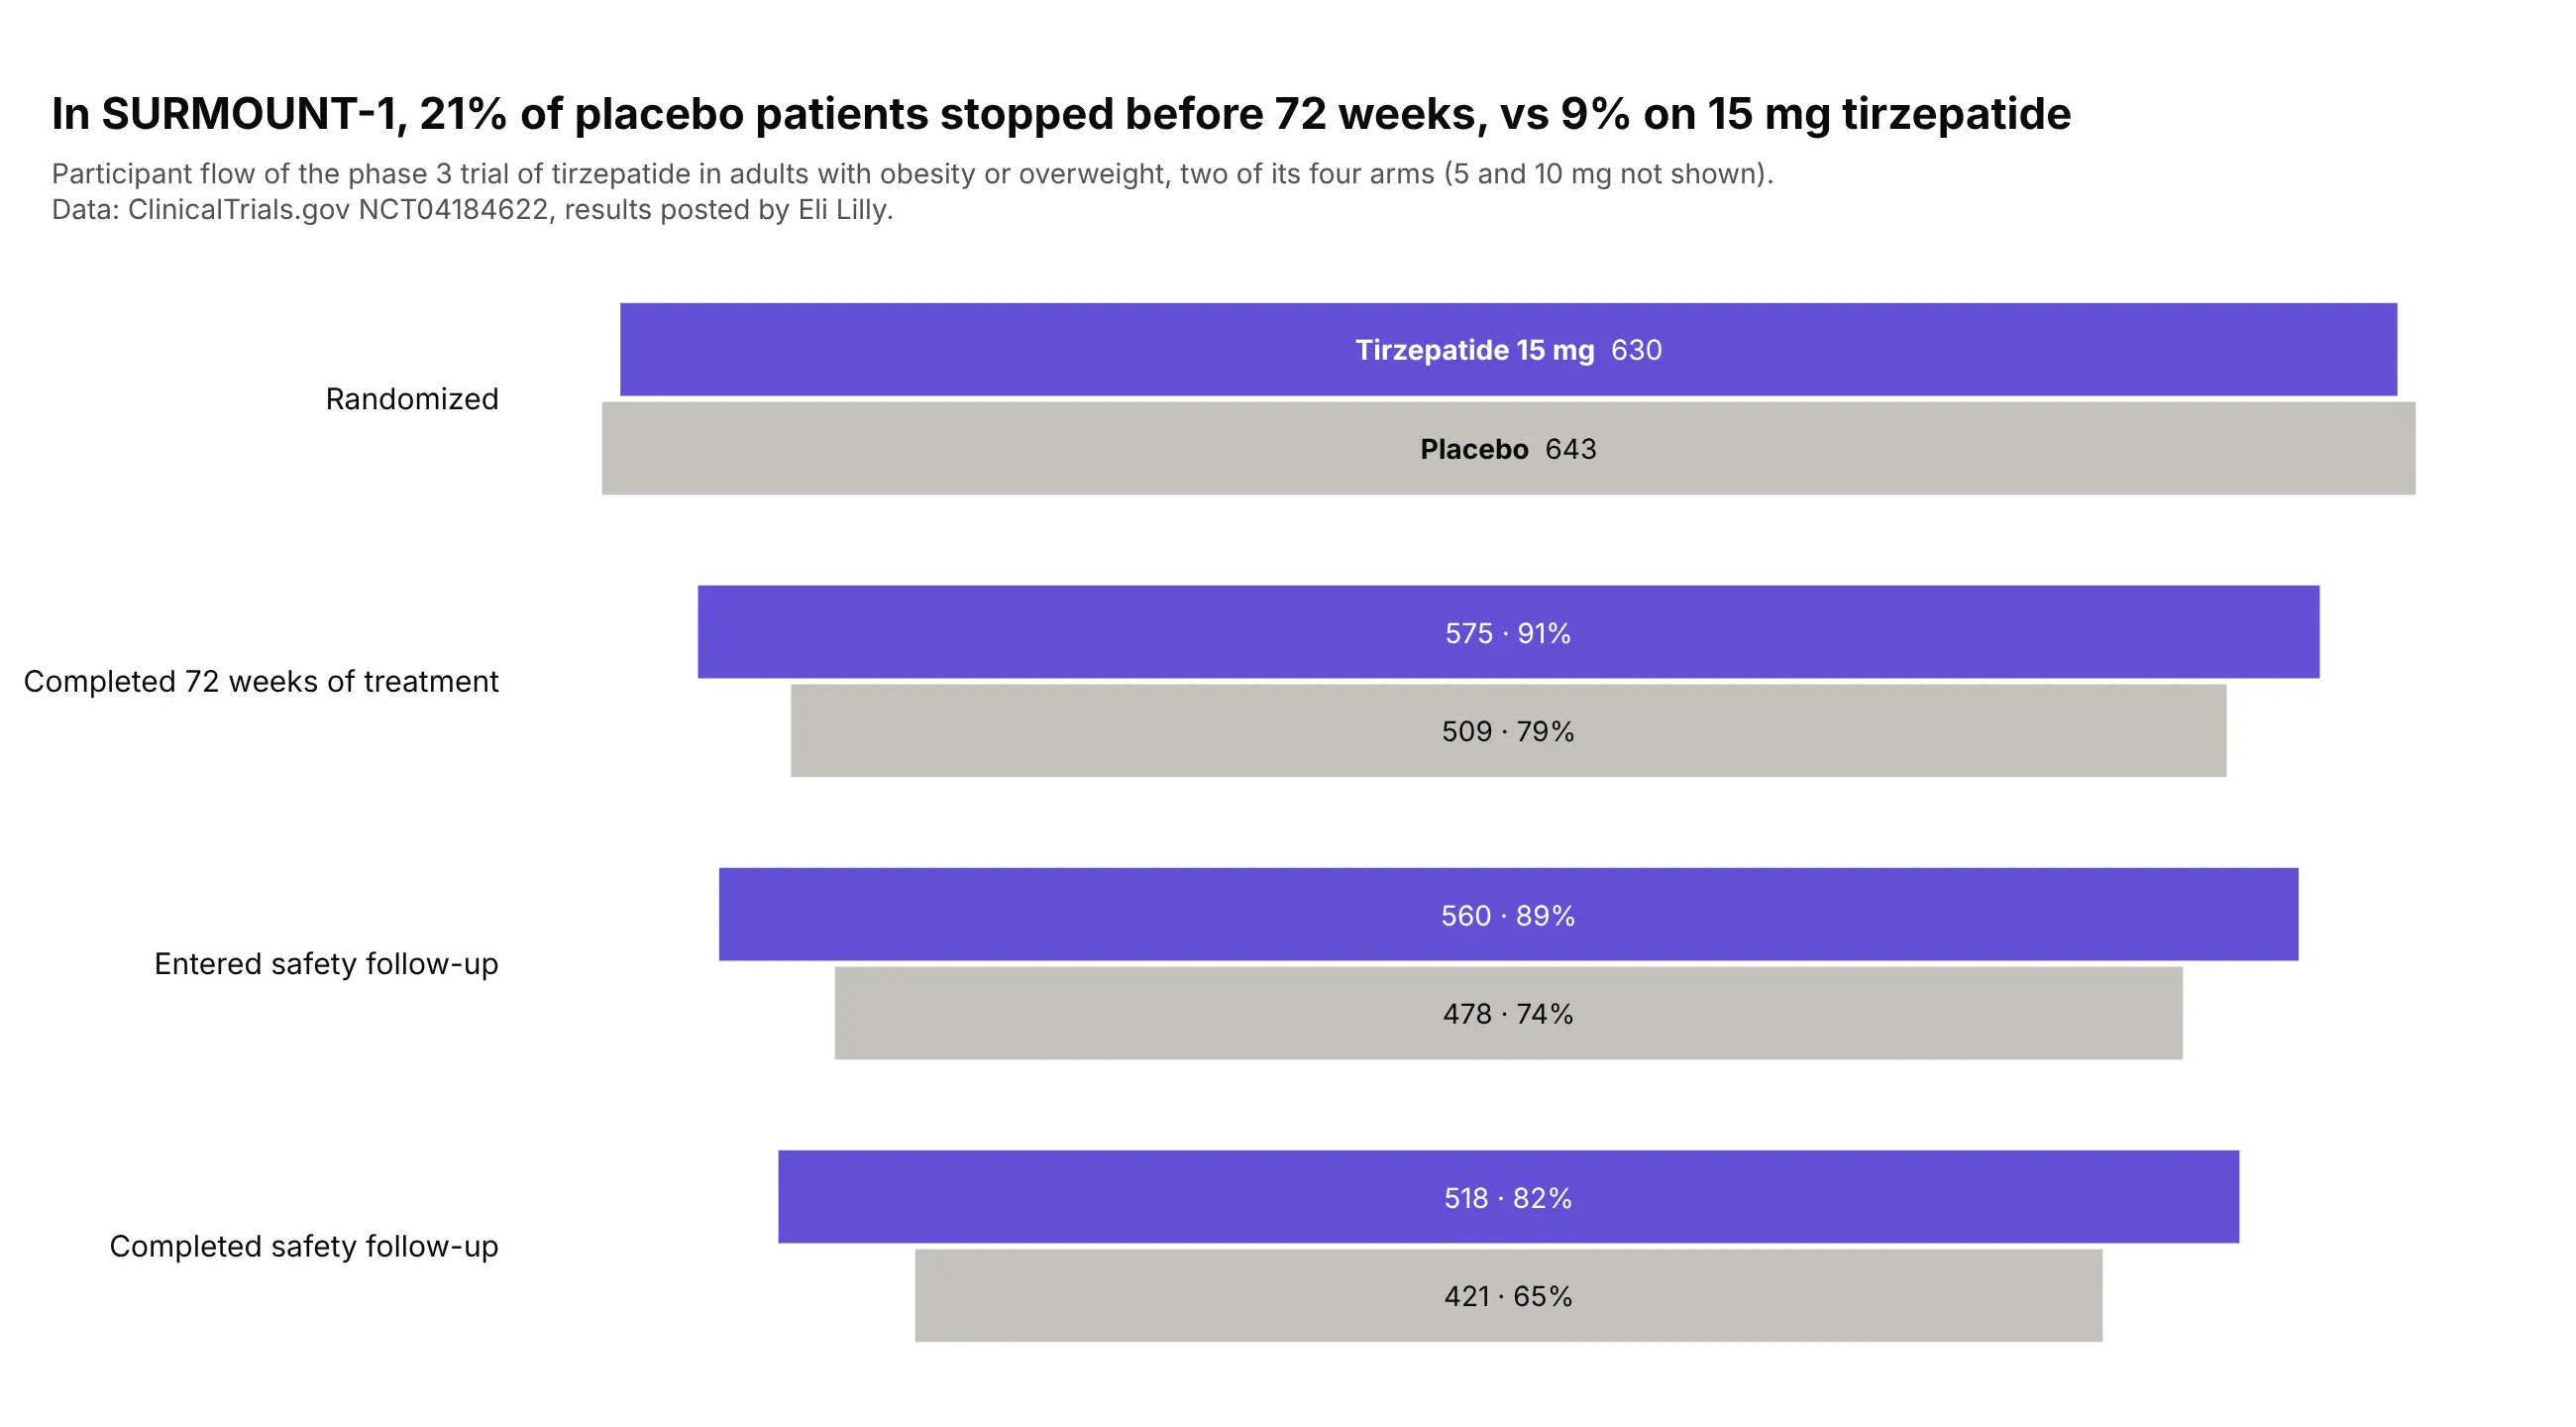
A trial's participant flow is a funnel. In SURMOUNT-1, 134 of 643 placebo patients (21%) stopped before 72 weeks, against 55 of 630 on 15 mg tirzepatide (9%), which matters when reading the results. Data: ClinicalTrials.gov NCT04184622, results posted by Eli Lilly (Jastreboff et al., 2022).
Tip: draw the control arm in gray and the drug in color so the eye goes to the treatment.
Get the data from ClinicalTrials.gov (study NCT04184622, the results section's participant flowmodule) and shape it into a table (columns: arm, stage, participants).Build a plotly grouped funnel comparing Placebo and 15 mg Tirzepatide.- Stages: randomized, completed 72 weeks of treatment, entered safety follow-up, completed safety follow-up.- Text: count and percent of the arm randomized; arm names in the first bars, no legend.- Placebo in gray (#c3c2bc), tirzepatide in purple (#6250d6).
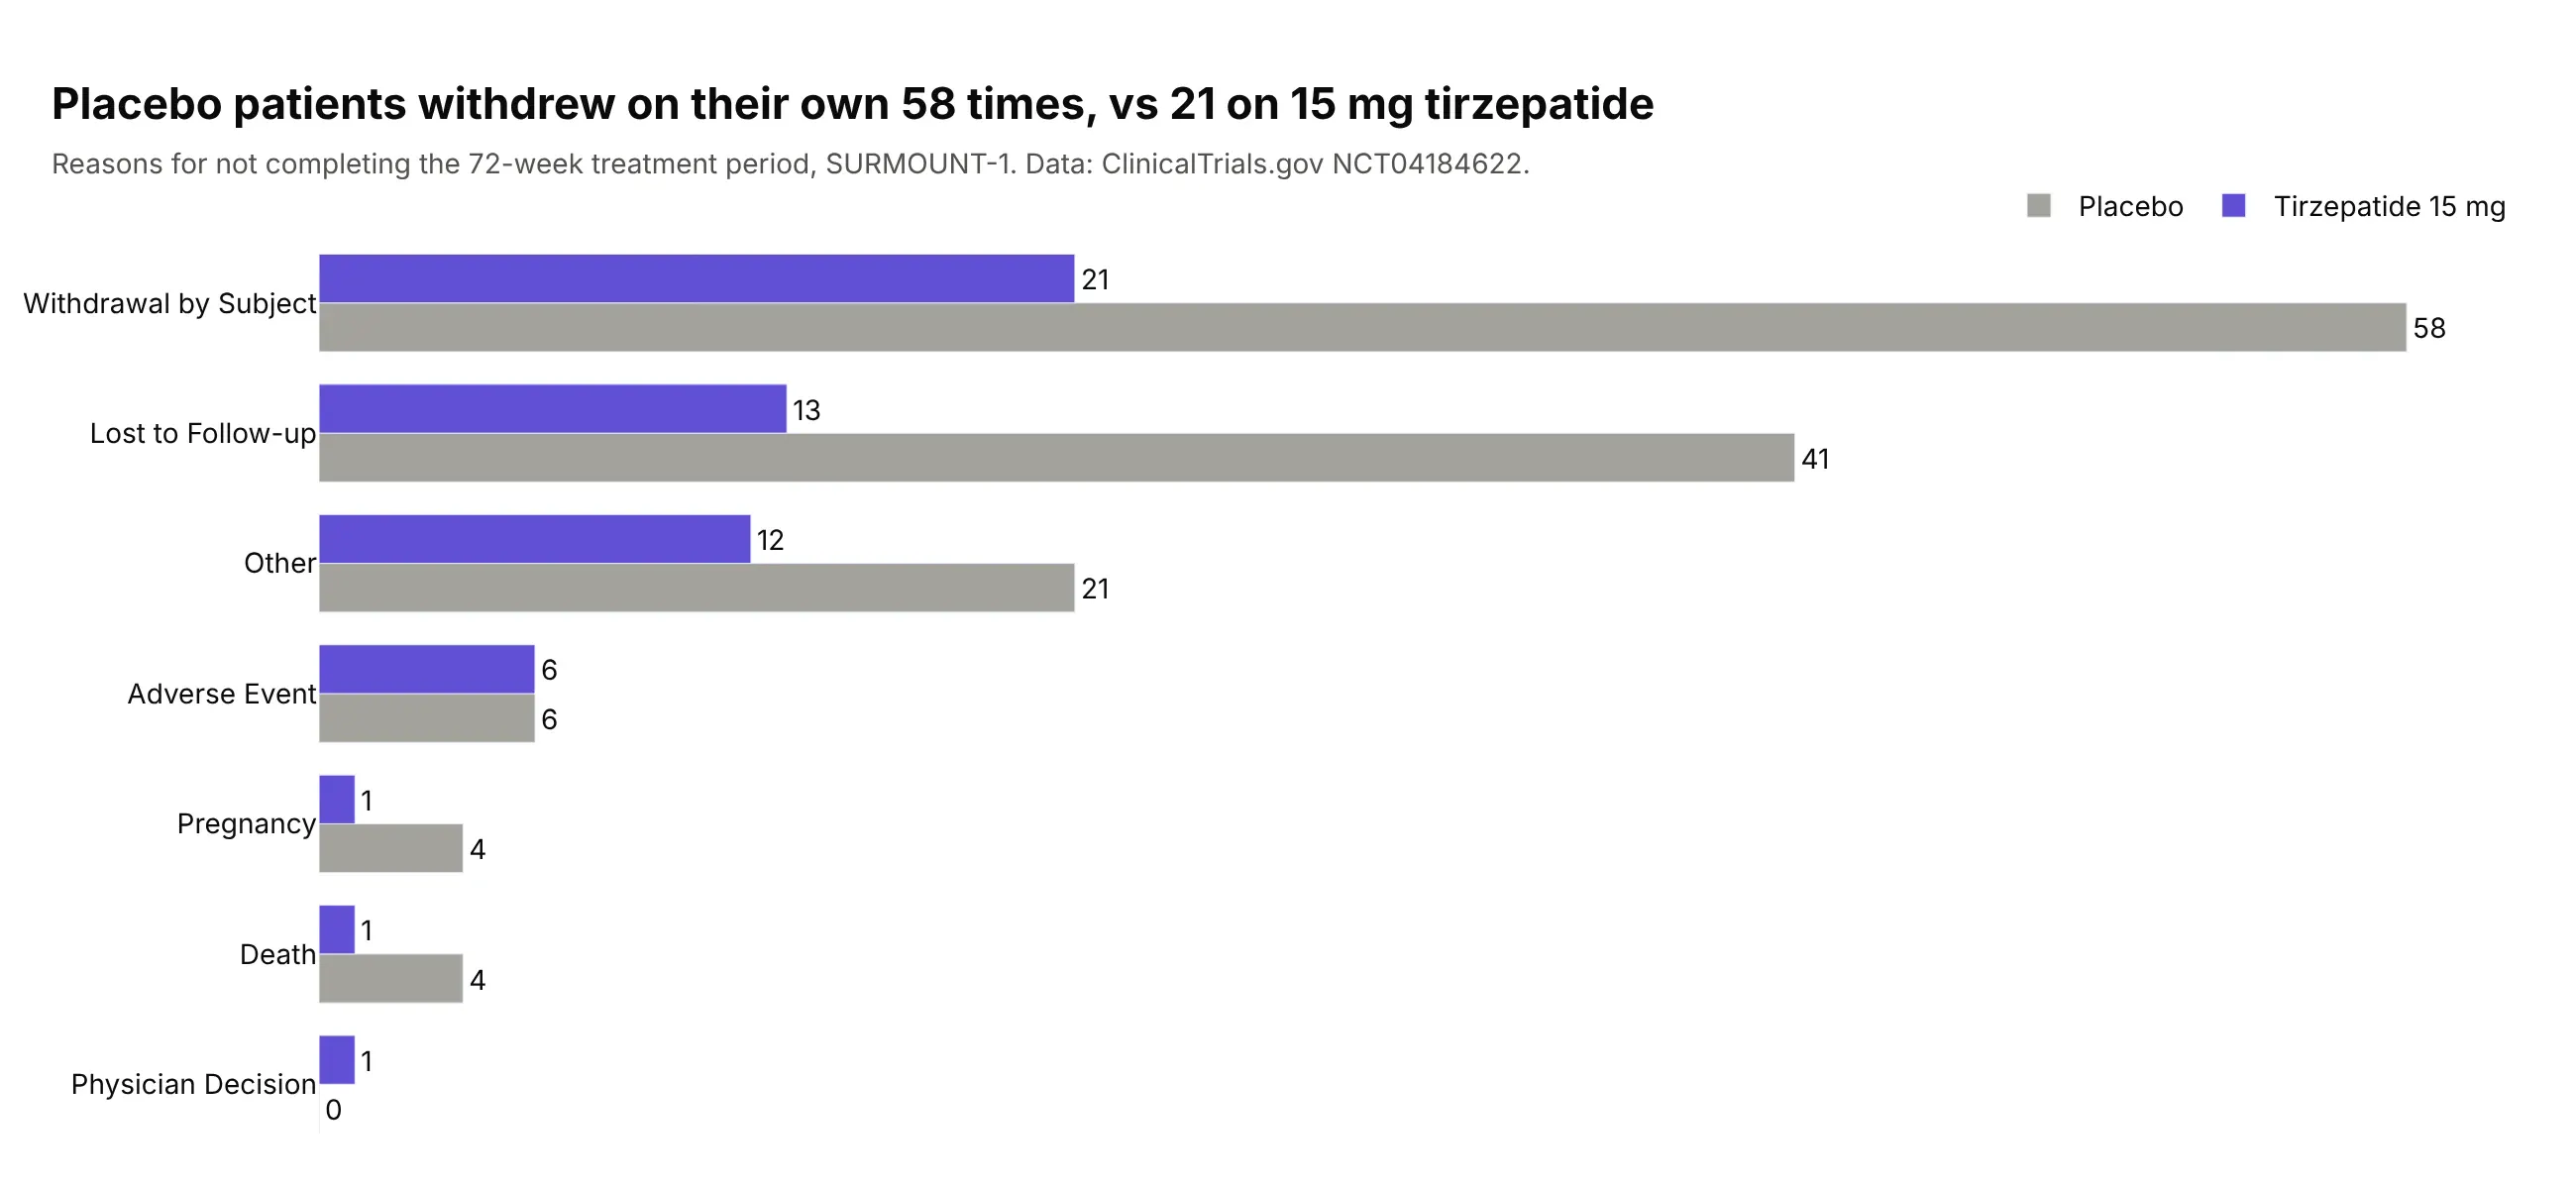
Another way to see it: a grouped bar chart of the reasons for stopping shows the difference is mostly withdrawals and patients lost to follow-up.
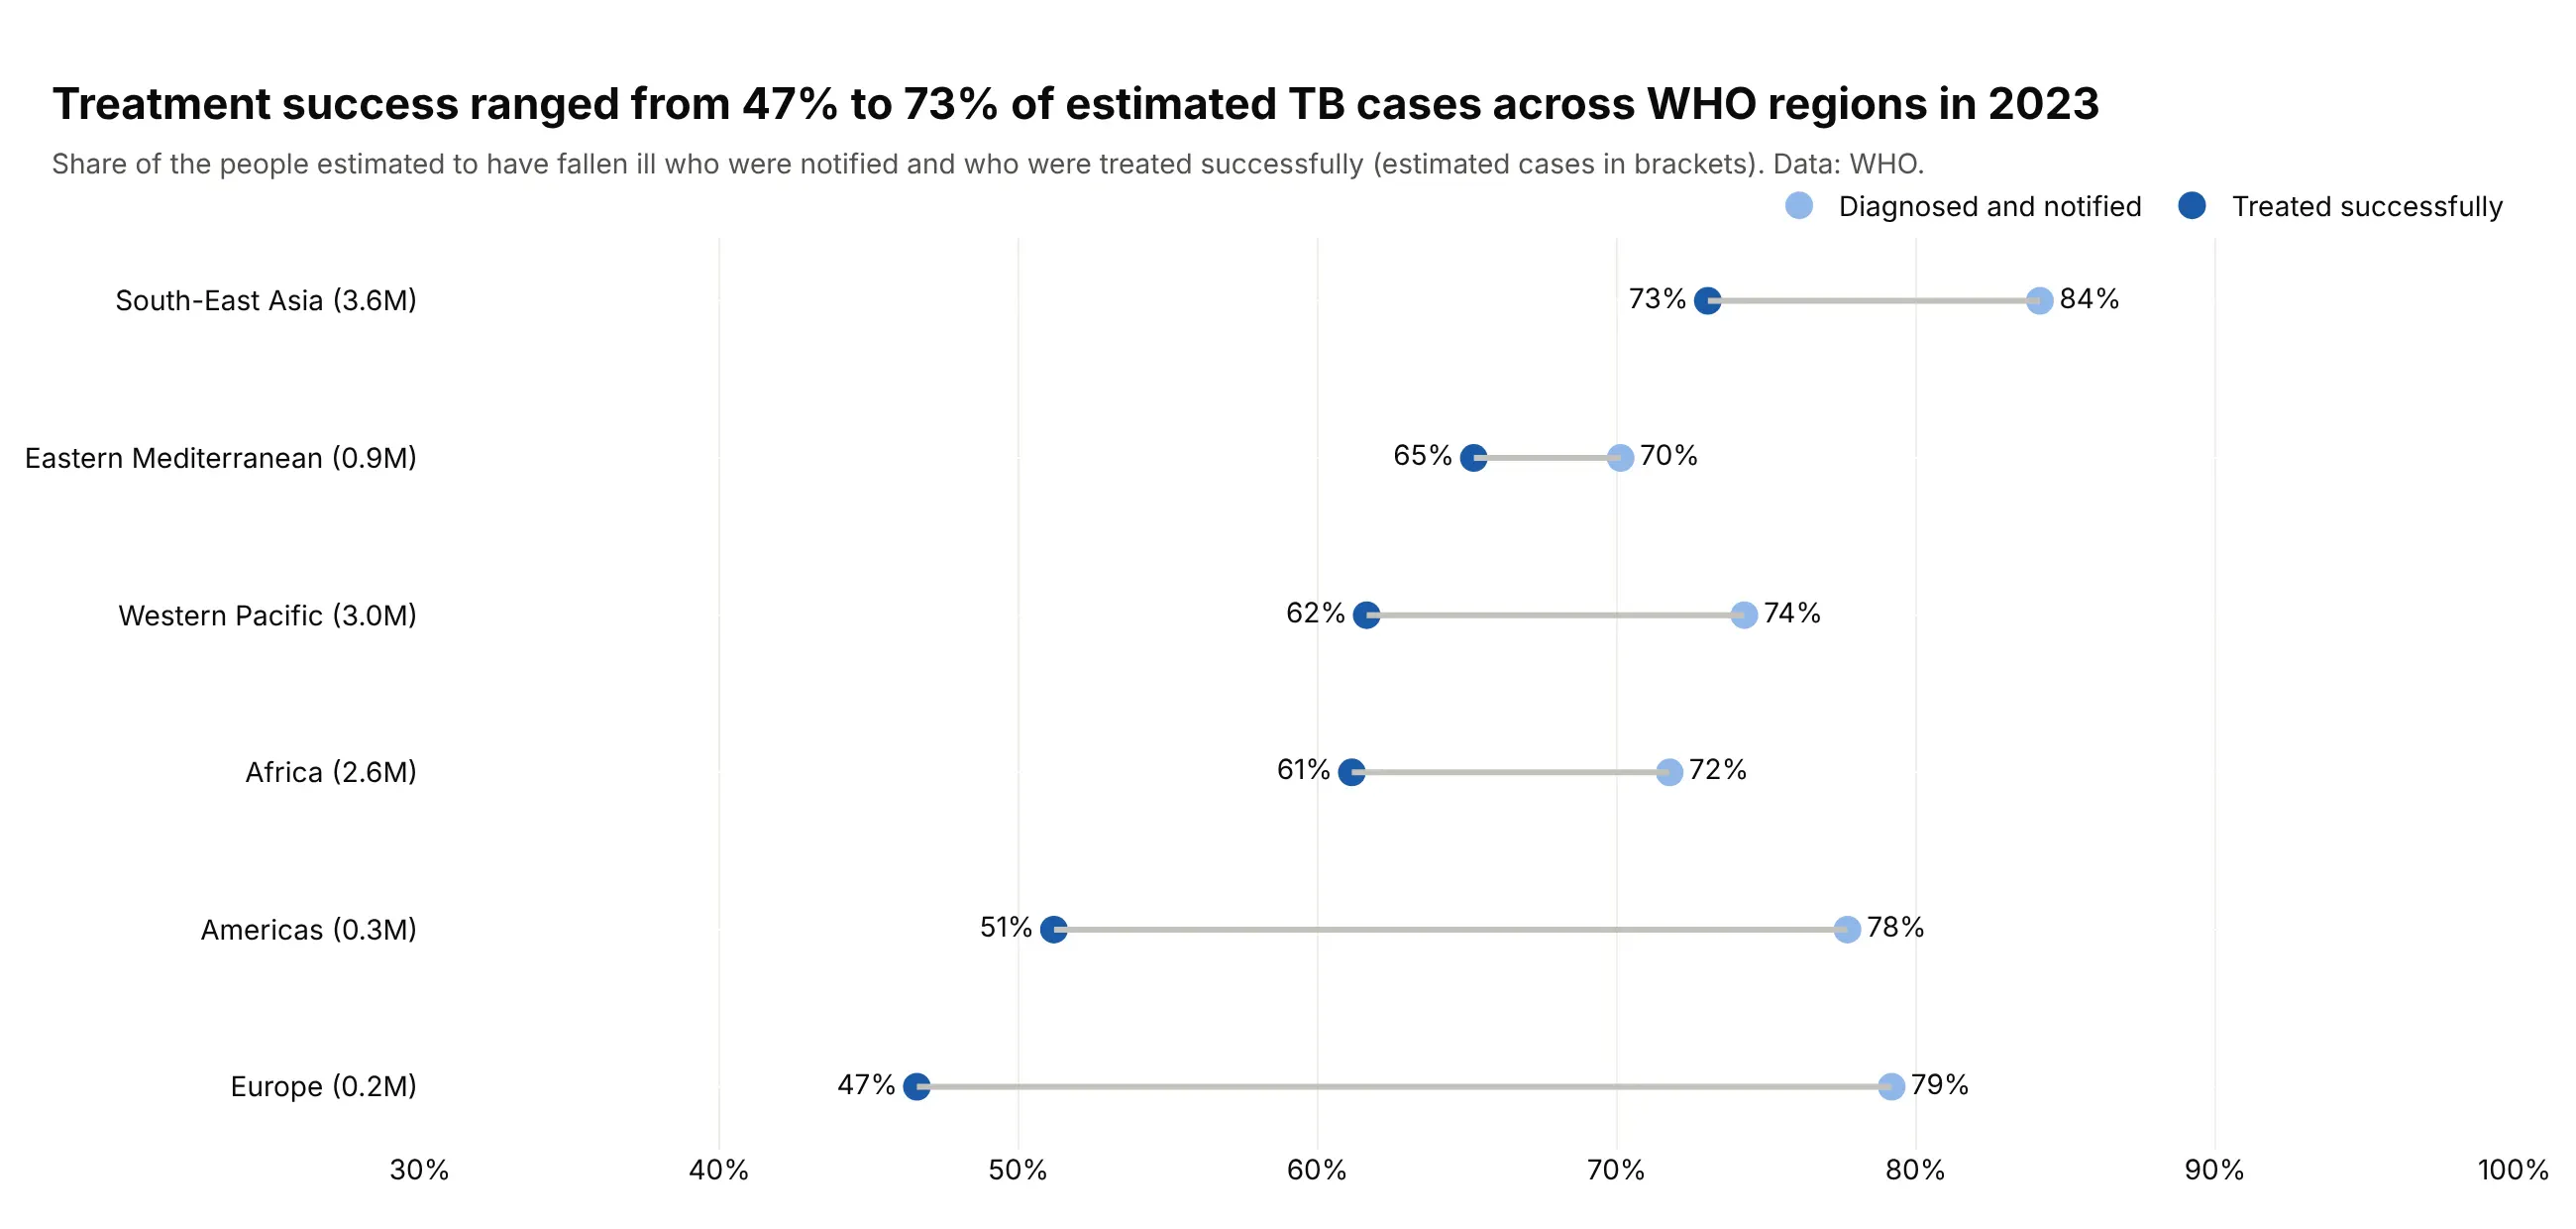
3. Only 65% of people who fell ill with TB in 2023 were treated successfully
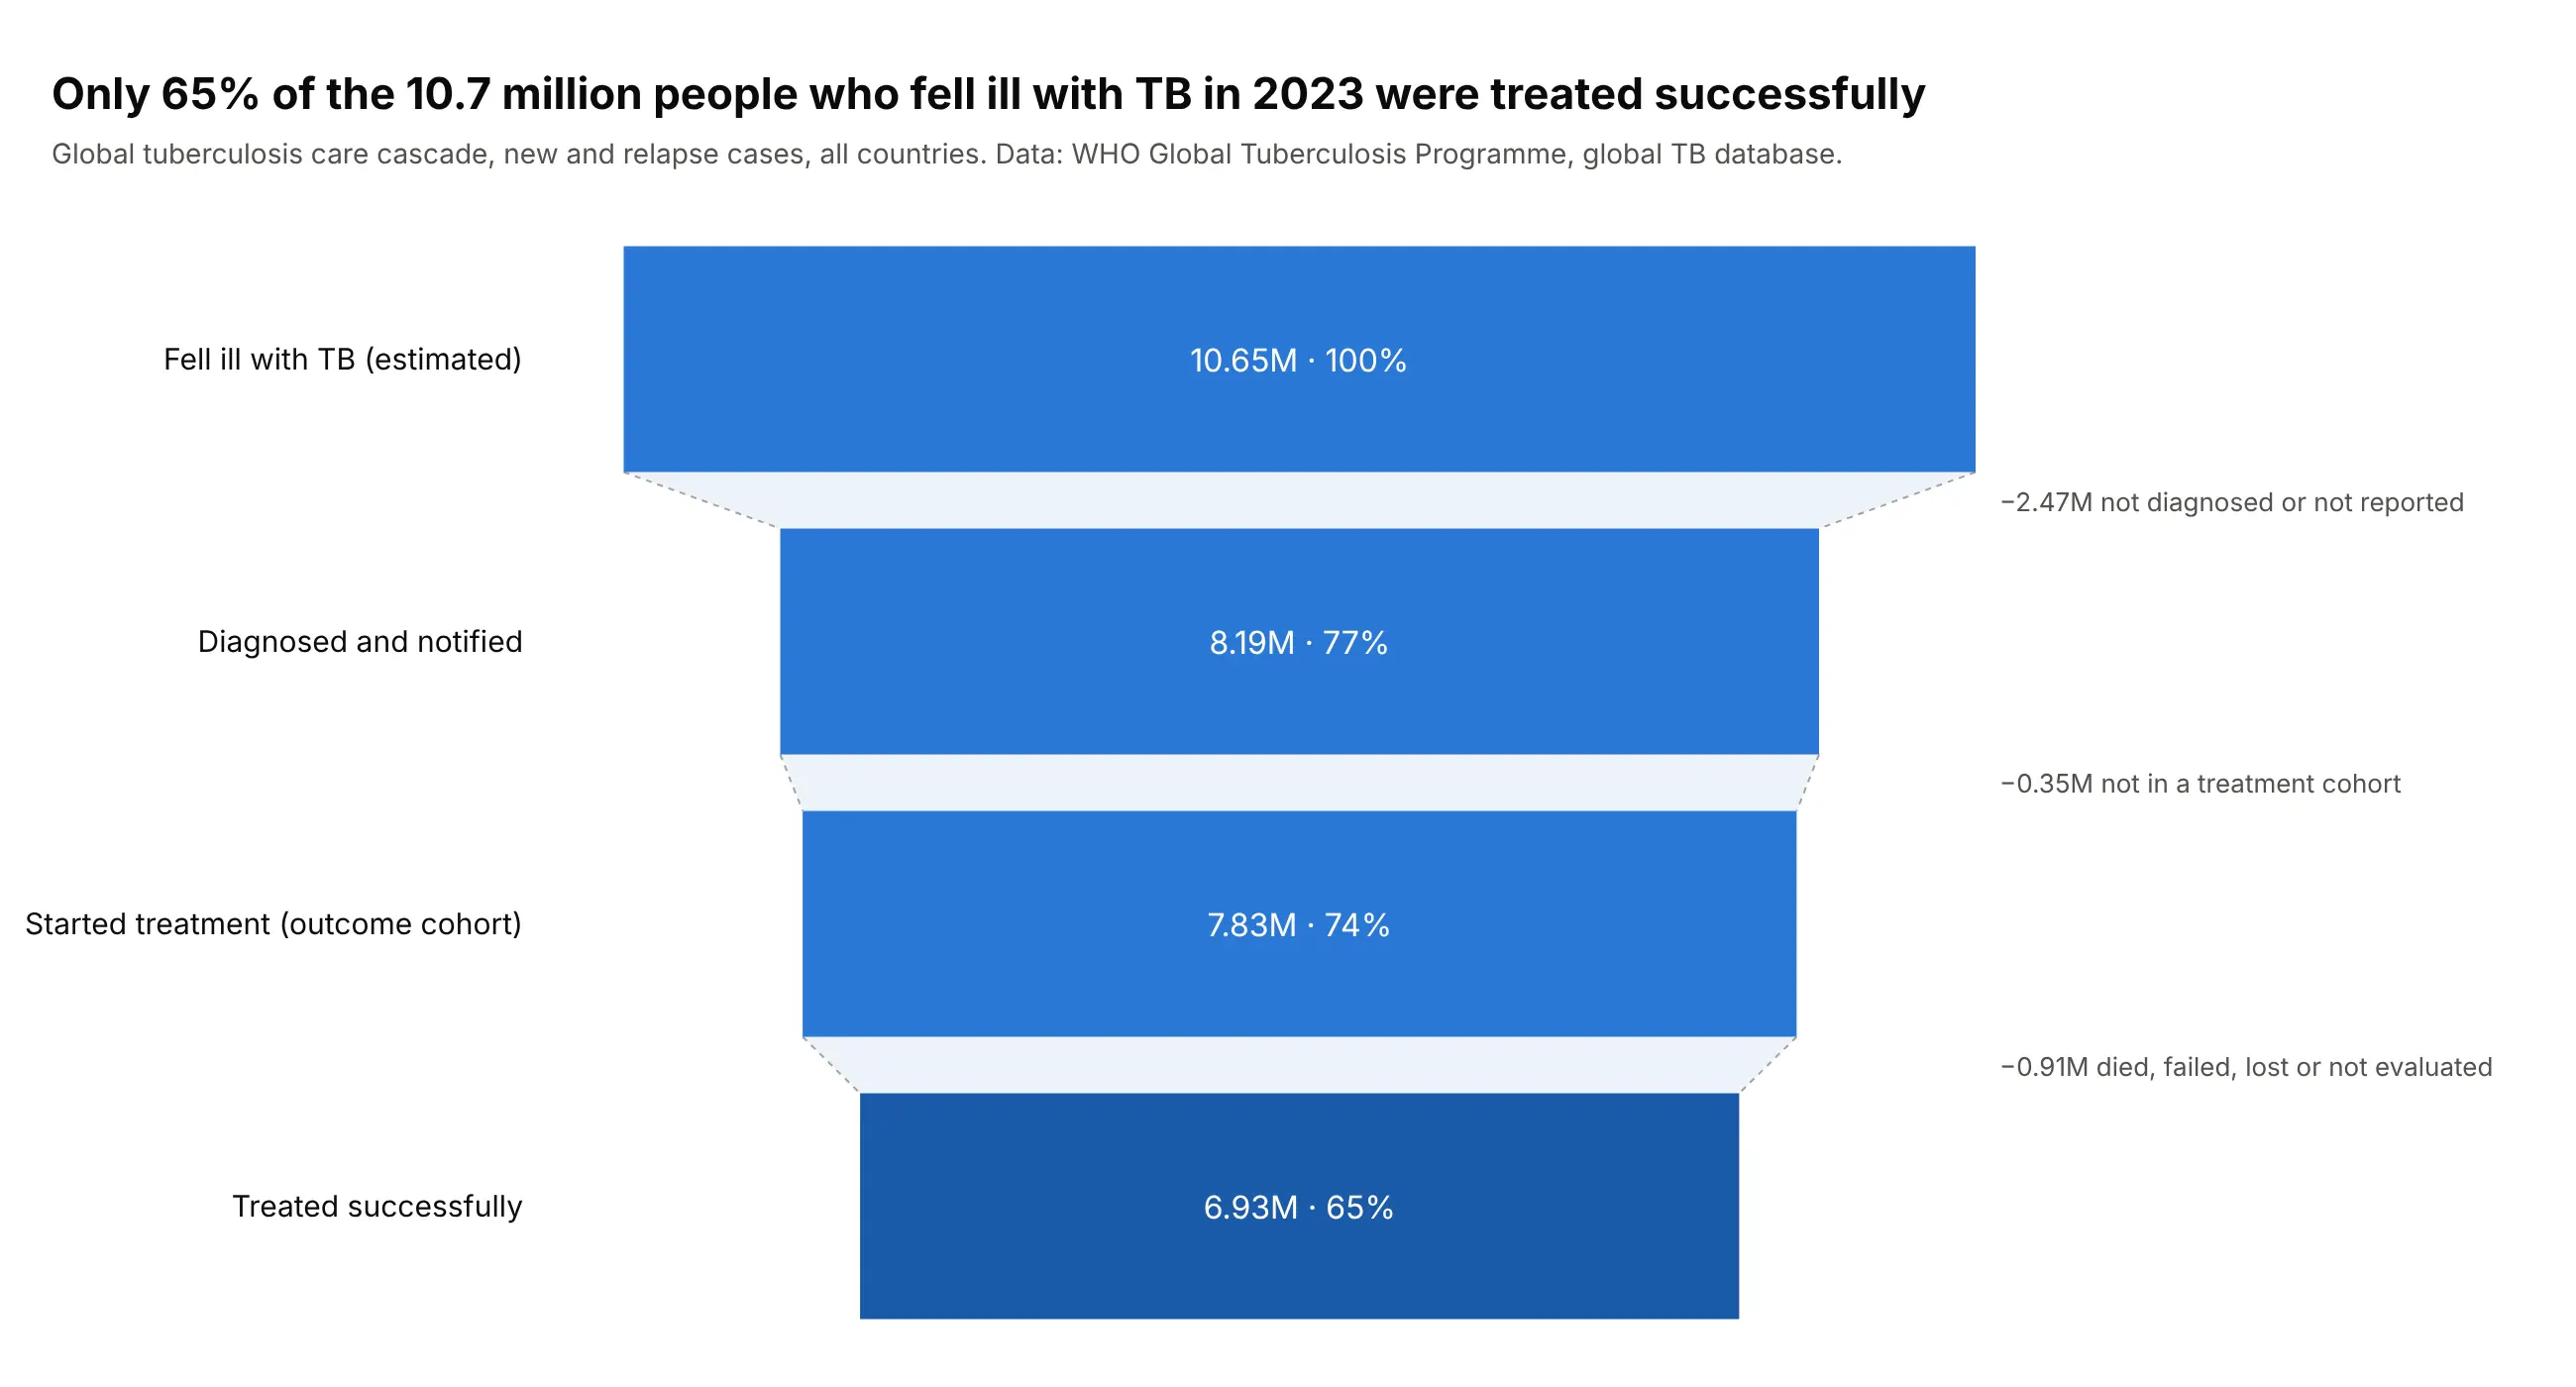
The care cascade is public health's funnel. Of 10.65 million people estimated to have fallen ill with tuberculosis in 2023, 2.47 million were never diagnosed or reported, and 6.93 million (65%) were treated successfully. Data: WHO Global Tuberculosis Programme, global TB database.
Tip: annotate each connector with what was lost, so the gaps carry numbers as well as the bars.
Get the data from the WHO global tuberculosis database (CSV downloads of estimates, notificationsand treatment outcomes, year 2023) and shape it into a table(columns: country, iso3, region, est_incident, notified, cohort, success).Build a plotly funnel of the global totals.- Stages: fell ill (estimated), diagnosed and notified, started treatment, treated successfully.- Text: value in millions and percent of the first stage; the last bar a darker blue.- Dashed connector outline, and an annotation per gap naming the people lost.
Another way to see it: a dot plot by WHO region shows Europe and the Americas notify most cases but treat them successfully least often.
4. Only a third of the 290 GW of planned US power plants are under construction
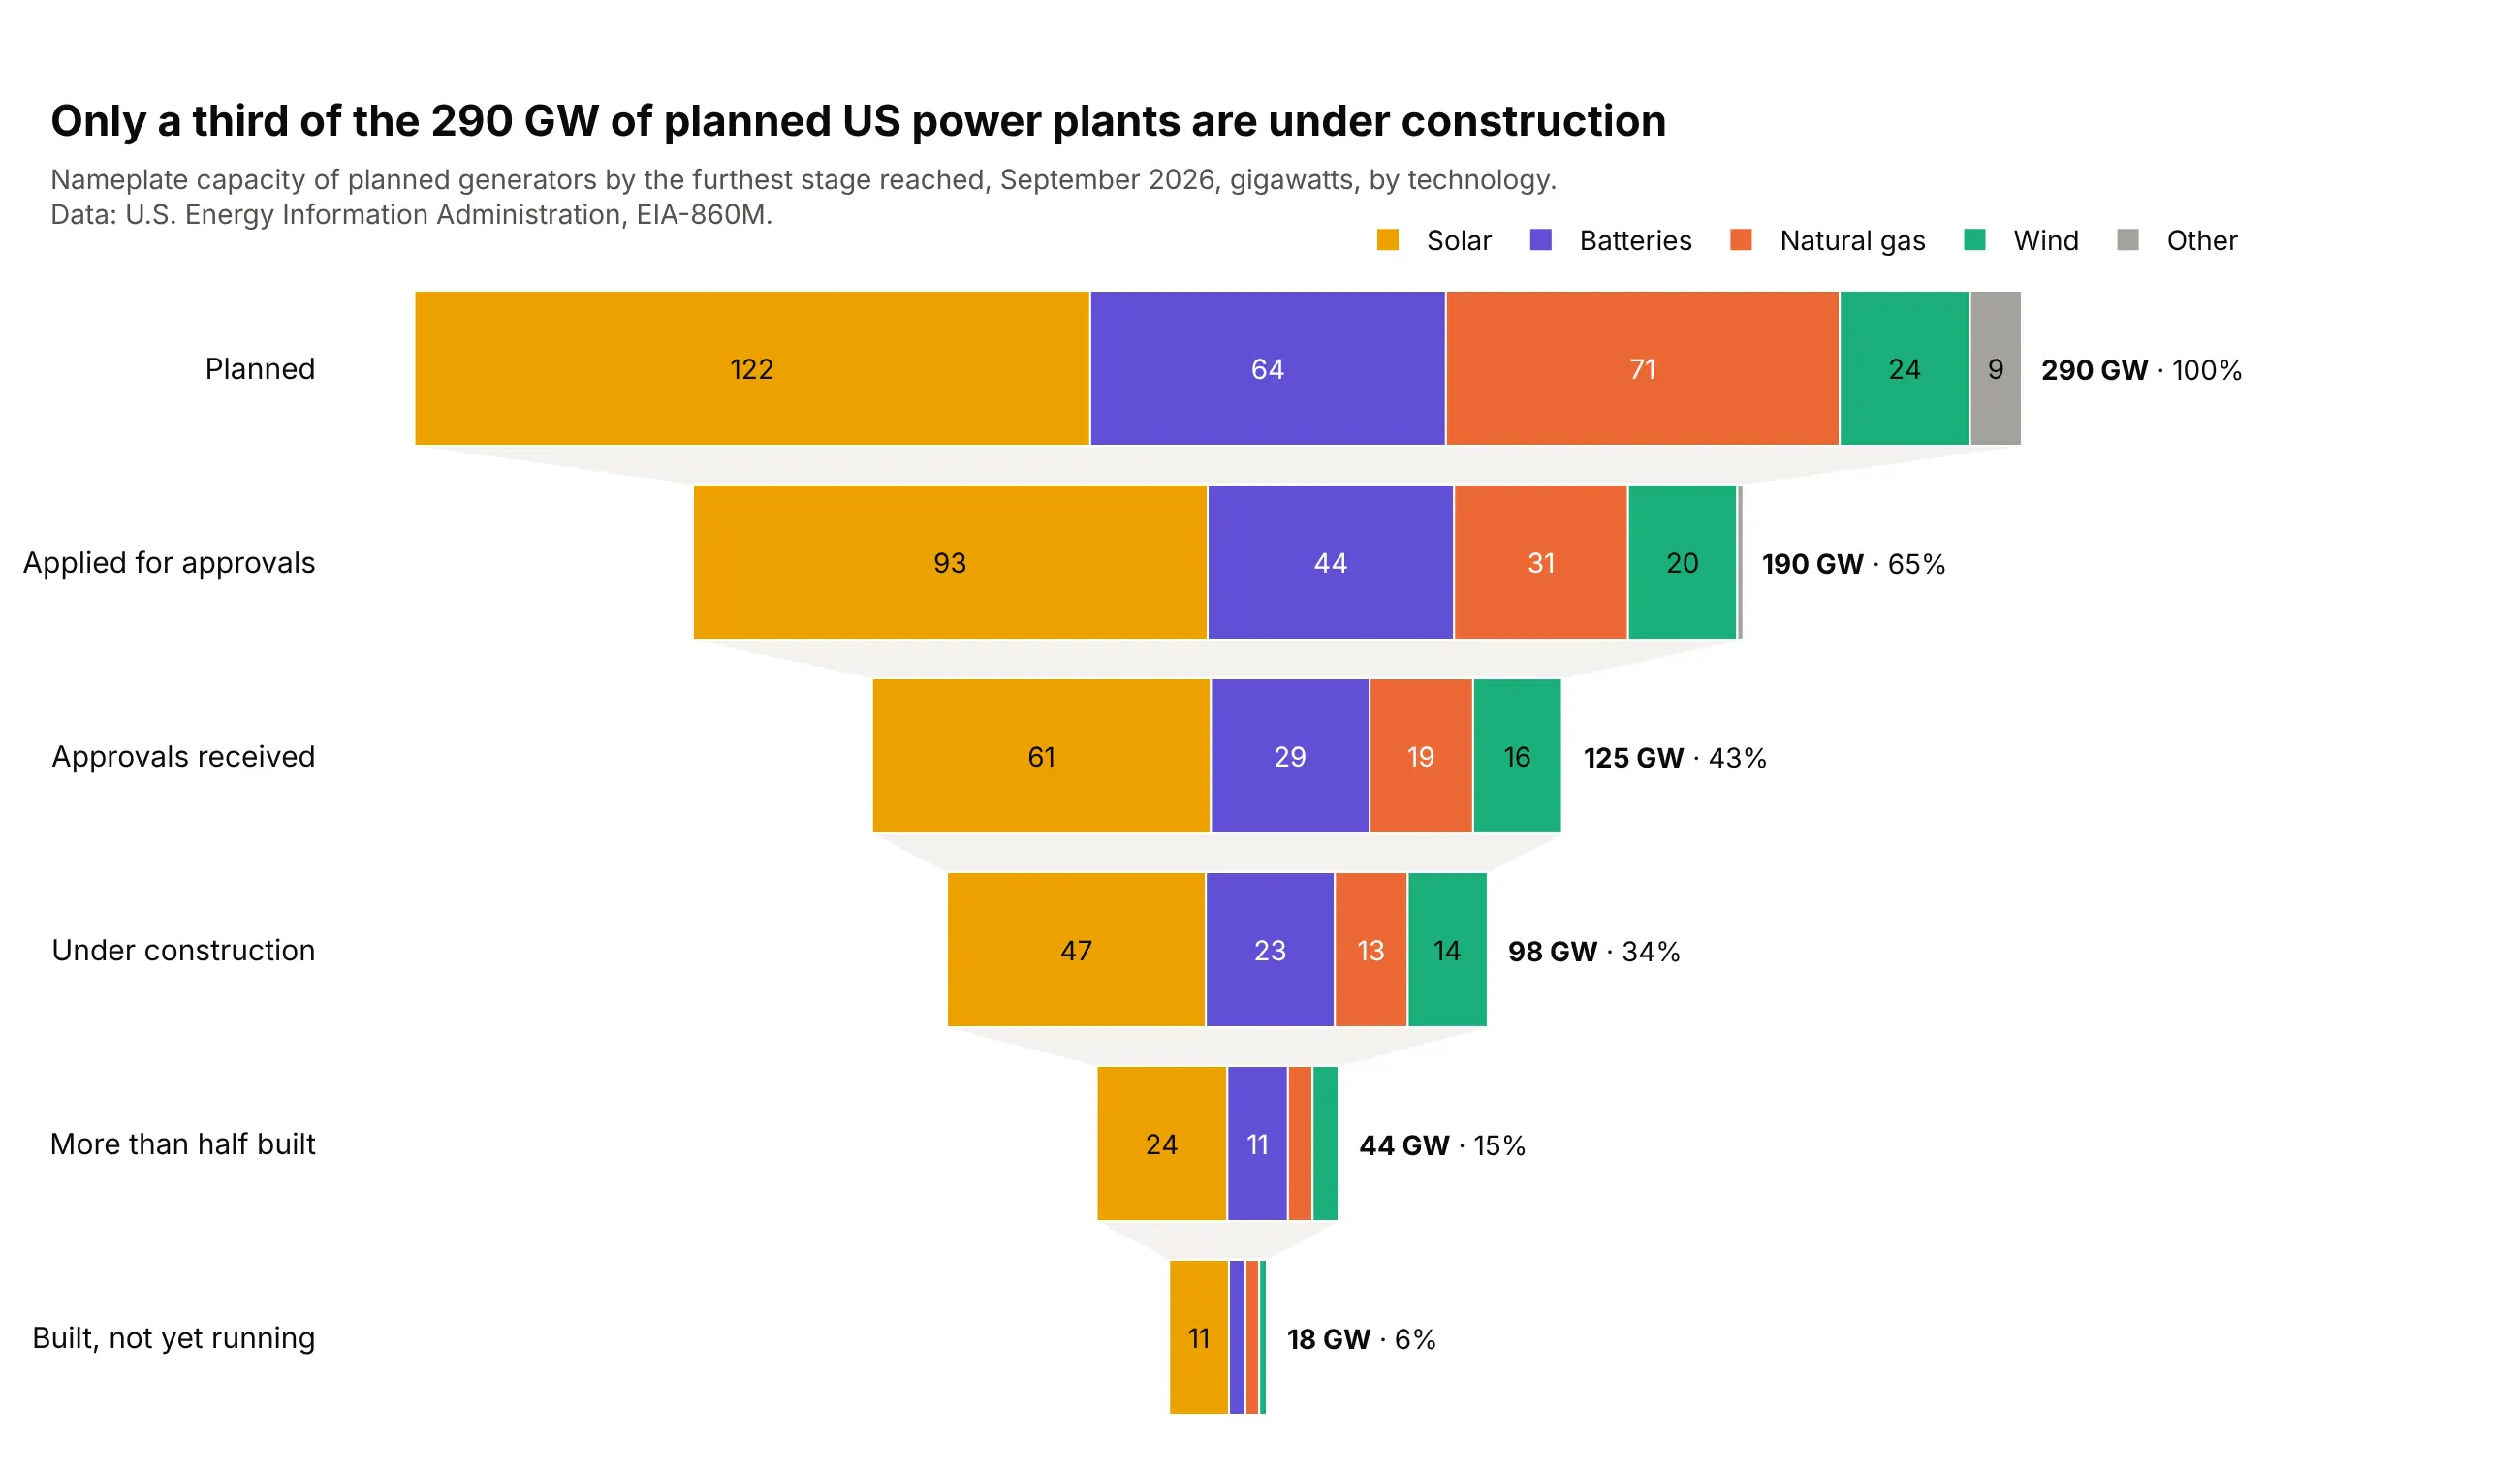
EIA lists 290 GW of planned US generators, but only 98 GW (34%) are under construction. Natural gas makes up 71 GW of the plans and 13 GW of the construction, a wider gap than solar's 122 and 47. Data: U.S. Energy Information Administration, EIA-860M, September 2026.
Tip: turn mutually exclusive statuses into cumulative stages ("reached at least this stage") before you draw them.
Get the data from the EIA's Preliminary Monthly Electric Generator Inventory (EIA-860M,September 2026, sheet "Planned") and shape it into a table(columns: technology, status_code, generators, mw).Build a plotly stacked funnel (one trace per technology: solar, batteries, natural gas, wind, other).- Cumulative stages from the status codes: P+L+T+U+V+TS planned, L.. applied, T.. approved,U.. under construction, V+TS more than half built, TS built.- GW inside segments (hide what doesn't fit with uniformtext), totals and percent at the right.
5. Refinance applications fell from 9.0 million in 2021 to 1.8 million in 2025
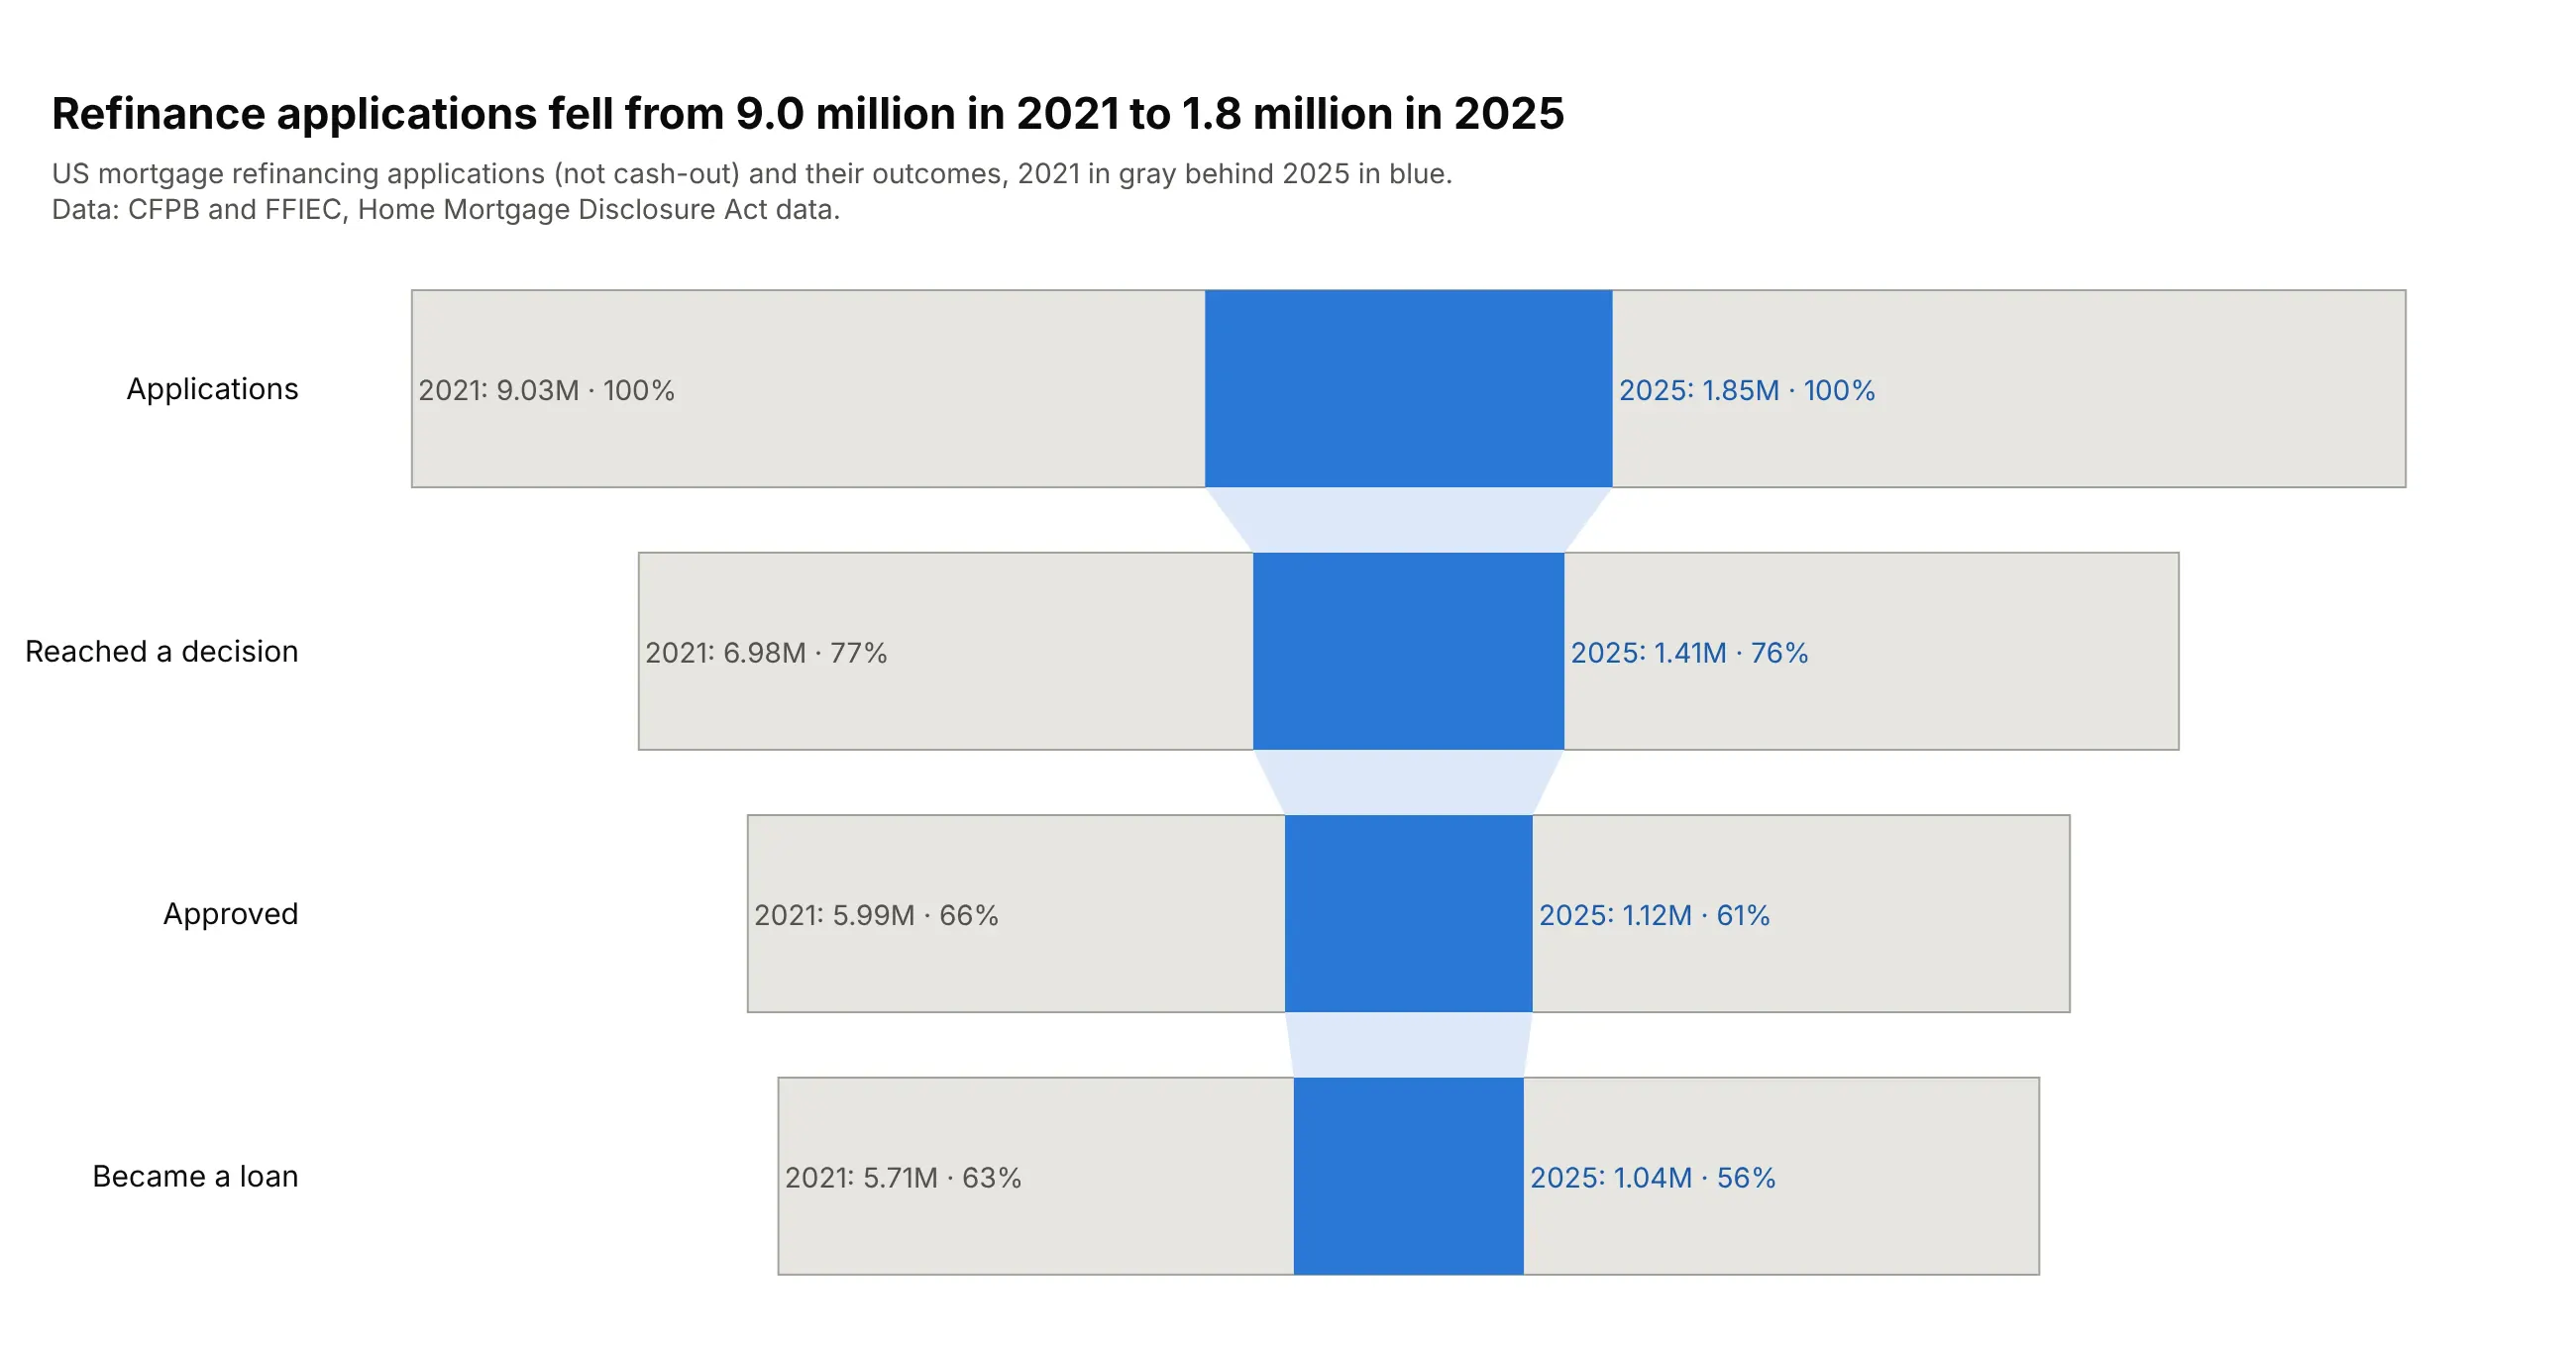
Refinance applications fell by 80% between 2021 and 2025. The shape barely changed, but 56% became loans in 2025, down from 63%. Data: CFPB and FFIEC, HMDA.
Tip: funnelmode="overlay" with the earlier year in light gray shows the shrink and the shape together.
Get the data from the CFPB's HMDA Data Browser API (nationwide aggregations by year, actiontaken 1-5 and loan purpose) and shape it into a table(columns: year, loan_purpose, action_taken, applications).Build a plotly funnel with funnelmode="overlay" for refinance loans (purpose 31), 2021 and 2025.- Same four stages as applications -> decision -> approved -> loan.- 2021 light gray with a gray outline and text at the left; 2025 blue with text outside.
6. Credit card complaints to the CFPB ended in money back 13 times in 100
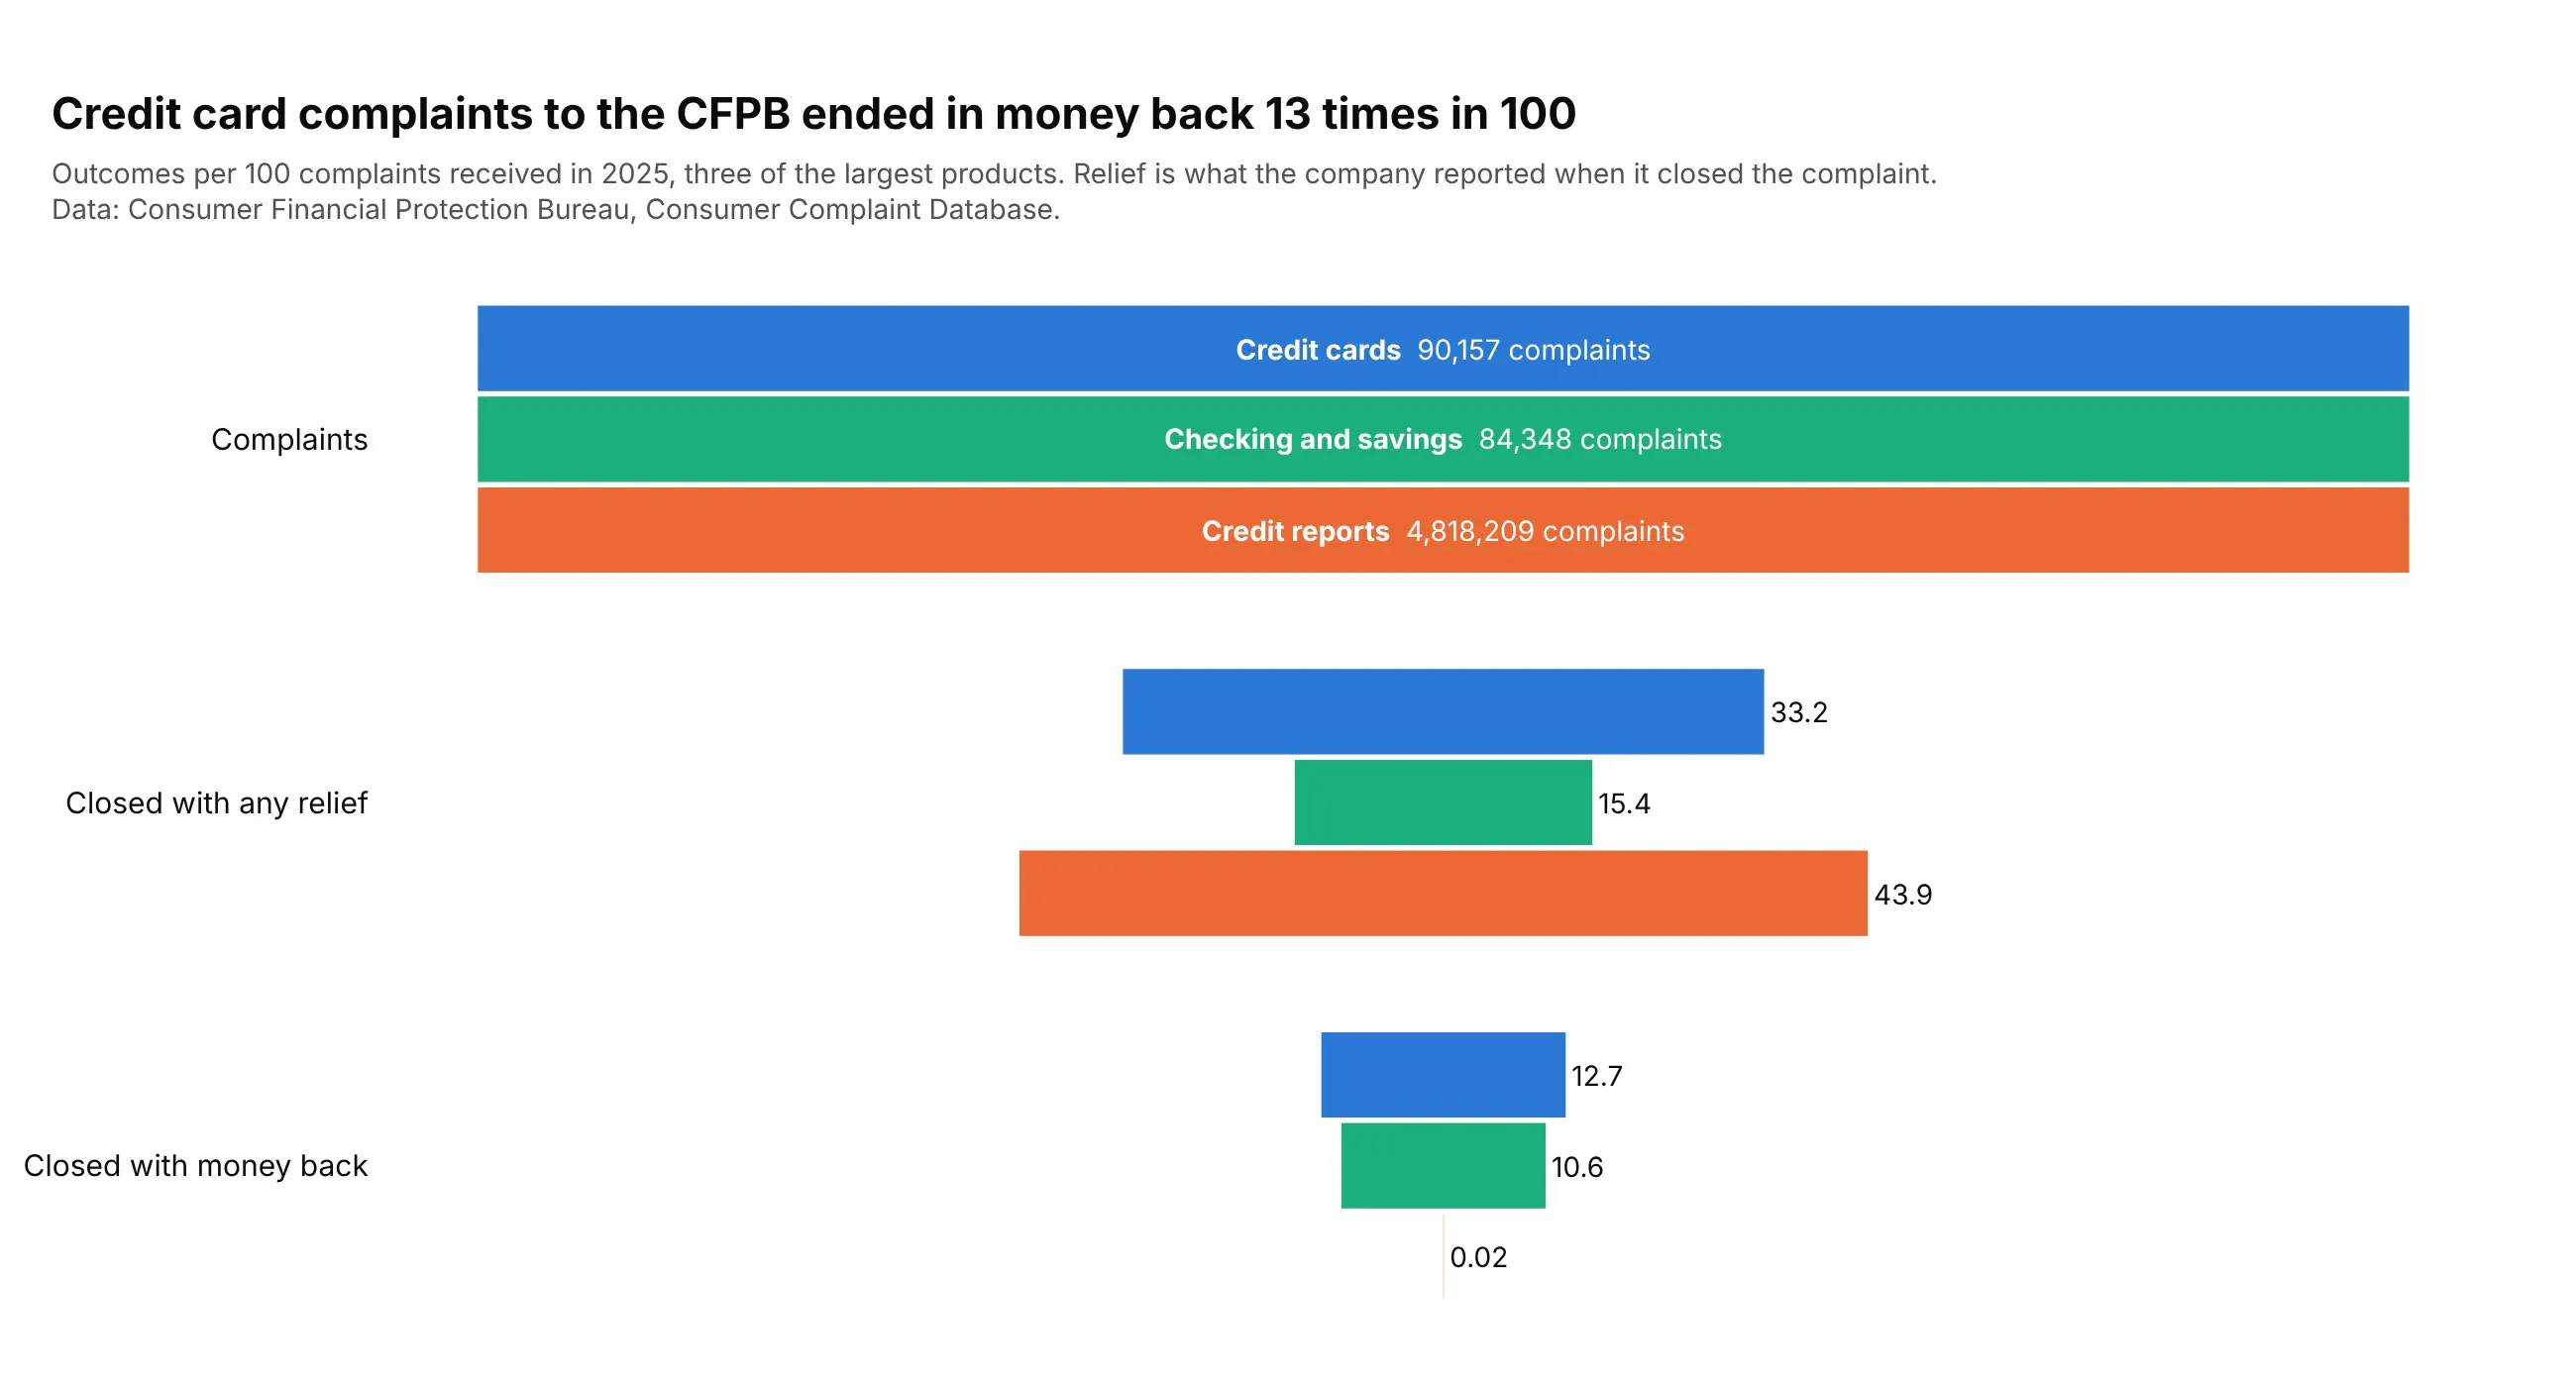
Per 100 complaints in 2025, credit card companies gave money back 12.7 times. Credit reporting complaints, 4.8 million of them, often closed with non-monetary relief (43.9 in 100) but almost never with money (0.02). Data: CFPB Consumer Complaint Database.
Tip: normalize each group to 100 so funnels of 90,000 and 4.8 million share one scale, and keep the raw counts in the hover.
Get the data from the CFPB Consumer Complaint Database search API (complaints received in 2025,counts by product and company response) and shape it into a table(columns: product, complaints, explanation, non_monetary_relief, monetary_relief, untimely, in_progress).Build a plotly grouped funnel per 100 complaints for credit cards, checking or savings and credit reporting.- Stages: complaints, closed with any relief, closed with monetary relief.- Product names and complaint counts in the first bars; raw counts in customdata for the hover.
7. About a third of the businesses opened in 2015 were open ten years later
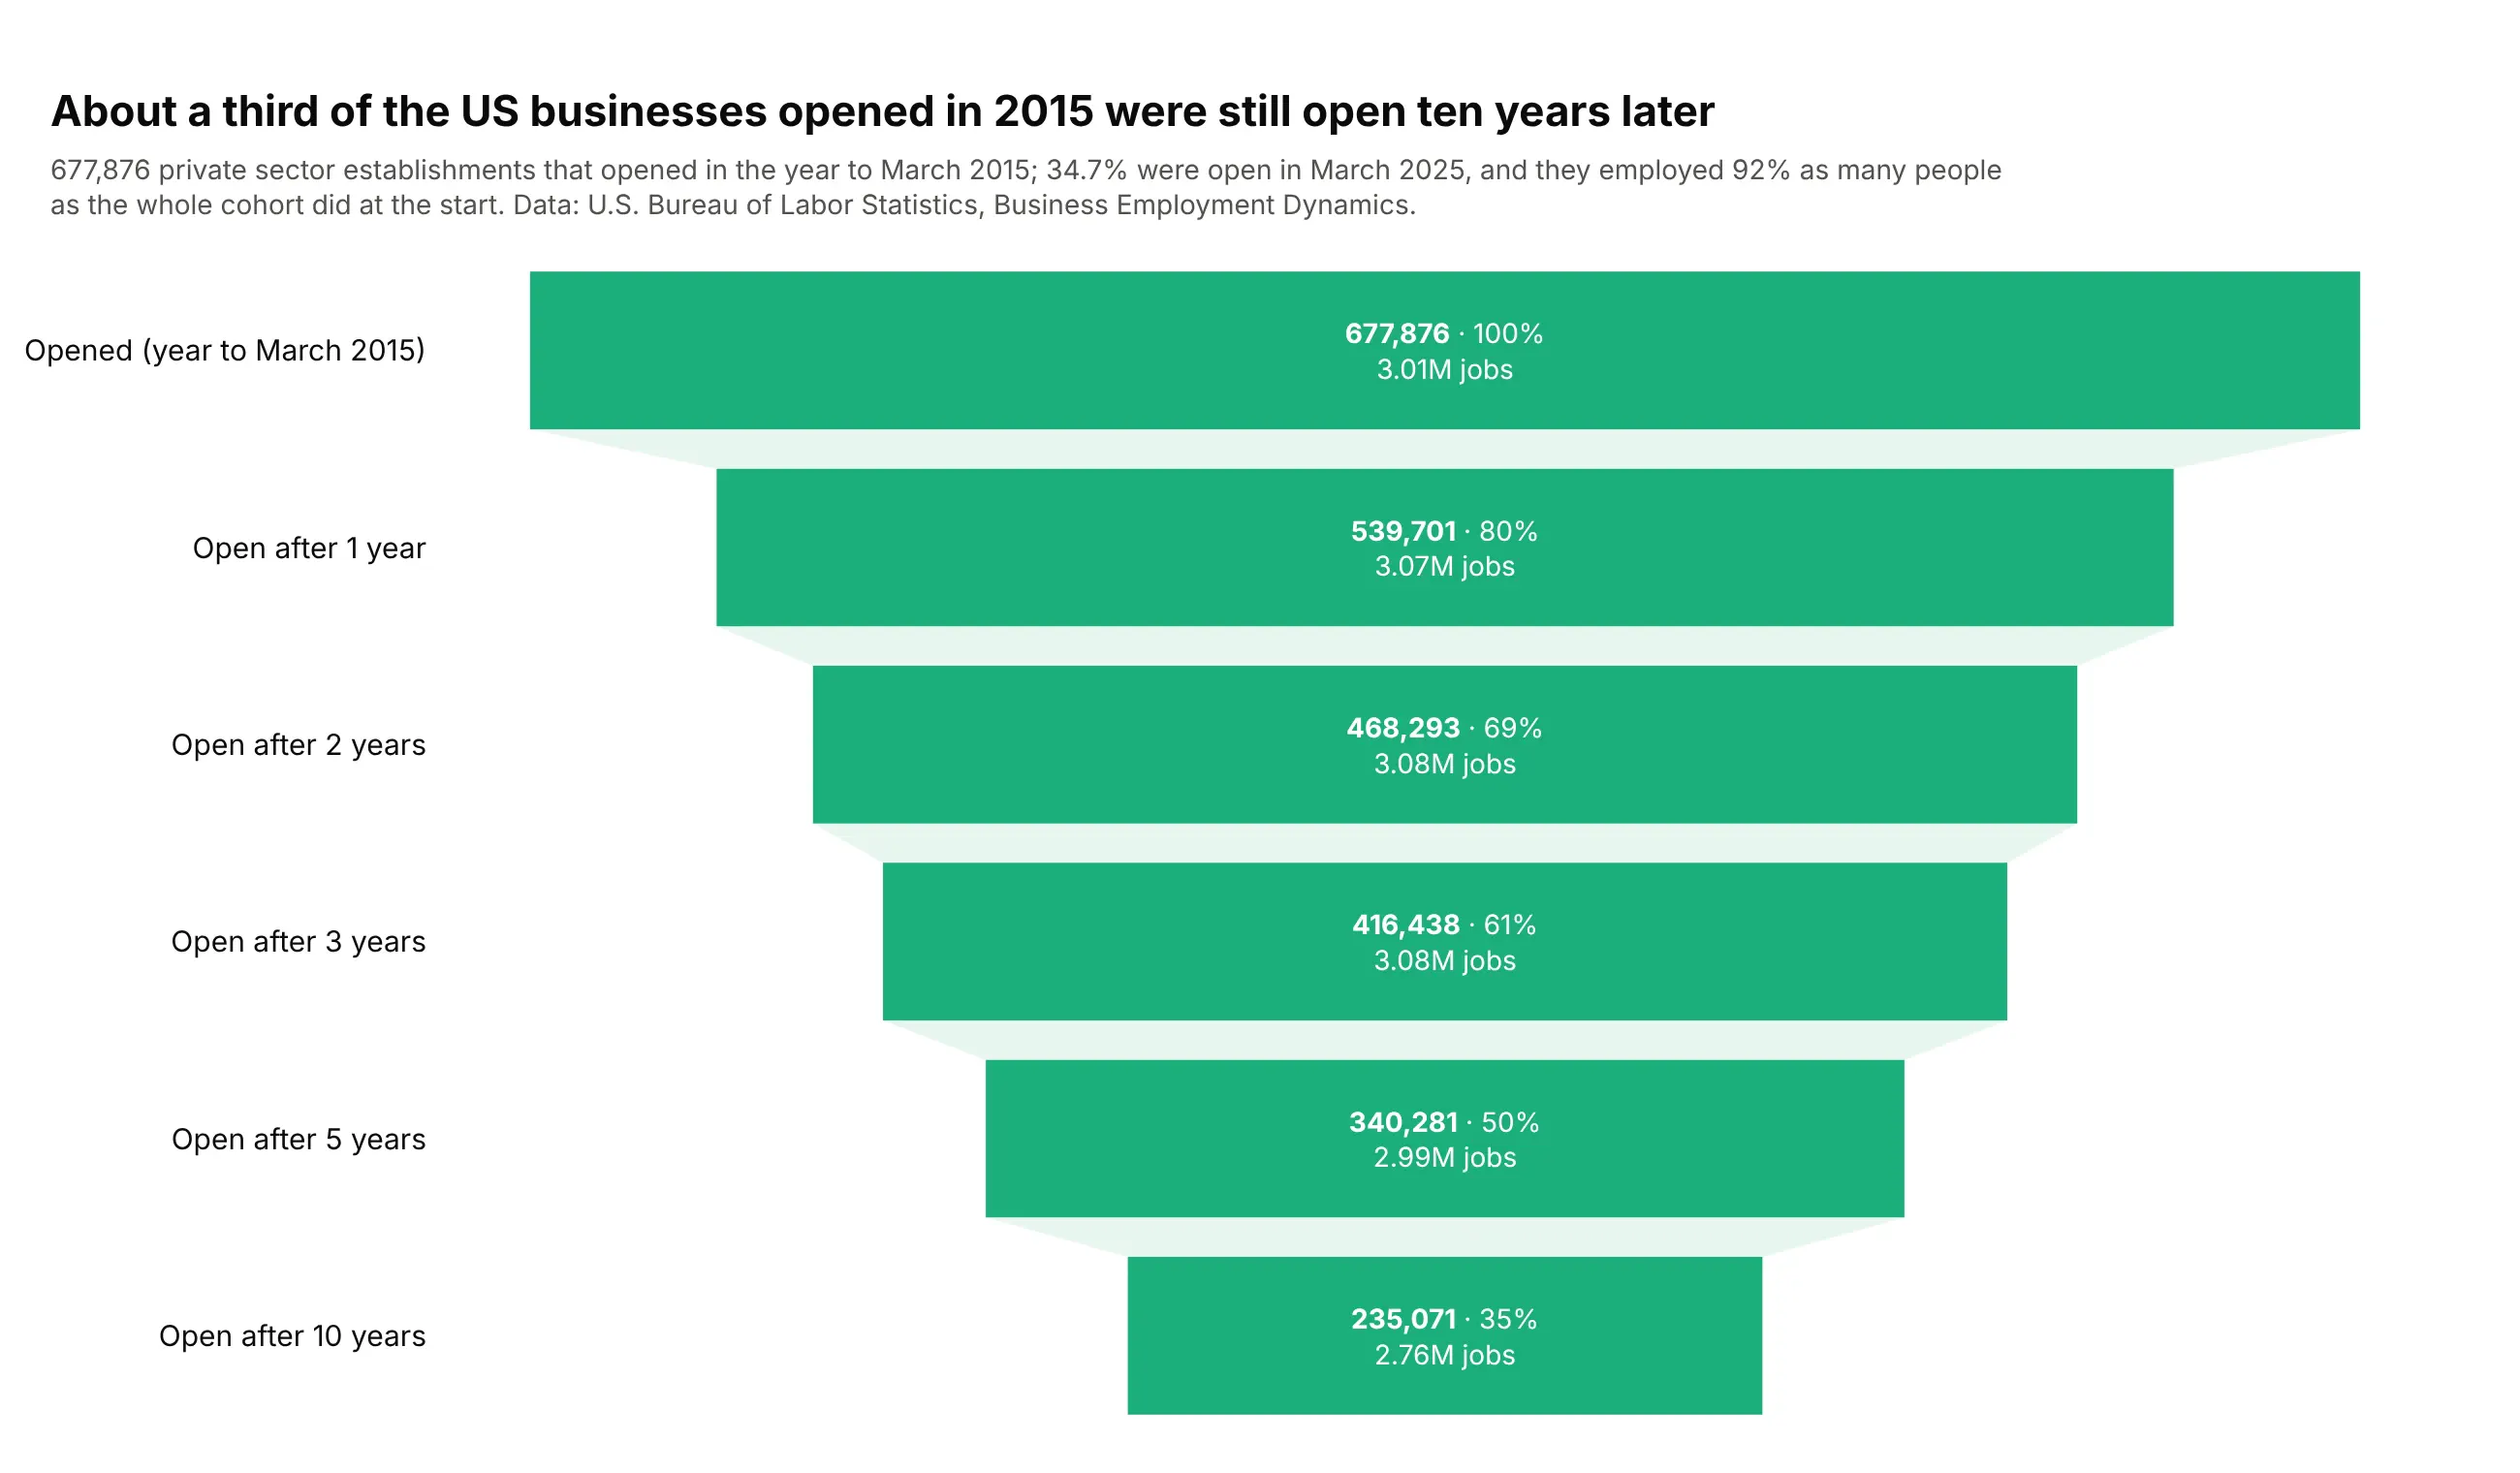
Of 677,876 US establishments that opened in the year to March 2015, 34.7% were open in 2025. The survivors grew, so they employed 92% as many people as the whole cohort did when it opened. Data: U.S. Bureau of Labor Statistics, Business Employment Dynamics.
Tip: put a second measure (jobs) in customdata and print it under each value in texttemplate.
Get the data from the BLS Business Employment Dynamics "Table 7. Survival of private sectorestablishments by opening year" (us_age_naics_00_table7.txt) and shape it into a table(columns: cohort, year, age, surviving, employment, survival_rate).Build a plotly funnel for the 2015 cohort at ages 0, 1, 2, 3, 5 and 10.- texttemplate: bold count, %{percentInitial}, and jobs in millions from customdata.- One green, light green connector; subtitle with the employment comparison.
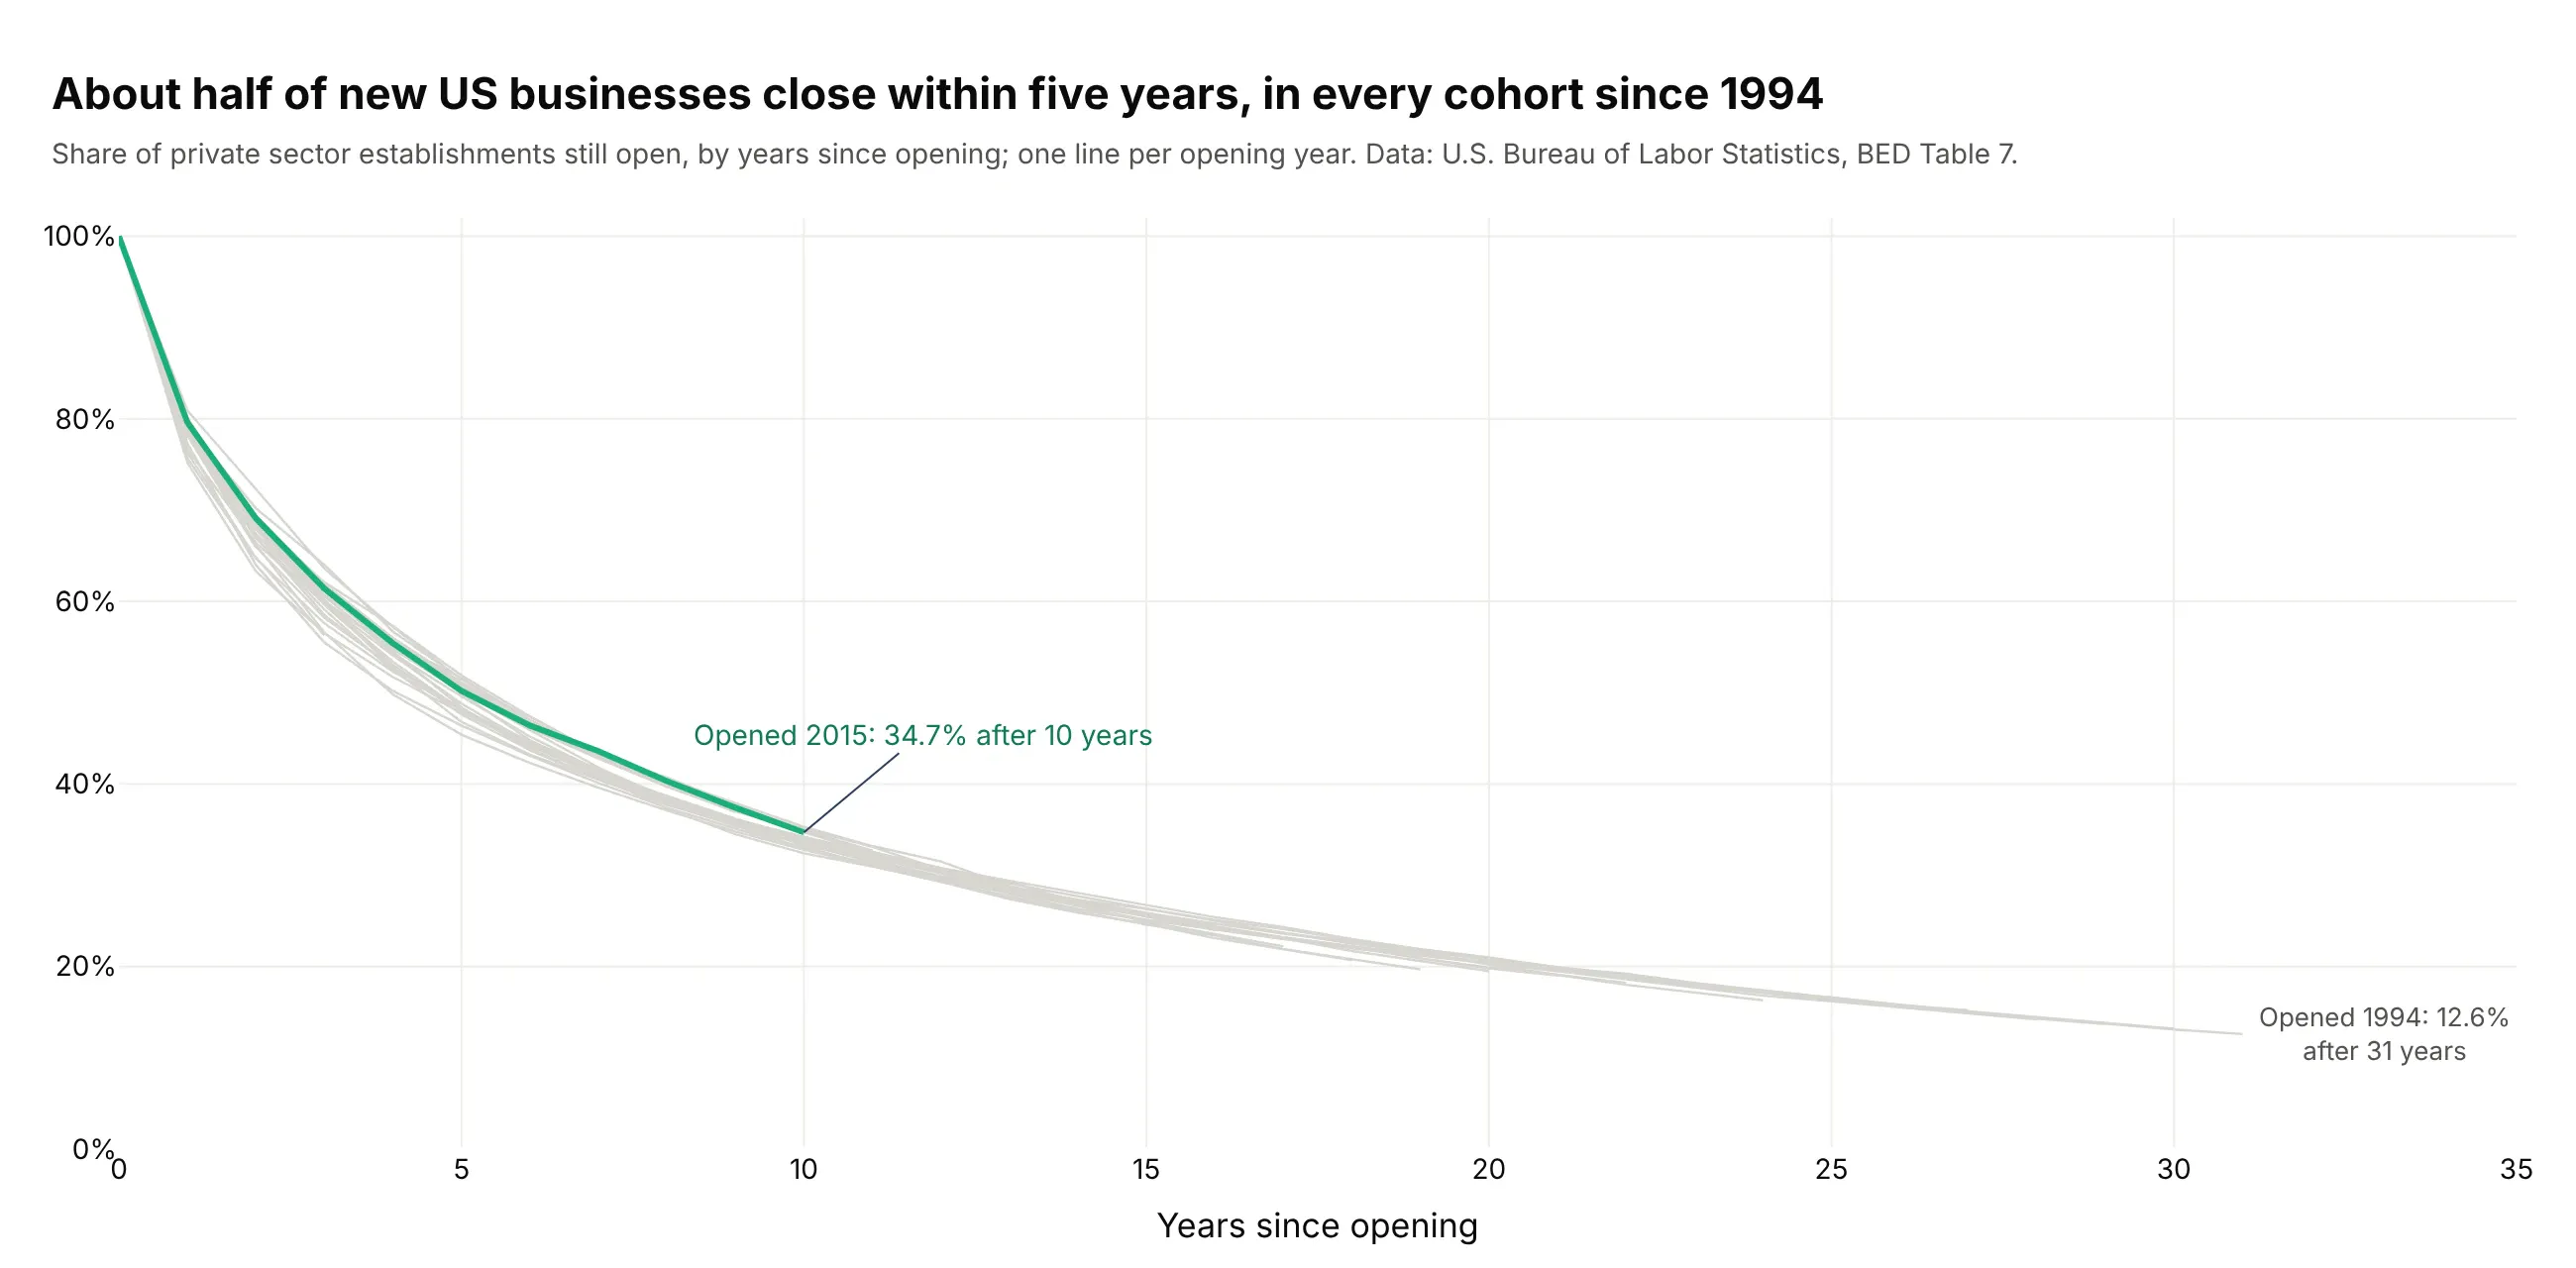
Another way to see it: a line per cohort shows the 2015 curve is typical, since 45% to 52% of every cohort since 1994 survived five years.
8. Harvard admits 3.5% of applicants, and 84% of them enroll
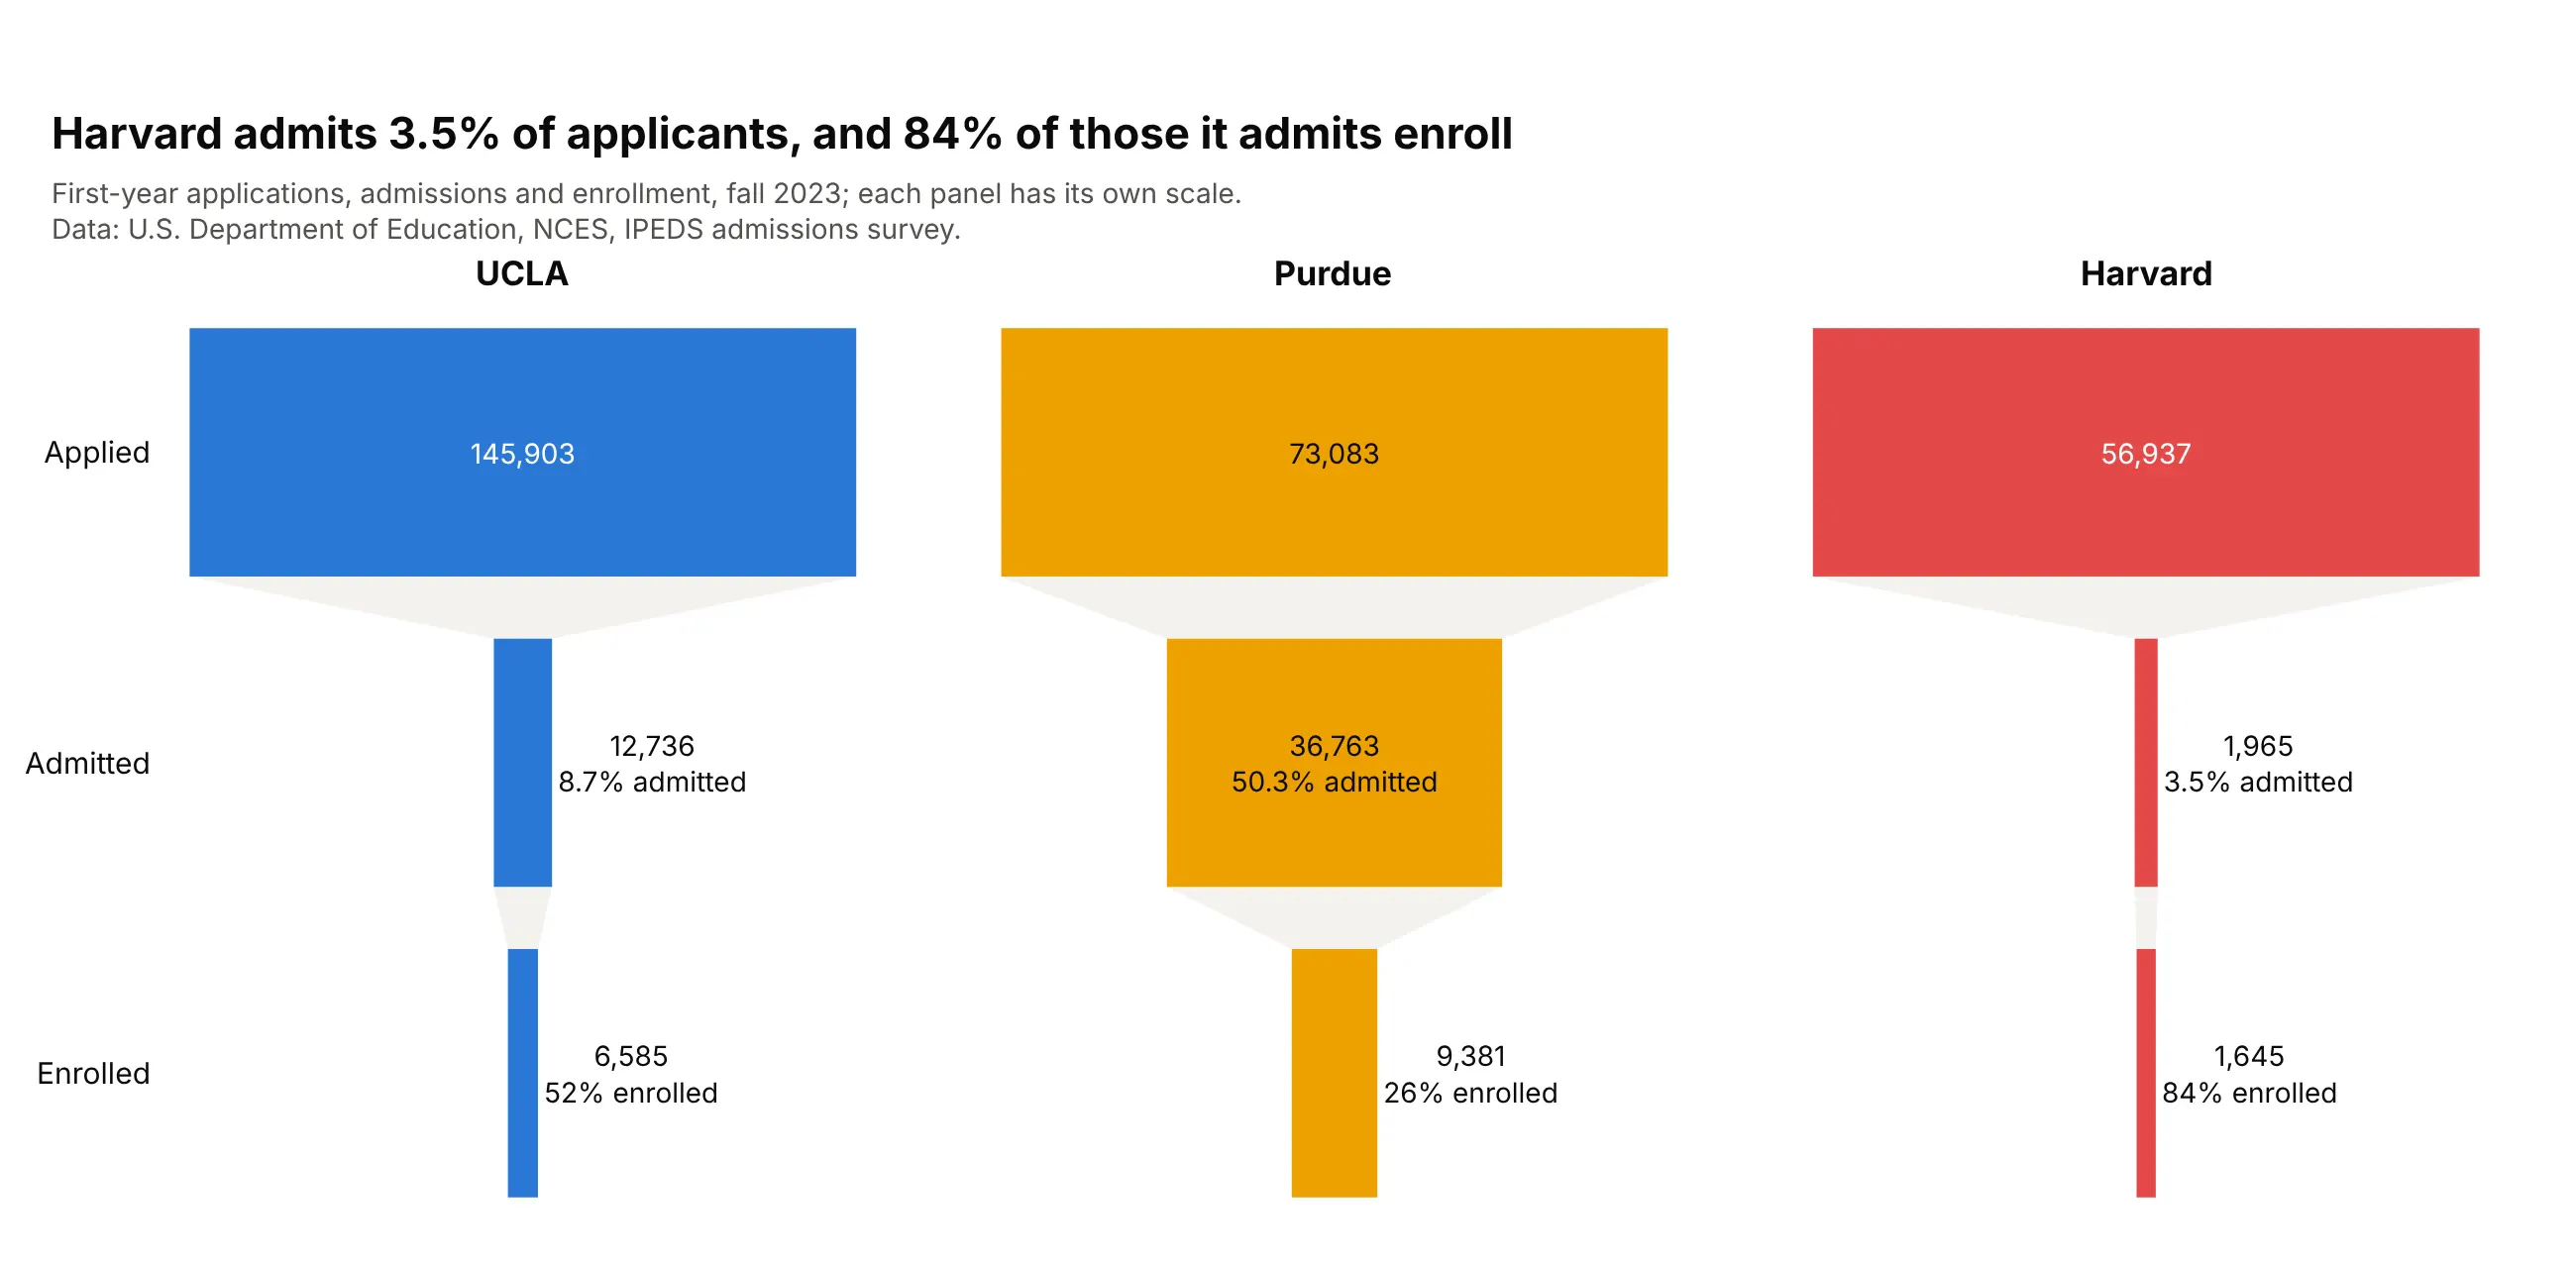
Admit rate and yield shape a college's funnel. Harvard admitted 3.5% of 56,937 applicants and 84% enrolled, while Purdue admitted half but only 26% of admits came. Data: NCES IPEDS admissions survey, fall 2023.
Tip: small multiples with make_subplots give each funnel its own scale, so UCLA's 146,000 applications don't flatten Harvard's.
Get the data from NCES IPEDS (complete data files ADM2023 and HD2023 for names) and shape itinto a table (columns: unitid, institution, state, control, applicants, admitted, enrolled).Build three plotly funnels side by side with make_subplots (UCLA, Purdue Main Campus, Harvard).- Stages: applied, admitted, enrolled. Text: count plus admit rate and yield.- Shared y axis, one color per college, text outside small bars.
9. Of 4,079 NFL draft picks in 2000-2015, 19 are in the Hall of Fame
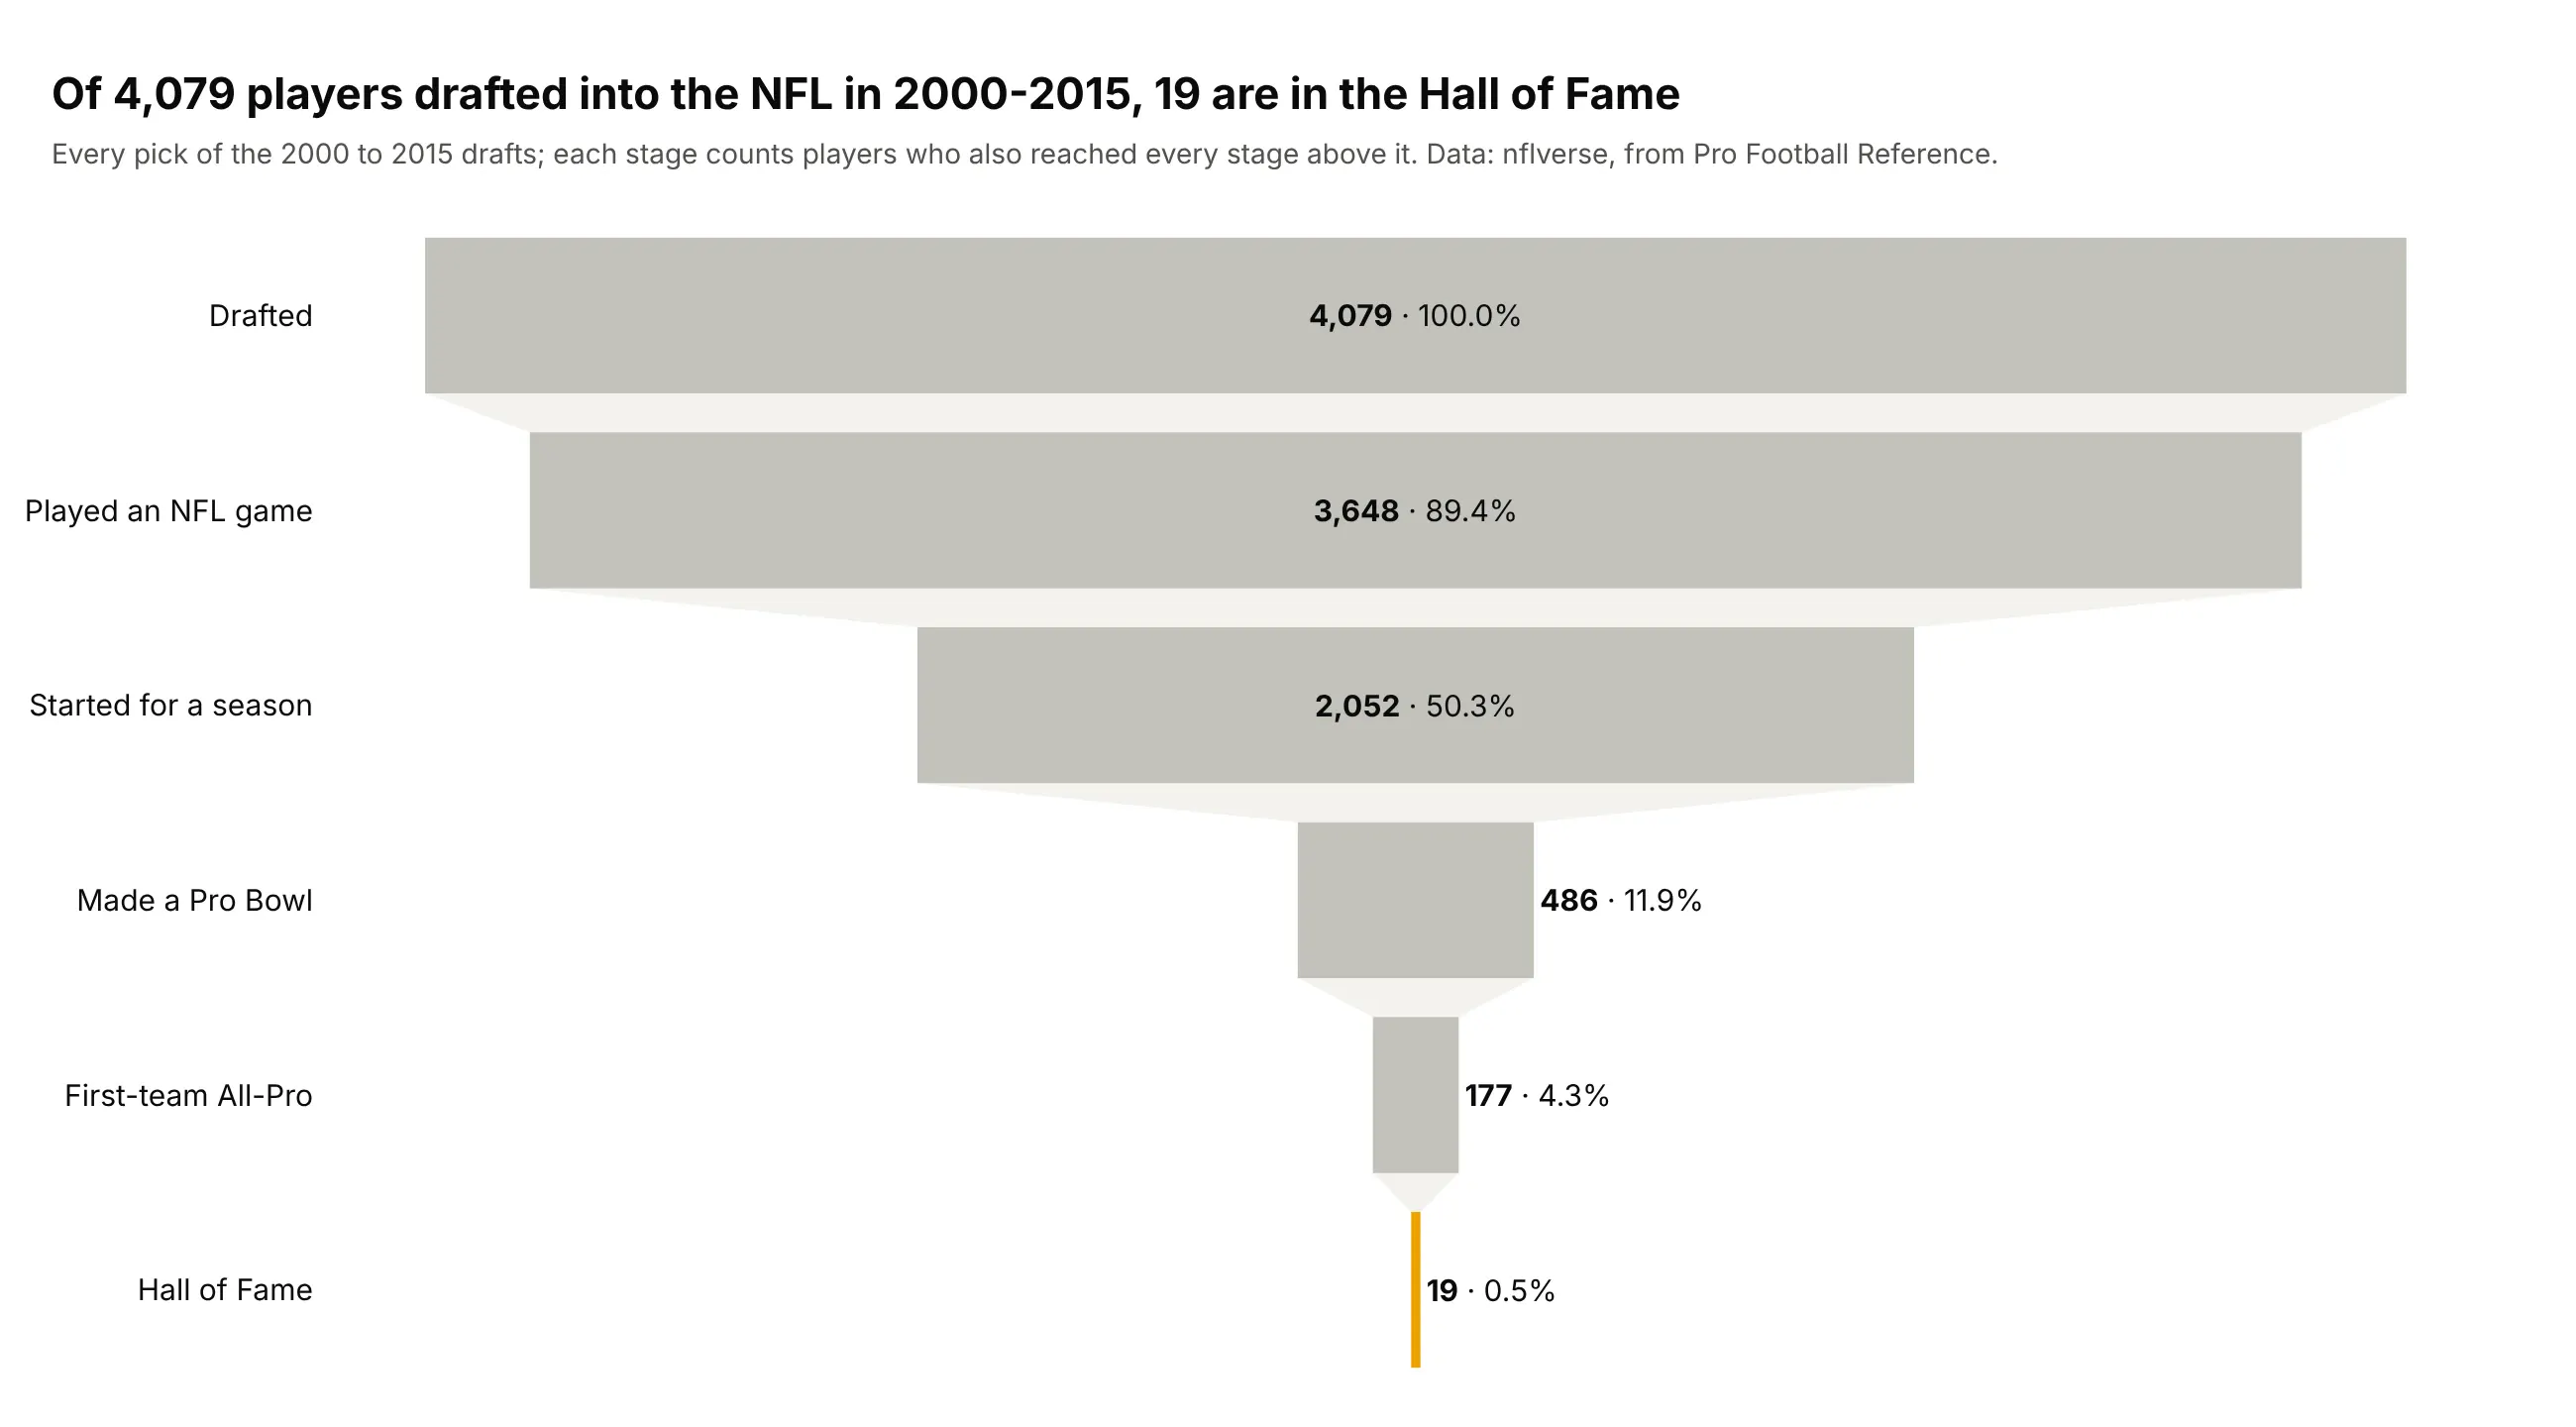
Half of the 4,079 players drafted in 2000-2015 started for at least one season, 486 made a Pro Bowl, and 19 are in the Hall of Fame (0.5%). Data: nflverse, from Pro Football Reference.
Tip: make every bar gray except the one the title is about.
Get the data from nflverse's draft_picks release (career stats from Pro Football Reference)and shape it into a table(columns: season, round, pick, player, position, games, seasons_started, probowls, allpro, hof).Build a plotly funnel of the 2000-2015 drafts.- Nested stages: drafted, played a game, started a season, Pro Bowl, All-Pro, Hall of Fame.- Gray bars, the Hall of Fame bar gold; value and percent initial, outside for small bars.
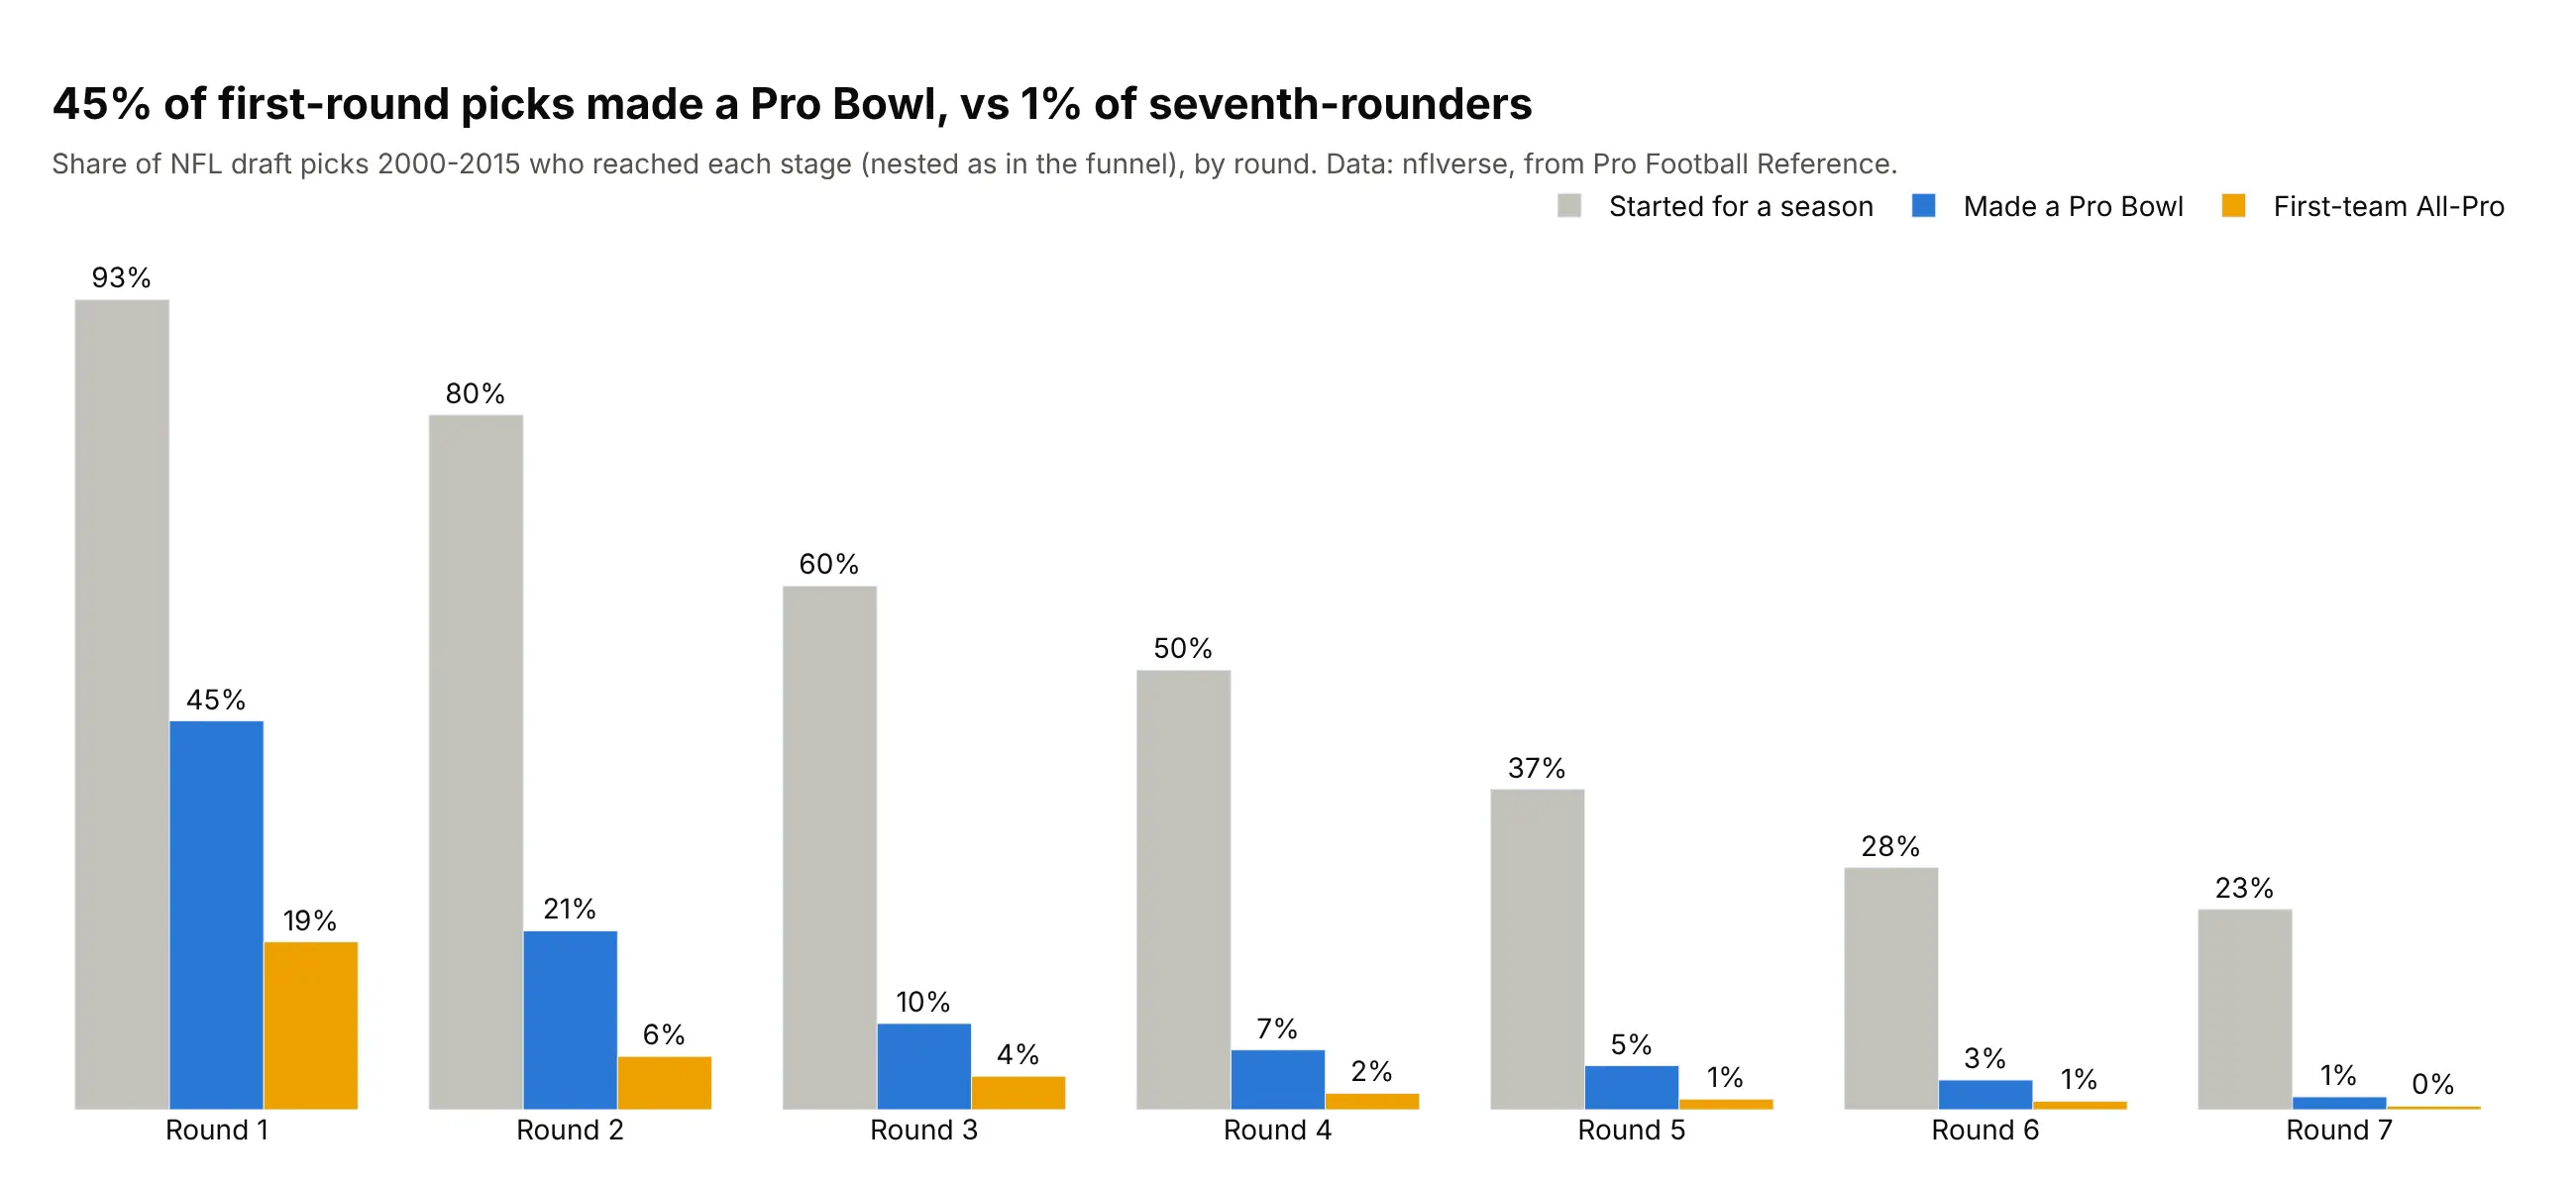
Another way to see it: a grouped bar chart by round shows 45% of first-round picks made a Pro Bowl, against 1.5% of seventh-rounders.
10. Of 38,492 vulnerabilities from 2024, 150 are severe and known to be exploited
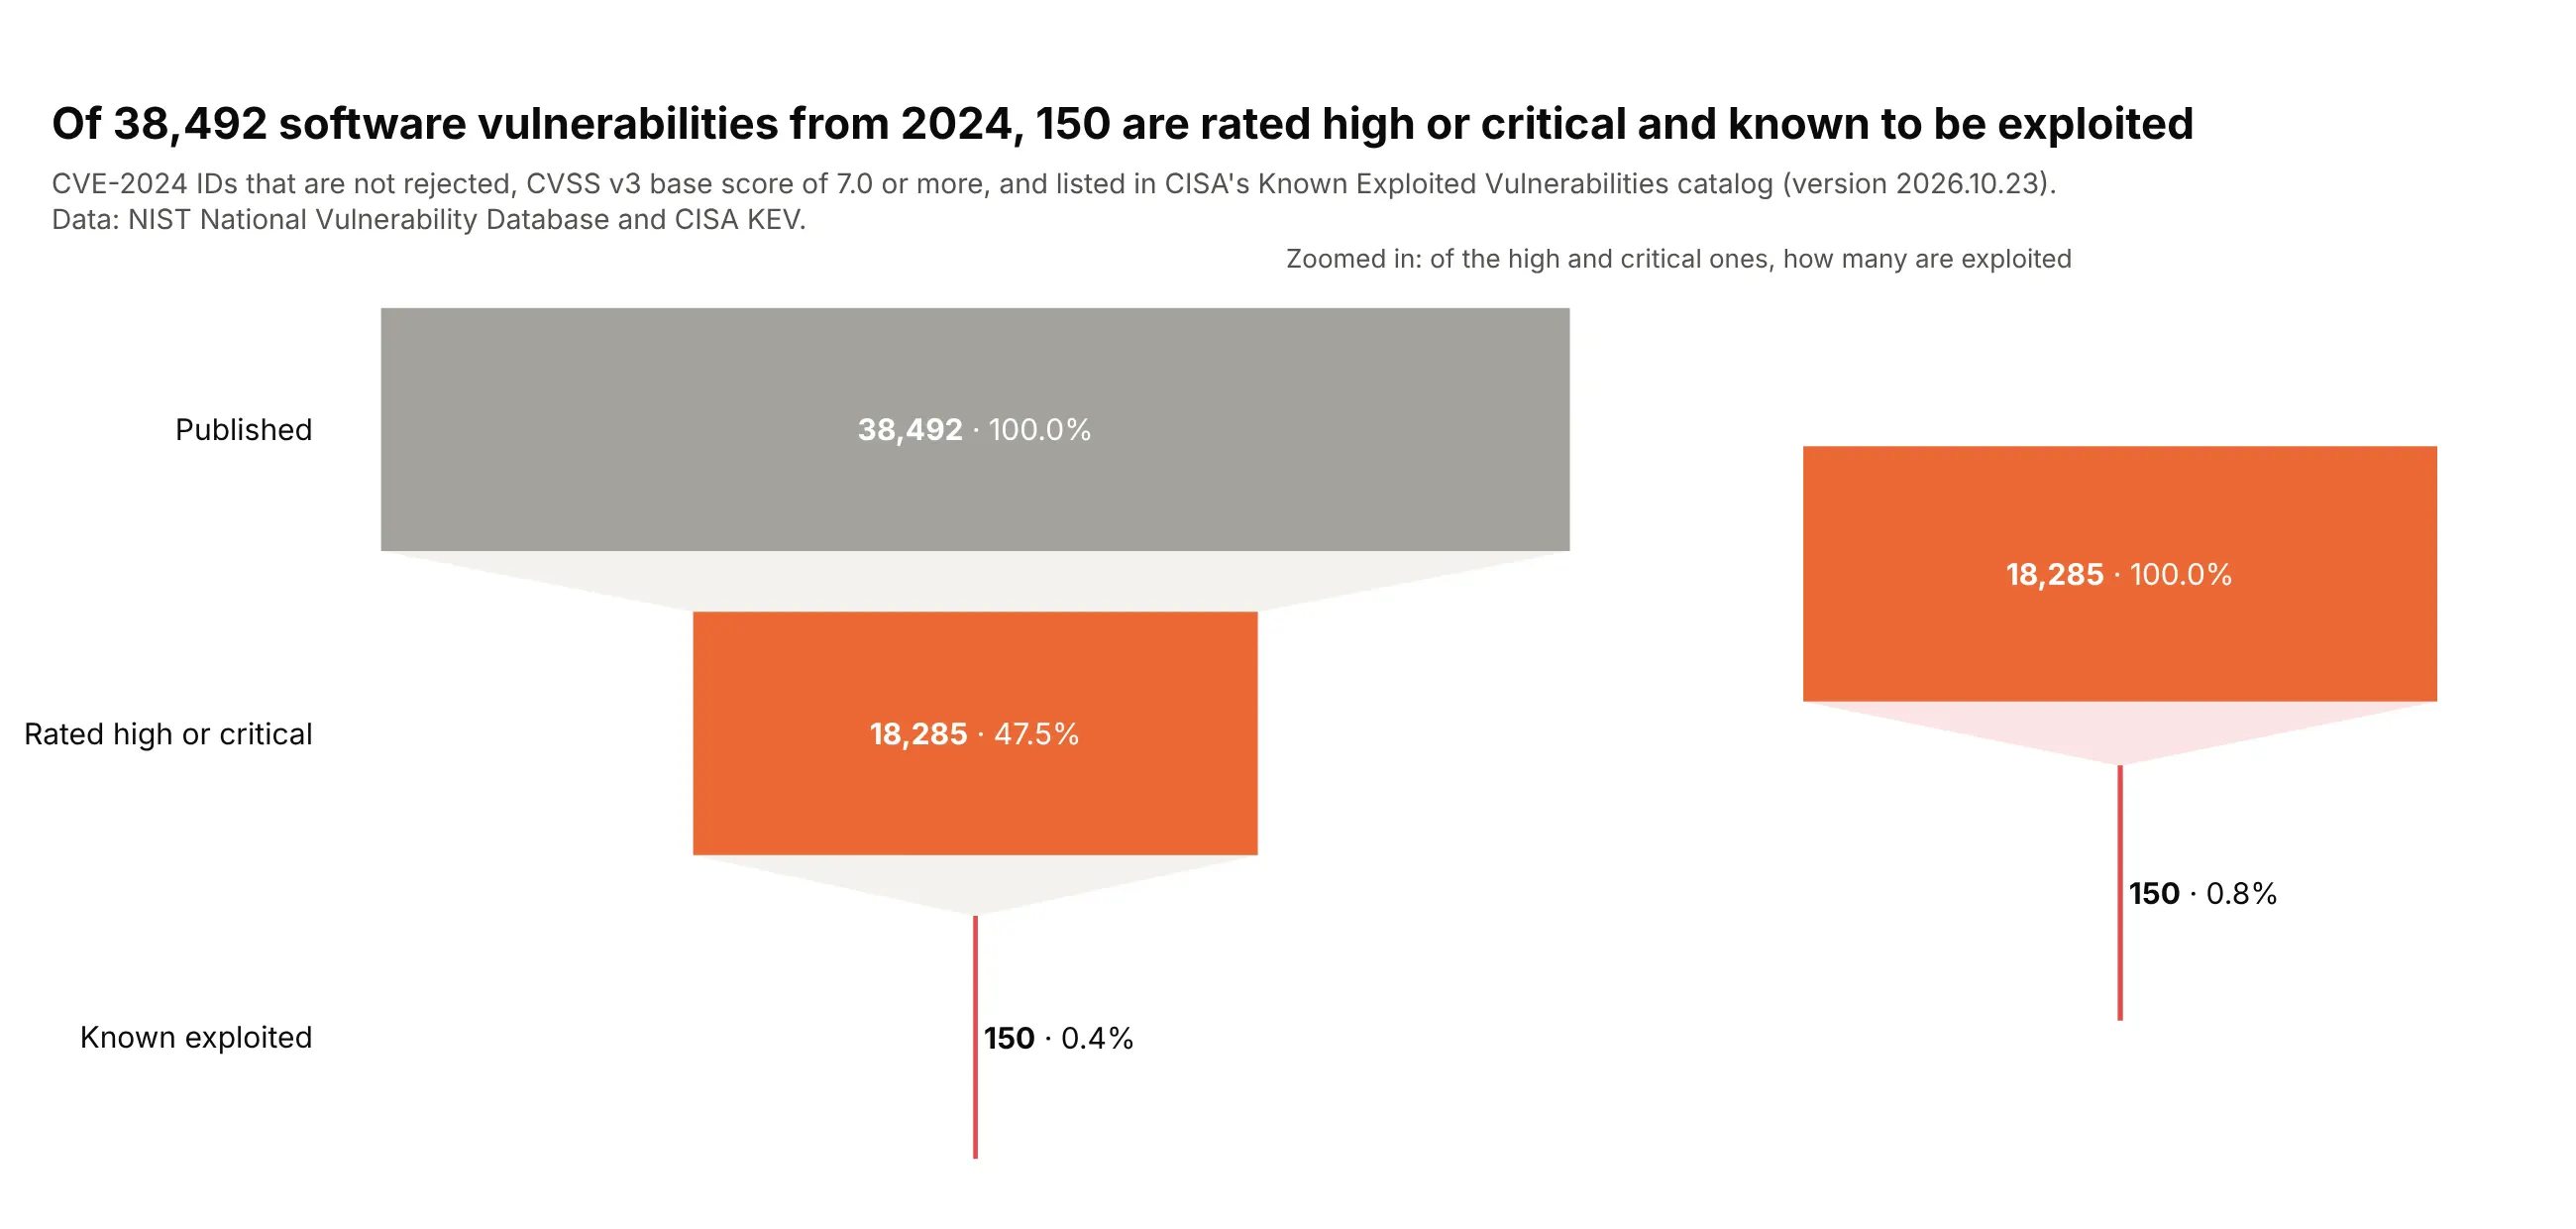
Half of the 38,492 CVE-2024 vulnerabilities are rated high or critical, but only 150 of those are on CISA's list of vulnerabilities attackers have used, 0.8% of the severe ones. Data: NIST National Vulnerability Database and CISA Known Exploited Vulnerabilities catalog.
Tip: add a second, zoomed funnel with its own domain instead of distorting the scale.
Get the data from the NIST NVD CVE JSON 2.0 feed for 2024 and CISA's Known ExploitedVulnerabilities catalog and shape it into a table(columns: cve_id, published, status, base_score, severity, in_kev, kev_date_added).Build a plotly funnel: published (not rejected), CVSS v3 >= 7.0, and also in KEV.- Last bar red with its text outside; a second funnel of the last two stages at the right.
11. 82% of the natural gas pulled from US wells in 2024 reached the market as dry gas
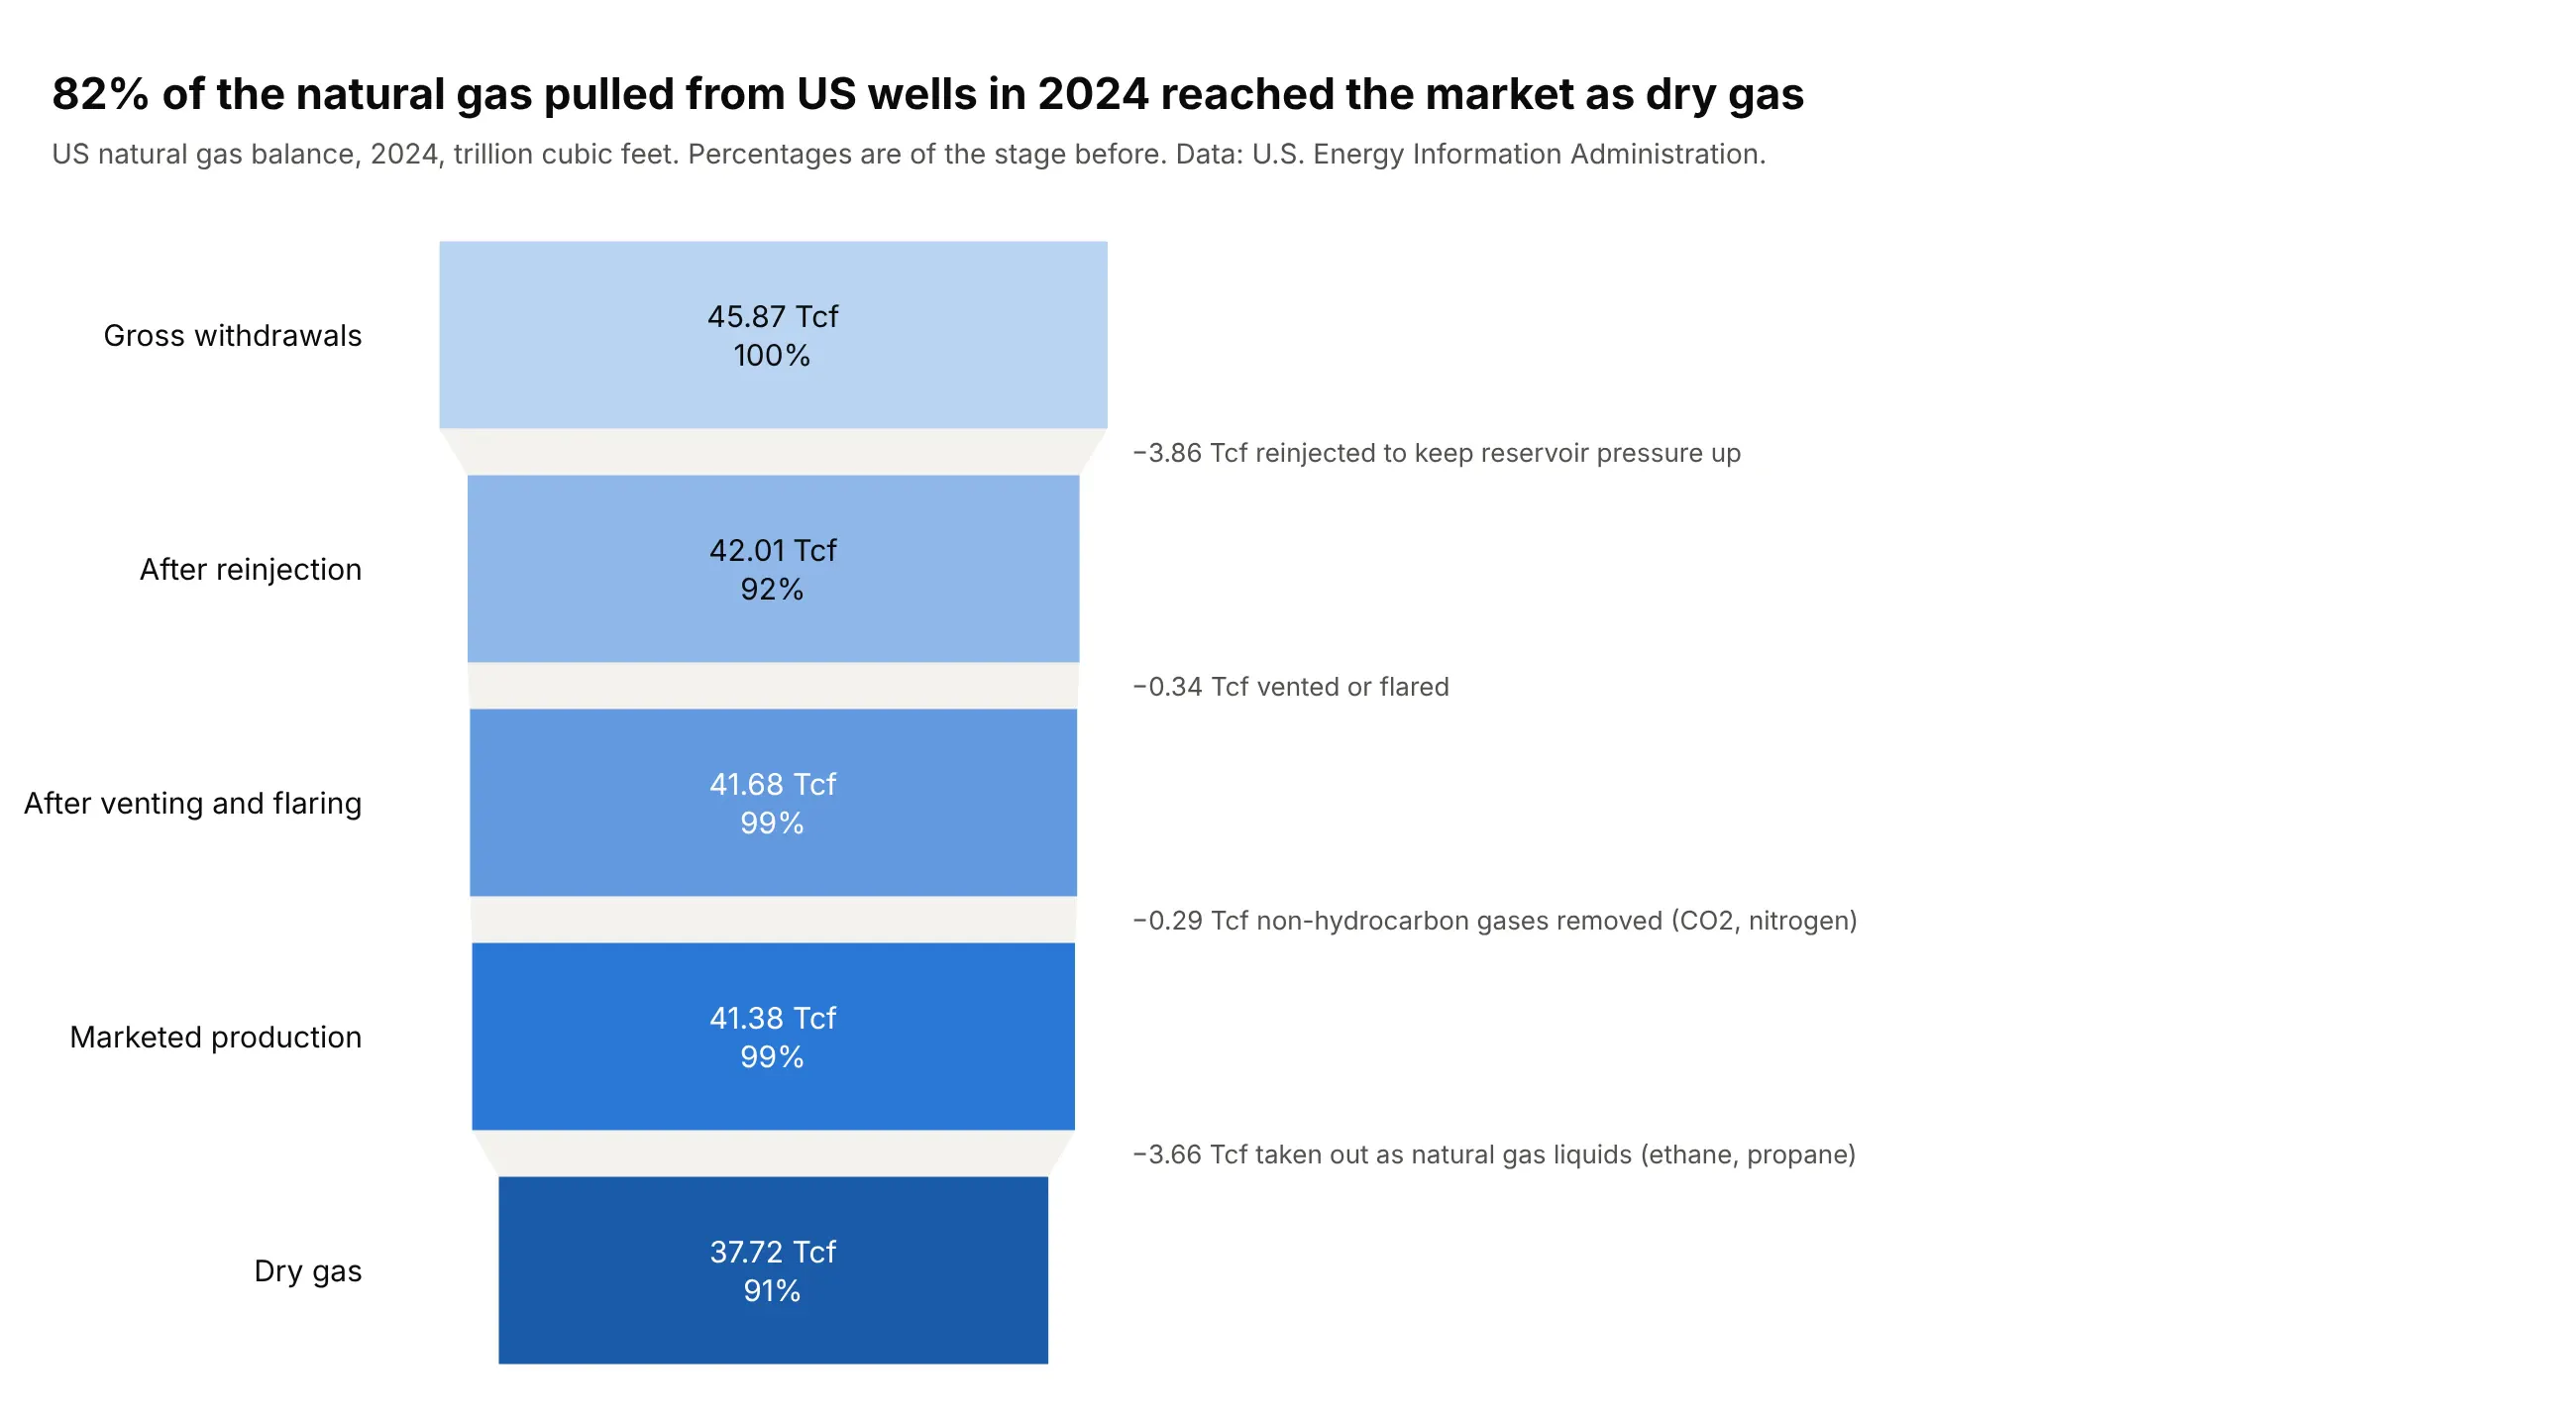
US wells produced 45.87 trillion cubic feet of gas in 2024. After reinjection, venting and flaring and the removal of natural gas liquids, 37.72 Tcf (82%) reached the market as dry gas. Data: U.S. Energy Information Administration.
Tip: name what each step removes and how much in an annotation, because a 1% step is too thin to see in the bars.
Get the data from the EIA's Natural Gas Gross Withdrawals and Production series (US, annual,MMcf) and shape it into a table(columns: year, gross_withdrawals, repressuring, vented_flared, nonhydrocarbon_removed, marketed, ngpl, dry).Build a plotly funnel of 2024 in trillion cubic feet: gross withdrawals, after reinjection,after venting and flaring, marketed production, dry gas.- Text: the value in Tcf and the percent of the stage before; one blue that darkens towards dry gas.- An annotation between each pair of bars naming what was removed and how much.