
Priyaanka Arora
April 03, 2025
How To Effectively Maximize Data Science ROI With AI
Data science work is expensive, and it’s often hard to measure. Yet the expectation is clear: teams should influence decisions, improve efficiency, and contribute to business outcomes. ROI is the language the business speaks, but connecting data science output to measurable return isn’t always straightforward.
How do you communicate the ROI of your work? And more importantly, how do you increase it?
When used correctly, AI can help data science teams go from stuck in prototypes to shipping production-grade data applications. It can cut development time, reduce costs, and surface insights that matter faster. In this post, I’ll unpack how AI can actually increase the ROI of data science projects.
What is ROI in data science?
Return on investment (ROI) in data science refers to the measurable business value generated by data initiatives relative to their cost, where value is only realized when models, insights, or applications are deployed and used in production.
Business value includes savings from automation, improved decision quality, accelerated workflows, and new revenue streams. High model accuracy or analytical depth doesn’t translate to ROI unless outputs are delivered in a way that drives decisions and actions. A technically sound model sitting in a notebook delivers no ROI.
If your work never makes it into the hands of decision-makers, or if the time from idea to impact is too long, ROI tanks.
How to calculate data science ROI
The classic formula looks something like this:
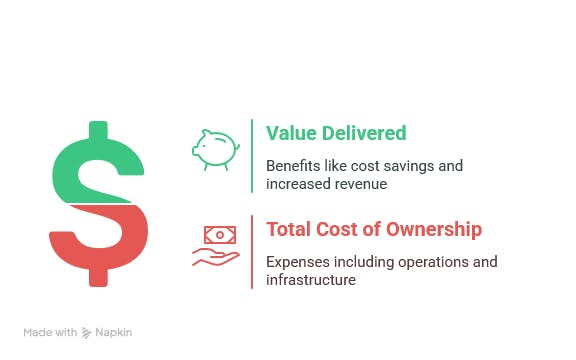
Data Science ROI = (Value Delivered by Data Products – Total Cost of Ownership) / Total Cost of Ownership
Where:
- Value Delivered could include cost savings, increased revenue, productivity gains, reduced risk, or faster time to insight, but only if those outcomes result from deployed models, dashboards, or data tools
- Total Cost of Ownership includes salaries, tooling, infrastructure, and time spent on development, deployment, and maintenance
Of course, the biggest challenge is attribution. It’s not always clear what percentage of a positive outcome was driven by the model, versus the business context it was deployed into.
So how do you measure the ROI of AI?
Same structure, different flavor:
AI ROI = (Business Impact - Cost of AI tools/development) / Cost of AI tools/development
How to calculate ROI of Data Science and AI
Business impact is often hard to pin down, but you can proxy it with:
- Reduced decision latency
- Increased accuracy in forecasting
- Operational cost reduction
- Uplift in revenue or retention from model-informed changes
By incorporating AI in development, data science workflows, or data science applications. You'll typically see ROI show up through:
- Time savings (automated coding, data prep, etc.)
- Lower development costs (fewer dev hours or reduced need for full-stack expertise)
- Increased productivity (more iterations, faster debugging)
- Faster, more confident decisions (via AI-augmented insights)
In other words, if AI helps you ship something that would’ve otherwise taken weeks, the ROI is measurable in hours saved and velocity gained.
Here’s an example:
Broadband Insights recently integrated an AI chatbot into their Monthly Metrics Dash app using Dash Enterprise’s Chatbot Builder. The chatbot helps internal teams and investors surface trends in subscriber and financial data, either by generating raw SQL queries via Ollama or by answering natural language questions directly.
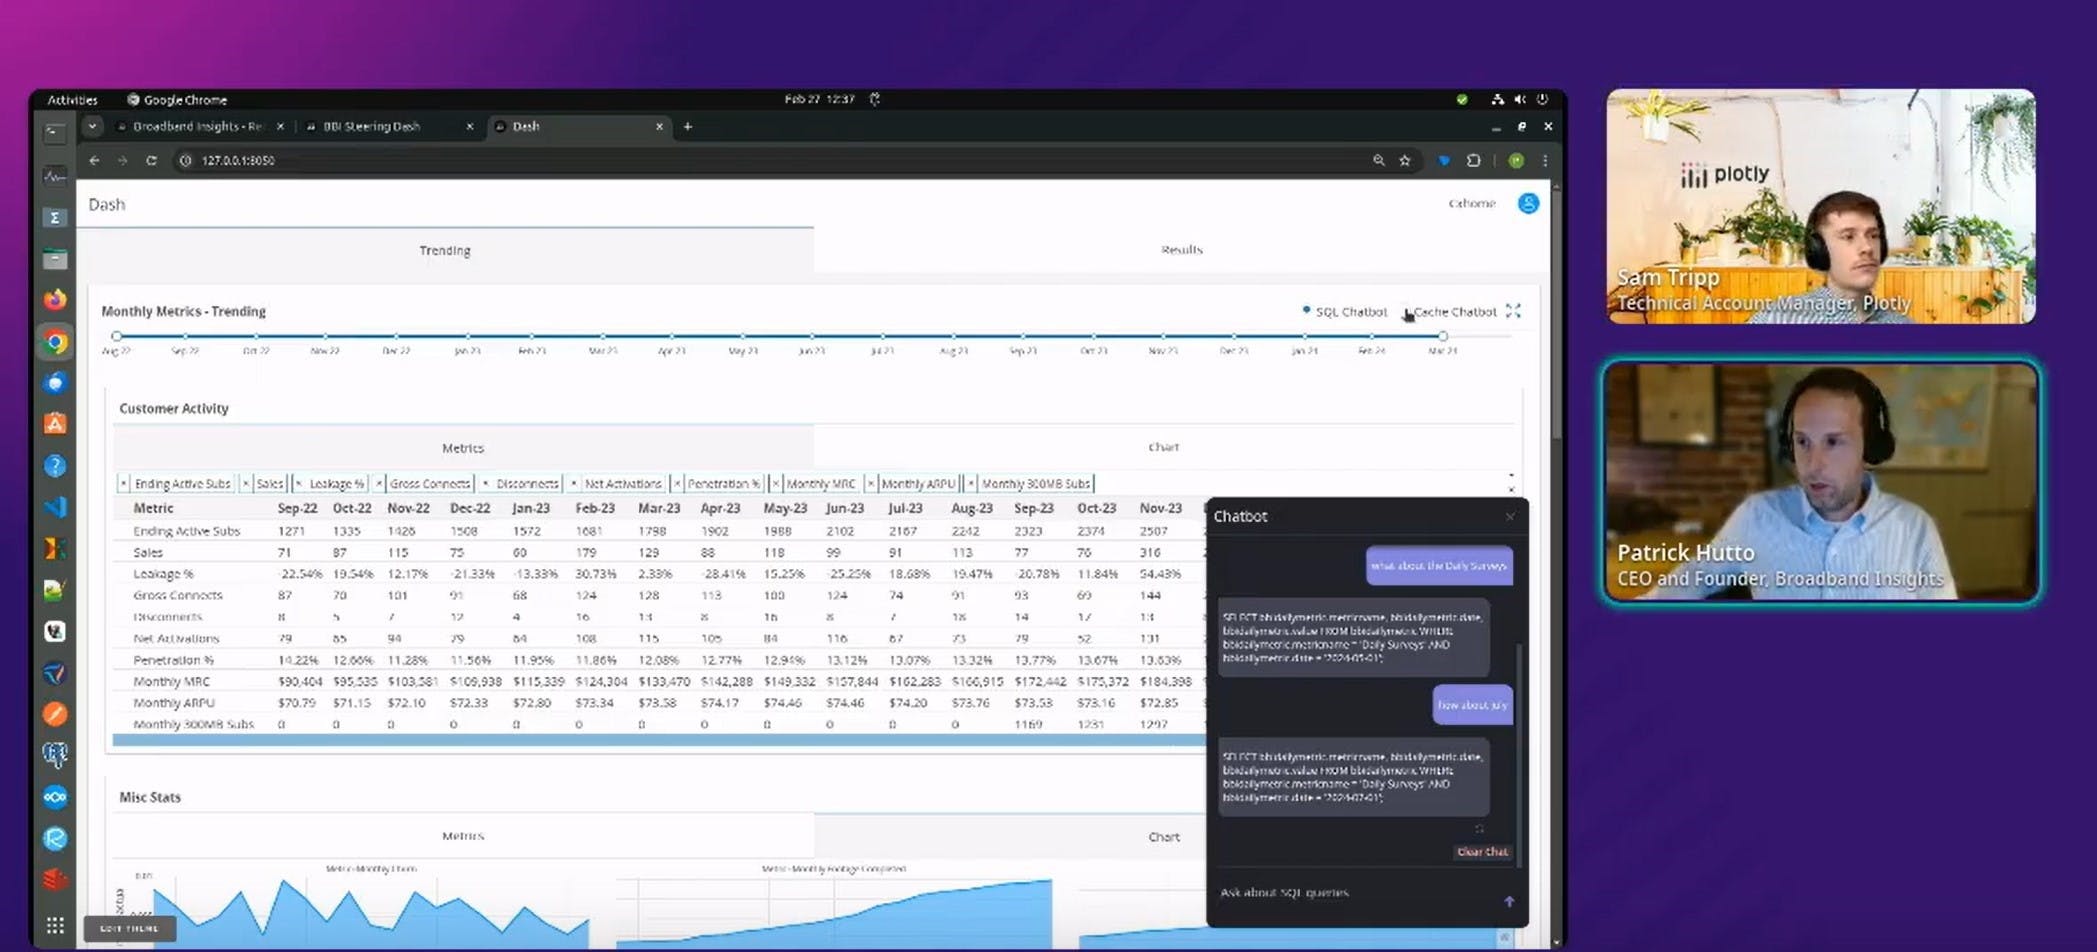
Broadband Insights builds an AI chatbot with Plotly.
This dual-mode setup, backed by schema-aware querying and a pivoted Pandas dataset, lets non-technical users explore complex data without writing code. The result is faster analysis, reduced dependency on data teams, and higher ROI from existing data assets.
The last-mile gap: going to production
Then there’s the real ROI killer: most data science work never ships.
According to VentureBeat, 87% of data science projects fail to go to production. That means no one ever uses them. No data apps, no decision making, no business impact derived.
This bottleneck is known as the last-mile gap, and this common challenge blocks data science ROI. The last-mile gap is one key area where AI, when applied thoughtfully, can flip the script.
How you can actually maximize data science ROI with AI
There are two places AI boosts ROI for data science:
- It improves the development process, reducing time and cost.
- It improves the user-facing application, helping end users extract insight faster.
Both depend on one thing: pushing past the last-mile gap to ship production-grade data apps, not just prototypes.
AI makes data app development faster, cheaper, and more accessible
Modern AI tools can write usable code from prompts. That means your team can go from Python notebook to interactive Dash app faster than ever. Whether you’re building a time-series forecast viewer or a multi-tabbed BI dashboard, AI can scaffold the app layout, generate boilerplate code, and even recommend data visualizations.
This matters because:
- Less IT and full-stack dependency: You can minimize dependency on IT teams or frontend coding expertise to build a UI.
- Use your existing team: Analysts, data scientists, and domain experts with varying skills can collaborate full-cycle from model to deployable app.
- Cut development time: Instead of days setting up callbacks or layout, it’s minutes with autogenerated code.
In Plotly Dash Enterprise, this gets even better. Plotly AI is tightly integrated, so once you generate your app code, you can click to apply a theme, click to deploy, and you’re done. You can circumvent DevOps overhead and the debugging doom-loop from mismatched toolchains.
Accelerating development with Plotly AI has real ROI implications:
- Development cost savings from less need for custom frontend/backend work.
- Time to value shrinks dramatically.
- Productivity per team member increases, especially for domain experts without formal software training.
AI for data cleaning and prep
Before data gets visualized, it has to be cleaned. AI tools can automate some of the dullest parts of the job: spotting outliers, fixing schema mismatches, suggesting imputations. These aren’t magic fixes, but they reduce the manual effort required to get data analysis-ready.
Instead of spending hours wrangling inconsistent labels or tracking down formatting issues, your team can focus on the work that drives decisions: building models, refining metrics, and delivering insights through production-grade apps.
AI-powered insights in production with smart insights
The biggest ROI unlock is in what happens after the data app ships.
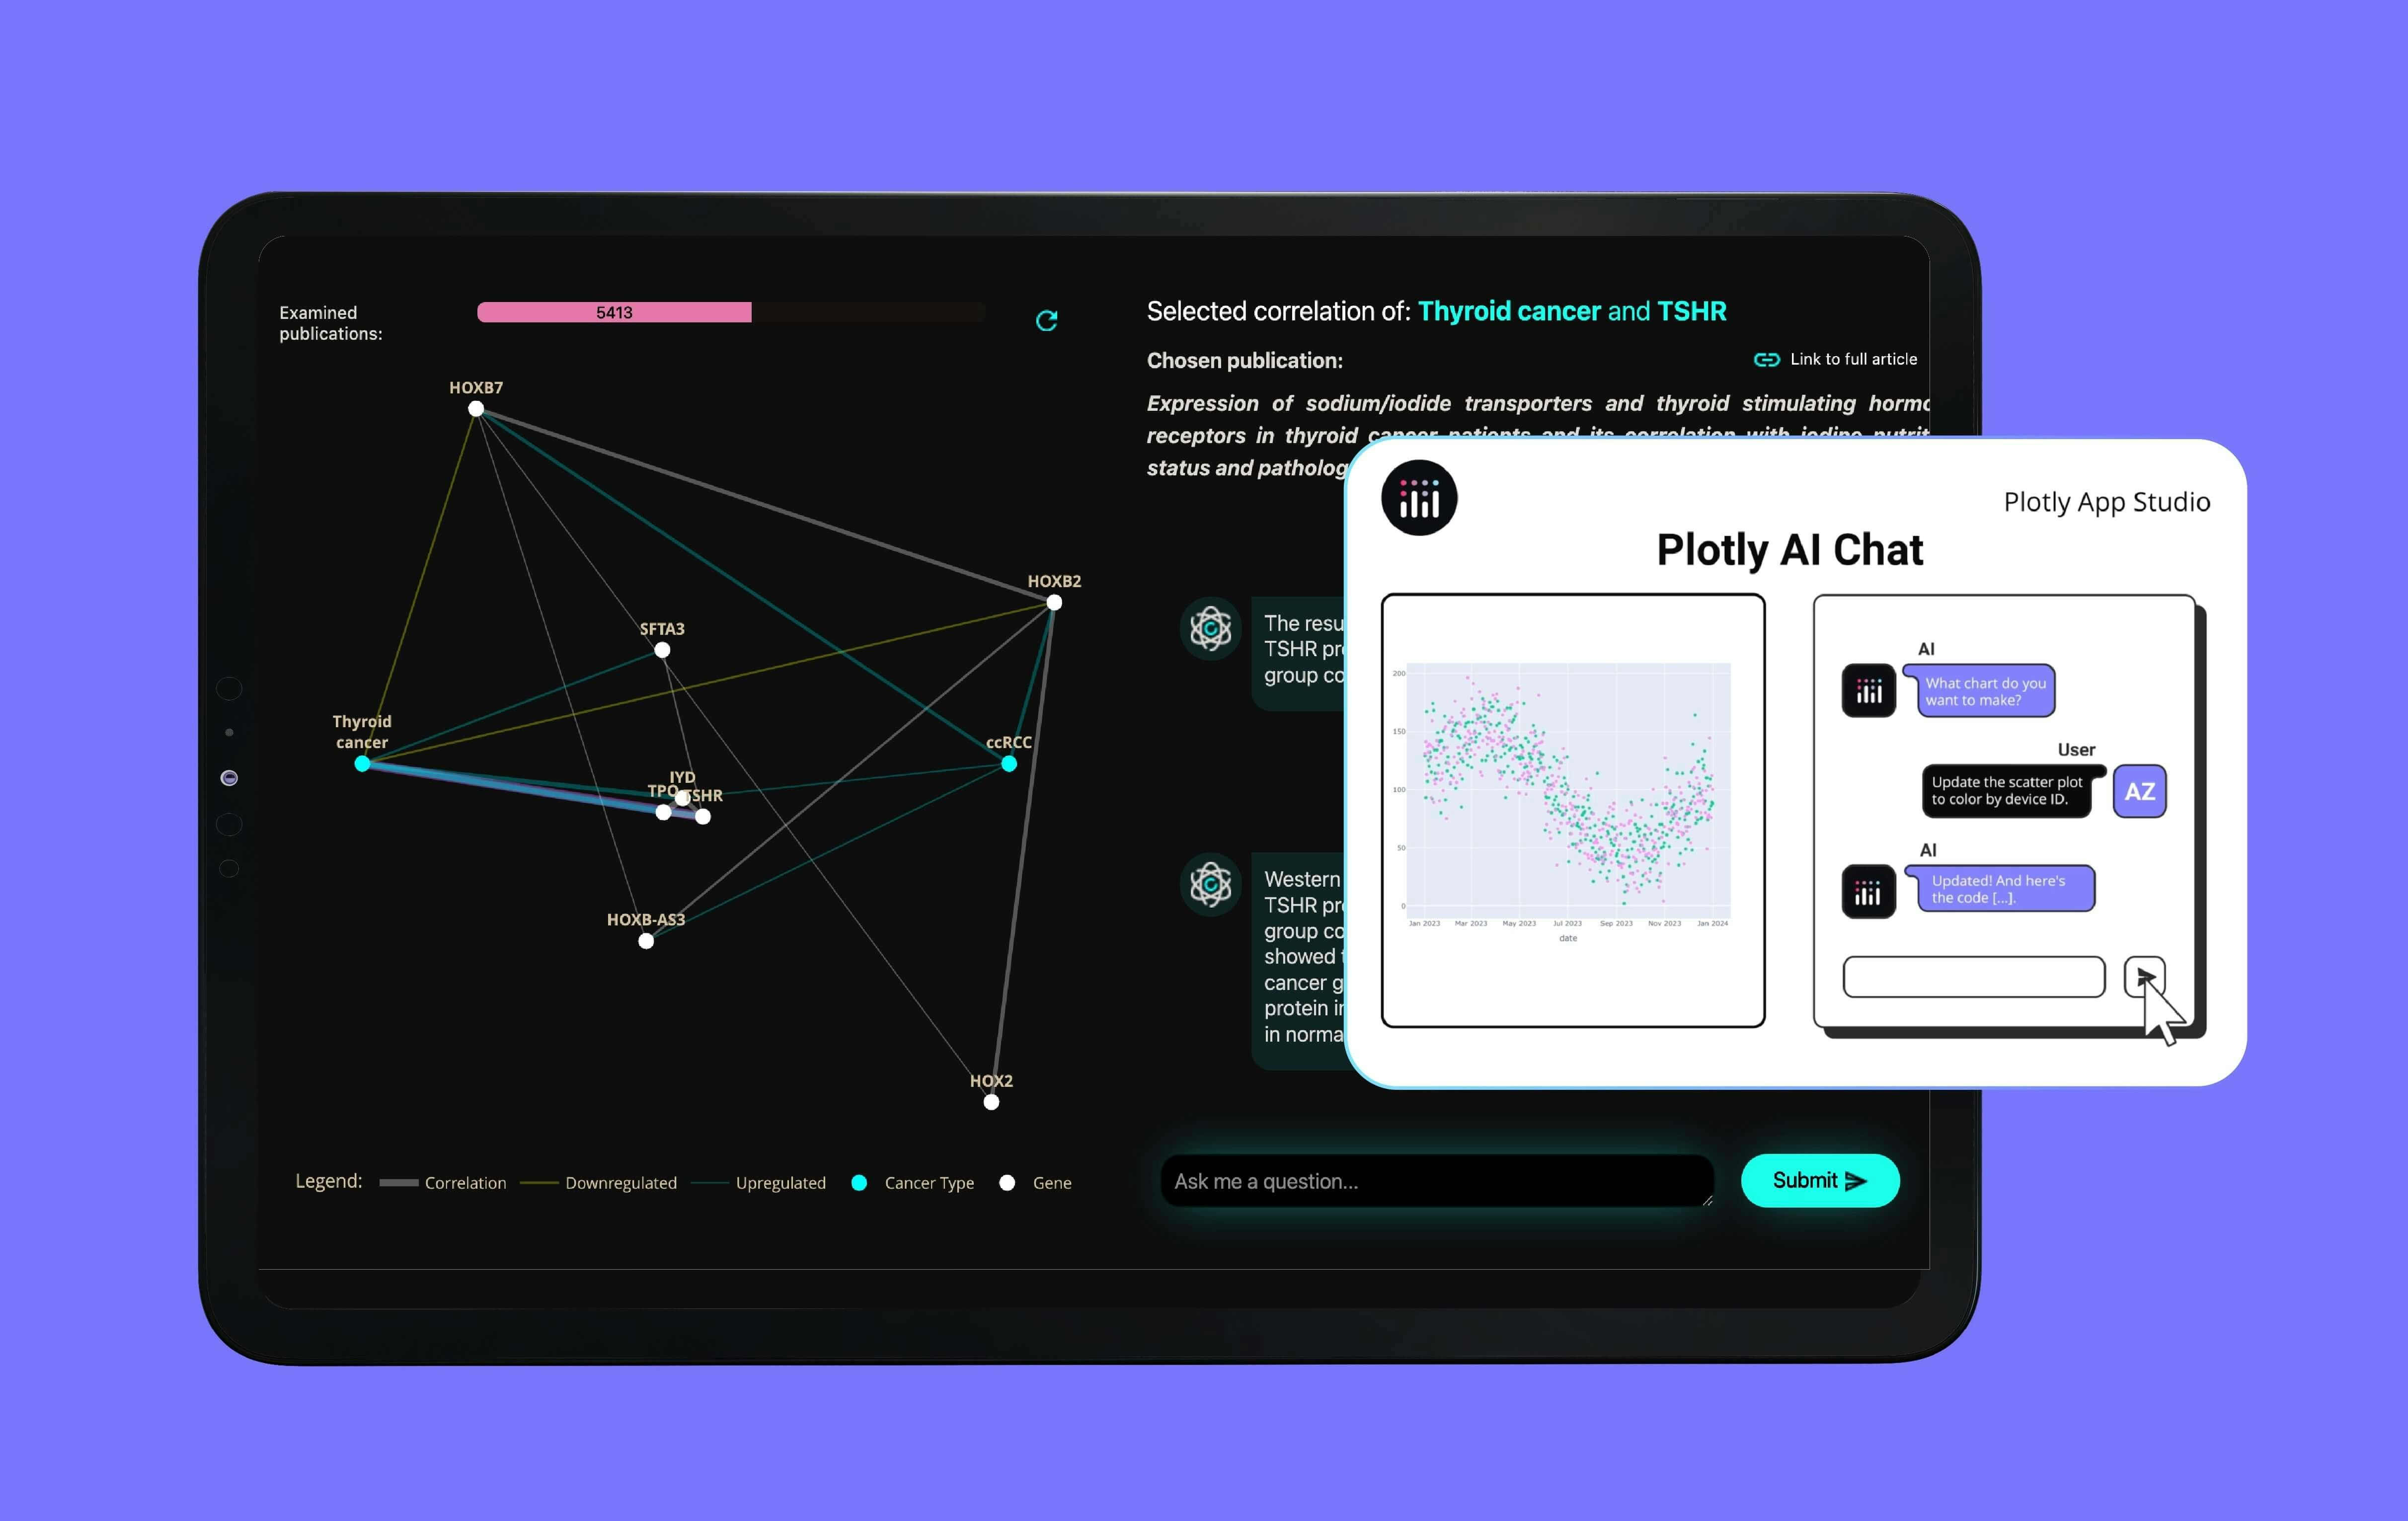
Dash apps support AI-powered insights, which means your end users do more than looking at static charts. They can ask questions to a custom-built AI chatbot in natural language, explore trends automatically flagged by the app, and get explanations on the fly.
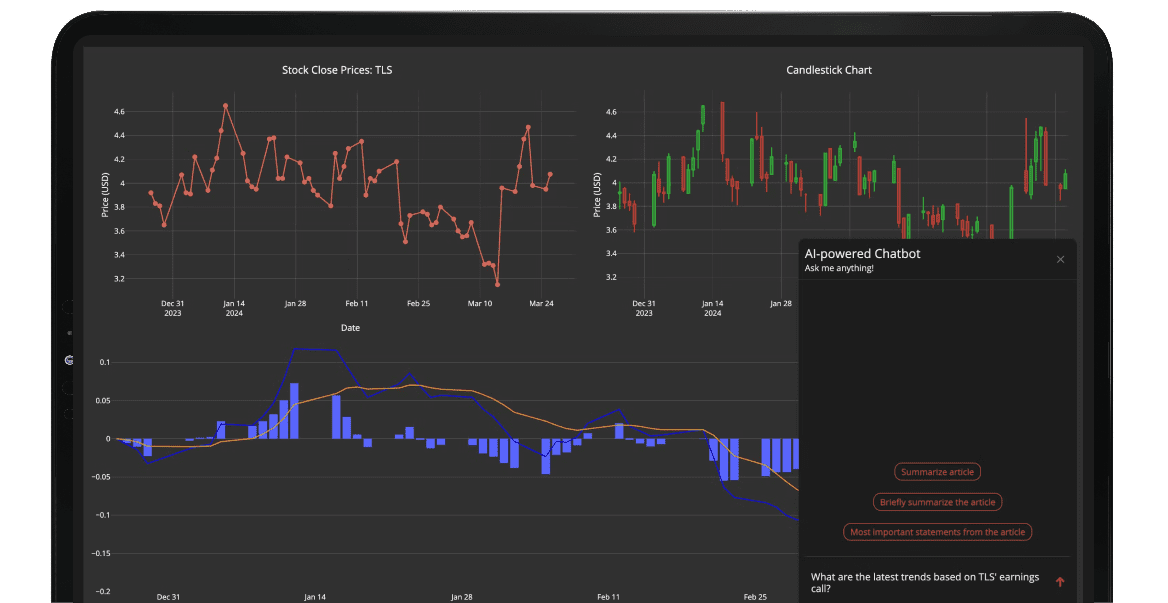
Build a custom AI chatbot for your data app with Plotly.
This turns a Python data app from a dashboard into a decision tool. It:
- Speeds up insight discovery (fewer “what am I looking at?” moments)
- Builds confidence in the data (users can explore the “why” behind metrics)
- Reduces data team overhead (fewer ad hoc questions)
Recap of three ways AI actually maximizes ROI for data science projects
- Faster Development: AI writes layout and viz code for you. Non-coders can generate production-ready apps. With Plotly Dash Enterprise, you go from idea to deployed app in minutes.
- Simpler Data Cleaning: Use AI to automate repetitive tasks. Free up your team for high-impact work.
- Smarter Insight Delivery: Let end users explore and understand the data directly through embedded AI. Less friction, more decisions.
Put together, these AI strategies drastically reduce cost, increase velocity, and connect data science outputs directly to business outcomes. That’s how you maximize ROI.
Check out Plotly AI
Generic AI tools give you generic results and generic code that often doesn’t run, or isn’t structured for production. Plotly AI is purpose-built for data scientists building real apps. It’s included with the Plotly Dash Enterprise platform, so every AI-generated snippet is immediately usable and deployable.
With Plotly’s AI capabilities alongside the leading platform for Python data apps, your team can chat, click, or code to build, beautify, deploy, and scale insights from data smarter and faster.