
Celia López
December 12, 2024
How to Future-Proof Your Data Apps With Structured Debugging
Have you ever thought about the physics of reliability?
When we say something is reliable, it means that we can predict with certainty how it will behave. Dash applications are no different. Building a reliable Dash app equates to the prevention of unexpected app behaviors when someone uses it. The challenge lies with planning for those unexpected events without knowing the underlying rules.
In the context of Dash apps, an unexpected event could be an authentication error with an external database caused by an expired API key. The short-term consequence of this event would be an interruption in service, preventing users from seeing the most up-to-date information or updating their data. In the long term, these consequences could undermine trust in the product and the people who develop it, and dampen the business impact created by data teams.
The goal of this blog series is to provide you with tools to discover the underlying rules of debugging so you can future-proof your Dash data app code.
What are bugs vs issues in data app development?
In software development and debugging, unexpected behaviors are also unwanted — we refer to these unwanted behaviors interchangeably as bugs or issues. But there's an important difference between bugs and issues. Bugs are typically library or software-specific and it’s clear from the start that they are unintended behaviors. An issue is a more general term that refers to unwanted behavior that we intend to change but whose nature and cause we don’t understand (yet).
Even though the cause of an issue can be a bug, not all issues are bugs. For example, if a library provides a mysum function that should return the addition of its arguments and mysum(2,3) returns 20 instead of 5, there’s clearly something wrong with the function definition and we would create a bug report in the library's repository.
However, often the source of unwanted behavior in our Dash apps is not that evident, as data apps can involve hundreds of lines of code and complex logic. This is where we flag such behaviors as issues.
Risk is the combination of the probability of an event and the impact of its consequences. If we want to reduce the risk of an issue happening in our Dash app, we can either reduce the likelihood or reduce the impact. Though we can’t reduce this risk to zero, we can take concrete steps to safeguard as much as possible against issues.
When an issue happens, the resolution process gives us valuable information about how the data app is working and how the users expect our app to work, which can be different from its original design. In turn, this will allow us to reduce the likelihood of issues by adding to our code logic that takes into account the conditions we had not considered before. Even though they are not welcome in production, when issues appear during the development phase they can help us make our Dash app more reliable.
How to define rules for an issue when designing a data app
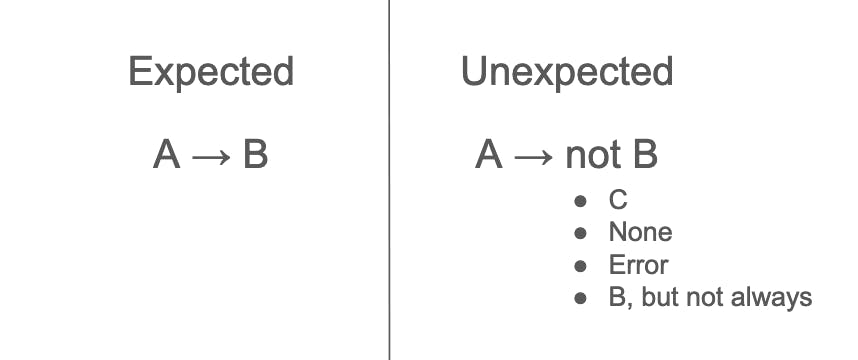
Let’s start with an example. Suppose you're designing a data app that will produce an output "B" when the user performs an action "A". Consequently, when action A is performed, the only expected output would be B. Whereas, an unexpected output could be: "C", an error message, the absence of an output — basically any outcome other than action A producing output B, every single time.
We would call this “A not resulting in B” relationship an issue. We don’t know yet if it’s a bug because we haven’t fully understood the rules of how or why a particular behavior is happening.
We can start by defining the rule(s) we do know.
Let’s try it with the “A → B” expected behavior rule we just discussed. For simplicity, we'll look at what happens when the unexpected behavior A → C happens instead of A → B.. To further define the example, A represents the user clicking a button to generate a plot, B represents the generation of the correct line chart, and C represents the generation of an incorrect line chart. Here are some pictures to help you visualize two different outputs, B and C:
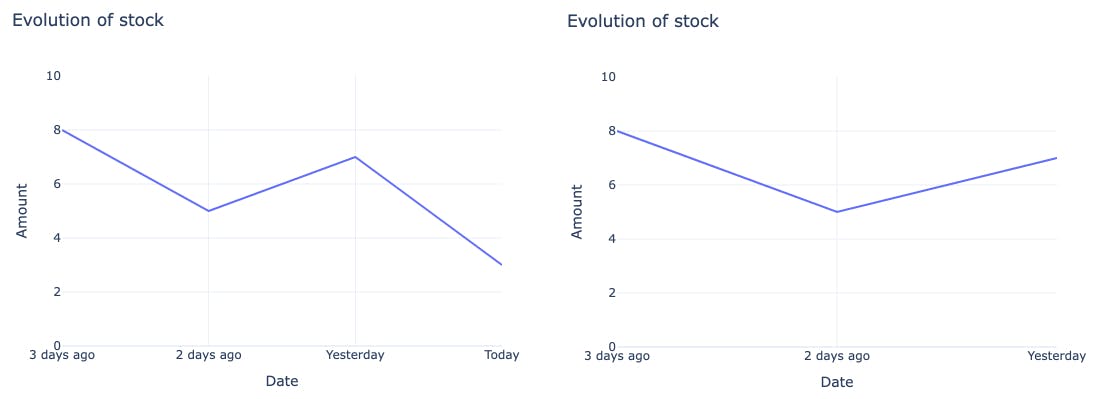
The left-hand chart shows “B”, where the correct line chart is generated. The right-hand line chart shows “C”, where an incorrect line chart is generated.
A rule for the expected behavior could be:
“When the user clicks the button, the plot is generated”.
However, “When the user clicks the button, the plot is generated” could be a definition of the unexpected behavior too, so this is not a useful rule. To see why, let's turn this single rule into two more detailed rules:
        “A → B: When the user clicks the button, the plot is generated with updated data”.
        “A → C: When the user clicks the button, the plot is generated with outdated data”.
One way to assess if the rules are good enough is by asking: “If I gave these definitions to someone else, would they be able to differentiate when the issue is happening vs when it’s not?”. To achieve this scenario where the rules are different enough, we need to add details to make them more precise.
Although the rules could still be more precise, these new versions already allow us to differentiate between the expected and the unexpected, which gives us a valid starting point. But as I hinted, we can make our rules even more precise. The following is my framework to do so.
Using the Journalistic Six to create precise issue definitions
The Journalistic Six (also called “The Five Ws”) is a checklist used in journalism to make sure that all the important information about a story is included in its report. These questions are What, When, Where, Who, and Why — and How as a sixth one.
For Dash developers, these questions can be a great framework to help us add details to expected vs unexpected rule definitions. Let’s see how the Journalistic Six framework can be applied to a Dash App, with examples of common answers:
Question
What the question means in the context of Dash apps
Examples
What
What is working as expected?
What symptoms do you see?
Is there any error message (e.g. in the logs or the debug menu)?
What did you already do to try to fix it?
“A callback is returning a value that it shouldn’t”.
“A specific callback fails but it’s possible to keep doing other things”.
“The app freezes: after a certain action is triggered, the user can no longer interact with the app until they refresh the page”
How
How does the related code look?
How should the code execute the steps to get the expected output from the input?
How do you run or deploy the app? (one click deploy, CI/CD)
“The callback uses component with id ‘graph-2’ and property ‘hoverData’ as Input”
“I run the app with gunicor app:server –preload”
“I have if-else logic that looks like this: [code]”
When
When did it start happening?
Does it happen consistently or is it an intermittent error?
Can we check the deployment history?
Is there any automatic pipeline or task that modifies the app without developer intervention? (As an aside: no developer action doesn’t mean that nothing happened, there could be some automated processes like scheduled redeployments or weekly server restarts.
“It started happening after modifying X component or function in the code”.
“It was working fine until the last server restart, which happened on Sunday”.
“It started happening with no developer action”
Where
In which environments does it happen?
- The deployed app
- The workspace
- Your local environment
- Only one server.
If it happens in some environments but not others:
- What is different between the servers (e.g. Prod but not Dev)? Are both healthy?
- What is different between the environments? (e.g. library versions, environment variables)
Where does the app need to connect? Does the app connect to external services?
- How? (which library is used, how are the credentials passed)
- Does the server need to be whitelisted in the external service?
“The app works fine in my local environment but shows a timeout error when it’s deployed”.
“The issue happens both in my local environment and the deployed app, which are using different Python versions”.
“The app can connect to AWS from the Dev Dash Enterprise server but not the Prod one”.
Who
Does it happen to every user or only to certain users/groups? If it only happens to some users: what’s different for them?
- Do they have different permissions?
- Do they use different browsers?
What type of authentication does the app have?
How does the app use user information?
Does the issue happen to other developers in the community? → Is there any bug report in the library repository or documentation?
“The app owner can deploy but co-owners can’t”.
“Users who belong to the HR group see the plot but members of the Sales team get an error”.
Why
Our goal with this process is to answer this question, so at the start, it is typically unanswered. However, we can have starting hypotheses and “why nots”.
“I believe this is happening because the app is not connecting properly to the database”.
“I thought it could be related to the pandas version but after updating it, the issue persists”.
Applying the Journalistic Six framework to our example
A quick recap: we looked at an example where an action A represents clicking a button in a Dash app. The rule A → B would generate an expected behavior of the app displaying the correct line chart, while the rule A → C would result in an unexpected behavior where an outdated line chart is generated.
Let’s apply the Journalistic Six framework to our outdated plot issue and better define this A → C rule:
What?
- A line plot is generated when the user clicks the button. However, instead of showing updated data including today’s values, it is showing outdated data (the last value is yesterday’s).
- There are no error messages.
How?
- The df object is generated outside the callback with a SQL query (pd.read_sql) to an external public database.
- The callback Input is the n_clicks property of a html.Button component with id=”my-button”.
- Inside the callback, the global df object is used inside px.line to generate the new_fig object, which is returned as the figure property of a dcc.Graph component with id=”my-graph”.
When?
- We deployed the app yesterday and the data was okay. We noticed the issue today.
- It happens every time we trigger the callback that generates the plot. However, redeploying the app updates the data.
Who?
- It happens to every user.
Where?
- It happens in the deployed app. When we run the app locally the data is updated (we see today’s data in the plot).
- The Dash and Plotly versions in the requirements.txt are 2.18.1 and 5.24.1, respectively. In my local environment the versions are the same (I checked with pip list).
- We connect to an external database to retrieve the data.
Why?
- We have already tested that the callback is running because we have added a print statement inside it that appears in the logs every time we click the button.
- If we return a px.bar plot instead of a px.line plot with the callback, the data is still outdated.
With this information, the definition of the A → C unexpected behavior rule can be expanded to these points:
- The issue is happening in the version of the app that was deployed yesterday.
- A callback that uses a button click as Input updates the figure property of a dcc.Graph with a line plot that is generated with the df object and px.line.
- The df object is generated outside the callback with a SQL query (pd.read_sql) to an external public database.
- We use plotly==5.24.1 and dash==2.18.1.
- When the app was deployed yesterday, the plot showed the updated data (the last point was the one corresponding to yesterday’s data). Today we noticed that the last point in the plot was still yesterday’s. It should show today’s data.
- We tried refreshing the page and triggering the callback again by clicking the button. The callback runs successfully (we checked with print statements) but the plot remains the same.
- When we run the app locally today, the plot shows the correct, updated data.
This is a very long definition and you may be thinking that this overwhelming list doesn’t really look helpful. After several years as part of the Dash Enterprise Customer Support team at Plotly, it does to me, though, and I think it will to you too after this blog series.
Identifying the root cause of the issue
Within our example, we've collected plenty of details on the A → C unexpected behavior. Now, we have a basis for further narrowing down the root cause behind the issue.
In the case of the example A → C rule definition, these are the most relevant pieces of information that I have identified:
- The df object is generated outside the callback with a SQL query (pd.read_sql) to an external public database.
- Today we noticed that the last point in the plot was still yesterday’s.
- When we run the app locally today, the plot shows the correct, updated data.
Why is this information relevant?
- When an object is defined globally (outside callbacks) in a Dash app, it is only generated when the script it is in is run. It is not run when a new user visits the app or when we refresh the page.
- When we run an app in development mode, we typically do it with python app.py.and app.run(debug=True).
- Every time we run python app.py, the whole app.py script is run, so df is regenerated.
- If we stop the app in the terminal with Ctrl+C and start python app.py again df will be regenerated.
- If we have app.run(debug=True), make some changes to the code and save them, the app will automatically reload and the script will be rerun. This means that every time we make a change to the code with debug enabled, the df will be regenerated.
- However, when a Dash app is deployed app.py is only run once during the deployment. This means that df won’t be regenerated until we redeploy the app.
- In the example, if the deployment was done yesterday, the version of the df that the deployed app is using is yesterday’s. That’s why the plot shows outdated data.
With this analysis, we have transformed an unexpected behavior into an expected one. It is still unwanted, but now that we know why it’s happening, we can explore ways to modify it.
For example, if we want the df object to be updated while the app is deployed, we could try to generate it inside the callback. But that’s a story for another blog post.
Building a deeper understanding for debugging Dash apps
Issues that arise during the development phase of data apps are an opportunity to learn more about the app's underlying rules. Discovering such issues during development can help us ultimately deploy more reliable production apps.
The Journalistic Six framework helps us create precise issue definitions, which is a necessary step to identify the relevant variables that are involved and understand why the issue is happening.
My experience as a Plotly Customer Success Engineer has helped me develop a deeper understanding of common issues Dash developers encounter when crafting interactive data applications. Stay tuned for the next part of my series — I'll share how you can further investigate issues and eventually solve them.
Thanks for reading!