
Arne Petter
May 09, 2024
Building Plotly Dash Data Applications as a Data Science Consultant
Bringing people together as a community is one of the key functions of technology.
The power of community was palpable when Adam Schroeder and Arne Petter chatted in the first-ever Dash Club Hangout. Members of the 10,000+ strong Dash Club came together to pick the brains of a long-standing contributor to the data visualization and application framework space.
Read the highlights of Arne’s chat with Plotly community manager Adam, answering community questions about his experience building Dash solutions for internal and external clients alike.
Q&A with Arne: the experience of building interactive data apps with Dash
Arne is a data science and analytics consultant at a nordic multinational power company. He’s also responsible for the highest number of Plotly-related answers on Stack Overflow. In his current role, he assists with the set up of Plotly Dash Enterprise projects.
How did you become the top contributor on Stack Overflow for Plotly-related topics?
As many before me, I started out on Stack Overflow asking questions. And that could be a daunting experience where you risked getting no answers, getting berated for not knowing your stuff or not asking the question the right way, or all of the above. Still, I found Stack Overflow to be extremely valuable.
And after taking the time to learn how to ask a well phrased, non-duplicate, on-topic question with a fully reproducible code snippet, I was left with the impression that I could get assistance with pretty much anything from people who really knew what they were talking about. That’s when I started thinking that it would be awesome to one day contribute to the community in the same way.
I just needed to find a technology that was worth the time and effort it would take to become a specialist. And that’s exactly what happened the first time I asked a question about Plotly.
“When I first asked a question on the Plotly tag, I got more or less an immediate answer from one of the company’s team members.”
Arne Petter, Data Science Consultant
When I first asked a question on the Plotly tag, I got more or less an immediate answer from one of the company’s team members. It was such an extreme joy to get in touch directly with the Plotly team that it ignited a spark in me to take part in the community and contribute and learn more.
Have you implemented interactive Plotly Dash applications for internal employees only, or for external clients as well?
I started out using Plotly Dash to develop applications for internal users as a part of their internal analytics toolsets. When external users saw it, their initial feedback was, "What is this? It feels so much more flexible than PowerBI."
The feedback I get from users and colleagues for Dash makes me enthusiastic about it as well. Right now though, I’m assisting a highly qualified team of data engineers with their transition from Dash Open Source to Dash Enterprise.
How do you increase Dash app performance when working with large data sets?
Polars is even better than pandas when it comes to speeding things up; using Polars dataframes. For those who don't know, Polars is a dataframe framework written in Rust. And that makes it blazingly fast when handling bigger datasets. Taking the time to learn a bit of Polars is definitely worth it.
“Polars is blazingly fast when handling bigger datasets.”
Arne Petter, Data Science Consultant
You can also look into Datashader, and partial property updates in Dash — you can partially update anything in a callback, especially figures. This means you don't have to update the whole data set again, going back and forth between the client, server, and browser. You can do everything on the browser.
Can you work with Polars in Python without knowing Rust?
Yes — Polars is a library that's available in Python just as pandas is.
What are Dash apps used for versus PowerBI at your current organization?
PowerBI is for sharing reports and other uses except for highly specialized purposes. Think of it like this: PowerBI is like a shovel while Plotly Dash is highly specialized like a scalpel would be to a surgeon.
“PowerBI is like a shovel while Plotly Dash is highly specialized like a scalpel would be to a surgeon.”
Arne Petter, Data Science Consultant
They are for two very different uses. PowerBI is widely used, but we've made the decision to use Plotly and Dash for particular topics including illustrating and visualizing points on a map, and retrieving and displaying information in time series figures and charts that contain a lot of data points.
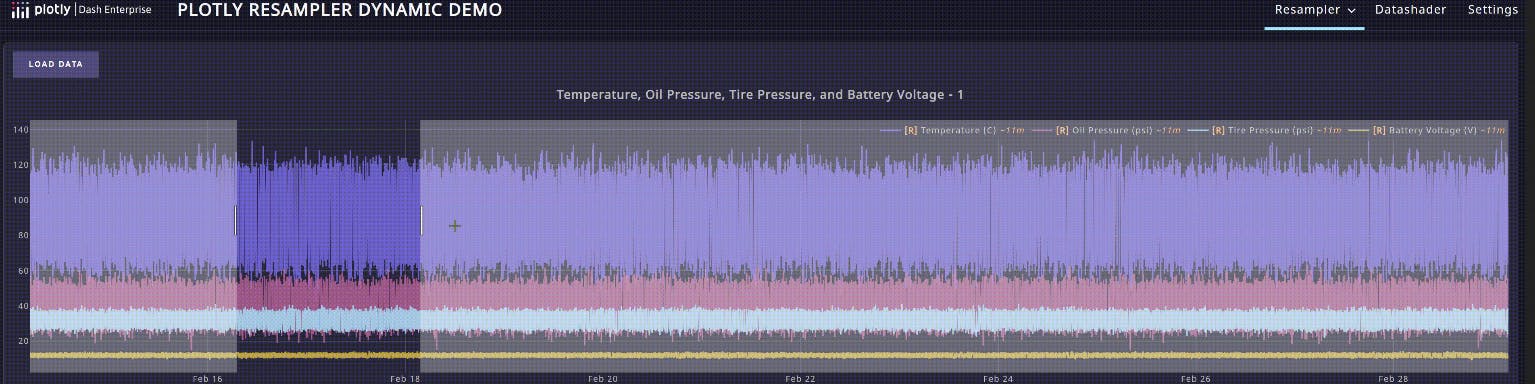
Nearly 200 million time-series data points being visualized simultaneously with Plotly Dash and Databricks.
How do I prepare to transition from Plotly Dash to Dash Enterprise?
Though you can't gain hands-on experience with Dash Enterprise without actually purchasing it, you can research the topics you're going to be working with, like more advanced callbacks, for example. While waiting for your organization to purchase Dash Enterprise, dive deeper using the open source version and that's probably the best preparation you can do.
Note from Adam: you can also reach out to the Plotly team and ask to learn more about Dash Enterprise. The team can give you a demo and let you see the product. Reach out to team Plotly here.
Is AI part of your current data app workflow?
Yes, absolutely, I use AI tools to improve my workflows every day. I use ChatGPT to answer all sorts of questions, even directly regarding Python and Dash.
But in my experience, although ChatGPT is a wonderful tool, it can't replace a skilled colleague or a well-functioning forum like Stackoverflow. It's a supplement to other resources.ChatGPT can quickly lead you down some rabbit holes where it is convinced that it has a solution, but doesn't work when I try it. So I end up having a few arguments with ChatGPT!
In my week, I can tell you I do use ChatGPT, but there are other things that are much more important to me. I don't use it as a basis for building data apps or in my day-to-day workflows, but just get a few things verified by the tool instead.
Do you have any tips to reduce the memory footprint of a Dash app?
That's very specific to each set up and situation, but in general when handling memory in your Dash app, just make sure not to trigger unnecessary callbacks and reduce the data you're working with in the first place. The first step, if you haven't already done so, would be to use the DCC Store component for sharing data between callbacks.
Which databases and Python libraries do you work with?
I'm not really that proficient in Databricks, but that's what I prefer because it plays so well with Dash. The advantage of combining Databricks with Dash is that all the datasets you can use are not strictly organized as in other databases. You can have almost any data or data structure you'd like, and you can query that data pretty easily by setting it up in a callback.
“By combining Databricks and Dash, you can have almost any data or data structure you'd like, and you can query that data pretty easily by setting it up in a callback.”
Arne Petter, Data Science Consultant
As for Python libraries, Dash Bootstrap Components and Dash Mantine Components — those are beautiful additions to the Dash Core Components that I use every day for every app that I make. For layout and styling, I have most experience using dashboard sub components, but when it comes to interactively and input components, Dash Mantine Components is really my favorite.
Why did your organization move from open source Dash to Dash Enterprise?
First and foremost, as I understand it, for scalability. It was to make it a part of the organization and not rely on external open-source tools and GitHub for everything. An important reason was to keep everything internal to the organization.
Is it overkill to use Plotly Dash for something that can be done easily with PowerBI?
Overkill? Absolutely not because I find it so much easier to maintain, say a short Python script, over time than it is to maintain PowerBI files or DAX queries.
“I find it so much easier to maintain, say a short Python script, over time than it is to maintain PowerBI files or DAX queries.”
Arne Petter, Data Science Consultant
For smaller projects, the main reason for switching from PowerBI to Plotly Dash is really the maintainability and shareability.
How should someone prepare for a career in consultancy?
Take part in communities and make sure you are visible. Get really good at what you're doing and perhaps focus on one particular thing that you consider yourself to be really good at. That will be your contribution to a team and to an organization.
“Take part in communities and make sure you are visible.”
Arne Petter, Data Science Consultant
Make sure you are able to play a good role in any organization by getting a brief overview of project management frameworks and tool sets. If you have a basic understanding of how team work and you can contribute something you are good at, you're there.
Receive Plotly and Dash updates
You can reach out to Arne Petter on LinkedIn, and receive regular Dash and community updates via email by signing up for the bi-monthly Dash Club newsletter.