
Domenic Ravita
March 11, 2025
What is Plotly AI?
AI is everywhere and promises to improve our ability to analyze, visualize, and extract insights from data. Experimentation with ad hoc AI tools is being done across the data science and analytics development cycle to quickly generate basic visualizations and web apps from Python code. While this approach has created lots of excitement for analytics-as-code, users we speak to are finding that general AI code editors run out of steam fairly quickly on scenarios beyond trivial toy apps and prototypes. They’ve shared frustration with AI development reaching the point in a project where the AI is no longer effective for fixing bugs and entering a kind of AI debugging doom loop.
Generative AI can perform much better when applied in a more specialized way within an opinionated data app development framework and with context on the development workflow. That specialization can be realized through more narrowly-defined problem spaces with better context via RAG and by selecting custom domain-specific AI models suited to specific tasks.
Bringing data apps into the AI age
Applying generative AI in this specialized way, Plotly has introduced Plotly AI, an innovative set of capabilities empowering data teams to chat, code, or click their way to building interactive Python data applications. By incorporating generative AI, Plotly AI simplifies and accelerates the process of creating data and AI applications and interactive visualizations, making it more accessible to users at every level.
In the past, crafting interactive data applications in Python required some rudimentary coding skills and knowledge of a set of libraries and frameworks like Plotly Dash. Today, AI lowers the barriers to getting started but can quickly lead into the AI debugging doom loop due to the combined issue of the knowledge gap of the developers and the AI’s lack of context on the specific libraries and frameworks being used. To address this gap, Plotly AI introduces AI-assisted development adapted specifically to Plotly data visualizations and Dash data application development resulting in higher-quality code generation, fewer hallucinations, and a seamless integrated experience to keep developers out of the AI debugging doom loop.
What is Plotly AI?
Plotly AI is a set of AI-enabled capabilities seamlessly built into Plotly products that helps data teams analyze data faster and create production-quality, interactive Python data applications using Plotly. Dash developers can also embed a chat experience for the users of the data applications they create using the Chatbot Builder and more quickly answer questions using the Ask AI documentation bot. Together, these are the growing ways Plotly AI is enhancing the use of Dash open source and Dash Enterprise.
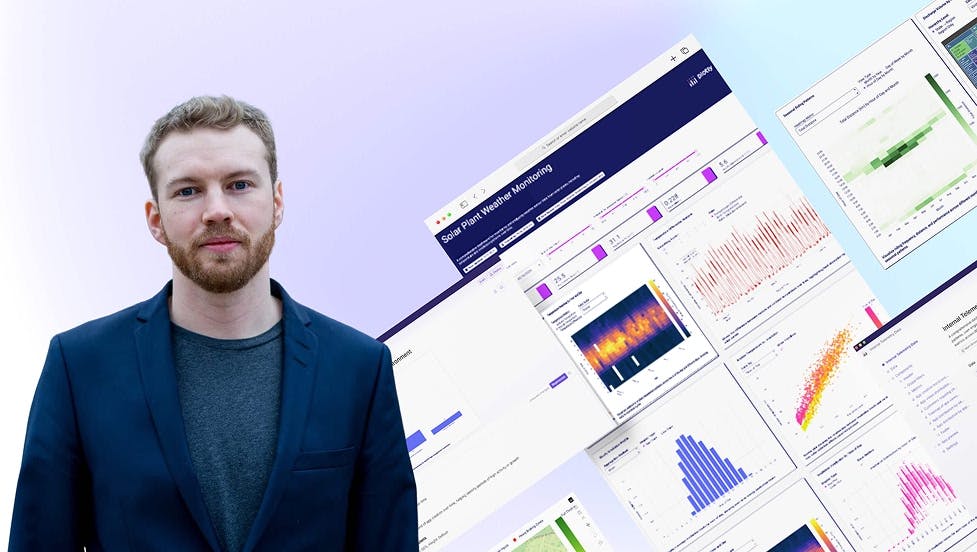
Plotly Studio for agentic analytics: Generate apps with AI in under two minutes
AI is changing how teams build data apps. Our new Plotly Studio, in early access, turns datasets into production-grade, interactive data apps in under two minutes by removing the need for scaffolding, setup, or manual layout. It gives anyone the ability to gain advanced insights while still producing clean, editable code for developers or Python enthusiasts. Dash Enterprise manages what comes next: deployment, authentication, version control, and scaling across teams; with the alternate option to publish easily with Plotly Cloud as well. This platform help teams move faster without cutting corners. Apps built this way become part of how decisions are made and shared across the organization.
Chris Parmer, Plotly Co-Founder and Author of Dash, introduces Plotly Studio.
Custom AI chatbot integration
One of the standout features of Plotly AI is the ability to embed custom AI chatbots into data applications. These chatbots, powered by large language models (LLMs), provide users with conversational interfaces to interact with data. This means users can ask questions and receive insights in real-time, making data exploration more intuitive and engaging. Moreover, these chatbots can be tailored to align with a company's brand identity, ensuring a seamless user experience. Plotly customer Broadband Insights recently demonstrated their use of the Plotly Chatbot Builder.
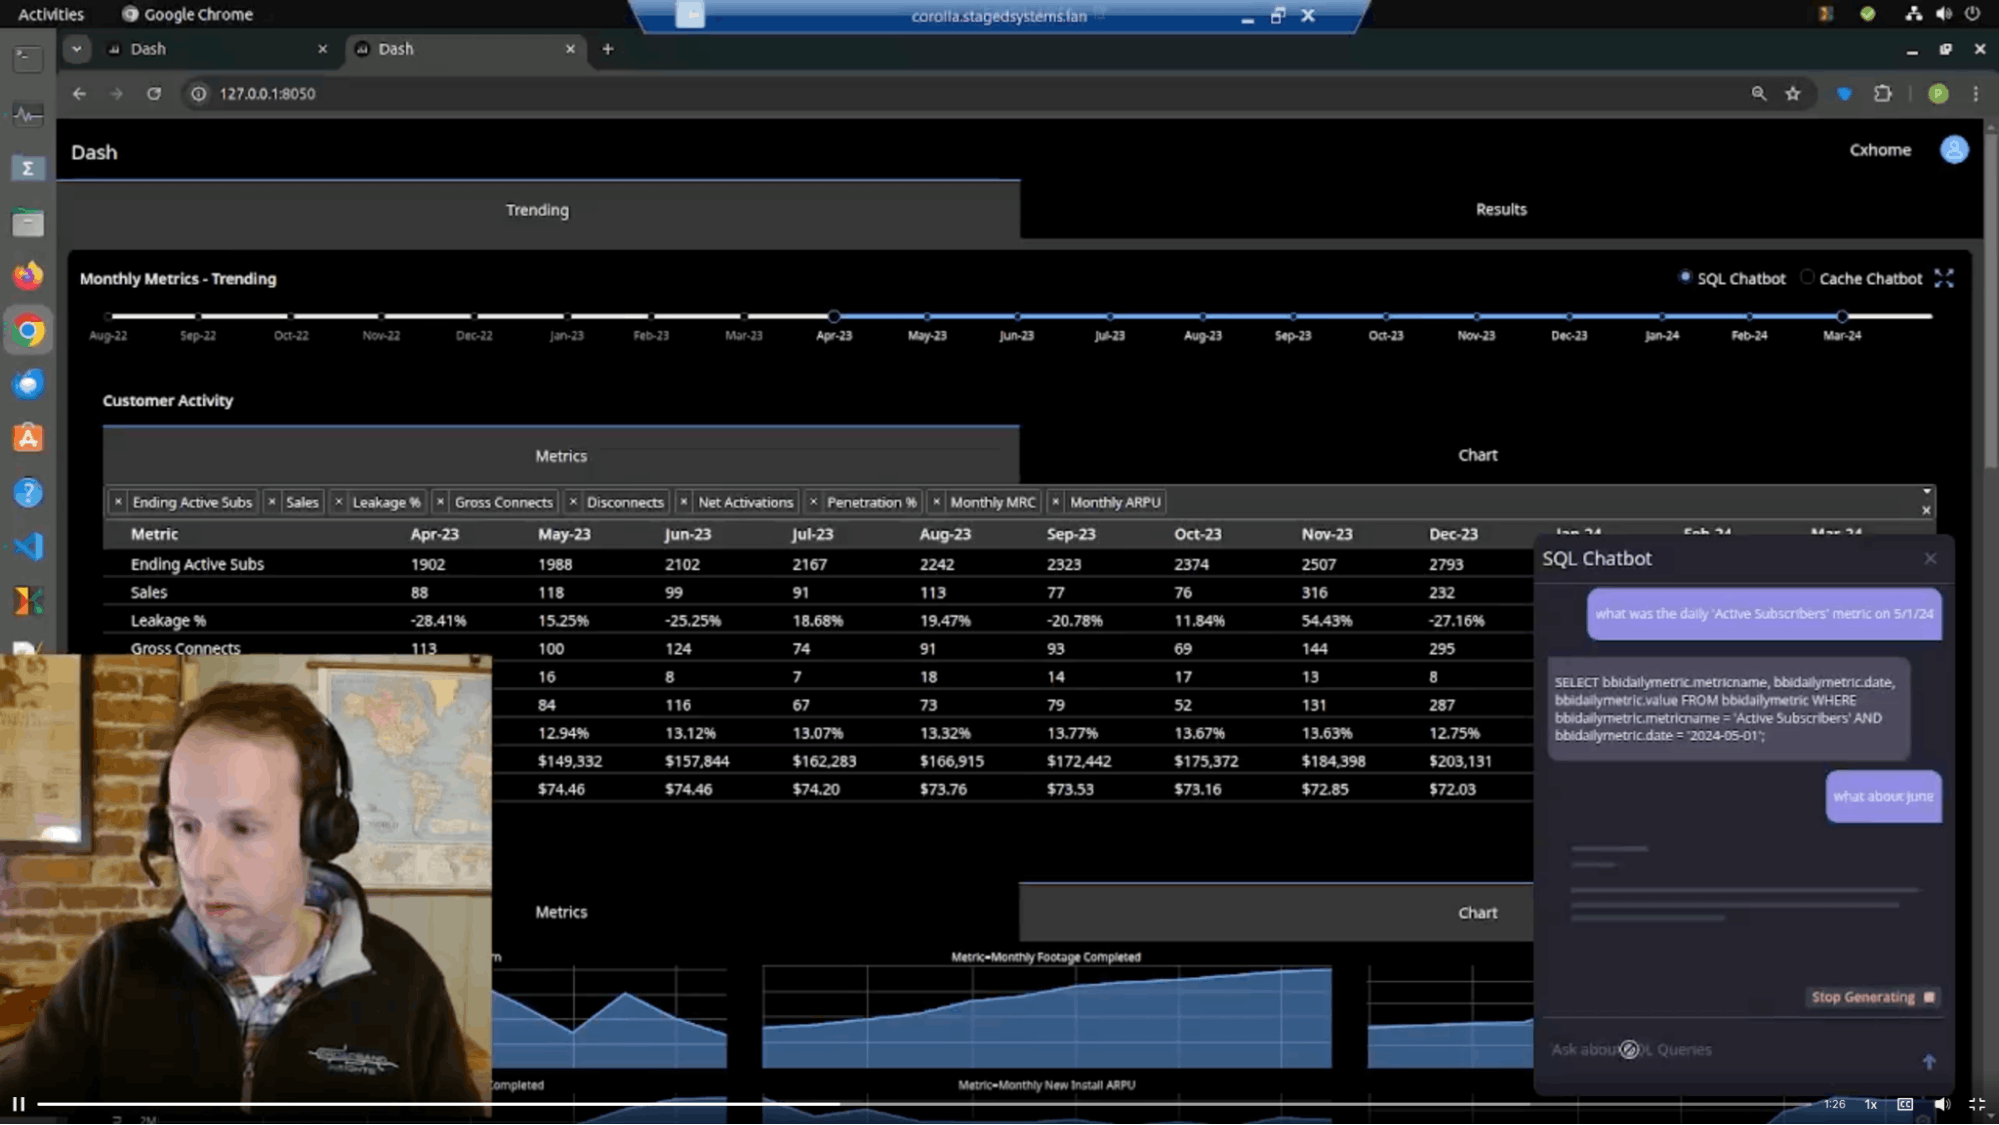
The Plotly Chatbot Builder in a telecom data app. Watch the full demo here.
Plotly AI also includes AI-powered documentation chatbot capable of answering complex queries and learning from user behavior over time. The feature is available as a free-to-use “Ask AI” chatbot in the open-source Dash and Plotly graphing library developer documentation.
What are the benefits of Plotly AI?
- Provides higher-quality code suggestions than general AI coding editors and additional ease-of-use
- Broadens the access to data analysts and other roles on the team who may be less comfortable with analytics-as-code with Python and the Dash framework
- Offers the ability to scale with AI securely to production with one-click deployment, cloud platform scalability, and application embedding
- Simplifies data app development while providing the full flexibility of code
What’s next for Plotly AI?
The introduction of Plotly AI marks a significant milestone in the evolution of data visualization and data application development. As artificial intelligence continues to advance, tools like Plotly AI are poised to become indispensable in the data scientist's toolkit, enabling more efficient workflows and deeper insights. The emphasis on natural language interaction signifies a shift towards more intuitive interfaces, democratizing access to data analytics and empowering a broader range of users to harness the power of their data.
Learn more and try it yourself
Watch our recent webinar to learn more about AI in Plotly Studio and get started generating data apps with AI.