Gamuda develops tunnel boring machine IoT solution with Dash Enterprise
Industry
Manufacturing, Energy & Utilities, Technology & Software
Infrastructure
GCP
Summary
- Innovative engineering solution provider pairs Python and Plotly’s Dash with sensor data to build a real-time monitoring solution for the world’s first Autonomous Tunnel Boring Machine (A-TBM) offering.
- Dash helps accelerate digital transformation and innovation strategies with a custom, flexible alternative to restrictive, domain-specific legacy software.
- Interactive Dash applications are being developed to accommodate algorithms that capture preventative maintenance insights and address human pain points in data reporting processes.
Introduction
You’ve heard of driverless cars and delivery drones, but what about humongous drills? Tunnel boring machines (TBMs) move through the earth beneath some of the planet’s busiest cities and have recently joined the list of tech that “thinks” for itself.
The world’s first autonomous tunnel boring machine (A-TBM) was developed in early 2019 by Gamuda Berhad, one of Malaysia’s largest infrastructure companies. Some of their key accomplishments include the world’s first Stormwater Management and Road Tunnel (SMART) which houses a motorway and stormwater drain, and the tunneling for Malaysia’s first mass rapid transit (MRT) system. At the heart of major projects like these are TBMs capable of drilling large tunnels six meters (20 feet) in diameter beneath the earth’s surface.
A-TBMs are outfitted with different sensors that collect data and enable operators to program drilling to a very precise level — they can measure within one millimetre of accuracy. While drilling, the A-TBM has a margin of error of 100 millimetres, in which much can go wrong: public trust, project success, expensive equipment, and personnel safety are all at stake.
"We are committed to advancing innovation in tunnel boring, and ‘fail fast’ is our mantra. Python and Dash let us experiment quickly to find solutions that really please people and add value to what Gamuda can offer."
John Lim Ji Xiong, Excellence Transformation Team Lead, Gamuda
Challenge
In the tunnel boring industry, several incumbent software systems are commonly used. When A-TBM development began in mid-2018, John Lim Ji Xiong, a senior R&D engineer, started using the Plotly Python graphing library to interactively chart data analyses that he could share with his management. As the lead of Gamuda’s Tunnel R&D team, John was on the lookout for new and better approaches. By 2019, John and the R&D team knew they wanted to create their own custom software to track and monitor TBMs as they drilled underground. “The existing software we bought was expensive and didn’t give us the insight we wanted. The interface was old and clunky, not based on React. It was hard to graph a chart, for example, and it took a long time to plot a simple X and Y axis. We wanted something we would really love and appreciate internally.”
The R&D team, all mechanical engineers conversant in Python, quickly developed an awareness and appreciation for Dash, which John discovered while visiting the Plotly website.
A basic pain point of the legacy software affected everyday operations at a human level. The existing solution was only available on a single computer in the office, and each phone call from management requesting information on location, timing, or speed required someone to get up, go to the computer station, search for, and compile the information. This made progress reporting very difficult. The team wanted to make it much easier for A-TBM operators and management to access current drilling data whenever and wherever they were, whether at home, in the office, or at the A-TBM itself.
Another pain point was advanced monitoring. As an advancement from simply graphing A-TBM sensor data, the R&D team wanted to develop algorithms that would identify trends and patterns. The existing solution’s vendor indicated that such customizations would be costly and required six to 12 months to deliver—time enough for Gamuda to have already finished a significant amount of tunneling work. Faced with these challenges, the R&D team wasn’t convinced that they couldn’t produce something better for themselves.
Solution
By the time John’s team discovered Dash, most of the drilling at their active project site was complete. Two of the 10 TBMs were still active, with 10-15 tunnel engineers and on-site staff requiring access to insights pieced together through so many phone calls and runs to the single computer station. To deliver an innovative analytic solution to this relatively small audience in a short period of time, the R&D team knew they were limited to their present resources and Python knowledge. “The easiest thing to pick up and learn was Dash,” said John. “It helped us to build things fast, and we were able to test ideas ourselves instead of paying a vendor to do it. We could take an idea, try it, and within a day or a week, we’d have something.”
In John’s case, that something began to pay off. Dash enabled the team to take a speedy, fail-fast approach to solving important problems. For example, damage to the drill head is expensive and delays progress. Engineers inside the body of the A-TBM can often hear a particular noise when the part is damaged. The team thought microphones or vibration sensors positioned behind the bulkhead could provide useful data inputs to enable a more predictive maintenance approach. However, they struggled to gain good data from these sensor types. Knowing this, they moved on to another approach.
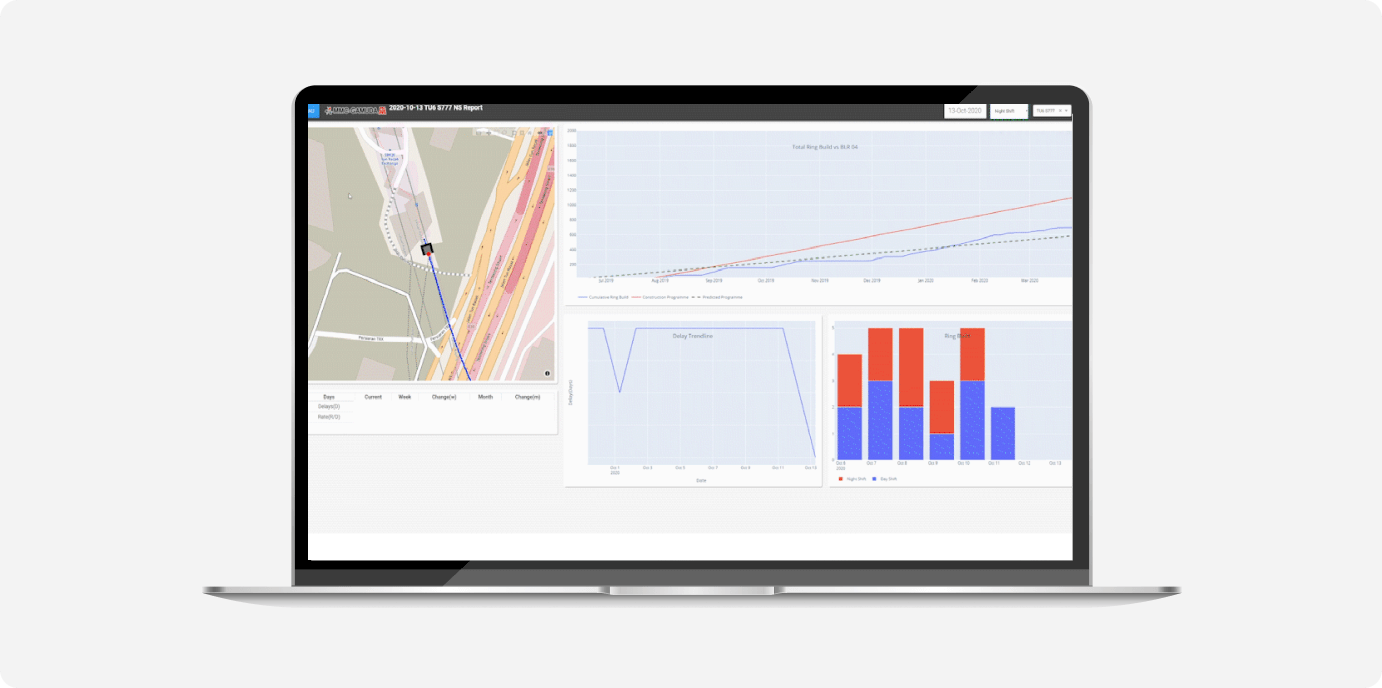
This time, they used Dash to track in real time how much torque was detected by sensors in the drill head. As the project neared completion, drilling operators noticed more breakdowns occurring. Retrospectively comparing these breakdowns to the data indicated that the Dash application had picked up spikes in the data correlating with subsequent breakdowns. Due to shift changes, drill operators were missing the “big picture” in the data over time. The team presented this finding to management, who were pleased with the lesson learned and have since been updating the Dash application to detect and flag these spikes for future projects.

Drilling operations in dense urban areas also take into account Internet of Things (IoT) sensor data from nearby buildings to prevent structural damage and disruption.

Gamuda’s solution, built with Dash, takes advantage of modular visualization components that enable them to create mapping and real-time charting of A-TBM sensor data and progress.
Results
Momentum from the project led to the creation of a new, organization-wide innovation outfit, the Gamuda Excellence Transformation team (GET), which John now leads. Gamuda continues to make incremental changes like these that improve their Dash interface with A-TBM operations. The company is already bidding for future projects where systems that include their Dash application capabilities will be much more than a “nice-to-have.” They see Dash as adding value and differentiation to these bids, where Gamuda is able to propose their own bespoke solutions that incorporate not only sensor and drill tracking but also environmental and resourcing analytics.
About Gamuda
Gamuda Berhad is an engineering, property, and infrastructure company based in Malaysia. It is one of the largest Malaysian infrastructure companies, with a proven track record of delivering innovative breakthrough solutions worldwide.


