
Danielle Oberdier
April 24, 2023 - 8 min read
Want to Learn Python? Excel Can Help!
When it comes to processing large amounts of data, Python wins the pot. But robustness comes with a lot of questions. Where’s the best place to start? What should I google? If mastering machine learning is my goal, how can Python best get me there?
When tackling a new challenge, a familiar tool can prove a vital asset. Read on to learn how the hours you’ve spent learning Excel may be more helpful than you ever imagined in learning your newest programming language.
Start At The Source
I’m pretty sure we can all agree that no relationship thrives one-way. So when we talk about Excel and Python’s pairing up to make your programming knowledge more official than ever, let’s start by acknowledging how both languages can fill each other’s gaps.
Python Needs Context
Concocting data frames and pulling summaries may not be glamorous, but they are a great place to start building a solid foundation with Python. And what could be better at providing a sounding board for new learning than familiar Excel? Even in the face of new innovations, Excel has not lost popularity amongst programmers as more than 1 in 8 people worldwide use the tool.
However…
Excel Needs A Face-Lift
It’s no secret that Excel functions could benefit from a little modernization. And flexible Python may be the one to provide. Take it from me: no matter how advanced I’ve gotten in Python, nothing beats embarking on a new project with a fresh Excel spreadsheet. Leave it to Excel to prove that “in the new” does not have to mean “out with the old.”
How Does Python Deal With Excel Data?
Loading Excel Data into Python
Enough talk. Let’s scrub in. How exactly does an Excel spreadsheet morph into a Python script?
Many tutorials will direct you to the open source Python package pandas to commence your work with Python and Excel. This approach is definitely worth exploring, but for a first experience with Excel, Python and automating between the two, openpyxl is more seamless. You can install openpyxl using the following command:
pip install openpyxl
Now that openpyxl is installed, you are free to load your Excel file of choice (we’ll call ours book.xlsx) into Python:
from openpyxl import load_workbookwb = load_workbook(“book.xlsx”)
Our ultimate goal is to make this Excel workbook into an interactive file that can be updated and saved at any time. Excel workbooks often have many sheets, so the first step is to define the sheet that holds your data as an active sheet:
sheet1 = wb.active
Exporting to Excel
Now that you’ve activated the sheet that holds your data, you will want to save it as a new Excel file as follows in order to proceed with automation:
wb.save(“autobook.xlsx”)
You now have a new Excel workbook with your data on an active sheet, ready for the next steps. To actively follow along, you can work within this spreadsheet from Plotly’s GitHub for the upcoming steps.
Can Python Be Used to Automate Excel?
If you’re reading this tutorial, chances are you have been given a task involving Python, Excel and some form of data analysis. Though the capabilities of Python to reinvent an Excel spreadsheet are seemingly endless, the main advantage to automating Excel is ensuring that any commands in your Python console still work even if your spreadsheet’s data is altered.
Automating Excel Data With Python
Defining the sheet that holds your data as active solidifies the connection between your Python console and Excel.
The next step is to pinpoint the actual active cells in our pivot table and define them. This ensures that Python can access the mapped area and fulfill its commands even when data is added and removed.
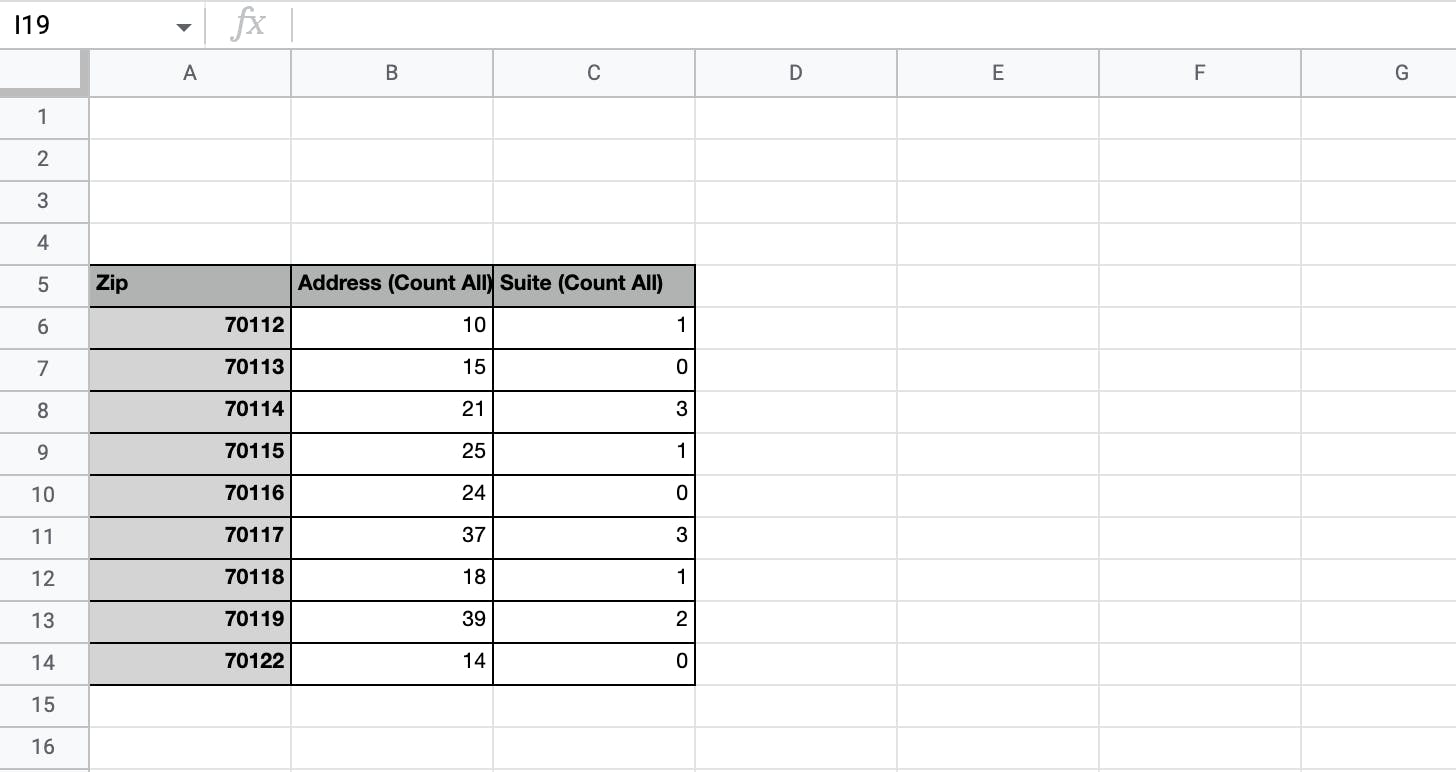
The above image shows a sample table that lives within the larger Excel spreadsheet we’ve defined as autobook.xlsx. The data itself comes from The City of New Orleans’ open data portal. The cells that encompass this table are the cells that we want Python to identify as active. We will select these cells using minimum and maximum column and row functions from openpyxl as follows:
min_row = wb.active.min_rowmin_col = wb.active.min_columnmax_row = wb.active.max_rowmax_col = wb.active.max_column
In this case, if you were to print the four variables you just created, you would get these values:
min_row: 5min_col: 1max_row: 14max_col: 3
If you visually compare these values to the rows and columns defining the data set above, you will see that the minimum and maximum values serve to highlight the area of the sheet we want to update automatically (i.e. the table starts at row 5 in the spreadsheet and ends at row 14).
As soon as you save our work using the command wb.save(), you can rest assured that your active cells will update in both your Excel and Python environments as new data is added or removed. We will prove this in detail in the next section.
Writing Excel in Python
The clearest way to see how Excel and Python interact is to actually write Excel formulas directly into your Python console. The simple formulas you have studied to calculate sums and averages in Excel are easy to implement into your Python console with openpyxl.
How Excel Formulas Integrate With Python
Say you want to input the total number of addresses in the table into cell B15 in the image above, you could write your code as follows:
sheet1[‘B15’] = ‘=SUM(B5:B14)’
The sum of the current B column, 203, will print into cell B15 and update accordingly as the values change, just like it would in Excel. Seeing the syntax overlap between Excel and Python in this way further proves that their interactions can prove useful for data manipulation.
How Python Automates Excel Spreadsheets
The main priority here is to prove that our pre-programmed functions in Python still work when data is added and removed from our Excel sheets themselves. This is obviously a step up from writing formulas into individual cells.
The best way to validate that your Excel spreadsheet is automated is to write an Excel command in Python that uses the min col, max col, min row and max row functions you have already defined. The printed values of each variable will change as you manipulate the data in your Excel spreadsheet, but the commands will still run.
Say for example, one of your colleagues goes through your active sheet and completely rearranges not only the data provided, but also the formatting of your table as shown below:
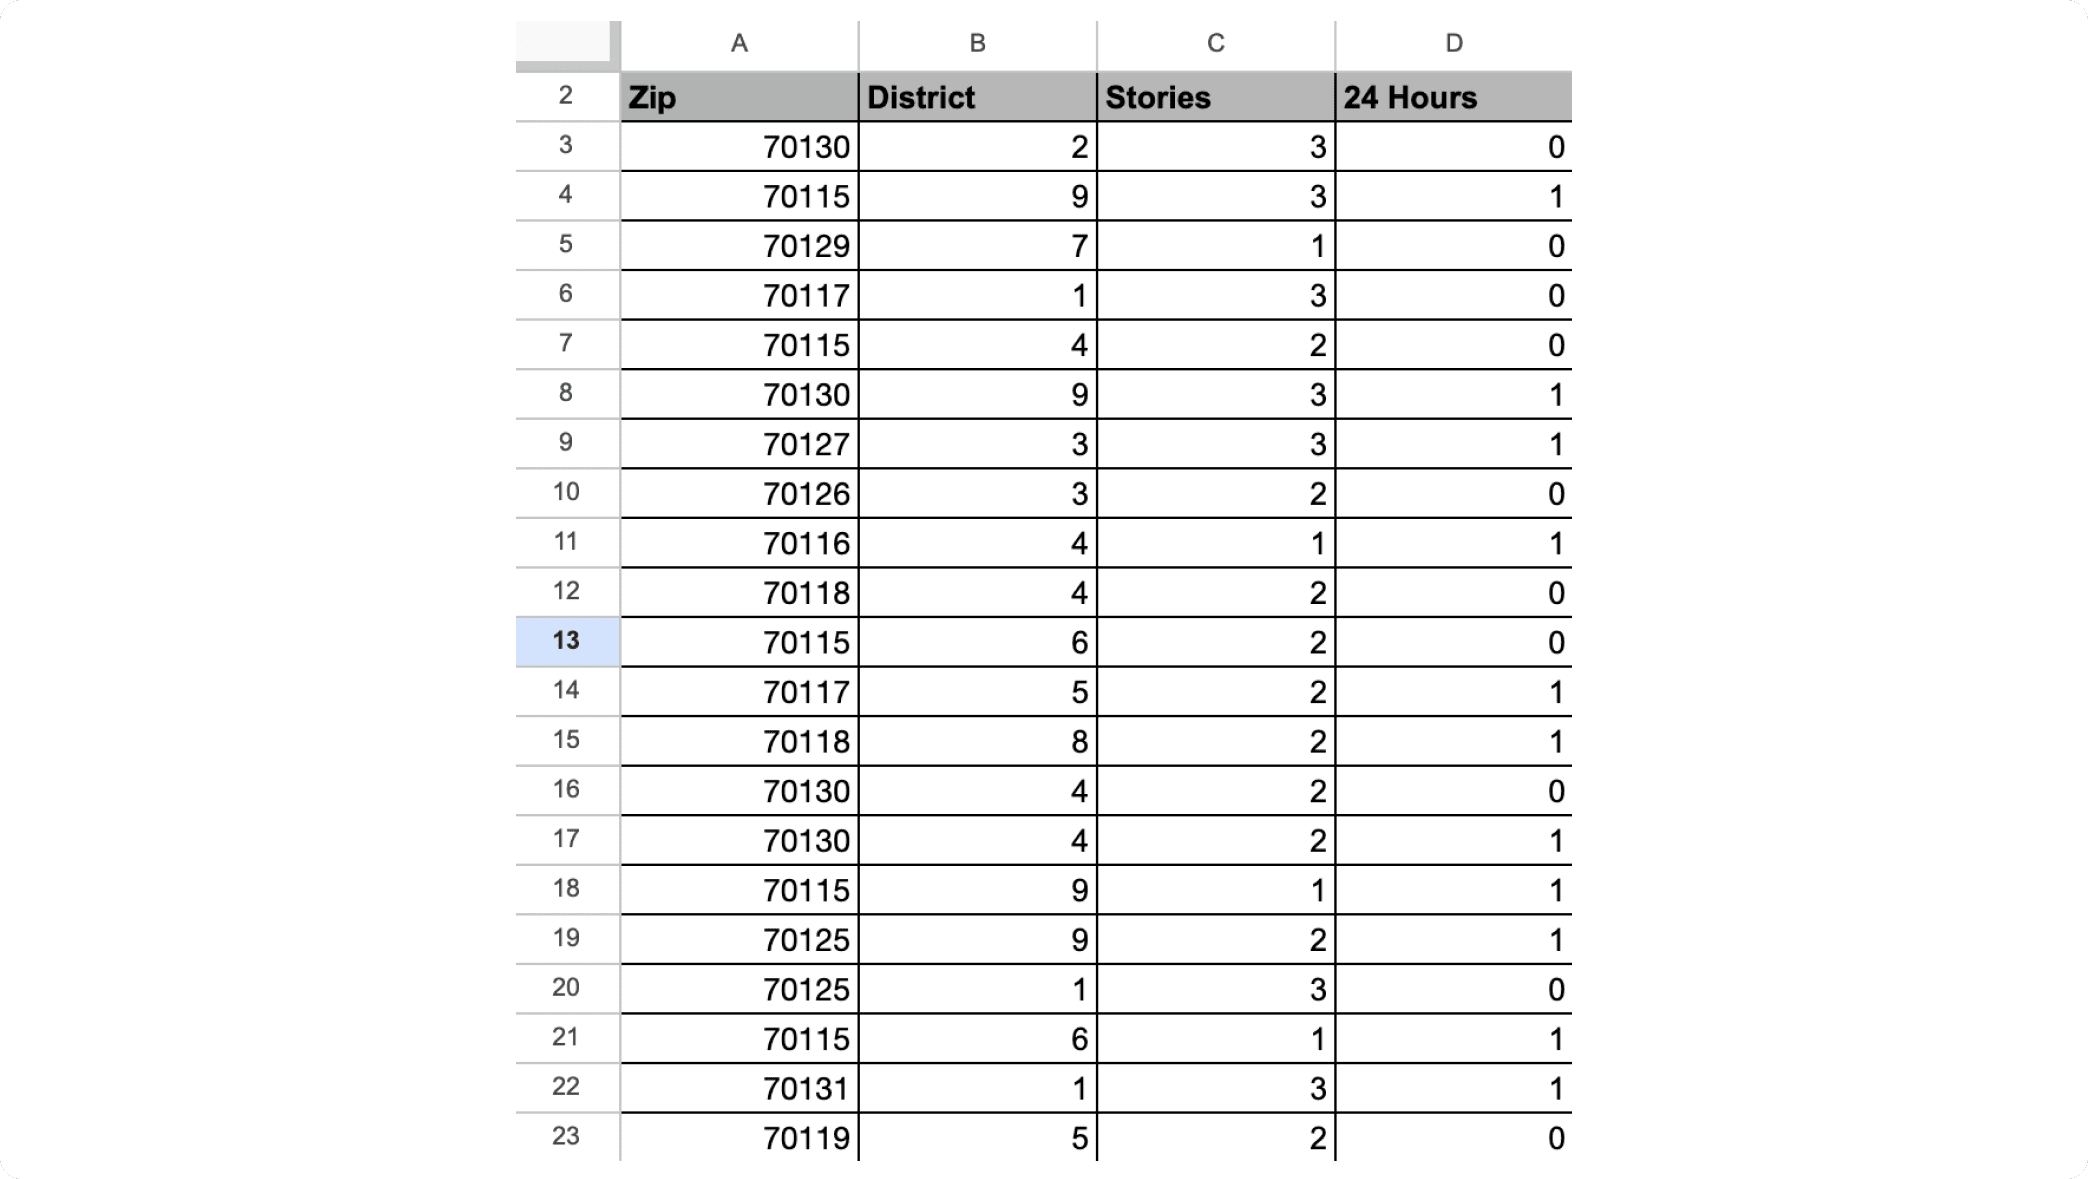
Now, if you were to print the four variables you created in the previous section, you would get these values:
min_row: 2min_col: 1max_row: 23max_col: 4
As you can see, openpyxl is able to adjust the actual values of your table’s limits, meaning that you can go in at any time and conduct data analysis quickly from your console with the same commands you have been using all along.
There are many ways you can elaborate on the foundation you’ve built through this exercise and use it for applied data analysis. The most obvious is to try your hand at calculating some basic statistics on your data, observing how the Python commands consistently update in tandem with your spreadsheet. This tutorial from Pylenin.com provides excellent step by step instructions on how to capture your data’s trends using an iterative approach.
Another important task is to visualize your Excel data as a chart that can be automated in a similar fashion to the table. Visualizing data, in addition to fortifying the presentation of your findings, inspires your learning process. By turning lines of data into a solid image, you see your knowledge manifesting in a more tangible way.
If you’re ready to move on to this stage of learning, the Plotly Blog offers many resources for creating interactive data modules. Additionally, Plotly’s framework Dash leverages Python code in a user-friendly, low-code environment to help developers of all skill levels try their hand at building real apps.
Conclusion
In just the course of this blog, you have seamlessly traveled back and forth between Excel and Python. Though we mainly stuck to openpyxl, Plotly Express can also be effective in building a solid relationship between Python and Excel.
Ultimately, even the most complicated operations across programming languages often start from an xlsx file. By combining Excel’s simplicity and familiarity with Python’s efficiency and robustness, you have the best of two worlds.