
Elias Dabbas
July 28, 2023
Automating and Streamlining Digital Marketing Workflows with Plotly and Dash
Like many other fields, Digital Marketing is heavily dependent on data. Actually, no digital marketing work can be done without access to data, and without the ability to manipulate, visualize, process, and make decisions based on data. Having said that, there are many other skills and mindsets required to be a digital marketer, other than data skills. In other words the ability to work with data is necessary, but not sufficient for digital marketing.
In this series of posts I’ll be talking about how Data Science fits into a Digital Marketing workflow and what the available tools for that are. This series will be more practical than theoretical, where after laying out the main points and approach in the first post, we will be building special search and digital marketing data apps and dashboards using advertools and Dash.
Combining those apps together (with Dash as the front end and advertools providing the underlying functionality) can serve as a nucleus for a full digital marketing set of tools that can be expanded and customized as needed.
The apps will be open source, and you will have full access to use, run, make changes, and deploy those apps any way you want. If you want to scale those apps for a large organization; integrate with a large, existing infrastructure; or do more, you might want to consider the Dash Enterprise version which can help with those aspects of running apps on a large scale. We will go through the steps of building the apps, and discuss the various ways of running and deploying them.
Dash in the data app and dashboard ecosystem
To see where Dash fits among the various options for interactive data analysis and visualization, let’s consider the various levels of abstraction any tool can exist on, and put Dash on that “map”.
In software, many times we find various tools doing the same thing, but at varying levels of abstraction. Some tools are “higher level”, and some are “lower level”. My favorite analogy for this is the three different approaches for having a pizza:
- Ordering approach: Call a restaurant, get the pizza, and start eating.
- Supermarket approach: Go shopping for ingredients, cook, chop, bake, serve, eat.
- Farm approach: Plant tomatoes, raise cows, milk them, produce cheese, and so on.
The trade-off involved here is as follows: as we go to higher levels of abstraction (toward the ordering approach), things become easier, more convenient, less complex, and require much less knowledge than at lower levels. At the same time, as we go higher up we lose power, flexibility, and the ability to customize the pizza. The unit prices go considerably higher as well.
The opposite happens at lower levels of abstraction. We get much more power and flexibility, at much lower unit cost. The price we pay is that we need much more knowledge, and we need to handle much more complexity.
The challenge is to select the tool that is at the right level of abstraction for the task at hand. I believe this is also the essence of product management. A great product gives its users the right type of options, and hides away the things that they most likely won’t need.
So why is Dash at the right level of abstraction? Because it enables data analysts with little programming knowledge and a good sense of data to build dashboards easily and flexibly. Before going further, let me also differentiate between programming and software development/engineering.
Both include writing code, but the objective in programming is to simply write code to complete a certain task. Software development is more concerned with writing code, testing it, documenting it, packaging it, versioning it, deploying it (and much more), with the intention of having others use that (productized) code. The skills required for programming are limited to knowing your tasks well, organizing your thoughts, and knowing the syntax and features of your programming language. In other words, programming is available to hobbyists, while software development/engineering is not.
If you know some programming, then you can create great Dash apps and dashboards. This is why Dash is at the right level of abstraction.
Exploring a Dash minimal example
Let’s explore a concrete example, and see how much code is involved in creating a simple app, versus how much natural language is involved in telling someone else to code it for you.
Full code
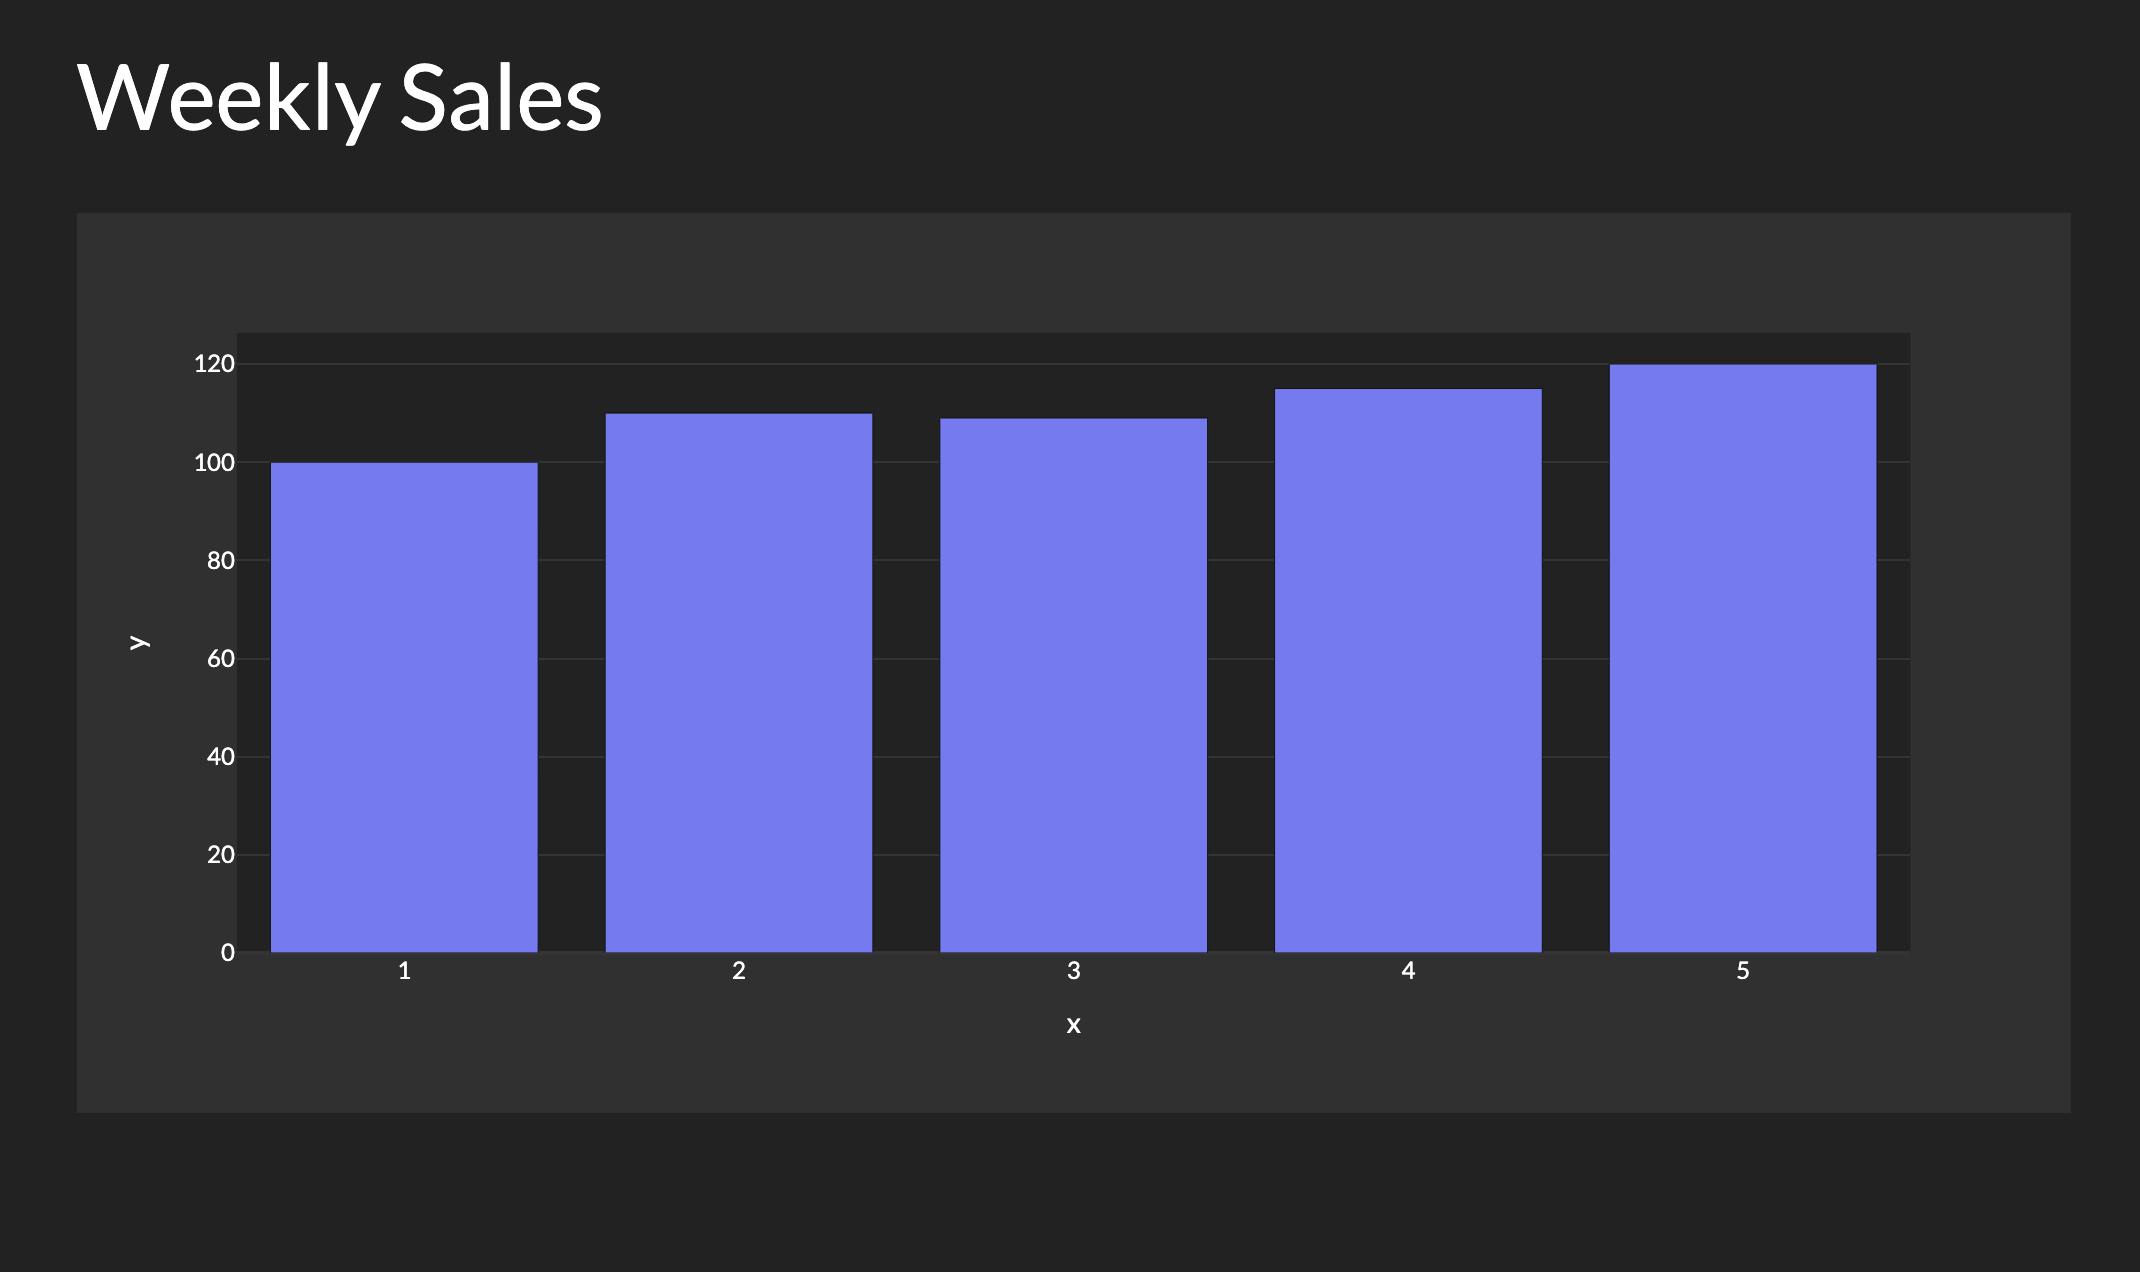
from dash import Dash, dcc, htmlimport plotly.express as pxapp = Dash(__name__)app.layout = html.Div([html.H1('Weekly Sales'),dcc.Graph(figure=px.bar(x=[1, 2, 3, 4, 5], y=[100, 110, 109, 115, 120]))])if __name__ == '__main__':app.run()
As you can see, it’s more efficient to simply code the app than it is to ask someone to do it (with even more words than code!). Of course, in many cases your code can be much more expressive and efficient than even expressing what you want with natural language. Furthermore, with the mindbogglingly fast developments in large language models, there will be many cases where an LLM can even produce the code for you, and you can edit and double check that it works as intended.
Creating Dash Apps with ChatGPT
A quick test with ChatGPT shows how easy it is to create a Dash app.
My prompt: create a Plotly Dash app that has a drop-down menu of all weekdays, and display the user's choice as follows: "You chose: <day>"
I copied and pasted the code as-is, and ran the app, which worked as intended.
Exploring the changes in data in the digital marketing field
In digital marketing, there are various high-level tools that are very easy to use, which are very good at answering more than 95% of your questions. What makes our job important and relevant is our ability to answer the other 5% of questions. Some of these “5% situations” are: very specific cases, an unusual combination of factors, a large amount of data that simply doesn’t work on the default interface, combining data from various sources, and many more situations that require us to dig deeper and further than what the default UI provides.
The general trend has been a massive increase in the number of data sources, as well as the amount of data from each source. Fifteen years ago, you simply had Google Analytics, Google Search Console, Google Ads, and probably another special tool’s data.
Now, even a small company with a website and an app use at least the following:
- Google: Analytics, Ads, Search Console
- Facebook/Instagram: Ads, Insights
- Twitter: Ads, Analytics
- Mobile: Analytics
- Play store: Analytics
- Mobile Apps: Apple App Store
- SEO: Moz, Semrush, Ahrefs
The list never stops expanding. This is not to mention other special data sources that any company/website might have, like server log files, CRM data, open data about various things that affect the business.
With this open buffet of constantly moving and constantly expanding data sources, the situation can be as overwhelming as a regular food buffet, and might hurt your stomach!
In a short period of time, we have gone from begging for as much data as we can get our hands on to the present situation, where it is so overwhelming that we want less and less data (the right data of course).
This debacle is similar to what doctors face for example. While there are potentially unlimited things to measure in a patient’s body, the expert doctors go through a special algorithm, and determine the six or seven relevant metrics that are important for the current situation. This decision making is not only informed by doctors’ data analysis skills: it is also guided by the specialized knowledge about their specialty.
We do something similar, and because we work with a very large number of data sources that is constantly evolving, we want a set of great tools.
Defining a great tool can be done in various ways, and in the data world, a great tool might be one that provides insightful charts, actionable insights, and findings. All definitely important stuff. But another more important feature is that a great tool allows us to ask any question we want about our data. Dash is one such tool.
Another one, specifically for SEO, SEM, and digital marketing is advertools. This is a package that I created for fellow digital marketing people, as well as data scientists working in the field.
When I started learning data science, I read a lot of buzz about how machine learning and artificial intelligence is transforming the field. Most of it was about how the big companies are using AI and ML to optimize campaigns, ad clicks, and run large-scale operations. Great, I thought, but what about me? On a random Tuesday afternoon, when a client or a colleague calls me and asks a question or has a request, how is that useful for me? Seeing a large number of specialized open-source packages for many different fields, I was surprised to not find as many packages for SEO. Many exist for web developers to assist in building search-friendly websites, but most are not for the marketing person. So I started building one such package.
The advertools approach
Advertools is a package and command line tool aimed at digital marketers and covers many daily use cases and tasks including crawling websites, generating keywords for SEM campaigns, analyzing XML sitemaps, and more.
Advertools follows the Unix philosophy in its approach. One of the main tenets of this approach is to create tools that do one thing, and do it well. Following the same approach, advertools functions do one very specific thing each: there is a function that extracts hashtags, one that converts an XML sitemap to a DataFrame, another that crawls a website, one that tokenizes text, and so on. These tools are designed to work in many possible sequences, but they can each function independently.
Another important element of the Unix philosophy is to build programs that assume that the output will be used by other programs. Pretty much all of advertools functions return a DataFrame, or a file that can be read into one. Once you have a “tidy” or “long form” DataFrame, you have the full power of the entire Python data ecosystem to do further work with that output. You can plug that output into another advertools function, use Plotly to visualize it, or run a machine learning algorithm on the data.
In order to play well with other tools in the ecosystem, Unix programs are encouraged to use universal format that other tools can use, text in that case. In the data ecosystem, the DataFrame has proven to be that universal format, and advertools aims to play well within that system by providing a DataFrame in almost every function.
Using advertools - an example
Let me quickly illustrate this logic with a typical workflow for SEO and website analysis in general:
- robotstxt_to_df: Convert a robots.txt file to a DataFrame.
- sitemap_to_df: Using the available sitemaps listed in the robots file get all available sitemaps, combined into one DataFrame.
- robotstxt_test: A bulk robots tester which can be used to check if you have any URLs in the sitemap that are blocked by the robots file’s rules.
- crawl_headers: Taking URLs in the sitemap this function makes bulk concurrent HEAD requests to check the status codes of a list of known URLs.
- crawl: One of the most important functions, and can be used to crawl the whole website with one line of code. It also provides lots of options to manage the crawling process, like concurrent requests, crawling speed, which links to follow, what special items to extract from the crawled web pages, and much more.
Once you have crawled the website and extracted the content you want, the possibilities are endless. You can collect numeric data like prices, or salaries from job-listing websites. You can run various NLP algorithms to analyze, understand, and eventually generate data. Of course you can do so with competitors, and you are only limited by your imagination in what you can do.
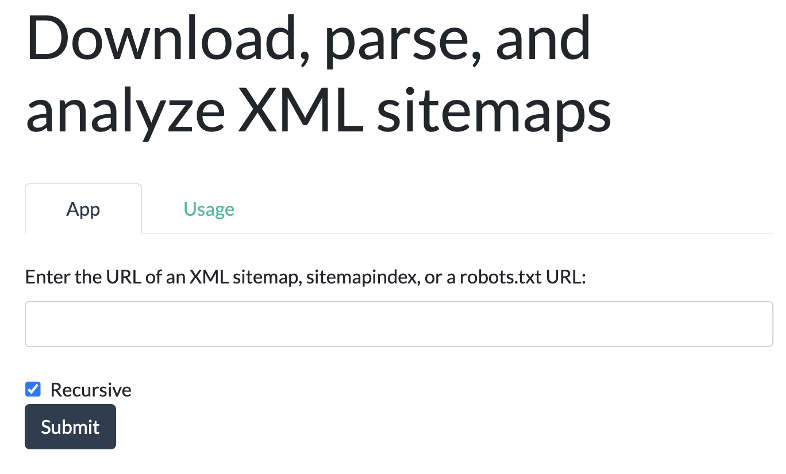
The next phase of evolution of those functions is to give them a visual interface so they become user-facing, no-code products that can be used by a non-technical audience. If you can code, they can be low-code tools for you to start with and customize, any way you like. This is where we will use Dash to give advertools a user interface. To give you simple example, here is the signature of the sitemap_to_df function:
adv.sitemap_to_df(sitemap_url, max_workers=8, recursive=True)
The sitemap_url can be a normal sitemap, a zipped one “.xml.gz”, a sitemap index, or even a robots.txt URL. The function can retrieve them all and combine them into one DataFrame. Because sometimes you just want a single sitemap, or you just want to analyze a sitemap index file, you can set recursive=False. You also have the options to set the number of concurrent requests to send with the max_workers parameter as shown.
The programming interface can be ported to a graphical user interface with Dash, like this:
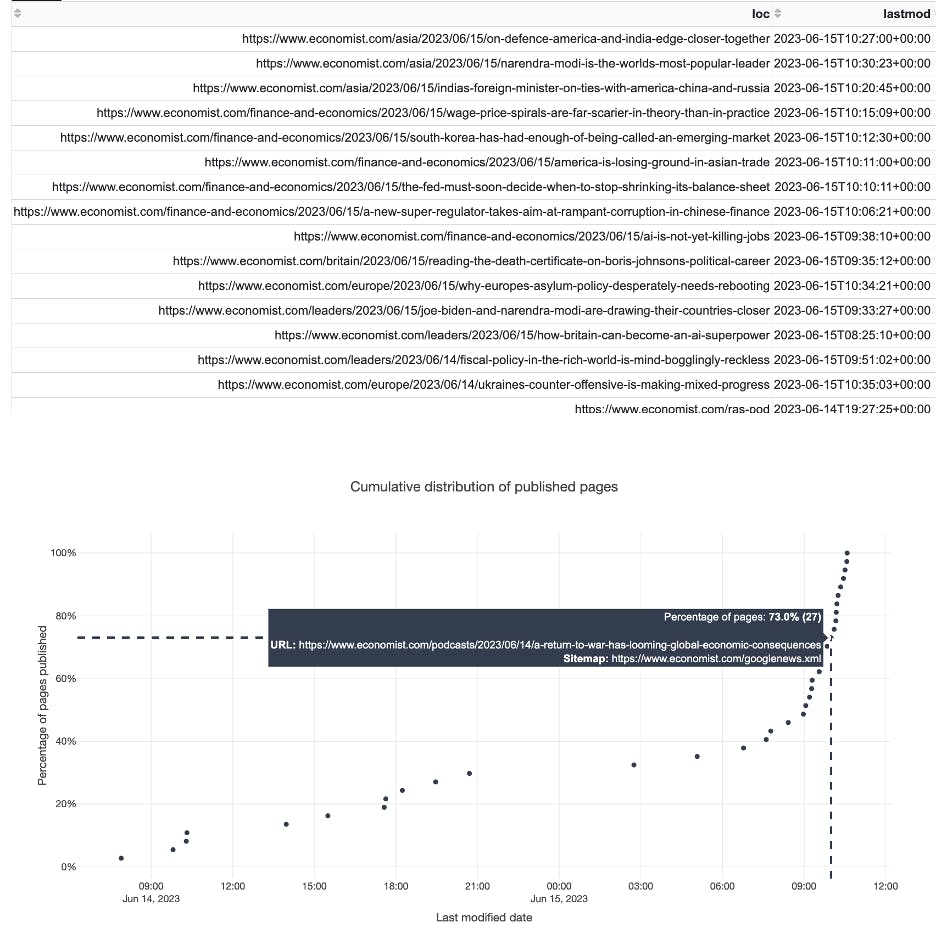
While in Python this function returns a DataFrame, we can go further in our app, by providing a chart about our URLs and their publishing frequency so we can analyze publishing trends. Here you can see the URLs of the Economist’s Google News sitemap and when their publishing trended faster upwards for this small dataset:
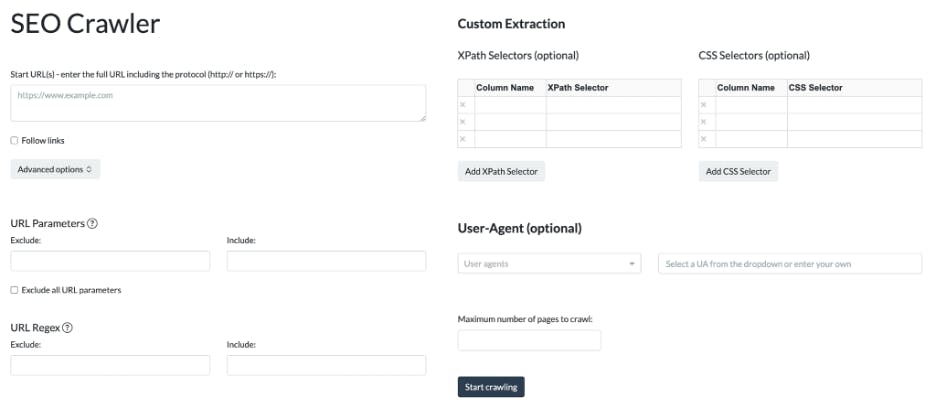
A more elaborate function, crawl, with its many extensive options can evolve into a proper no-code SEO crawler:
With the crawled website data, containing dozens of columns, we can create many interesting and interactive visualizations to gain insights on the sites that we crawl.
This is exactly what we will be doing with the Dash apps that we will be building in the following articles in this series. We will take a function (or a set of functions), and build a workflow around it. With Plotly’s visualization capabilities, and many other tools in the PyData ecosystem, we can build some really cool apps. You’ll then use them, modify them, and improve them as you like.