
Predictive Analytics at Multinational Telecommunications Firm Accelerates Digital Transformation with Dash Enterprise
Industry
Telecom
Summary
- A major telecommunications conglomerate used Dash Enterprise to develop a Python-based analytics platform that includes eight data applications, a flexible Dash Python framework, and a modular approach to analytics workflow.
- Using Dash Enterprise, various teams — Finance, Marketing, and Analytics — now have access to multi-millions of data records, a granular understanding of internal ROI, and speedier decision processes.
- Building and deploying an analytics platform with Dash Enterprise also enables consistent KPI calculations, a 1-week turnaround of ad hoc requests, and a repeatable cadence for analytics tasks, saving 7 to 10 days of data scientists’ time each month.
Introduction
Predictive analytics is a changemaker within the telecommunications group. By developing and delivering new tools and platforms to internal stakeholders, the team is moving away from traditional business intelligence toward Python-driven machine learning and AI methodologies, enabling C-level executives to derive insights from complex analyses in real time.
To build and deliver these tools, the group chose Dash Enterprise for its value in accelerating time-to-delivery and insights.
“Predictive analytics is at the forefront, leading digital transformation within the leading telecommunications conglomerate. By building and deploying powerful tools to internal customers at the highest levels, we are reducing analytics processes from 2-3 months to sometimes a single week. Dash Enterprise has enabled what was previously impossible for us.”
Challenge
Company executives across multiple business areas required tools to support and accelerate everyday decisions with data-driven insights:
- Marketing executives wished to perform complex “what if” analyses to understand the sales revenue impact of different promotional campaigns and pricing strategies.
- The CFO needed to quickly review and understand which business case models drive value across thousands of customer segments, promotional campaigns, and regional channels, to optimize the company’s internal investment strategy.
- 3 months’ time-to-insight for internal customers in Finance and Marketing, using workflows based in SQL and Excel and visualizations with traditional BI software.
- 7- to 10-day lead times for monthly manual customer segmentation analysis reduced the time data scientists could spend on furthering new areas of analysis.
- Lack of standardized calculations led to inconsistencies in KPIs and business metrics from month to month.
Solution
The analytics team developed an analytics platform, powered by Dash Enterprise, to deliver powerful data applications to internal customers in the conglomerate’s marketing and finance organizations.
- 8 data applications deployed in production, with more in development.
- Flexible Dash Python framework — as multiple analytics use cases developed, including upgrades, deactivations, cost and revenue, and network usage, individual data apps were combined to allow more complex analyses.
- Modular approach to analytics workflow — the Data Pull app formulates and executes complex SQL queries, while the Visualization app shows historical and predictive cohort performance trends across different use cases.
- Standardized KPI calculations — the Data Pull app provides a repeatable, standard way of querying and calculating business metrics for all incoming use cases.
- Historical and predictive analyses — the Visualization app is a multi-tab data app that presents historical and predictive analyses of the Data Pull’s outputs across various use cases.
Results
With the analytics applications built and deployed with Dash Enterprise:
- Multi-millions of data records are now accessible in a self-serve way via the Data Pull app.
- Granular understanding of internal ROI by Finance team end users, who can generate provisional P&L sheets without Excel — on-demand, by desired use case, month, and line items.
- Reduced month-long decision processes or Marketing team end users, who can now quickly gain visibility into promotional campaign performance, test new pricing constructs, and stop campaigns that do not demonstrate incremental gains.
- Consistent KPI calculations across diverse use cases, thanks to standardized SQL query construction via the Data Pull app.
- 1-week turnaround for ad hoc requests (previously impossible for the Analytics team), thanks to repeatable app development and deployment with Dash Enterprise, which abstracts away full-stack workflows and DevOps deployment tasks to accelerate time-to-delivery.
- Repeatable cadence for monthly analytics tasks by scheduling regular, standardized data pulls that save 7 to 10 days of data scientists’ time each month.
About Plotly
Plotly is a software company whose mission is to enable every company, around the world, to build data apps. Our product, Dash Enterprise, is a platform of best-in-class development tools to quickly and easily visualize data in Python from virtually any data source. With customers across the Fortune 500, Plotly is a category-defining leader in enabling data-driven decisions from advanced analytics, machine learning, and artificial intelligence.
More user stories like this

Kansas City Chiefs Champion Digital Transformation in Business and Operations
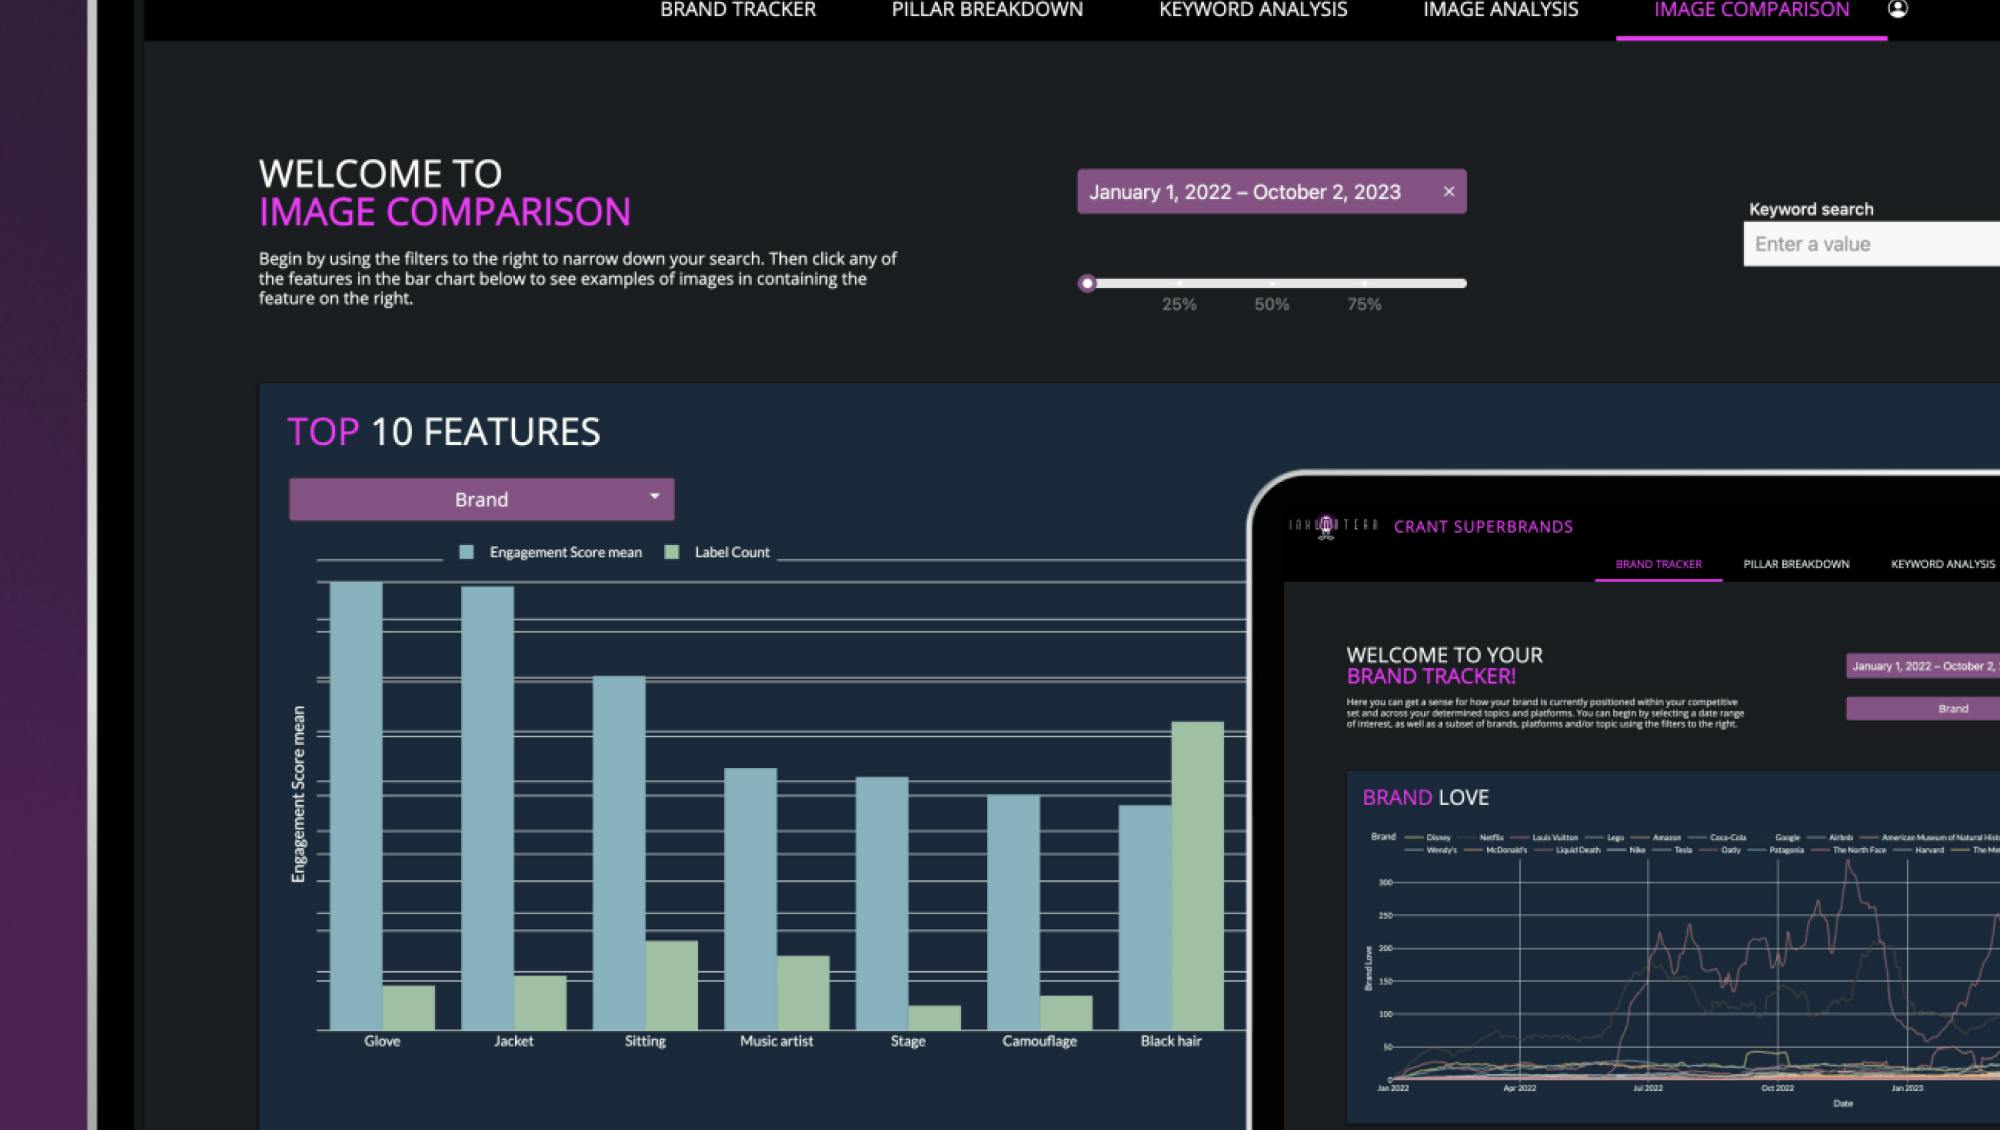
How Crant Automated AI-driven Insight for Brand Building with Dash

Dash Enterprise for Sports Analytics with Utah Jazz