
Plotly
May 1, 2023 - 7 min read
The Best Python Tools for Data Science
As data scientists take on new types of projects and aim to solve more complex problems, having a roster of Python tools is essential for meeting today’s challenges and innovating for the future. Python libraries and frameworks give data scientists a foundation on which they can create data analysis workflows, build apps, and develop machine learning (ML) systems that support enterprise data strategies at scale.
What Python skills are needed for data science?
Data scientists spend most of their time analyzing and understanding data and building ML prototypes to explore how they can be used in their companies. Because Python is such a flexible coding language, having a diverse skill set when it comes to using it enables data scientists to tackle challenges at the intersection of big data and AI.
One of the main ways you can use Python is to build data visualizations and run analytics. Developing ML and AI to assist in the data analysis process is also critical as businesses start to scale their analytics and rely on different types of data from many different sources. Data scientists need to be able to use Python in a variety of ways to stay agile as these shifts happen.
For analytics, data scientists should know how to use Python to collect, manipulate, and organize information. They also need to be able to communicate that information in a meaningful way. This is where using Python to build data visualizations like graphs is essential. Data scientists must understand how to pull different data sources together and surface insights that decision-makers and executives can use to formulate business strategy.
Which Python framework is used in data science?
There are several frameworks and libraries you can use for different tasks and many of them can be used together to help you get the job done.
NumPy is one of the most-used open-source Python libraries and is considered the universal standard for working with numerical data in Python. Pandas is another widely-used library that provides data structures and analysis tools. When it comes to ML frameworks, Kaggle found that 80% of data scientists use scikit-learn. They also found that TensorFlow and Keras are top options that are often used in combination.
What tools can data scientists use to visualize Python analytics?
To build effective Python analytics visualizations, data scientists can combine multiple libraries for maximum flexibility and added capabilities. Python data visualization usually starts with importing packages like NumPy or pandas and visualization libraries like Plotly. Then, data scientists need to import and clean their data to make sure it’s accurate. Finally, they need to design visualizations that communicate the information effectively.
Top 10 Python Tools for Data Scientists
Frameworks and libraries make Python analytics and ML development easier and faster for data scientists. Here are the top 10 tools data scientists can use to innovate at scale and take their data analytics capabilities to the next level.
- NumPy
- SciPy
- pandas
- matplotlib
- Plotly
- Cufflinks
- Black
- scikit-learn
- SQLAIchemy
- TensorFlow
1. NumPy
NumPy (Numerical Python) is a go-to tool in the data science community that enables users to create high-performance multidimensional arrays and matrix data structures. It’s an excellent tool for performing mathematical operations on large datasets. It also enables users to take advantage of a unique type of array called ndarray — which is a multidimensional container of items of the same type and size — and provides methods to efficiently operate on it.
Benefits
- The NumPy API can be used in most data science and scientific Python packages including pandas, SciPy, matplotlib, and scikit-learn.
- It also provides a flexible array object that can be used to perform a range of mathematical operations.
- Arrays are faster and more compact than lists in Python. They also take up less memory to store data.
When to Use It
Data scientists might use NumPy to perform matrix multiplication or to calculate the eigenvectors (a nonzero vector of a linear transformation) and eigenvalues (the factor by which the eigenvector is scaled) of a matrix. They can also use it to do data analysis using NumPy's mathematical functions or to perform a Fourier transform (FT) on a time series.
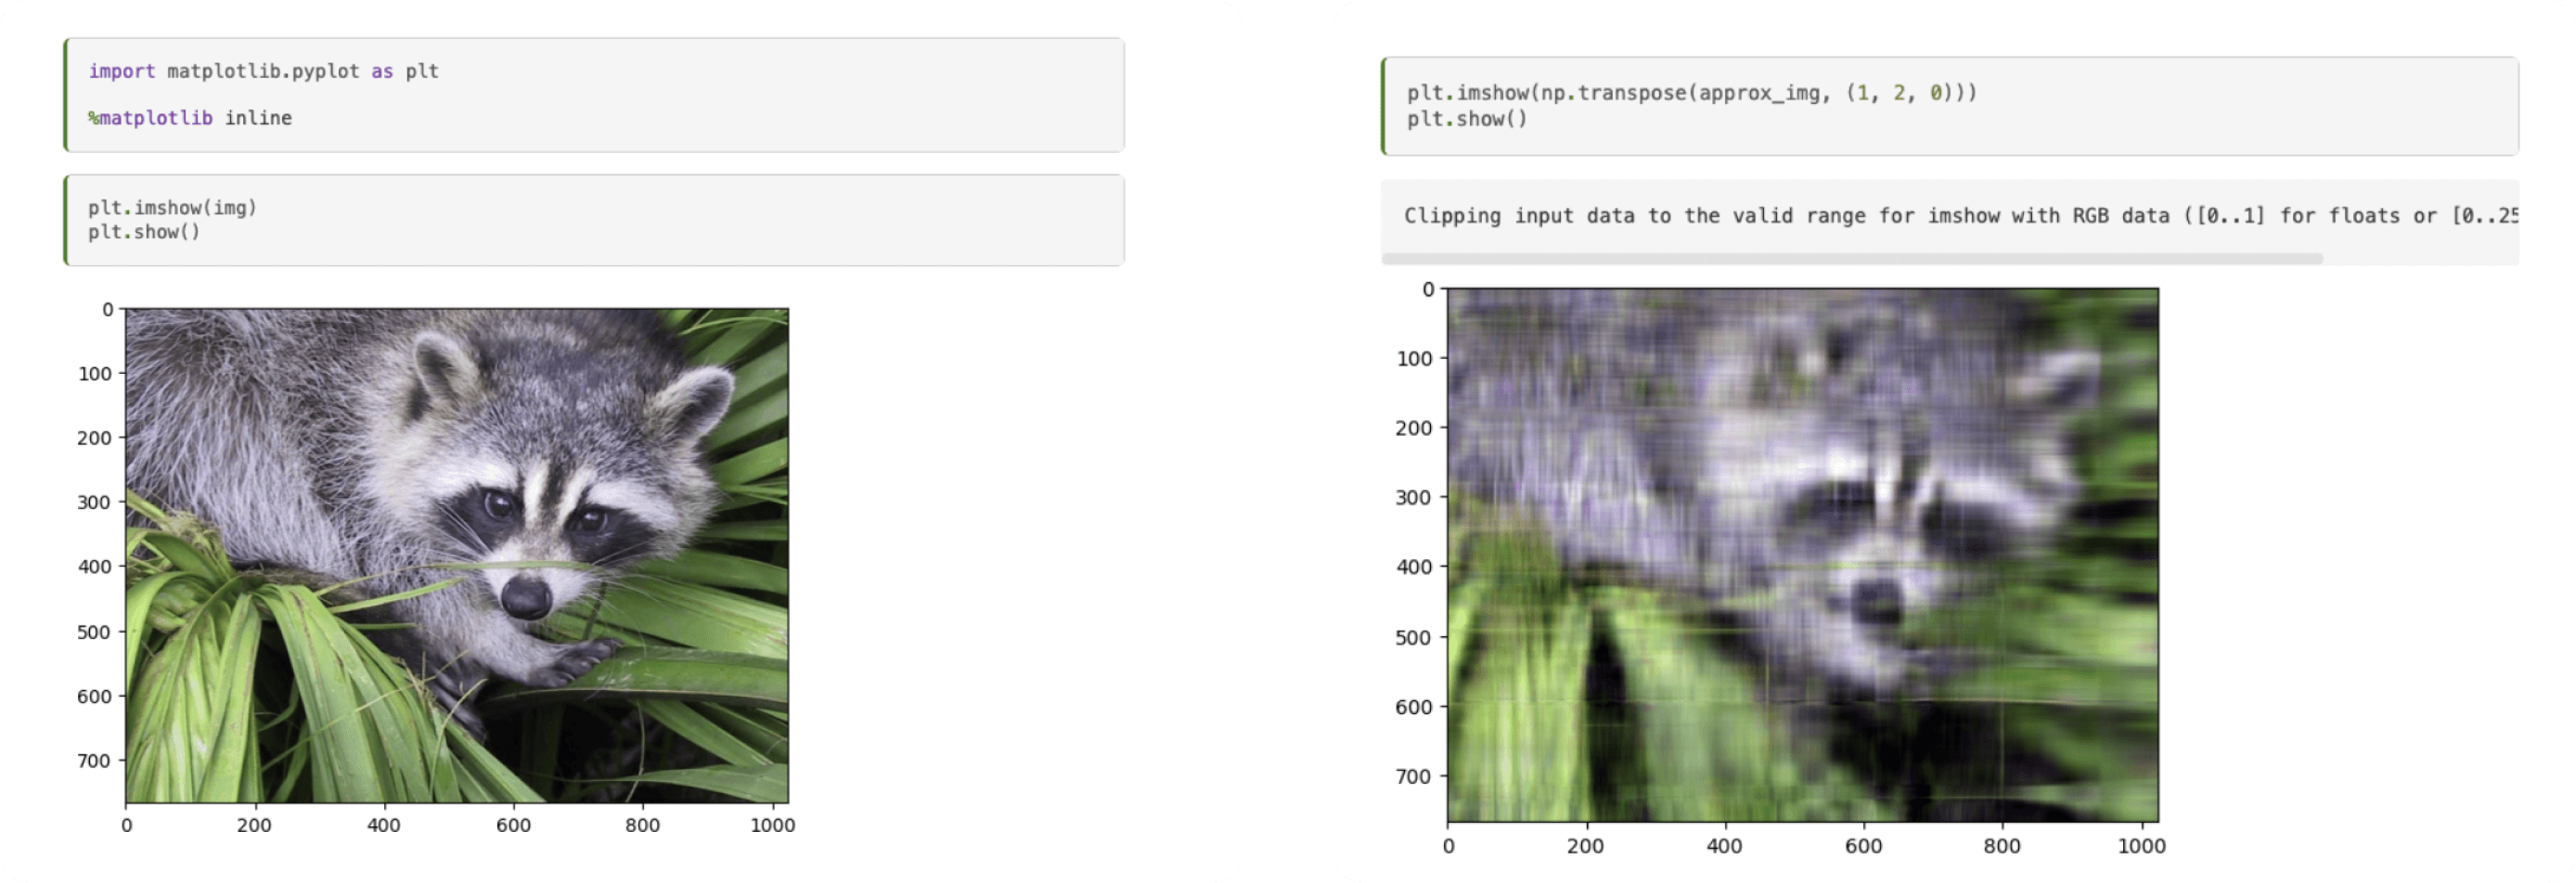
Using a matrix decomposition to generate a compressed approximation of an image with NumPy. Source.
2. SciPy
For data scientists who need to do things like optimization, linear algebra, integration, interpolation, and statistics, SciPy (Scientific Python) is an open-source scientific computing library for Python. It’s built on NumPy and provides additional functionality including a range of statistical functions like hypothesis testing, probability distributions, and descriptive statistics. You can also use its sub-packages for specialized tasks like image processing, sparse matrix manipulation, and clustering algorithms.
Benefits
- SciPy provides a wide range of mathematical and scientific functions that can be used for highly complex analysis tasks.
- It easily integrates well with other Python libraries, such as matplotlib, pandas, and scikit-learn.
- It’s more user-friendly and efficient for scientific calculations than NumPy.
When to Use It
Data scientists can use SciPy to perform tasks like numerical integration or solving differential equations. You can also perform hypothesis testing or estimate the parameters of a probability distribution from a set of observations.
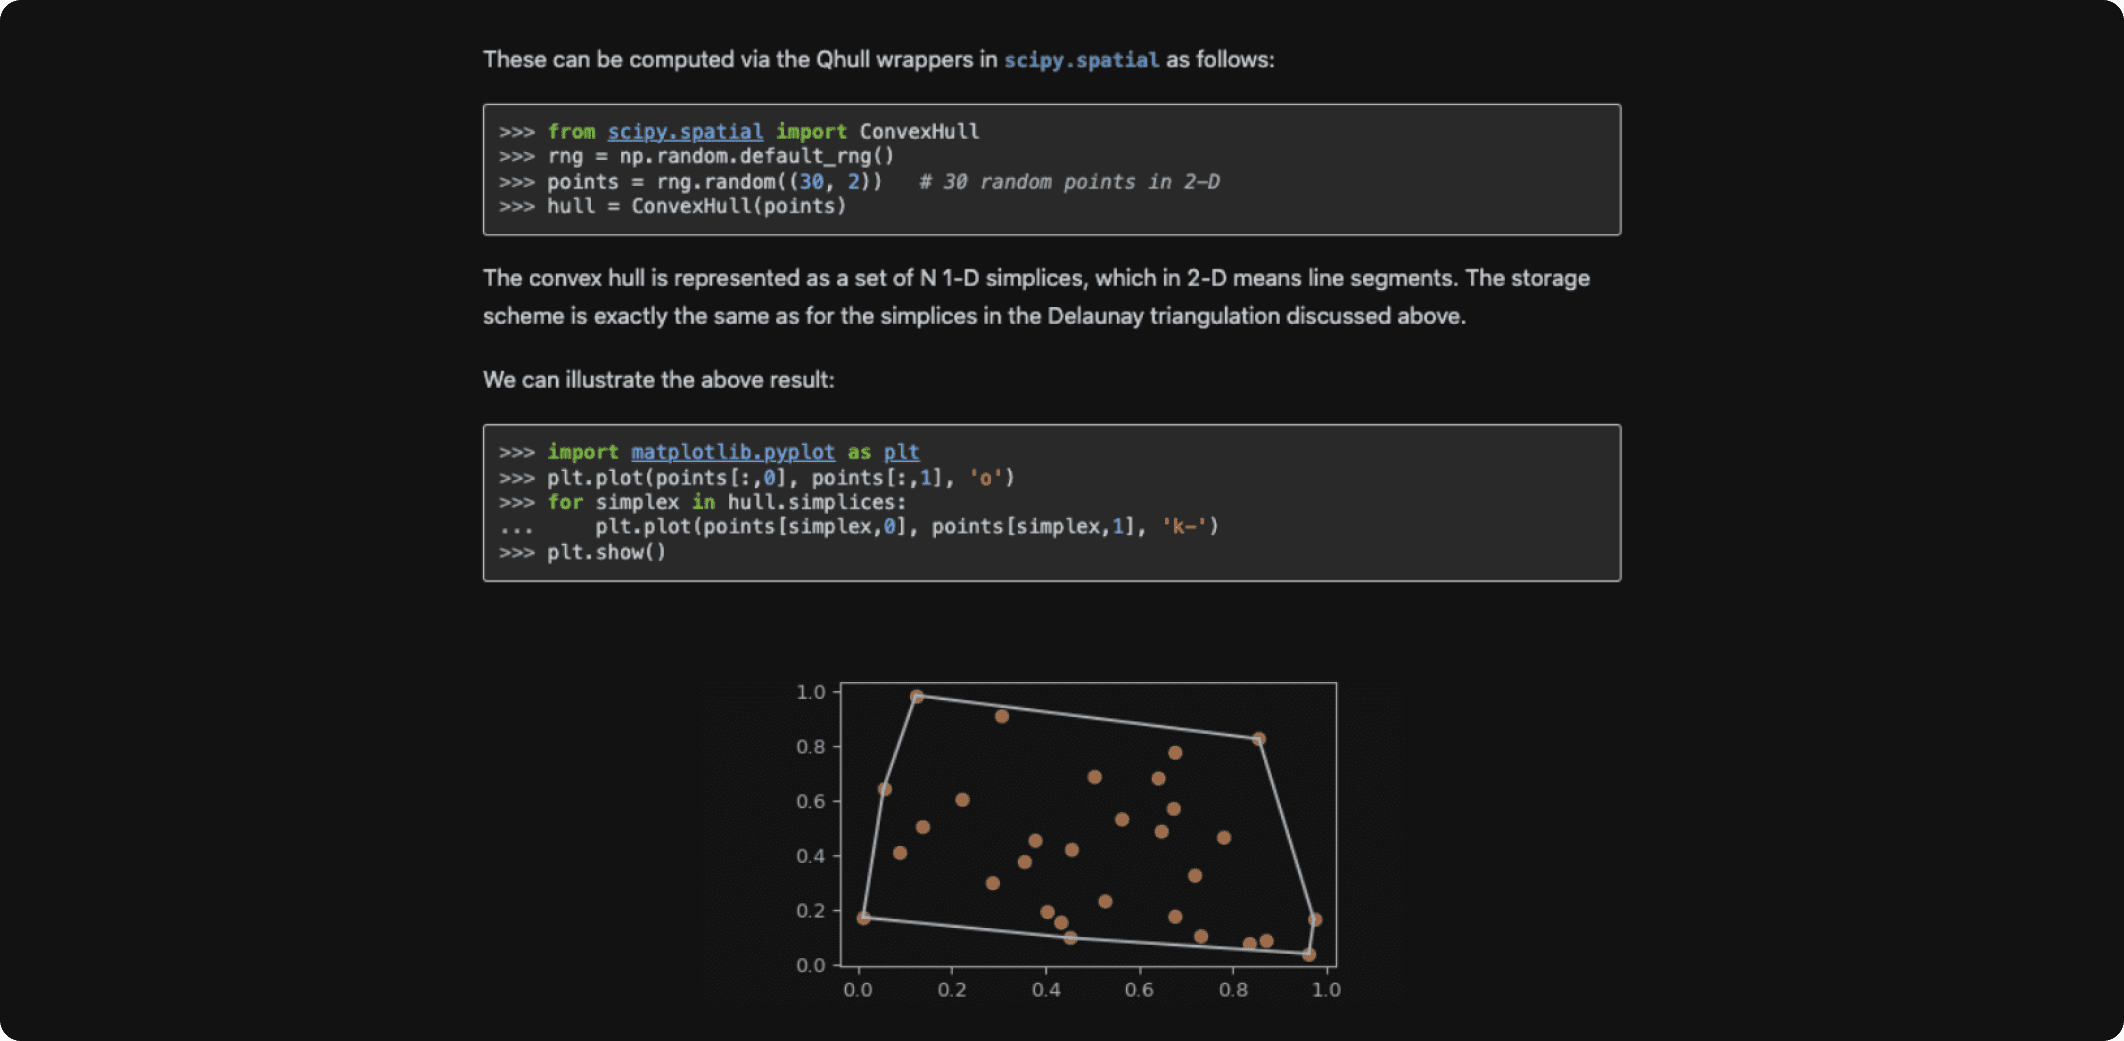
Working with a convex hull using SciPy. Source.
3. pandas
pandas (Python Data Analysis) is a popular Python package that provides high-performance data manipulation and analysis tools that are built on NumPy. It supports reading and writing data from various file formats, including CSV, Excel, SQL databases, and more. It allows data scientists to leverage both Series and DataFrame structures and makes working with relational and labeled data easy and intuitive. pandas is primarily used for real-world data analysis in Python, allowing users to clean, transform, and reshape data, as well as perform common data analysis tasks, such as grouping, filtering, and aggregation.
Benefits
- pandas is highly customizable and extensible, with many third-party libraries and tools built on top of it.
- It enables you to create your own function and run it across a series.
- It also allows you to deal with missing data thanks to its syntax and robust functionality.
When to Use It
A data scientist might use pandas to read a large dataset, clean up missing or incorrect values, and perform data transformations to prepare it for further analysis. They could then use it to aggregate the data and perform statistical analysis, generating insights.
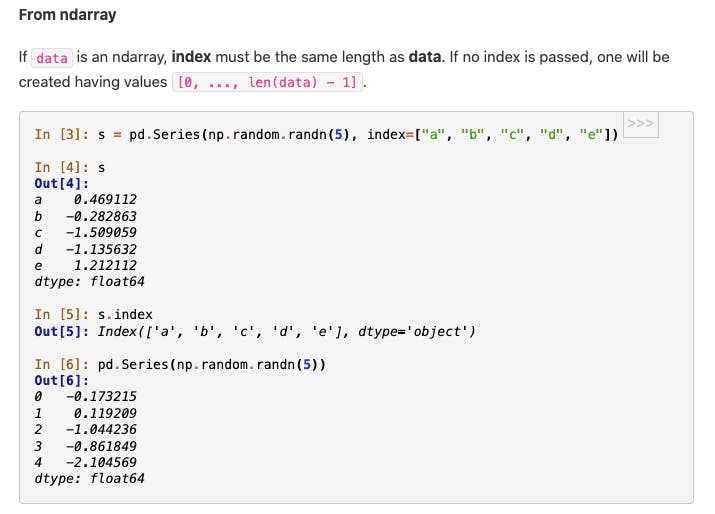
Working with ndarray using pandas. Source.
4. matplotlib
matplotlib is widely used for creating Python graphs, including both static and interactive data visualizations as well as more complex visualizations like subplots, grids, and animations. It can be combined with NumPy, pandas, and SciPy. It allows users to create graphs similar to R or Matlab. Matplotlib also has great documentation for beginners, including tutorials as well as a large community of users who contribute to the library.
Benefits
- When using matplotlib visualizations alongside ML, it enables you to easily catch outliers in your data.
- It has low memory consumption for enhanced runtime and can be used on almost any operating system.
- You can easily embed data visualizations in JupyterLab and Graphical User Interfaces (GUIs), like a website.
When to Use It
Data scientists can use matplotlib to create effective charts for showing business metrics like sales figures for different product categories, making it easy to identify top-selling products and areas for improvement. They can easily create multiple visualizations to bring data into a dashboard for non-technical users to view.
Creating a scatter plot with a masked region with matplotlib. Source.
5. Plotly
Plotly makes Dash, a platform that allows you to build interactive, dynamic data visualizations and data apps for Python. It has over 40 different chart types that cover a variety of use cases from statistics to 3D modeling. Plotly enables data scientists to create beautiful web-based visualizations that can be displayed in Jupyter notebooks, saved to standalone HTML files, or served as part of pure Python-built web applications using Dash.
Core Benefits
- Plotly is highly customizable, allowing users to create visualizations that fit their specific needs and style preferences to communicate information in an engaging way.
- It has a large community of users who constantly contribute to its development and provide support.
- Plotly's interactivity features make it ideal for exploring and presenting complex datasets to gain deeper insights.
- Its Dash Enterprise platform has one-click deployment and stateless architecture that enables the ability to install on any cloud VPC including AWS, Azure, or GCP, making it efficient and highly scalable.
When to Use It
Dash is great for making customized, interactive data visualizations when you need to present data to executives or set up visualizations that can be used on an ongoing basis to make business decisions across departments. It makes it easy for data scientists to get creative with data visualization so that the insights they find really make an impact on their audience.
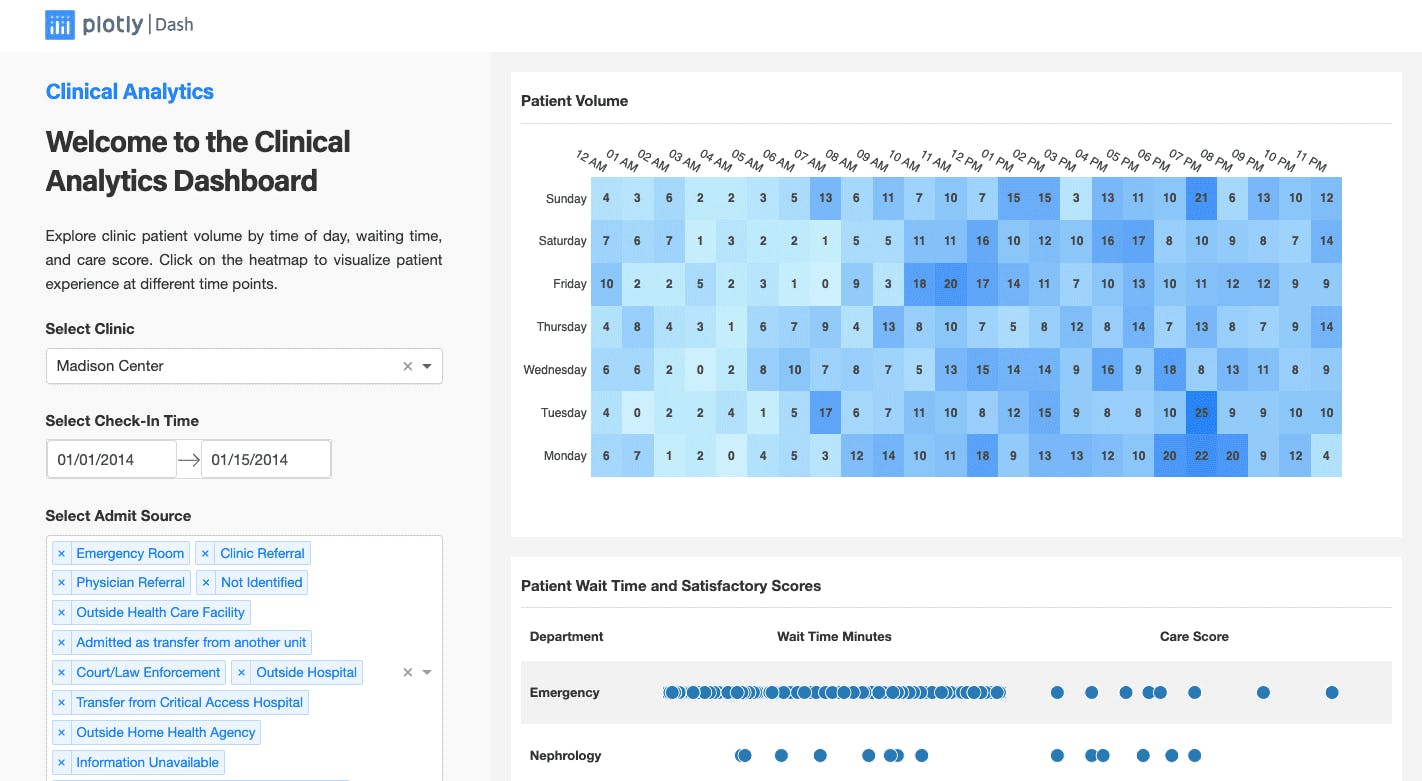
Data visualization app made with Dash. Source.
6. Cufflinks
Cufflinks is a Python library that connects Plotly and pandas so that users can build data visualizations directly on data frames. It makes it easy for data scientists and analysts to create interactive data visualizations without the need for advanced programming skills. Cufflinks' ability to create interactive plots allows users to explore their data in real time, enabling them to discover insights that may not be apparent in static charts or graphs.
Benefits
- Cufflinks supports a variety of customization options, including chart titles, axis labels, and colors, and can be used to create interactive plots in Jupyter notebooks, as well as standalone HTML files.
- It enables users to quickly explore large datasets and identify trends and patterns.
When to Use It
With Cufflinks, data scientists can create interactive plots so that their audience can easily explore their data on their own—no matter what their level of technical skill might be. It can also be used to build internal web-based tools by allowing developers to embed interactive plots into web pages.
Plotting with pandas and Plotly using Cufflinks. Source.
7. Black
Black is a Python formatter that ensures your code adheres to a set of style guidelines. It reduces the amount of time you spend formatting your code so you can focus on more important tasks, like writing the code itself. It ensures everyone stays on the same page about code formatting. There isn’t much room for customization, but this helps reinforce the same formatting rules from user to user.
Benefits
- Black is extremely simple to set up.
- It can save developers time by automatically formatting code, eliminating the need to manually format code or argue about formatting choices with team members.
- Black always verifies that the formatted output creates the same internal representation in Python, so it never applies changes that could result in a different code interpretation.
- Makes code review faster for data science teams.
When to use it
Black is great for projects where not everyone may be familiar with the desired coding standards. Data science teams can ensure that all code submissions follow the same style guidelines, making it easier to review and integrate new code into the project.
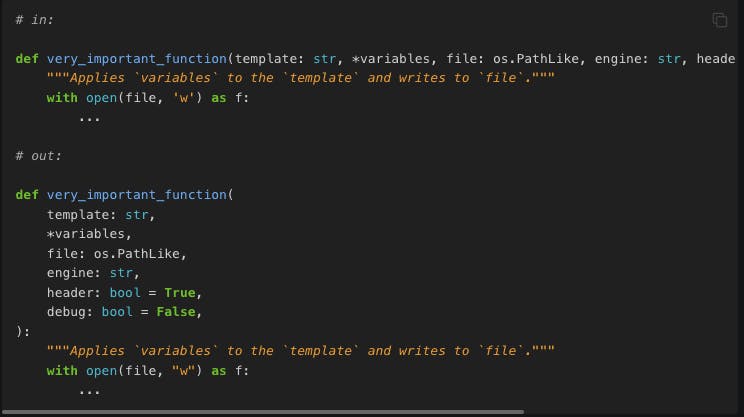
Line wrapping formatting with Black. Source.
8. scikit-learn
scikit-learn provides many of the most commonly used machine learning algorithms in its open-source library. It offers a range of supervised and unsupervised learning algorithms, including regression, classification, clustering, and dimensionality reduction. Additionally, it has tools for data preprocessing, feature selection, and model evaluation.
Benefits
- scikit-learn provides a simple and consistent interface for working with machine learning models.
- It integrates well with other Python libraries, such as NumPy, pandas, and matplotlib.
- scikit-learn also has built-in functionality for preprocessing and feature selection, making it easy to prepare data for machine learning.
When to Use It
One of the main ways data scientists and ML engineers use scikit-learn is to build machine learning models for predictive modeling tasks. Data scientists can also use it to perform clustering analysis on a dataset using clustering algorithms. This can help identify groups of similar data points that can be used for further analysis or segmentation.
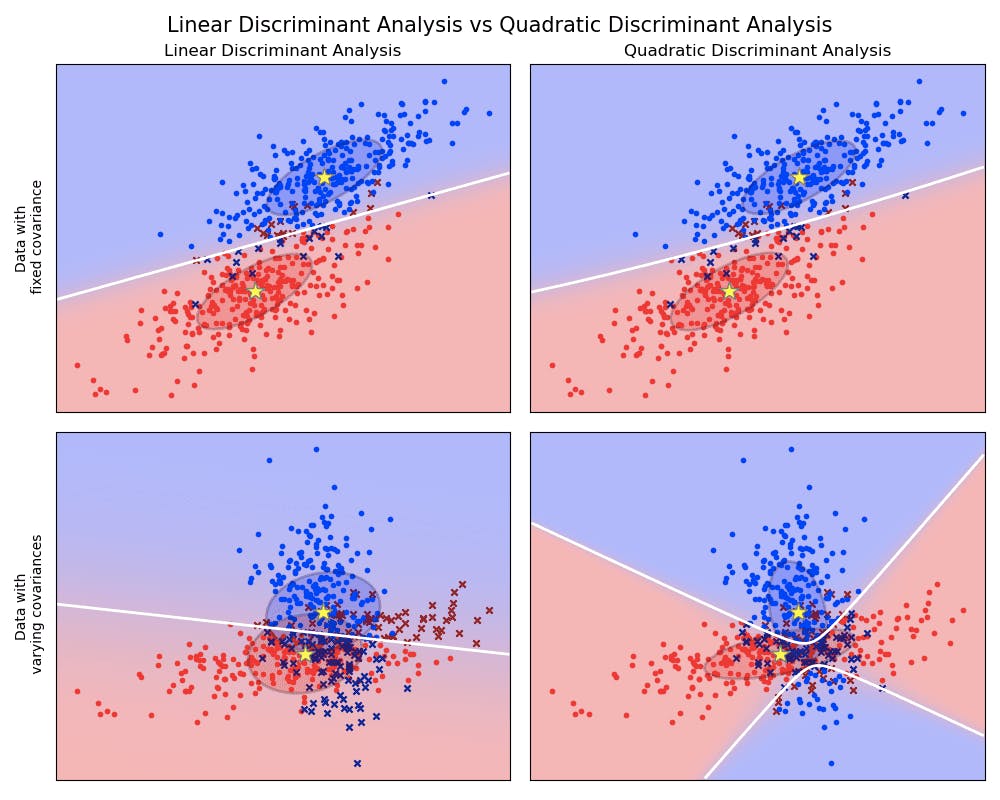
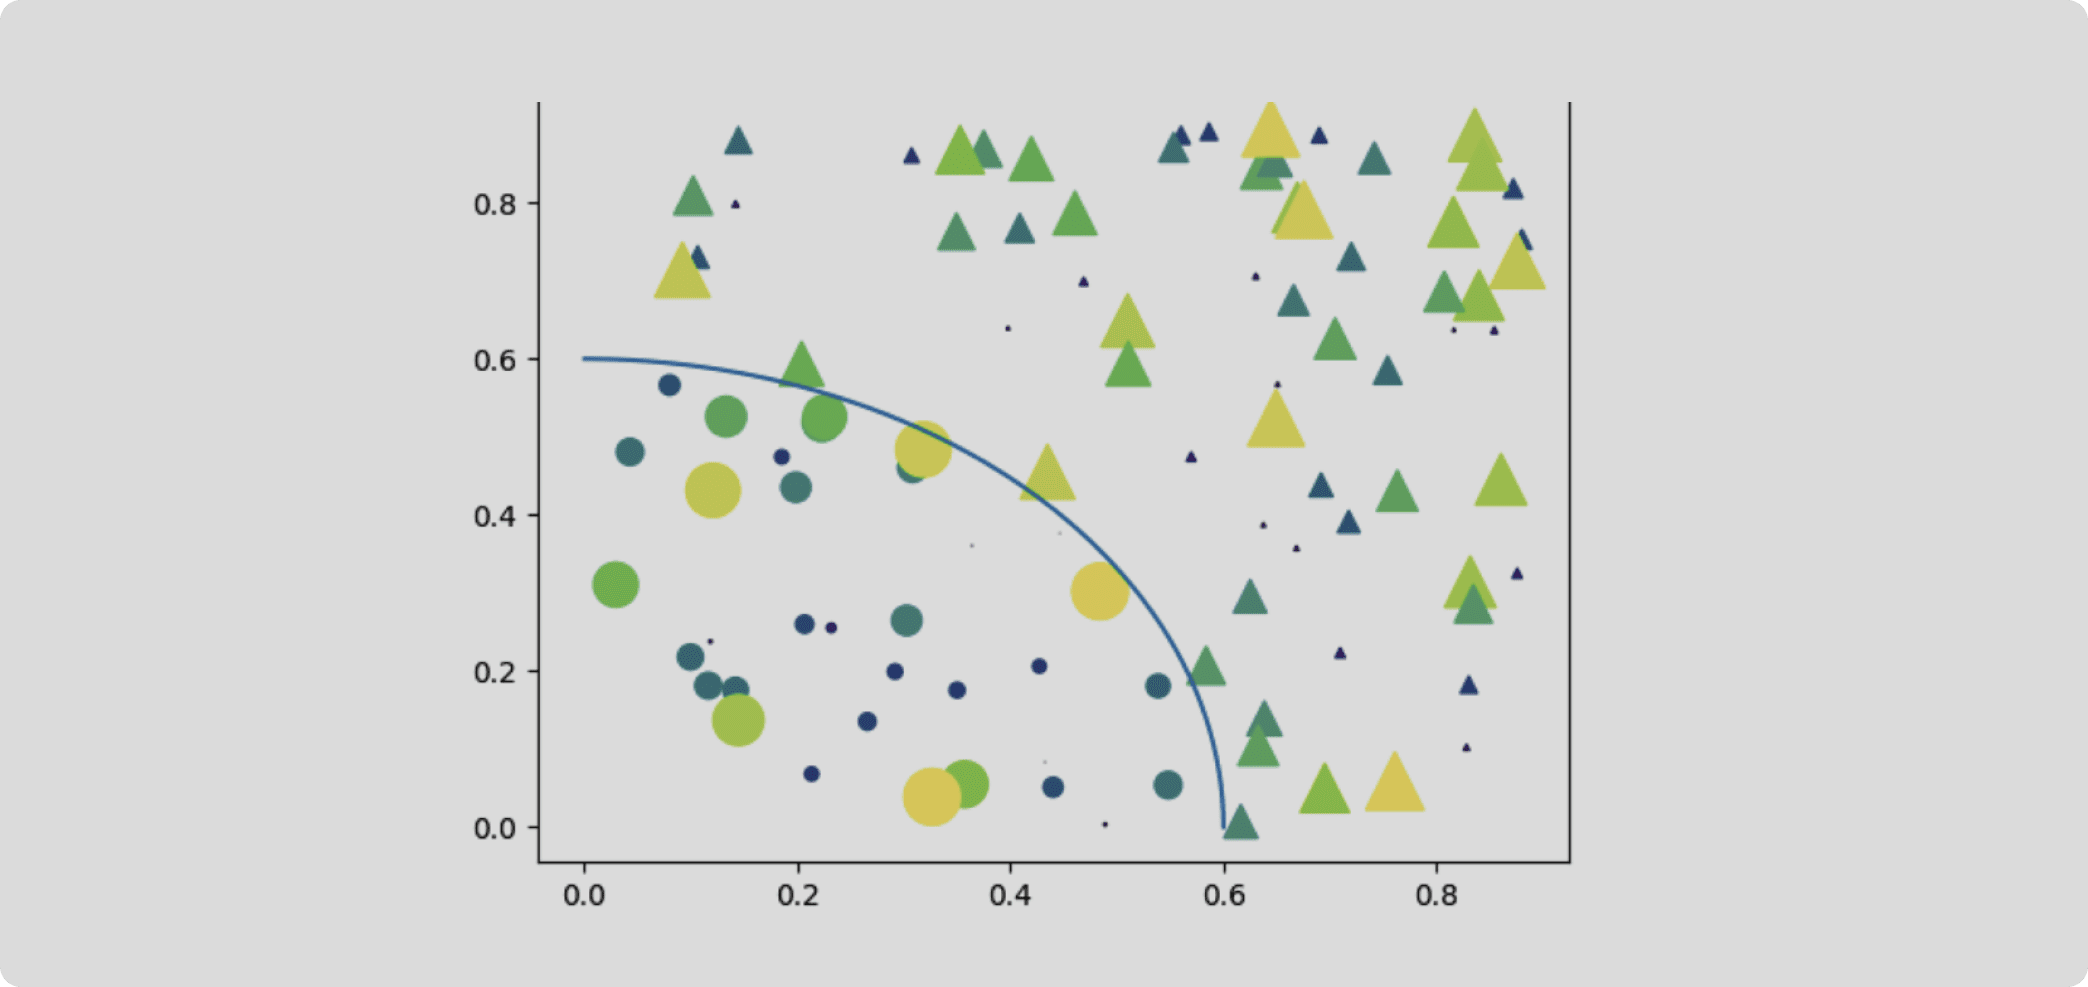
Linear and Quadratic Discriminant Analysis with covariance ellipsoid using scikit-learn. Source.
9. SQLAlchemy
If you need to combine the power of SQL and Python, look no further than SQLAlchemy. This tool is an Object Relational Mapper that offers data scientists and developers the full capability and flexibility of SQL, allowing communication between Python programs and relational databases. It does this by translating Python classes to tables and turning function calls into SQL statements. It allows data scientists to use Python to query their database rather than SQL, making it easier to write more complex queries.
Benefits
- SQLAlchemy makes it much easier to work with databases in Python.
- It supports many common database backends, including MySQL, PostgreSQL, SQLite, and Oracle.
- Features include database transactions and connection pooling making it ideal for building high-performance, scalable database applications.
When to Use It
SQLAlchemy is great for data scientists who want to bypass the need to set up a relational database management system and write SQL to carry out database operations. It allows users to do things like building data analysis apps using Python that interact directly with a database.
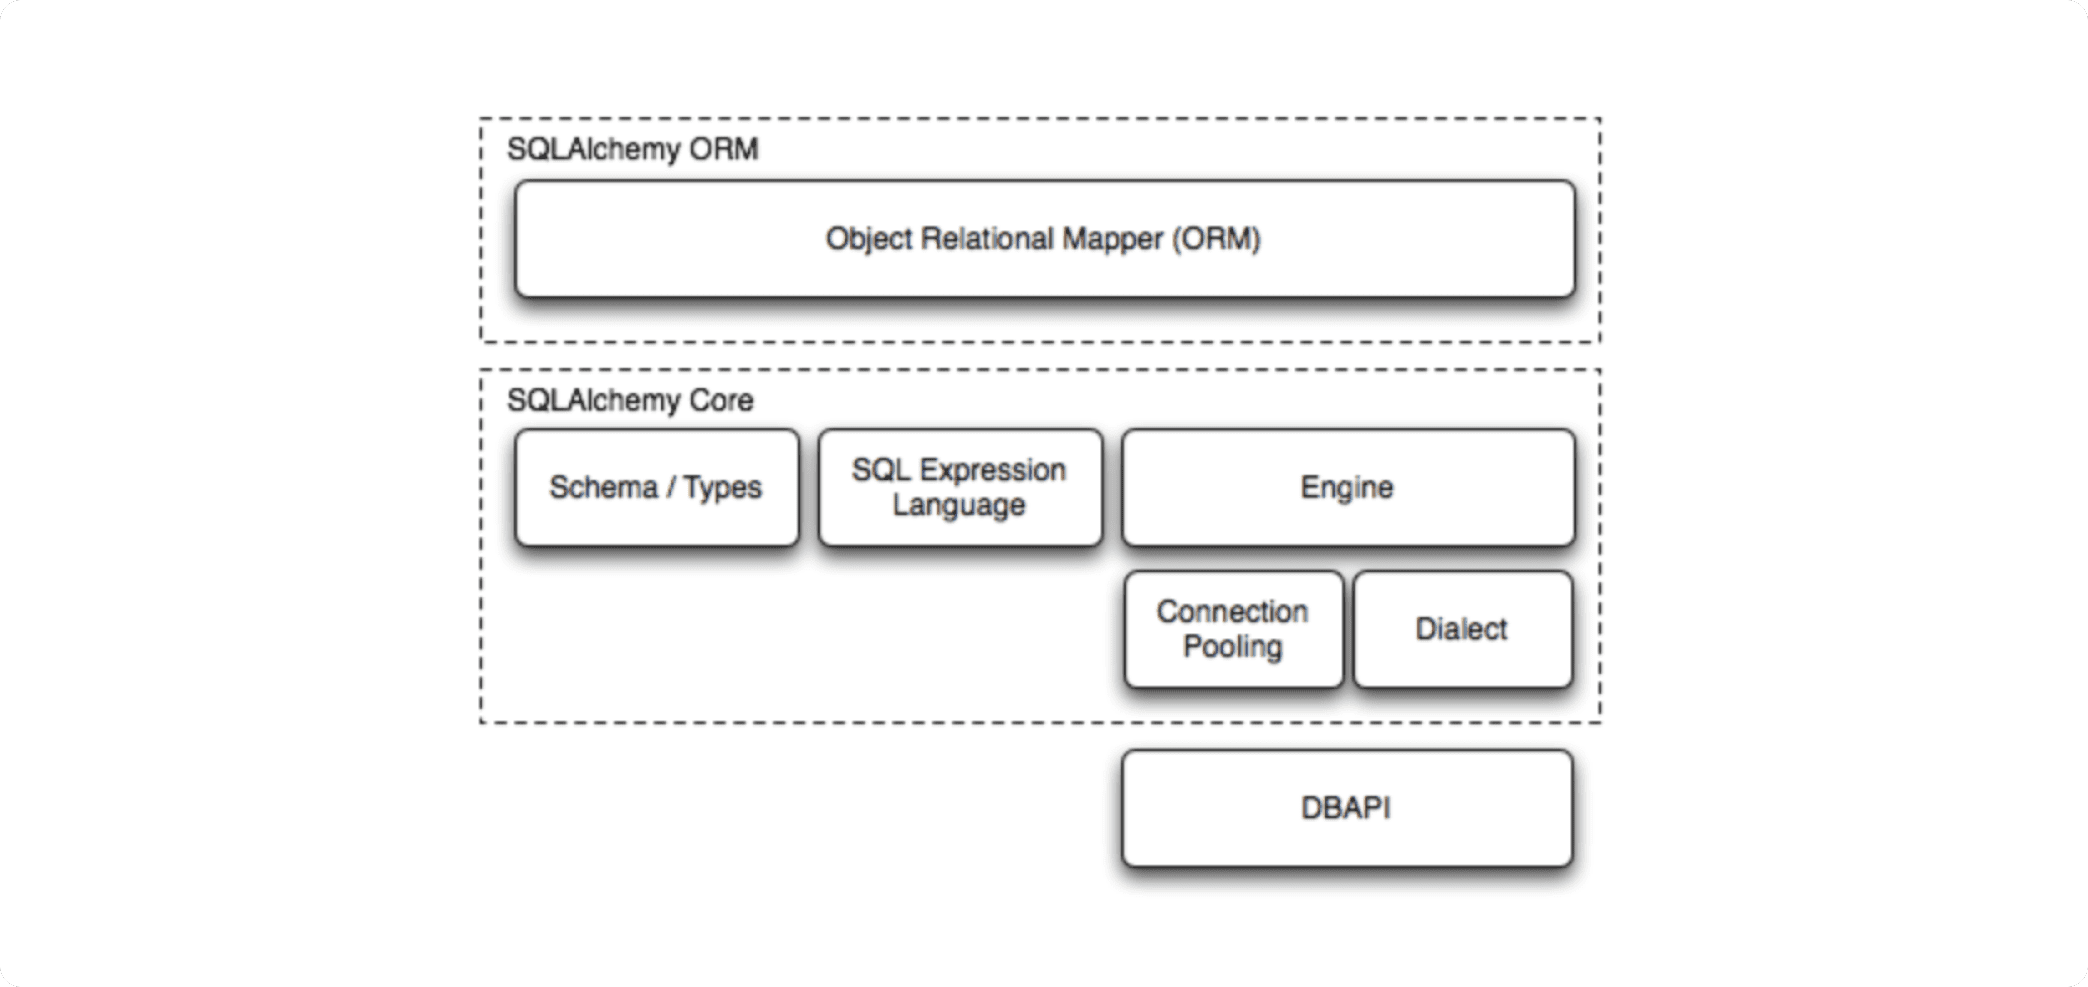
SQLAlchemy components. Source.
10. TensorFlow
TensorFlow is an open-source platform for building ML models that’s great for both beginners and seasoned data scientists, developers, and ML engineers. It enables users to work on a variety of ML, deep learning, and NLP tasks. ML models made with TensorFlow can be deployed on desktop, mobile, web, and in the cloud. Because clean data is at the heart of any successful ML project, TensorFlow also includes tools for consolidating, cleaning, and processing data at scale.
Benefits
- TensorFlow supports many data types, including images, text, and time series data.
- It also facilitates automatic differentiation, making it easier to implement more complex algorithms.
- It has GPU support for faster training of deep learning models.
- TensorFlow enables users to scale quickly by making it possible to train large models on distributed systems.
When to Use It
Data scientists and ML engineers can use TensorFlow to build models that can generate or translate natural language text. It can also be used for speech recognition projects, helping data scientists turn spoken words into text data for analysis.
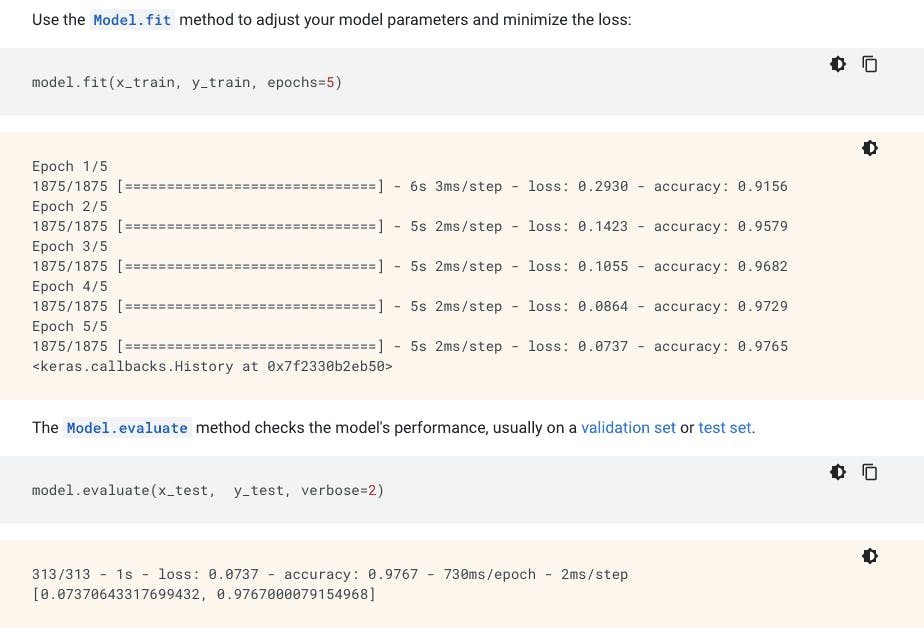
Train and evaluate your ML model with TensorFlow. Source.
Why Python Tools Matter for Data Scientists
No matter what projects you’re working on, Python tools enable you to speed up and scale the work you’re doing. Data scientists have a huge role to play in the future of enterprise success and growth, as well as innovation and development in the realms of ML and deep learning.
Python tools give data scientists the flexibility to be as creative as they need to be to make an impact. With engaging data visualizations, businesses can make better use of their data to make decisions that help them pull ahead of the competition. Using tools that make ML more approachable for more data scientists, enterprise teams can develop models that make businesses far more productive and sustainable in the long run.
Learn more about using Plotly to bring your Python data visualizations to life with low-code tools for building data apps.
Download our guide to discover 5 more essential Python tools to help you boost your efficiency, build better visualization, and power your ML projects.