
Elias Dabbas
November 13, 2023 - 9 min read
Analyzing Website Structure With robots.txt Files and XML Sitemaps Using Dash
Your website is where your brand lives, where your content is curated, and where the most important transactions happen. It is also a place that you control, and have a say on everything from how to display information to what you want to highlight, and so on.
Having findable pages that are easy to crawl by search engines as well as LLMs, and easy to use by users is crucial in establishing your online presence.
We will begin to build a set of tools to evaluate your online presence, and we will start with website structure in this article.
If you want to follow along and run the app with your own data, or want to customize the app, you can do so here.
What is website structure, and why is it important?
At this stage, since we will only be working with robots.txt and analyzing XML sitemaps, website structure will consist of a list of URLs (as declared in the sitemaps), as well as how the sub-folders are structured, and what content they contain. We will be analyzing the counts of each (sub)folder and see how content is distributed across topics, products, themes, etc.
Let's consider this simple example of URLs:
Analyzing URLs with code
A quick glance at the URLs shows that this site has a /bags folder, as well as a /shoes folder. We can also see that each is split into sub-folders (sub-categories), until we get to the final part of the URL, where we can see the specific product name. Now we would like to quantify those segments of the website and see how they are split.
urldf = adv.url_to_df(url_list)urldf
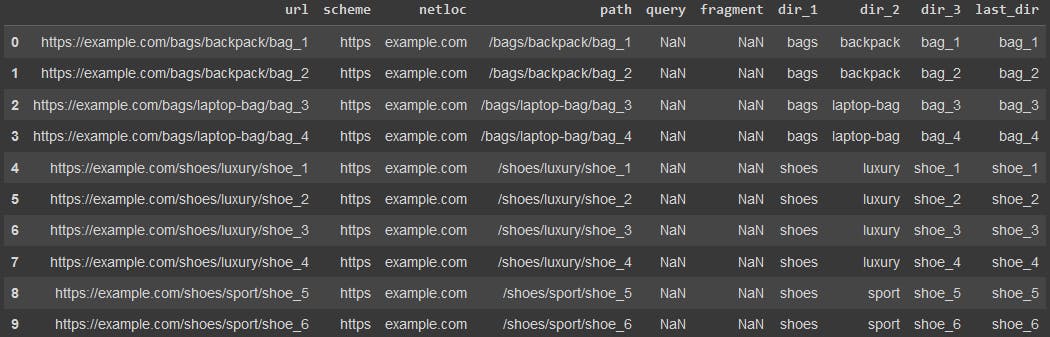
We just split each URL into its components as you can see in the column names above. We basically converted the URLs into a table, where now we can easily filter, select, and count any (sub)segment of the website and learn more about it.
adviz.value_counts_plus(urldf['dir_1'], size=20, name='example.com/dir_1/')
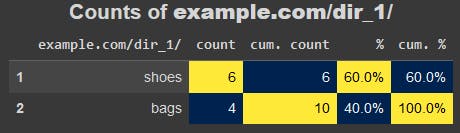
So, our website's products are split 60:40 between shoes and bags respectively. We can run the same analysis to see how each of these categories is split into sub-categories:
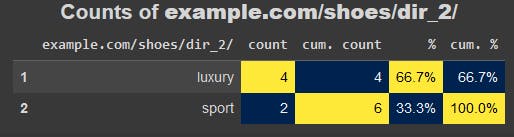
adviz.value_counts_plus(urldf[urldf['dir_1'].eq('shoes')]['dir_2'], size=20, name='example.com/shoes/dir_2/')
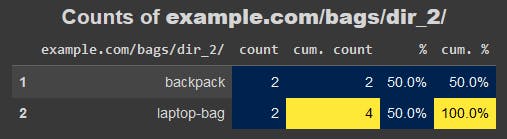
adviz.value_counts_plus(urldf[urldf['dir_1'].eq('bags')]['dir_2'], size=20, name='example.com/bags/dir_2/')
Let's now translate this process into a no-code Dash app, where the user has to only paste a list of URLs into an text input box, and hit the "submit" button.
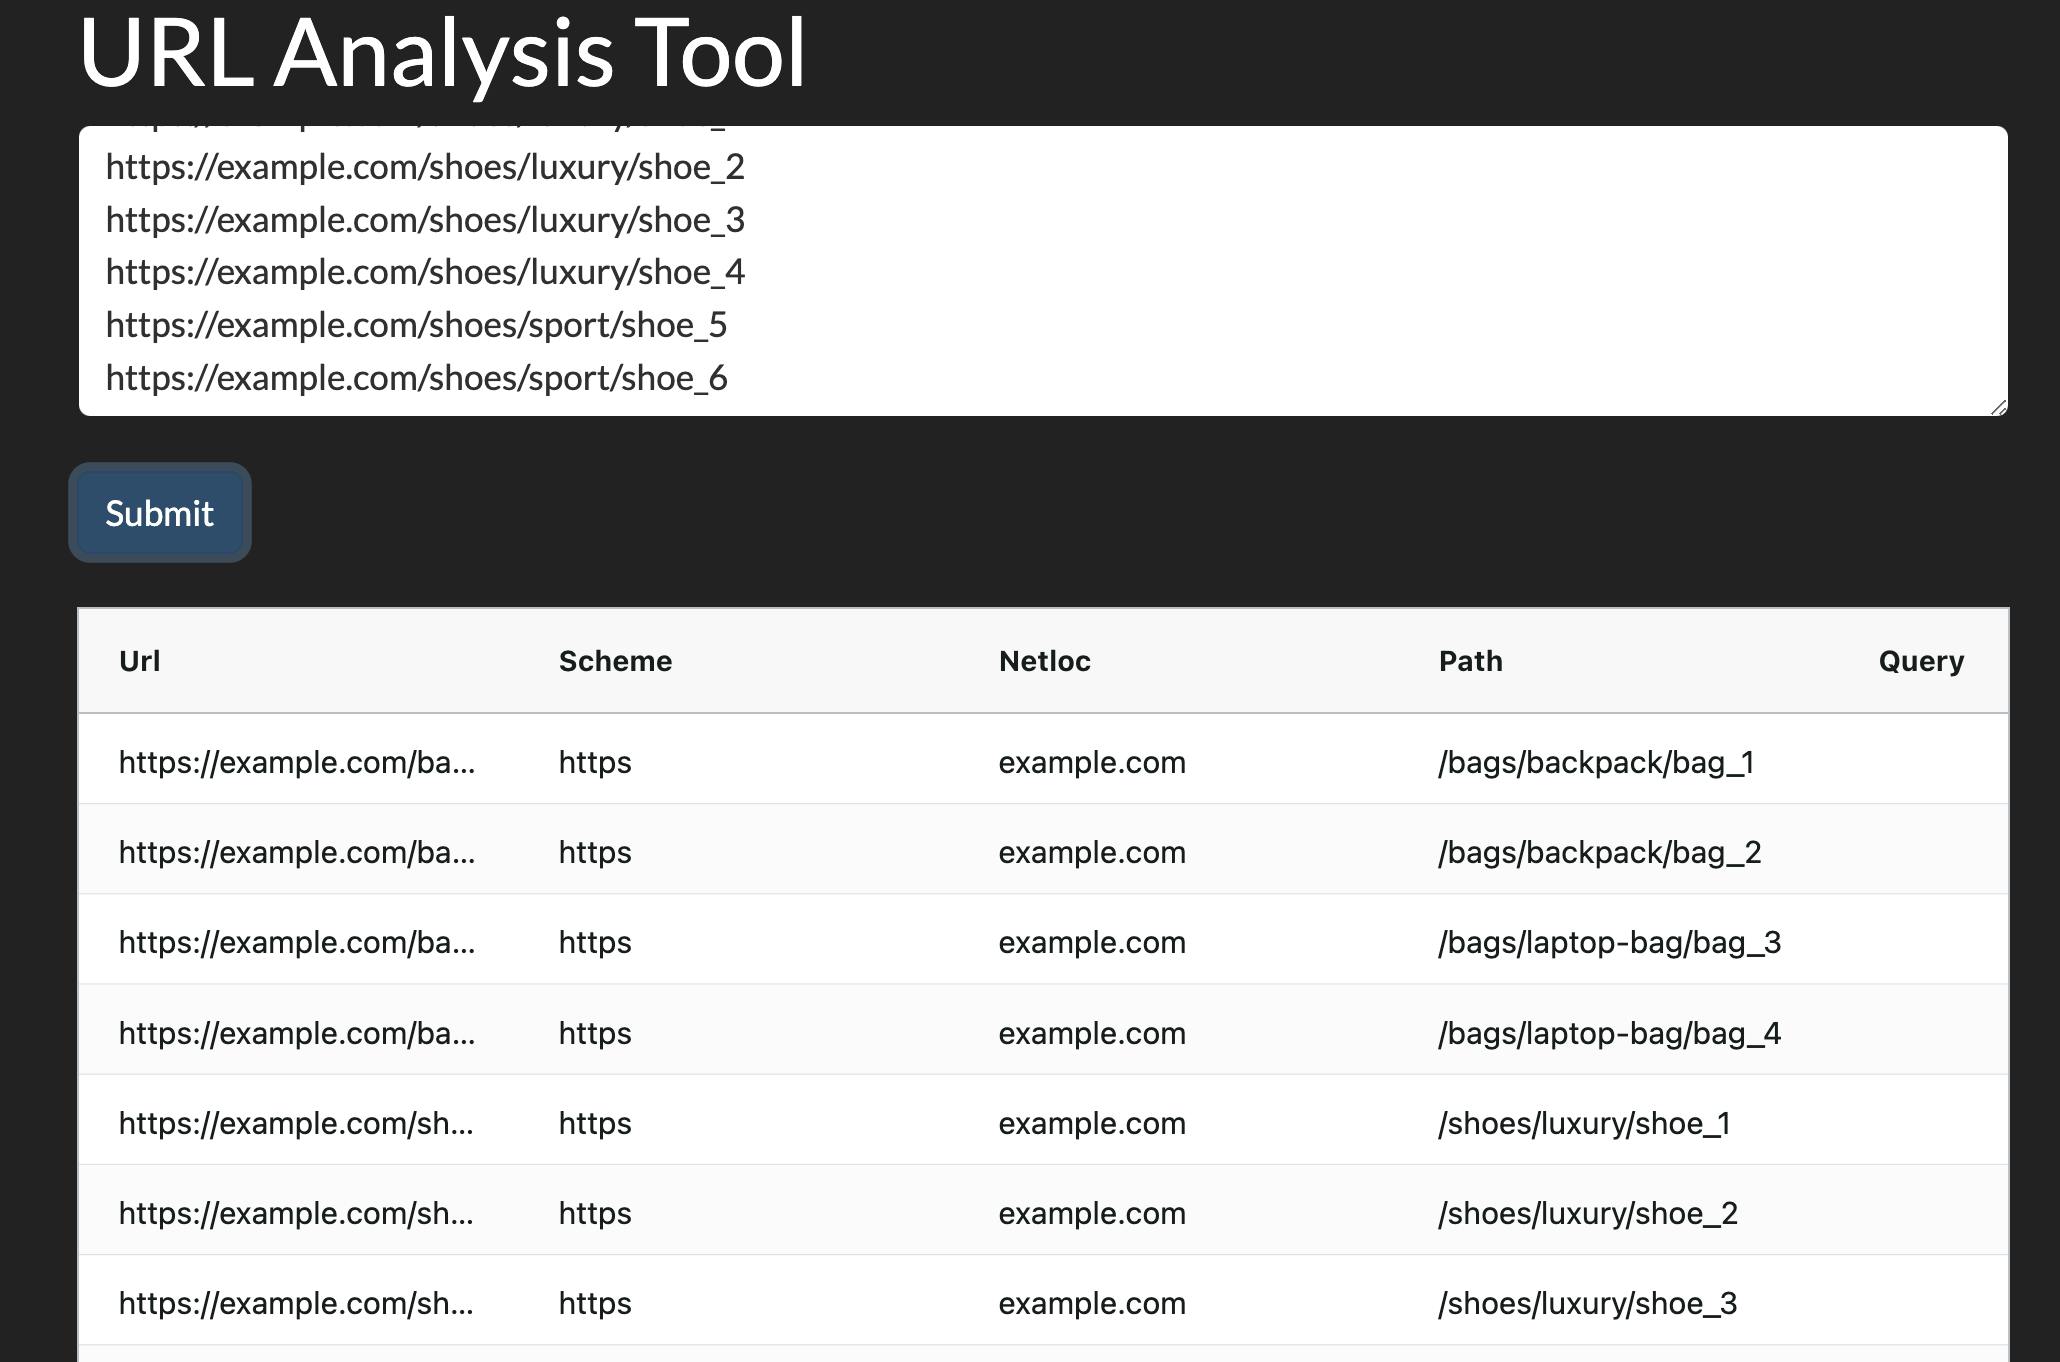
Analyzing URLs with Dash
Our app, as with any Dash app, consists of two main conceptual parts:
- The layout: This is the visible part the user sees, and can interact with. In this case we have an <h1> tag as the title of the app, a textarea element for users to paste this URls, a "Submit" button, and an empty invisible <div> element underneath them. Once the user submits the URLs, the element will be filled with the table containing the split URLs.
- The callback function(s): In this part of the app we connect two (or more) elements in our app and determine how each influences the other. In this case, hitting the submit button would take the provided URLs, split them, and create a table using dash-ag-grid and places it in the empty <div> element at the bottom of the page.
urls_app = Dash(__name__, external_stylesheets=[dbc.themes.DARKLY])urls_app.layout = html.Div([html.H1("URL Analysis Tool"),dbc.Textarea(id='url_list',rows=5,placeholder='Enter URLs one per line'), html.Br(),dbc.Button('Submit', id='url_analysis_button'), html.Br(), html.Br(),html.Div(id='url_analysis_output')], style={'marginLeft': '4%', 'marginRight': '4%'})@urls_app.callback(Output('url_analysis_output', 'children'),Input('url_analysis_button', 'n_clicks'),State('url_list', 'value'))def split_urls(n_clicks, url_list):if not n_clicks:raise PreventUpdateurldf = adv.url_to_df(url_list.splitlines())urldf_grid = dag.AgGrid(rowData=urldf.to_dict('records'),columnDefs=[{'field': column} for column in urldf.columns])return urldf_gridurls_app.run(port=8051)
The value of understanding a website's URL structure
There are various things we can use this understanding in:
- Large-scale advertising campaigns: If we want to run an ad campaign per category, sub-category, and/or product on our website, the first step is get an idea on what products we have. Then we can get product names, titles, descriptions, and possibly images to create our campaigns. We can also run keyword research analysis to see which products/categories are more important and split our ads and budgets accordingly. But first, we need to have a good idea about how our website is structured.
- Search engine optimization (SEO): After running a keyword analysis on our industry, we can now see how/if our website structure adequately reflects the market demand. We might discover that there is large category of "duffle bags" and related keywords. In our simple fictitious website, we don't have any of those products listed. This might lead us to recommend filing this content gap, or be conscious that we are missing that segment of the market. We can also crawl those URLs and analyze their content, check their status codes and load times, and run various other steps to help in our technical and strategic SEO activities.
- Content/product strategy: Similar to the points above we can use this URL analysis as a first step in formulating our content strategies.
- Competitor analysis: All of the above can and should be used to analyze our competitors. This would give us a view of the industry as a whole, and not just our own website.
Limitations of analyzing URLs only
One of the most important challenges in using URLs to analyze a website is that there is no standard way to organize URLs. Some sites have a /category/sub-category/product-name URL template, while others might have more/fewer levels in the URLs. Also, there are various different types of websites. You typically have a different structure between e-commerce sites and media/news sites. Corporate and informational sites would have their own structure, and websites can really implement any structure they want. This is where the analyst's role comes into play, where try to figure out as much as we can from those URLs, and be conscious of the limitations of our datasets.
The URLs only show the "skeleton" of the website, and no "meat". Obviously, we don't know much about the specifics of each URL, but this should provide a very good start for reading our site. Once we split the URLs into their segments, we can group and count them any way we want, and create a useful "table of contents" that would helps in navigating the site.
We will get into an in-depth process of crawling a website in the next article. For now, let's dig deeper into how we can analyze the URLs. To begin with, where we can get a list of website's URLs?
Getting URLs and last modified dates from XML sitemaps
An XML sitemap is basically a text file that contains contains a list of URLs of the website, together with (optionally) their last modified date. Other tags are allowed, but the URL is mandatory, and lastmod is optional but useful.
Typically, websites have a link to their sitemap in their robots.txt file under the Sitemap field. It is straightforward to find the robots.txt file, because its specification is very strict. It has to be placed at the root of the domain, is case-sensitive, and all URL elements count (http or https, www or non-www, and so on).
The robots file also has a set of rules for various crawlers especially regarding which pages or sections of the website not to crawl.
The typical search engine starts crawling a website by first going to the robots file, getting the XML sitemap, and (hopefully) makes sure it follows the rules mentioned in this file.
What issues might arise here? Some rules in your robots.txt might be blocking URLs in sitemaps
We can get a site's XML sitemap by using the advertools sitemap_to_df function, which converts a sitemap to a DataFrame. It can handle:
- Regular sitemaps
- Sitemap index files (sitemaps that link to other sitemaps, for very large websites)
- Compressed/zipped sitemaps
- The URL to a robots.txt file, where it extracts and concatenates all sitemap into one DataFrame.
Getting an XML sitemap with code
sitemap = adv.sitemap_to_df('https://dash.plotly.com/robots.txt')sitemap

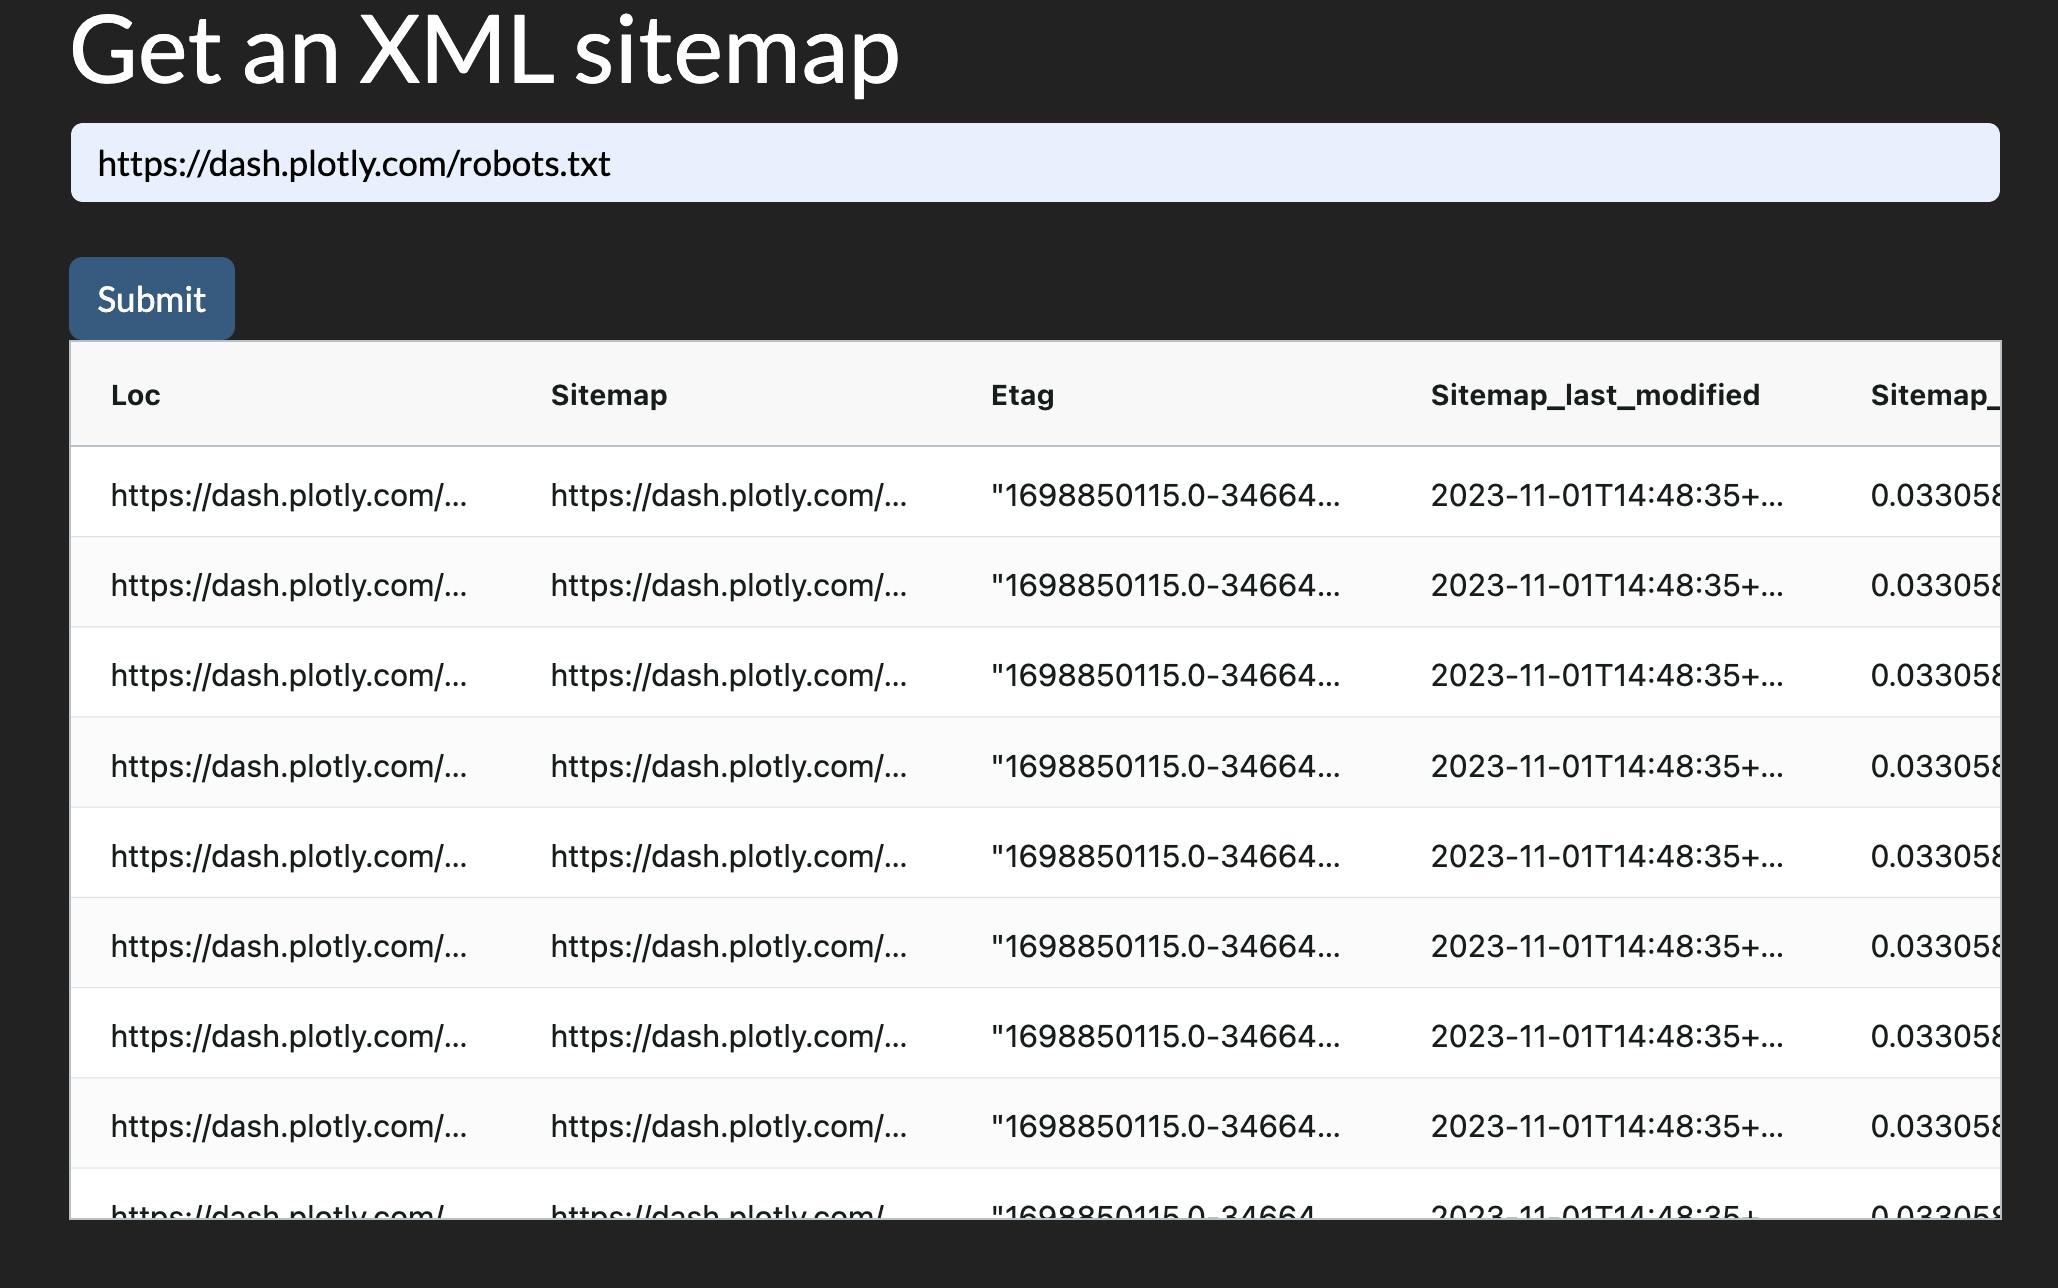
As you can see, we have each tag in its respective column, with a few additional metadata columns. Let's now do it with Dash.
Getting XML sitemaps with Dash
sitmeap_app = Dash(__name__, external_stylesheets=[dbc.themes.DARKLY])sitmeap_app.layout = html.Div([html.H1("Get an XML sitemap"),dbc.Input(id='robots_url',placeholder='Enter the ful URL of a robots.txt file, for example: https://example.com/robots.txt'),html.Br(),dbc.Button('Submit', id='sitemap_submit'), html.Br(),dcc.Loading(html.Div(id='sitemap_output'))], style={'marginLeft': '4%', 'marginRight': '4%'})@sitmeap_app.callback(Output('sitemap_output', 'children'),Input('sitemap_submit', 'n_clicks'),State('robots_url', 'value'))def get_xml_sitemap(n_clicks, robots_url):if not n_clicks:raise PreventUpdatetry:sitemap_df = adv.sitemap_to_df(robots_url)except Exception as e:return html.Div(['Sorry, something went wrong:',str(e)])sitemap_grid = dag.AgGrid(rowData=sitemap_df.to_dict('records'),columnDefs=[{'field': column} for column in sitemap_df.columns])return sitemap_gridsitmeap_app.run(port=8052)
Now that we have a list of URLs of a website, what else can we do?
Visualizing the hierarchical structure of URLs with an interactive treemap
We can use the url_structure to get a view of how the first two directories of our URLs are split.
adviz.url_structure(sitemap['loc'],domain='dash.plotly.com',theme='plotly_dark',items_per_level=50)
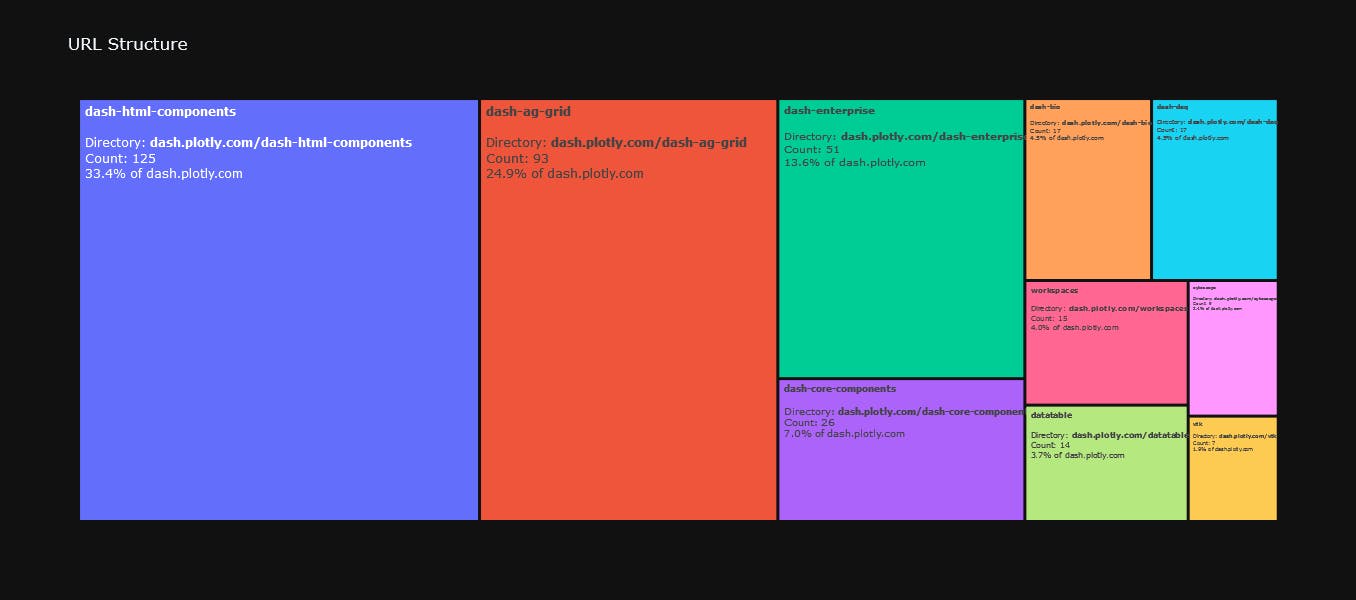
Visualizing the hierarchical structure of URLs in Dash with an interactive treemap
We can now see how the site is structure. We can see the relative importance of each directory (in terms of the number of pages at least). We can click through each of the levels, and see how that level is split. We get URL counts and percentages for an even better understanding of the structure.
The number of URLs is not necessarily an indicator of importance. Some sites have listing pages for example, where each listing take a separate URL, and they might amount to a large percentage of the website, yet not be the most important segment of the site.
As with every dataset, we can almost never get the full picture, but we are starting to put together our puzzle.
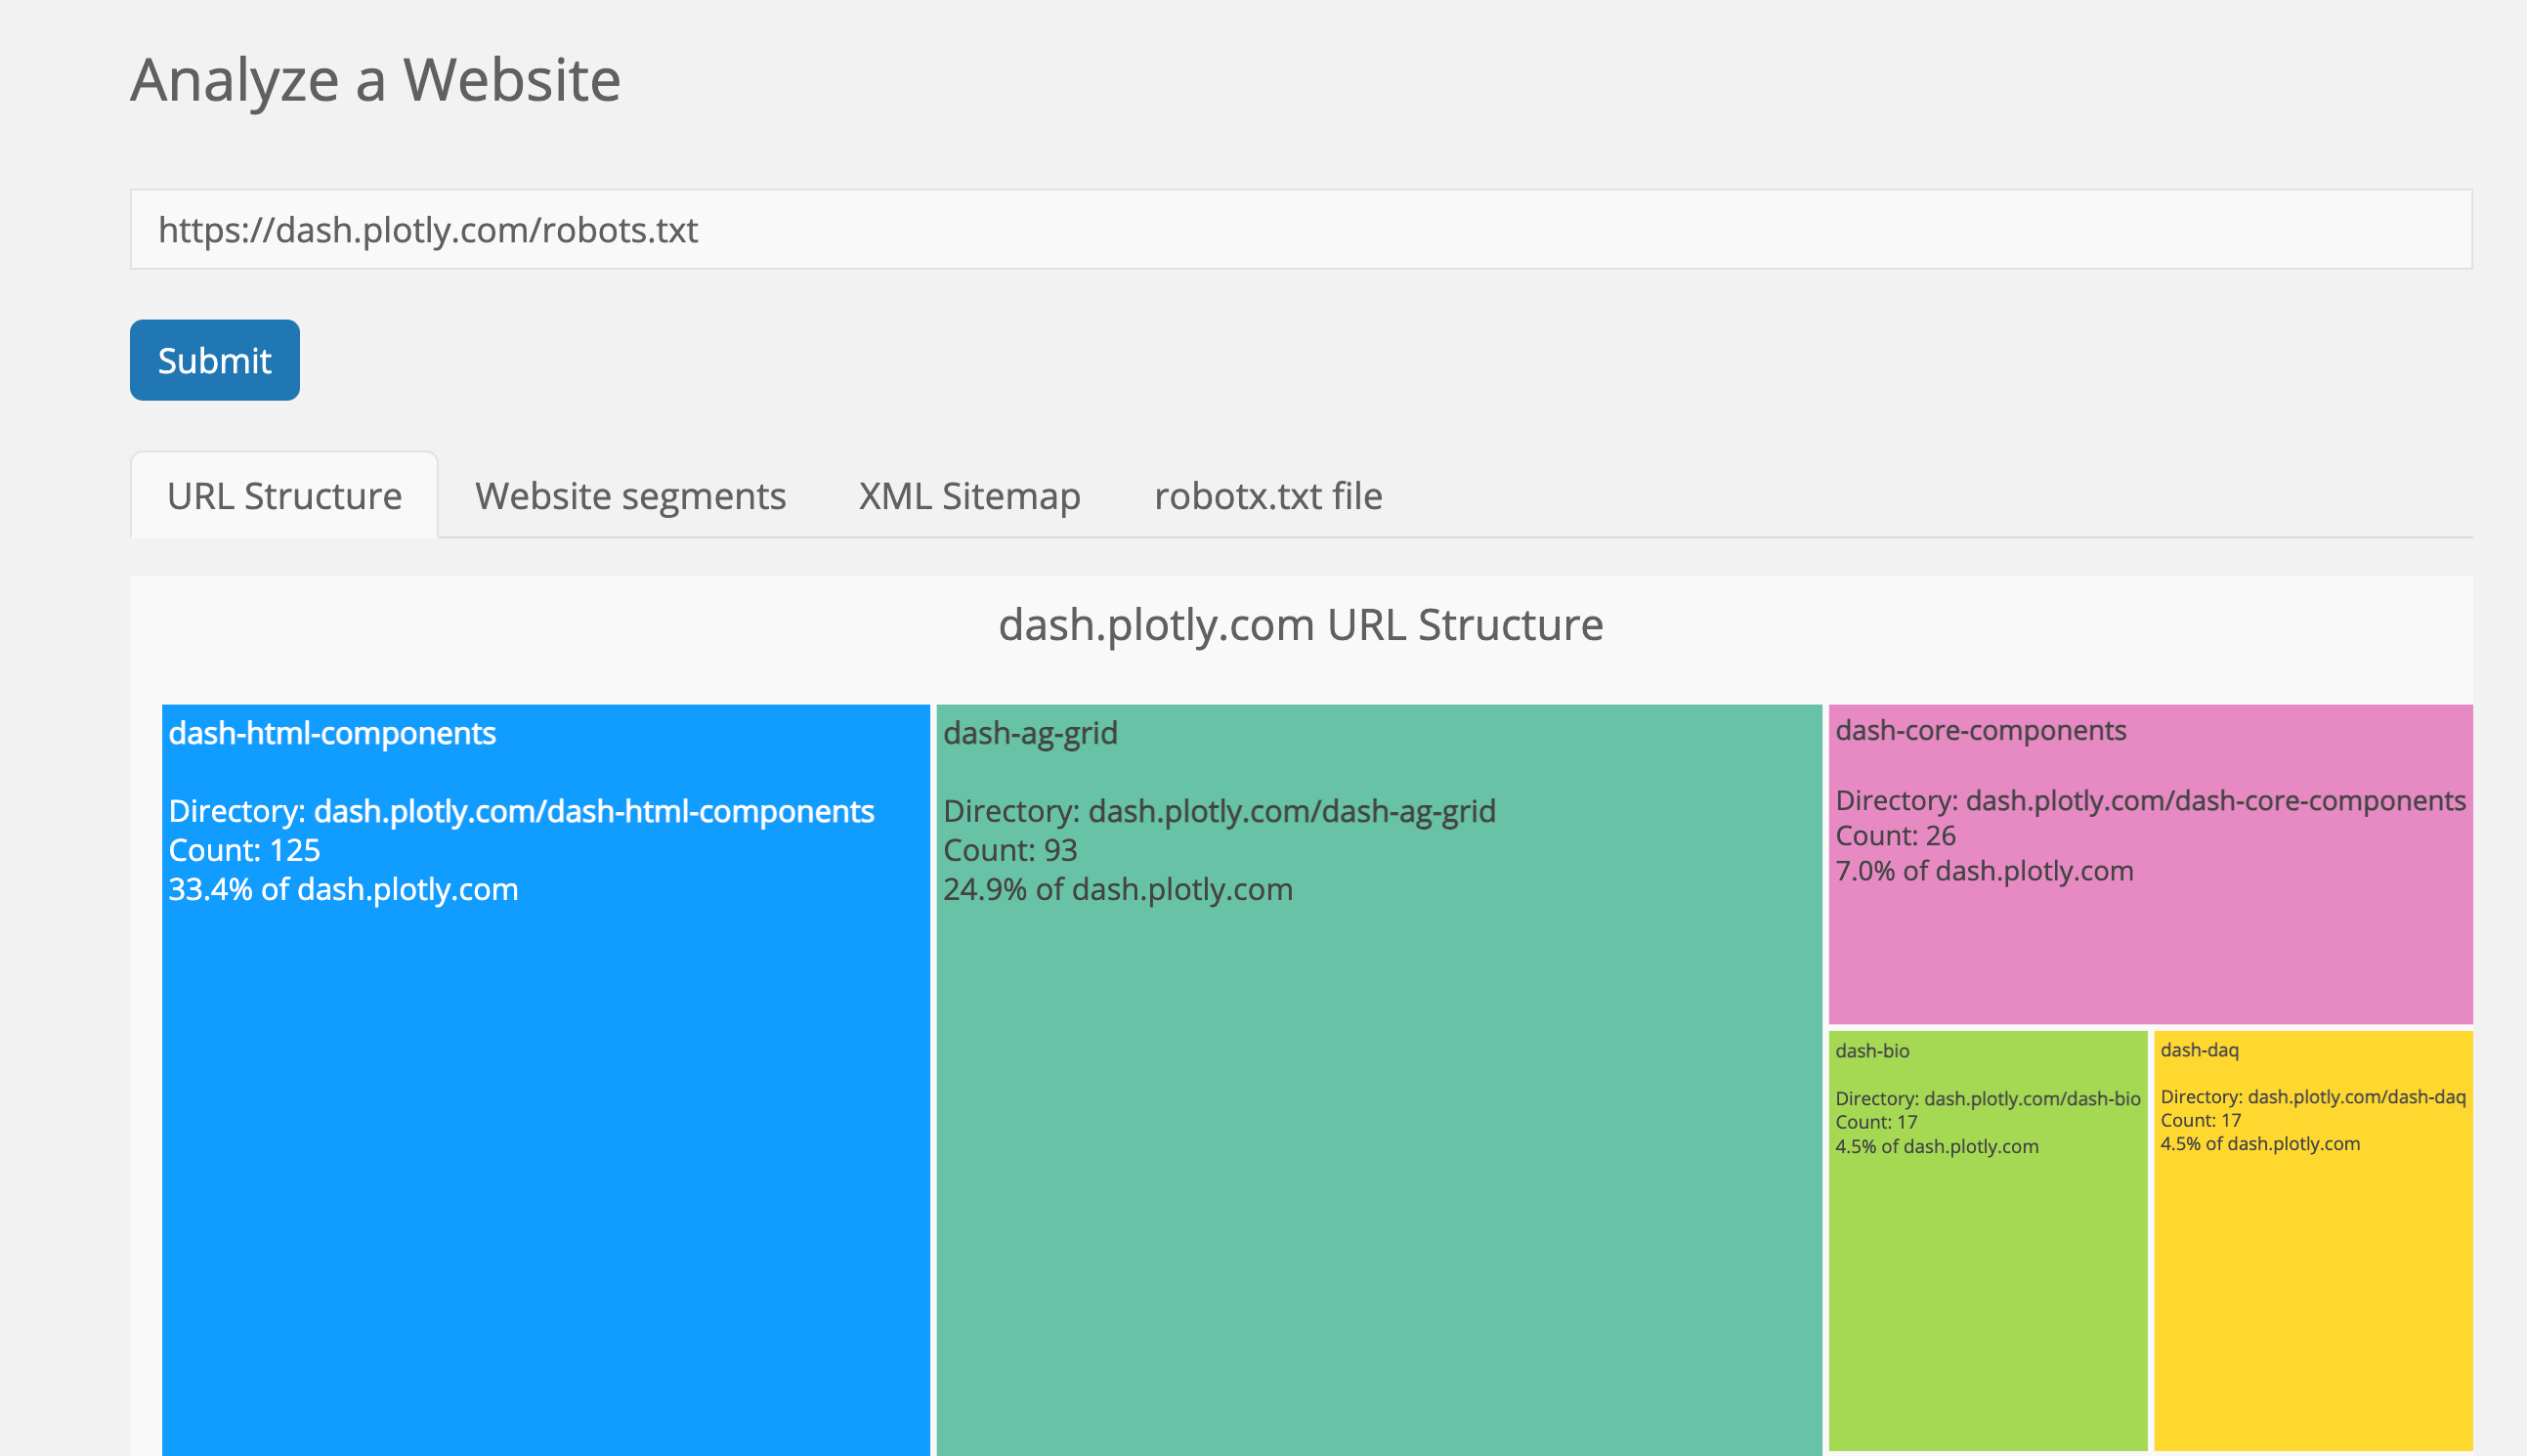
Putting it all together
We are now in a position to place all our mini apps under one app, where the user simply has to enter a robots.txt URL, and they then have access to all the features we just worked on. This can be achieved with a simple tab structure, so each mini app would stand alone, and yet other features would still be accessible.
Full code:
app = Dash(__name__, external_stylesheets=[dbc.themes.DARKLY])app.layout = html.Div([html.Br(), html.Br(),dbc.Row([dbc.Col(lg=1),dbc.Col([html.H2("Analyze a Website"),dbc.Input(id='robots_url',placeholder='Enter the full URL of a robots.txt file, e.g: https://example.com/robots.txt'),html.Br(),dbc.Button('Submit', id='submit'),html.Br(), html.Br(),dcc.Loading(html.Div(id='robots_table')), html.Br(),], lg=10),dbc.Col(lg=1)])])@app.callback(Output('robots_table', 'children'),Input('submit', 'n_clicks'),State('robots_url', 'value'))def display_robots_table(n_clicks, robots_url):if not n_clicks:raise PreventUpdatetry:sitemap_df = adv.sitemap_to_df(robots_url)except Exception as e:return html.Div([f'Sorry, something went wrong!' , html.Br(),html.B(f'{str(e)}.'), html.Br(),'Please make sure you have the correct URL.'])domain = urlsplit(robots_url).netlocurldf = adv.url_to_df(sitemap_df['loc'])url_structure_fig = adviz.url_structure(sitemap_df['loc'],items_per_level=30,height=700,theme='darkly',title=f'{domain} URL Structure',domain=domain)url_structure_fig.layout.font.size = 14robots_df = adv.robotstxt_to_df(robots_url)columnDefs = [{'field': column} for column in sitemap_df.columns]sitmap_grid = dag.AgGrid(defaultColDef={"resizable": True, "sortable": True, "filter": True},rowData=sitemap_df.to_dict("records"),columnDefs=columnDefs)if 'lastmod' in sitemap_df:lastmod_fig = px.ecdf(sitemap_df,x='lastmod',markers=True,lines=False,hover_name='loc',template='darkly',title=f'Publishing trends<br><b>{domain}</b>',height=600,ecdfnorm='percent')lastmod_fig.layout.xaxis.showspikes = Truelastmod_fig.layout.yaxis.showspikes = Truelastmod_fig.layout.yaxis.ticksuffix = '%'lastmod_fig.data[0].marker.symbol = 'circle-open'lastmod_fig.data[0].marker.size = 20lastmod_figure = dcc.Graph(figure=lastmod_fig)else:lastmod_figure = ''robots_grid = dag.AgGrid(rowData=robots_df.to_dict('records'),defaultColDef={"resizable": True, "sortable": True, "filter": True},columnDefs=[{'field': column} for column in robots_df.columns])user_agents = robots_df[robots_df['directive'].str.contains('user-agent', case=False)]['content']robots_test = adv.robotstxt_test(robots_url,user_agents=user_agents,urls=sitemap_df['loc'])urldf_grid = dag.AgGrid(defaultColDef={"resizable": True, "sortable": True, "filter": True},rowData=urldf.to_dict('records'),columnDefs=[{'field': column} for column in urldf.columns])tabs = dbc.Tabs([dbc.Tab(dcc.Graph(figure=url_structure_fig), label='URL Structure'),dbc.Tab(urldf_grid, label='Website segments'),dbc.Tab([lastmod_figure, sitmap_grid], label='XML Sitemap'),dbc.Tab(robots_grid, label='robotx.txt file'),])return tabsapp.run(jupyter_height=800, port=8053)
Advanced theming with Dash Enterprise Design Kit
As we've see, Dash already provides powerful and customizable user interface layout and theming management mainly through Dash Bootstrap Components (as well as other similar packages like Dash Mantine Components).
In addition to that, Dash Enterprise offers even further easy UI customization with Dash Enterprise Design Kit.
Dash Enterprise Design Kit components
Several high-level components make coding and laying out an app much easier, like cards, block, reports, and pages. Dash Enterprise Design Kit elevates data applications to an enterprise-level of functionality, making them well-suited for business use. The ability to create and share custom reports, including PDF conversion allows app designers and developers to focus more on analysis and insights, rather than spending time assembling reports every week.
Graphical UI for customizing themes
Another feature that offers a selection of initial themes and templates can be highly beneficial. It provides pre-made, well-designed color palettes that can be easily customized, aiding in your design process.
The same app can look like this when themed with Dash Enterprise Design Kit, for example:
Summary
We've crafted some simple tools that can quickly help you understand a website without taking up too much time or resources. These tools can be your go-to for getting insights into a website's structure, content, products, and more.
By taking a closer look at websites by crawling through them, you can gain a better understanding of website structure to drive marketing ROI.