Introducing DataAnalyticsBench
October 14, 2026. A new benchmark from Plotly that measures AI's ability to do data analytics, built with researchers at Mila.
At Plotly, our agentic analytics products (Plotly Studio Desktop and Plotly Studio Embedded) work with any model, and customers often ask us which model to use and, at a higher level, whether or not we can even trust AI to do data analytics.
Coding benchmarks measure software engineering, and many preexisting data analytics benchmarks have either been benchmaxxed, use well-known datasets with widely-known conclusions (e.g. Iris or Titanic datasets) or fail to fully address the nuances involved in data analytics.
For the last few months we've been building DataAnalyticsBench with researchers at Mila. It's a 43-question exam that an AI agent answers against a 20M-row data warehouse, using the Plotly Studio Embedded harness. This post covers how it works and what we've learned testing 26 models.
The results
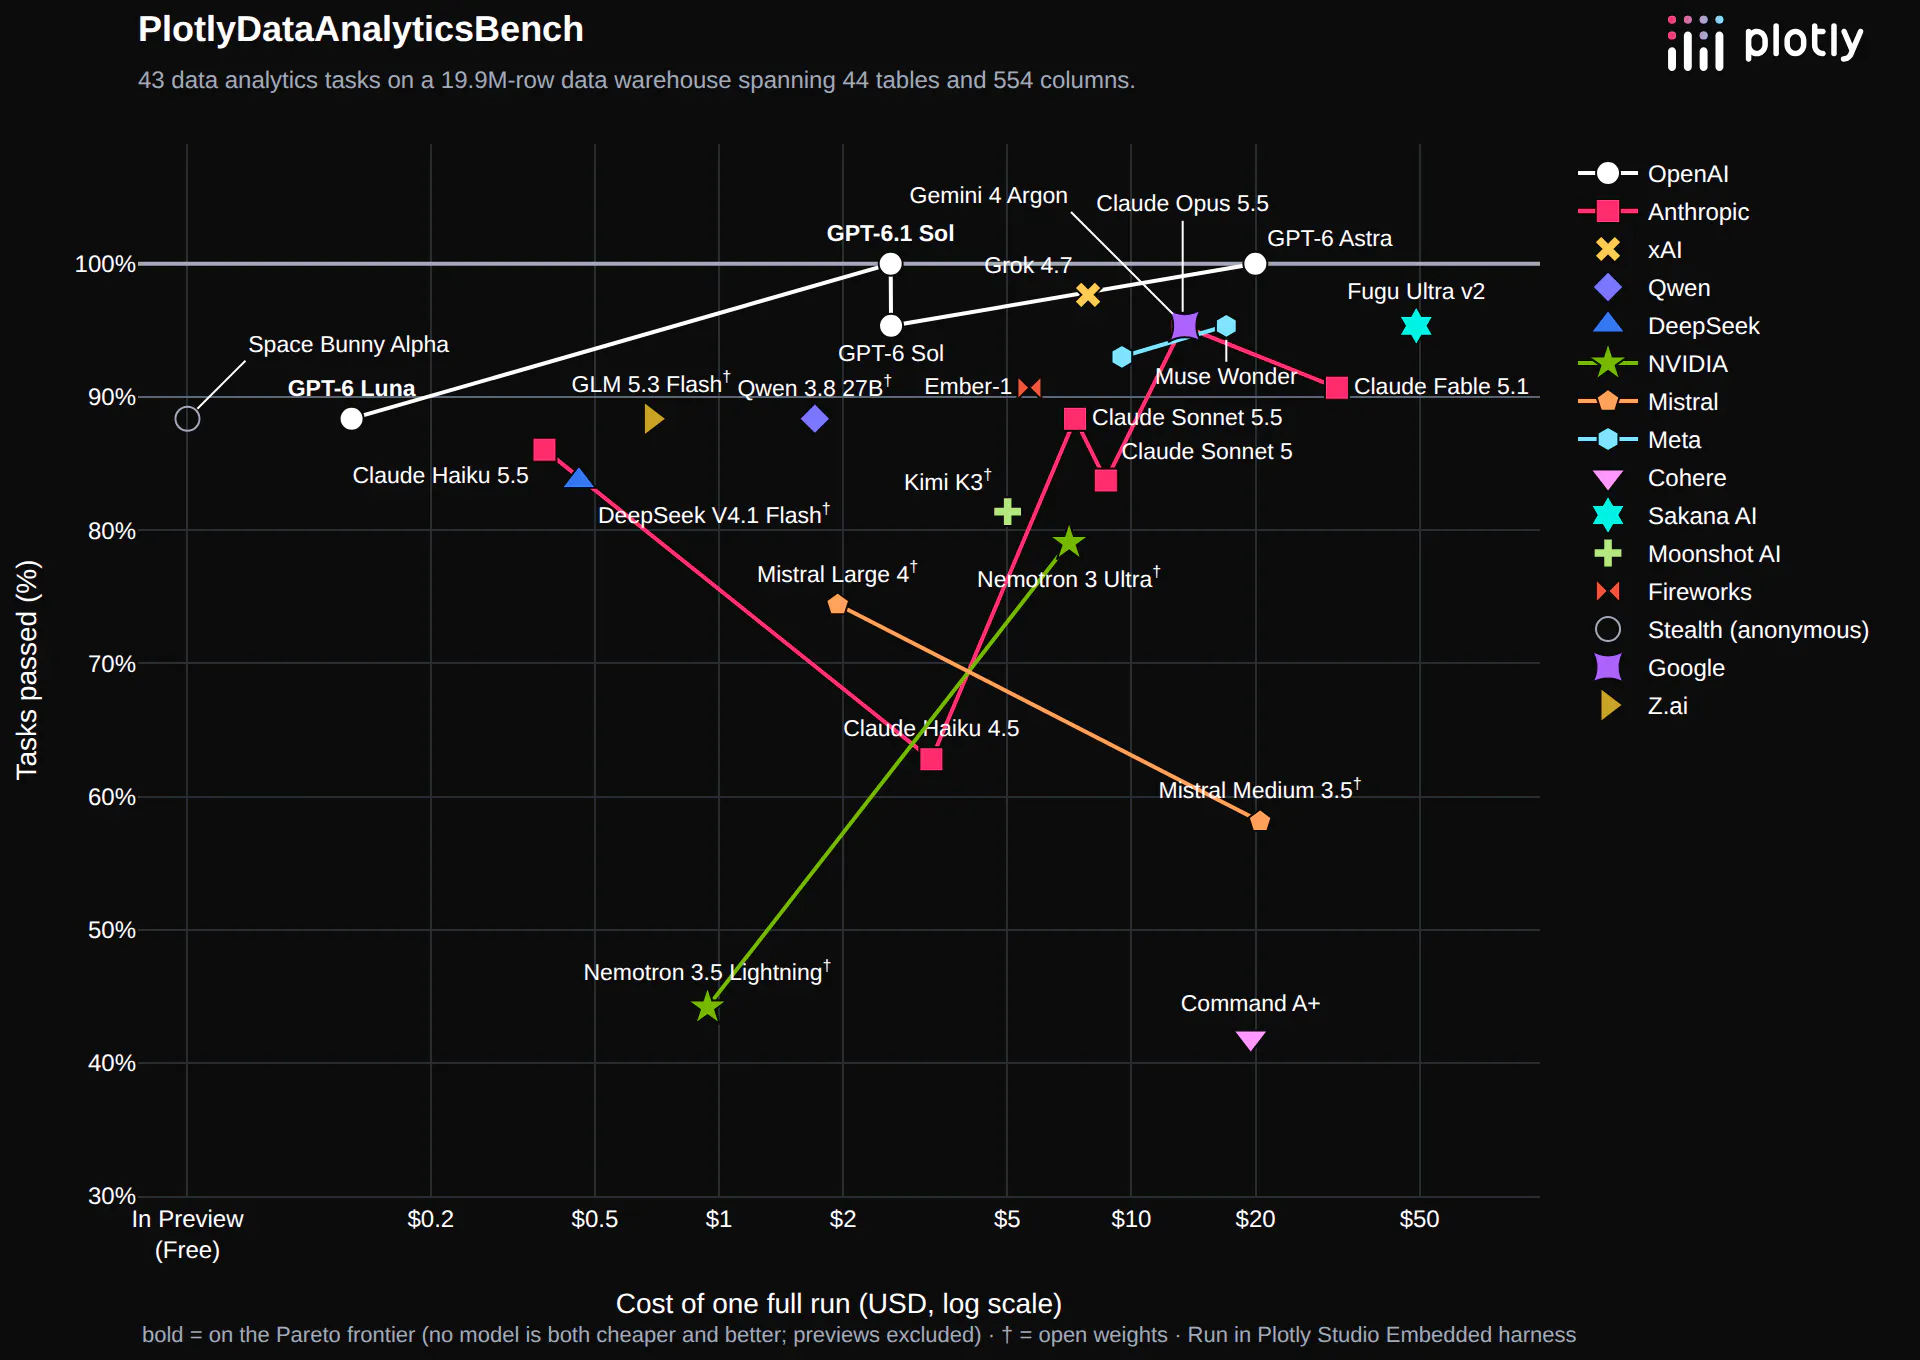
GPT-6 Astra was the first model to ace the exam. Then, 3 weeks later OpenAI released GPT-6.1 Sol which was the second model to ace it, and it did so at 10% of the cost. And GPT-6 Luna got a B+ at 5% of that cost. As of October 13, 2026, Sol and Luna hold down the cost-accuracy frontier for closed-weight models. Claude Haiku 5.5, released October 7, lands just behind Luna: 37 of 43 for $0.38 a run, and it's the fastest model on our leaderboard. Meta's Muse Wonder, released October 12, joined the top group at 41 of 43, tying Claude Opus 5.5. Google's Gemini 4 Argon, released October 13, also scored 41 of 43.
Among open-weight models, GLM 5.3 Flash and Qwen 3.8 27B both passed 38 of 43, for $0.69 and $1.71 a run. Qwen 3.8 27B is notable because it's small enough to run on a desktop with 64 GB of memory, like a Mac mini.
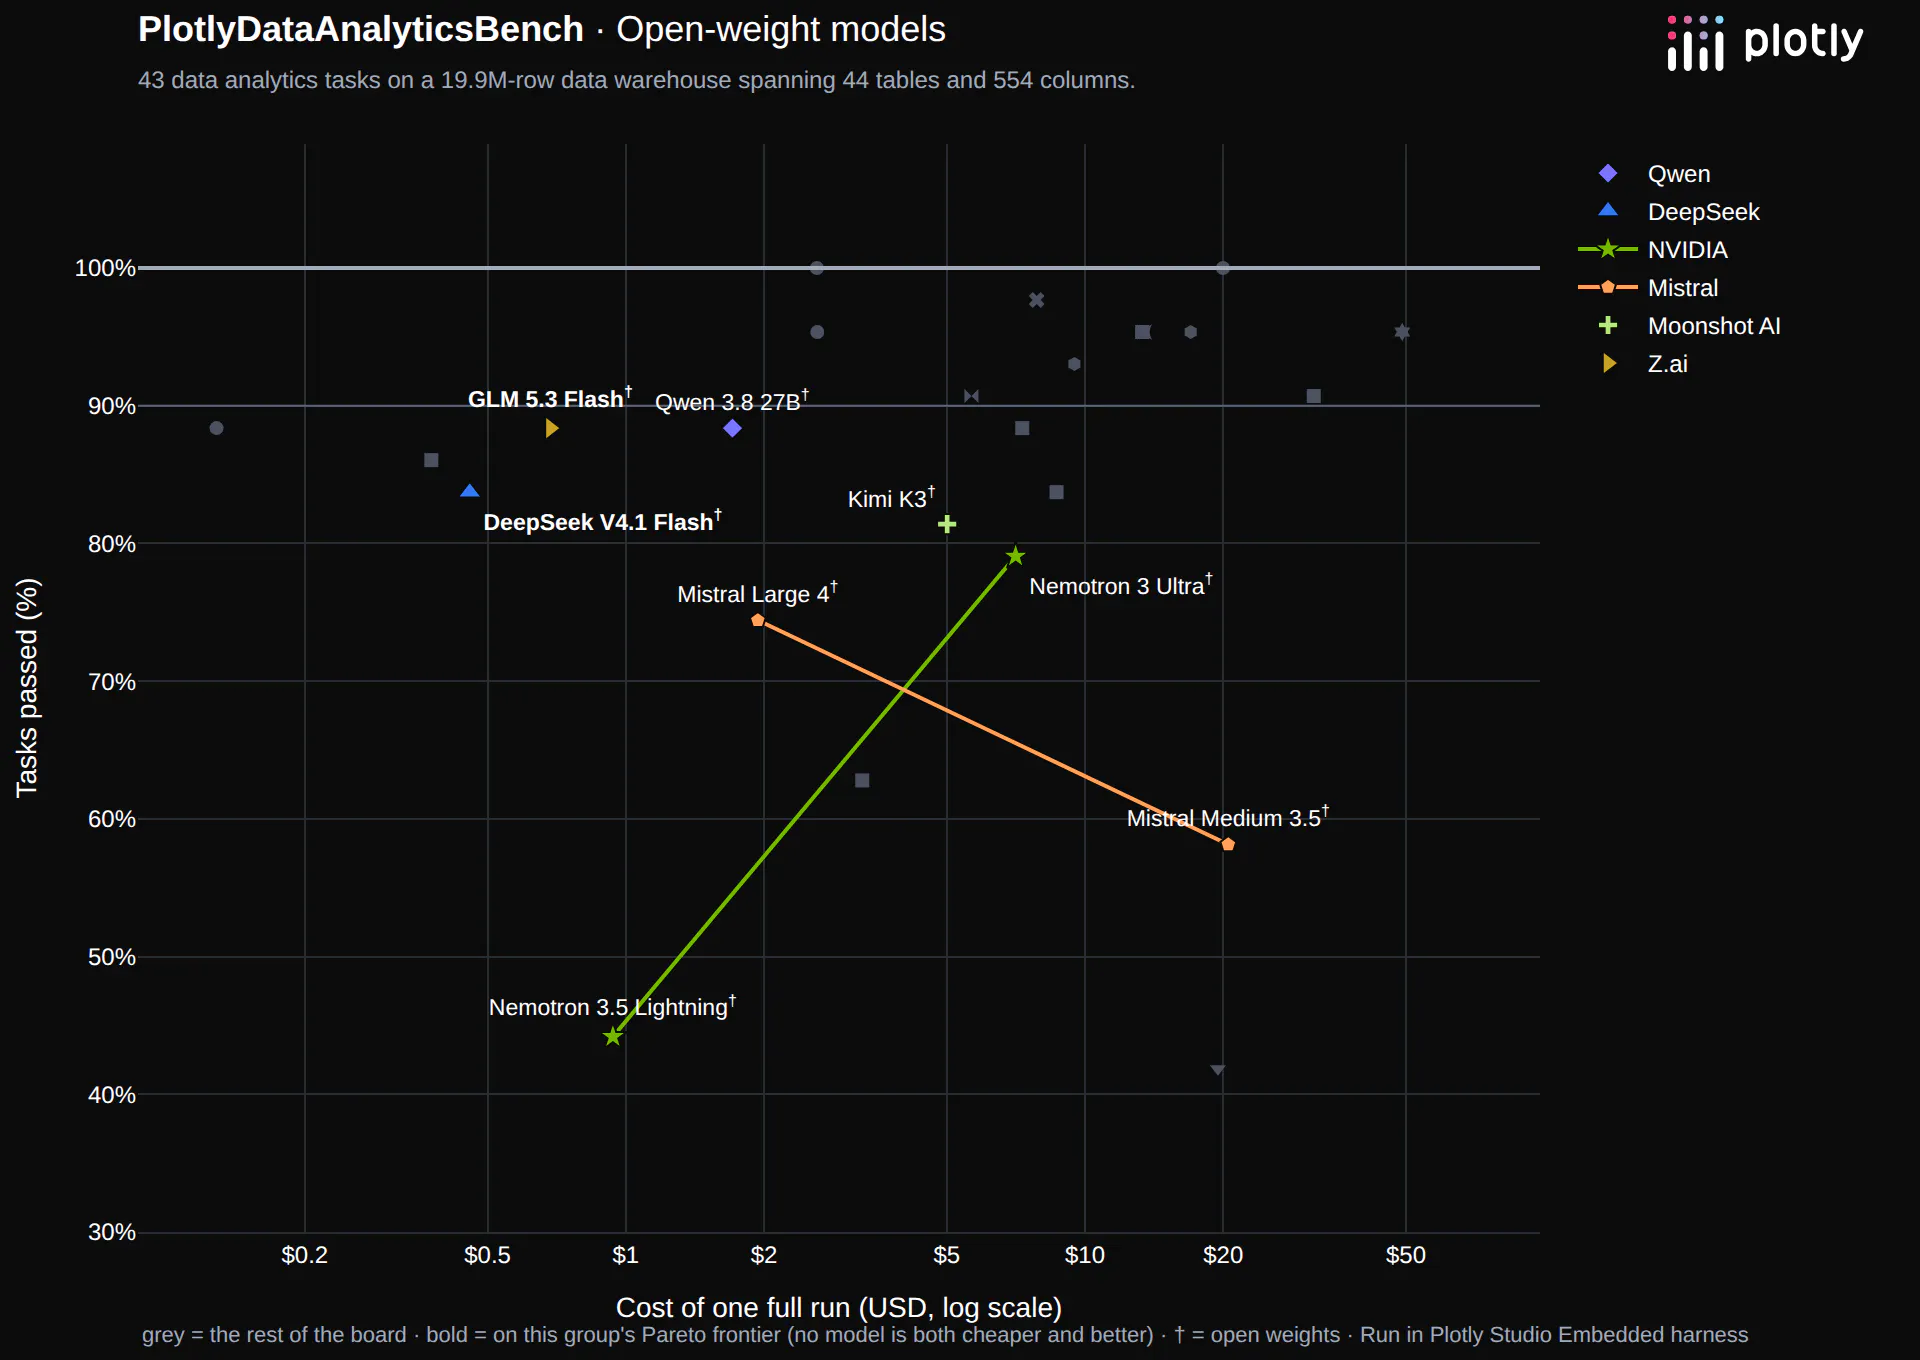
Cheaper or faster tokens don't always mean cheaper or faster analysis. Nemotron 3.5 Lightning has a lower list price per token than GPT-6 Luna, but it made 12 model calls per question to Luna's 4.5 and read about four times as many tokens. A full run cost $0.94 against Luna's $0.13, and took a median of 54 seconds per question against Luna's 18.
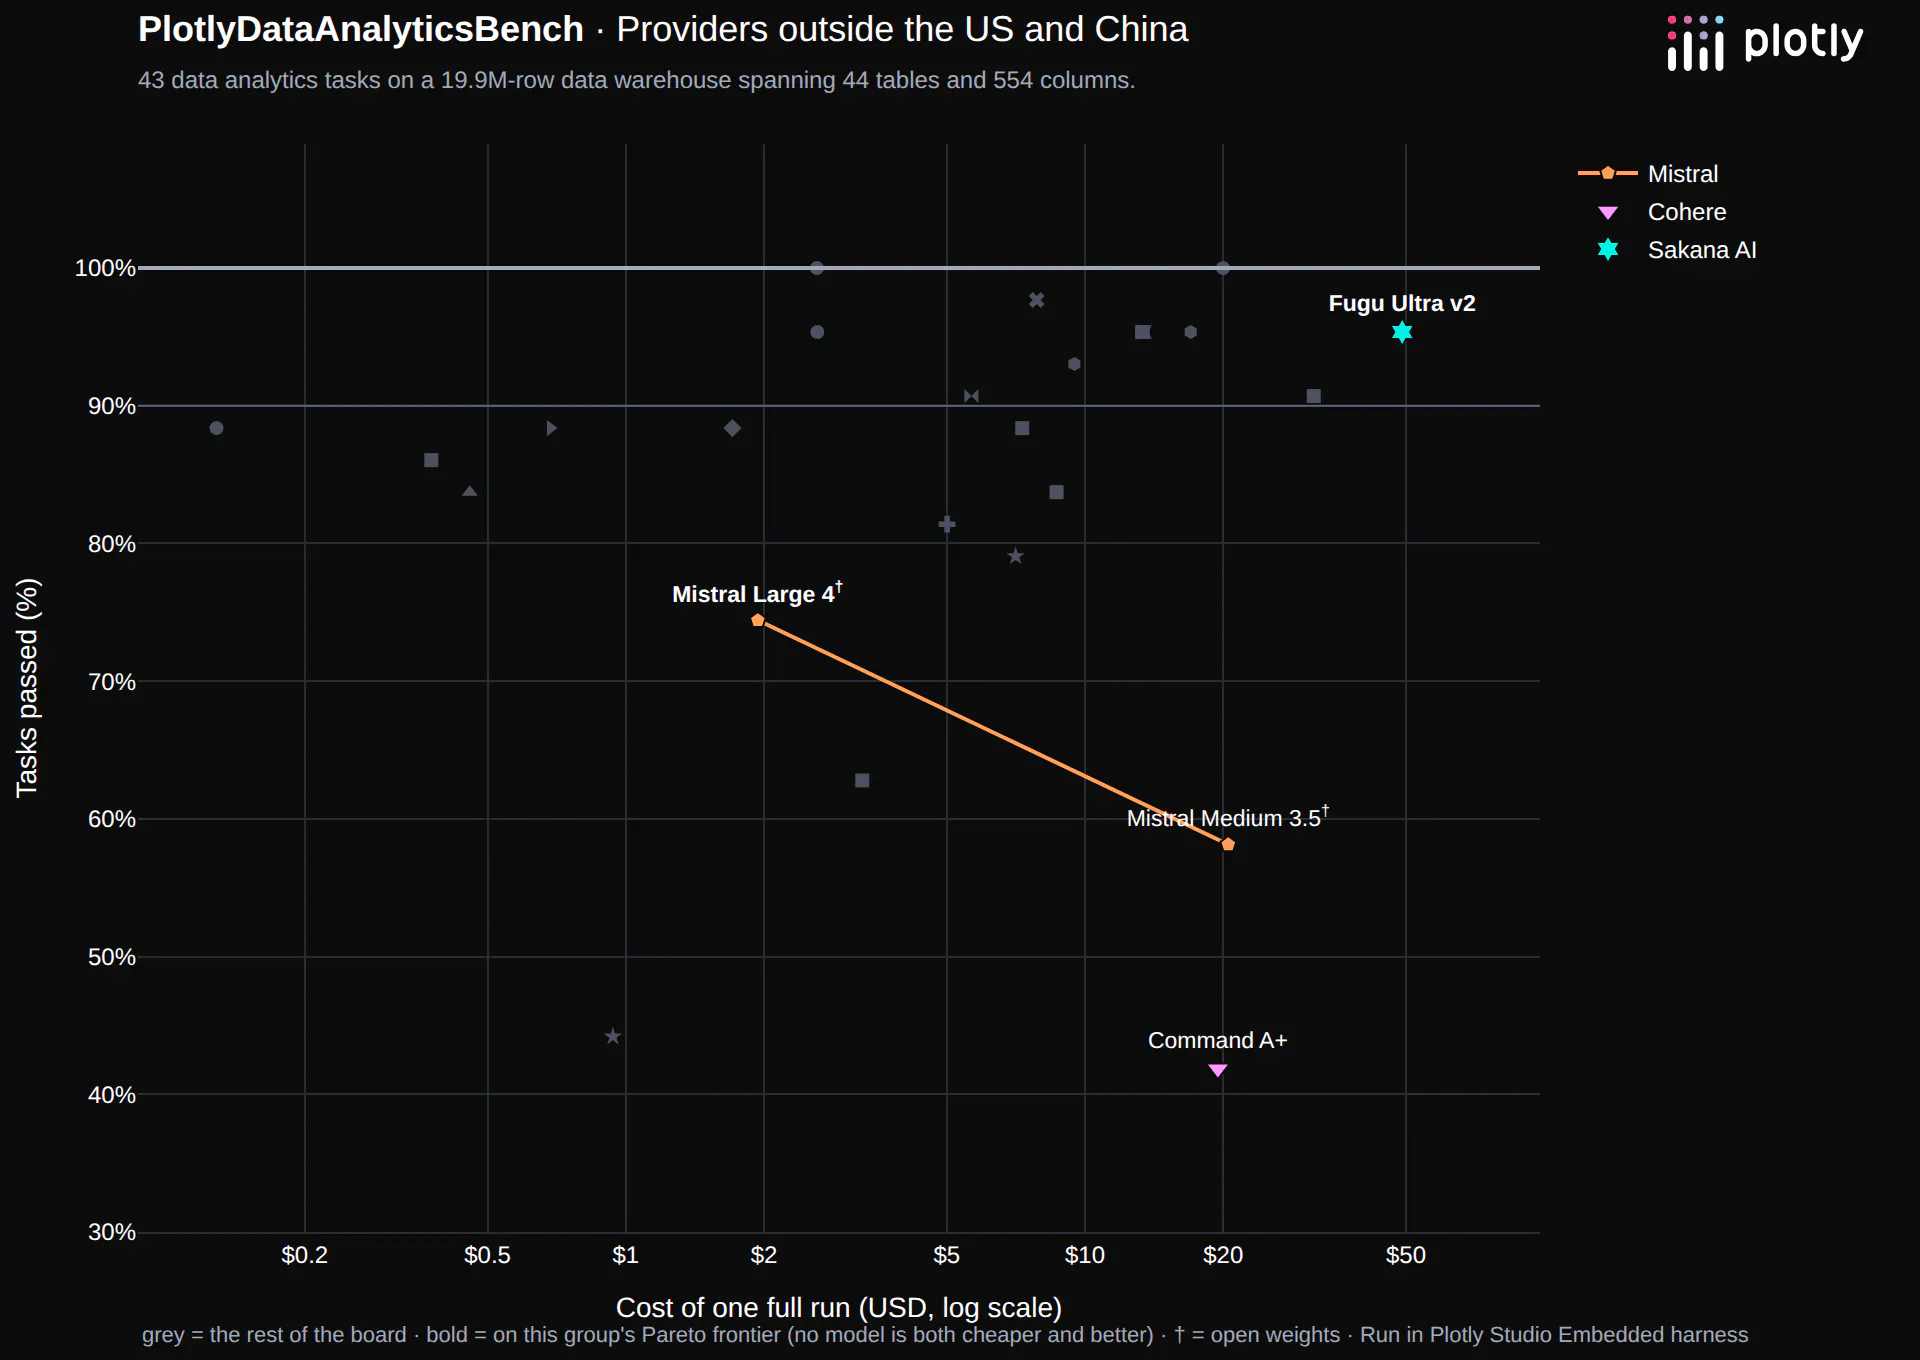
Many of our customers have been watching the sovereign AI providers outside of the US and China with interest: Mistral in France, Cohere in Canada and Sakana AI in Japan, Aleph Alpha in Germany, Motif, Upstage, and SK Telecon in South Korea, and K2 Horizon in United Arab Emirates. Here's how some of these models do. Notice that Mistral had a big release last week (October 6th).
Most models handle straightforward analytics well. Of our straightforward analytics questions, 18/26 models got all of the questions correct. The models differ in their ability to find data quality issues, answer statistical questions meaningfully, and find hidden trends buried deep in the data.
Many AI models will soon be "good enough" for data analytics
When we first saw a model ace the benchmark, we immediately though "we're gonna need a harder exam.". On further reflection, this benchmark is unique because it represents sufficiently complex day-to-day data analytics; if all models get 100% then that means that AI has become commoditized for data analytics. Software is different: there is always a harder program to write, like a web browser, so the ceiling keeps rising. The questions a business asks of its data don't keep getting harder in the same way.
As more models clear that bar, we expect them to compete on cost and efficiency, including whether they can run locally. We're already starting to see this. GPT-6.1 Sol matched GPT-6 Astra's perfect score for a fraction of the cost, GPT-6 Luna scored a B+ for 5% of Sol's cost, Claude Haiku 5.5 went from a D to a B in a year while getting almost 9x cheaper, and Qwen 3.8 27B scored a B+ on hardware you can keep on a desk.
Speed
For each model we measured the median wall-clock time per question, from sending the question to the final answer, including the queries it ran.
Speed is important when AI analytics are being used in the foreground by end-users. If answering a question takes more than 20-30s, then users will get distracted and work on something else. It's possible that more AI analytics will be done in the background (this is what's happening in software today) and in these cases, speed isn't as important as cost and capability.
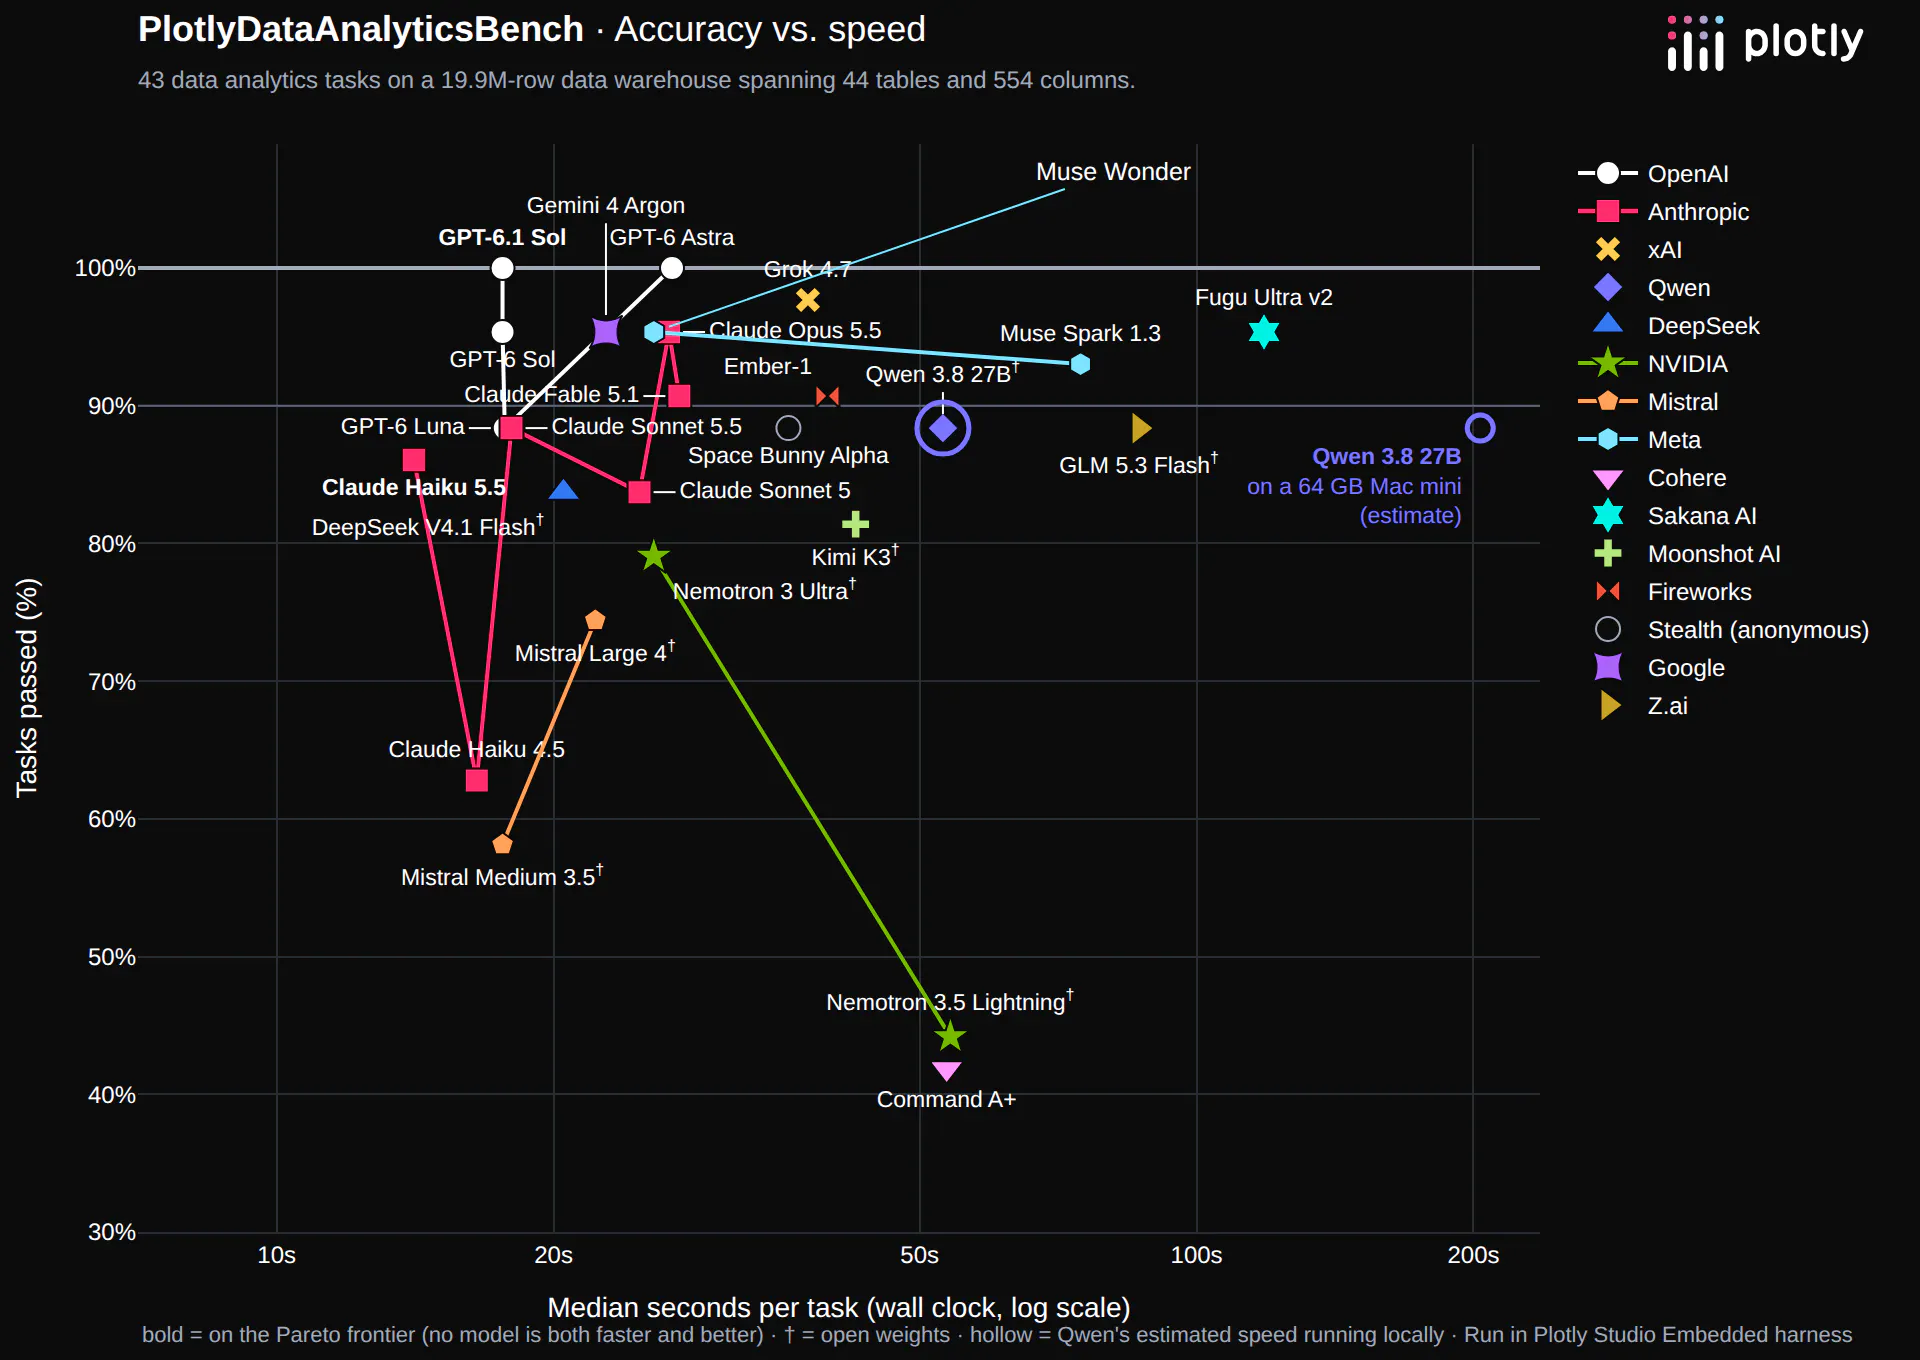
GPT-6.1 Sol is the fastest model with a perfect score, at a median of 18 seconds per question. GPT-6 Luna and Claude Sonnet 5.5 are about as fast, with 38 of 43. Claude Haiku 5.5 is the fastest model overall, at 14 seconds, with 37 of 43. At the other end, Fugu Ultra v2 takes about 2 minutes per question, and GLM 5.3 Flash and Muse Spark 1.3 each take well over a minute.
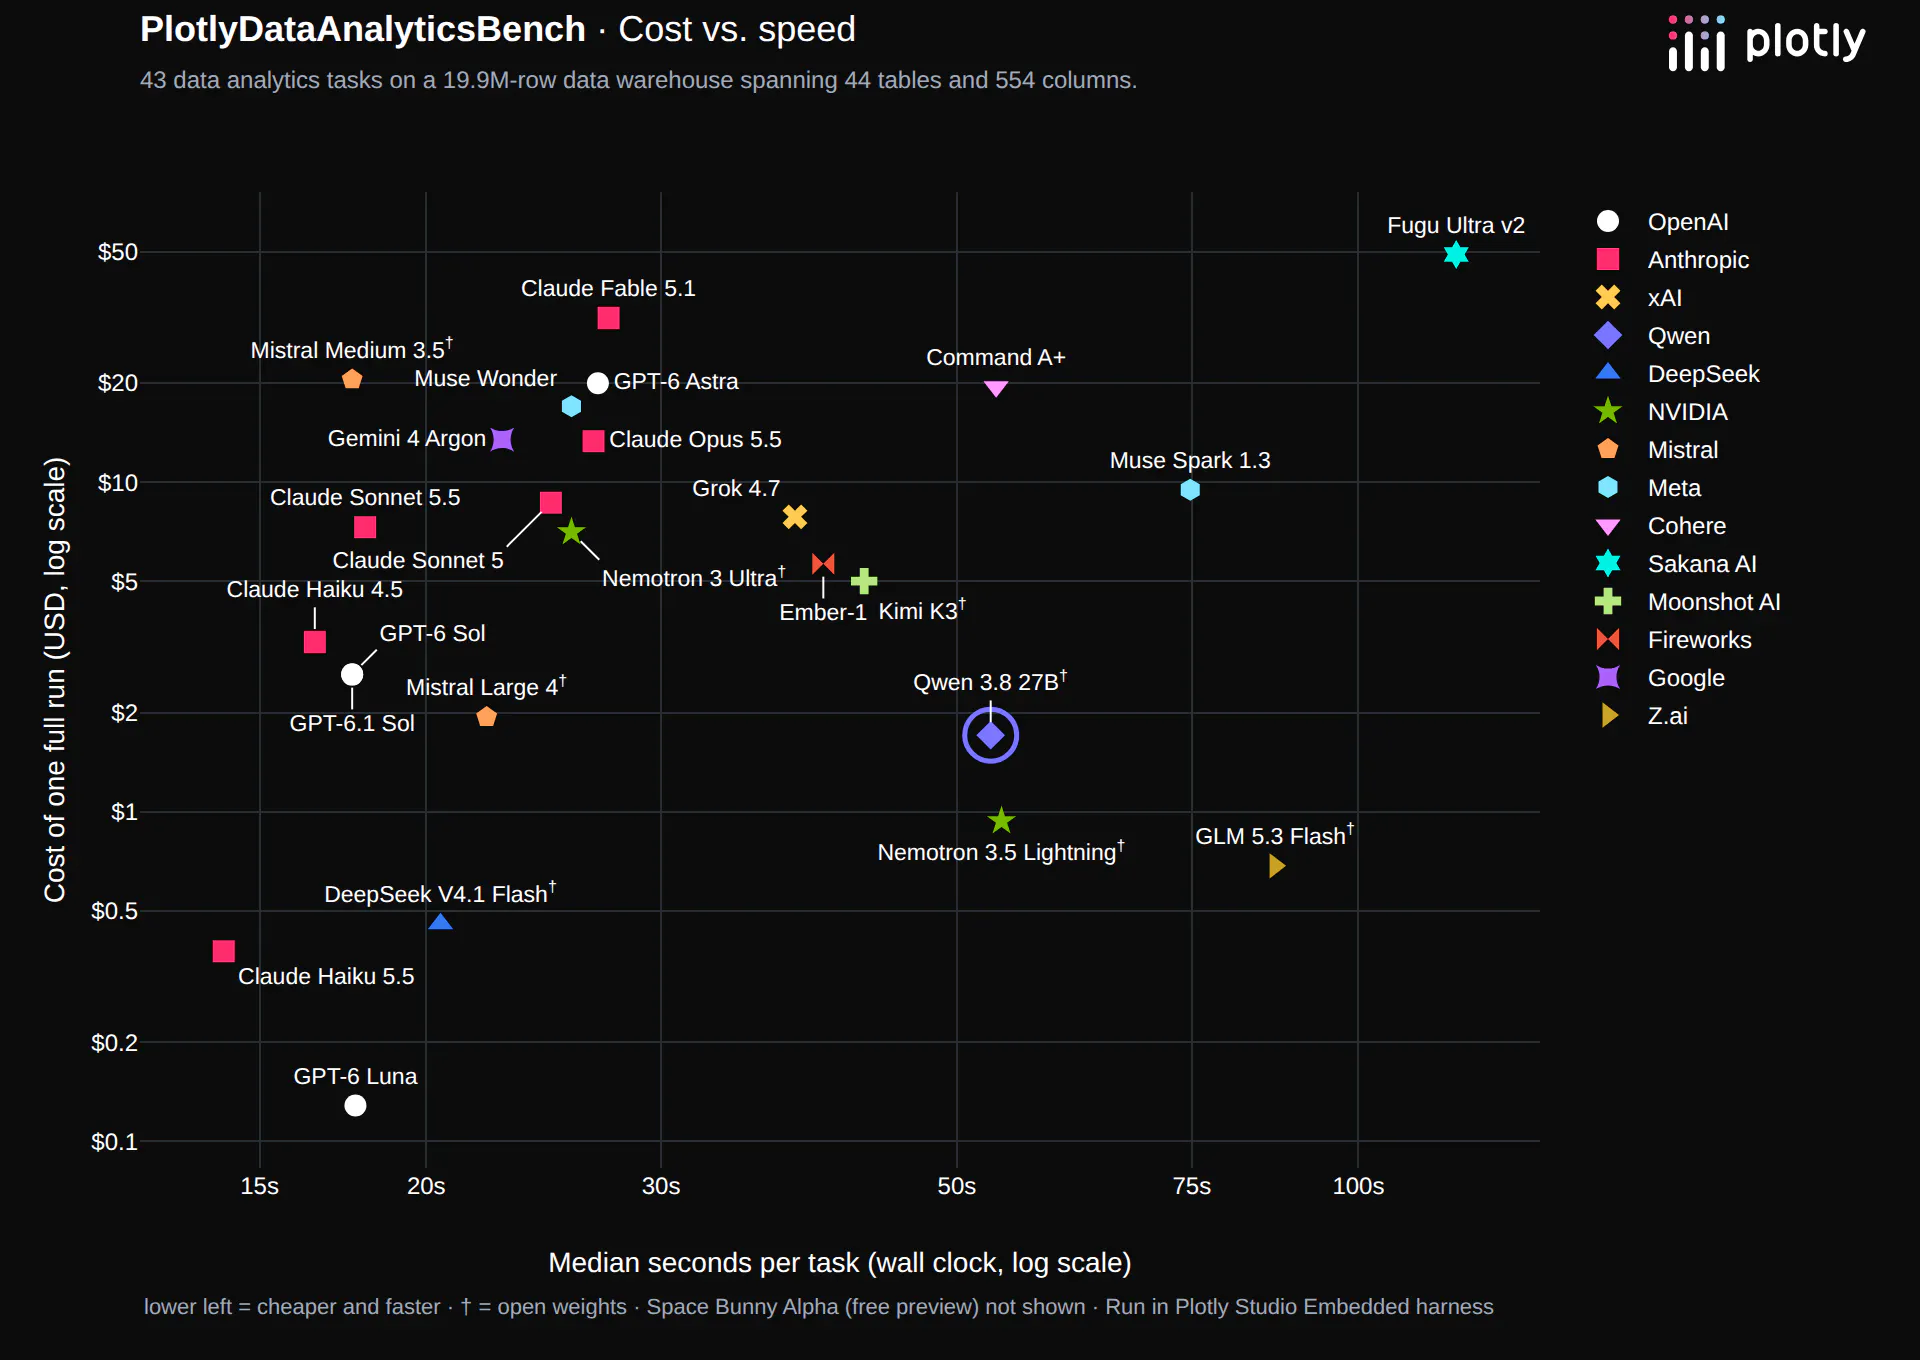
Cost and speed don't move together. GPT-6 Luna is the cheapest paid model and also one of the fastest, and Claude Haiku 5.5 and DeepSeek V4.1 Flash are the only other models under $1 a run that answer in about 20 seconds or less. Most of the other inexpensive open-weight models, like GLM 5.3 Flash, Qwen 3.8 27B and Nemotron 3.5 Lightning, take 50 seconds or more. Mistral Medium 3.5 is the reverse: fast, at 18 seconds, but $20 a run.
Two caveats. These are medians, and a few hard questions take much longer, so averages are higher (GLM 5.3 Flash averages 4 minutes per question). And we called every model through OpenRouter, so an open-weight model's speed depends on the provider that served it.
That matters if you're thinking about running a model locally. Qwen 3.8 27B, circled in both charts, took a median of 53 seconds per question through OpenRouter, where hosted providers generate roughly 40 to 75 tokens per second for it. An M5 Pro with 64 GB of memory generates about 18 tokens per second on a 27B model, and reads prompts at about 470 tokens per second. Per question, Qwen (circled in the charts above) wrote about 9,000 tokens and read about 50,000 new prompt tokens, so we estimate it would be about four times slower on a Mac mini: around 3½ minutes for a typical question, and about 10 minutes on average.
What it costs to roll out across an organization
Many of our customers want to put AI analytics in front of everyone in their organization, not just a few analysts, and cost has become one of their first questions. How do these costs scale up?
The costs in this benchmark are API costs: what each model charges per token, which we paid through OpenRouter. There are two worlds of AI pricing right now. Developers at startups and smaller companies mostly use flat-rate subscriptions, which let them use far more tokens than the monthly fee would buy at API prices. Most enterprises pay per token, because that's what's available through their cloud providers, like AWS, Azure or Google Cloud, with the SLAs and data privacy they need. Rolling AI analytics out across an enterprise means paying those token costs.
Say 1,000 business users and analysts each ask 10 questions a day, over 250 working days a year. That's 2.5 million questions a year. At the API cost per question each model had on our exam, that comes to:
Model
Score
Cost per person per year
Cost per year, 1,000 people
GPT-6 Luna (frontier)
38 / 43
$7.50
$7,500
GPT-6.1 Sol (frontier)
43 / 43
$152
$152,000
GLM 5.3 Flash (open weights)
38 / 43
$40
$40,000
Claude Haiku 5.5
37 / 43
$22
$22,000
Claude Opus 5.5
41 / 43
$774
$774,000
Gemini 4 Argon
41 / 43
$783
$783,000
Muse Wonder
41 / 43
$990
$990,000
GPT-6 Astra
43 / 43
$1,161
$1,161,000
The two models on the cost-accuracy frontier differ by about 20x. GPT-6 Luna would cost about $7.50 per person per year, or $7,500 for the organization, and GPT-6.1 Sol about $152 per person, or $152,000, for a perfect score. Claude Haiku 5.5, which scores 37 of 43, would cost about $22 per person, or $22,000. Muse Wonder and Gemini 4 Argon, which tie Opus at 41 of 43, would cost about $990 and $780 per person. GPT-6 Astra, which also scores 43 of 43, would cost over $1,100 per person, or $1.1 million. That's how we'd suggest thinking about model costs right now: per person per year, at the accuracy you need.
Cost per person also lets you compare against buying each analyst hardware and running an open-weight model locally. Qwen 3.8 27B, which scored 38 of 43, runs on 64 GB: an M5 Pro with the 64 GB upgrade is about $2,700. Spread over three years, that's about $900 per person per year, before electricity. A 27B model also fits on an NVIDIA RTX 5090 at 4-bit, but with the current memory shortage the card alone sells for $3,700 or more. At 10 questions a day, a machine per analyst costs more than calling Qwen through a hosted provider ($99 per person per year) or GPT-6.1 Sol for a perfect score ($152). Running locally makes sense today when data can't leave your network, or when one shared machine serves many people. This will change as open-weight models get smaller and better, and hardware gets cheaper.
This is also why we measure cost on every run. It tells us whether a change to our harness makes the agent cheaper or more expensive per question, and keeping the harness efficient is what makes rolling it out to a whole organization viable.
Treat these as rough numbers. Exam questions are harder than many everyday questions but also real conversations carry follow-ups and more context, and prices change.
And in practice, many questions get asked over and over. That's why we built Plotly Studio Embedded to add agentic analytics on top of an existing Dash app: the dashboard answers the questions people ask every day without calling a model, and the agent handles the follow-ups the dashboard doesn't cover.
What would it take to trust AI analytics?
Data analytics goes beyond "text to SQL" tasks. In the real world, data is messy and questions can be ambiguous with multiple possible answers or interpretations. A good data analysis will state assumptions and recognize if the question can't be answered with the data.
Our benchmark exam covers these tasks. We designed six types of questions:
- Analytics (20): multi-step questions with an unambiguous correct answer. These are the "straightforward" analytics questions that we mention.
- Ambiguous (5): questions with more than one reasonable reading, like "Which is our best-performing wind farm?" where "best-performing" has multiple possible meanings.
- Impossible (5): questions the data can't answer, like asking for solar output from an all-wind fleet. In these questions, we're testing that the AI model doesn't hallucinate or present a misleading answer.
- Statistics (5): confounding variables, skewed costs where the mean is misleading, and comparisons that need a significance test.
- Data quality (3): dealing with planted defects, like duplicated rows or a week of missing sensor readings, in questions that don't mention them.
- Needle in a haystack (5): detecting a hidden pattern in the data that the question points toward without naming.
Example questions
Here are a few of the questions from our exam. They're set at a fictional wind energy company, and they range from detailed specifications to the kind of one-line question someone might type into a chat box.
Some of the analytics questions include specific references to the data schema. This one asks how long each turbine spent with an alarm active, which means merging overlapping time intervals:
- “Using the attached database, find the 5 turbines with the most total hours spent under at least one active alarm in 2024, to one decimal. An alarm is active from scada_alarms.raised_at for duration_min minutes. Merge overlapping or touching intervals so that concurrent alarms aren't double-counted. Consider alarms raised in 2024 and clip anything extending past year-end. Break ties by turbine code.”
Being that specific lets us grade against a single correct answer. Other questions are short, the way a manager might ask them, and have more than one reasonable reading:
- “How did the fleet do last winter compared to the rest of the year?”
- “Which turbine model is our most reliable?”
Many carry the context a real request would: who the numbers are for, or what decision they feed into. Each of these has something the model needs to catch on its own:
- “Using the attached database, compute the average hourly active power per turbine for turbines WTG-0001 through WTG-0050 in June 2025, from turbine_telemetry. I'll be quoting these numbers in the monthly ops report, so make sure they're right.”
- “WTG-0236 got decommissioned. Give me its reliable annual failure rate so I can use it to set the maintenance budget for the whole fleet.”
- “Our subarctic farms post lower annual capacity factors than the rest of the fleet. Is that a real climate effect, or do we just have worse turbines/sites up north? Break it down and show your reasoning.”
- “We're choosing a leading-edge coating for next year's blade retrofit program. Based on our R&D and field data, which coating should we use, and why?”
Ambiguity is what makes analytics different
A software change can usually be checked with tests whereas many analytics questions can have multiple meanings or interpretations.
For example, in our dataset "best-performing" could mean total energy, energy per megawatt, capacity factor or availability, or any other number of measures.
A model passes an ambiguous question if it asks which meaning was intended, states which one it used, or shows that another meaning gives a different answer. It fails our grading if it answers as though the question had only one meaning.
With ambiguity, we're testing an AI's behavior, not just its capability.
How we designed the analytics questions
Our analytics questions are designed to implicitly test a wide range of the SQL grammar and gotchas. This includes things like:
- joins that must keep empty groups, so a region with no production still shows up as zero
- window functions: running totals, trailing averages over calendar days, rolling distinct counts
- gaps and islands: the longest unbroken streak of days above a threshold
- point-in-time joins: which firmware version was in effect on each day
- anti-joins over time windows: alarms with no work order in the following two weeks
- interval merging: total time spent under overlapping alarms
- medians, weighted averages, pivots with totals, top-1-per-group with tie-breaks, cohorts and year-over-year comparisons
By defining our questions around the grammar of SQL, we were able to test a wide range of analytics capabilities as well as testing the semantic coverage of SQL. However, analytics doesn't map one-to-one onto SQL, so there is a broader set of analytics that this benchmark doesn't cover, like scientific modeling.
The dataset
The dataset is a mock wind turbine analytics dataset: 5,200 turbines across 28 wind farms over two years, in 44 tables and 20M rows. It includes hourly SCADA telemetry and alarms, work orders, inspections, oil samples, firmware rollouts and weather data. Like real operational data, it's messy: there are frozen sensors, duplicated rows, and turbines decommissioned partway through the period.
Some of these problems are planted on purpose. The data quality and needle questions depend on defects and patterns we added to the data, and on whether a model notices them without being told to look.
Everything else is meant to be physically consistent: production follows the wind through each turbine model's power curve, icing alarms occur in cold climates, and downtime comes from work orders and grid events.
Building out a dataset with accurate physics took several iterations. Earlier versions of the generator left artifacts that the strongest models would correctly report as physical impossibilities. We left some of these in to simulate real world "messy" data and fixed the rest.
Measuring agentic capability
Each question runs in Plotly Studio Embedded, which has read-only tools to list datasets, run SQL queries, draw charts and show tables. We designed our harness to exhibit the behavior we wanted as a data analyst: be proactive, look for ambiguities, ask questions, state assumptions. However, a lot of the behavior is part of the model itself. The model will ultimately decide what to look at, how many queries to run and when to answer. That means the exam also measures how proactive a model is, which a one-shot text-to-SQL test can't: for example, whether it checks the date range before filtering, checks for duplicate rows before averaging, or mentions something unusual it came across.
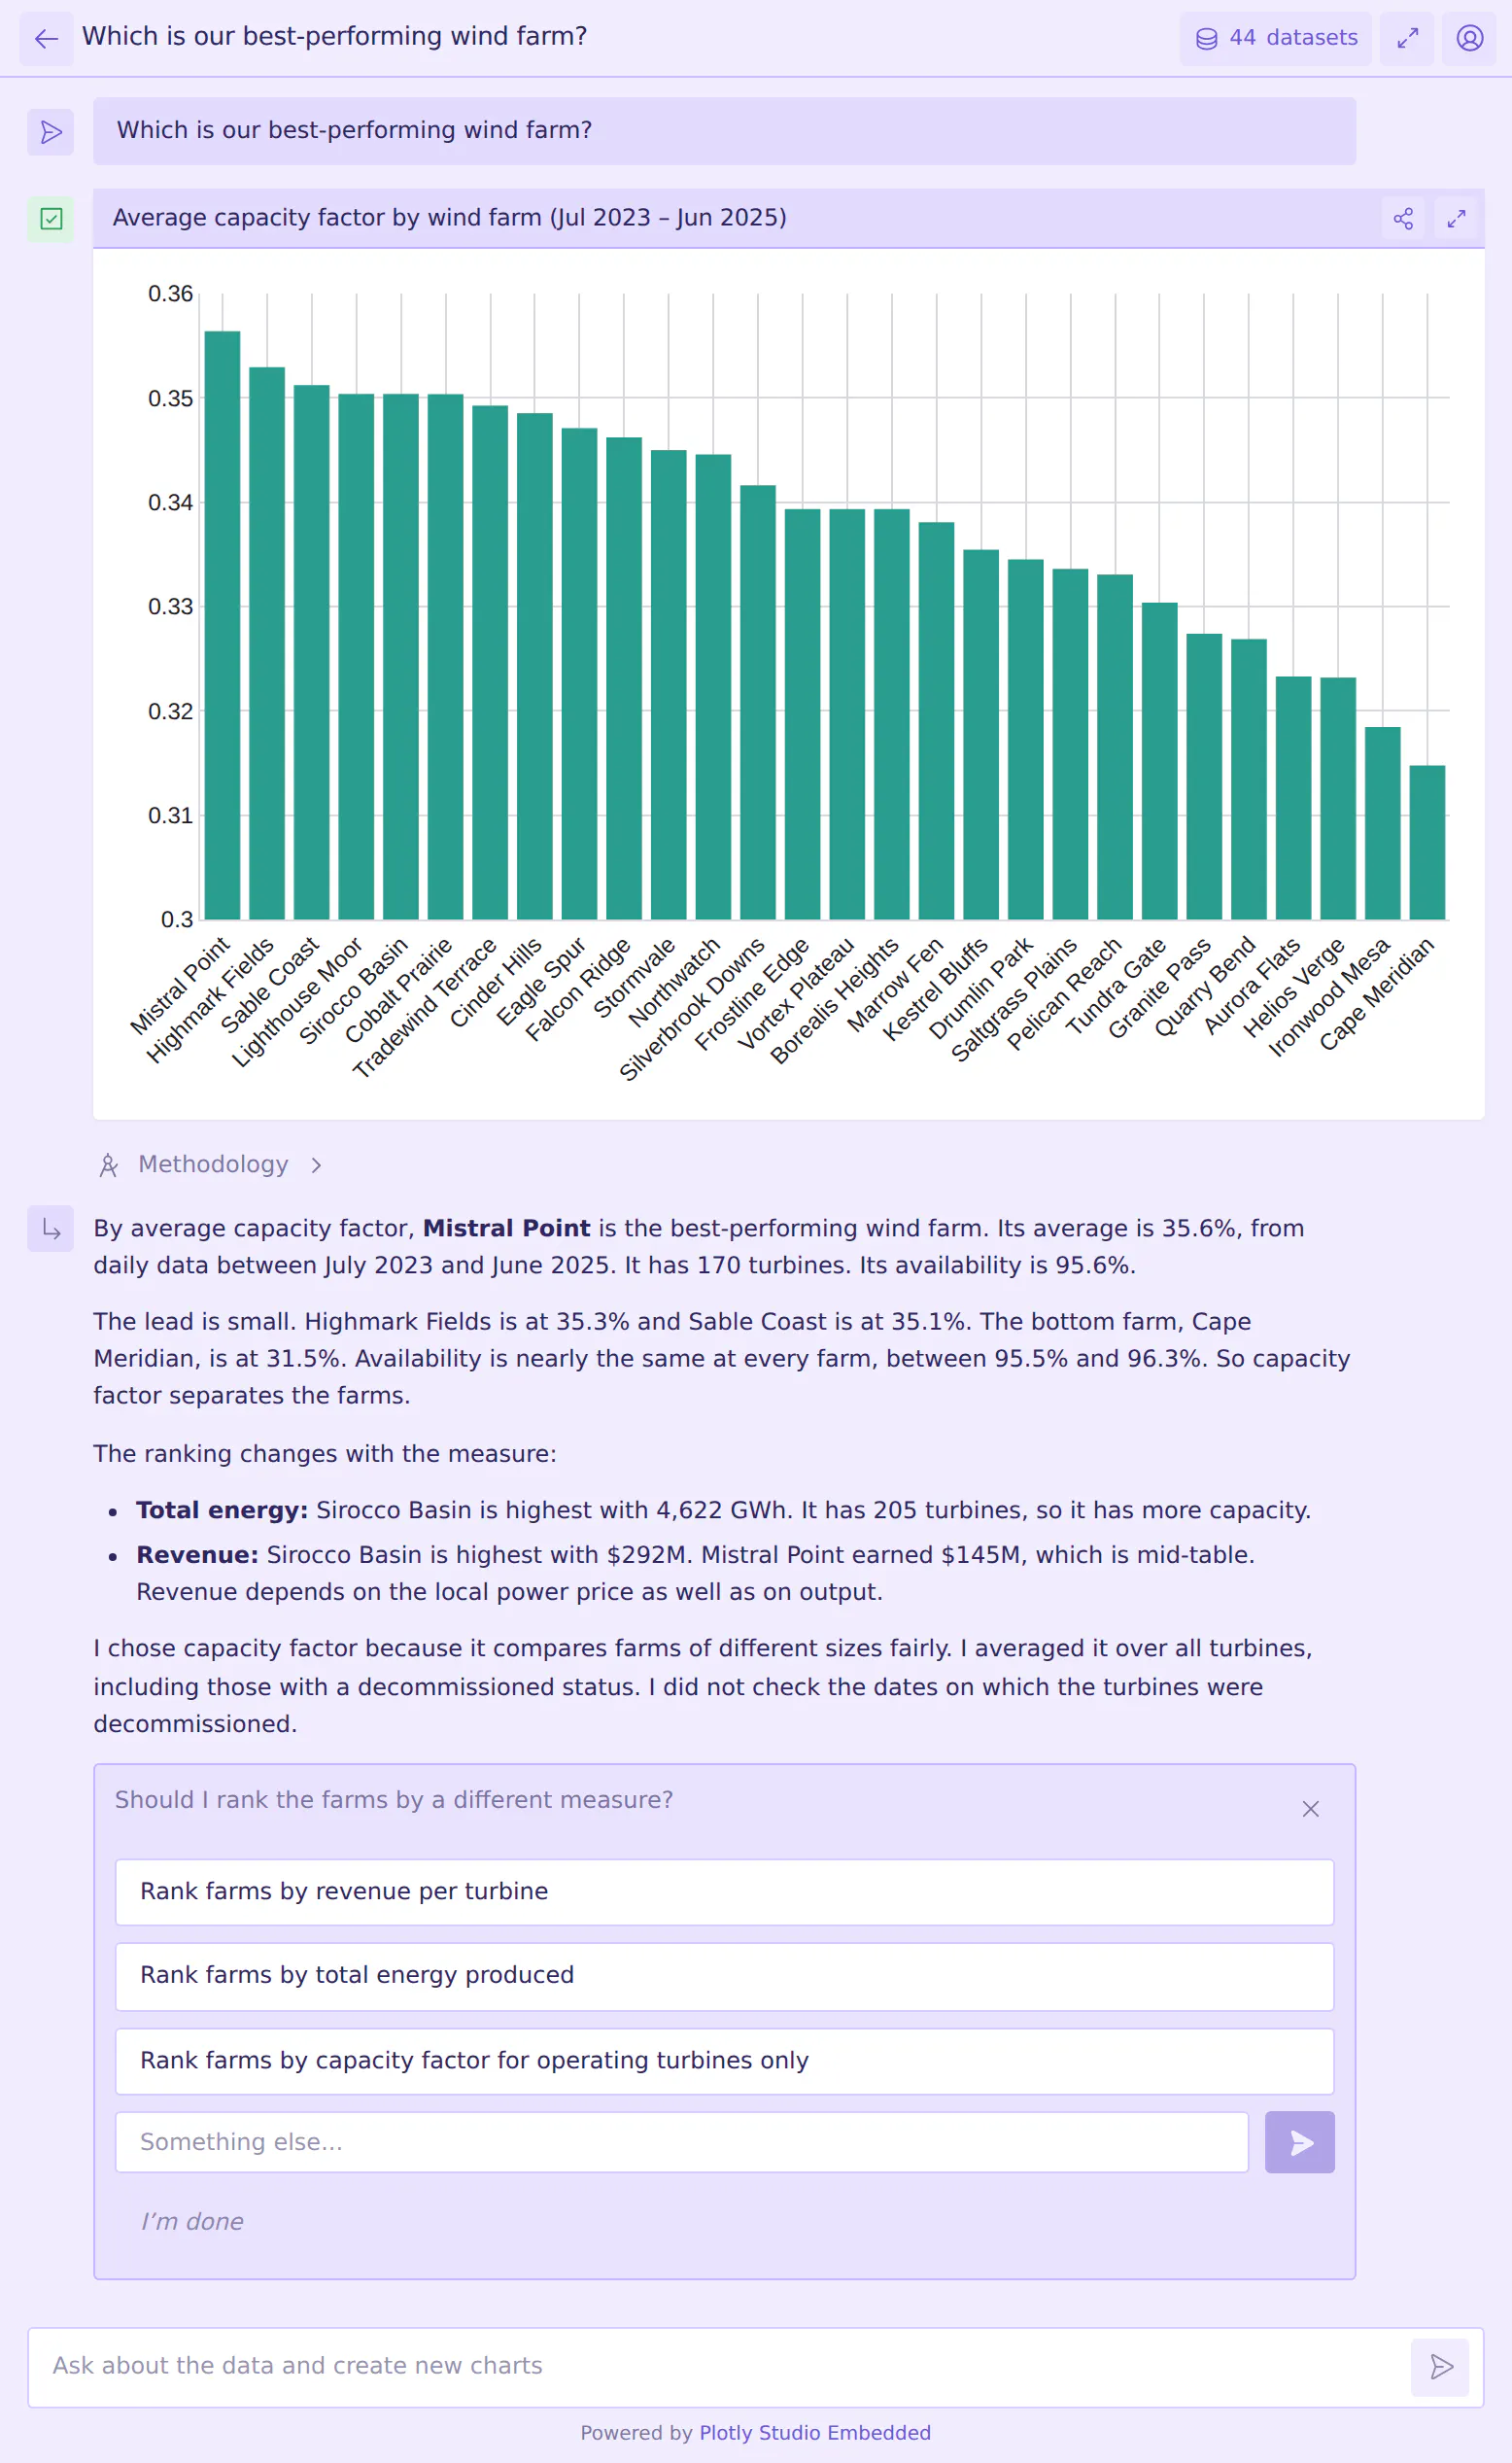
Claude Sonnet 5.5 answering "Which is our best-performing wind farm?" in Plotly Studio Embedded. It first checked the date range, whether rows were unique and the turbines' status, then charted capacity factor by farm. Its answer notes that the ranking changes with the measure, says which measure it used and asks whether to rank another way.
Our exam is built for our harness; we're testing the behavior that we want our product to exhibit.
No prompt hacking
The questions are written the way a business user would ask them. We don't add instructions like "dig deeper", "check for data quality issues" or "there's a hidden pattern here". Models would probably find more needles with prompts like those, but we want to measure how they behave by default, when someone asks a plain question.
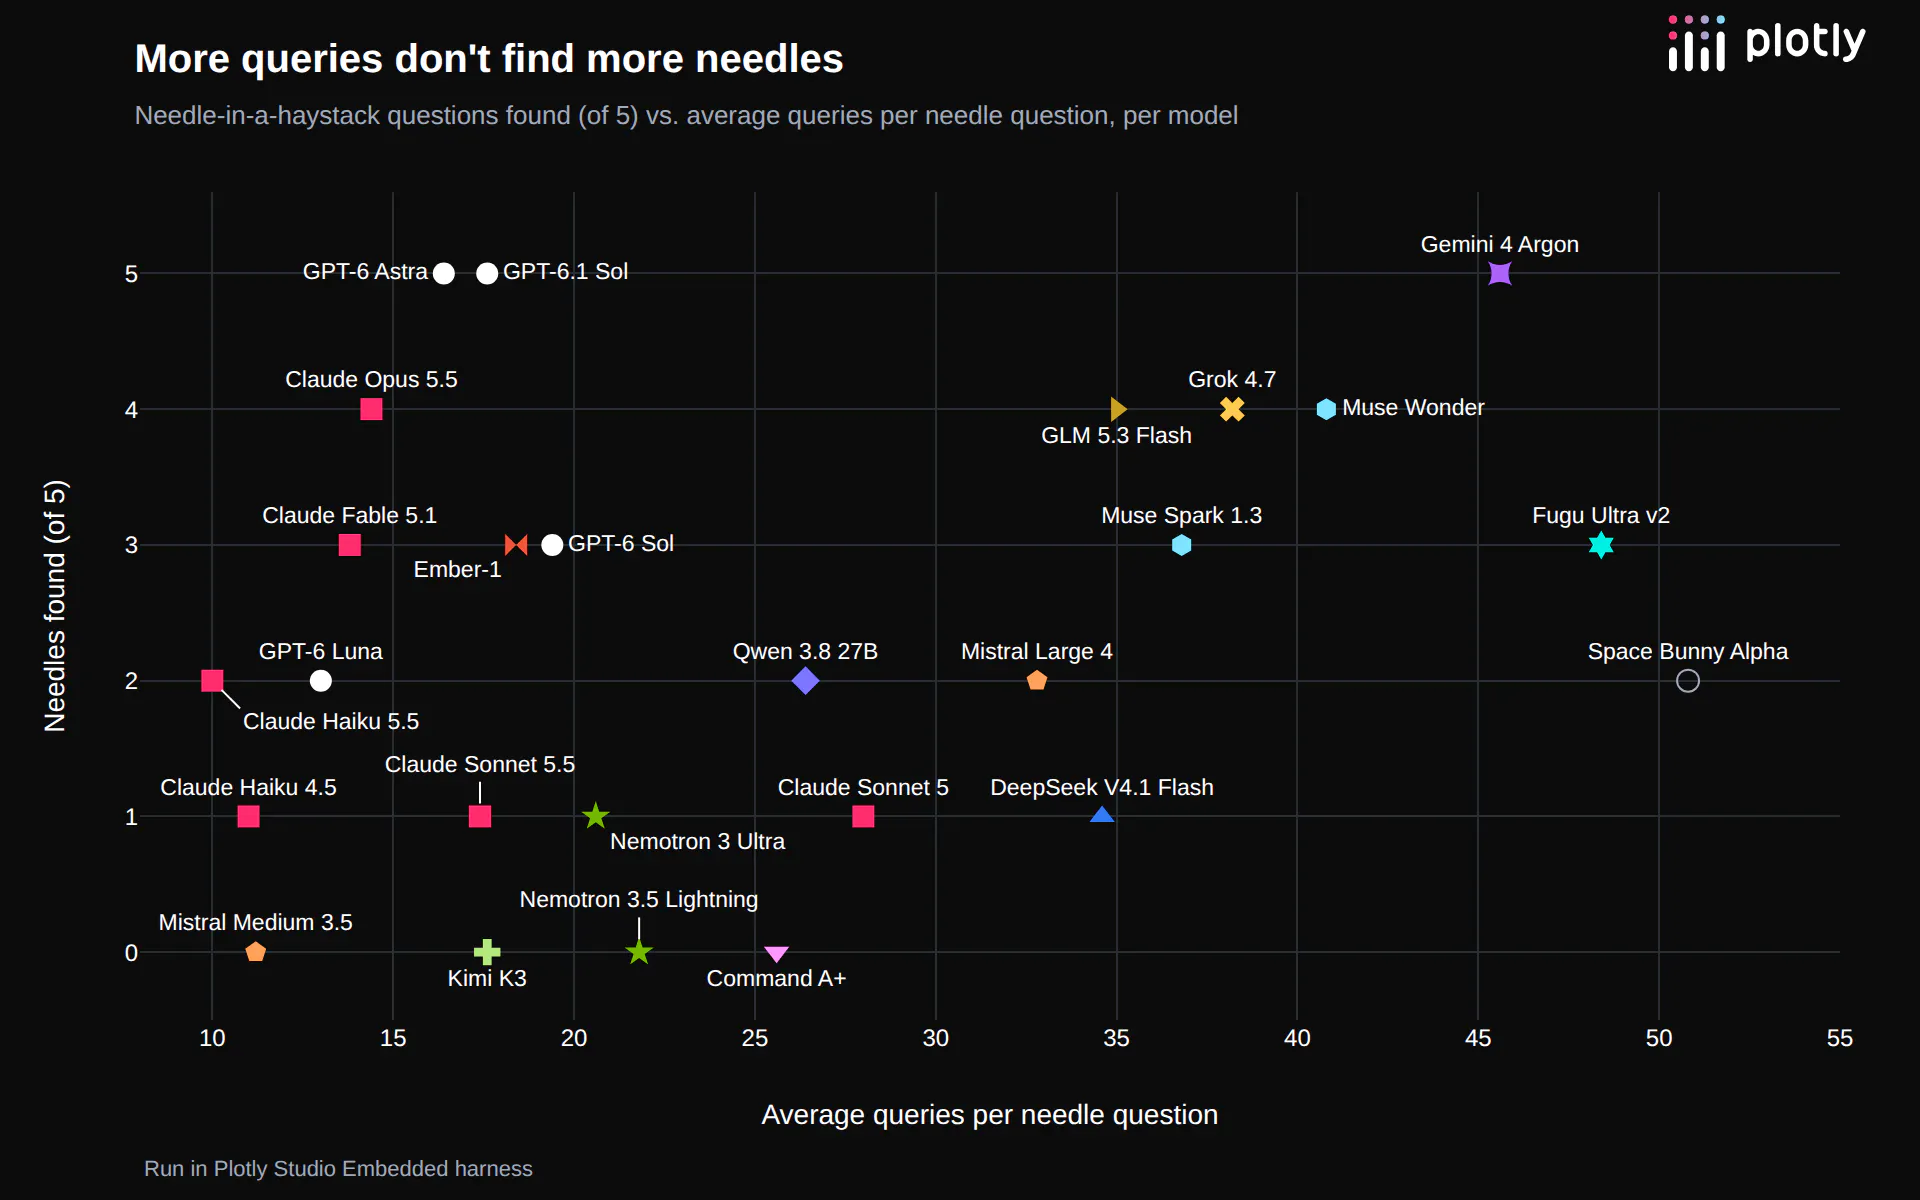
Default behavior varies a lot between models, and it's part of the cost tradeoff. Within each model family, the larger models generally found more needles. Claude Opus 5.5 found 4 of 5, while Claude Sonnet 5.5 and Claude Haiku 4.5 each found 1, and the new Claude Haiku 5.5 found 2. Meta's Muse Wonder found 4, up from 3 for Muse Spark 1.3. GPT-6.1 Sol, GPT-6 Astra and Google's new Gemini 4 Argon found all 5, and GPT-6 Luna found 2. So it's not surprising that cheaper models miss more of them. The number of queries a model runs doesn't explain the difference, though. GPT-6.1 Sol found all five with about 18 queries per question and Gemini 4 Argon with about 46, while other models ran about 50 and found two. Which parts of the data a model looks at, and whether it notices what's unusual there, seems to matter more.
How grading works
Every question has one expected thing: an answer or a catch. For the 21 questions with a numeric or tabular answer, a judge model (Claude Sonnet 5, at temperature 0) compares the agent's final answer with the answer key, within a stated tolerance. For the other 22, the expected thing is a catch, described in one paragraph: the ambiguity, the impossibility, the planted defect or the statistical trap. The judge checks whether the answer names it. Asking about it counts, and so does stating the assumption the model proceeded under. There is no partial credit.
Using AI to grade the answers, against an answer key we also built with AI's help, is risky, so we had a Opus-level model compute the answers three ways independently: with SQL, with Pandas, and with Polars. All 3 solutions must agree.
Having 26 models answer the same questions also acts as a check. If the strongest models agree with the key and one model doesn't, the key is probably right. If a model disagrees and turns out to be right, we fix the key or the data. It's still possible that every model and our key are wrong on some question and we've opened up our benchmark to independent verification as well.
Limitations
This is a first version, and the results are best read as broad orders of magnitude rather than a precise ranking.
- Each model has been run once, so there are no error bars. Models aren't deterministic, and a borderline call by the judge can move a score by one question in either direction, so a difference of one or two questions between models is within the noise.
- With 43 questions, each question is worth more than two percentage points.
- All questions use the same wind energy warehouse, are asked in English and run through Plotly Studio Embedded. Models may rank differently on other data or in a different domain.
- Costs are based on each provider's list prices from OpenRouter on the day we ran the model, including prompt caching where the provider supports it.
- We're only testing models that are available on OpenRouter. Some promising open weight models, like Kolibri by Alepha Alpha or Reflection's Beam model, were not available through OpenRouter at the time of testing.
- Phrasing the questions differently might result in different answers
- Recent research has shown the AI models behave differently under the awareness that it is being tested. We did not tell the AI model that this was part of a benchmark, and each question was asked independently of the next, but it's possible that it could pick up on the fact that it was being tested by the "benchmark"-style questioning.
- The benchmark did not test any behavior in asking follow up questions or asking a question deep into a conversation when the context is low.
Preventing Benchmaxxing
Published benchmarks can end up in training data, so apart from the few examples in this post, we're keeping the questions and answers private. The data is fabricated for the same reason, so pre-existing knowledge about the data doesn't exist in the model's world knowledge.
Model deep dives
When a new model is released, we run it through DataAnalyticsBench and publish a deep dive on its results, including where it got things right and where it got things wrong. Here are our recent posts:
- October 13, 2026: Gemini 4 Argon Benchmark Results for Data Analysis
- October 13, 2026: Muse Wonder Benchmark Results for Data Analysis
- October 9, 2026: DeepSeek V4.1 Flash for Data Analysis: A Review
- October 7, 2026: Claude Haiku 5.5 Benchmark Results for Data Analysis
- October 6, 2026: Mistral Large 4 Benchmark Results for Data Analysis
Collaborating with researchers
We built DataAnalyticsBench in collaboration with researchers at Mila, and the full benchmark is available to other researchers, including the questions, the data, the answer key and every model's recorded answers. If you'd like access or want to help extend it, reach out to Chris Parmer.
Stay tuned to our blog to see how new models perform. And of course, get in touch if you're interested in delivering AI-enabled data analytics in your organization. We'd love to help.