NVIDIA Nemotron 3.5 Super VL Benchmark Results for Data Analysis
Oct 15, 2026: NVIDIA's new open-weight model is the fastest on our leaderboard, and it fits on a single desktop.
At Plotly, we keep a close eye on model releases. Our agentic analytics products, Plotly Studio Desktop and Plotly Studio Embedded, and our open source libraries Plotly and Dash work with any model, and our customers look to us for recommendations. Today NVIDIA released Nemotron 3.5 Super VL, an open-weight mixture-of-experts model with 120 billion parameters, 12 billion of which are active for each token. It's priced at $0.15 per million input tokens and $0.50 per million output tokens on OpenRouter.
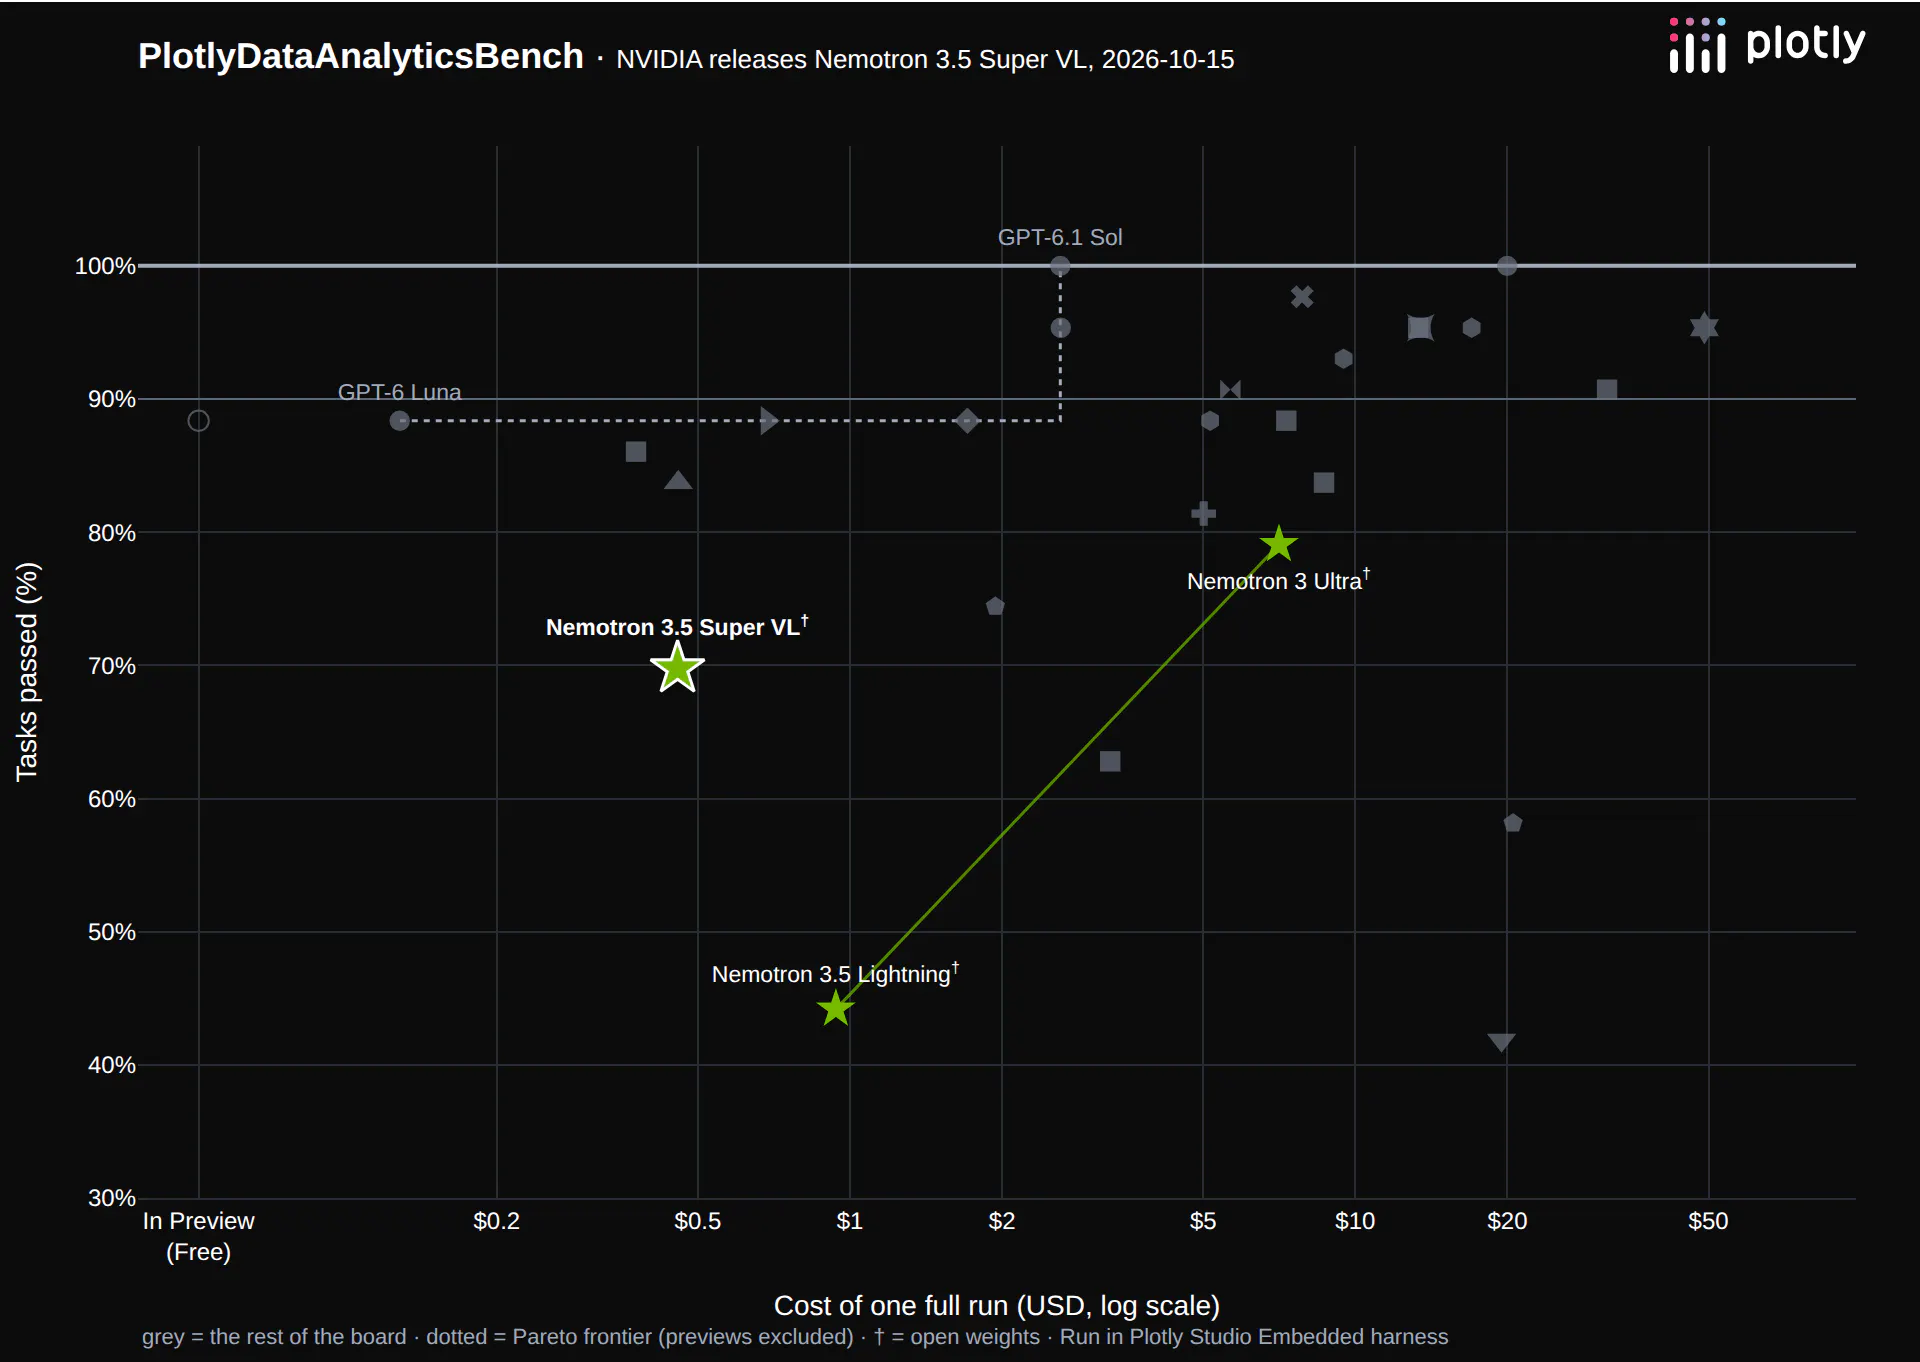
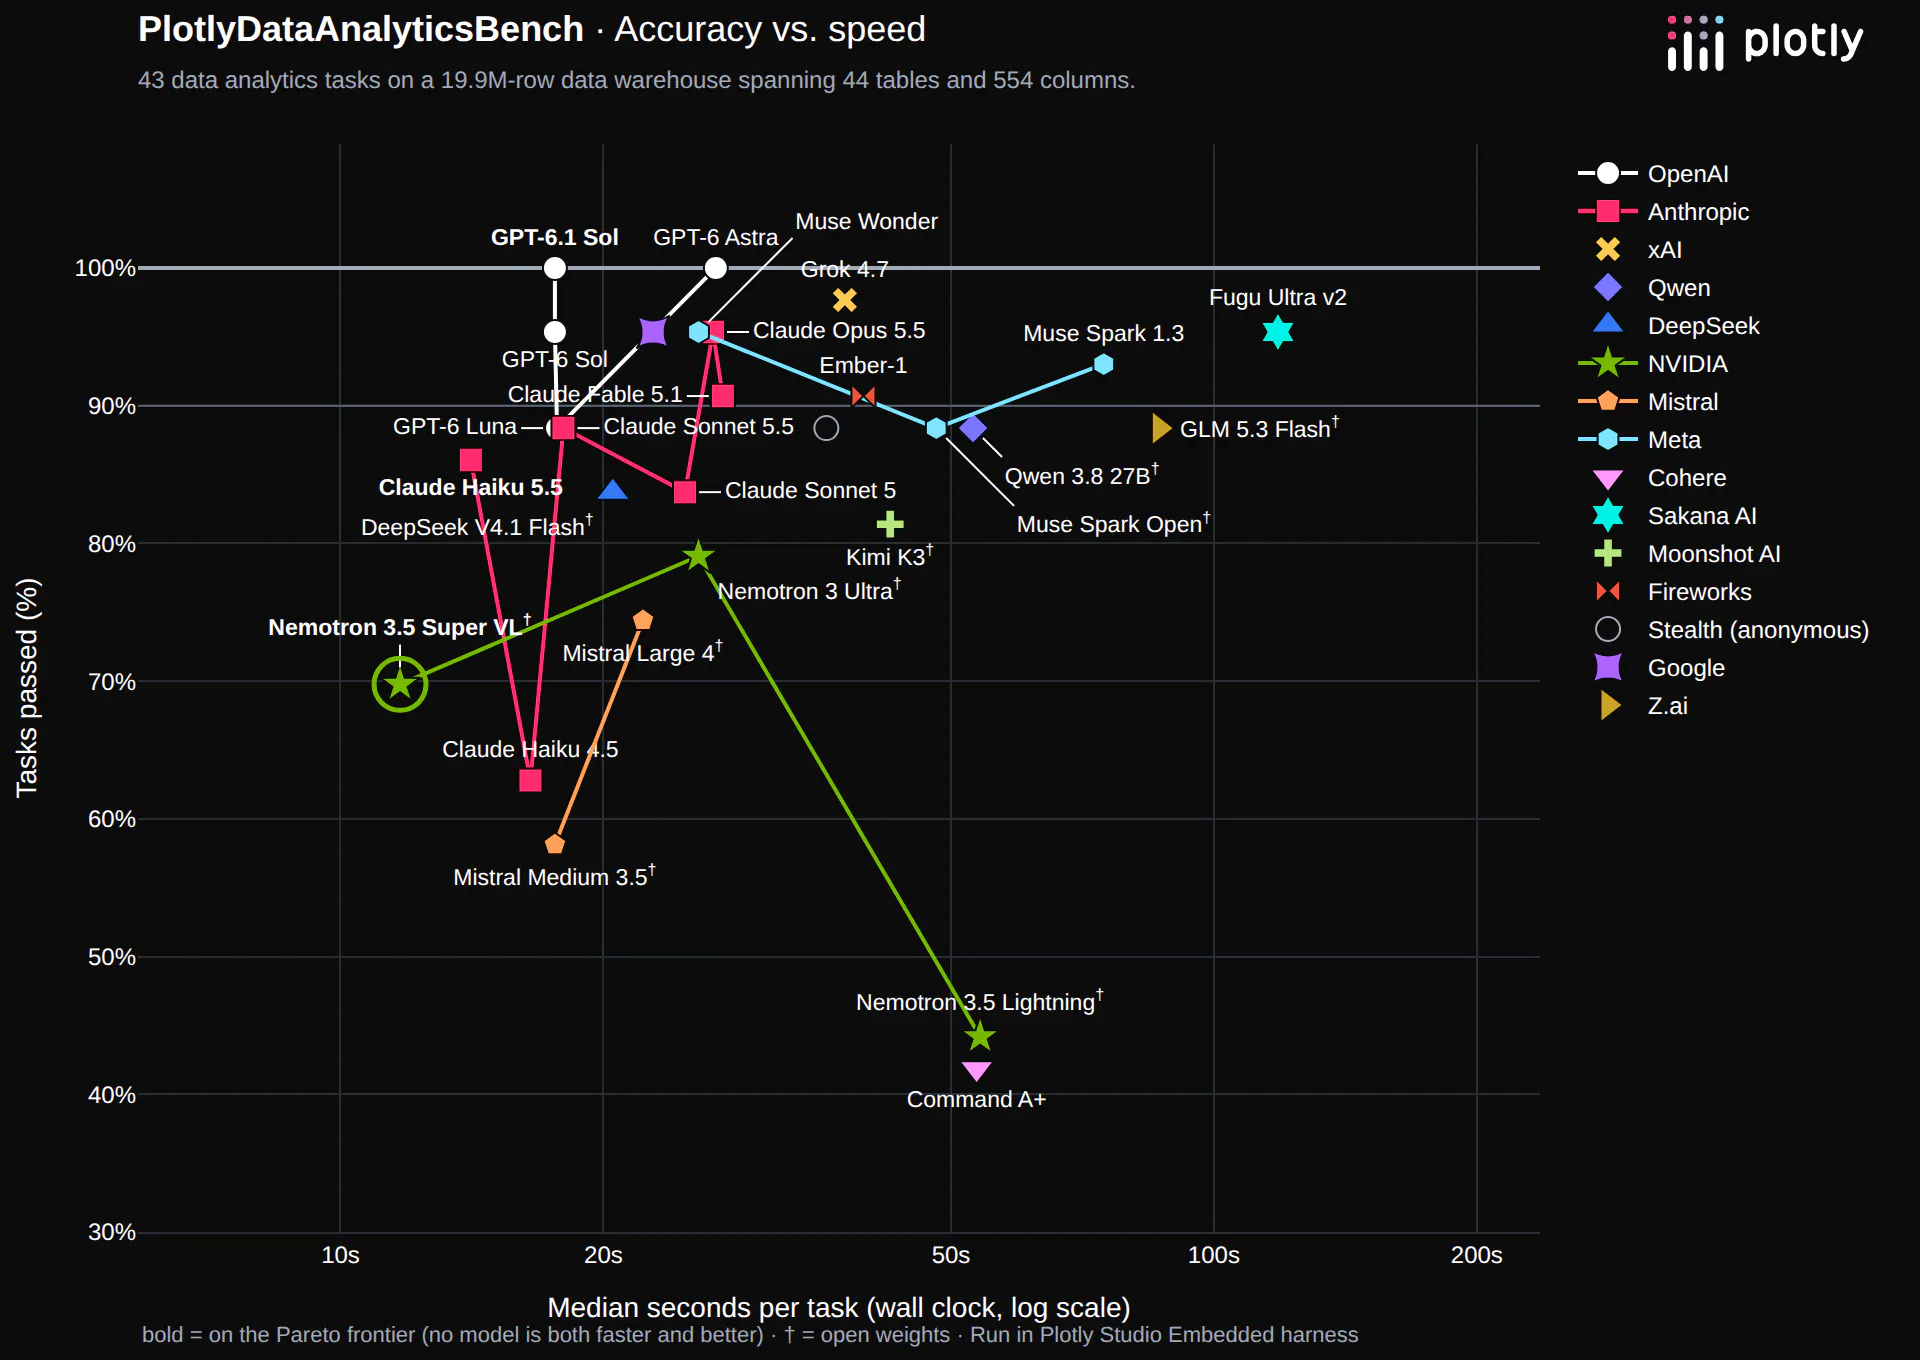
We ran it through our data analytics exam. It passed 30 of 43 questions (70%, a C-), for $0.46 for the whole exam, and it answers a typical question in 12 seconds, the fastest of the 28 models on our leaderboard.
How NVIDIA's models have progressed
We've tested two earlier Nemotron models. Nemotron 3 Ultra, from June, is NVIDIA's largest, at 550 billion parameters. Nemotron 3.5 Lightning, from August, is its smallest, at 30 billion. Nemotron 3.5 Super VL sits in between, and it comes within four questions of Ultra at a fifteenth of the cost and in half the time:
Nemotron 3.5 Lightning
Nemotron 3 Ultra
Nemotron 3.5 Super VL
Released
August 2026
June 2026
October 2026
Parameters (active / total)
3B / 30B
55B / 550B
12B / 120B
Analytics questions
13 / 20
19 / 20
19 / 20
Impossible requests
3 / 5
5 / 5
5 / 5
Ambiguous questions
3 / 5
5 / 5
4 / 5
Statistics traps
0 / 5
4 / 5
2 / 5
Data quality
0 / 3
0 / 3
0 / 3
Hidden needles
0 / 5
1 / 5
0 / 5
Total
19 / 43 (44%)
34 / 43 (79%)
30 / 43 (70%)
Cost of one full run
$0.94
$7.06
$0.46
Median time per question
54 seconds
26 seconds
12 seconds
Against Lightning, Super VL passes 11 more questions for half the cost and answers more than four times faster. On straightforward analytics, impossible requests and ambiguous questions it now scores about the same as Ultra. Where Ultra still leads is statistics: it passed four of the five statistics questions, and Super VL passed two.
One thing hasn't changed across NVIDIA's models: none of the three found any of the data quality problems we planted, and between them they found one of the five hidden patterns.
Run it on a single desktop
Super VL is small enough to run at home or in the office. NVIDIA publishes the weights on Hugging Face, and a 4-bit version is about 70 GB, so it fits on a single machine with 128 GB of memory, like a Mac with 128 GB or NVIDIA's own DGX Spark. No cluster, no Thunderbolt mesh.
Because only 12 billion parameters are active for each token, it should also generate text much faster on a desktop than a model that uses all of its parameters for every token. Qwen 3.8 27B, an open-weight model that runs in 64 GB, scored higher, 38 of 43, but took a median of 53 seconds per question even on hosted servers, and we estimate several minutes on a Mac.
Cost and speed
The whole exam cost $0.46, about a cent per question. At the cost per question we measured, 1,000 people each asking 10 questions a day would come to about $26 per person per year.
It's cheap and fast because it does very little per question. It made about 4 model calls and read about 150,000 tokens per question. Nemotron 3 Ultra made 10 calls and read about 490,000 tokens. That efficiency is also why it misses the planted problems: it rarely looks around the data before it answers.
Where it got things right
- Analytics questions (19 of 20). Multi-step SQL with window functions, point-in-time joins and merged alarm intervals, almost all correct on the first try.
- Impossible requests (5 of 5). It said so when the data couldn't answer the question.
- Ambiguous questions (4 of 5). Asked "How did the fleet do last winter compared to the rest of the year?", it said which months it counted as last winter and compared output per turbine-day, since winter covers three months and the rest of the year nine.
Where it got things wrong
Nemotron 3.5 Super VL missed 13 of the 43 questions:
- Data quality (0 of 3). On the request with the warning "I'll be quoting these numbers in the monthly ops report, so make sure they're right", it reported a full month of readings for every turbine, averaged over the duplicated rows, and didn't notice the last day of the month was missing. Summarizing a quarter of gearbox oil temperatures, it claimed full coverage and missed a week of missing readings.
- Hidden needles (0 of 5). We planted five patterns in the data for the model to find on its own, without being told to look. It didn't find any.
- Statistics traps (2 of 5). Asked whether windy days drive up SCADA alarms, it answered from the overall relationship without checking whether something else, like the season, explains both.
- A one-day slip. Asked for a trailing 30-day count at each month end, it used a 31-day window, so all twelve numbers were too high.
About the benchmark
We run new models through the same exam as they're released, and we'll keep sharing what we find.
The exam is private and we're sharing it with researchers. We're keeping it private so that the answer key doesn't make its way into the training set. For the same reason, the data is fabricated: the warehouse is a synthetic wind-energy fleet, built to look like a real operator's data, so its answers don't exist anywhere else.
If you'd like access, reach out to Chris Parmer at Plotly.