Claude Haiku 5.5 Data Analytics Benchmark Results
Almost 9x cheaper than Haiku 4.5, two letter grades better, and the fastest model on our data analytics exam.
At Plotly, we keep a close eye on model releases. Our agentic analytics products, Plotly Studio Desktop and Plotly Studio Embedded, and our open source libraries Plotly and Dash work with any model, and our customers look to us for recommendations. Today Anthropic released Claude Haiku 5.5, the newest version of its smallest and fastest model.
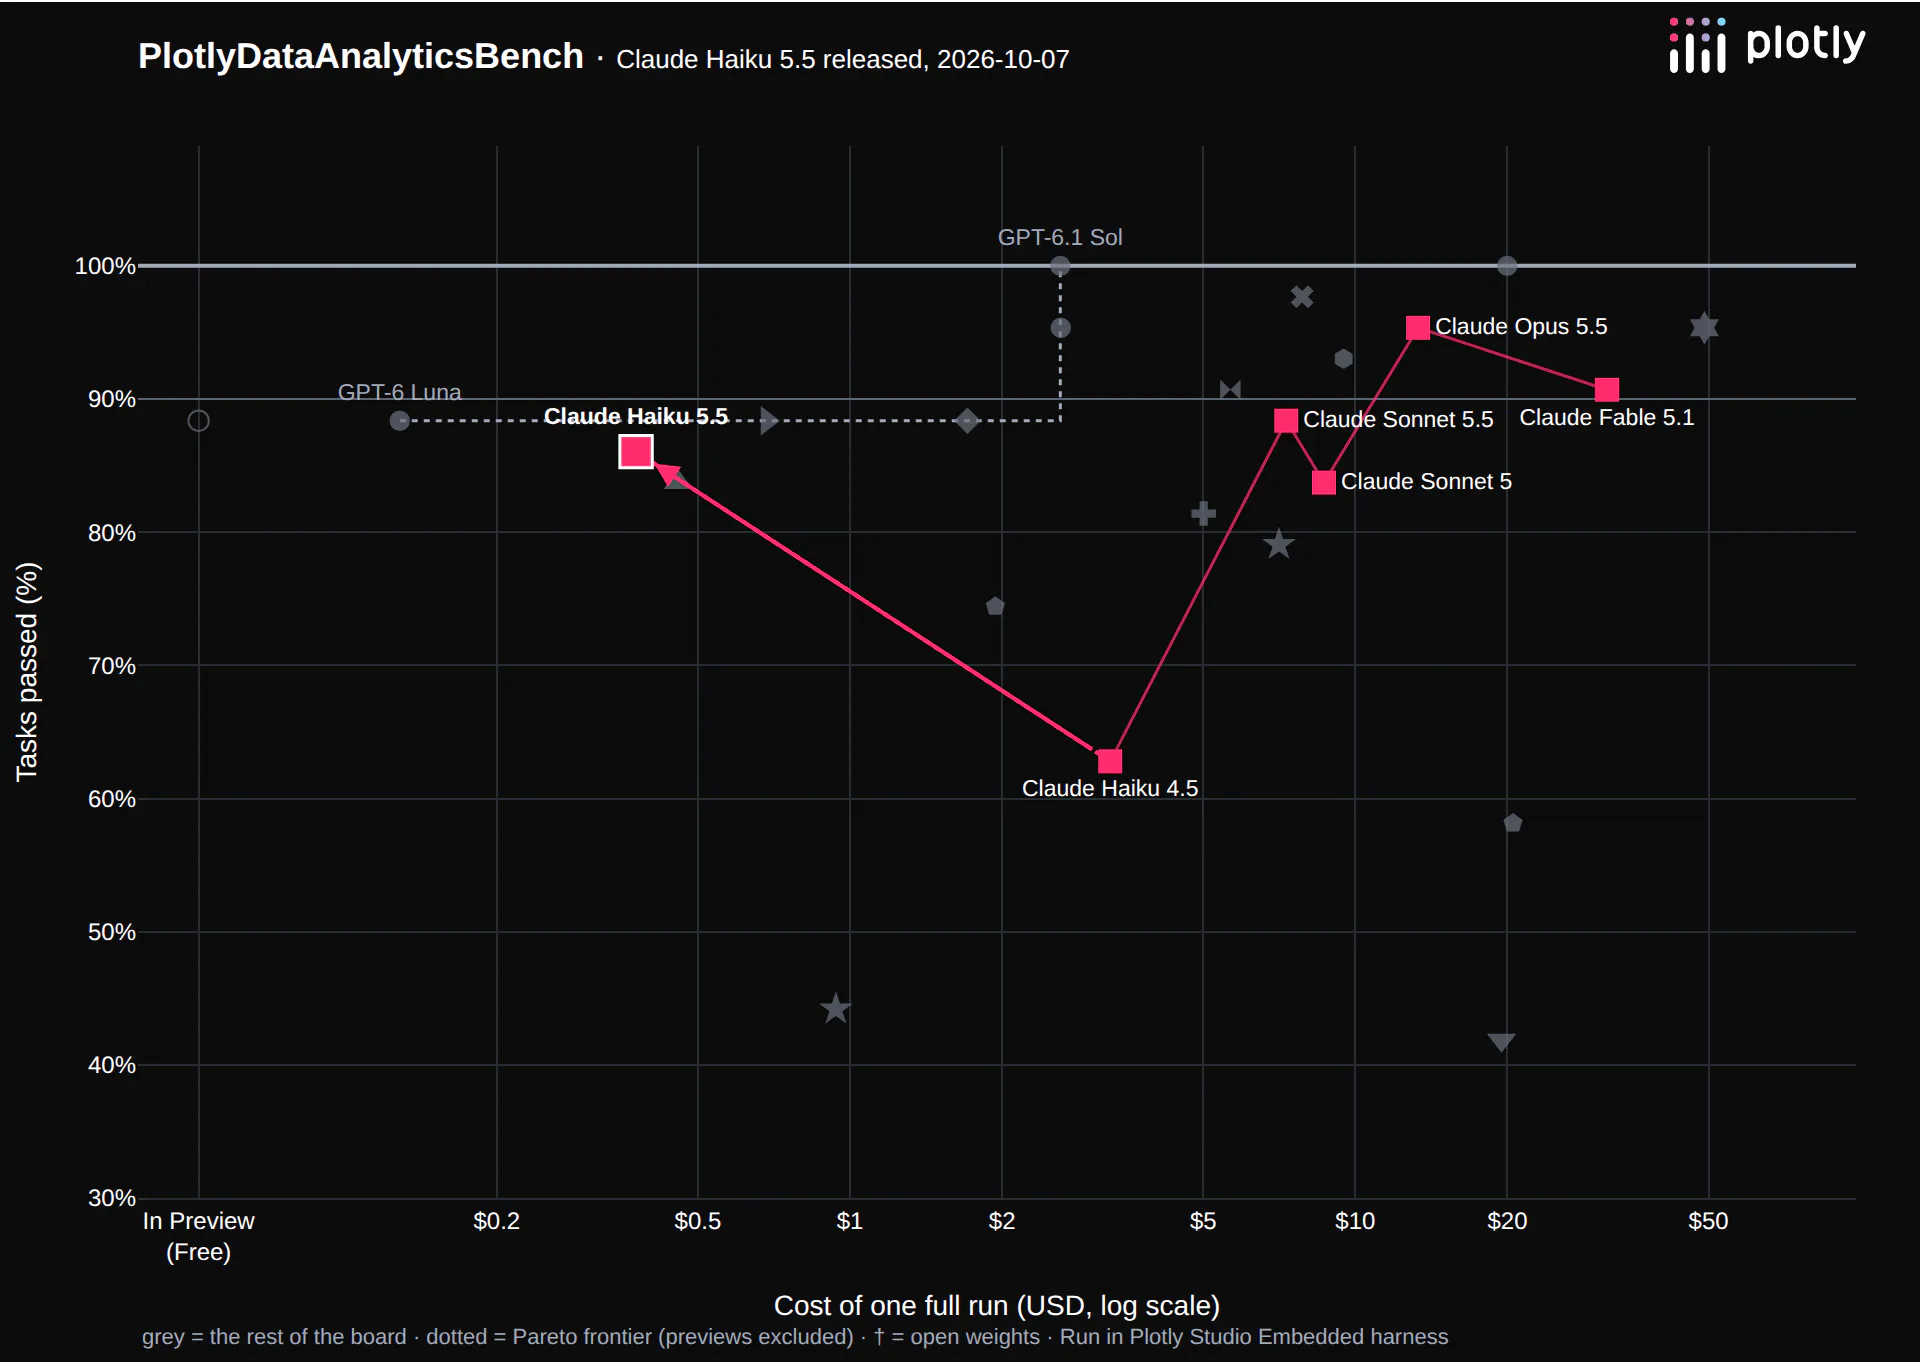
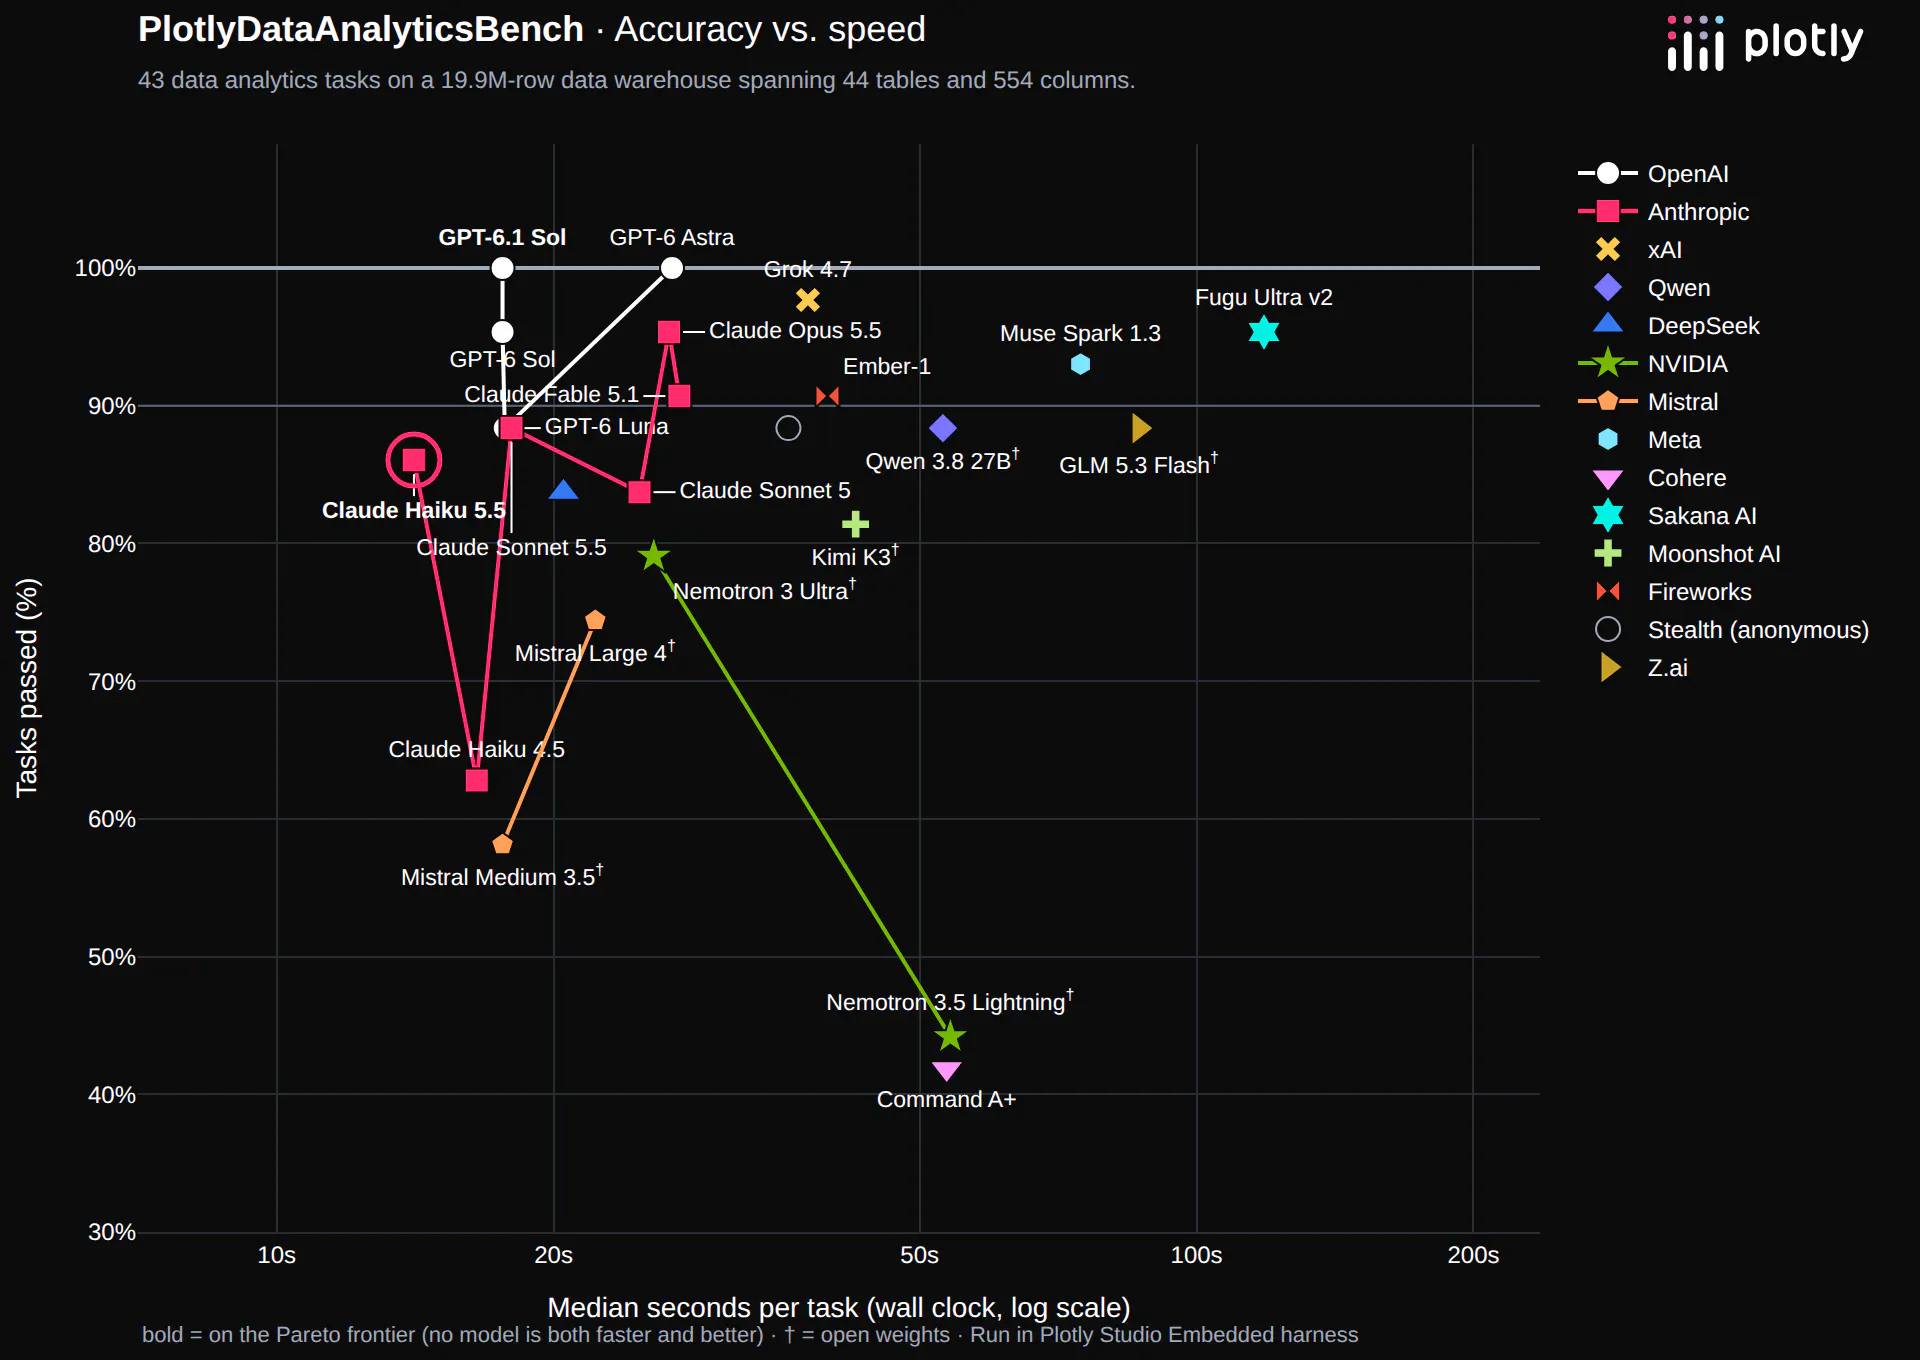
We ran it through our data analytics exam. Compared with Claude Haiku 4.5, released a year ago, it's almost 9x cheaper ($3.27 to $0.38 per run) and two letter grades better (a D to a B). It's also the fastest model on our leaderboard: it answers a typical question in 14 seconds.
The exam
Our data analytics exam tests how well models do at real data analysis. It runs within Plotly Studio Embedded, with the same agent, tools and prompts that app viewers use and only the model swapped, and it answers 43 questions through a series of tool calls and analysis steps. The data warehouse is representative of the real world: 20M rows across 44 tables and 554 columns. The questions cover a broad range of data analytic skills: answering questions, recognizing ambiguity, avoiding hallucinations, and finding a needle in a haystack.
The dataset is a mock wind turbine analytics dataset: 5,200 turbines across 28 wind farms over two years. It covers everything from hourly SCADA telemetry and alarms to work orders, inspections, oil samples, firmware rollouts and weather. And like real operational data it's messy, with frozen sensors, duplicated rows and turbines decommissioned mid-period, so a good analyst has to catch problems before quoting a number.
Every question has either an answer, checked against a verified key, or "a catch": an ambiguous question to raise, an impossible request to decline, a planted data defect to flag. There is no partial credit, and a confident answer that ignores the catch fails.
Claude Haiku 4.5 passed 27 of 43 questions (63%, a D). Claude Haiku 5.5 passes 37 of 43 (86%, a B), and it improved in every category but one:
Category
Claude Haiku 4.5
Claude Haiku 5.5
Analytics questions
17 / 20
20 / 20
Impossible requests
4 / 5
5 / 5
Ambiguous questions
3 / 5
5 / 5
Data quality
0 / 3
3 / 3
Hidden needles
1 / 5
2 / 5
Statistics traps
2 / 5
2 / 5
Total
27 / 43 (63%)
37 / 43 (86%)
Cost of one full run
$3.27
$0.38
Median time per question
17 seconds
14 seconds
Cost and speed
It cost $0.38 in inference tokens for Claude Haiku 5.5 to complete the exam, under a cent per question. Among the paid models we test, only GPT-6 Luna is cheaper ($0.13, with 38 of 43), and the two have the same list price per token.
For a sense of scale: if 1,000 people each asked it 10 questions a day, at the cost per question we measured, it would come to about $22 per person per year.
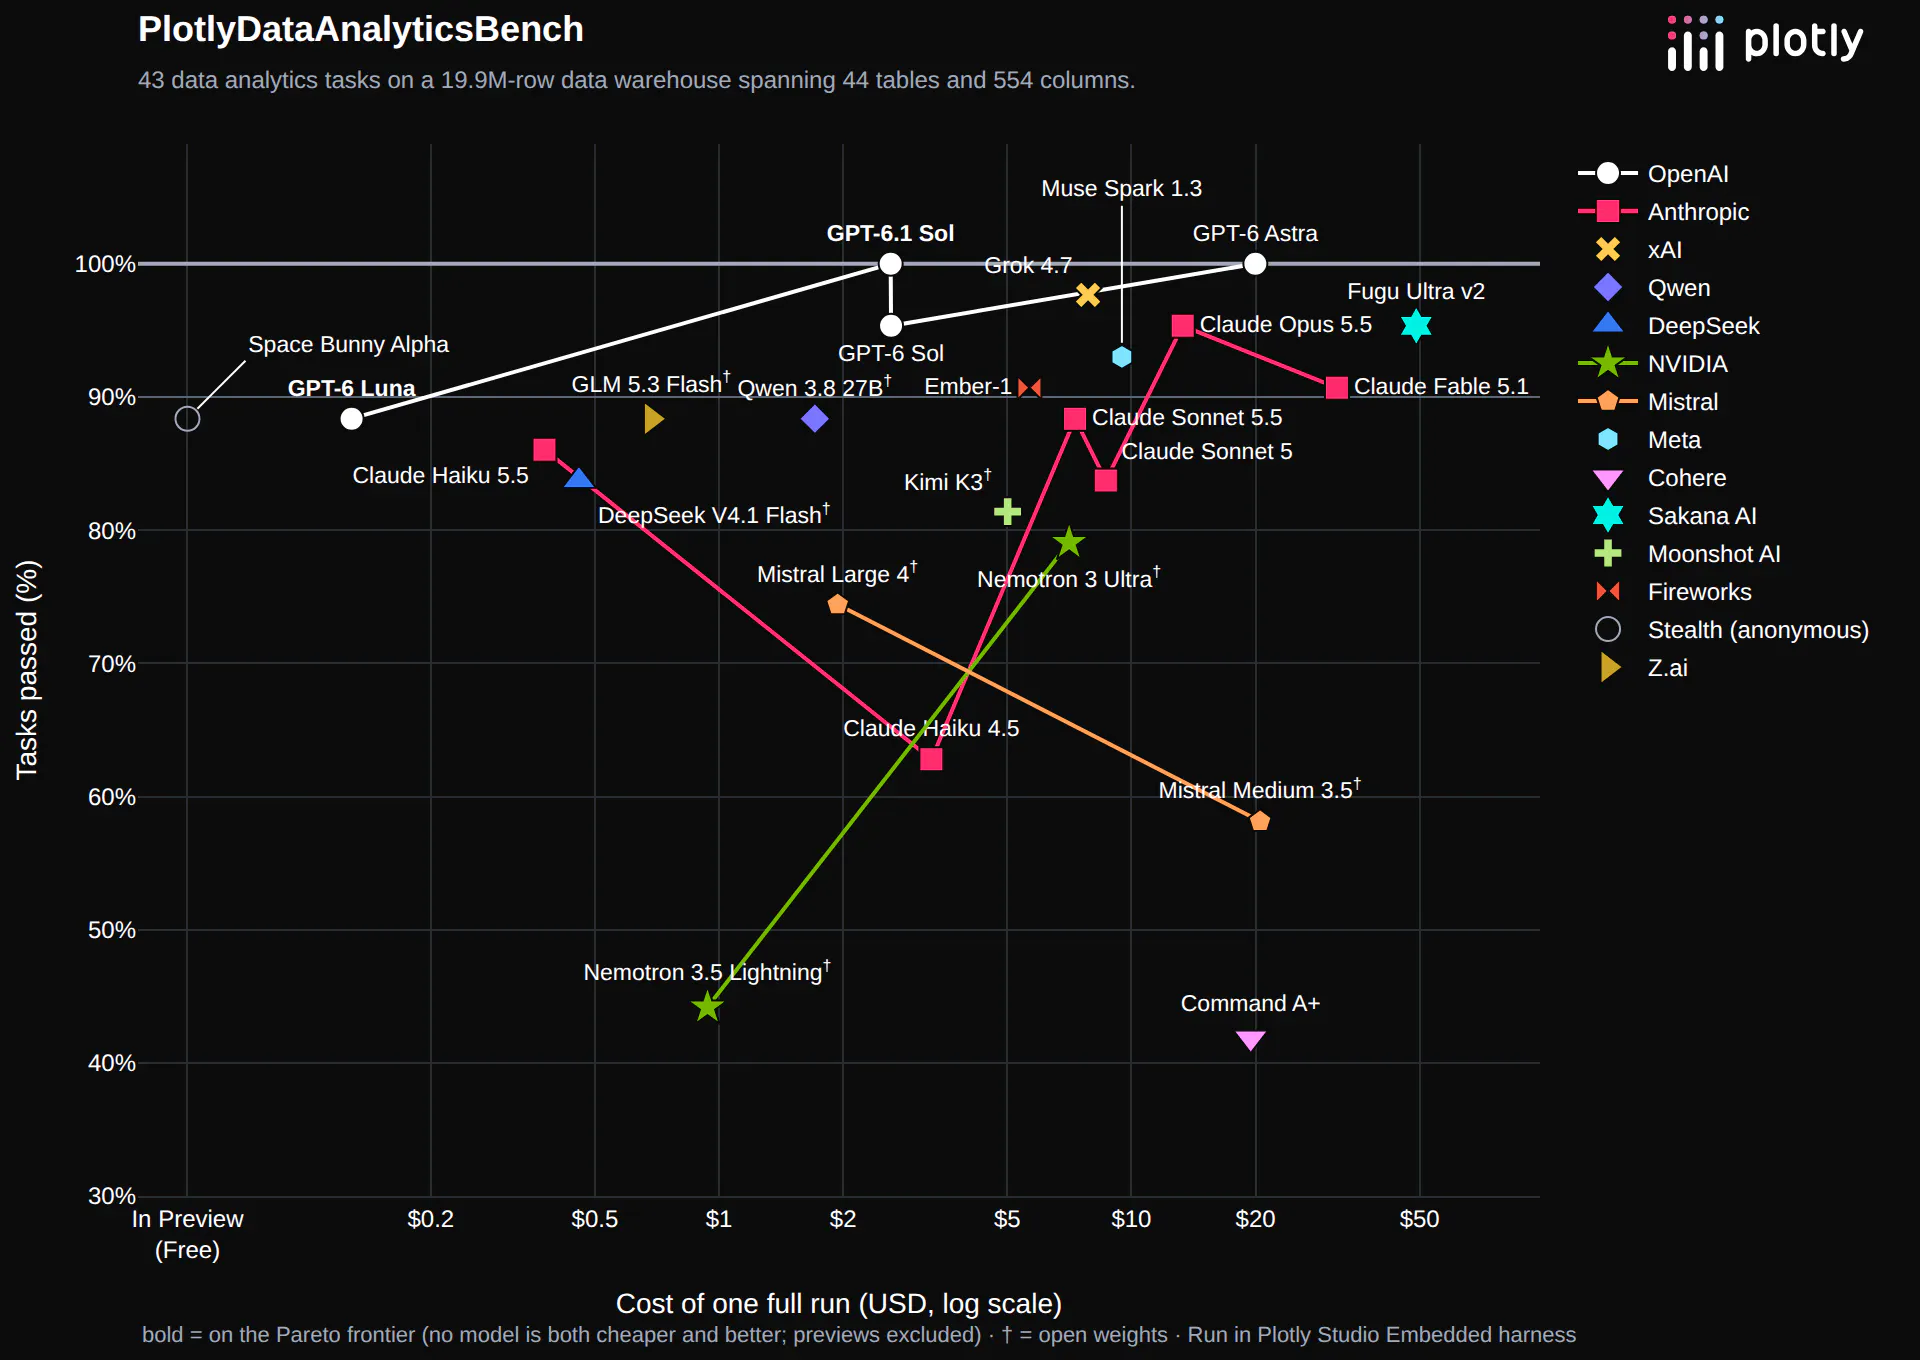
It's also the fastest model on the board, at a median of 14 seconds per question, ahead of GPT-6.1 Sol and GPT-6 Luna at about 18 seconds.
Where it got things right
Claude Haiku 5.5 got all 20 analytics questions right. These are multi-step analyses that would take a data analyst real SQL: streaks of consecutive days, point-in-time joins against firmware install history, merging overlapping alarm intervals, rolling distinct counts and weighted averages. The model works each one out on its own, exploring the schema, writing queries and checking the results.
It also got every question right in three of the categories that test judgement:
- Ambiguous questions (5 of 5). Asked "How did the fleet do last winter compared to the rest of the year?", it said which months it took "last winter" to mean, and offered to rerun it for a different period.
- Impossible requests (5 of 5). When the data couldn't answer a question, it said so instead of making up a number. Asked for a decommissioned turbine's "reliable annual failure rate" to set the whole fleet's maintenance budget, it explained that one retired turbine can't support a fleet-wide rate.
- Data quality (3 of 3). Only 13 of the 24 models on our leaderboard got all three. On the request with the warning "I'll be quoting these numbers in the monthly ops report, so make sure they're right", it found the duplicated rows and corrected itself: "The first averages I showed double-counted these rows and are wrong." It also flagged that the data ends a day before the end of the month. Summarizing a quarter of gearbox oil temperatures, it found the week of missing readings and put it first on its list of things to check.
Where it got things wrong
Claude Haiku 5.5 missed 6 of the 43 questions: three of the five hidden needles, and three of the five statistics traps.
- Stopping at a hypothesis. It found 2 of the 5 patterns we hid in the data. In the other three it got partway but didn't follow through. In one, it listed the right cause as a hypothesis to test later, instead of testing it.
- A small effect, but no confounder check. Asked whether windy days drive up SCADA alarms, it reported the alarm rate by wind band and called the rise small. It did not check for a third variable, such as season, that could drive both.
- The wrong unit of analysis. Comparing capacity factor across firmware versions, it averaged per turbine instead of per turbine-day, so both means came out just outside tolerance.
- Giving up on the cause. Asked whether its subarctic farms' lower capacity factors are a climate effect, it carefully ruled out wind resource and turbine models, then concluded that the data doesn't show the cause, when it does.
About the benchmark
We run new models through the same exam as they're released, and we'll keep sharing what we find.
The exam is private and we're sharing it with researchers. We're keeping it private so that the answer key doesn't make its way into the training set. For the same reason, the data is fabricated: the warehouse is a synthetic wind-energy fleet, built to look like a real operator's data, so its answers don't exist anywhere else.
If you'd like access, reach out to Chris Parmer at Plotly.