
Public utility organization reduces work order overdue rate by 87% with Dash Enterprise
Industry
Energy & Utilities
Integration
Databricks
Infrastructure
Azure
Summary
- Within one year, Dash enabled a public utility to reduce its overdue rate on thousands of work orders from 90% overdue to 3%, leading to a 10x reduction in customer complaints.
- Learn how a multi-departmental organization decides to move from using open-source Dash to licensing Dash Enterprise.
- Dash Enterprise scales to support user growth and deployment needs within teams and across the enterprise.
Introduction
A major North American public utility was facing a problem that it couldn’t quite quantify. The company had six thousand employees managing its power network operations, but they couldn’t keep up with customer requests: downed wires, power outages, low voltage, and blown transformers. Work orders to fix these problems were piling up, while unresolved customer complaints automatically escalated up the chain, leading to disruption at all levels.
Among the six thousand employees was an electrical engineer and avid open-source user of Dash, Plotly’s framework for building interactive analytic applications. He already used Python to work with departmental data, so it was easy to create Dash applications on his local machine, using Dash’s front end to look for patterns that might lead to a solution.
Challenge
By utilizing Dash to quickly and visually explore the data, it became apparent that 90% of the department’s work orders were consistently backlogged. The engineer shared the Dash application with his managers, who determined that they needed more detail. Dash’s modular, component-based nature led to a quick build-out of the application, allowing managers to gain data views by technician, location, number of open orders, and job type.
Dash was becoming a reliable way to quickly generate and share data views within the department. Fifty technicians, several managers, and 100 engineers regularly referenced the application in order to dispatch the right technicians to the right jobs and ensure that no one was being overworked or underutilized.
Solution
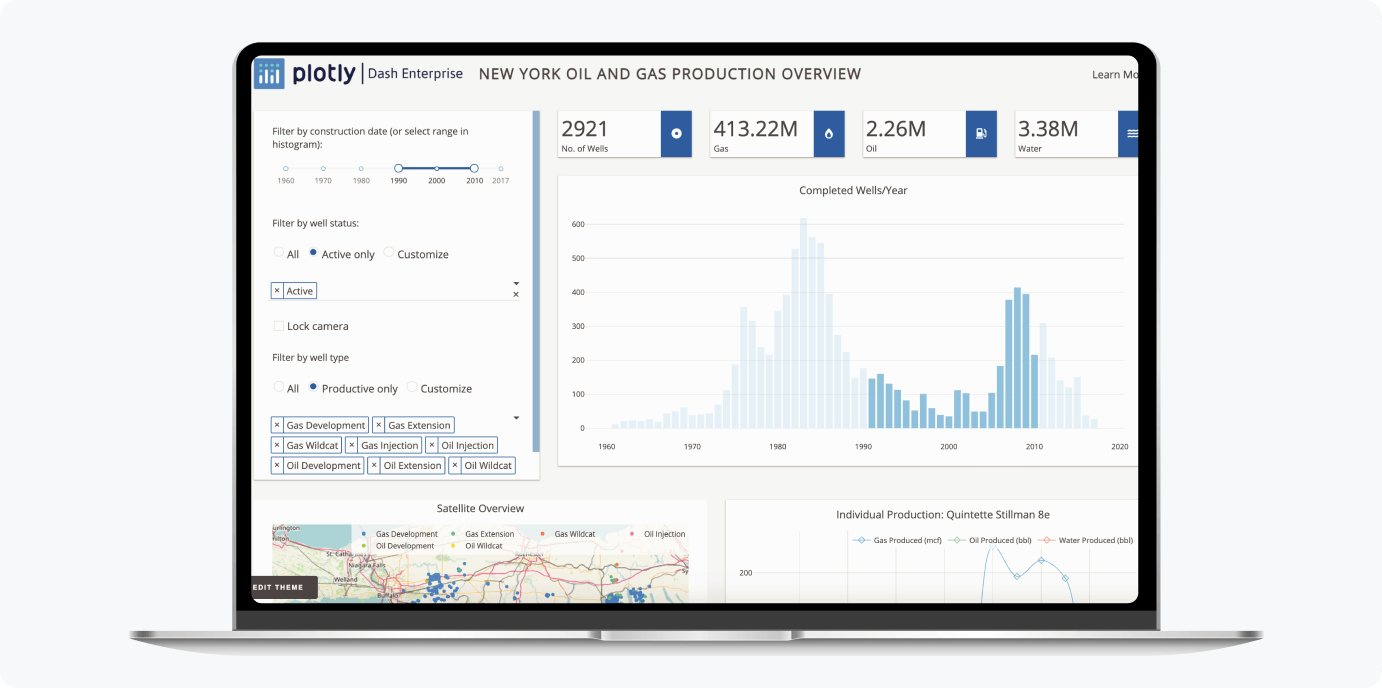
The insights gained and the impact on work efficiency led to the creation of more Dash applications. Analytic applications of smart meter histories and transformer load data became regular go-to tools for the department’s top executives, who didn’t need to know Python or advanced analytics to gain detailed insight into their operations.
They began to gain a real picture of customer demand, energy usage, and infrastructure health, contextualized by historical data and future risk indicators. Interactive maps and color grading let users see full, information-rich views at one glance. Managers could explore high-level views of an entire region or drill down to a specific transformer. Hover text and responsive tables displayed details on demand.
Dash Enterprise provides simplified layouts, sidebars, and headers. That means point-and-click theme editing for developers and easy visual scanning for users.
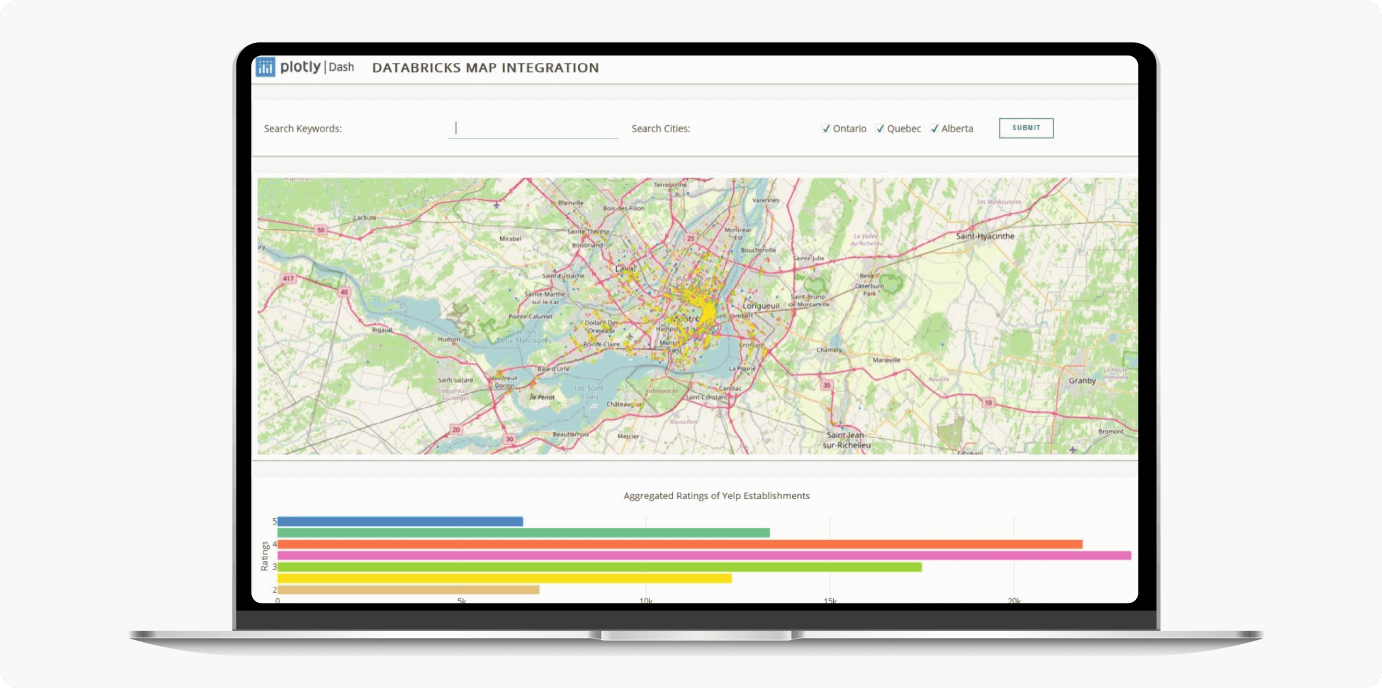
Dash Enterprise comes with out-of-the-box connectors for the most popular big data backends, like Databricks, RAPIDS, Snowflake, and Salesforce.
Results
Using Dash had a clear payoff for the utility’s customers. Within one year, 97% of work orders were being completed on time, as compared with the year prior, when 90% were past due. Customers were making 10 times fewer complaints. And at least 500 of the 600 voltage regulators were fixed because Dash enabled the department to dispatch their technicians more efficiently.
Within the department, Dash’s return on investment led to the creation of two software developer roles to further what was once the passion project of one dedicated employee. They secured a Dash Enterprise team license, opening up enterprise branding and styling capabilities that accelerated the arrangement, styling, and customization of their applications.
The team was able to build analytic apps even faster by abstracting away application design tasks. They quickly developed a prototype application to apply machine learning to forecast electrical loads and prevent faulty distribution during weather extremes. Meanwhile, colleagues in the R&D department took notice due to parallels with similar projects.
Dash’s popularity across different departments continued to grow. Its Python interface and 40+ technical charting types meant that most engineers and data scientists were already equipped to produce working Dash applications. Plotly’s Consulting and Training team supported this growing user base with several customized workshops. Over the course of a year, more engineers and data scientists learned basic Dash application development and progressed to integrating artificial intelligence and deploying applications from Azure Databricks notebooks.
As the number of people building and sharing Dash applications grows, deployment from local machines is not a scalable solution. Dash Enterprise features like application management, user tracking, and authentication are necessities for business operations. Needs for a stable deployment solution that integrates with the organization’s existing systems have been identified so that the utility can continue building and deploying mission-critical applications with Dash Enterprise.
Throughout this transition, Plotly has continued to support the organization in making the best product decisions to meet its evolving needs.
More user stories like this
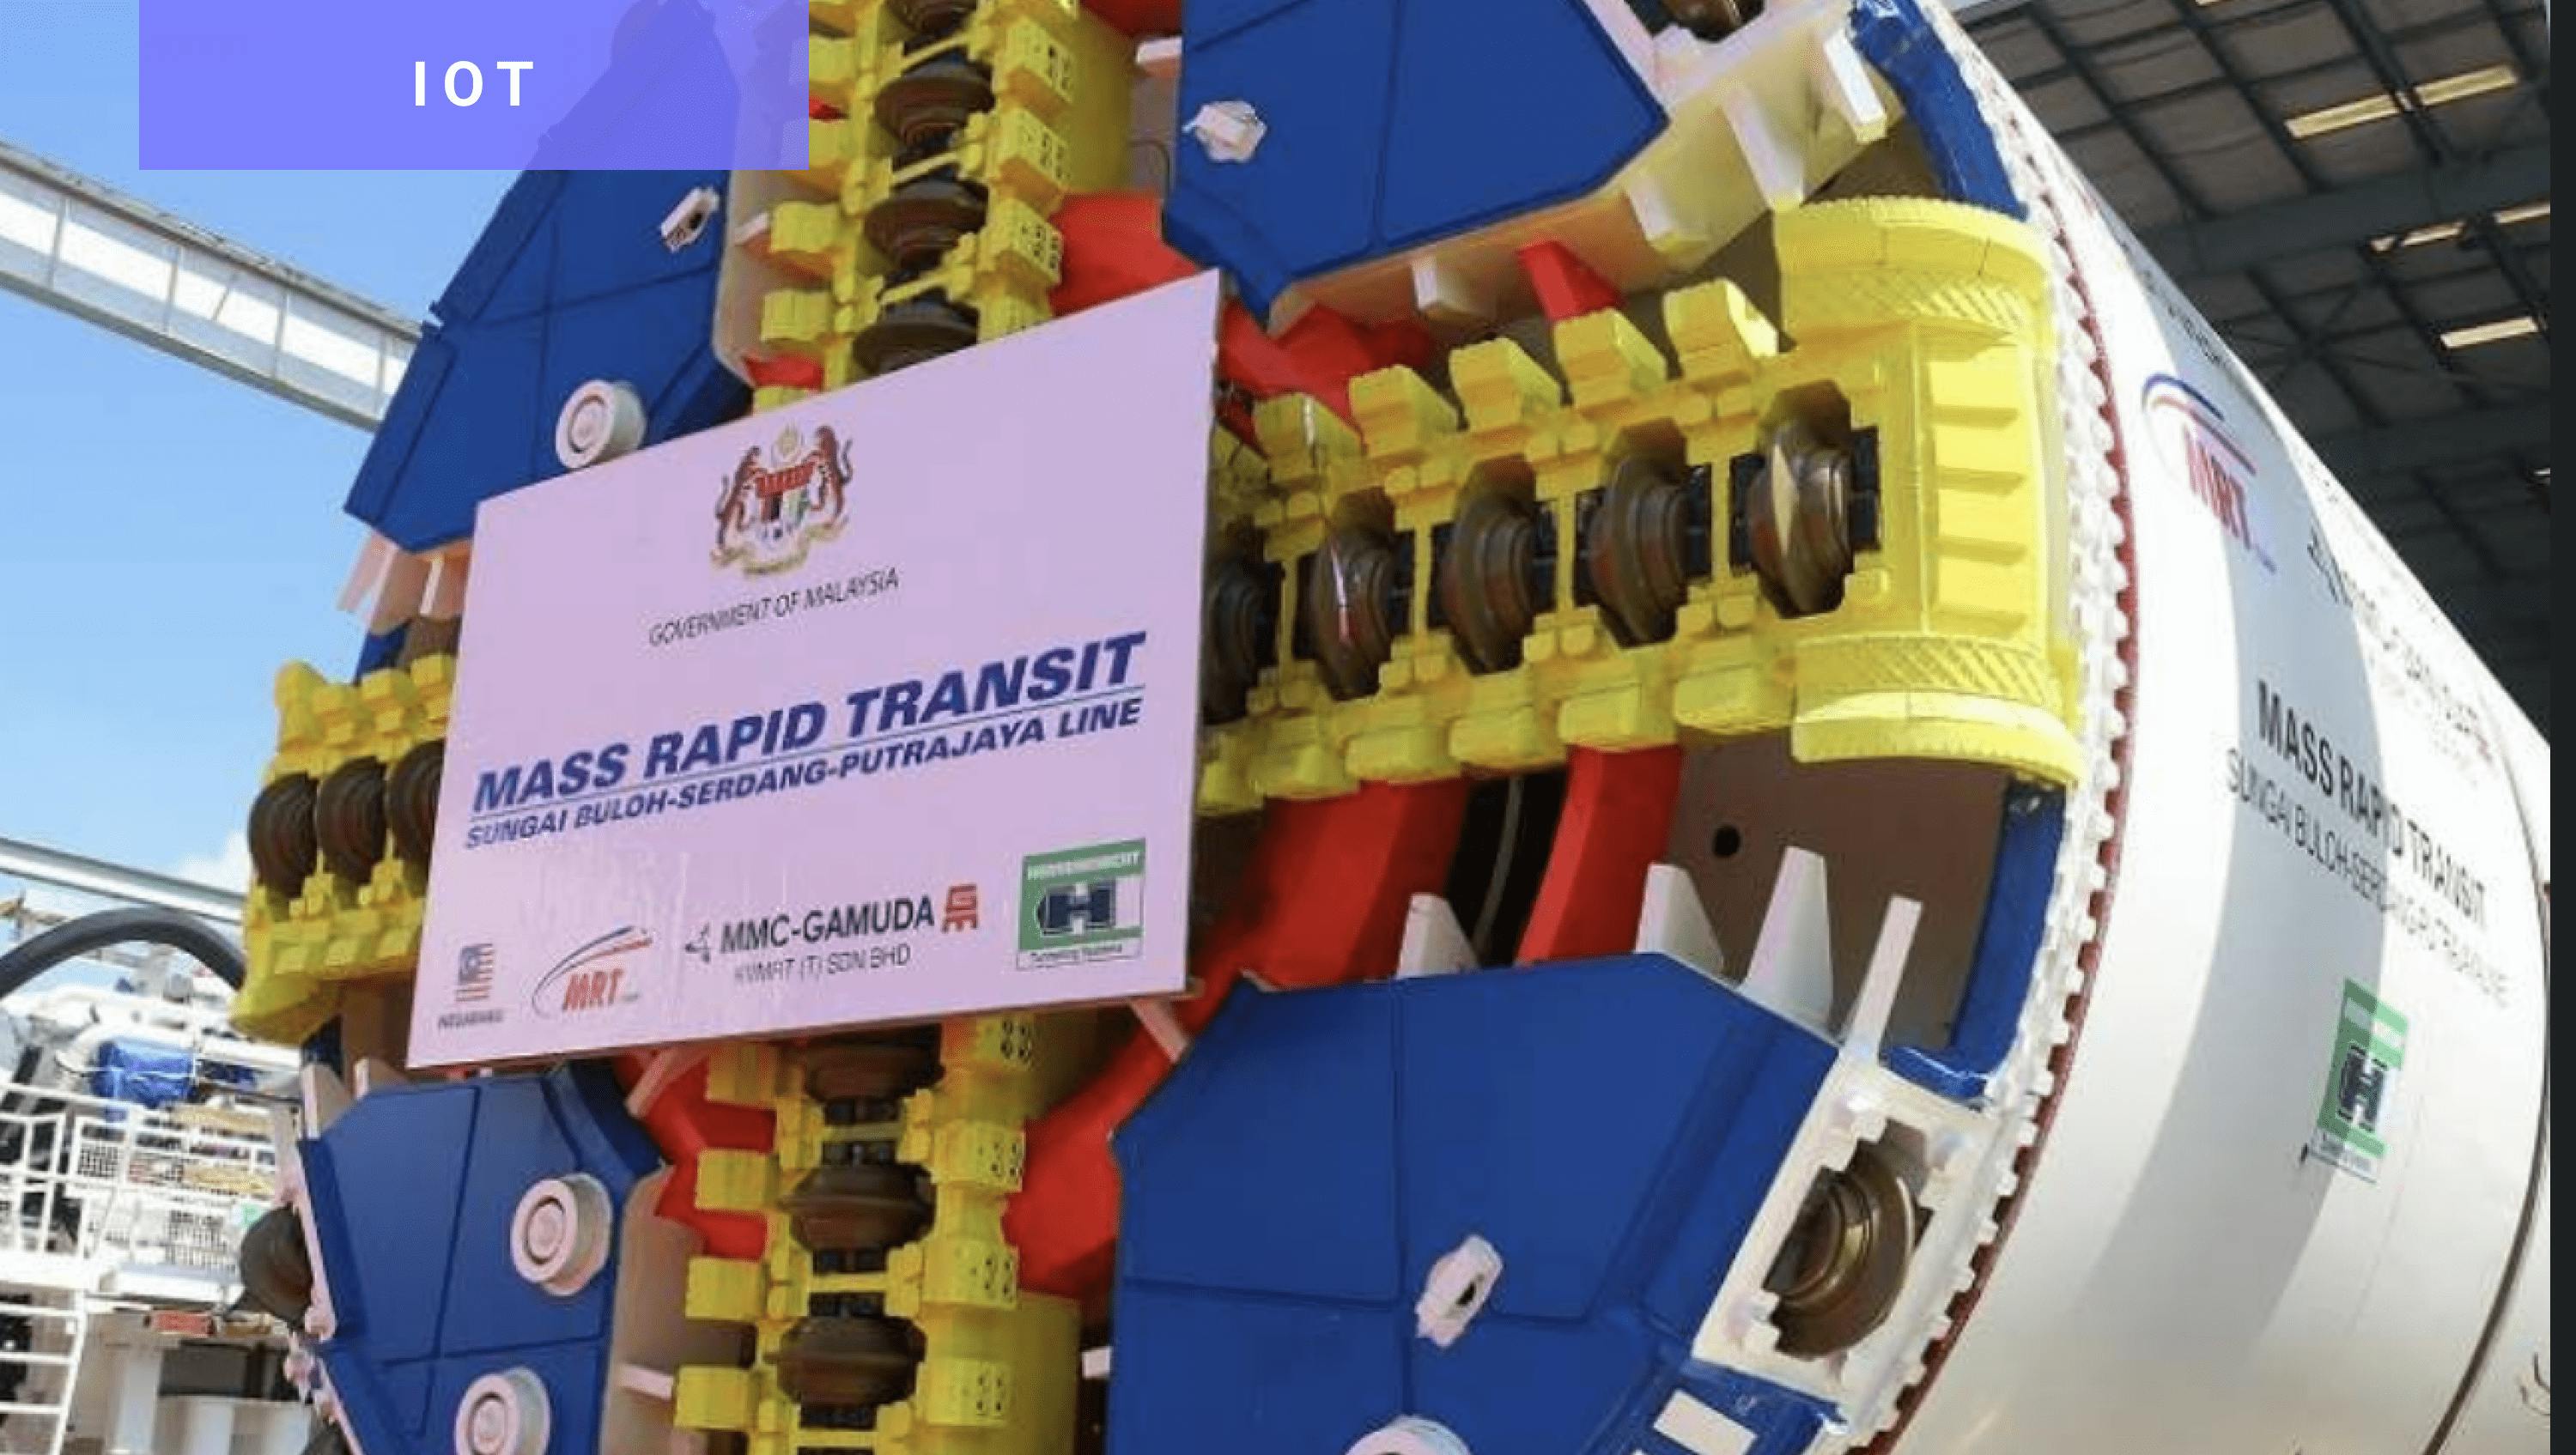
Gamuda develops tunnel boring machine IoT solution with Dash

National Renewable Energy Laboratory Mobilizes Dash for Wind Turbine Wake Research
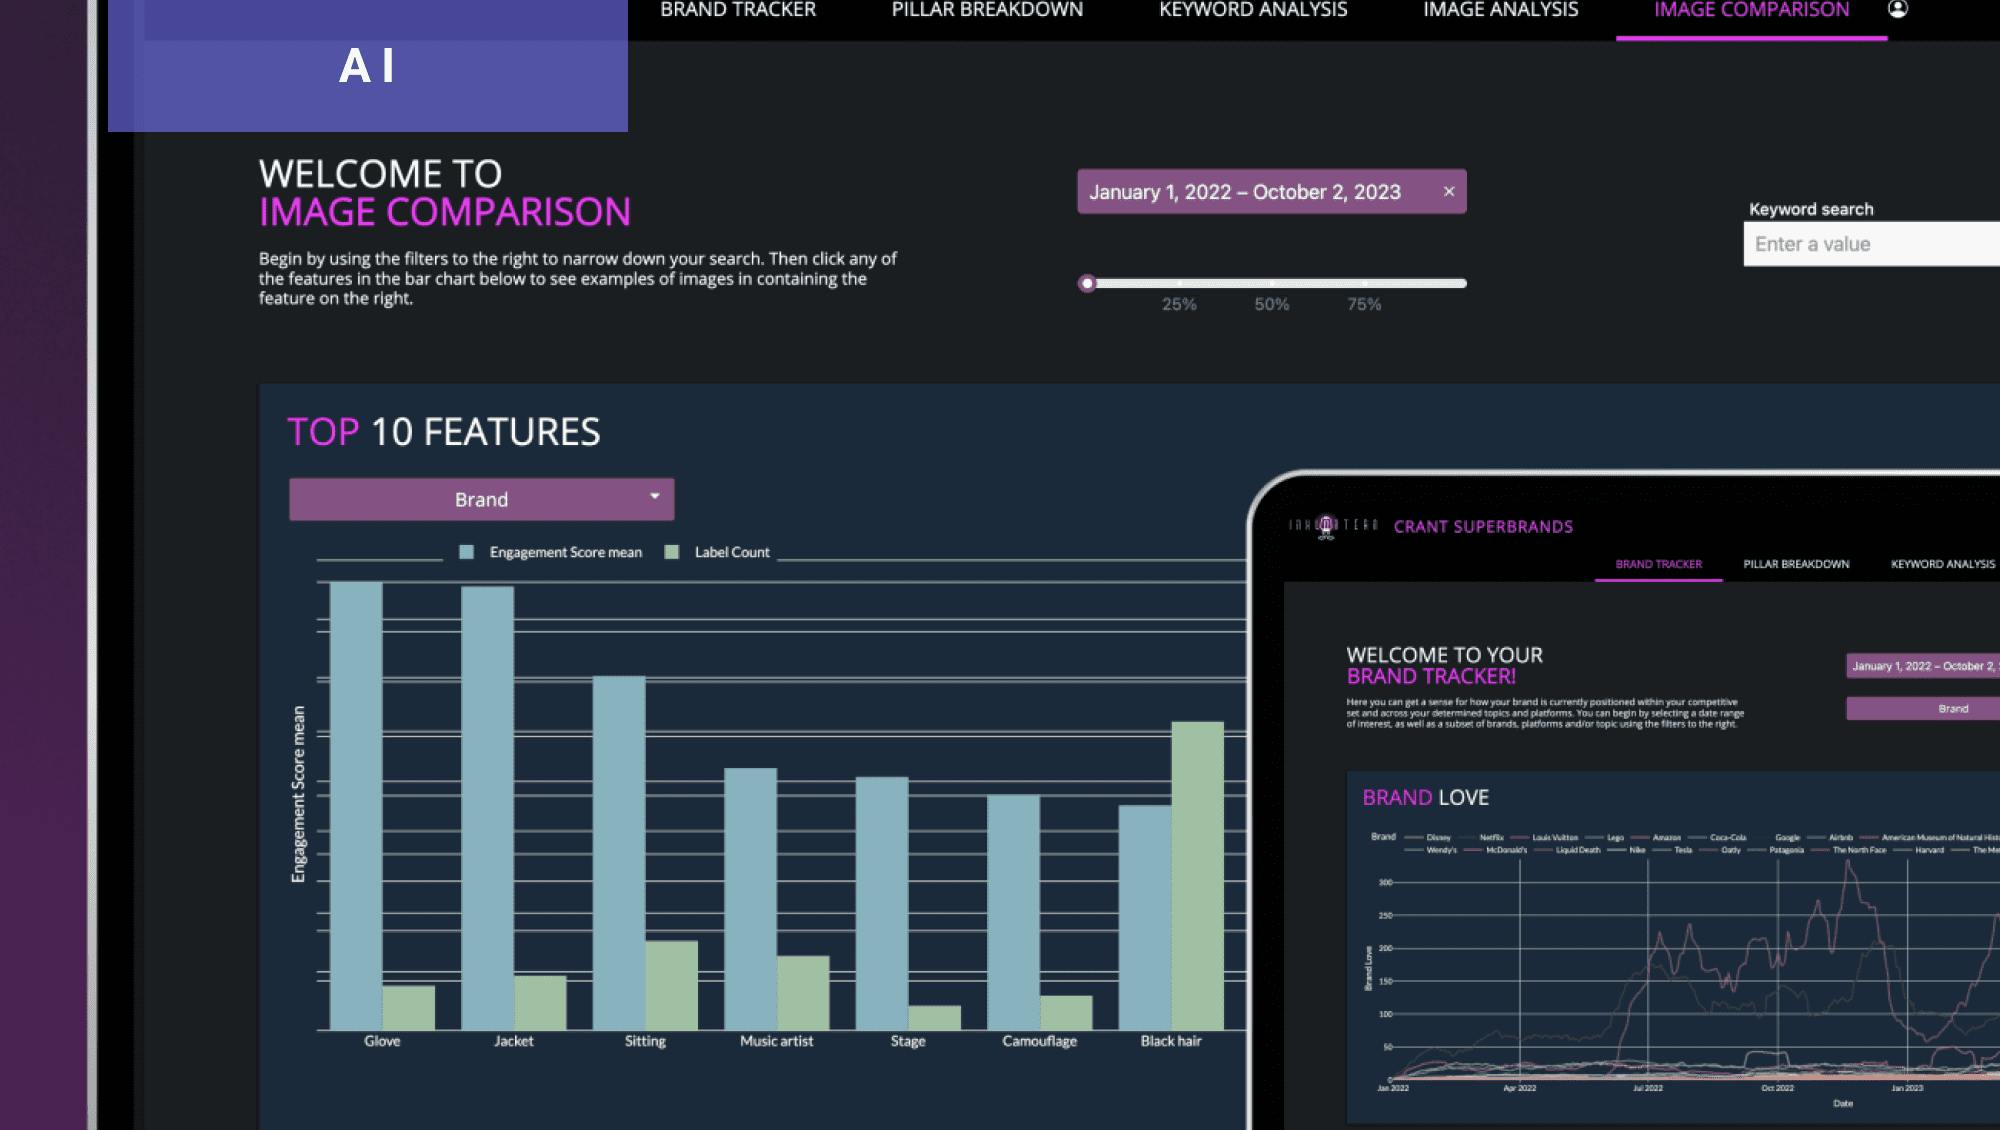
How Crant Automated AI-driven Insight for Brand Building with Dash