
Priyaanka Arora
July 25, 2024
What is a Data App? Complete Guide and Industry Examples
We’re past the era of debating the importance of data. Data is omnipresent, in huge quantities, and key to informed, competitive decisions.
Nowadays, data scientists uncover and share data insights by partnering with executives and other business users. Modern data science teams trade static reports for interactive, collaborative, and highly custom data applications — commonly known as data apps.
This in-depth guide will cover everything you need to know about data apps; how to define them, understand their benefits, build them from scratch, incorporate AI into them, and share them at scale across your organization. Keep reading for practical examples and real-world case studies of companies using these advanced data science applications to achieve a measurable competitive advantage.
What is a data application?
A data application is a type of analytic application that combines data visualizations with web applications to enable sophisticated and deep analysis of data. The name "data application" is a portmanteau of "data visualization" and "web application".
Data apps act as a bridge between data science teams and business users, allowing non-technical stakeholders to interact with, make decisions based on, and even manipulate and write back data in real time. Pascal Wolfe, an Assistant Professor at supply chain institute and Plotly customer NISCI (Ningbo Institute for Supply Chain Innovation), shares details of the Python web apps created by his team:
"...these projects would merely be some Python scripts we would hand over to the client, and they would have to build their own visualizations. We can now deliver not only algorithms, but actual products — the project partner doesn't have to do anything other than work with us on their data pipeline."
Pascal Wolfe, Assistant Professor, NISCI
And that quote sums up what a data application is not: a static report, a standalone visualization, or a machine learning algorithm contained within a Python script. It can contain all of those things, but provides enhanced functionality to unleash actions and decisions.
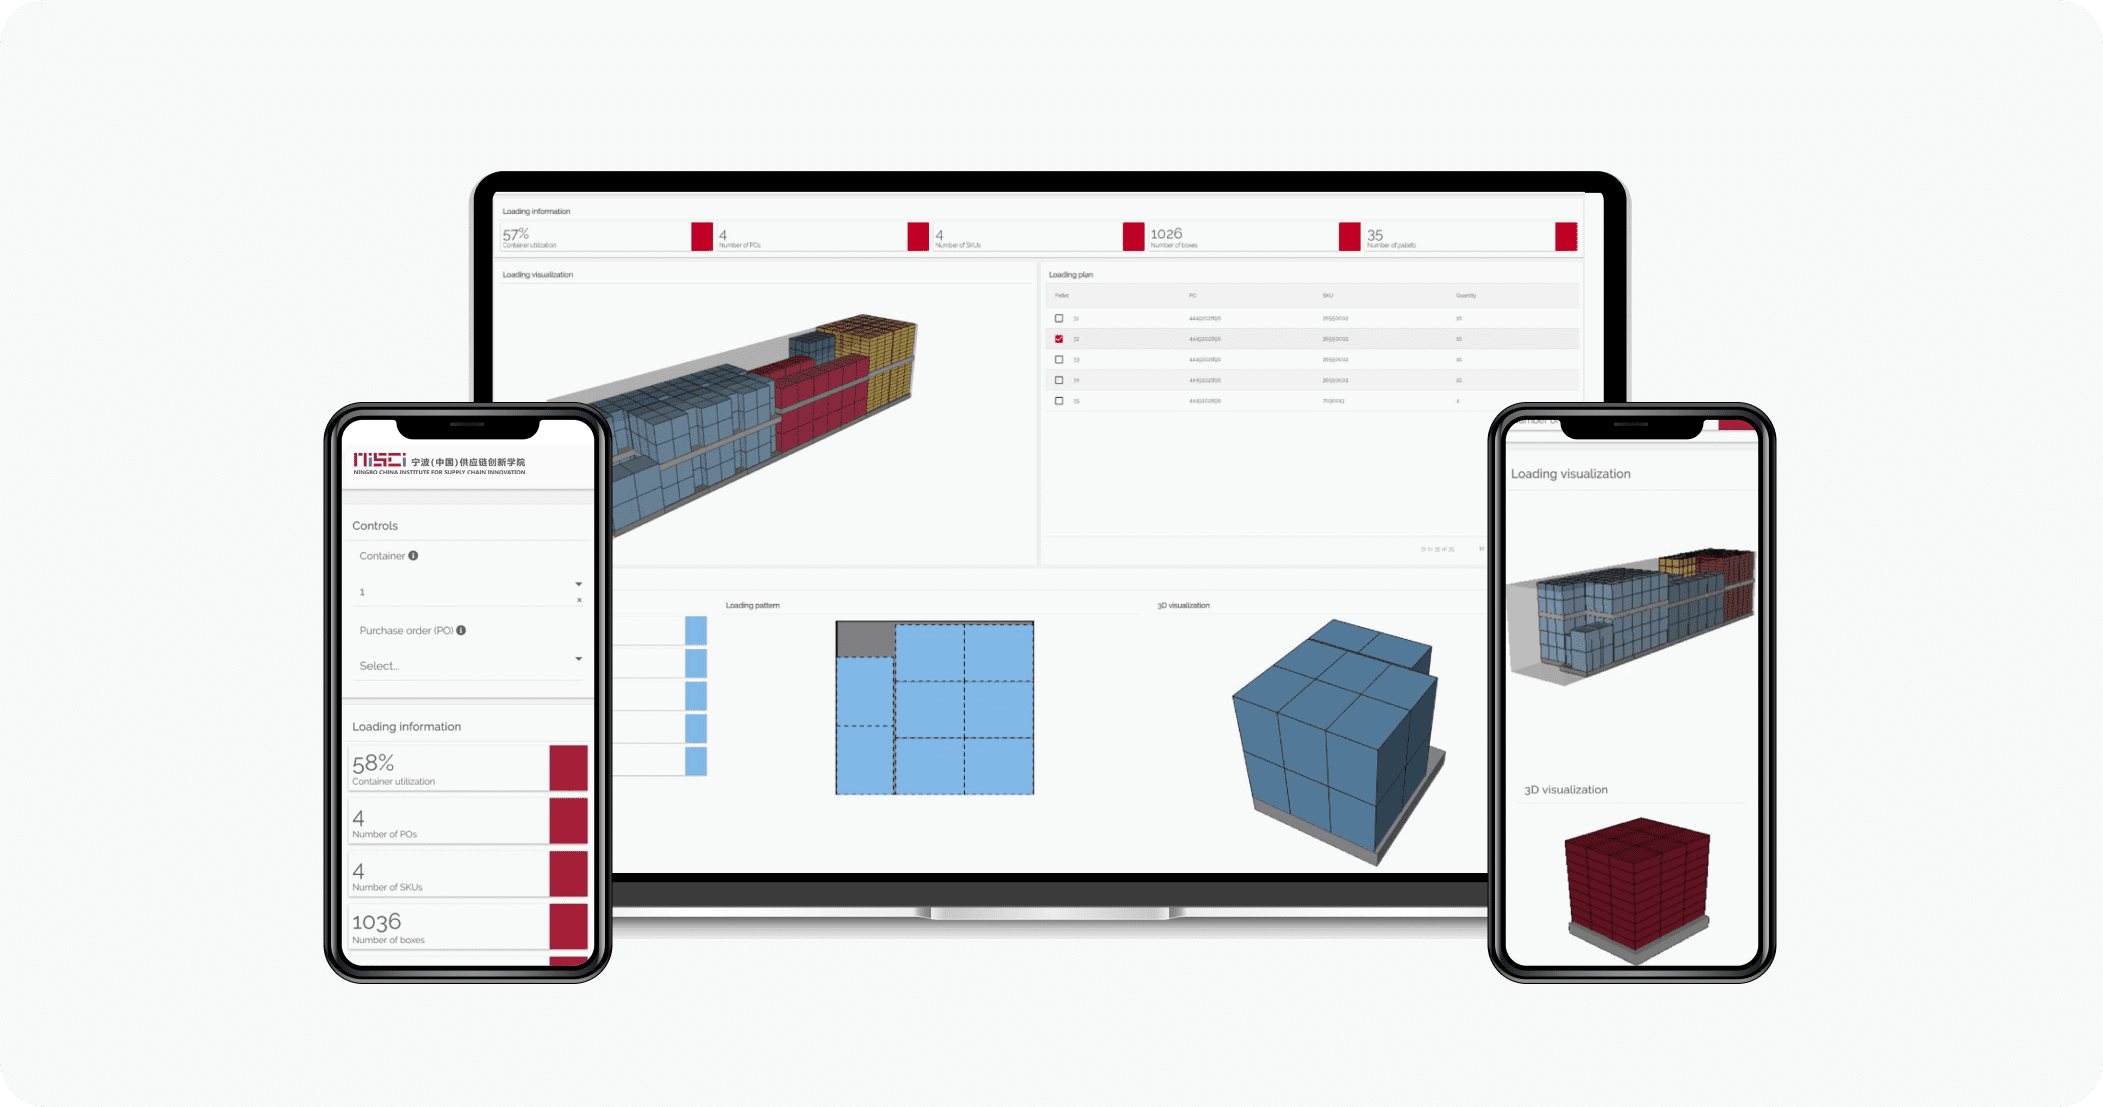
Plotly customer NISCI’s supply chain LCL loading data app. Users can create dynamic container loading plans with visual loading instructions.
Data apps are the latest evolution of interactive tools that power data democratization for operational business decisions and optimization. They’re evolved web applications or embedded applications and no longer restricted to just web browsers and can be deployed in virtually any environment.
Data applications are sometimes referred to as “analytical applications”, “data science applications”, or most recently, “two-way applications” given their read and write capacities. Here are some of their unique characteristics:
- Interactive user interface
- Customized templates and branded themes
- Integrates AI, machine learning, and other advanced analytics technologies
- Dynamic data writeback
- Shareable — directly, through triggered emails, through interactive PDFs, and snapshots
- Easily deployed to major cloud environments
- Secure authentication and authorization
- Composable for efficient reuse
- Scalable and can be embedded anywhere
What is the difference between data apps and web apps?
I've used the two terms interchangeably, but it's worth clarifying that data apps are a type of web app, built specifically to explore, analyze, or interact with data. A web app can focus on content delivery, ecommerce, or user interaction. Whereas a data app has visualizations, dashboards or reports, and interactive tools that help people make decisions. Data apps integrate directly with databases, APIs, or live data sources to provide real-time insights, and allow users to manipulate and write back data. So, you can consider a data app as a web app where data and insights is the main feature, not just an input or output.
The key components of a data application
Data apps are an emerging and relatively new technology — but they tend to have basic components present across different use cases and variations:
Data sources and connections
Every single data app has at least one component in common — the data. And if coded in Python, you have the ability to connect to any database, datastore, API, or file with a Python connector. This is crucial in fields such as defense or government organizations, where legacy tech stacks or airgapped environments lacking internet connectivity are prevalent.
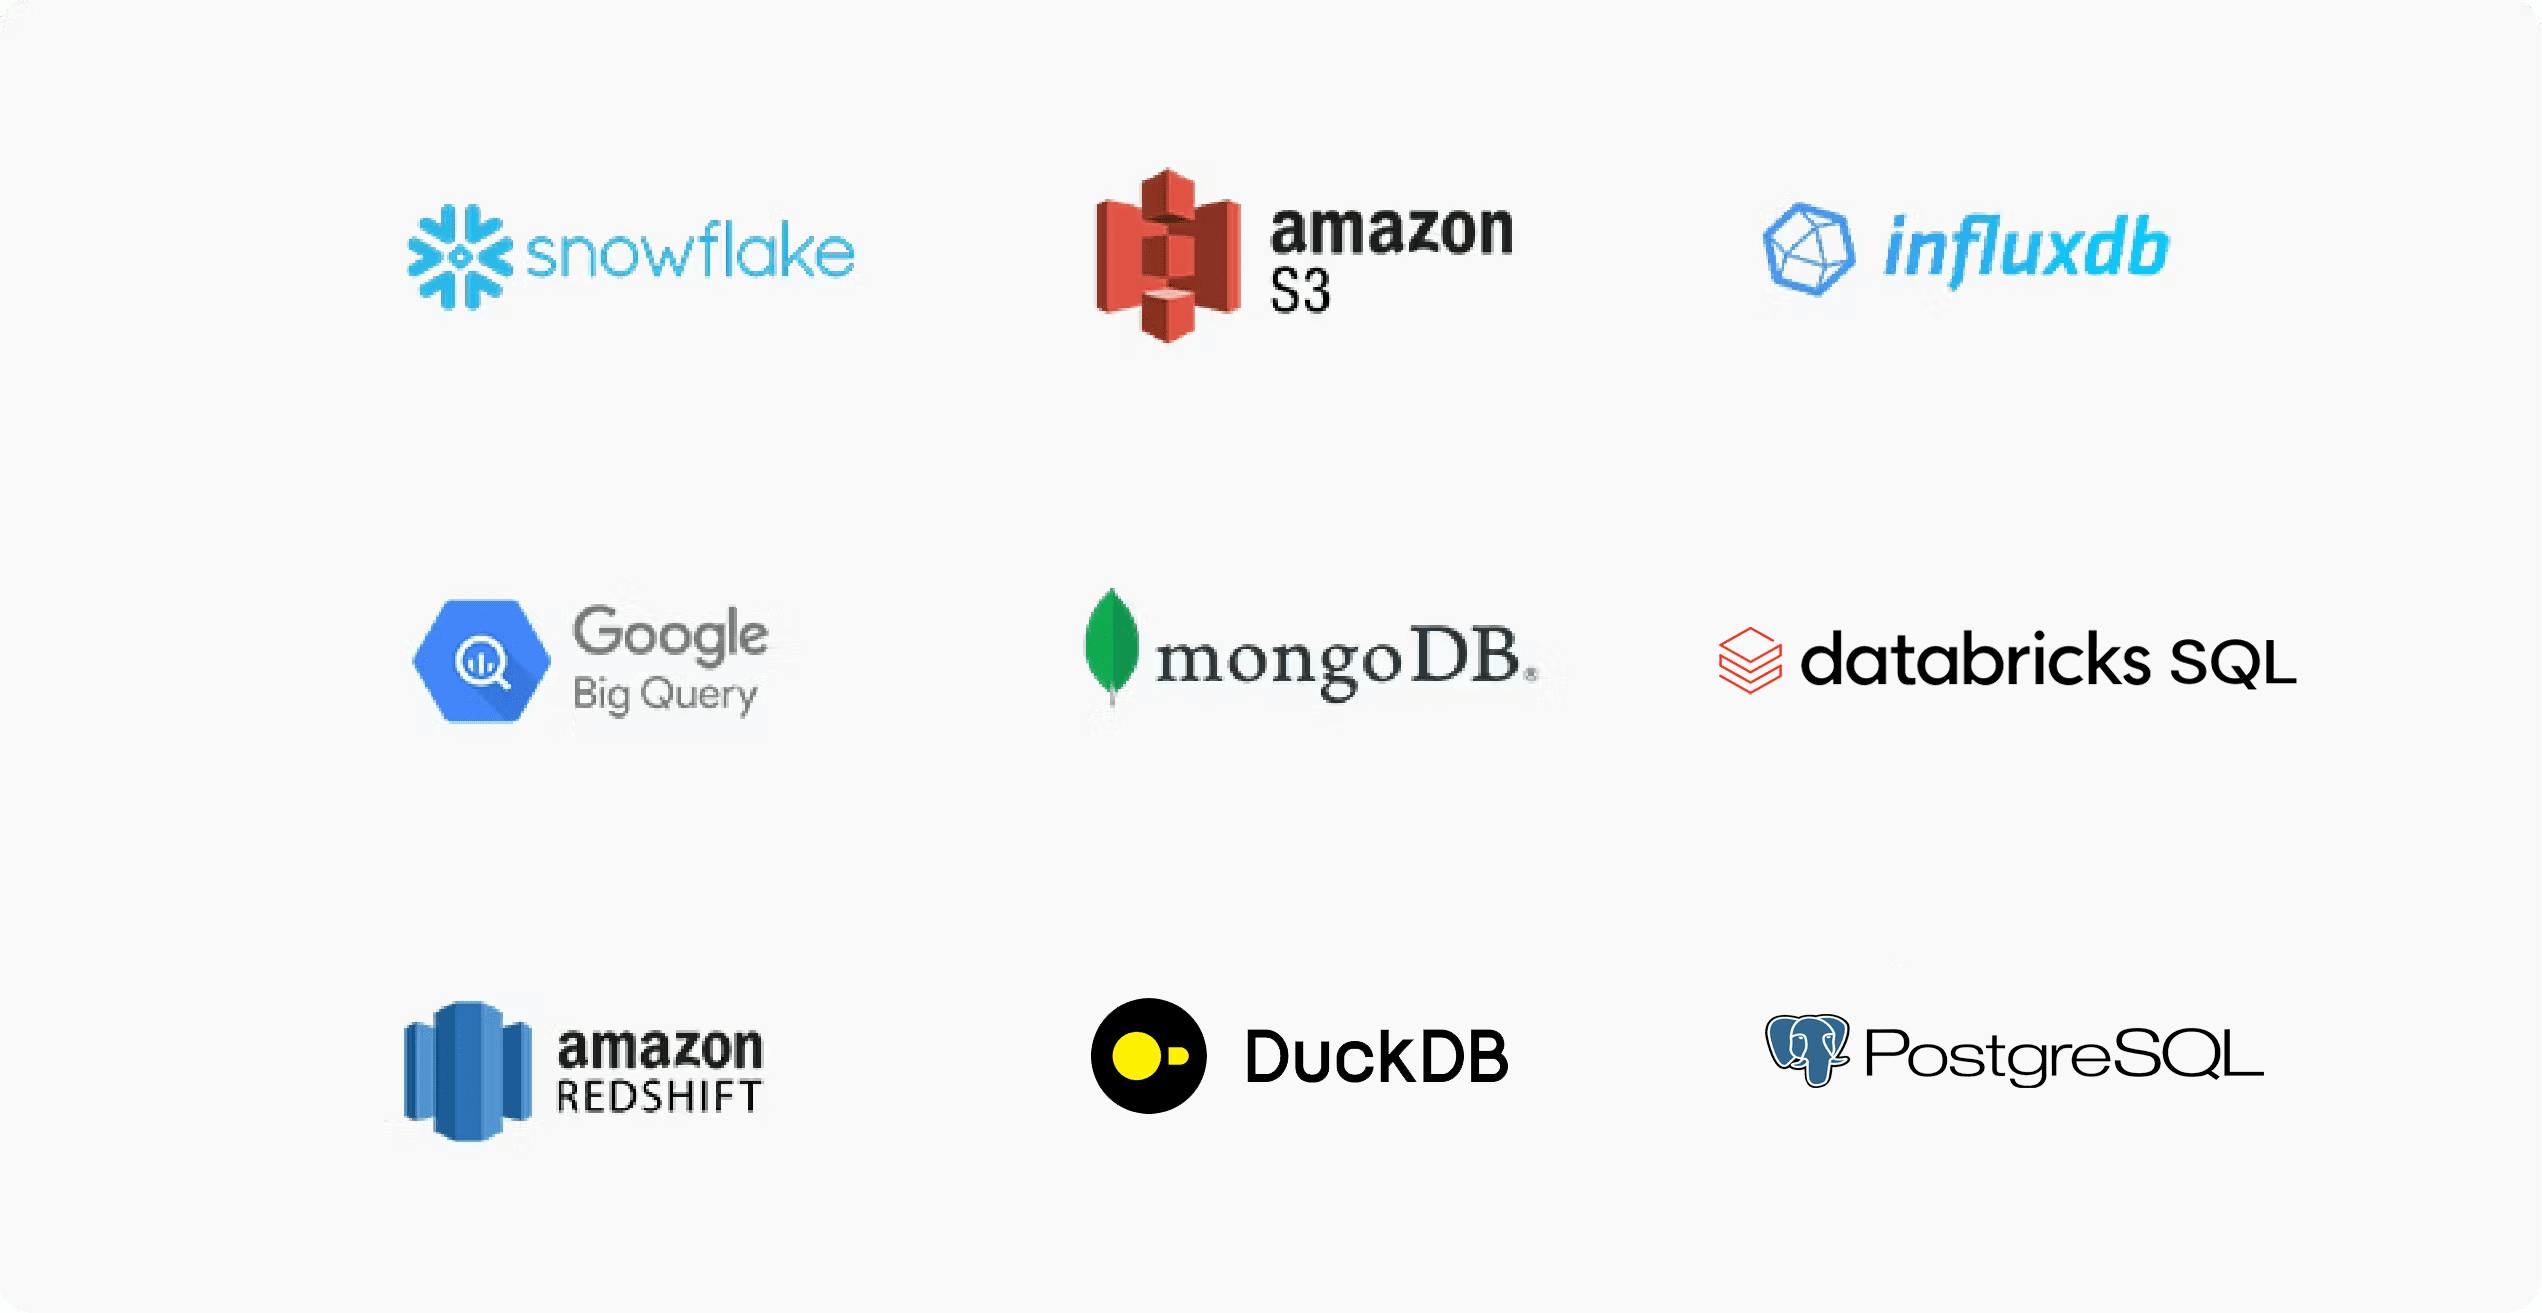
Using Python, your data application can connect to any database, datastore, API, or file format.
For example, big data analytics — deriving actionable insights from exceedingly large datasets — is made possible with the flexibility of data apps. Plotly community advocate and Lakeside Analytics founder, Sachin Seth, demoed how to visualize one billion data points in an industrial IoT app with Plotly and Databricks. Advanced use cases with voluminous data clearly distinguish data applications from reports and dashboards.

Visualize 200 million data points in an industrial IoT app with Plotly and Databricks.
Layout, visual interface, and design
The visual interface is another key component because what’s special about data apps is how customizable they are — capable of incorporating your company’s brand or color themes. In addition to the look-and-feel, the application layout itself guides the user’s flow and experience when interacting with data.
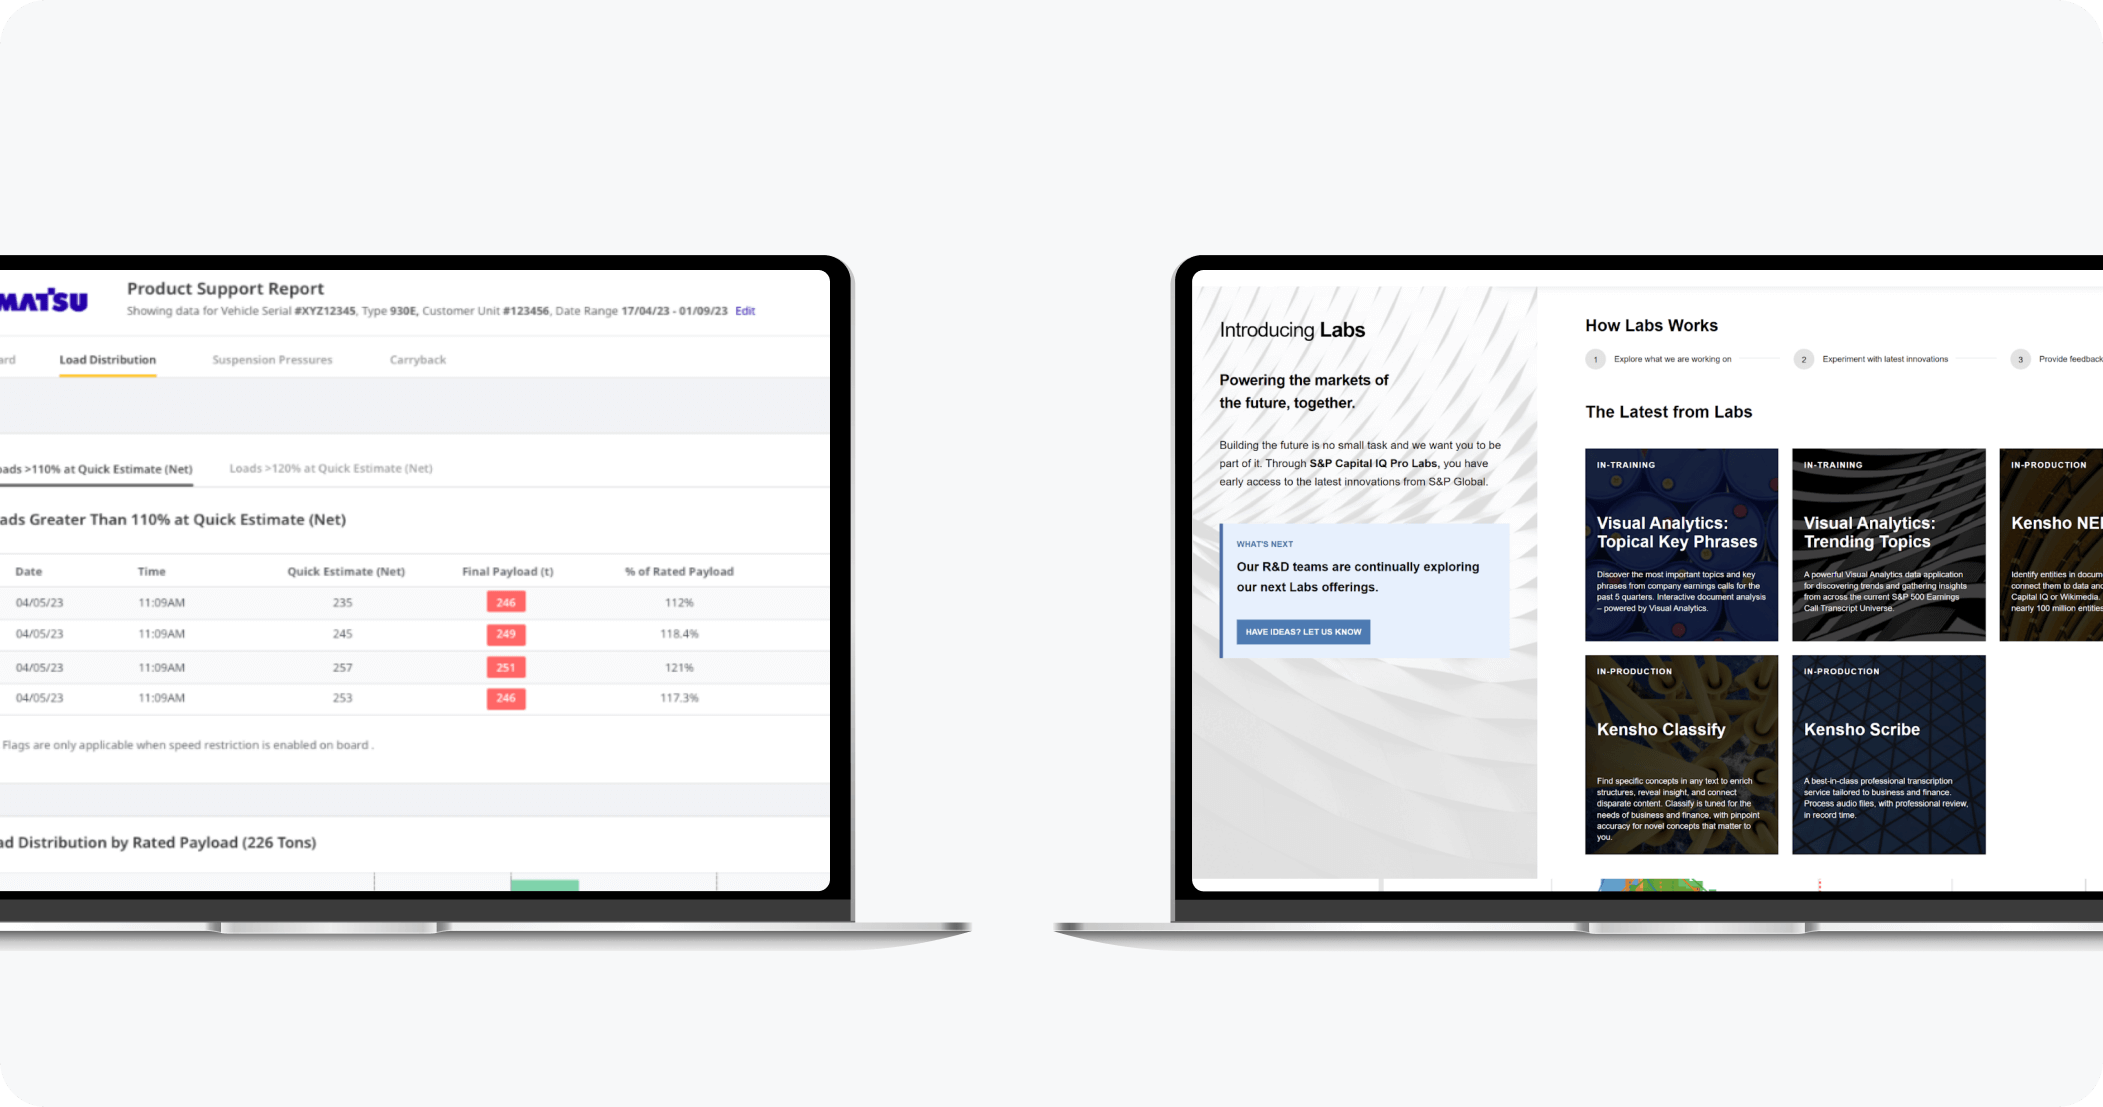
Branded, highly customized data apps from S&P Global and Komatsu.
Here’s the catch: without a framework like Plotly Dash, or a data design framework like Plotly Dash Enterprise Design Kit, designing a beautiful front end layout needs a ton of HTML and CSS knowledge.
Controls and callbacks
So far, we’ve looked at data sources and design. Interactivity is the third magic ingredient that moves you beyond BI towards actionable insights. Controls in your data application are the mechanism for users to interact with the data you’re presenting. In some cases, you can accept user input to write back into your dataset.
In Dash, Plotly’s open source data app framework, we use callbacks to handle the backend whenever a user interacts with controls in an app — form fields, checkboxes, sliders, buttons, and more. Here’s an impressive example of an interactive graph that updates in real time based on user interactions.
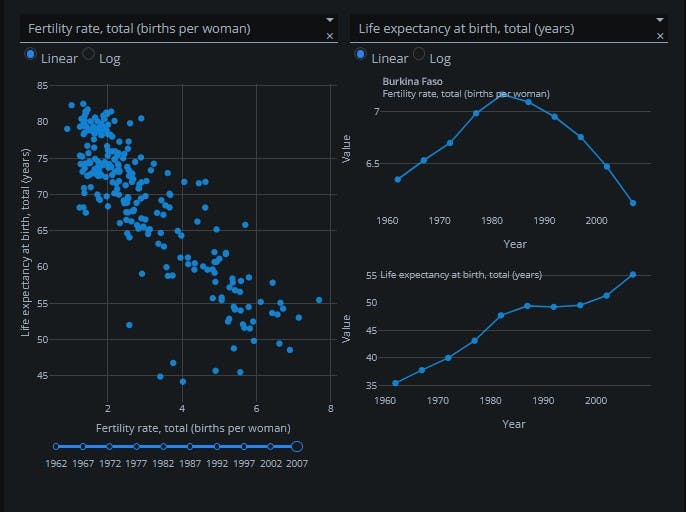
An interactive graph in a data app that updates the time series when a user hovers over the scatter plot.
Analytics engine
Without an analytics engine, a data app would be much closer to a traditional BI report. Adding this component brings the real power of data science, machine learning, and AI libraries into play. An analytics engine is built with tools like Hugging Face, PyTorch, TensorFlow, Pandas, and NumPy to process and analyze data in real-time.
These libraries enable complex computations and predictions, transforming raw data into predictive analytics, insights, and real time warnings or notifications. The analytics engine seamlessly integrates with the app, giving business users access to advanced analytics in an accessible manner, for powerful decision making.
Security and user management
In order to advance past exploratory data analysis, your solution needs to be production ready. A production-grade data app is capable of scale, used for cross-departmental collaboration and use cases, and most importantly, secure.
Tip: here’s an excellent resource on what makes a data app production ready.
But coming back to security, granular data access management, seamless user authentication, and data encryption are some of the data security and privacy features most companies require of production-grade data applications.
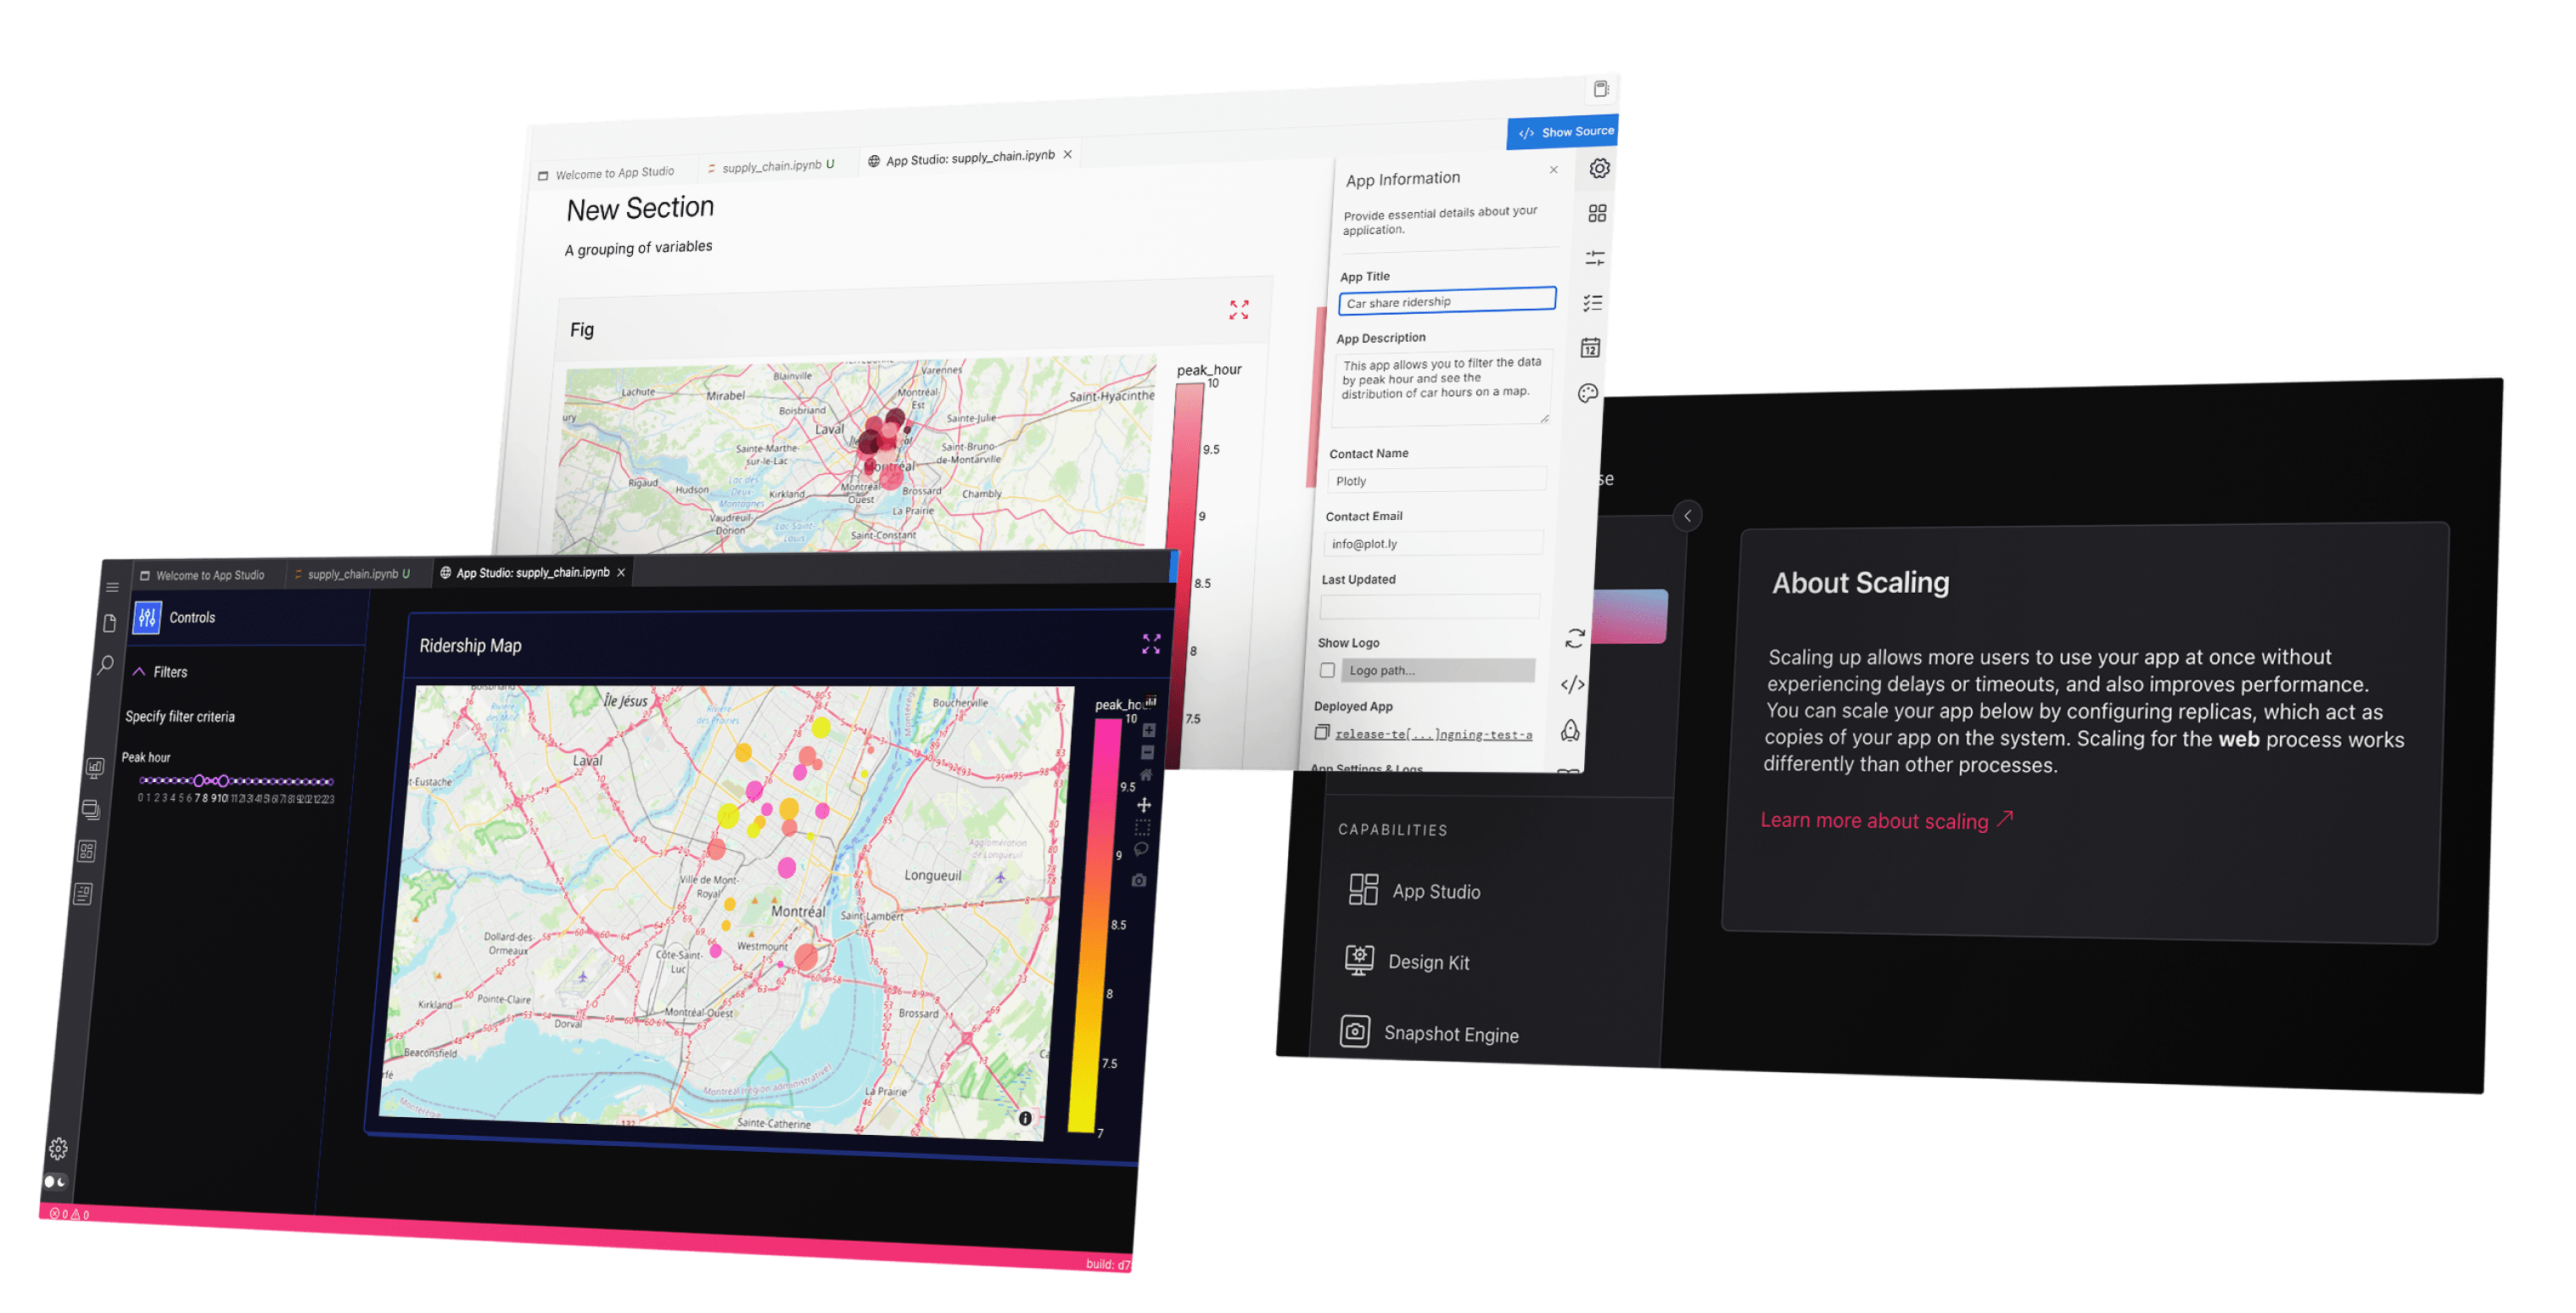
Deployment
Deploying your app to production makes it available for use by internal stakeholders or external clients. Modern data application frameworks offer centralized deployment to simplify this process. You can deploy apps with a single button click, manage multiple applications in a single platform, and even track viewer analytics to better understand usage patterns.
CI/CD workflows integrate seamlessly with modern deployment tools, ensuring efficient and reliable app releases. With built-in support for automated QA, pre-production reviews, and version control, deploying your data app becomes significantly easier.
Sharing
It’s hard to think of “sharing” as a component until you understand that
- Data apps are almost exclusively made to be worked on collaboratively
- Sharing in this context means much more than static PDFs, PowerPoints decks, or screenshots

A fully interactive, multi-device compatible PDF report rendered entirely in Python.
A data app is an amalgamation of advanced analytics and on-demand reporting in a single unit. You can generate reports as shareable links or downloadable PDFs, and automate real-time data monitoring and reporting. Some interesting use cases include modernizing and consolidating auditing and compliance infrastructure for streamlined operations.
You can also embed a data app anywhere, and pass data back and forth between the parent host app and your app.
Types of data apps
There are countless different uses for production data science applications; classifying them into types would be difficult. However, there are three general types or categories of data apps we see our customers and community create:
Embedded data apps: this type of app is embedded within another application for a specific purpose. For example, the AI-driven supply chain analytics company aioneers embeds Plotly Dash data apps into its AI supply chain operations platform.
Organization-wide data platforms: these data apps showcase internal use cases for operational decisions across the org. For example, the Kansas City Chiefs built an analytics platform to efficiently manage game-day operations in real time.
External, client-facing data products: commercialized data apps that a company uses to generate revenue by providing consulting, analytics, or other services via the data product to external clients. For example, S&P Global Market Intelligence created a commercial offering, S&P Global Capital IQ Pro Labs, where the company collaborates with clients to analyze large volumes of data based on specific workflows such as trending topics from earnings call transcripts.
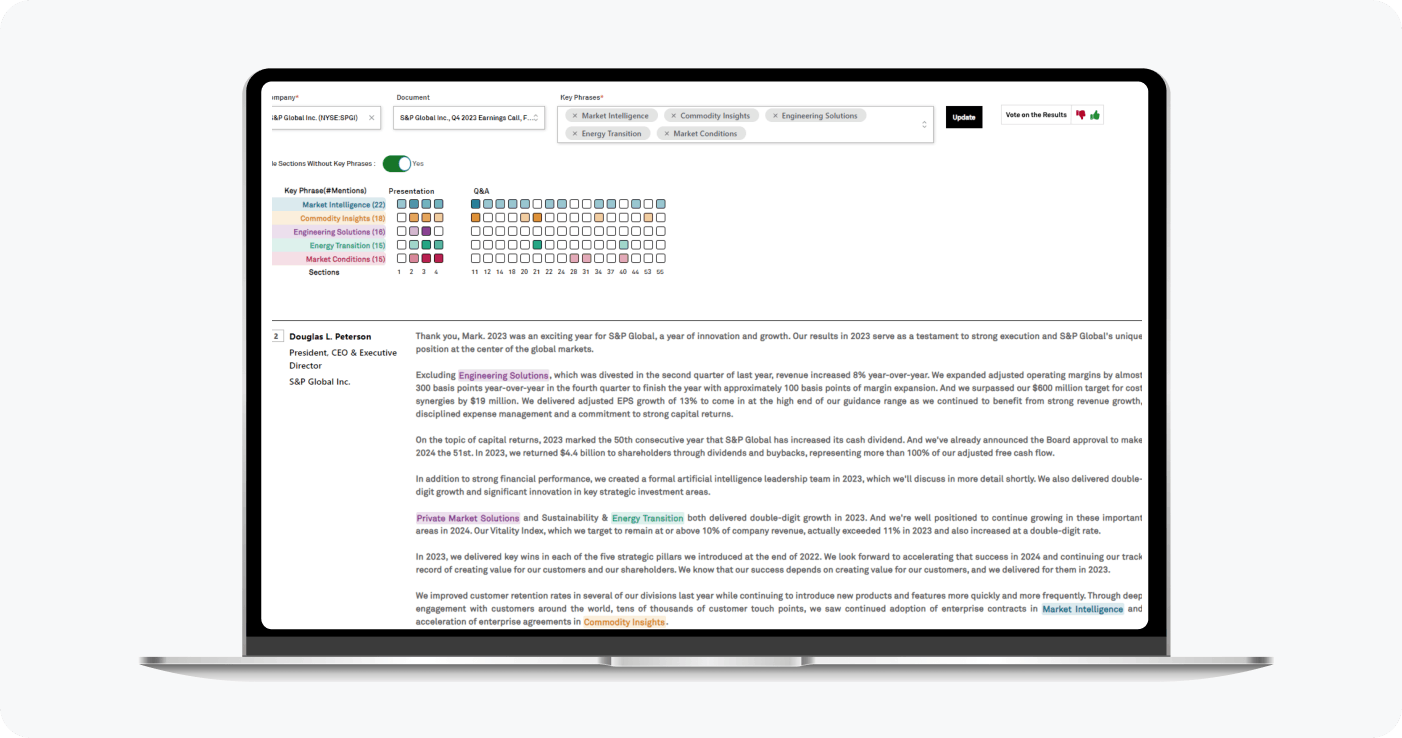
Identify the most significant topics in each earnings call transcript based on semantically- and contextually-similar keyphrase occurrences.
What are the benefits of data apps?
Data applications primarily benefit business users who wish to collaborate closely with data science and analytics teams to make business and operational decisions via an accessible user interface. Their benefits can be summed up with the following: collaboration, customizability, and control.
Collaboration
Decisions made in silos don’t work well in the long run. In practical terms, data analysts and scientists tend to be highly technical users, while decision makers are rarely so. Data apps bridge this gap, where the data scientist develops and shares an interactive data application or platform where they can work side-by-side with non-technical users to explore, seek insights from, and create a competitive advantage with data.
Customizability
Given the criticality of decisions made, the visual interface and design itself needs to reflect the organization's brand. Data apps excel at this, with the ability to customize the theming, user experience, and interactions that take place within the app. The newest wave of frameworks simplify this process by allowing data scientists to easily transform exploratory analyses in data science notebooks into professional, interactive data applications.
Control
Data apps are interactive — we’ve thoroughly established this fact so far. But that interactivity demonstrates “control” two-fold: app developers can minutely control how end users explore, manipulate, and write back data, while end users can control their experience of seeking insights from data. Apart from interactivity, data applications provide a set of security features that simplify managing access to data.
What are the challenges solved by data apps?
It depends. To an enterprise company struggling with uniting siloed departments and making sense of big data, data apps solve the problem of decisions at scale. But these apps can start small, offering a scientific researcher a method to build trust in their research findings by letting end users explore the data hands on.
Tip: we’ve collected an entire gallery of data apps solving problems and challenges of all sizes across 6+ industries. Explore this resource for an immediate, practical understanding of the types of problems solved by data applications.
A few other high-level challenges solved by data apps are:
- Scalability
- Data silos
- Data accuracy
- User accessibility
- Front end development
- Compliance
- Cost savings
- Resource optimization
- Revenue generation
Plotly customer, Martin Engineering, provided an apt illustration of the types of challenges solved. Mark Slack, Global Product Manager - Transformational Growth at Martin Engineering, shared with us:
“What we really want to do is to delight our customers with data-driven insights. One of the things we measure is how fast they wear out their equipment — looking at ways we can improve asset utilization and performance by helping them to integrate these insights into the way they work with our products.”
Mark Slack, Global Product Manager - Transformational Growth, Martin Engineering
Challenges faced when trying to build data apps
Data apps solve plenty of problems, but there can be initial challenges when a data science or data engineering team is new to building them. If you’re considering building an application to solve a business challenge faced by your org, keep the following common challenges in mind:
- Coding skills: Python is all you need to know, but it is a requirement to build more advanced data apps. However, this requirement is easing up with AI-powered insights and notebook-to-app transformation.
- Performance optimization: Though much easier as opposed to BI, there is still some planning required for high-performance apps, especially when dealing with real-time analytics and big data.
- User adoption: Adoption tends to be the bane of data science teams. But once you cross this challenge, the ROI and hands-on nature of data applications will ensure you keep those usage and viewer analytics trending up.
- Specialized installation environments: In certain industries, bare metal servers and airgapped installation environments are a basic requirement, which can complicate installation processes unless you choose a data app platform capable of meeting such requirements.
- Cost: Yes, building production-grade applications requires a monetary commitment given the sophisticated nature of data app platforms. But, in most cases you can get started with an open source framework as a proof of concept before moving towards production.
AI is starting to remove some of these barriers for data teams with varied levels of experience. Generative AI can now translate notebooks into interactive apps, suggest app layouts, and help debug code. For example, agentic AI-assisted workflows can take a basic data analysis and scaffold a working prototype in minutes, lowering the entry point for teams that may not have full-stack experience. While AI won’t replace good engineering or design, it can dramatically shorten the time from idea to functional app.
An overview of data app architecture
In a previous section, we've seen some of the typical components of data apps, including data sources, the visual user interface, interactive controls, and deployment tools. These basic functions form a typical application architecture.
Data applications often integrate with primary data platforms such as Databricks, alongside other internal data sources and APIs. In a typical architecture, an app might utilize a cloud-native deployment software such as Kubernetes to ensure scalability and adherence to organizational standards. Other architecture features can include automated CI/CD pipelines for swift deployment, platform observability at both cluster and app levels for efficient resource management, and integration with existing enterprise technologies like single sign-on for secure user authentication.
In addition to this, data apps can use licensed libraries to quickly style the user interface or support deep learning model integration and real-time data analytics. Here are two sample application architectures from Plotly customers, CIBC and Uniper:
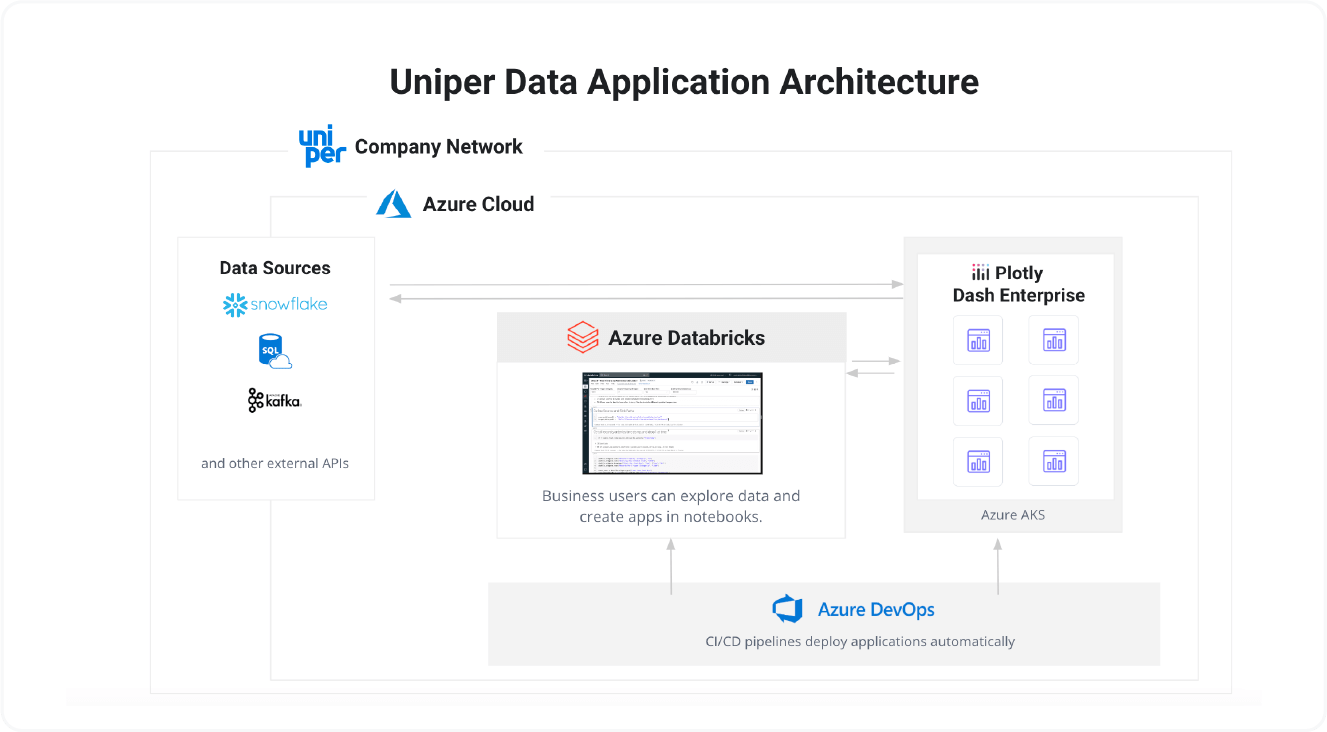
Uniper data app architecture.
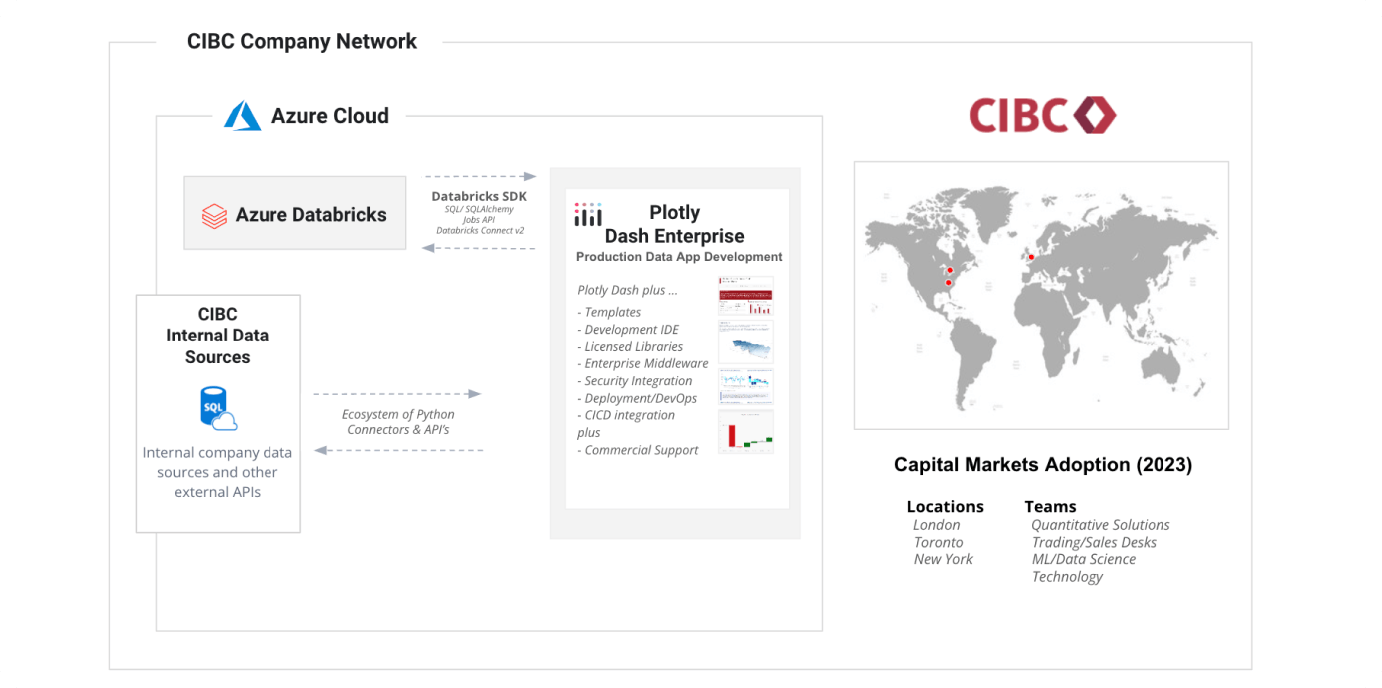
CIBC data app architecture.
Real-life examples of data apps by industry: case studies featuring Plotly customers
How are data apps used in the real world? What business impact do companies achieve by using data apps? This section highlights a few case studies of Plotly customers using data apps to create tangible value at organizations across diverse industries.
Tip: you can read the full collection of Plotly user stories here.
Quantitative analytics: CIBC drives ML-powered quant analytics
Multinational banking and financial services corporation CIBC delivered quantitative analytics powered by machine learning and personalized, ad-hoc tools accessed by Sales and trading desks to better serve their customers. The bank’s Quantitative Solutions team achieved cost savings and reduced their dependence on IT by empowering quant analysts to develop production-grade apps.
Energy: UK Power Networks aims to save customers more than £400MM
London-based distribution systems operator UK Power Networks developed ML-powered models to predict electricity demand peaks and inform network reliability upgrade investment decisions. The company’s Decision Sciences team provided potential cost savings for its customers by setting the path for affordable electricity in the UK's transition to Net Zero.
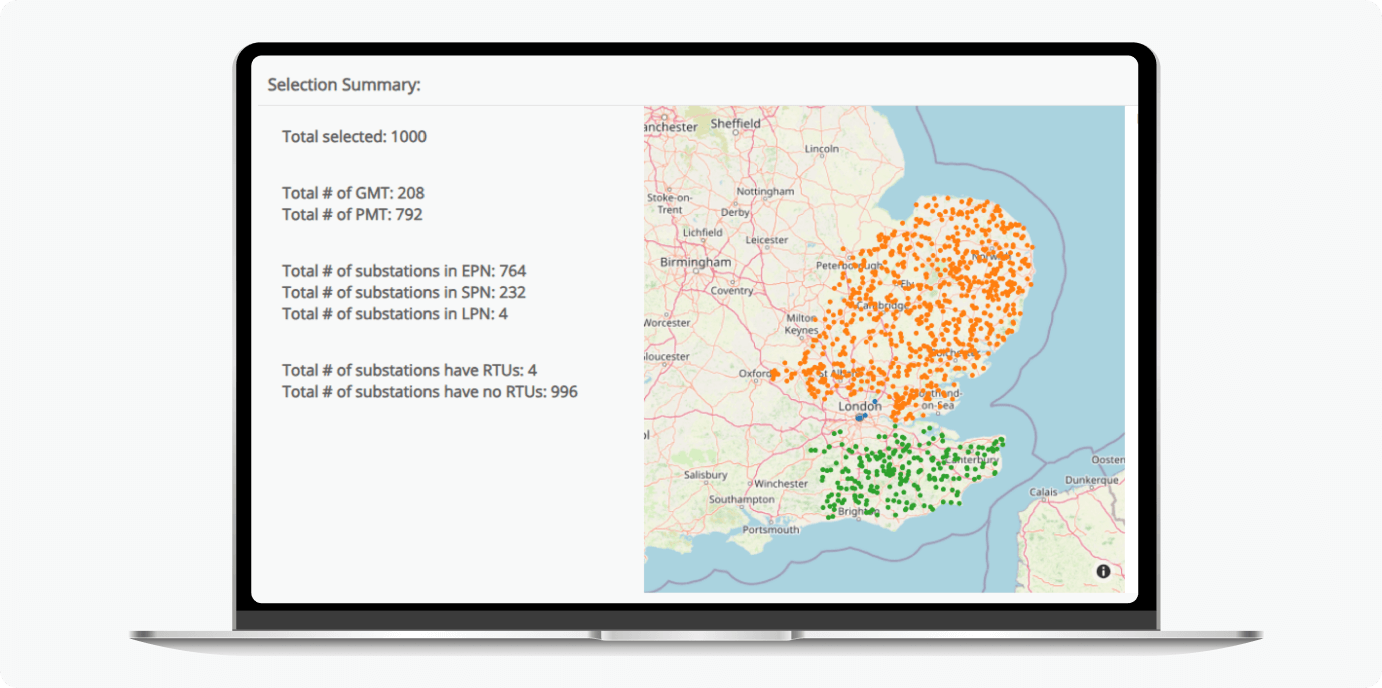
UK Power Networks' data app showing a high-level view of the network of substations, to help evaluate potential network upgrades.
Utilities: public utility organization reduces work order overdue rate by 87%
In a span of one year, a major North American public utility org reduced its overdue rate on thousands of work orders from 90% overdue to 3%, leading to a 10x reduction in customer complaints. This was achieved via a series of data apps focused on analytic applications of smart meter histories and transformer load data.
Healthcare: SICS enables more open sharing of health research with interactive data vault platform
The Singapore Institute for Clinical Sciences (SICS) data science team built a full-service data vault from which researchers could search the cohort data catalogs, read published research, and explore the data through interactive visualizations. The team developed multiple data apps, accessible in the web browser to enable wider access for the research community.
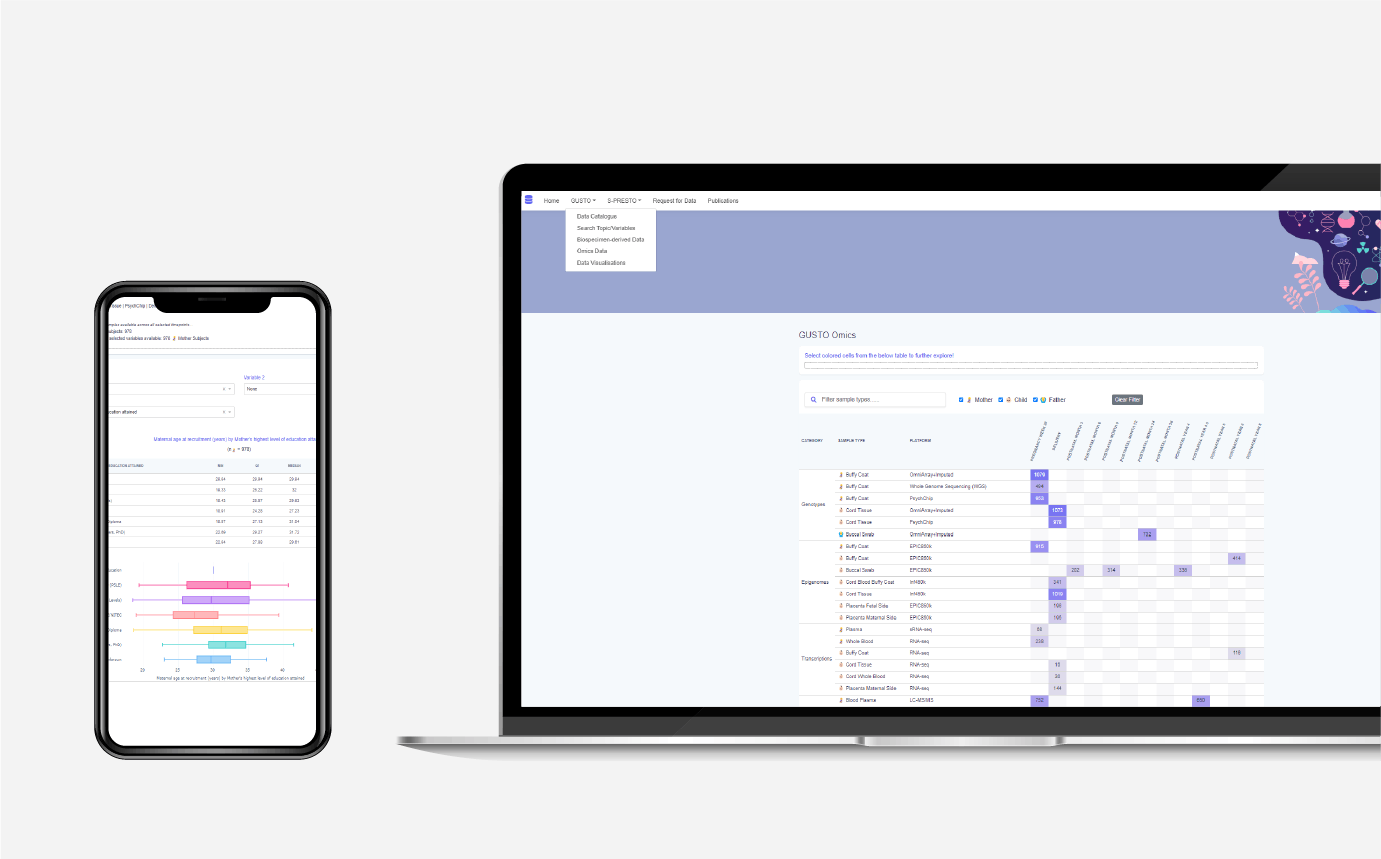
The SICS’ mobile-friendly data app for wider access to medical research.
Manufacturing: Komatsu develops advanced analytics and reporting applications
The Komatsu Surface Mining Analytics team, consisting of data scientists and BI engineers, consistently build custom data applications for multiple customer and internal stakeholder personas, integrating with Snowflake and other data sources. Their use cases include: equipment performance, global fleet mapping, mining shovel vibration analysis, and electric truck payload reporting.
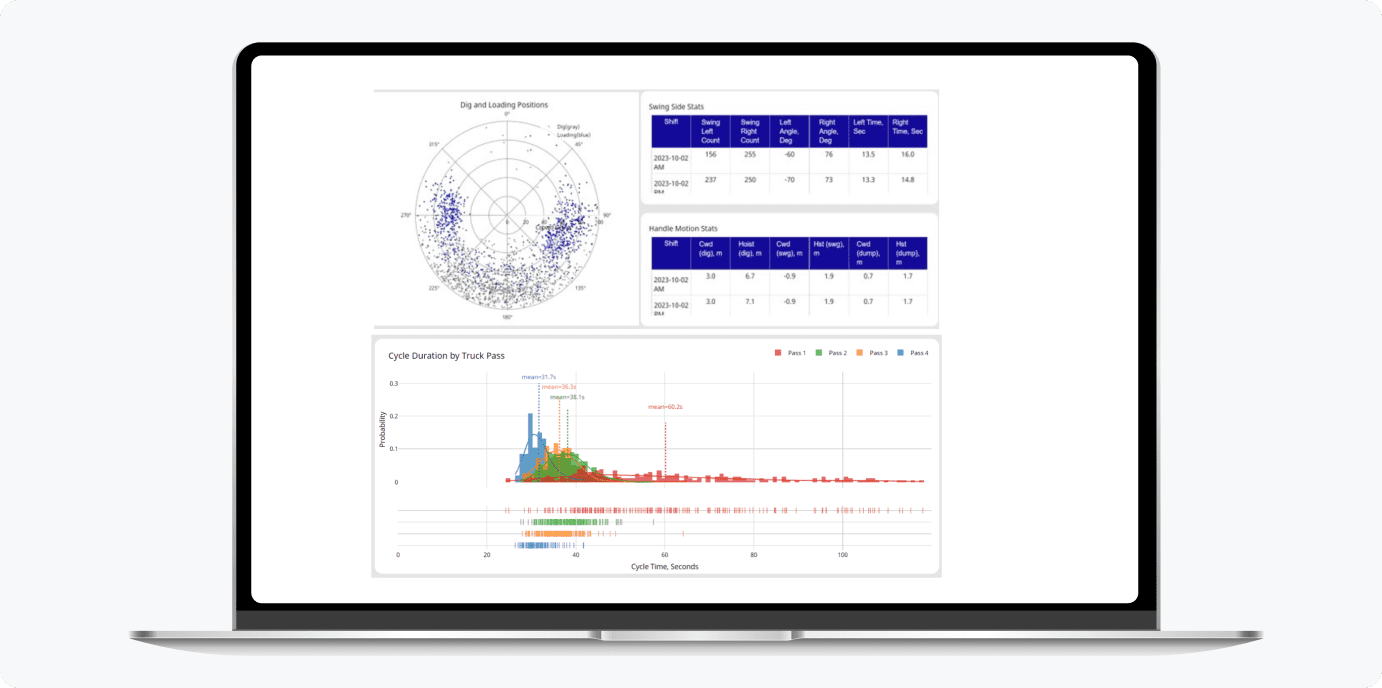
Komatsu’s Advanced Factory Analytics Insights data app shows insights on large mining equipment for premium paying customers as well as internal stakeholders.
Sports: Kansas City Chiefs champion digital transformation in business and operations
Super Bowl champions Kansas City Chiefs use data apps every day to manage their operations more efficiently. The team’s suite of apps share real-time analytics on live data streams related to dynamic ticket pricing, live ticket scanning data, and social media marketing metrics. The team has reduced manual workflows to save 32 person-hours every week.
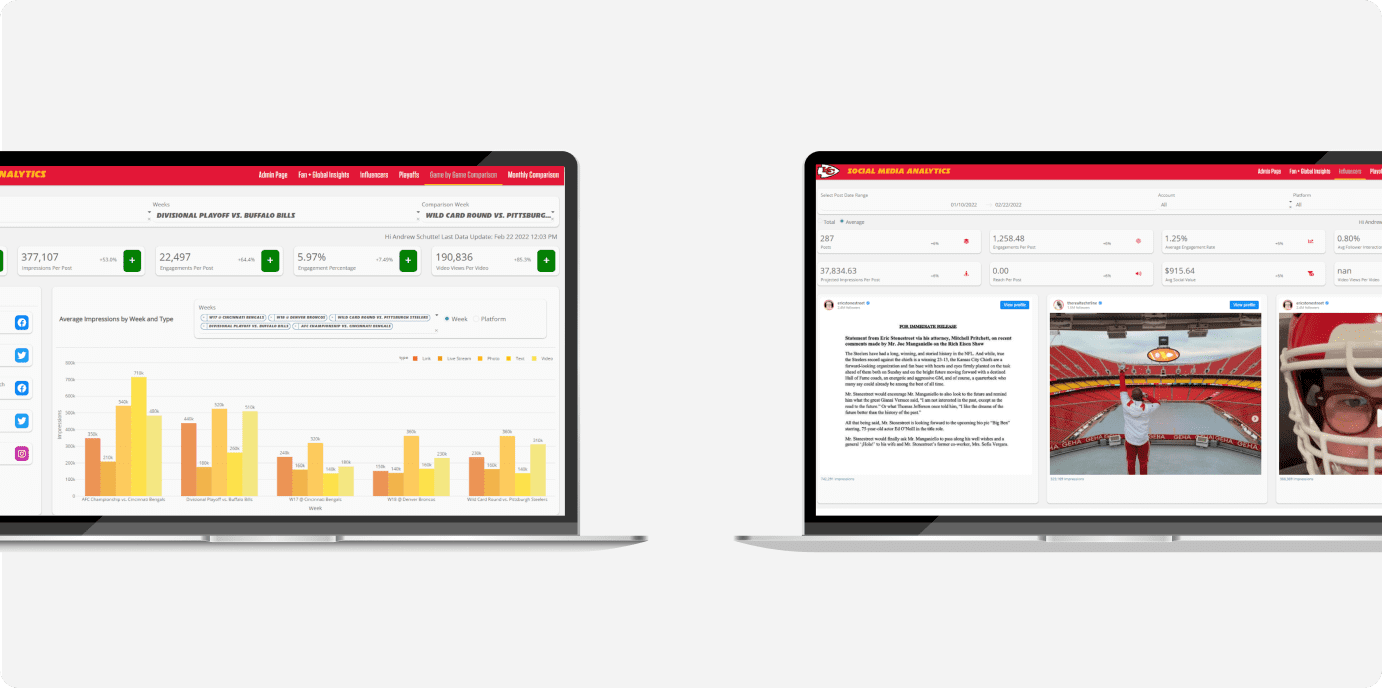
A suite of data apps developed and used by the Kansas City Chiefs data science team.
How to get started with Data Apps
Once you've answered the question, "what is a data app?" you can move towards practical application. Data science teams across multiple industries are quickly moving past basic reporting and rigid BI systems, with the advocacy of data applications. These expert teams deploy custom applications at scale for complex use cases that support better decision-making across the entire organization.
Sophisticated, visually appealing, and production-ready data apps.
Sophisticated, visually appealing, and production-ready data apps seamlessly integrate with your existing tech stack and secure infrastructure. To learn more about data apps in depth, download our free whitepaper on production-grade data apps.