
Plotly
November 19, 2026
8 Financial Dashboard Tools for Finance Teams: A Practical Comparison
TL;DR: Which financial dashboard tool should you choose?
- Plotly: The best overall fit for custom forecasting, pricing, risk, portfolio, and scenario applications built around Python models and finance-specific interactions.
- Microsoft Power BI: A practical default for broad internal reporting in organizations centered on Microsoft 365, Excel, Azure, or Dynamics 365.
- Tableau: Built for flexible visual exploration and polished dashboards where presentation quality matters.
- Looker: Strong when finance, sales, and operations must use the same governed metric definitions.
- Qlik Cloud Analytics: Useful for exploring relationships across several modeled and loaded data sources.
- Domo: Combines ingestion, transformation, dashboards, workflows, and apps in one managed cloud platform.
- Sisense: Designed for software teams embedding branded, multi-tenant analytics in another product.
- ThoughtSpot: Focuses on natural language and search-led exploration over prepared, governed data.
Choosing financial dashboard software starts with the job behind the dashboard. A team producing recurring management reports needs a different platform from one building a pricing model, forecast simulator, portfolio tool, or approval workflow.
Plotly is the strongest overall choice in this comparison for finance teams that need a custom analytical application, not another fixed report. It lets teams put Python models, calculations, user inputs, charts, tables, and workflow logic into one interactive app, then publish it through Plotly Cloud or govern it inside their infrastructure with Dash Enterprise.
That does not make Plotly the automatic answer to every finance requirement. Power BI is usually faster for standardized internal reporting in a Microsoft environment. Tableau is strong in visual exploration and presentation. Looker provides a governed semantic layer, Qlik supports associative exploration, Domo combines cloud data and analytics services, Sisense focuses on embedding, and ThoughtSpot emphasizes natural-language analysis.
This guide compares where each platform fits, what finance gains, what it gives up, and what adoption will require after the demo.
None of these products should be assumed to replace dedicated FP&A, enterprise performance management, consolidation, or close-management software. If finance needs driver-based planning, budget writeback, intercompany eliminations, currency translation, journal controls, or close orchestration, test those workflows explicitly and evaluate specialist software where necessary.
Financial dashboard tools compared
The order prioritizes finance teams that need to move from reporting into custom analytical and decision workflows. It is not a claim that the first product is strongest for every use case.
Rank and platform
Product type
Finance fit
Build and AI model
Deployment and commercial path
Relevant published pricing
Main trade-off to test
1. Plotly
Python visualization and analytical-app ecosystem
Custom models, simulations, scenario tools, pricing, risk, and decision workflows
Dash callbacks and Python code; Plotly Studio for AI-assisted creation; Studio Embedded for viewer-facing AI on Plotly Cloud; Dash MCP for agent access; private LLM support with Dash Enterprise
Dash Enterprise for self-hosted, governed deployment; Plotly Cloud for managed publishing
Dash is free and open source; Dash Enterprise is priced by custom quote; Plotly Cloud has Free, Pro, and Enterprise plans
Requires Python application ownership and is not turnkey FP&A software
2. Power BI
BI and reporting
Standardized internal reporting in a Microsoft environment
Power Query, semantic models, DAX, and Copilot for authoring and analysis; qualifying Fabric capacity and prepared semantic models required
Power BI Service; separate Power BI Report Server path for on-premises reporting
Pro $14/user/month; Premium Per User $24/user/month, paid yearly
Custom finance applications may require Power Apps, Fabric, embedded services, or separate development
3. Tableau
Visual analytics and BI
Visual exploration, variance analysis, and executive presentation
Drag-and-drop authoring; Tableau Agent availability depends on edition
Tableau Cloud or self-managed Tableau Server
Cloud Standard: Creator $75, Explorer $42, Viewer $15/user/month, billed annually
Custom model-driven workflows and writeback require additional development or products
4. Looker
Governed BI and semantic modeling
Shared finance and operating metrics across departments
LookML semantic layer, generated SQL, and Conversational Analytics grounded in the Looker semantic model; answers still require validation
Looker-hosted or customer-hosted variants; Google Cloud-hosted Looker core
Custom quote based on platform and users
LookML and warehouse modeling require technical ownership
Associative BI and analytics
Exploration across modeled data from several systems
Associative engine, load scripts, Qlik Answers across structured and unstructured sources, with cited sources and agentic capabilities
Qlik Cloud SaaS; self-managed options available by quote
Starter $300/month for 10 users and 10 GB; Standard from $825/month for 25 GB
Data reloads, scripting, and capacity design need specialist attention
6. Domo
Cloud data and analytics platform
One managed platform from ingestion through dashboards and apps
Visual and SQL transformation, dashboards, workflows, and AI services
SaaS; Workbench connects data behind the firewall
Custom credit-based consumption pricing with unlimited users
Data movement, transformation, storage, AI, and workflows can all affect credit use
7. Sisense
Embedded analytics platform
Branded analytics inside customer-facing finance or fintech products
Dashboard embedding, APIs, and Compose SDK for code-based experiences
Sisense-managed cloud or self-managed deployment, depending on plan
Custom quote
Deep embedding is a software-development project, not a finance-only rollout
8. ThoughtSpot
Search and AI-assisted analytics
Repeated ad hoc questions over prepared data
Natural-language search, Spotter agents, Liveboards, and modeled data
ThoughtSpot Cloud; confirm availability and parity for self-managed requirements
Essentials from $25/user/month; Pro from $50/user/month, billed annually
Safe answers still depend on modeling, definitions, query allowances, and source-compute design
Prices are public US list prices checked on October 6, 2026. Taxes, regions, capacity, implementation, infrastructure, add-ons, support, and negotiated terms can change the total. A viewer price, a creator license, a data-capacity allowance, and a consumption credit are different billing units and should not be compared as if they buy the same workload.
AI compatibility across the eight financial dashboard tools
AI compatibility is not a yes-or-no feature. Finance teams should distinguish between AI that helps authors build content, AI that lets viewers question governed data, support for external or private models, and agents that can execute analytical functions.
Plotly offers the broadest development model in this comparison. Plotly Studio generates inspectable code and applications, Dash works with any LLM coding agent, Dash MCP exposes application functions to agents, and Dash Enterprise supports private LLM infrastructure. The BI platforms generally concentrate AI inside their existing semantic models, reports, or managed cloud services.
Platform
Native AI capabilities
Model and agent compatibility
Deployment and governance
Main buying check
Plotly Studio supports natural-language analysis, visualization, and code-backed Dash app creation. Plotly Studio Embedded adds viewer-facing conversational analysis to Dash apps published on Plotly Cloud.
Dash can call any Python LLM SDK or orchestration library. Dash MCP can expose approved callbacks and Python functions as agent tools. Plotly Studio can use an organization-selected LLM provider behind the firewall with Dash Enterprise.
Dash Enterprise runs in the organization’s Kubernetes environment and supports private cloud, on-premises, and air-gapped deployment. Plotly Cloud is the managed path.
Private AI still requires the organization to select, operate, and govern an accessible model endpoint.
Copilot assists with report creation, summaries, natural-language questions, DAX, and other Power BI and Fabric tasks.
Copilot uses Microsoft-managed AI services. Wider Fabric services can support custom AI workflows, but they should not be confused with replacing the model behind Power BI Copilot.
Existing Power BI permissions and row-level security influence what Copilot can access. Administrators can restrict availability by security group and workspace.
Copilot requires paid Fabric F2-or-higher or Power BI Premium P1-or-higher capacity. Pro and Premium Per User licenses do not enable it by themselves.
Tableau Agent assists with data preparation, catalog work, web authoring, analysis, and supported dashboard experiences. Tableau Pulse provides AI-assisted metric summaries and explanations.
The native experience is tied to Salesforce and Tableau’s managed AI architecture. Custom extensions can connect other services, but that is a separate development project.
Availability varies across Tableau Cloud editions and the Tableau+ bundle. Some dashboard-agent functionality remains in beta.
Confirm the exact Tableau Agent capabilities included in the quoted edition and deployment. Standard Creator, Explorer, and Viewer prices do not represent the cost of the complete AI offering.
Conversational Analytics lets users question Explores and configured data agents. Advanced Analytics can translate suitable questions into Python for more complex analysis and visualization.
Data agents can be configured with instructions, selected Explores, business context, and verified queries. The native experience uses Gemini rather than an organization-selected LLM.
Looker permissions and content access continue to apply. Administrators must enable Gemini in Looker and Conversational Analytics. Dashboard agents and agentic workflows include preview functionality.
The quality of the semantic model and agent instructions determines answer quality. Google explicitly warns that plausible but incorrect responses remain possible.
Qlik Answers provides an agentic conversational interface across supported structured and unstructured sources. Discovery Agent monitors applications for changes and surfaces AI-generated insights.
Qlik’s native agents use Qlik data products, its analytics engine, knowledge bases, business logic, and supported external information. Qlik also documents MCP access for selected third-party agent workflows.
AI capabilities are centered on Qlik Cloud and vary by subscription, region, capacity, and administrator configuration.
Confirm which Answers, Discovery, Predict, MCP, and generative-AI capacity entitlements are included. The Starter price does not establish the cost of the complete AI offering.
Domo’s Agent Catalyst supports agents that combine instructions, governed data, knowledge, tools, and workflows. Domo also provides AI-assisted analysis and model-management capabilities.
Domo documents external model integrations with providers and platforms including OpenAI, Amazon Bedrock, Databricks, and Hugging Face.
Agents operate inside Domo’s managed cloud data and analytics environment. Governance depends on the datasets, tools, permissions, and actions supplied to each agent.
AI interactions, model use, ingestion, transformation, storage, and workflows can all contribute to credit consumption. Require a workload-based credit forecast.
Sisense Intelligence provides natural-language analysis, generated narratives, assistants, and other AI capabilities for embedded analytical experiences.
Customers can use a Sisense-managed model or supported bring-your-own-LLM configurations. Current documentation covers providers including Azure OpenAI, OpenAI, AWS Bedrock, and additional supported integrations.
Generative AI features are disabled by default and require administrator opt-in. Sisense supports managed and customer-controlled deployment options depending on the plan.
Confirm which AI features support the selected model and deployment. Some capabilities, including particular narrative features, can have separate licensing requirements.
Spotter provides natural-language exploration over modeled business data, with related agents for specialized analytical tasks.
The native experience operates over ThoughtSpot models and connected data. Embedding, Analyst Studio, MCP, and expanded agent functionality vary by commercial plan.
Source permissions and ThoughtSpot access rules still apply. Direct connections keep queries close to supported cloud data platforms but do not remove modeling or source-compute requirements.
“Unlimited LLM tokens” does not mean unlimited Spotter use. The Pro plan lists 25 Spotter queries per user per month, while consumption-priced deployments can also charge credits for Spotter interaction.
What the comparison means for finance teams
Choose the AI model according to the work it must perform:
- Choose Plotly when AI must help build or operate a custom financial application, use proprietary Python calculations, call approved application functions, or run against a private model behind the organization’s firewall.
- Choose Power BI or Tableau when AI should accelerate authoring and explain information inside an established BI environment.
- Choose Looker when conversational analysis should inherit centrally maintained metric definitions and verified semantic context.
- Choose Qlik when conversational and proactive agents should work across Qlik’s governed analytics and knowledge environment.
- Choose Domo when agents need to connect analytics with data preparation, tools, and operational workflows in one managed platform.
- Choose Sisense when AI-powered analytics must be embedded inside another customer-facing product and model-provider flexibility matters.
- Choose ThoughtSpot when business users primarily need natural-language exploration over prepared and governed analytical data.
For custom finance workflows, Plotly has the strongest overall AI path because it covers more than conversational querying. Teams can use AI to generate inspectable application code, integrate any Python-compatible model, expose controlled application functions to agents, publish viewer-facing AI through Plotly Cloud, or run Plotly Studio against private LLM infrastructure with Dash Enterprise.
The caveat is important: Plotly provides more flexibility because the team is building software. It therefore requires stronger ownership of application architecture, model evaluation, permissions, testing, and production support.
The product constraints above are current and material. Power BI Copilot requires qualifying capacity; Looker’s advanced and dashboard-agent capabilities require specific enablement; and Sisense’s generative features require administrative opt-in.
The eight best financial dashboard tools
1. Plotly
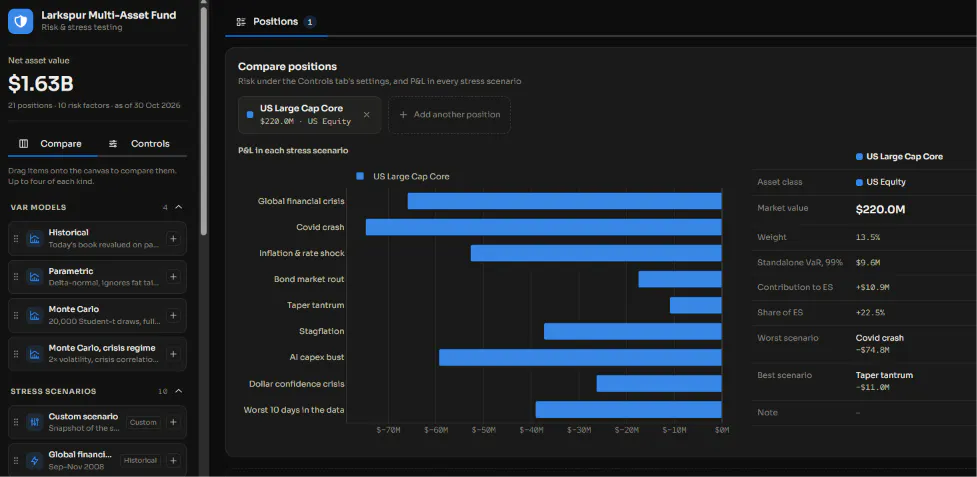
Plotly is an ecosystem for building and deploying data applications. Plotly.py creates interactive visualizations in Python. Dash turns those visualizations into applications with controls, tables, calculations, and state. Plotly Studio provides an AI-assisted route to code-backed analysis and app creation. Plotly Cloud publishes Dash apps as a managed service, while Dash Enterprise deploys and operates analytical apps inside an organization’s infrastructure.
That range is why Plotly ranks first here. Most tools in this list are optimized for reporting, visual exploration, semantic modeling, search, or embedding. Plotly is the stronger choice when finance needs to turn a proprietary model or decision process into software that people can use.
Finance fit: Quantitative models, forecasting, budget scenarios, pricing, portfolio analysis, risk, capital allocation, and workflows where users must change assumptions and receive a recalculated result.
What makes it different
- Finance teams can use existing Python packages and models instead of translating the logic into a proprietary calculation language.
- Dash callbacks connect charts, grids, controls, uploaded files, calculations, and application state. A user can change a growth rate, cost assumption, or risk threshold and see every dependent output update through controlled Python logic.
- Plotly supports conventional finance charts as well as specialized statistical, scientific, geospatial, and 3D views. The same application can combine a P&L bridge, scenario table, forecast distribution, and model diagnostics.
- Plotly Studio can generate and refine code-backed analyses and Dash apps from data and natural-language instructions. The generated application can be exported and run on Dash Enterprise or Plotly Cloud.
- Dash is compatible with ordinary Python model and LLM SDKs. Teams can add an assistant or agent when it improves a defined workflow rather than being limited to a preconfigured BI assistant.
- For Dash applications published on Plotly Cloud, Plotly Studio Embedded can add a viewer-facing AI chatbot without requiring the team to build the conversational layer from scratch. Viewers can ask natural-language questions about registered application data and generate supporting charts and insights.
How the production path works
Dash Open Source does not add hosting, viewer authentication, or an approval process automatically. Plotly Cloud is the managed route for publishing and sharing Dash apps. Dash Enterprise is the self-hosted route for organizations that need more control over their app deployments, data, compute, identity, and operations.
Dash Enterprise App Manager provides a portal for deploying and managing apps, including separate development, testing, and production environments. Its authentication layer integrates with identity systems using protocols such as SAML, OIDC, and LDAP. Snapshot Engine can save point-in-time application states and generate PDF reports, which is useful when finance needs a reviewable record of the assumptions and output presented at a specific moment.
These controls help with application governance. Dash Enterprise can run in private cloud, on premises, and internet-restricted or air-gapped Kubernetes environments. Plotly Studio can also use the organization’s selected LLM provider behind the firewall, supporting AI-assisted development without requiring code or sensitive data to leave the organization’s security perimeter. Finance still needs data lineage, tests, approvals, dependency management, release controls, and ownership of the model.
Where Plotly is stronger
Power BI and Tableau offer broader point-and-click reporting features. If the requirement is to build a standardized monthly dashboard quickly, either may take less engineering. If the requirement is to expose a proprietary Python model, accept application-specific inputs, run simulations, or guide a user through a decision workflow, Plotly is the better solution because the interface and calculation path are not limited to a BI report model.
The distinction is visible in financial services. CIBC Capital Markets uses Dash Enterprise to deliver quantitative analytics and machine-learning applications to sales and trading teams. The apps use Databricks and other internal sources while supporting custom security and authentication requirements.
Pricing: Dash and Plotly.py are free under the MIT license. Plotly’s pricing page lists a Free Plotly Cloud plan, Pro at $290 per Creator per year, and custom Enterprise pricing. Dash Enterprise uses a custom quote.
Decision: Put Plotly first on the shortlist when finance needs an analytical application rather than a fixed dashboard. Use one demanding workflow in the proof of concept: the model with the most important assumptions, the strictest data access, and the most complex output.
2. Microsoft Power BI
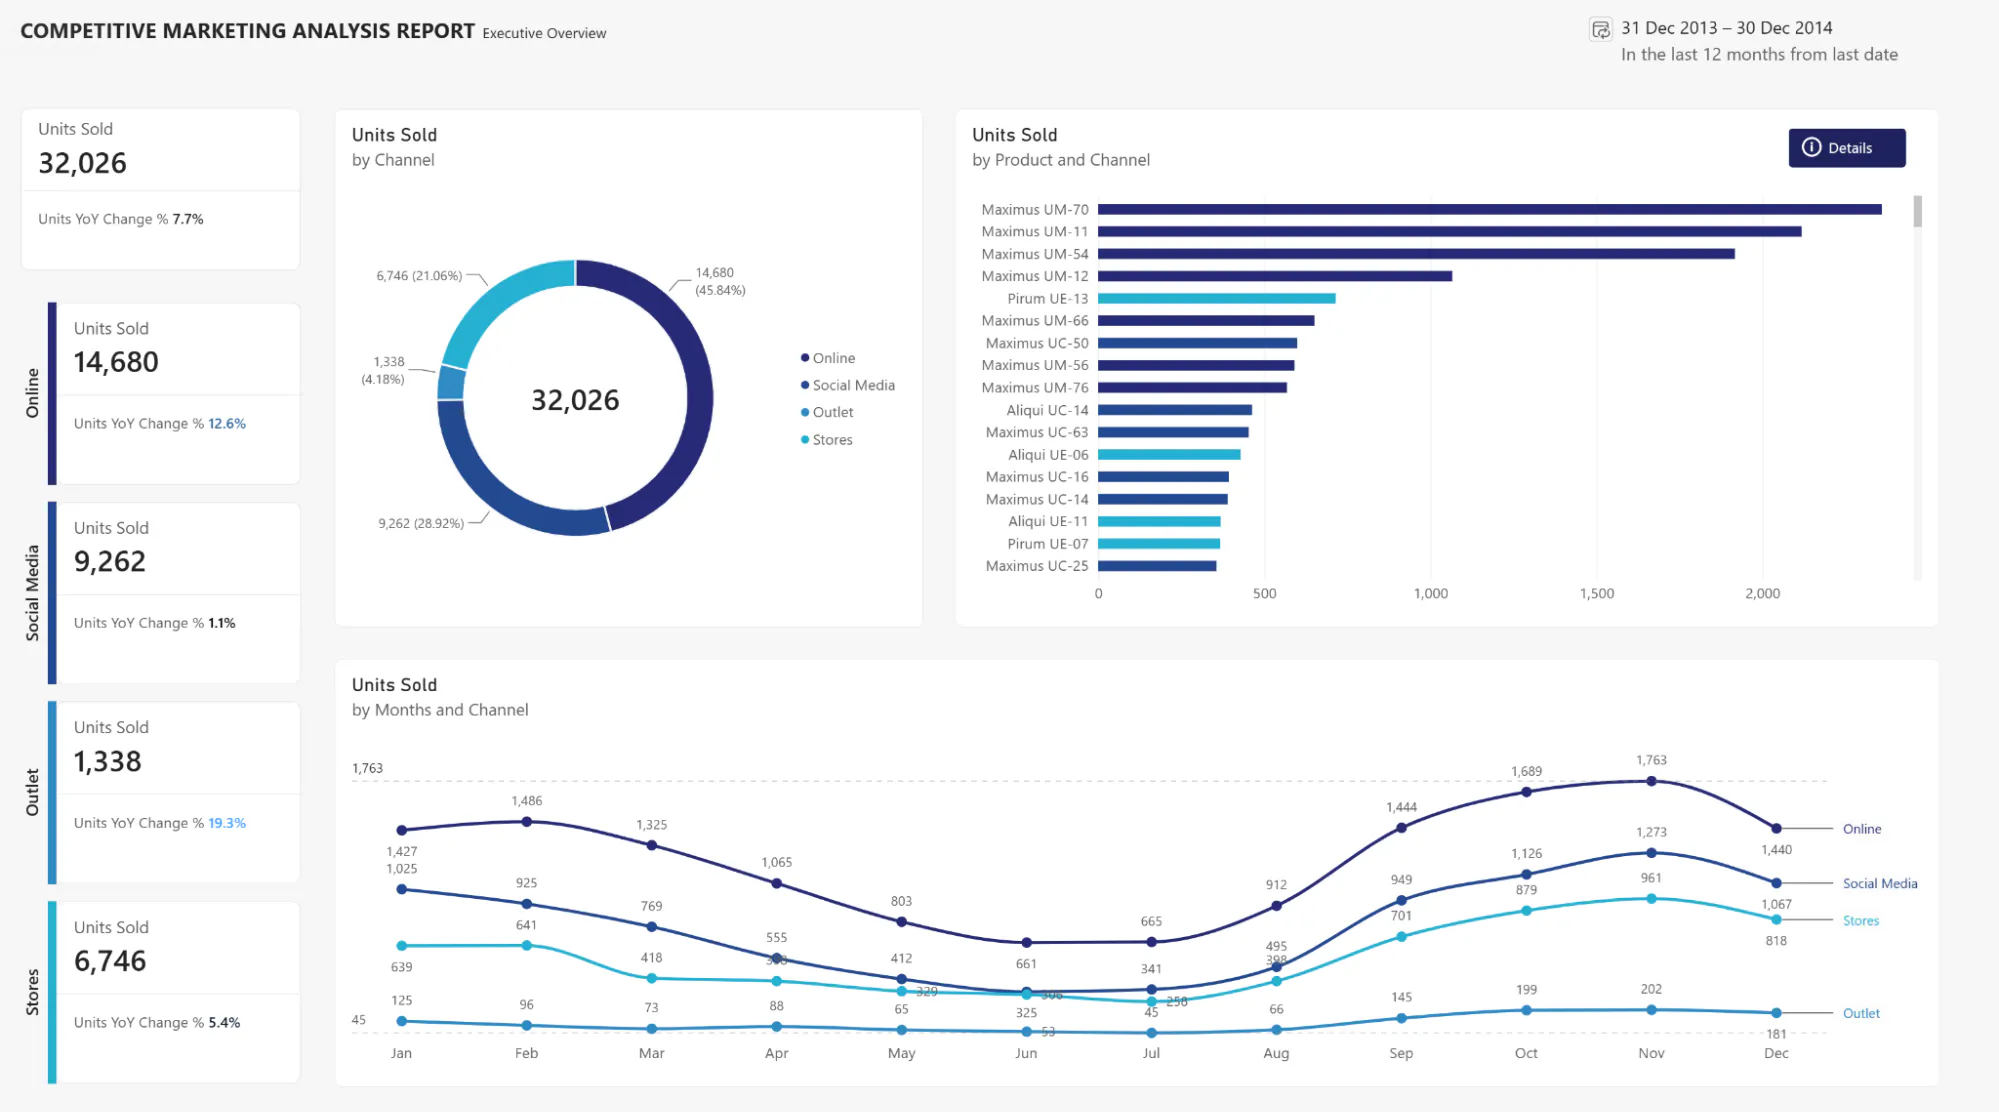
Microsoft Power BI combines data preparation, semantic models, DAX calculations, and interactive reports. Its position inside the Microsoft ecosystem makes it a common default for internal finance reporting.
Finance fit: Recurring management reporting, variance analysis, operational KPIs, and broad internal distribution where finance already depends on Excel, Microsoft 365, Azure, or Dynamics 365.
Why finance teams choose it
- Power Query and semantic models give teams a controlled layer between source systems and reports.
- DAX supports reusable measures, time-based comparisons, and finance calculations.
- Excel, Teams, SharePoint, Dynamics 365, Azure, Fabric, and Power BI sit within the same vendor ecosystem.
- Copilot can assist with parts of the authoring and analysis workflow when the organization has qualifying Fabric capacity, supported configuration, and prepared semantic models.
- Power BI Service supports cloud sharing, while Power BI Report Server provides a separate on-premises reporting path.
Where it falls short
Power BI is strong at standardized BI, but a bespoke planning or decision application can spread across DAX, Power Query, Power Apps, Fabric workloads, embedded services, or custom components. That may be appropriate in a Microsoft-centered architecture, but it is a different development model from keeping the calculation and interaction logic in Python.
Copilot does not remove semantic-model work. Microsoft warns users to prepare data and models so Copilot can generate useful output. Finance should test whether Copilot is enabled for the proposed capacity, region, tenant, and data architecture rather than assuming that a Pro or Premium Per User license unlocks the entire AI experience.
Adoption effort
Excel users may find the ecosystem familiar, but production ownership still requires Power Query, DAX, data modeling, security, refresh, and capacity expertise. A move from a custom Python application to Power BI usually means translating calculations into DAX or running them in an external service. A move from Power BI to Plotly means rebuilding the report as an application and recreating its metric, permission, and distribution rules.
Pricing: Microsoft’s US pricing page lists Power BI Pro at $14 per user per month and Premium Per User at $24, paid yearly. Report consumption without individual paid licenses applies only under qualifying capacity conditions; content publishers still need appropriate licenses.
Decision: Power BI is the more efficient choice for standardized internal reporting in a Microsoft organization. Plotly is the stronger choice when Python models, specialized controls, or a custom workflow define the finished product.
3. Tableau
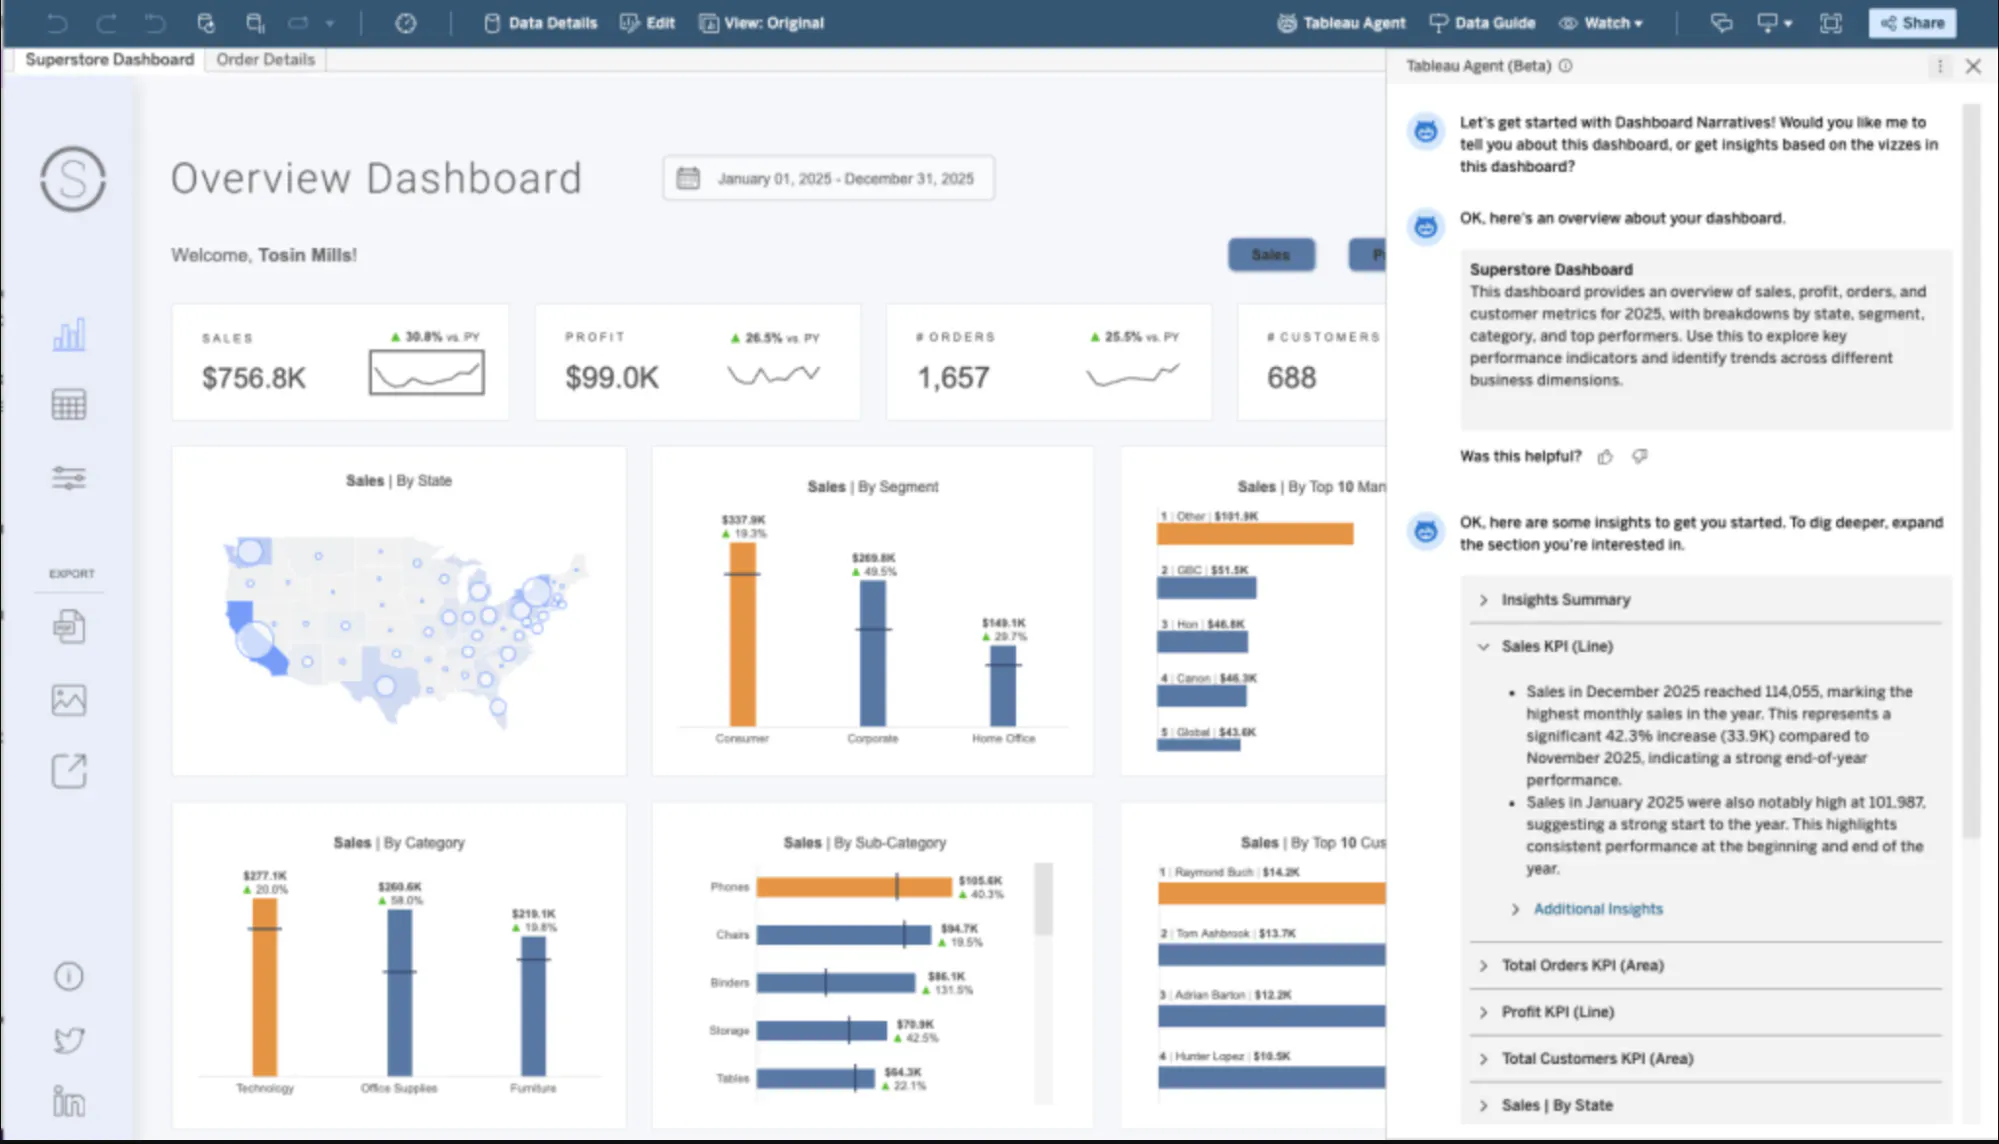
Tableau is a visual analytics platform from Salesforce. Tableau Desktop supports exploratory authoring on Windows and macOS, while Tableau Cloud and Tableau Server provide governed distribution.
Finance fit: Variance exploration, executive dashboards, board-ready visual communication, and self-service analysis where visual flexibility matters more than custom application logic.
Why finance teams choose it
- Drag-and-drop authoring helps analysts investigate patterns and construct polished views without writing a web application.
- Tableau’s visual grammar supports flexible slicing, filtering, drill-down, calculations, and dashboard composition.
- Tableau Pulse can distribute metric updates and highlight changes in Tableau Cloud.
- Teams can choose Tableau Cloud or operate Tableau Server themselves.
- Newer agentic capabilities are available through Tableau Cloud+ and the Tableau+ bundle, rather than being included uniformly across every Tableau deployment.
Where it falls short
Tableau can be extended and embedded, but a model-driven finance application with complex Python calculations, writeback, state, custom screens, or a guided approval process is not its native center of gravity. Those requirements may introduce extensions, external services, Salesforce products, or custom development.
Permissions also require more than assigning a license. Effective access depends on the site role, content permissions, and edition configuration. Finance should test controller, analyst, budget owner, executive, and external-user roles using representative content.
Adoption effort
Moving to Tableau requires rebuilding calculations, data sources, extracts, parameters, permissions, alerts, and scheduled outputs. The work is lighter when the source model is already governed and the requirement is visual analysis. It is heavier when a current system includes writeback or workflow outside the dashboard.
Pricing: Tableau Cloud Standard lists Creator at $75, Explorer at $42, and Viewer at $15 per user per month, billed annually. Every deployment requires at least one Creator. Enterprise Edition costs more, and Cloud+ and Tableau+ use custom pricing.
Decision: Tableau belongs high on the list when finance needs flexible visual analysis and strong presentation. Plotly is the better fit when the output must behave like custom software around a finance model.
4. Looker
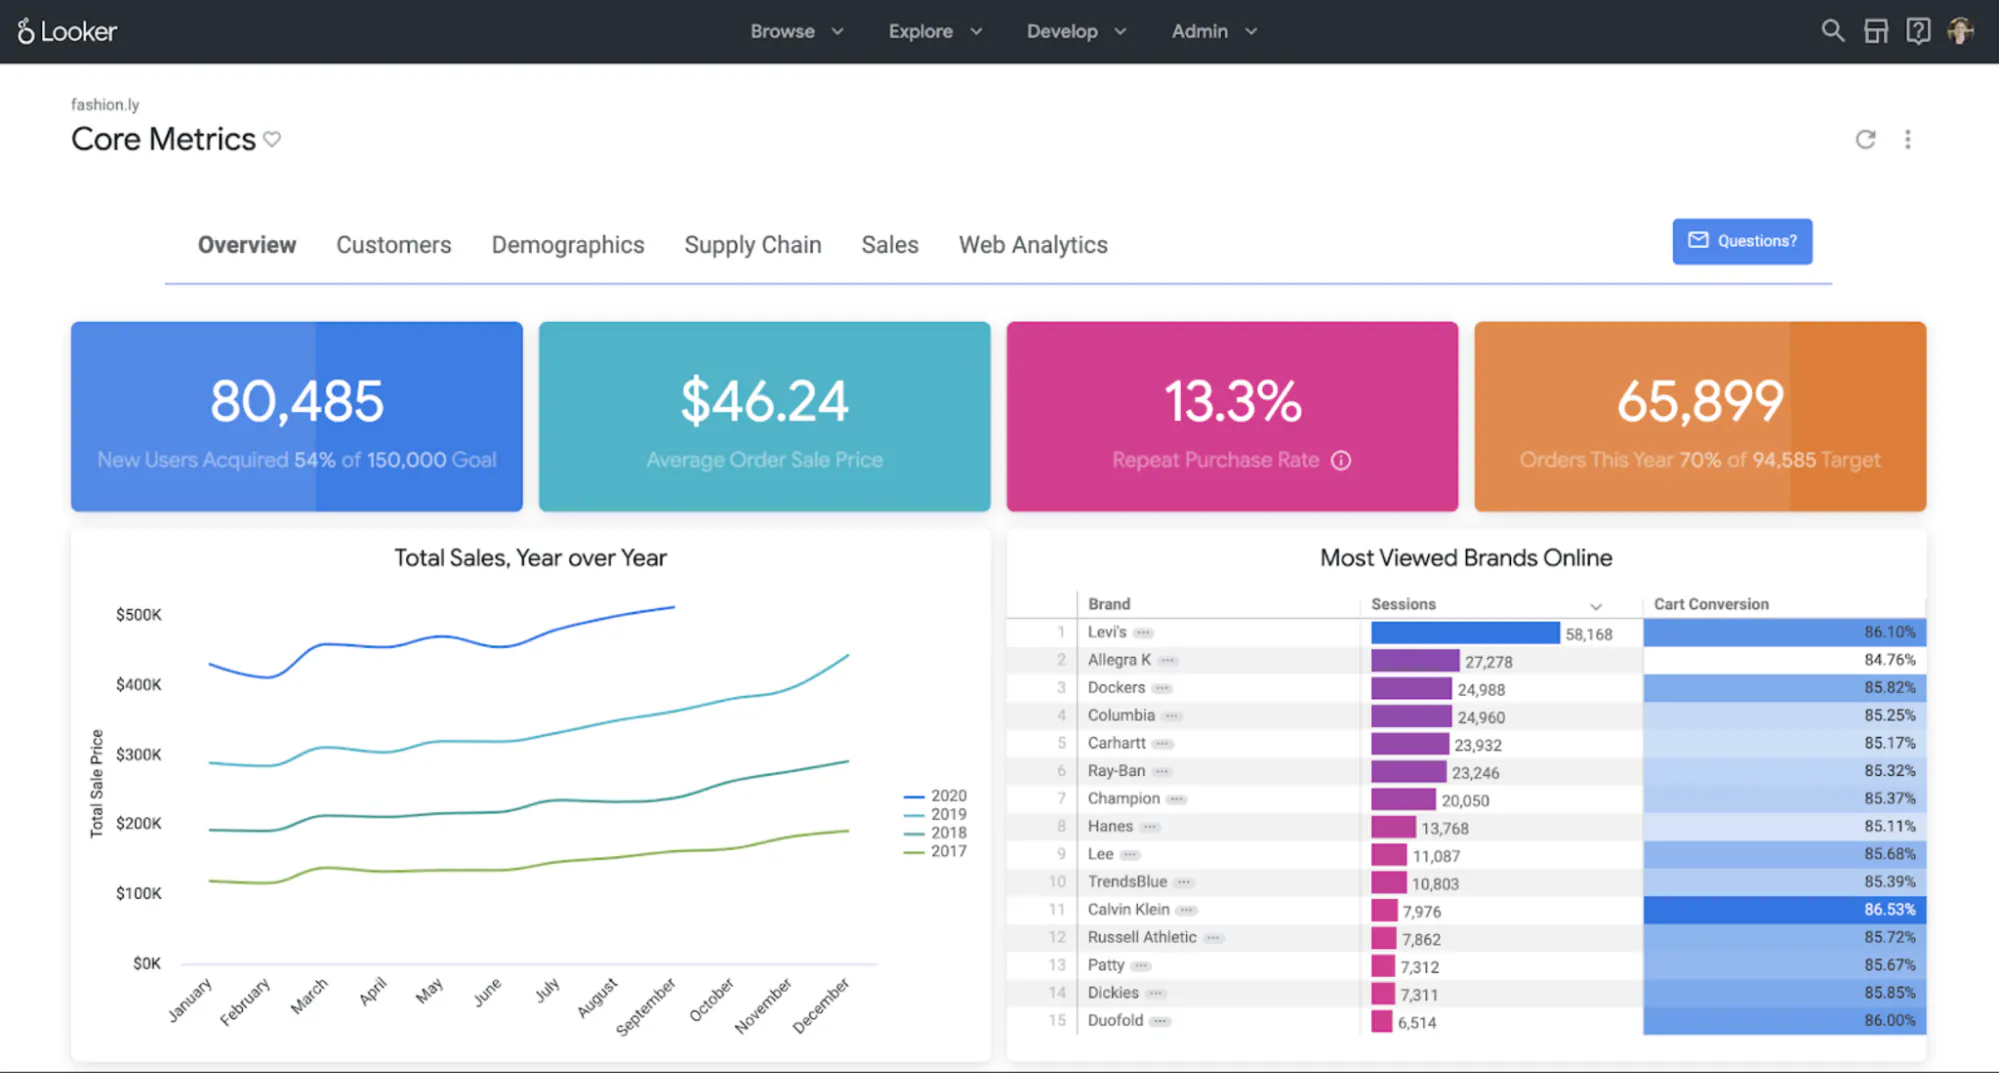
Looker is Google’s BI and semantic-modeling platform. Its main differentiator is LookML, a language for defining dimensions, measures, calculations, relationships, and governed business logic that Looker uses to generate SQL.
Finance fit: Organizations that need one controlled definition of revenue, gross margin, bookings, customer lifetime value, or another cross-functional metric.
Why finance teams choose it
- A central LookML model can reduce metric drift between finance, sales, and operations.
- LookML projects support Git-based development, review, testing, and reuse.
- Looker works with major SQL databases and cloud warehouses, including BigQuery, Snowflake, Redshift, and Databricks.
- Conversational Analytics uses the semantic layer as context instead of asking the model to infer definitions from raw tables.
Where it falls short
Semantic governance does not remove the need for careful modeling. The data team must understand SQL, joins, grain, fan-out, caching, and warehouse performance. Finance must still define and approve the business logic.
Looker’s AI features can produce incorrect answers, even when they are grounded in a semantic model. Use controlled rollout, reference questions, and validation for material finance decisions.
Adoption effort
Looker works best when a data team owns LookML and finance owns definition and acceptance testing. A migration involves more than reproducing tiles: metrics, joins, permissions, cache policies, scheduled deliveries, and user Explores all need to be rebuilt. A custom Python model may remain external or be exposed through a separate application.
Pricing: Google describes Looker pricing as a platform subscription plus user licenses. Standard, Enterprise, and Embed editions require a sales quote.
Decision: Choose Looker when semantic consistency across departments is the main requirement. Choose Plotly when finance needs to interact directly with custom Python calculations or application-specific processes.
5. Qlik Cloud Analytics
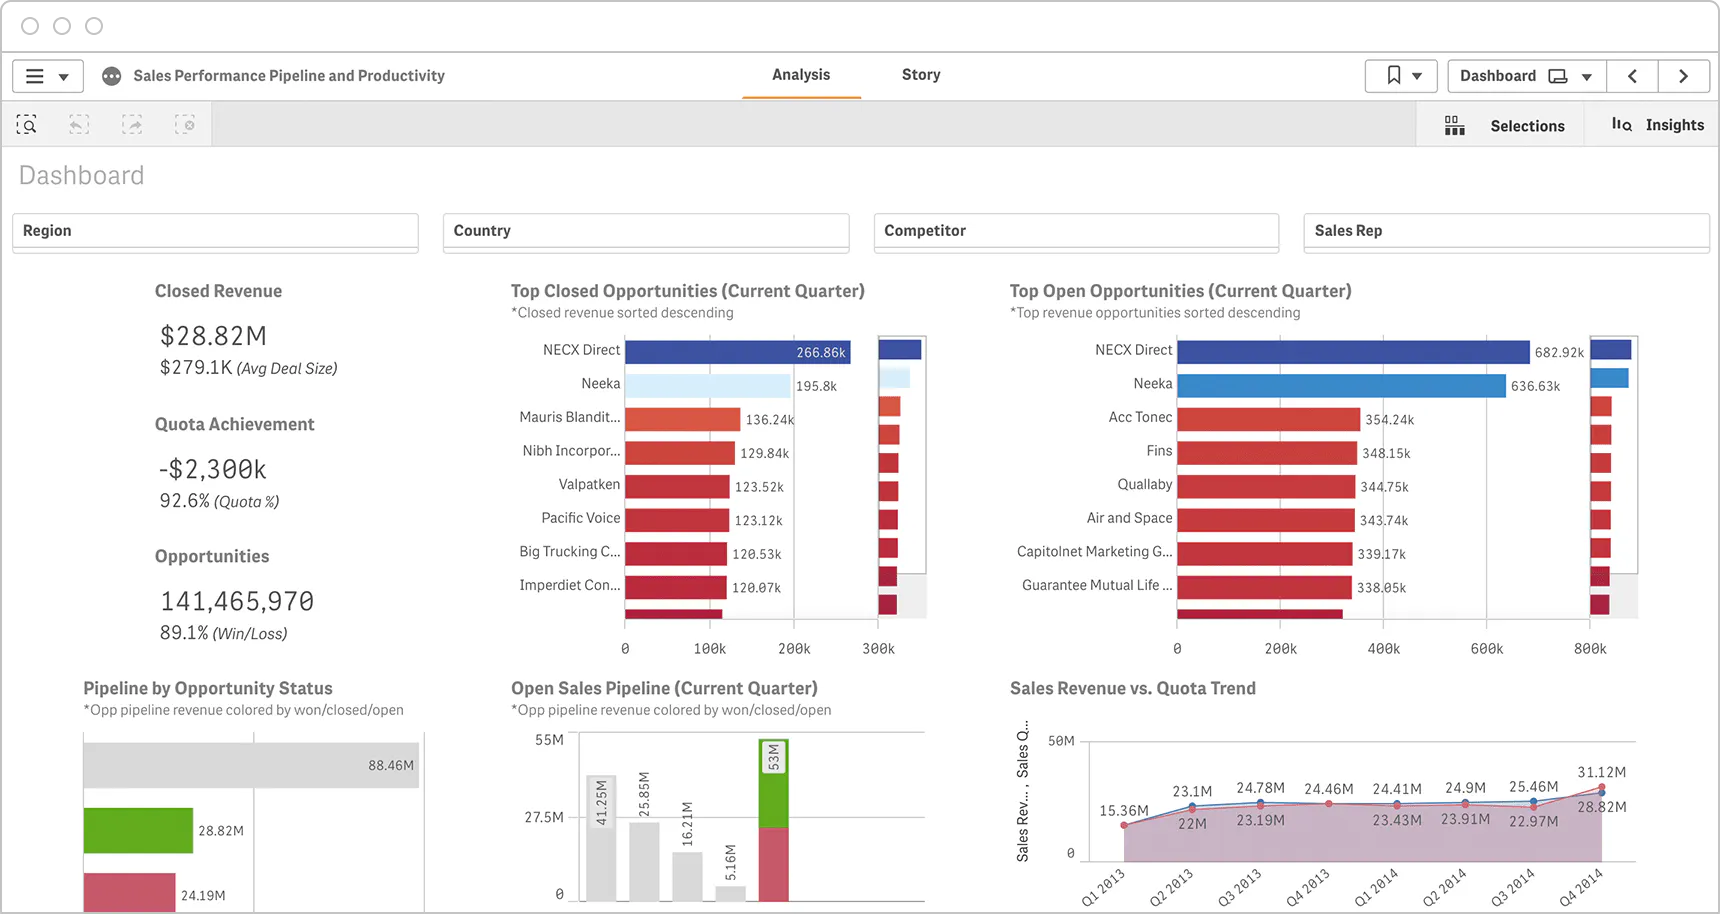
Qlik Cloud Analytics uses an associative engine that keeps selected, possible, alternative, and excluded values visible during exploration. This helps users investigate relationships across data that has been modeled and loaded into Qlik.
Finance fit: Exploratory analysis across ERP, CRM, warehouse, and file data where analysts need to follow relationships that a fixed drill path may hide.
Why finance teams choose it
- The associative model supports a distinctive way of exploring related and excluded values.
- Qlik load scripts and QVD files can create reusable transformation and data layers.
- Qlik Cloud includes dashboarding, reporting, automation, and AI features, with capabilities varying by tier.
- Cloud and self-managed deployment paths are available.
Where it falls short
An excluded value is not an accounting exception. The associative engine does not automatically perform consolidation, intercompany elimination, currency translation, or reconciliation. Those processes still need a controlled system of record.
The platform also introduces Qlik-specific modeling and scripting. Reload schedules, data capacity, app size, and script ownership affect the production design.
Adoption effort
Teams moving to Qlik rebuild the data model, load scripts, measures, visualizations, access rules, and reload operations. Simple data combinations may be accessible to analysts, while complex transformations require Qlik expertise.
Pricing: Qlik’s current pricing lists Starter at $300 per month for 10 users and a fixed 10 GB of data, Standard from $825 per month for 25 GB, and Premium from $2,750 per month for 50 GB, billed annually. Starter allows additional users but not additional data capacity; Standard and Premium use expandable data-capacity models.
Decision: Qlik is compelling when associative exploration matches how the finance team investigates cross-system data. Plotly is stronger when the interaction must execute custom Python logic or guide the user through a defined decision.
6. Domo
Source: https://www.domo.com/
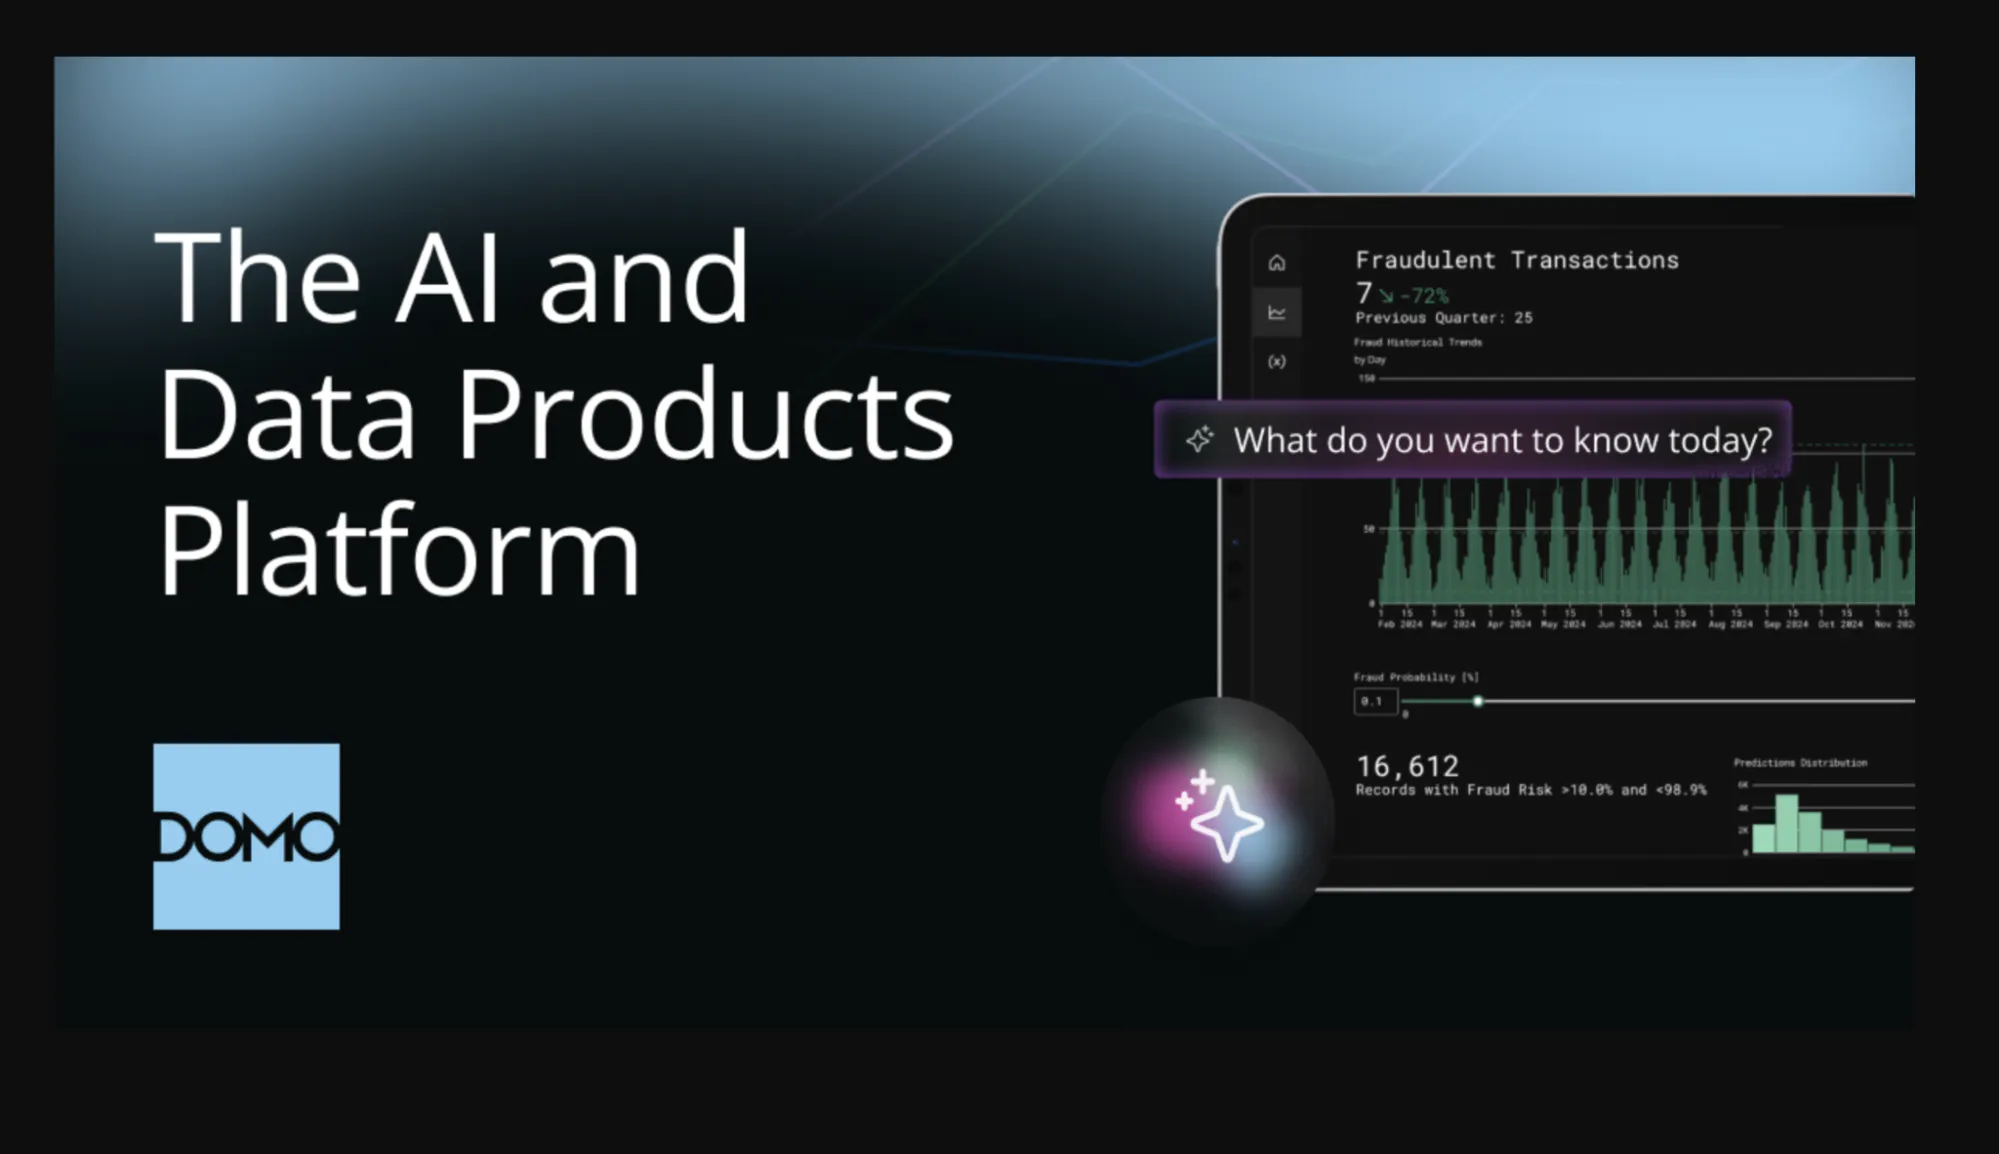
Domo is a managed cloud platform that combines connectors, data preparation, dashboards, alerts, workflows, and app development. Its differentiator is breadth within one service rather than one finance-specific analytical feature.
Finance fit: Teams that want to consolidate cloud data movement, transformation, BI, distribution, and lightweight applications on one managed platform.
Why finance teams choose it
- A broad connector ecosystem supports cloud applications, databases, files, and systems behind the firewall.
- Magic ETL provides visual, repeatable transformation workflows, while SQL DataFlows serve technical users.
- Dashboards, alerts, workflows, and apps run on the same platform.
- Consumption pricing permits unlimited users instead of charging for every seat.
Where it falls short
Domo is a managed cloud platform. Workbench can move data from on-premises systems, but it does not turn Domo itself into a customer-managed, on-premises product.
Its credit model also needs workload modeling. Ingestion, transformation outputs, storage, AI interactions, and workflow activity may consume credits differently. Unlimited users do not mean unlimited platform use.
Adoption effort
Migration includes source connections, transformations, datasets, cards, dashboards, workflows, permissions, and credit monitoring. Teams should decide which work Domo should own and which should remain in an existing warehouse or finance system.
Pricing: Domo publishes a credit-based consumption model with unlimited users but does not publish a starting dollar amount. Request a workload-based quote rather than comparing it with a per-user BI price.
Decision: Domo is attractive when platform consolidation is the priority. Plotly is the better choice when a proprietary model or highly customized analytical workflow matters more than bringing ingestion and dashboarding into one commercial service.
7. Sisense
Sisense focuses on embedded analytics. A bank, fintech company, or software team can place charts, dashboards, and analytical interactions inside an existing customer-facing product.
Finance fit: Embedded analytics for finance and fintech products where branding, tenant isolation, APIs, and application integration are core requirements.
Why product teams choose it
- Compose SDK supports TypeScript and frameworks including React, Angular, and Vue.
- Teams can embed an existing dashboard, customize one, or compose analytical elements in code.
- White labeling and several multi-tenant architectures are documented.
- Cloud and self-managed deployment models are available for Enterprise requirements.
Where it falls short
Deep embedding is a development program. The team must design authentication, tenant isolation, front-end behavior, telemetry, release management, and product support. A finance department that only needs internal dashboards may pay for capabilities it does not need.
Adoption effort
The shift involves data models, dashboards, APIs, SDK components, security, tenancy, and the host application’s design system. Self-managed deployment also transfers infrastructure and upgrade responsibilities to the customer.
Pricing: Sisense does not publish Enterprise pricing. Compare quotes using the exact deployment model, tenants, environments, support, white labeling, AI requirements, and expected usage.
Decision: Sisense deserves a shortlist when analytics is a feature inside another product. Plotly is stronger for finance teams that want data scientists or quantitative analysts to own the application in Python rather than rely on a JavaScript-heavy embedded analytics stack.
8. ThoughtSpot
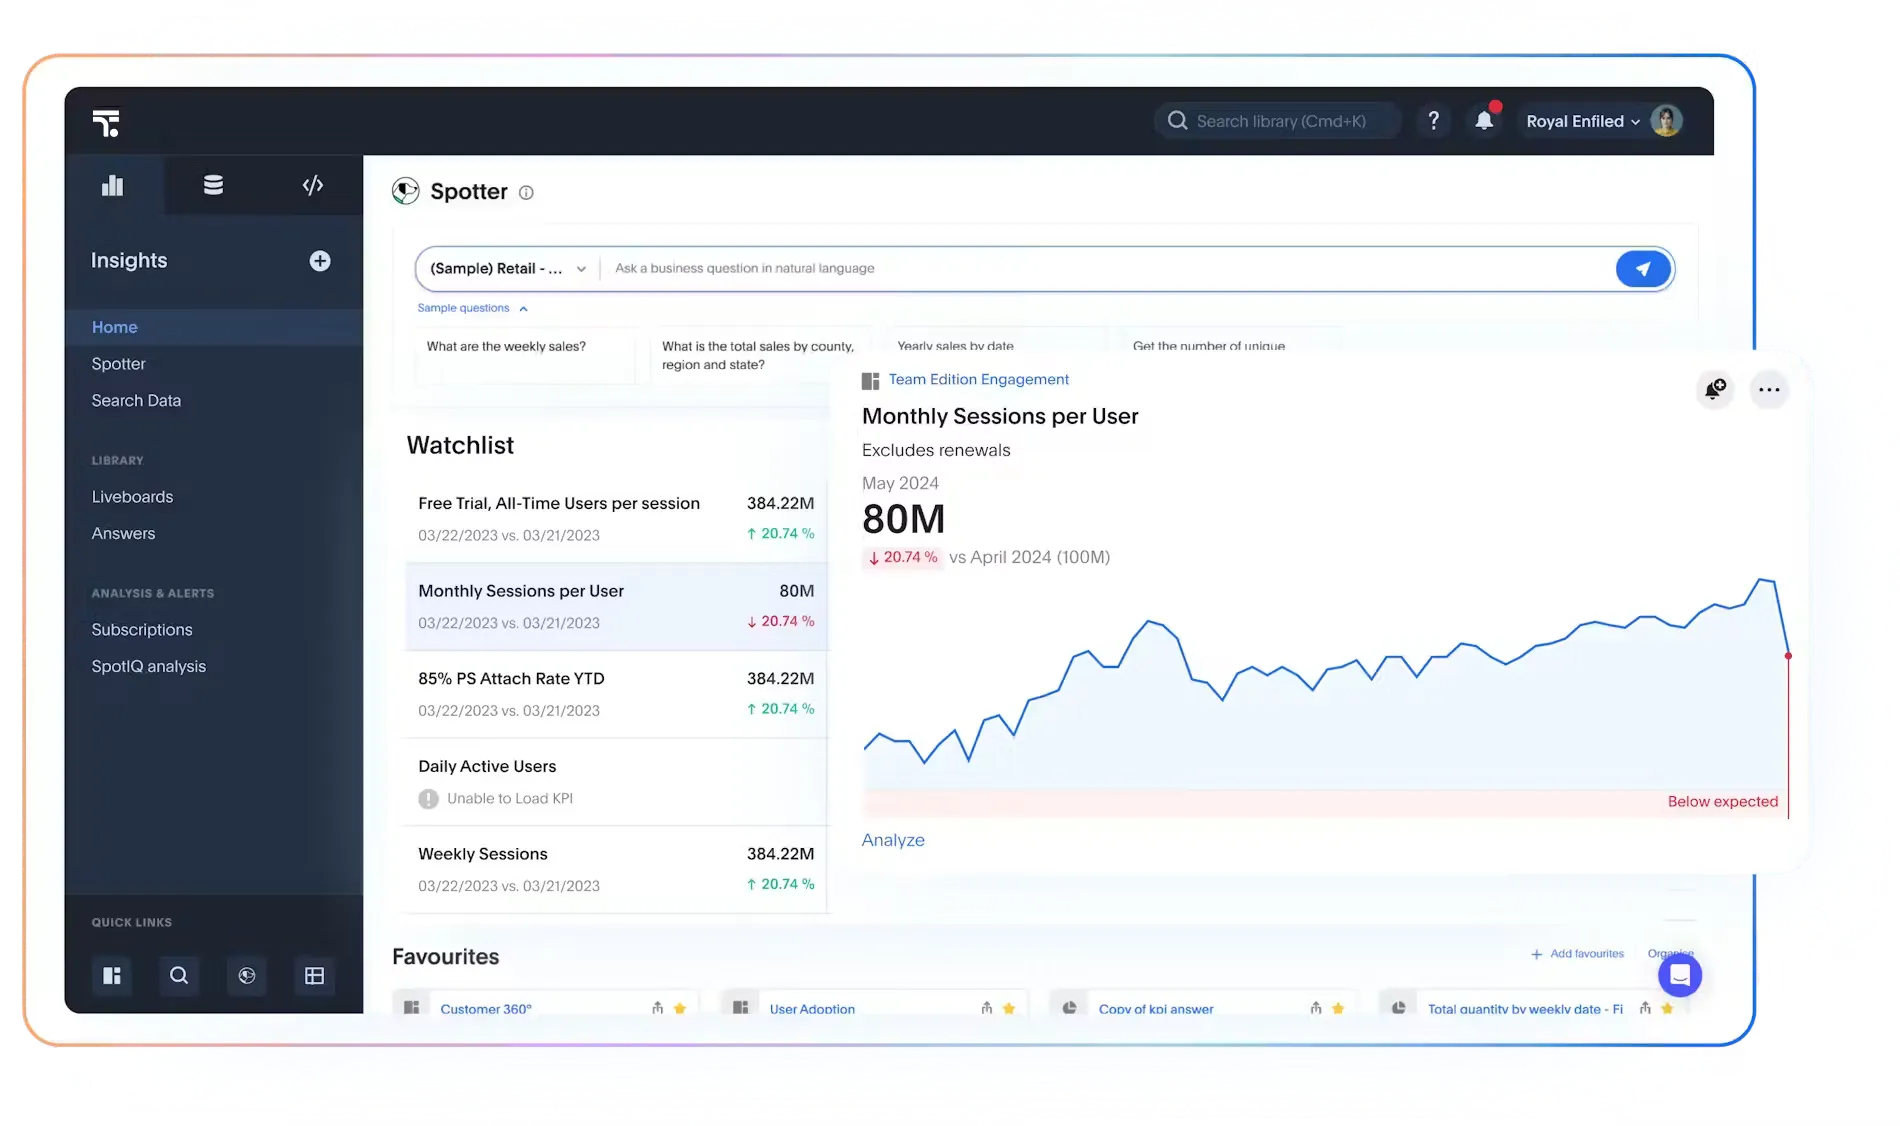
ThoughtSpot emphasizes search and AI-assisted analytics. Users can ask natural-language questions, create answers and Liveboards, and query supported cloud data platforms through direct connections.
Finance fit: Business users who repeatedly ask ad hoc questions that can be answered safely from a prepared and governed data model.
Why finance teams choose it
- Spotter provides a conversational route to follow-up analysis.
- The platform combines natural-language search, dashboards, automated insights, and monitoring features.
- Direct connections can query supported platforms such as Snowflake, BigQuery, Databricks, and Redshift without copying all analytical data into ThoughtSpot.
- Reference questions and coaching features let teams guide how Spotter interprets recurring questions.
Where it falls short
Natural language does not remove data preparation. A poorly modeled general ledger or ambiguous finance term remains unsafe, regardless of the interface. ThoughtSpot’s documentation also notes that direct connections do not support joins across connections and that some features are unavailable in that mode.
Pricing language requires care. ThoughtSpot says it does not meter or charge for LLM tokens, but plans can still govern platform use through users, rows, credits, or Spotter query allowances. “Unlimited tokens” should not be read as unlimited use of every feature.
Adoption effort
Teams must prepare models, synonyms, permissions, joins, reference questions, and validation rules. Finance should test ambiguous wording, fiscal calendars, sign conventions, and questions that span several source domains.
Pricing: ThoughtSpot pricing lists Essentials from $25 per user per month and Pro from $50, billed annually. Pro includes natural-language search and lists 25 Spotter queries per user per month; Enterprise uses custom pricing. Analyst Studio, embedding, MCP, and expanded AI allowances may be separate by plan.
Decision: ThoughtSpot is a strong specialist for search-led self-service on governed data. Plotly is the better fit when the user must operate a custom financial model, not only ask questions of an existing semantic layer.
How we evaluated the platforms
This is a qualitative comparison, not a numerical score. We reviewed current official product documentation, deployment guidance, and pricing pages on October 6, 2026. Each platform was assessed on the same seven questions:
- Primary finance workflow: Reporting, visual exploration, shared metrics, custom modeling, cross-source investigation, platform consolidation, embedding, or natural-language analysis
- Calculation and metric governance: Where finance logic lives, how it is reused, and how changes can be reviewed
- Application depth: Whether the platform primarily presents information or can support inputs, state, models, workflows, and actions
- AI strategy: AI-assisted building, analyst-facing AI, coding-agent readiness, viewer-facing AI, and the controls required around each layer
- Deployment and data control: SaaS, self-managed, on-premises, private cloud, and air-gapped options where currently documented
- Technical ownership and adoption: The people, languages, infrastructure, and rebuild effort required after selection
- Total cost: User licenses, capacity, consumption, infrastructure, implementation, add-ons, and ongoing support
Marketplace star ratings were excluded. The available profiles often cover different editions or wider product suites, and several tools lack comparable review volume. A one-decimal score would add apparent precision without helping finance evaluate its workload.
How to choose financial dashboard software
Start with the workflow, not the vendor category
Use the job that creates the most friction to form the shortlist:
Primary requirement
Platforms to examine first
What to prove
Custom forecasting, risk, pricing, portfolio, or scenario application in Python
Plotly
Model integration, inputs, traceability, app permissions, performance, deployment, and report output
Standard internal reporting in a Microsoft environment
Power BI
License mix, semantic-model ownership, Excel workflow, capacity, refresh, and Report Server differences
Visual exploration and executive presentation
Tableau
Authoring, finance formatting, PDF or subscription output, permissions, and creator/viewer economics
One governed metric layer across departments
Looker
LookML ownership, joins, cache policy, database performance, Git workflow, and finance approval of definitions
Associative exploration across modeled sources
Qlik
Data model, reload design, script ownership, capacity, and the boundary between exploration and reconciliation
One cloud platform from ingestion to dashboards and apps
Domo
Connector coverage, credit forecast, transformation ownership, data movement, and finance-control gaps
Customer-facing embedded analytics
Sisense
Native user experience, tenant isolation, SSO, SDK effort, support, and total product-development cost
Natural-language exploration
ThoughtSpot
Semantic readiness, query allowances, ambiguous terminology, source compute, and answer validation
Evaluate the finished application, not the first prototype
AI coding assistants and generated dashboards reduce the work required to start. They do not make the platforms interchangeable. Judge a prototype against the application finance will need after a few weeks: linked views, editable inputs, long-running calculations, approvals, access controls, scheduled output, testing, and deployment.
This changes the usual recommendation. Do not choose a platform only because the first dashboard is quick to build. Choose the operating model that fits the final workflow and the team that will own it.
Test the actual finance controls
Actuals, budgets, and writeback
A dashboard can display actual-versus-budget data without running the budgeting process. If users must enter assumptions, submit plans, approve changes, lock versions, or write data back, test each action. Identify which system owns the official version.
Consolidation and reconciliation
Connecting several ERPs is not consolidation. Confirm chart-of-accounts mapping, entity ownership, intercompany elimination, currency translation, journals, reconciliation evidence, and close status. If another system performs the work, document that boundary.
Metric definitions and lineage
Ask an analyst to trace one number from a dashboard tile to its formula, transformations, source fields, and source record. Then change the definition and watch how the platform tests, approves, releases, and documents the change.
Financial statement output
Use the organization’s real P&L, balance sheet, cash-flow statement, and board pack. Check subtotals, sign conventions, fiscal calendars, variance notation, notes, Excel export, PDF pagination, scheduled delivery, and print quality.
Access and audit controls
Deployment location alone does not establish compliance. Test row- and column-level security, segregation of duties, identity integration, audit logs, external sharing, exports, change history, backup, and incident processes.
AI governance
For each AI feature, document:
- The edition, capacity, credit package, or add-on that enables it
- Which data, metadata, and prompts leave the platform boundary
- The model provider, region, retention, logging, and administrator controls
- How answers are grounded, cited, reviewed, corrected, and monitored
- What happens when a plausible answer is wrong
Separate three AI decisions. AI-assisted authoring changes how builders create content. Analyst-facing AI changes exploration. Viewer-facing AI changes what deployed users can ask or execute. Buying one does not guarantee the other two.
Total cost at realistic usage
Model three years of authors, viewers, external users, environments, data capacity, source-compute consumption, refreshes, connectors, transformations, AI activity, infrastructure, implementation, training, and support. A low entry price is irrelevant if the intended workflow starts in a higher edition.
Our recommendation
Power BI and Tableau are mature reporting platforms. Looker is compelling for governed metrics, Qlik for associative exploration, Domo for cloud-platform consolidation, Sisense for embedded product analytics, and ThoughtSpot for search-led self-service.
If finance needs to turn a proprietary Python model into a secure, interactive application, Plotly is the better choice. It covers the whole path: Plotly Studio for AI-assisted, code-backed creation; Dash for the application; Dash Enterprise for governed deployment inside the organization’s infrastructure; and Plotly Cloud for managed publishing.
Start with the workflow that standard BI handles least well: the forecast model with user-controlled assumptions, the pricing tool still trapped in a notebook, or the scenario process passing spreadsheets between teams. Explore finance applications built with Dash and discuss the Dash Enterprise deployment path with Plotly.