
Plotly
November 19, 2026
7 Best 3D Visualization Tools for Data Teams in 2027
TL;DR: Which 3D visualization tool should you choose?
- Plotly: The best overall option for Python teams that need interactive 3D analytics to become a production data app.
- ParaView: The specialist choice for large simulation, mesh, and volume datasets across workstations and clusters.
- PyVista: A concise Python interface for VTK-backed mesh analysis and scientific 3D plotting.
- MATLAB: A natural fit when 3D visualization is part of an existing MATLAB engineering or numerical workflow.
- VTK: The foundation for teams building a custom scientific visualization system with control over the full pipeline.
- deck.gl: A strong browser framework for large geospatial, terrain, point cloud, and layered scenes.
- VisIt: Designed for parallel analysis of mesh-based simulation data on local and HPC systems.
The right 3D visualization tool depends less on how impressive its demo looks than on three practical questions: what structure your data has, where the scene must render, and what users need to do after they open it.
For most data teams, Plotly is the strongest overall choice because it provides a continuous path from an interactive 3D figure in Python to a browser-based data app, then to managed or self-hosted production deployment. ParaView, PyVista, VTK, and VisIt go deeper for specialist mesh, volume, and high-performance computing workflows. deck.gl gives web teams more control over geospatial layers or custom scenes, but requires more application engineering.
This guide compares those different product types on the same requirements. It is for data scientists, engineers, analytics teams, and software leaders choosing a tool for scientific, operational, or analytical 3D data.
How to read this comparison
These products are not interchangeable. Plotly provides graphing libraries, an app framework, and commercial deployment platforms; PyVista and VTK are scientific visualization libraries; ParaView and VisIt are specialist applications; deck.gl is a web-rendering framework; MATLAB is a commercial numerical environment. Ranking them without stating the intended outcome would be misleading.
We ranked them for a common data-team requirement: turning analytical 3D data into an interactive experience that other people can use and that a team can maintain in production. The comparison considers:
- Native support for points, surfaces, meshes, volumes, fields, terrain, and scene graphs
- Analytical interaction such as hover, selection, filtering, linked views, and animation
- Browser, desktop, server, and distributed rendering options
- The work required to move from exploration to a governed, multi-user application
- Python or web-development fit, documentation, and integration options
- Open-source licensing, paid hosting, and commercial support
That scope is why Plotly ranks first overall. If your primary requirement is petascale simulation post-processing, a VTK-native mesh pipeline, or complete control of custom shaders, a more specialized option may rank first for your project.
3D visualization tools compared
Rank and tool
Product type and authoring model
Strongest fit
Rendering and delivery
Production or commercial path
AI-assisted workflow
Main trade-off
1. Plotly
Python/JavaScript graphing libraries, Python app framework, and commercial platforms
Interactive 3D analytics that must become a data app
Browser-native WebGL; notebooks, HTML, and Dash apps
Plotly Cloud for managed publishing; Dash Enterprise for governed private-cloud, on-premises, or air-gapped deployment, with private LLM support
Plotly Studio for AI-assisted analysis and Dash app creation; Studio Embedded on Plotly Cloud; Dash MCP and coding-agent support; private LLM support with Dash Enterprise
Less native depth than VTK-based tools for specialist mesh formats and extreme scientific scenes
2. ParaView
Desktop/client-server scientific application with visual pipelines and Python scripting
Large simulation, mesh, field, and volume data
Desktop, remote server, distributed compute, and web through trame
Free BSD-licensed software; commercial services from Kitware
No comparable first-party AI layer documented; external agents can assist with Python pipeline scripts
Business-facing web applications require additional architecture and interface work
3. PyVista
Python library wrapping VTK
Python-native mesh processing and scientific plotting
Desktop, notebook, headless, and trame client/server views
Free MIT-licensed library; community ecosystem
No first-party AI assistant; compatible with general Python coding agents
A production application still needs a UI, authentication, hosting, and operations layer
4. MATLAB
Commercial numerical environment and programming language
Engineering analysis already performed in MATLAB
Desktop, Live Scripts, exported output, and deployed apps with additional products
MathWorks licenses, support, App Designer, and deployment products
MATLAB Copilot assists with generating, explaining, refining, debugging, and testing MATLAB code
License cost and less direct browser sharing than a browser-native Python stack
5. VTK
C++ scientific visualization toolkit with Python bindings
Custom scientific visualization pipelines and domain applications
Native desktop/server rendering, Python, and web/mobile options
Free BSD-licensed toolkit; commercial services from Kitware
No first-party AI interface; external coding agents can assist with Python or C++ pipeline code
Maximum control comes with the highest pipeline and application-engineering burden among the Python options
6. deck.gl
JavaScript/React geospatial visualization framework
Large geospatial layers, terrain, point clouds, trips, and 3D tiles
Browser-based WebGL2/WebGPU
Free and open source; deploy with your web stack and optional commercial map services
No first-party AI assistant; AI authoring or viewer interaction must be added through the surrounding JavaScript application
Not designed around general statistical charts, volumetric science, or a complete application back end
7. VisIt
Desktop/client-server scientific application
Parallel analysis of time-varying mesh simulations
Desktop and remote/HPC compute
Free BSD-licensed software
No comparable first-party AI layer documented; external agents can assist with Python automation
Limited first-class path to a polished browser application for non-specialist users
The seven best 3D visualization tools for data teams
1. Plotly
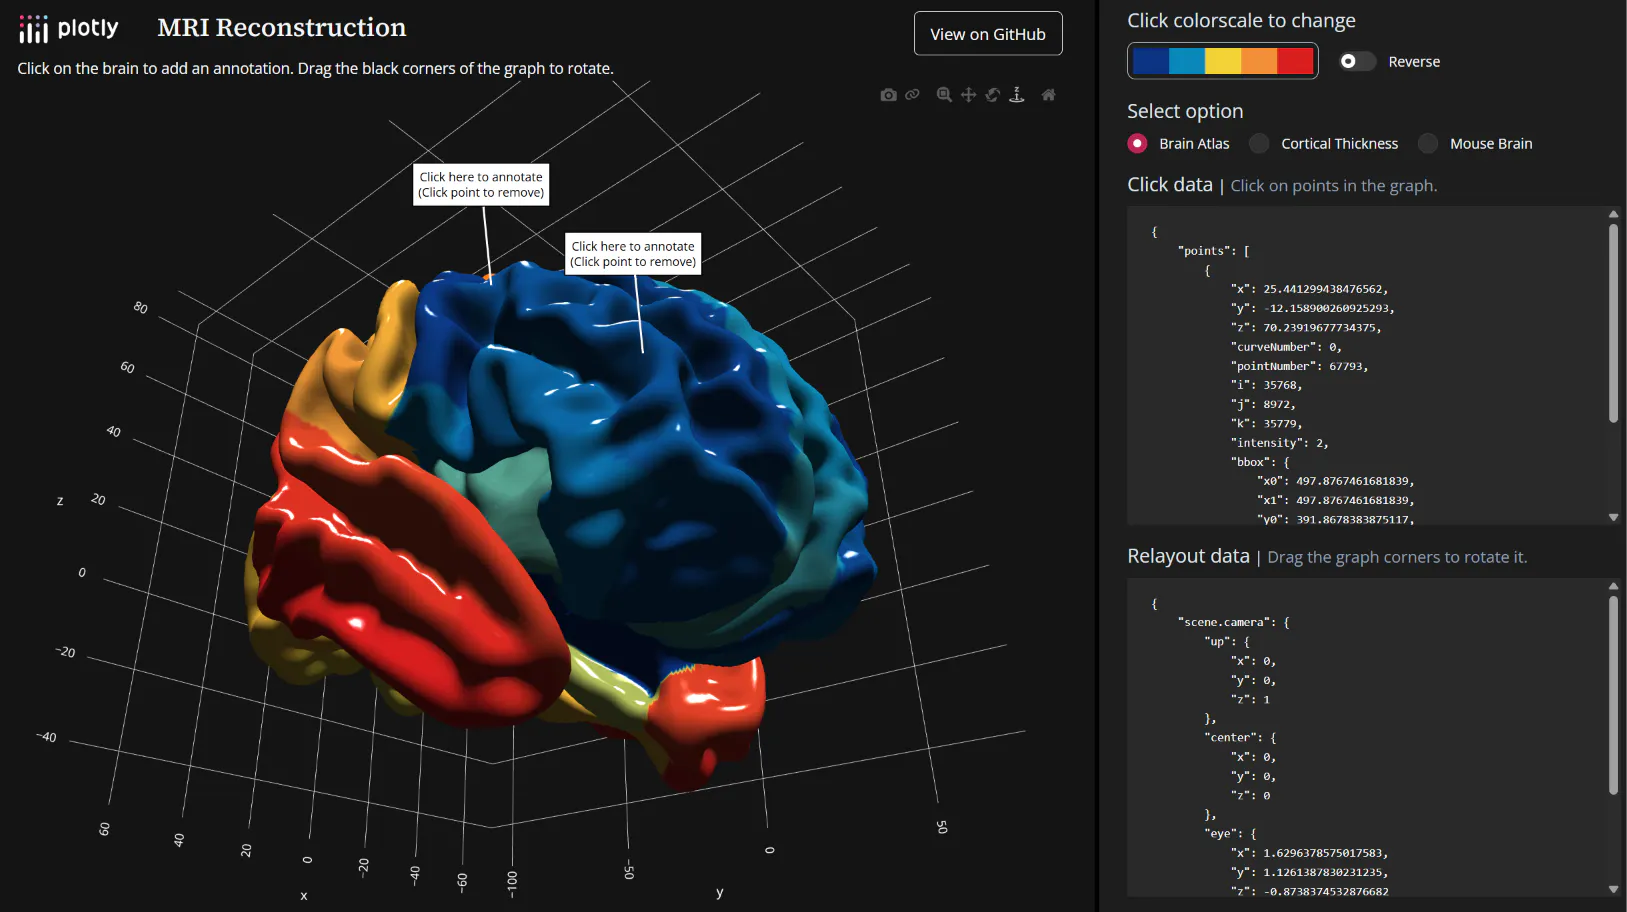
Source: https://brain-viewer.plotly.app/
Plotly is the company behind the open-source graphing libraries, the open-source Dash application framework, and two commercial paths for deploying Dash apps. Plotly.py creates interactive 3D figures in Python; Dash connects those figures to controls, tables, calculations, and application state; Plotly Cloud publishes Dash apps as a managed service; and Dash Enterprise deploys governed data apps inside an organization’s infrastructure.
That progression matters in a buying decision. A notebook figure can become part of an operational application without abandoning Python or rebuilding the visualization in a separate front-end stack.
Where it fits: Data science and engineering teams that need browser-native 3D charts, linked analytical views, custom Python logic, and a supported route to production.
Why it stands out
- Plotly provides seven WebGL-based 3D trace types: scatter3d (points and lines), surface, mesh3d, cone, streamtube, isosurface, and volume. The 3D chart documentation includes examples for camera control, scenes, subplots, bubbles, trisurfs, volumes, and vector fields.
- Rotation, zoom, pan, hover labels, legends, and camera controls work in the browser without custom JavaScript.
- Dash callbacks can connect a 3D scene to 2D charts, data tables, filters, model parameters, and Python calculations. That is useful when a precise table or cross-section should sit beside a spatial view.
- Plotly Studio adds AI-assisted data exploration and app authoring. Generated app code can be exported and run on Plotly Cloud or Dash Enterprise, so the AI-generated starting point is not the deployment architecture.
- Coding agents can work from Plotly and Dash documentation, but they do not remove architectural decisions such as data access, callback design, caching, or viewer permissions.
- For 3D Dash apps published on Plotly Cloud, Plotly Studio Embedded can add a user-facing AI chatbot. Users can ask natural-language questions about registered application data and generate additional charts or explanations without leaving the app. Studio Embedded is currently in beta and is limited to Plotly Cloud.
Production path
Plotly.py and Dash Open Source do not include hosting or authentication by default. Teams can publish smaller apps to Plotly Cloud, then use Dash Enterprise App Manager when they need an app portal, separate development/test/production environments, deployment controls, and app lifecycle management. Dash Enterprise also supports SAML, OIDC, LDAP, and common identity providers, so teams do not have to implement viewer authentication inside every app.
This makes Plotly the strongest choice in this list when the requirement is not merely to render a 3D object but deliver an analytical workflow to controlled users. Dash Enterprise is especially compelling when the app combines 3D visualization with proprietary Python models, long-running calculations, live data, background work, or organization-specific interfaces.
What you give up
Plotly’s 3D traces run in WebGL, so practical limits depend on scene complexity, browser memory, and the viewer’s GPU. Large raw point clouds or dense volumes may require aggregation, resampling, level-of-detail strategies, or preprocessing. Plotly’s performance guide also notes that WebGL content is rasterized inside SVG or PDF exports, so a 3D scene will not remain fully vector-based in those formats.
Plotly is not a replacement for every VTK pipeline. If a team relies on specialist simulation formats, distributed scientific filters, or very large unstructured meshes, ParaView, PyVista, VisIt, or VTK may be the better analysis engine. A useful hybrid is to preprocess scientific data with those tools and deliver selected results through Plotly and Dash.
Adoption effort
Python users can create a first 3D figure quickly with Plotly Express or use graph_objects for lighting, cameras, surfaces, and mesh control. A multi-page production app requires more design. Callback dependencies, state, caching, data access, testing, and deployment still need deliberate architecture. Plotly Studio and coding agents can reduce authoring time, but not that underlying work.
Price and license
Plotly.py and Dash are free under the MIT license. Plotly’s pricing page lists a free Plotly Cloud plan, a Pro plan at $29 per Creator per month ($290 billed annually), and custom Enterprise pricing; viewer allowances and additional charges vary by plan. Dash Enterprise uses custom pricing.
Evidence in practice: NovaLabs built CliqScale.R with Dash, combining user-defined inputs with browser-based 3D reactor simulation results. According to the customer story, the application reduced the lead time for access to an end-to-end CFD methodology from as long as one year to minutes.
Bottom line: Shortlist Plotly first when 3D is one part of a decision workflow and the finished product needs to reach users as an interactive, governed data app. Explore Plotly’s 3D examples or request a Dash Enterprise demo to test the path with a representative workload.
2. ParaView
Source: https://lidarview.kitware.com/
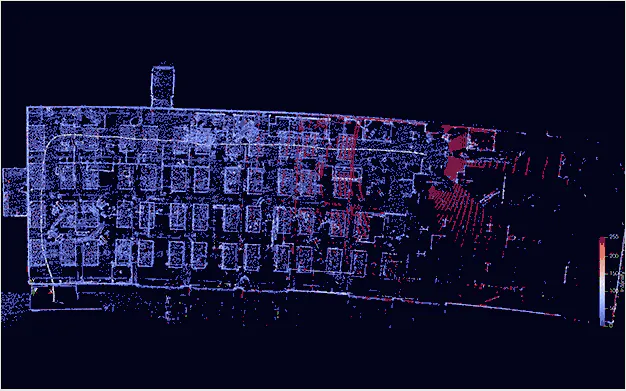
ParaView is an open-source application and framework for scientific data analysis and visualization. Built on VTK, it combines a visual pipeline editor, Python scripting, client-server execution, parallel processing, and remote rendering.
Where it fits: Scientists and engineers working with CFD, finite element, climate, medical, or other simulation data that is too complex or large for a conventional charting library.
Why teams choose it
- Native pipelines for clipping, slicing, contouring, thresholding, probing, streamlines, volume rendering, and derived calculations
- Readers for common scientific and engineering formats, including VTK-family formats, Exodus, CGNS, XDMF, NetCDF, and HDF5-based data
- A distributed architecture that can use remote parallel compute while the user works from a desktop client
- Python automation through pvpython and paraview.simple
- ParaView Catalyst for in situ analysis while a simulation is running
Compared with Plotly
Moving to ParaView gains scientific data depth, native mesh semantics, parallel filters, and remote/HPC execution. The trade-off is the last mile. A polished, business-facing browser app with application-specific controls, identity, tables, and workflow logic requires trame or ParaViewWeb, hosting, session management, and custom development.
The adoption effort is moderate for a scientist using the desktop interface and higher for a software team embedding ParaView in a multi-user web product. Do not choose ParaView merely because the source dataset is large; choose it when its mesh pipeline and distributed analysis model are central to the work.
Price and license: ParaView is free under the BSD 3-Clause license. Kitware offers commercial consulting, training, and support separately.
3. PyVista
Source: https://docs.pyvista.org/
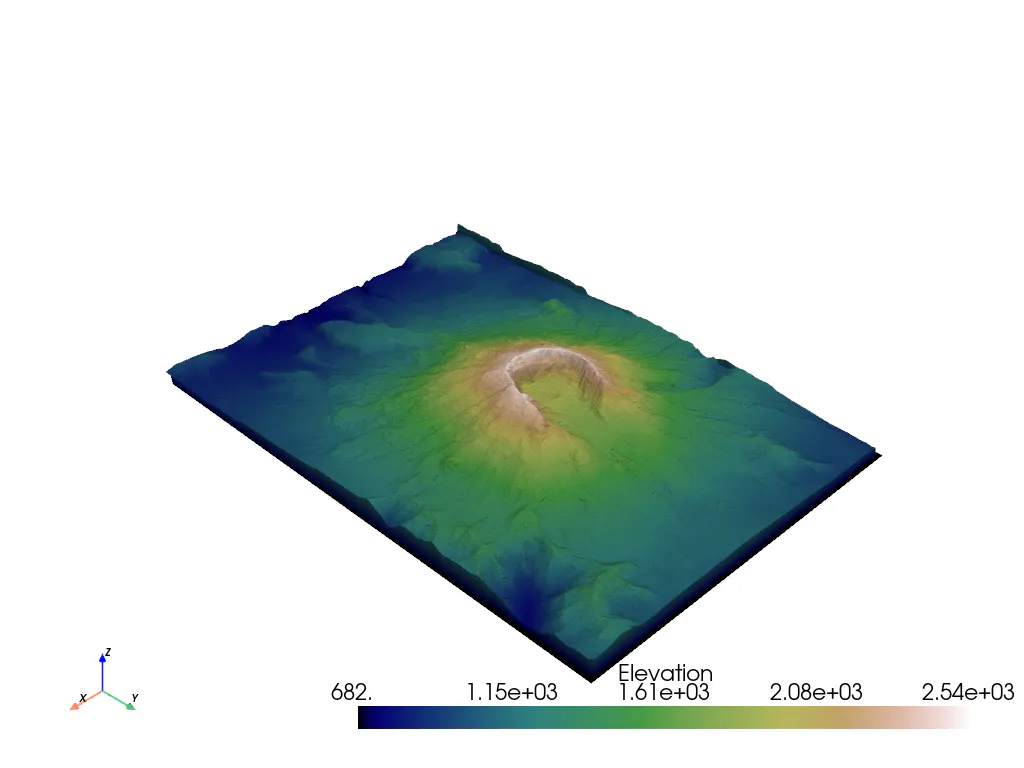
PyVista is an MIT-licensed Python library that presents VTK’s scientific data model through a more concise, NumPy-oriented API. It works with point clouds, polygonal surfaces, image data, structured grids, and unstructured meshes.
Where it fits: Python teams that need mesh analysis, geometry filters, or VTK-quality rendering without building raw VTK pipelines.
Why teams choose it
- Filters for slicing, clipping, contouring, thresholding, sampling, interpolation, and geometric analysis
- Direct access to NumPy arrays attached to mesh points and cells
- One plotting interface across scripts, notebooks, headless jobs, and larger Python tools
- Trame backends that support client-side, server-side, or switchable rendering in Jupyter contexts
Compared with Plotly
PyVista gains VTK’s richer mesh types, readers, filters, and scientific rendering. It gives up Plotly’s ready-made analytical chart model and integrated route from figure to governed data application. A production PyVista experience normally needs trame, Panel, Qt, or another application layer plus authentication, hosting, monitoring, and release management.
For a team moving from Plotly, the main transition is conceptual. Data becomes a mesh or VTK dataset with point and cell arrays, rather than traces in a figure. For a team moving from VTK, PyVista generally reduces boilerplate while retaining access to the underlying toolkit.
Price and license: PyVista is free under the MIT license. There is no dedicated PyVista hosting service; infrastructure and support are separate decisions.
4. MATLAB
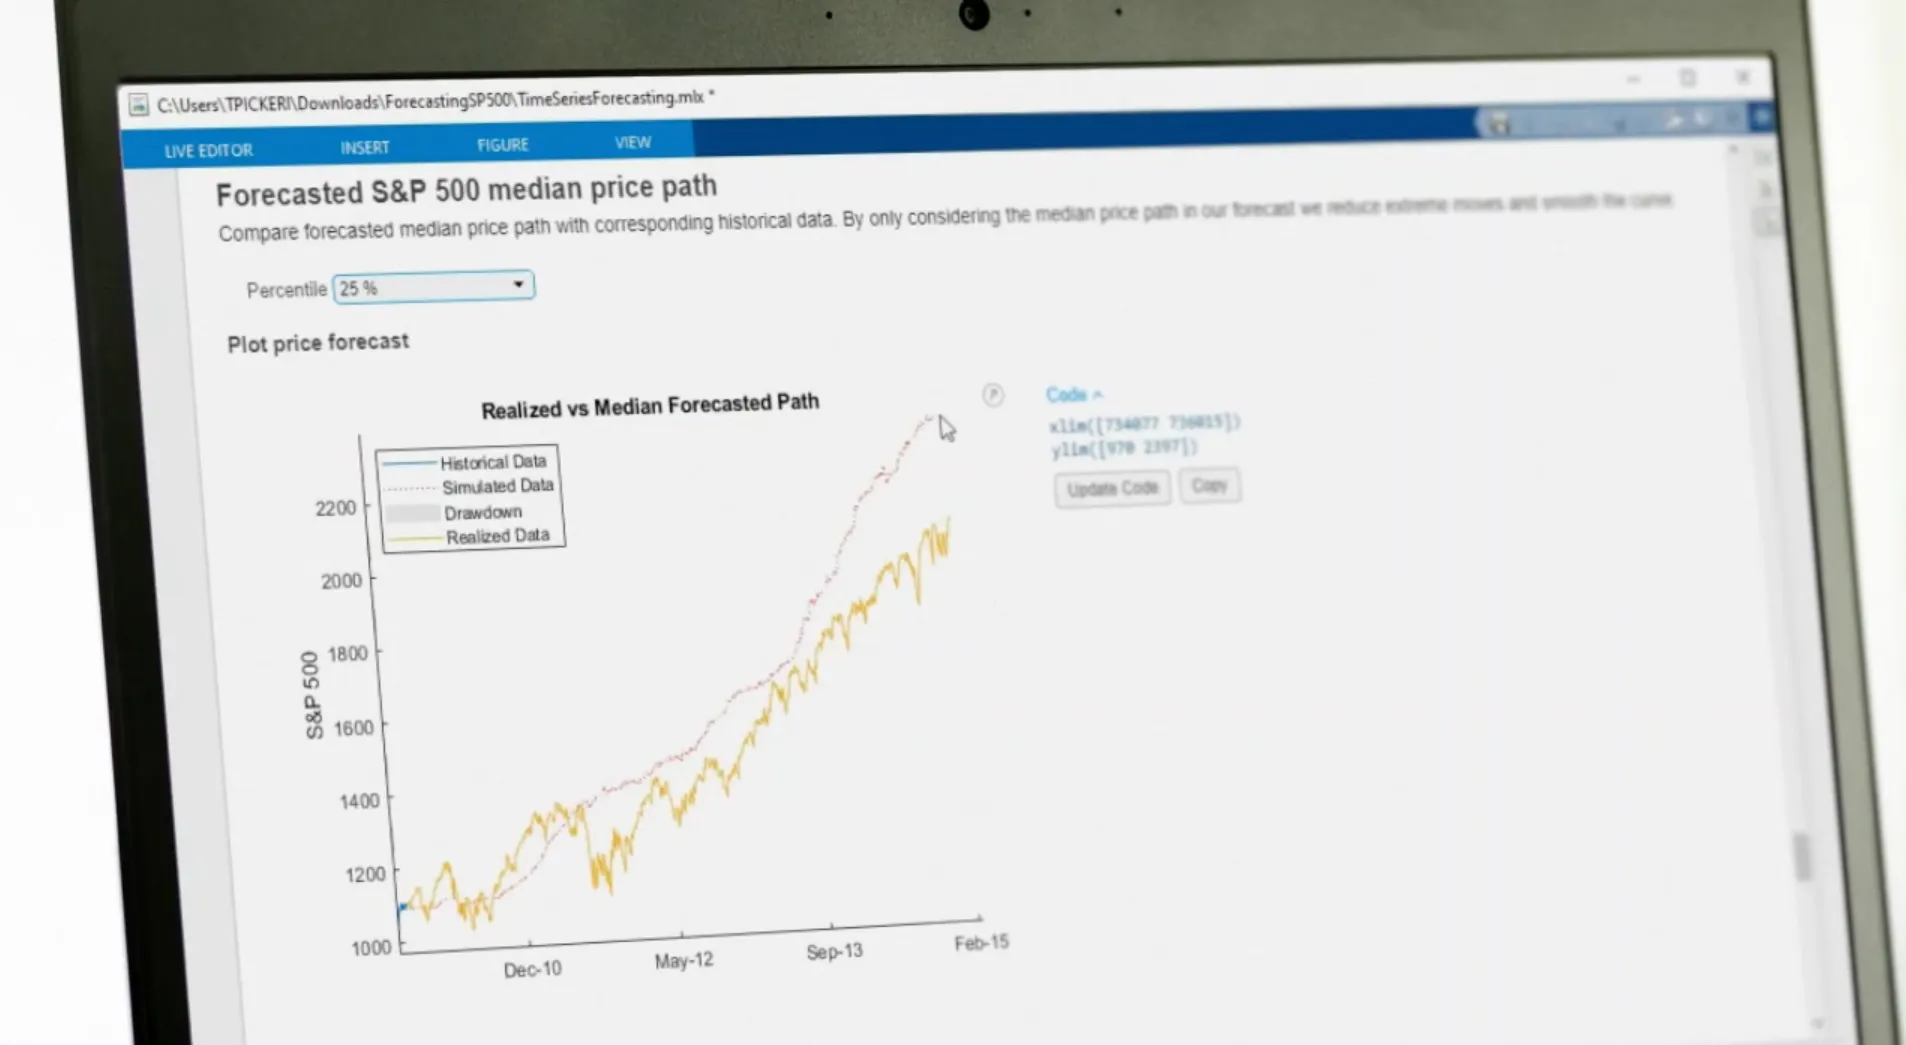
MATLAB combines numerical computing, algorithm development, and visualization in a commercial environment. Its built-in functions cover 3D lines, scatter plots, surfaces, meshes, contours, vector fields, and volumetric data.
Where it fits: Engineering and research teams whose models, toolboxes, and validation processes already live in MATLAB.
Why teams choose it
- Familiar functions such as plot3, scatter3, surf, mesh, contour3, quiver3, and isosurface
- Numerical analysis and visualization in the same workspace and language
- Live Scripts that combine code, equations, narrative, and figures
- App Designer for packaging analysis into purpose-built interfaces
- Deep domain toolboxes and MathWorks documentation, training, and support
Compared with Plotly
MATLAB is the safer choice when certified engineering workflows, Simulink, or domain toolboxes matter more than browser delivery. Plotly is stronger when Python is the shared language and the output needs to become a browser-native data app for a broad audience.
Switching from MATLAB is rarely just a plotting change. Teams must account for models, toolboxes, validated functions, file formats, and user skills. Conversely, adopting MATLAB for visualization alone introduces licensing and platform dependencies that may not be justified if the surrounding stack is already Python.
Price and license: MATLAB is proprietary. MathWorks pricing varies by license model, organization type, region, and add-on products. App deployment may require additional MathWorks products or infrastructure.
5. VTK
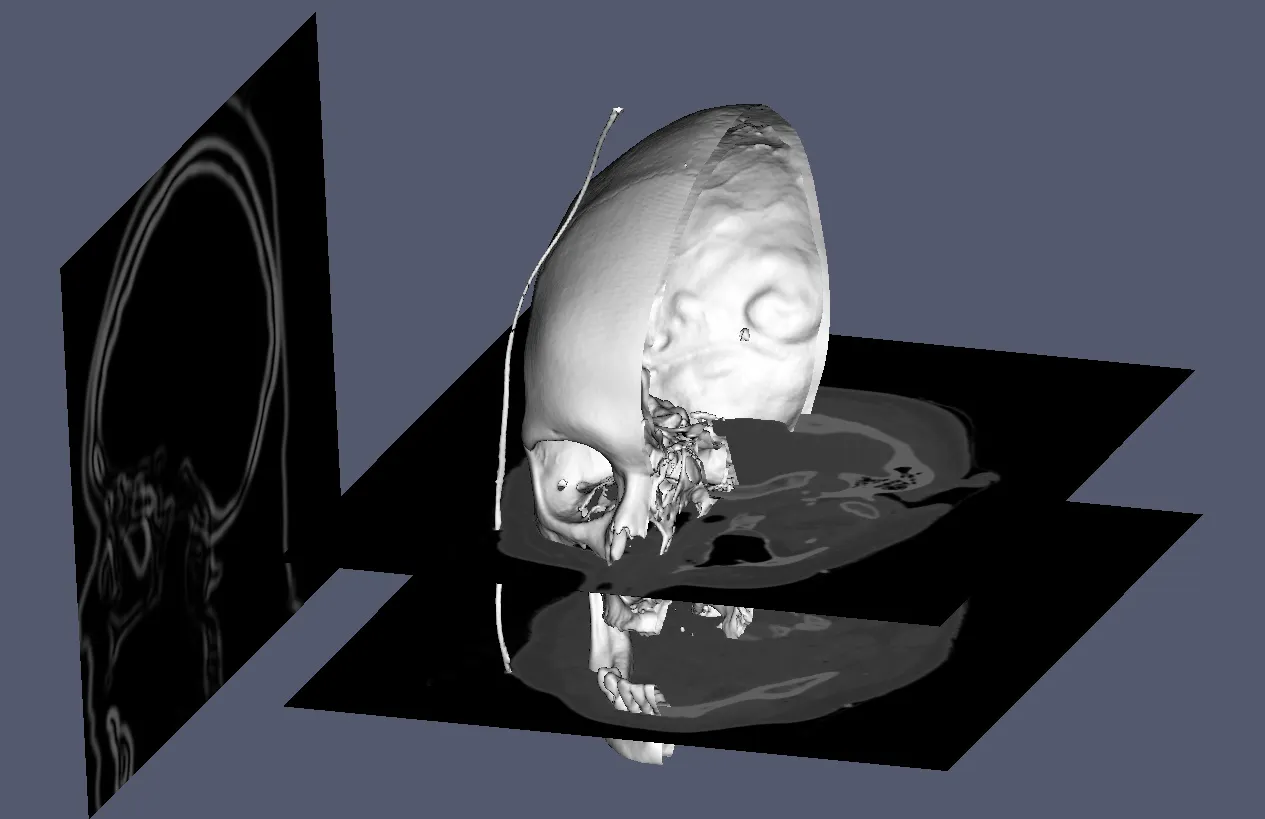
VTK is an open-source toolkit for 3D computer graphics, image processing, modeling, volume rendering, and scientific visualization. Its C++ core, Python bindings, data objects, filters, mappers, actors, renderers, and interaction primitives underpin higher-level projects including ParaView and PyVista.
Where it fits: Software teams building a custom medical, engineering, research, or scientific visualization application where the processing and rendering pipeline is itself part of the product.
Why teams choose it
- A dataflow architecture that composes readers, filters, mappers, actors, and renderers
- Data models for images, structured and unstructured grids, polygonal data, and composite datasets
- Algorithms for contouring, clipping, resampling, geometry processing, image operations, and analysis
- Threaded and distributed-memory parallelism, plus Python interoperability
- Broad reader and writer coverage for specialist scientific formats
Compared with Plotly
VTK gains low-level control and scientific depth. It loses the concise figure grammar, automatic analytical conventions, and packaged application/deployment path that Plotly provides. Even basic axes, legends, interaction patterns, and application navigation require more engineering.
Adoption effort is high. Developers need to understand the VTK pipeline, data ownership, rendering environment, and packaging. Choose VTK when that control creates durable product value.
Price and license: VTK is free under a BSD-style license. Kitware provides commercial development and support services.
6. deck.gl
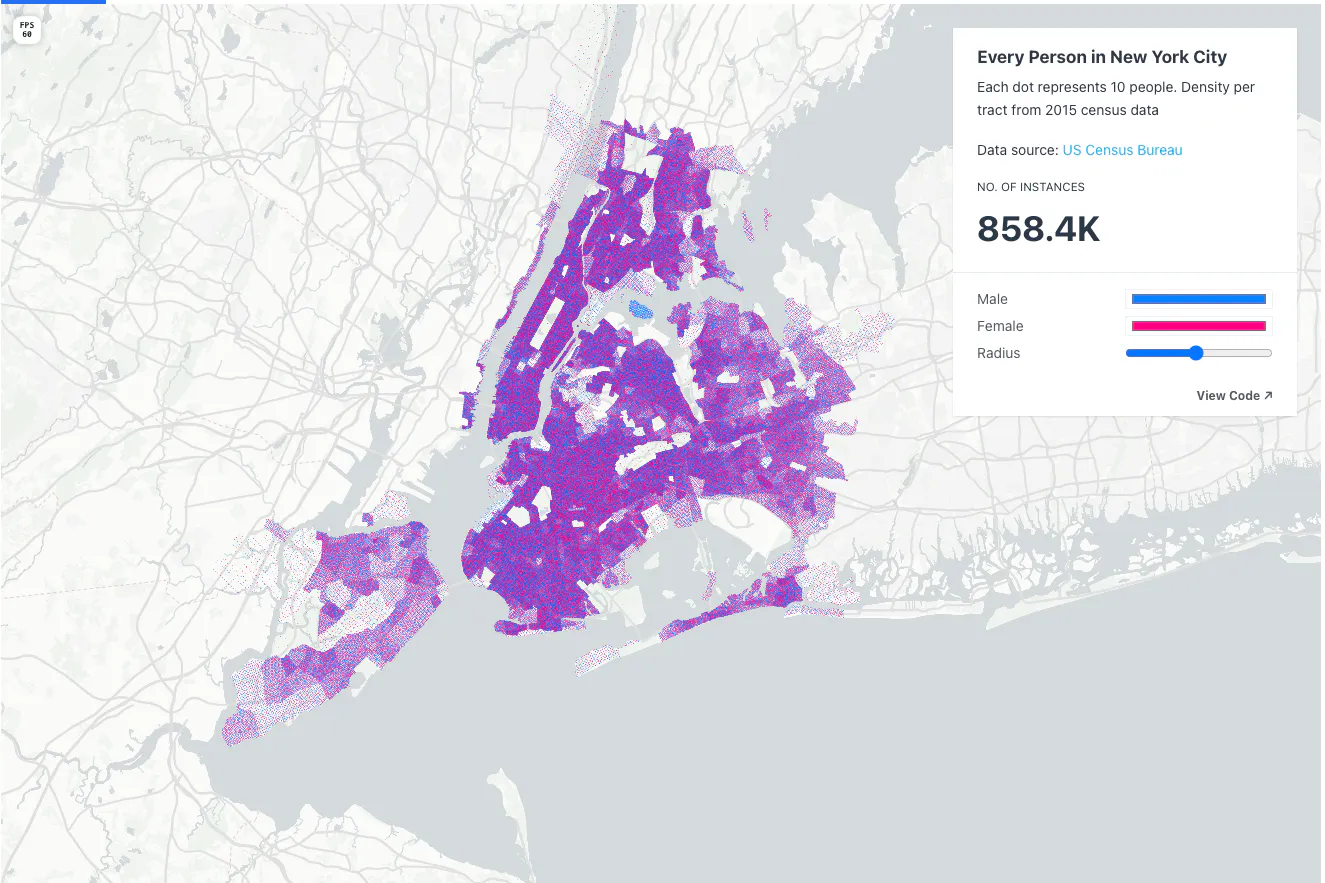
deck.gl is a JavaScript and React framework for high-performance visualization of large datasets with WebGL2 and WebGPU. It uses composable layers for point clouds, terrain, trips, 3D tiles, meshes, heatmaps, arcs, and other geospatial forms.
Where it fits: Web and geospatial teams creating map-centered applications with dense, layered, or animated spatial data.
Why teams choose it
- A broad layer catalog that includes PointCloudLayer, TerrainLayer, ScenegraphLayer, and Tile3DLayer
- GPU-based calculation, picking, highlighting, filtering, transitions, and animation
- Integrations with Mapbox, MapLibre, Google Maps, and ArcGIS, or operation without a base map
- A declarative update model that fits React applications
Compared with Plotly
deck.gl gains geospatial scale, tile and terrain primitives, and more direct control over layered map scenes. It gives up a Python-first analytical workflow and a complete data-app platform. Statistical charts, tables, back-end logic, identity, and deployment remain separate parts of the web application.
Python teams can use pydeck, but a customized production experience will still pull the project toward JavaScript and front-end engineering. Choose deck.gl when the map is the application canvas; choose Plotly when 3D, 2D charts, tables, and Python analytics need to operate as one workflow.
Price and license: deck.gl is free under the MIT license. Base maps, tiles, geocoding, hosting, and other external services may have separate fees and terms.
7. VisIt
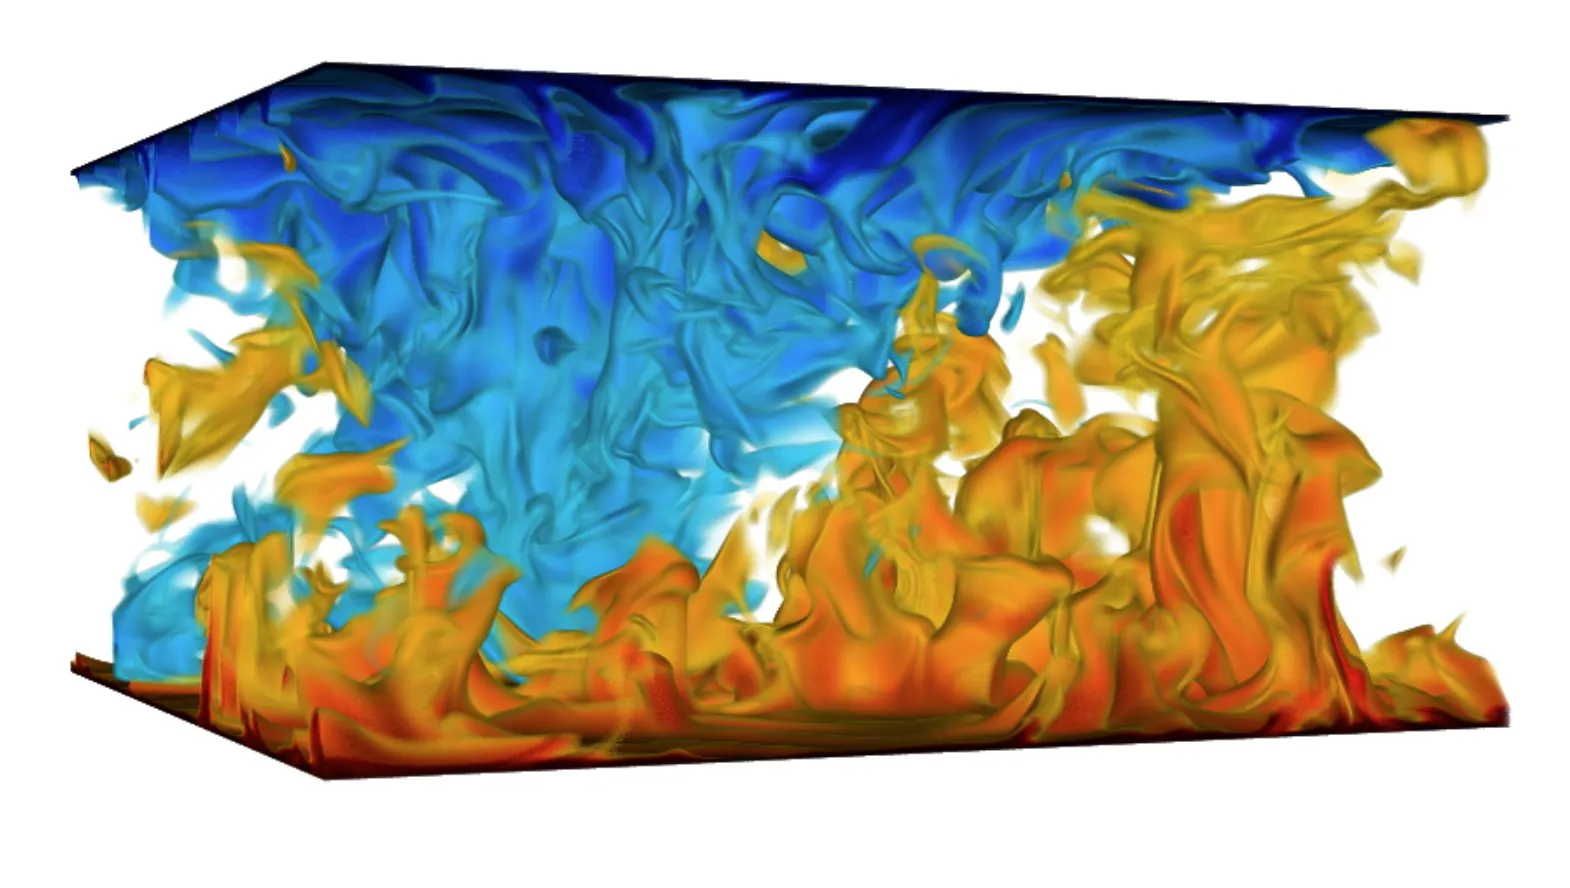
VisIt is an open-source, distributed application for analyzing and visualizing data on two- and three-dimensional meshes. It was developed for large, time-varying simulation data and can move compute-intensive work to remote resources.
Where it fits: Research laboratories and HPC teams analyzing scalar, vector, tensor, molecule, mesh, and volume data across simulation runs.
Why teams choose it
- Native support for structured, unstructured, and adaptive meshes
- Operators for slicing, clipping, contouring, thresholding, transformation, and derived expressions
- Parallel processing and a client-server model for remote compute
- Time-series animation, batch processing, and Python automation
Compared with Plotly
VisIt gains a purpose-built simulation analysis environment and parallel mesh processing. It gives up browser-native sharing and the direct route to a tailored application for non-specialist users. Its interface and terminology assume scientific visualization knowledge.
Adoption is easiest when the organization already has HPC infrastructure and domain experts. If the goal is a reusable decision tool for operations, commercial teams, or customers, expect a separate delivery layer, or export derived data into Plotly and Dash.
Price and license: VisIt is free under the BSD 3-Clause license. There is no dedicated managed hosting plan.
How to choose the right 3D visualization software
1. Start with the data structure, not the screenshot
An x-y-z table, an unstructured finite-element mesh, a medical image volume, a point cloud, and a 3D Tiles scene require different abstractions. Confirm that a tool preserves the topology, fields, coordinate systems, time steps, and metadata your analysis needs.
- Choose Plotly for analytical points, surfaces, meshes, volumes, vector fields, and mixed 2D/3D app workflows.
- Choose ParaView, PyVista, VTK, or VisIt when scientific meshes, specialist readers, or derived filters are central.
- Choose deck.gl for geospatial layers and tiled spatial scenes.
2. Decide where data and rendering should live
Browser rendering simplifies sharing and uses the viewer’s GPU, but it imposes browser memory and hardware limits. Server or HPC rendering keeps heavy data and compute near the source but adds infrastructure and session-management requirements. Desktop applications can be powerful for experts while remaining difficult to distribute to occasional users.
Test with a representative production dataset, not a sample. Measure initial load, rotation, filtering, selection, memory use, and concurrent sessions. For very large scenes, test aggregation, resampling, decimation, tiling, and server-side preprocessing before assuming a different renderer will solve the problem.
3. Define what users do after they rotate the scene
A production workflow usually needs more than camera control. Users may need to select an asset, change model parameters, inspect a cross-section, compare a time series, correct a record, launch a calculation, download a report, or share a saved state.
Plotly’s advantage is strongest here: a 3D chart can participate in a Dash application with Python callbacks, 2D figures, forms, grids, and business logic. ParaView and VisIt are stronger when the user is a scientific specialist working inside a visualization pipeline.
4. Separate prototyping speed from day-100 fit
A one-line plotting call is useful, but it does not decide the platform. Evaluate how the tool handles data access, authentication, authorization, testing, deployment, logging, background work, upgrades, and ownership after launch.
Dash Open Source can run on general infrastructure, but it does not add authentication automatically. Plotly Cloud provides managed publishing; Dash Enterprise provides a governed, self-hosted path. PyVista, VTK, and deck.gl are libraries. Your team assembles the surrounding production system. ParaView and VisIt are complete expert applications, but productizing their output for a different audience is a separate project.
For the available publishing routes, see Plotly’s Dash deployment overview.
5. Treat AI-assisted development as an accelerator, not an architecture
Coding agents can help write examples, callbacks, shaders, filters, and tests in any code-first tool. That reduces syntax and search time, but it does not erase differences in rendering, data models, deployment, or governance.
Plotly Studio goes further by using natural language to help explore data and create editable Dash applications. That is useful when a team wants faster app authoring without changing the production target. The generated code can still be exported and run on Plotly Cloud or Dash Enterprise. For other tools, assess whether your coding agent can access current official documentation and whether the generated result follows your team’s architecture and review standards.
6. Compare total delivery cost
Free licensing is only one line item. Add developer time, infrastructure, GPU capacity, commercial map services, security review, support, upgrades, and the cost of maintaining a custom application shell.
Plotly’s commercial products cost more than assembling only open-source libraries, but they can replace repeated work around publishing, identity, permissions, environments, and app management. MATLAB may reduce risk for an established engineering organization even when license fees are substantial. VTK may justify its engineering cost when unique rendering behavior is a product requirement.
7. Verify export and accessibility requirements
3D interaction can create occlusion, depth-perception, keyboard, and screen-reader challenges. Provide a linked table, 2D projection, labels, or downloadable data when users need precise comparisons or an accessible alternative.
Also test the exact output used in reports. Browser-native WebGL scenes may be rasterized in PDF or SVG exports. A production selection should satisfy both the interactive workflow and the required record of the analysis.
How we evaluated these 3D visualization tools
To qualify, a product had to be actively documented, support genuine three-dimensional data or scenes, and provide a practical route beyond a single local screenshot. We reviewed official product pages, documentation, licensing, and pricing on October 6, 2026. We did not run a common performance benchmark because these tools target different data structures and rendering architectures; a single points-per-second score would create false precision.
Each entry was assessed on the same six questions:
- What can it represent natively? Points, lines, surfaces, meshes, volumes, fields, terrain, tiles, or arbitrary scene graphs.
- How do users analyze the result? Camera control, hover, selection, filters, linked views, animation, and derived calculations.
- Where does it render? Browser, desktop, notebook, server, cluster, or a combination.
- How does it become a maintained product? Application framework, authentication, deployment, monitoring, commercial hosting, or an expert desktop workflow.
- What does a team gain and give up? Scientific depth, application flexibility, development speed, operational burden, or vendor support.
- What is the adoption effort? Required languages, conceptual model, dependencies, migration work, and infrastructure.
We intentionally excluded G2 and Capterra scores. Most specialist open-source tools in this list have no product profile, while available scores often refer to an adjacent commercial suite rather than the exact 3D product. Presenting those numbers in one ranking would imply a comparison the underlying reviews do not support.
Final recommendation
Choose the specialist first when the specialist data model is the requirement: ParaView or VisIt for large simulation post-processing, PyVista or VTK for mesh-centric scientific development, deck.gl for geospatial layers.
Choose Plotly when the requirement is broader: an interactive 3D view that must connect to live data, Python analytics, controls, tables, and other charts, then reach real users as a maintainable application. Start with the open-source 3D chart gallery. For managed publishing, evaluate Plotly Cloud; for identity, app-level governance, controlled infrastructure, and a production app portfolio, talk to Plotly about Dash Enterprise.