NISCI Develops Supply Chain Applications With Dash Enterprise
Industry
Manufacturing
Infrastructure
Bare Metal
Summary
- The NISCI research team successfully deployed production-grade, interactive ship cargo optimization and distribution network planning applications with Dash Enterprise.
- The team deployed these supply chain focused applications in 3-5 months, with about 15% of the effort spent on visualization.
- Shipping and logistics companies are able to optimize both cargo loading and plan network distribution scenarios with the click of a button with NISCI’s applications.
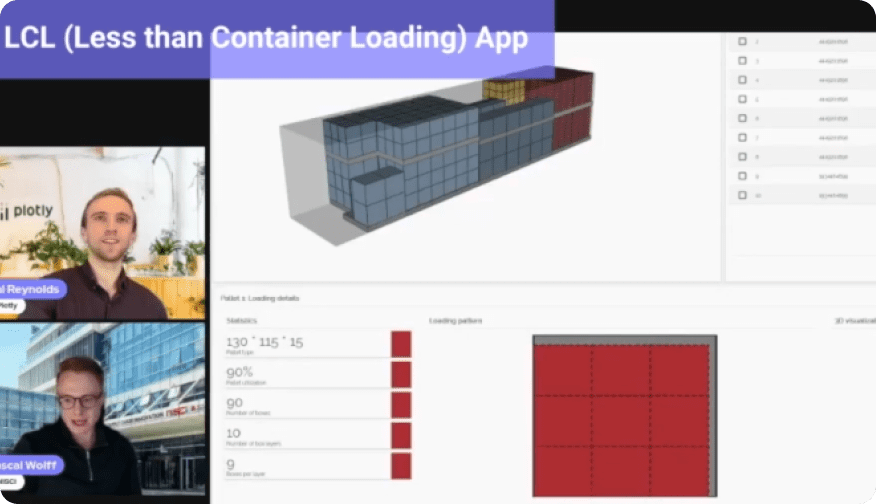
NISCI Webinar Highlight Reel
Introduction
The NISCI (Ningbo Institute for Supply Chain Innovation), an integral part of MIT's global SCALE network, is a research center dedicated to supply chain management and logistics. The institute focuses on academic instruction and practical applications in collaboration with industry partners, spanning government entities, corporations, and organizations.
A core component of the NISCI's work is the optimization of supply chain networks, typically for manufacturing and logistics firms. The institute develops solutions that tackle classic optimization challenges, such as plant and warehouse location decisions, sourcing decisions, and more. The research also extends to logistics solutions, such as truck routing and trailer loading, or leveraging AI and machine learning to estimate vessel arrival times at specific ports.
The NISCI develops visualizations for its supply chain and logistics solutions in their local Computational and Visual Education (CAVE) Lab, and relies on Dash Enterprise to develop and deploy interactive applications and visualizations in a fast and efficient manner.
“Without the visualization provided by Dash Enterprise, these projects would merely be some Python scripts we would hand over to the client, and they would have to build their own visualizations. We can now deliver not only algorithms, but actual products — the project partner doesn't have to do anything other than work with us on their data pipeline.”
Pascal Wolf, Assistant Professor, NISCI
Challenge
The research team at NISCI faced challenges in communicating the results of their machine learning and optimization algorithms to their project partners.
The NISCI works on complex shipping and logistics cases, such as scenario planning with multiple parameters or determining the implications of a 10% increase in transportation costs. Visualizing these solutions at times felt like navigating a black box, making it challenging for practitioners to analyze and interpret the results. The research team wanted to increase transparency and strengthen trust in the solutions they provided to project partners.
The team at NISCI realized that interactive visualization and analysis provided a boost in transparency by allowing project partners to deeply understand the underlying data. They aimed to create visualizations atop their optimization algorithms to make the solutions more accessible and engaging for practitioners, aiding in their understanding of the end results.
The research team initially turned to Matplotlib for basic visualization, which was powerful yet lacked support for building highly interactive visualizations or full-fledged applications. When they discovered Plotly’s Dash, they found it could facilitate quick development in Python of such applications, but without the requirement of a dedicated software development or IT team — enabling a streamlined solution for creating full-featured data apps to package their optimization models as complete, interactive data.
Over a period of just two weeks, the team successfully deployed their first data applications. Based on this initial success with Dash, they began to explore Dash Enterprise, particularly for optimizing processes in the realm of container loading.
Solution
The NISCI team, with expertise in supply chain management rather than computer science, found it relatively easy to adopt Dash Enterprise in developing data applications for their project partners. They were able to create their own library of custom templates to save time, despite being a small team of three researchers.
The team developed two key applications, the first being a solution for LCL (Less than Container Load) loading, and the second, a multi-channel distribution design application.
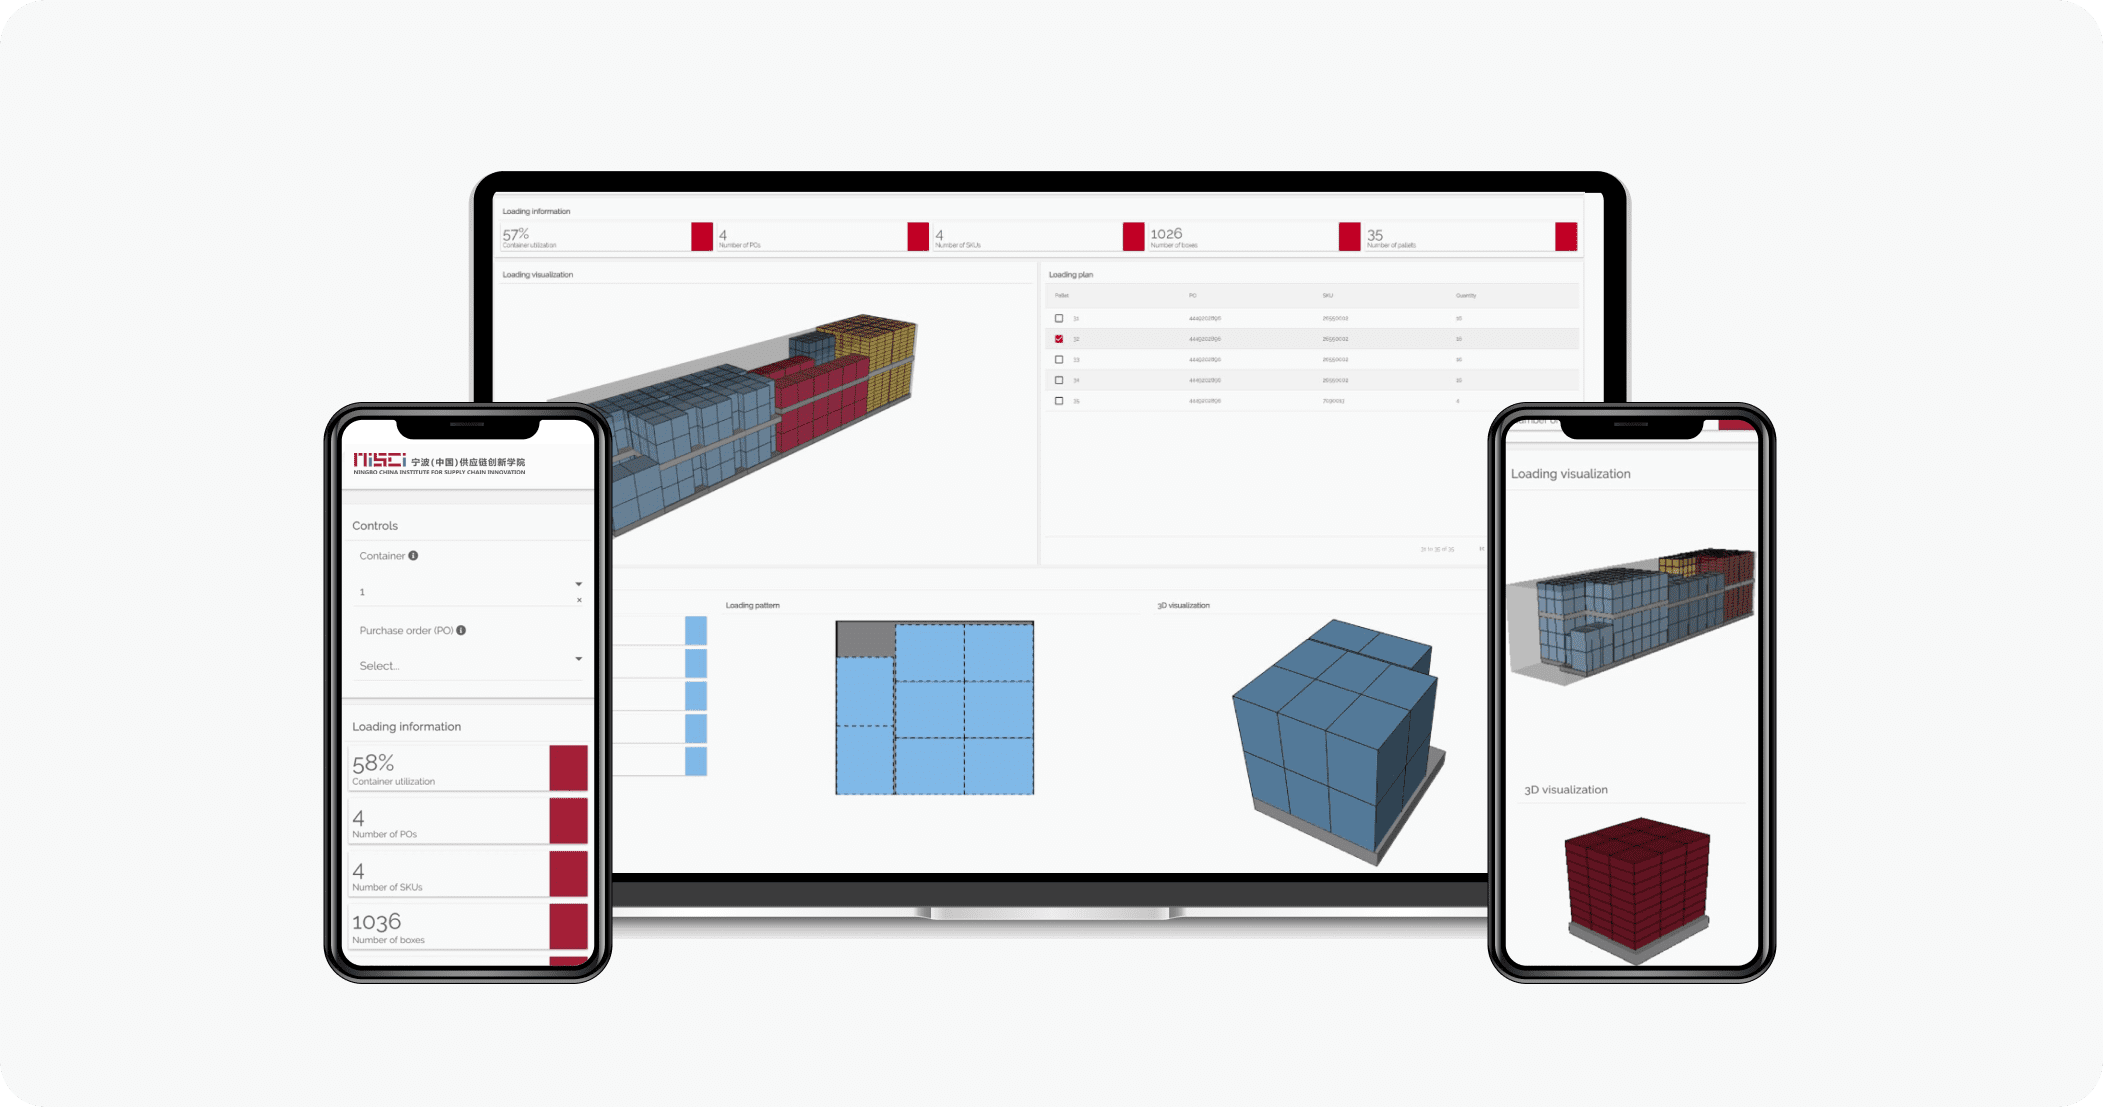
NISCI's LCL loading application gives users the ability to create container loading plans with visual loading instructions. Mobile responsiveness is made possible through NISCI's usage of Dash Enterprise Design Kit.
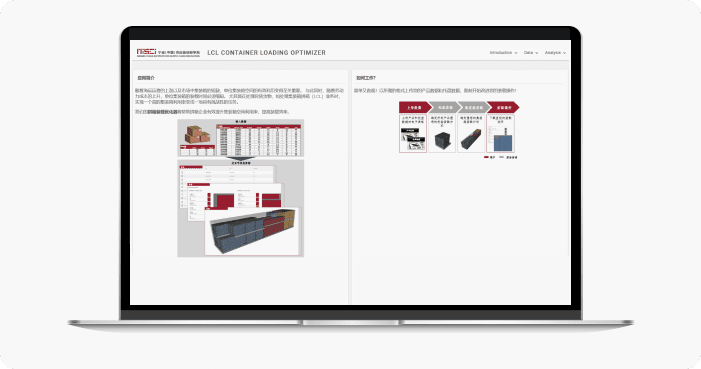
The data app also has multi-language support, with a Chinese user interface available.
The LCL loading app empowers logistics companies to create efficient container loading plans and to obtain visual loading instructions. Users can easily upload data containing cargo details, box dimensions, and weights via spreadsheets. In the background, NISCI's optimization algorithm ensures optimal placement of each SKU on the palettes, box stacking configurations, and container layout for efficient space utilization. A comprehensive interactive workflow guides workers on the shop floor for more organized plan execution.
The multi-channel distribution design application ensures an optimal approach to revamping the distribution network and accommodating evolving business needs. The app handled assessing and enhancing delivery performance, analyzing more than 18 months of records holding nearly 2 million order lines, customer orders, inbound data, and warehouse activities. It incorporated machine learning algorithms to generate insights on actual delivery times versus planned delivery times and the reasons behind delivery delays, based on customer ordering patterns.
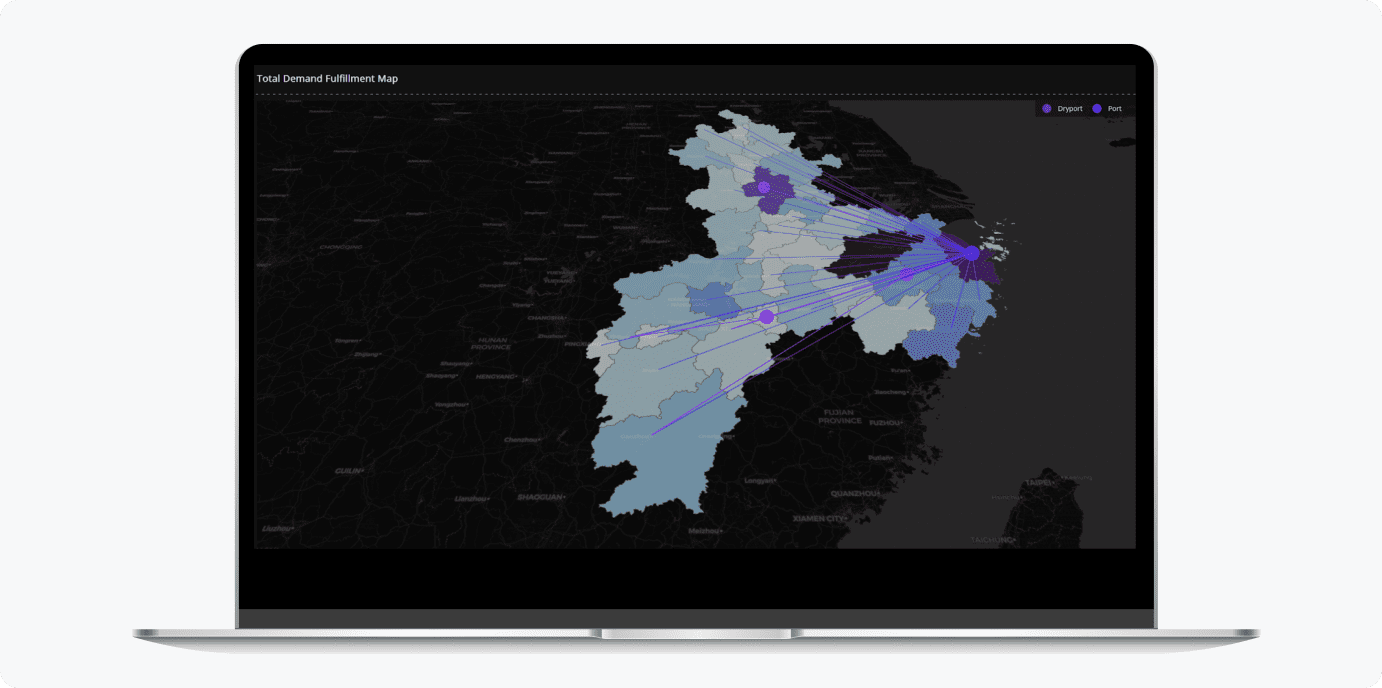
The multi-channel distribution design application provides an optimal approach for planning distribution networks to improve delivery metrics.
The multi-channel distribution design app was developed in collaboration with a Fortune 500 company seeking to transform their distribution network in Australia and New Zealand, in response to increased demand and a shift from traditional B2B to a more B2C-oriented business model. The NISCI team eventually added simulation capabilities to this app, allowing users to identify optimal locations for order fulfillment, minimizing transportation costs and enhancing customer service by improving the next day delivery capabilities by more than 12%, measured in terms of Sales per day of lead time.
Results
- Deployment of production-grade supply chain planning applications in 3 to 5 months, enhancing supply chain planning, with less than one month spent on visualization, approximately 15% of the overall effort.
- Dash Enterprise Design Kit enabled effortless cross-device compatibility, reducing development time.
- Via the LCL loading app, NISCI enabled rapid optimization initiation in about 3 seconds, with identification of SKUs that benefit from box rotation, saving space, and transportation costs.
- Practitioners at shipping companies are able to compare 12 to 15 distribution network scenarios in less than one hour, using the multi-channel distribution design app.
- Improved decision-making and presentation of warehouse and supply chain designs to management.
- Streamlined visualization projects, offering mathematical and visual problem-solving.
About NISCI
NISCI is a non-profit educational and research institute that operates independently under the guidance of the MIT Center for Transportation and Logistics and is the only research institute jointly established by MIT and the Chinese government. The institute is a member of the MIT Global Supply Chain and Logistics Excellence (SCALE) Network, which currently consists of research centers located in the United States, Spain, Luxembourg, Malaysia, Colombia and China, with 16 graduate and executive training programs (both virtual and in residence) offered in Europe, North America, Latin America, and Asia.

More user stories like this

Equinor develops a visualization platform utilizing Dash
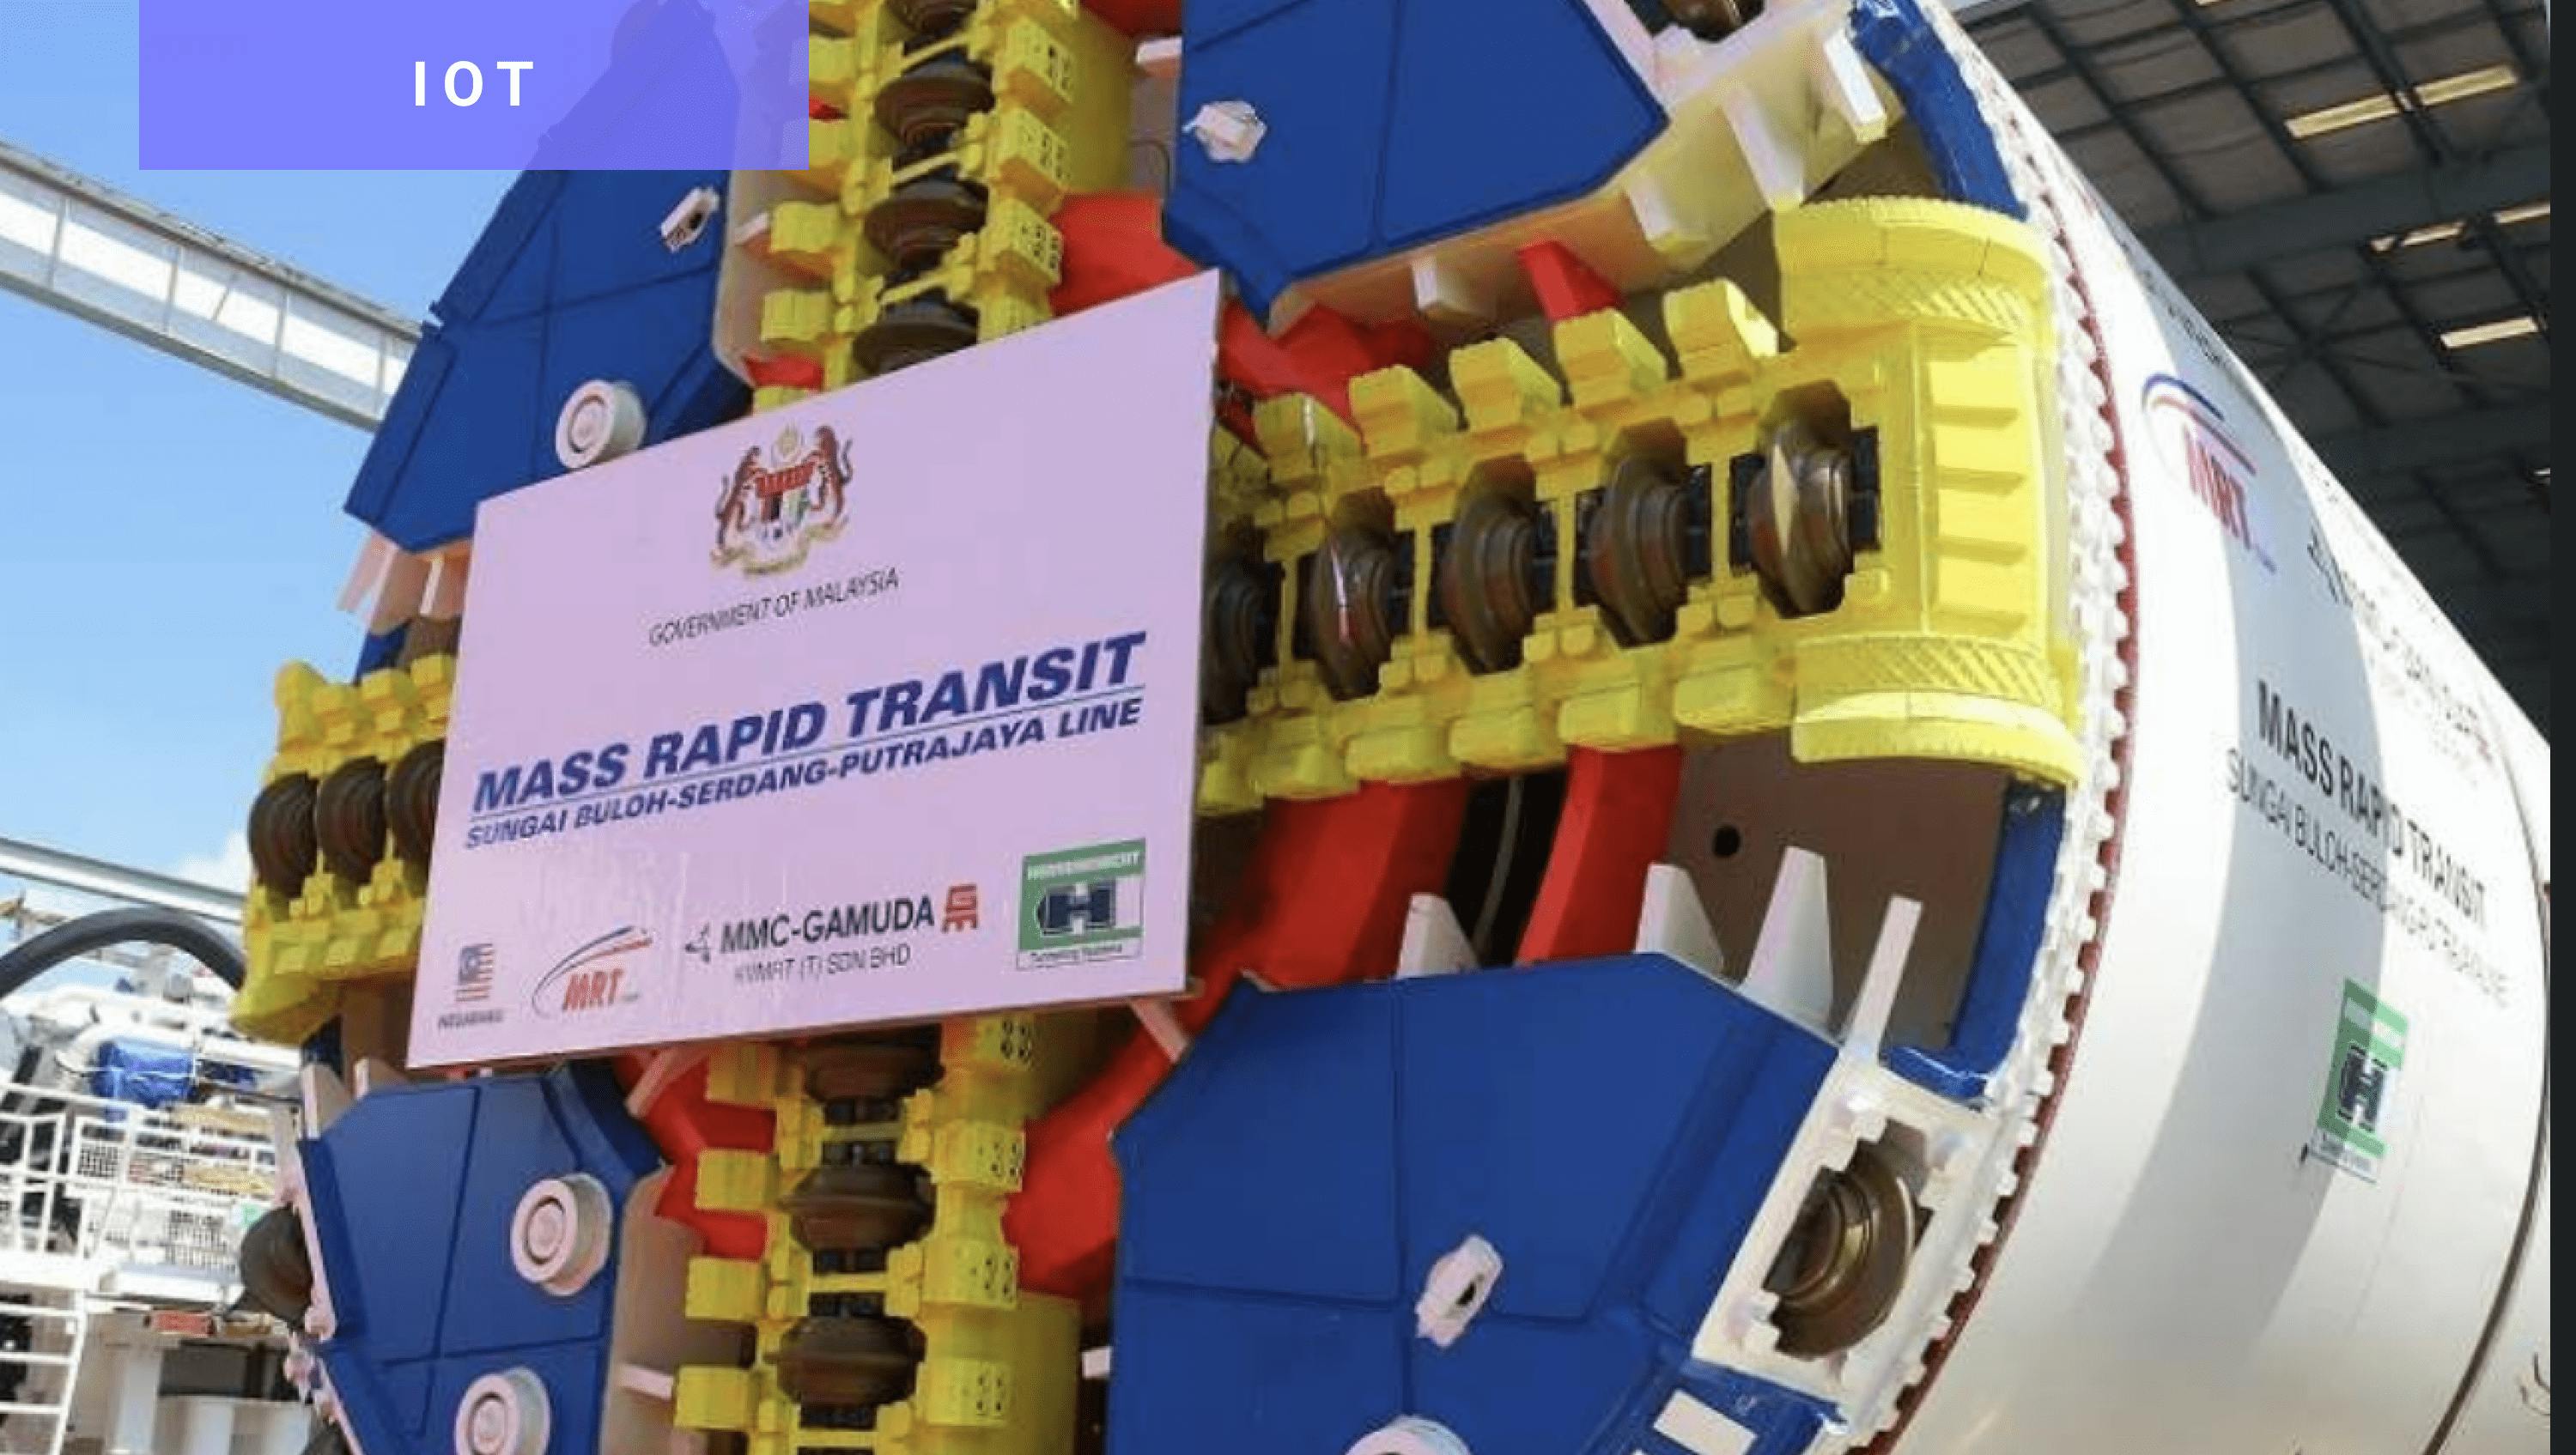
Gamuda develops tunnel boring machine IoT solution with Dash
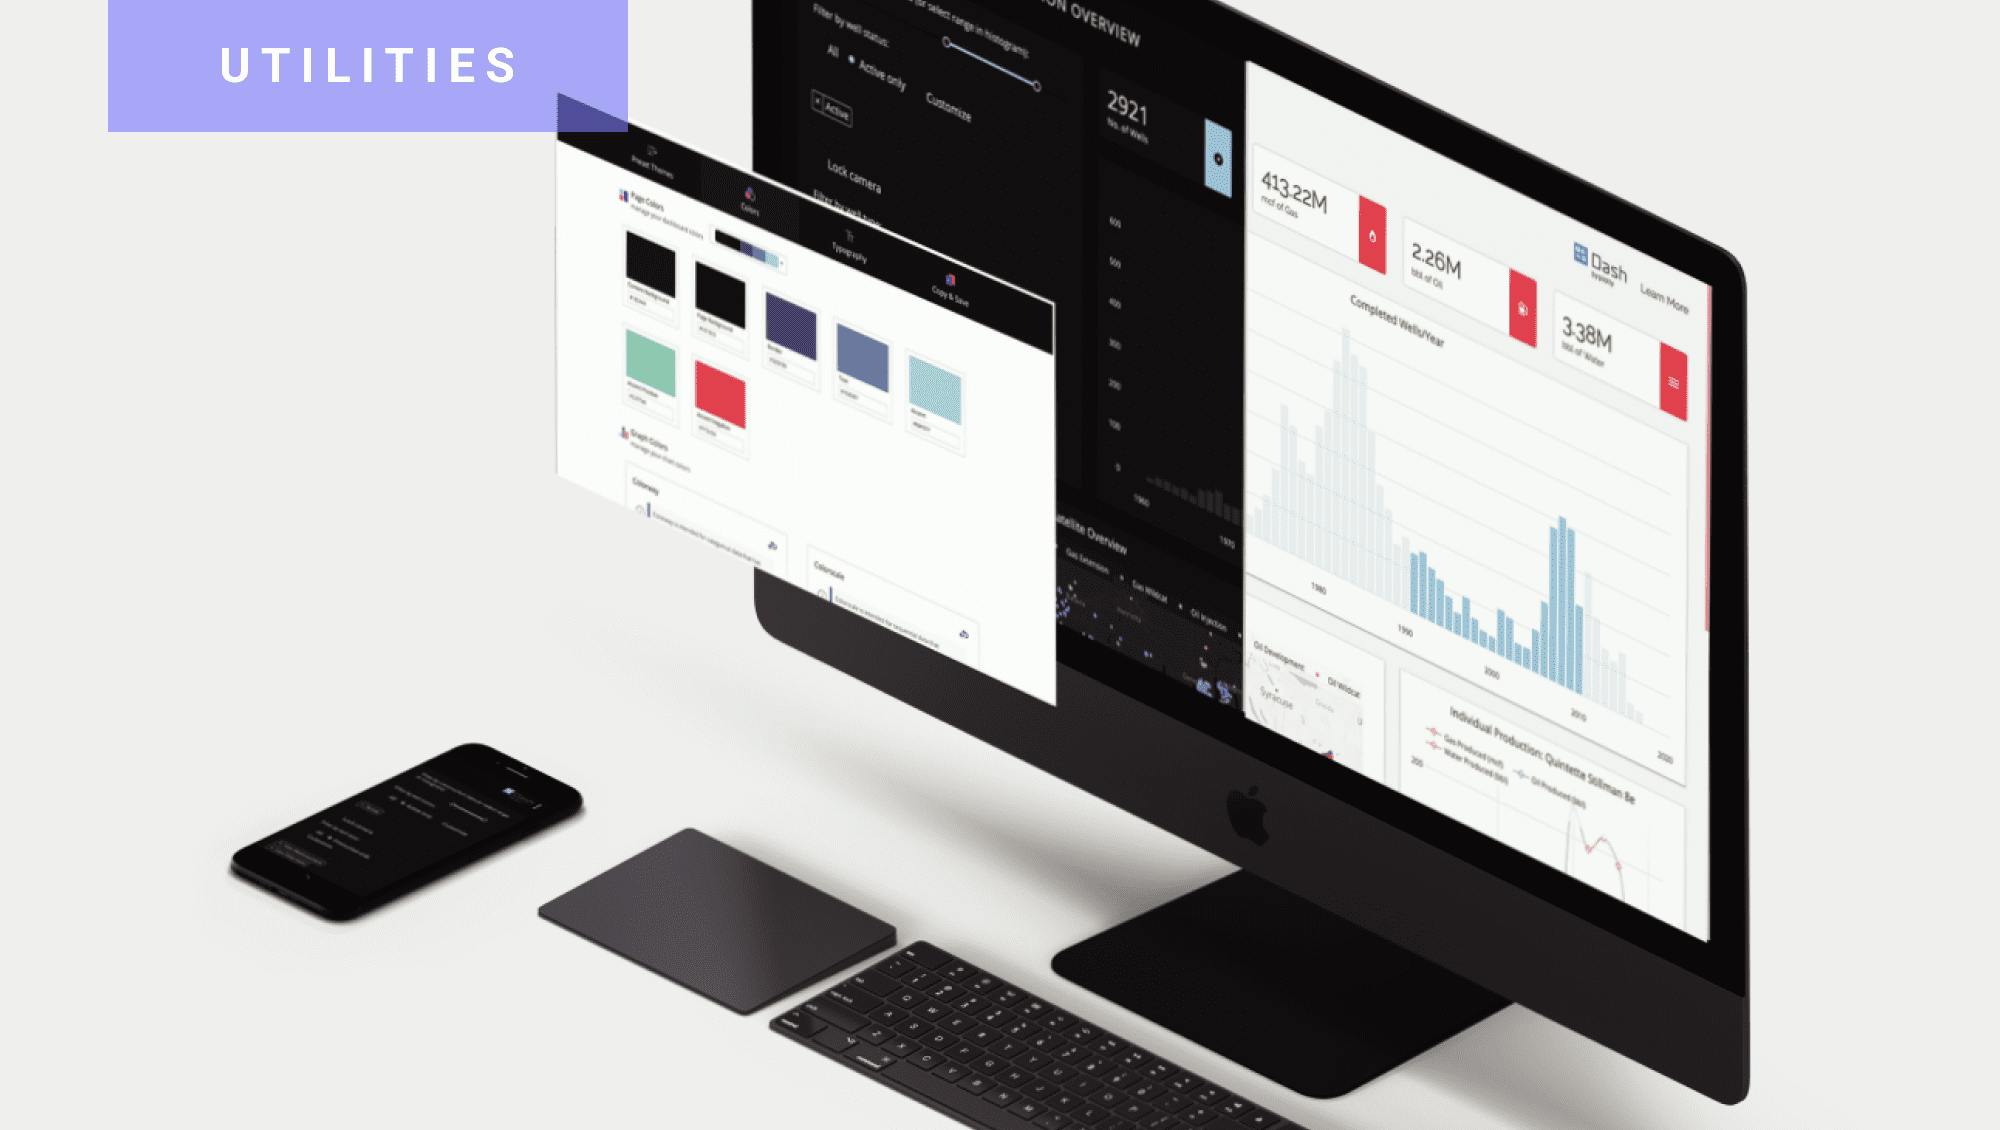
Public utility organization reduces work order overdue rate by 87% with Dash