
SOPRIS TECHNOLOGIES Builds Scalable Reporting Engine with Plotly Dash Enterprise
Industry
Telecom & Entertainment
Infrastructure
GCP
Summary
- SOPRIS TECHNOLOGIES uses Dash Enterprise to automate the generation of interactive, large-scale PDF reports, delivered monthly to thousands of enterprise customers via its Managed Service Providers.
- Automation drastically reduces manual workload while preserving deep customization for each client.
- PDF reporting complements SOPRIS Moneytoring™ Suite of Services, which is built and operates in Google Cloud and supports seamless analytics and large-scale AI services.
Introduction
SOPRIS TECHNOLOGIES, INC., based in the USA and operating a wholly owned subsidiary in Mexico, is a leader in providing advanced monitoring-based services focused on helping enterprise customers, across the Americas and beyond, continually measure and improve the service experience delivered to its end users.
The flagship solution, Moneytoring™, helps businesses optimize the performance of their end-to-end service delivery performance to ensure the best-in-class customer experience, achieving operational performance and maximizing ROI. SOPRIS collaborates with major Managed Service Providers, each delivering monitoring services to 1,000s of multinational enterprise customers, to distribute its suite of Moneytoring™ services at large scale.
SOPRIS Moneytoring™ services are backed by a leading team of data science professionals which specializes in business and operational processes and can identify areas of continuous improvements which are reported to its customers in a continuous frequency, through sophisticated, user-friendly reports with granular and actionable detail to help customers achieve the potential improvements for their services.
Challenge
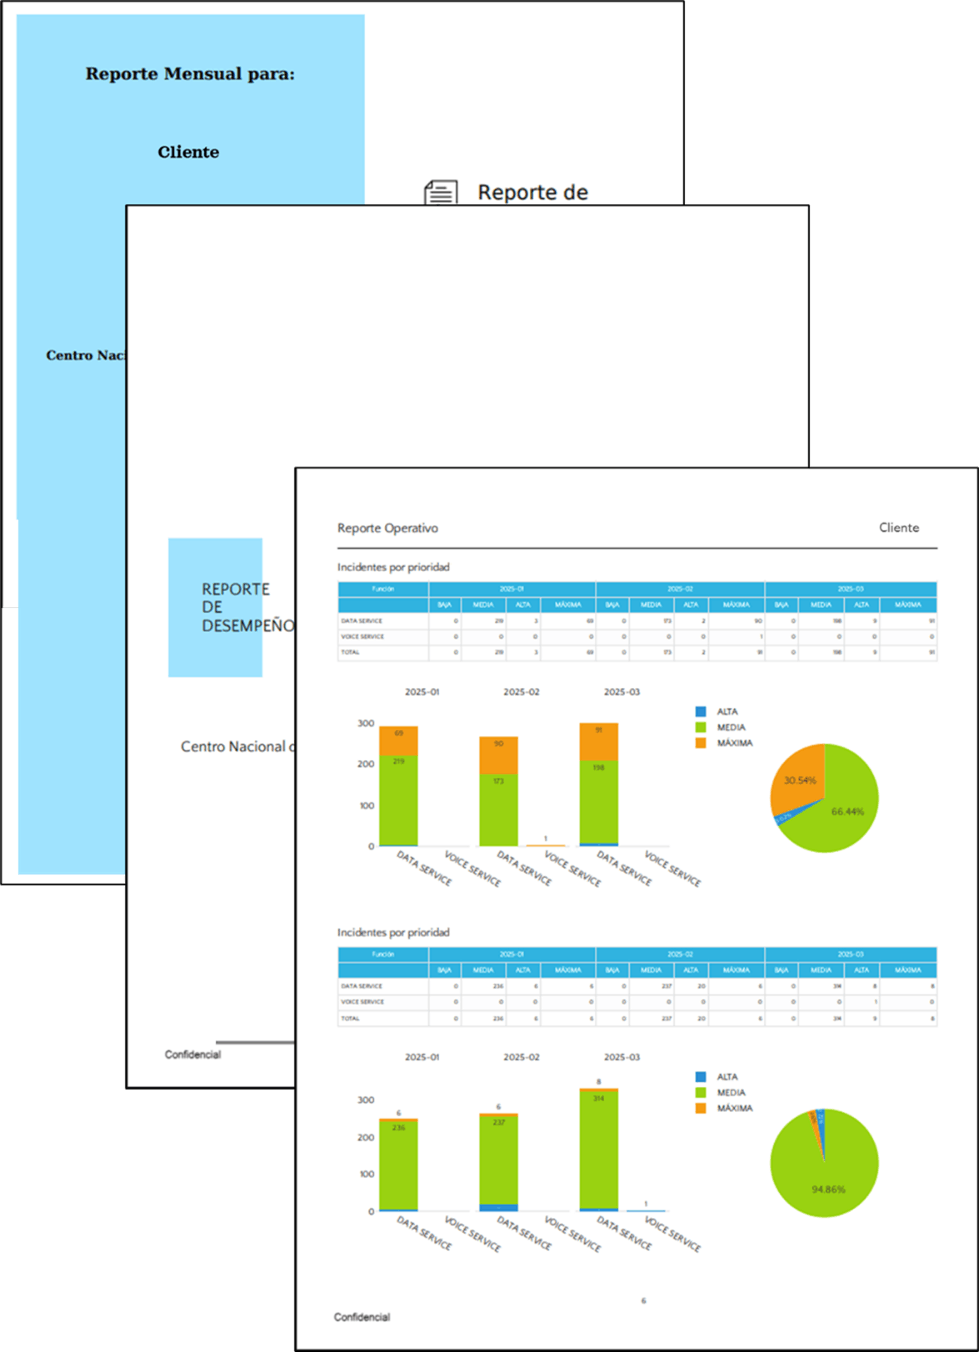
The SOPRIS team faced the challenge of delivering monthly performance reports, consisting of hundreds of pages, with multiple attachments such as excel files, and to be generated over the first two days of each month and to be scalable for delivery to 1,000s of enterprise customers across the Americas. Their initial solution relied on manual workflows and Looker Studio, which could not handle the complexity of large datasets and PDF exports with detailed tables. This process was resource-intensive, prone to errors, and difficult to customize, limiting their ability to deliver consistent, high-quality insights on a large scale.
Solution
To address this challenge, SOPRIS explored off-the-shelf solutions but found none that met their complex scalability and customization needs, and decided to build their own solution for which they adopted Dash Enterprise as part of a core environment. With Python, Dash, and Plotly’s visualization capabilities, SOPRIS created an integrated, automated, reporting environment, along with templates that streamlined the report generation process.
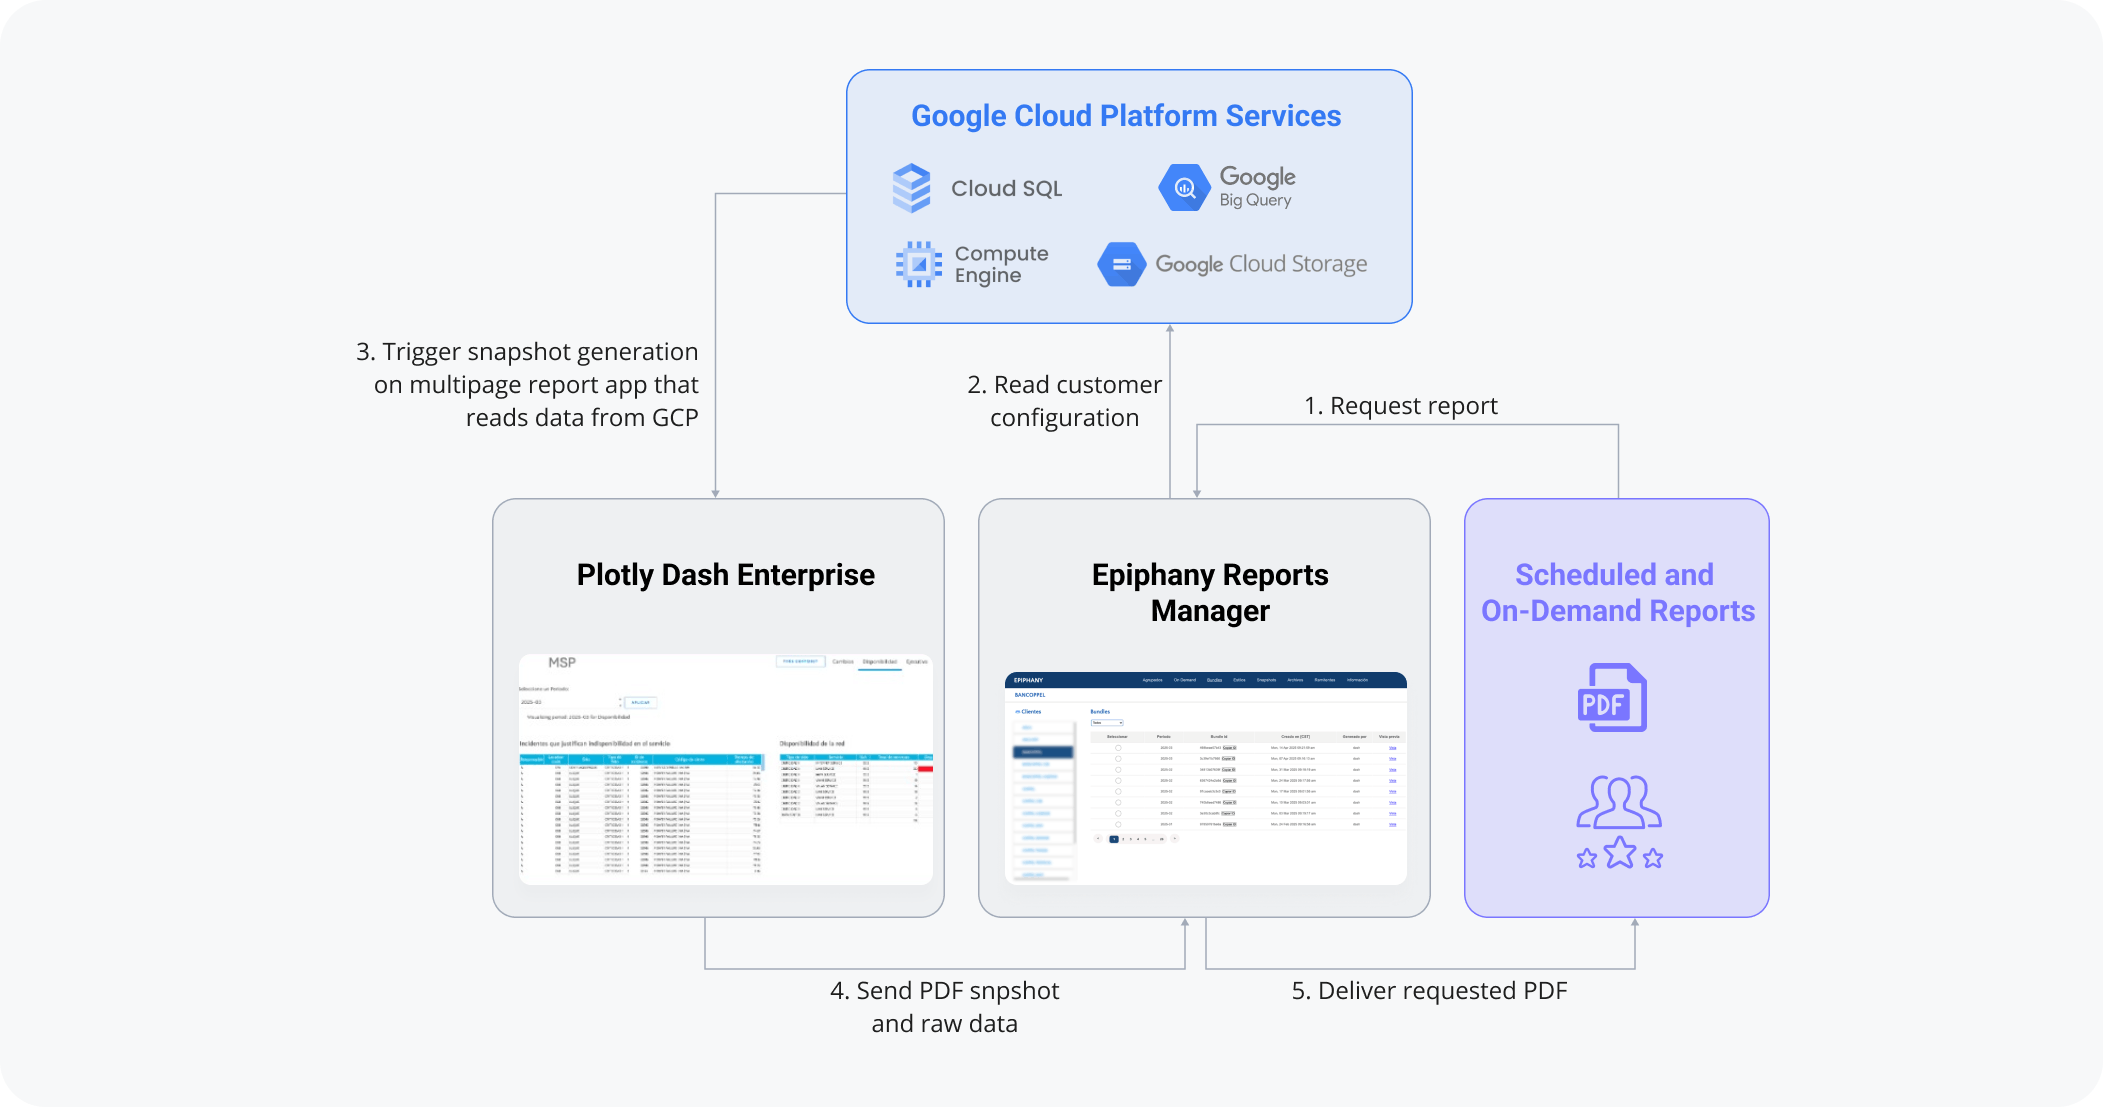
Each report consists of multiple chapters, including nested chapters (for example, to cover the organizational structure of a customer), integrated into a single PDF, and a variable number of Excel attachments, varying by customer, with data pulled directly from Google Cloud and BigQuery and processed seamlessly within their Google Cloud environment.
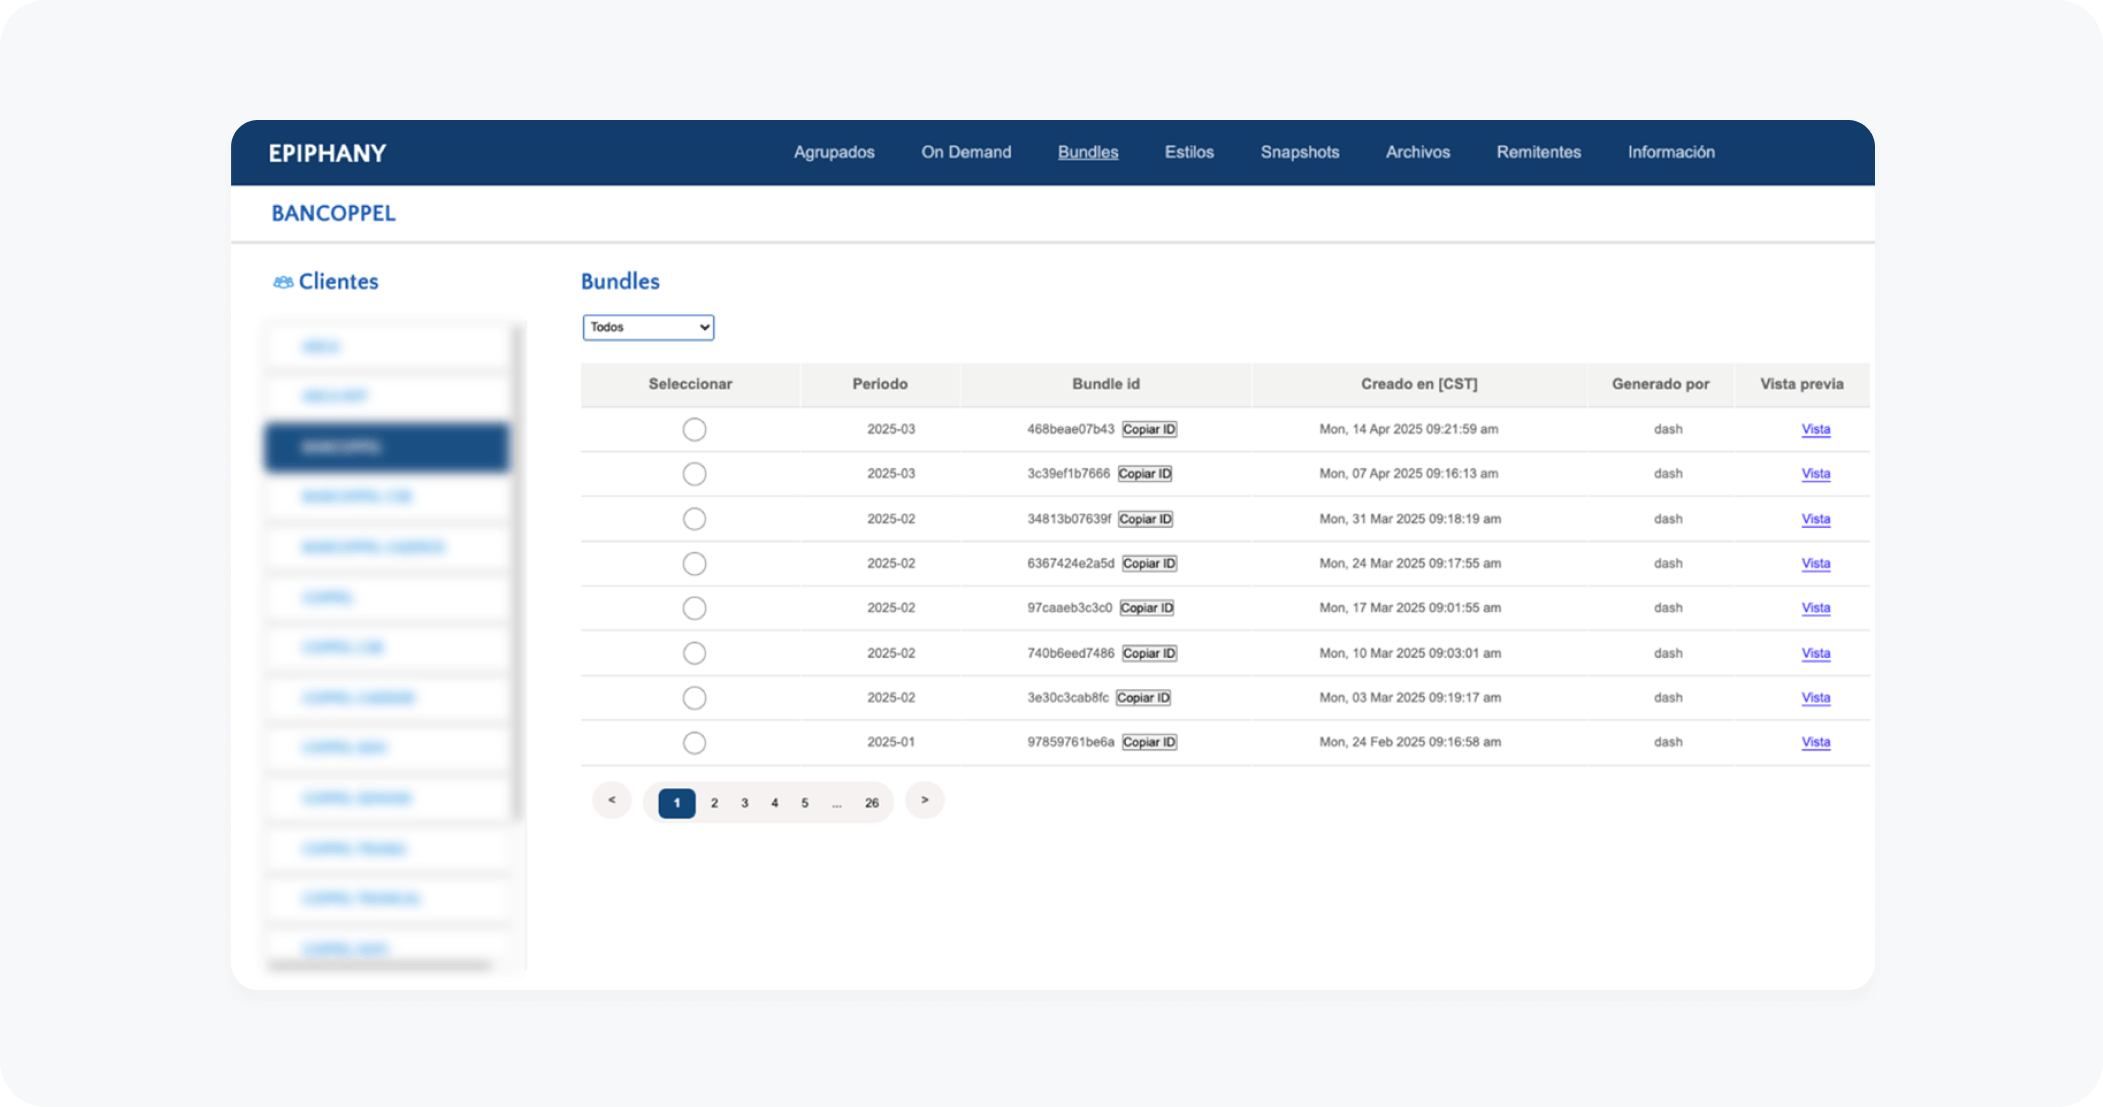
An internal Dash data app orchestrates the process and triggers snapshot generation for each chapter, consolidating them into a polished PDF with the click of a button. Parameters in the app allow customization for each customer without duplicating work, making it easier to maintain consistency while tailoring content to individual needs.
““Dash Enterprise gives us the flexibility, control, customer customizability, and scalability we need to deliver high-quality, interactive reports at large scale every month — something no other tool could match.””
Julio Sanchez Hernandez, Architecture and Development, SOPRIS TECHNOLOGIES
The result is a system that smoothly generates a variety of customer tailored reports on the first day of each month, reducing manual effort and ensuring timely delivery. Customer teams then utilized the data to identify and implement improvements to their business process.
Results
By switching to Dash Enterprise, SOPRIS achieved:
- A 90% reduction in manual workload for report generation, freeing up resources for other strategic tasks.
- High-quality, multi-page PDF reports customized for 1,000s of multinational enterprise customers monthly.
- Improved scalability, with the ability to handle high-frequency, high-volume data across multiple regions.
- Enhanced reporting flexibility, enabling integration of a wide range of interactive charts and visualizations.
Looking ahead, SOPRIS is exploring ways to expand its Moneytoring™ services and capabilities, leveraging Dash Enterprise to integrate more advanced visualizations and deliver even greater value to its customers.
About SOPRIS TECHNOLOGIES
SOPRIS TECHNOLOGIES, based in the USA and operating a wholly owned subsidiary in Mexico, is a leader in providing advanced monitoring-based services focused on helping enterprise customers, across the Americas and beyond, continually measure and improve the service experience delivered to its end users of a business process. SOPRIS has embraced the vision to transform the traditional monitoring and observability market into an end-user service and business centric focus.

More user stories like this

Broadband Insights Helps ISPs Build Smarter Networks with Custom Analytics Platform

Predictive Analytics at Multinational Telecommunications Firm Accelerates Digital Transformation with Dash Enterprise

National Renewable Energy Laboratory Mobilizes Dash for Wind Turbine Wake Research