AI data analysis that actually works
Built on ten years of Plotly expertise, with checks that catch errors and add domain knowledge, so you get reliable data apps instead of messy AI code that breaks.
See hidden insights in any data source imaginable
Detect patterns and unexpected relationships across domains and variables, producing visualizations that expand how you explore your data. Connect to any data source imaginable, dynamically. Data warehouses, APIs, legacy systems; if Python connects, so can you with Plotly Studio.
Your data, two minutes
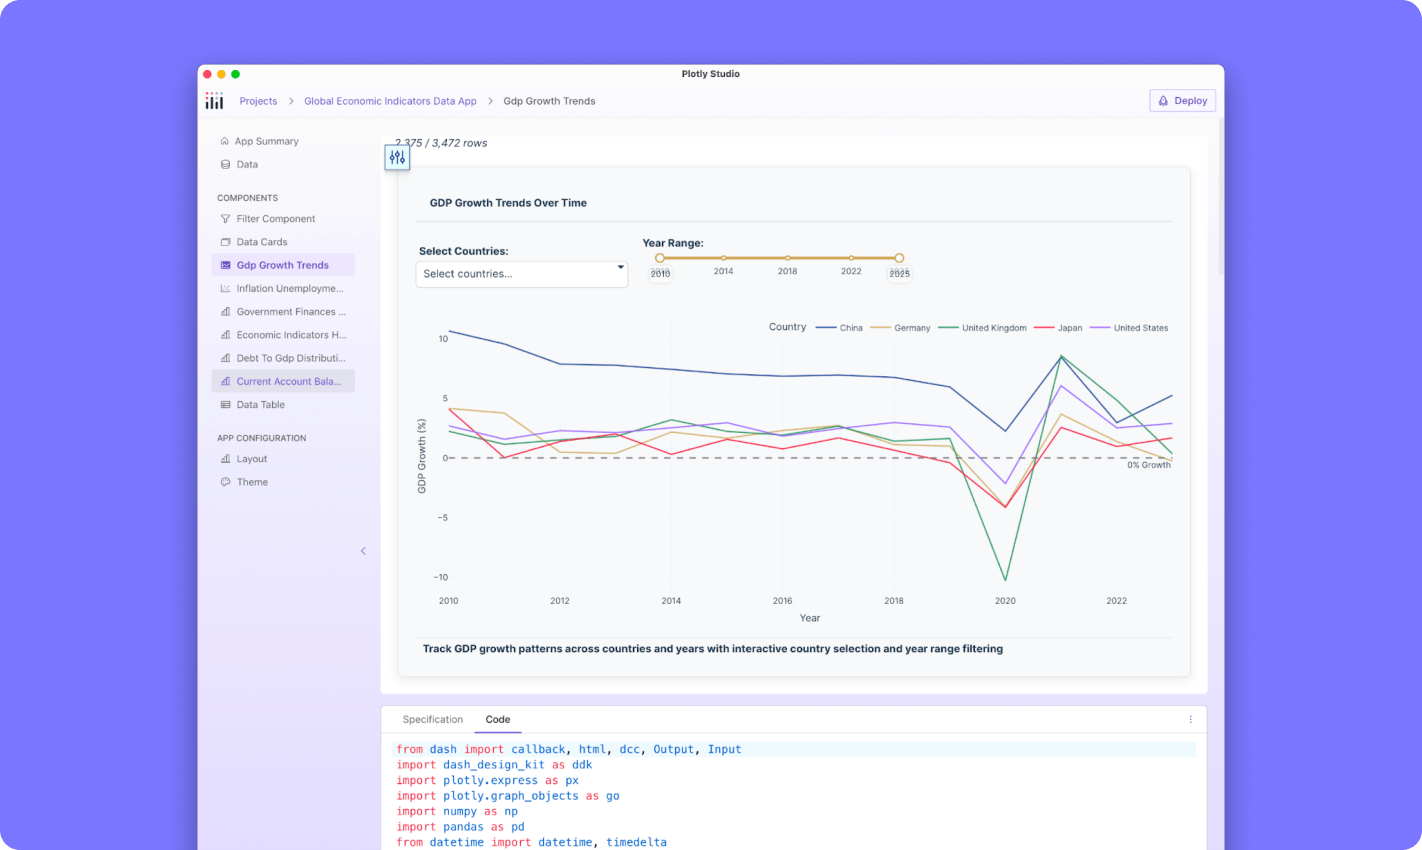
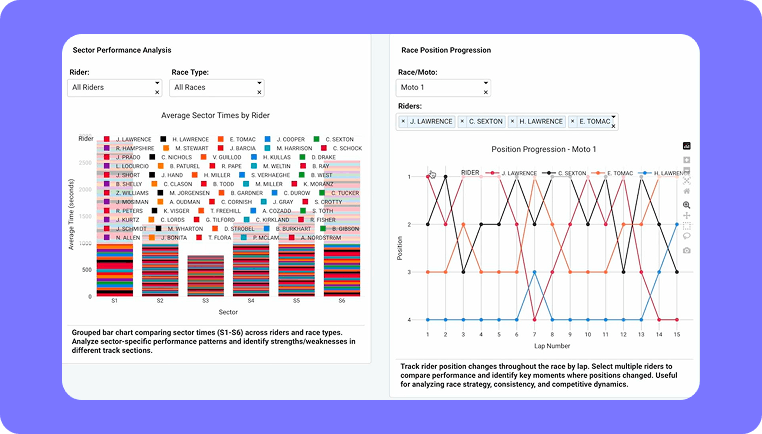
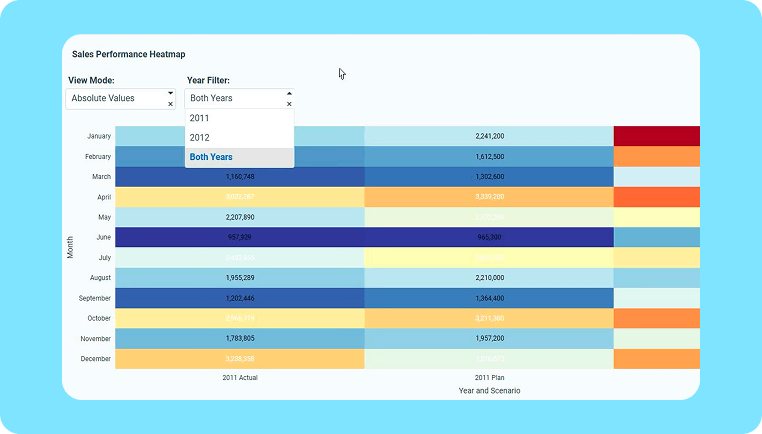
AI-generate complete applications and dashboards from your data in minutes. Get multiple data visualization perspectives, interactive controls, and professional theming backed by production-grade Python code.

Your data analysis deserves an audience
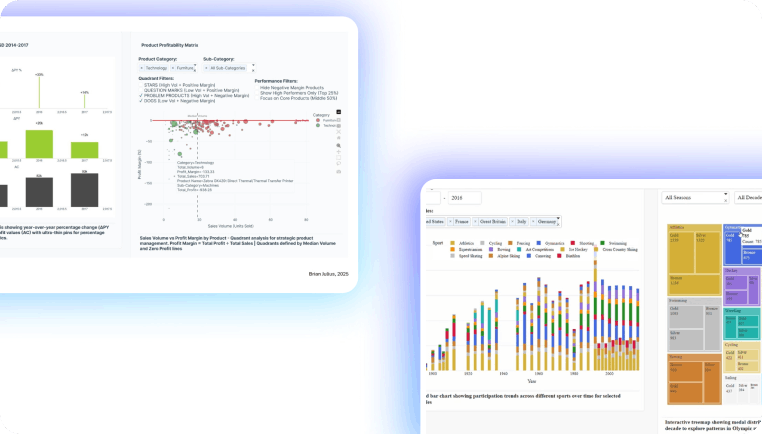
Go from insight to impact by sharing stunning, interactive data applications with anyone. See how teams at Berkeley Labs, UK Power Networks, and CIBC publish data applications used by thousands of users across their organizations.
AI-generated data apps in minutes
AI generates endless analytical perspectives automatically from any data source in under two minutes. Domain-specific intelligence suggests visualizations outside your comfort zone.
Spec-driven development
Natural language specifications enable team collaboration, code review processes, and documentation standards. Generate, then iterate easily with plain language prompts you can feed back into the LLM.
Dynamic connections to any data source
Connect to any database, API, or internal system through AI chat, with Plotly Studio generating the code and managing credentials securely.
Production-grade code behind the scenes
Applications structured with proper file organization, separation of concerns, and professional development patterns. Builds better Dash apps than Cursor, Replit, Claude Code, BI tools, Hex, and even our community.
Data visualization AI agents trained by Plotly
10+ years of Plotly data visualization best practices encoded as default behaviors. Rich out-of-the-box functionality: AG Grid, DDK, PDF export.
Simple, rapid deployment & sharing
Self-contained Python runtime eliminates installation and configuration overhead. Publish instantly to Plotly Cloud or Dash Enterprise for sharing insights at scale.


