
Principal Asset Management builds a scalable real estate forecasting platform with Plotly, AWS, and Snowflake
Industry
Financial Services
Integration
Snowflake
Infrastructure
AWS
Summary
- Principal’s Real Estate Data Strategy and Analytics team built an internal real estate forecasting platform that supports over 140k model outputs across 2k combinations.
- A Dash application serves as a central interface for research and investment professionals to examine market performance and risk, evaluate model portfolios, and explore ML-based internal forecasts that will integrate with LLM services
- The system has reduced engineering overhead, improved feedback loops, and enabled higher-quality collaboration between investment researchers and end users.
Introduction
Principal Financial Group is a global financial services organization headquartered in Des Moines, Iowa, focused on helping individuals and businesses in Asia, Australia, Europe, Latin America, the Middle East, and North America build and protect their financial well-being. The company has been in the financial services industry for nearly a century and a half, boasting an impressive track record in Retirement and Income Solutions, Benefits and Protection, and Asset Management.
Within its Asset Management division, Principal Real Estate Investment’s Data Strategy and Analytics (DSA) team supports investment teams with quantitative research and data-driven products and solutions to enhance investment performance. These solutions enable investment professionals to access relevant and reliable insights that guide their investment decisions. The team comprises engineers, quantitative researchers, developers, and analytics professionals who collaborate globally to operationalize advanced analytics and artificial intelligence (AI) models, delivering actionable insights.
Challenges
The (DSA) team at Principal operates in a macroeconomic environment characterized by rapid policy changes, economic shifts, and evolving regulatory standards. These factors influence asset performance expectations, prompting stakeholders to request that different economic scenarios be considered to assess the impact on internally forecasted market conditions, portfolio performance, and risk.
Before adopting Plotly’s Dash Enterprise, the team relied on a combination of Power BI and front-end development contractors. Power BI lacked the interactivity and flexibility required for modeling and displaying views of the model’s outputs. Internally, there was little front-end development experience, with much of the team working primarily with Python back-end infrastructure
To support faster iteration and enable the team to collaborate more effectively without bottlenecks, the team opted to develop internal web apps using Plotly. This approach alleviated the heavy reliance on contractors. It also significantly increased the speed-to-delivery for the team by unlocking the ability of most of their developers to quickly stand-up user interfaces and iterate with decision-makers in a way that builds confidence.
Solution
To meet the demand for rapid, scenario-driven analysis, Principal's real estate analytics team built a flexible architecture that connects data engineering, modeling, and visualization. Forecasts are generated by pulling data from internal systems and third-party sources, cleaning and processing it through AWS-based pipelines, and loading it into Snowflake (Figure 1). In one of their modeling solutions, an AWS process trains with the processed data to produce individual forecasts for over 70 markets, 18 different property and sub-property types, and several potential economic scenarios. From there, Dash applications present the results in ways that researchers and portfolio managers can explore interactively.
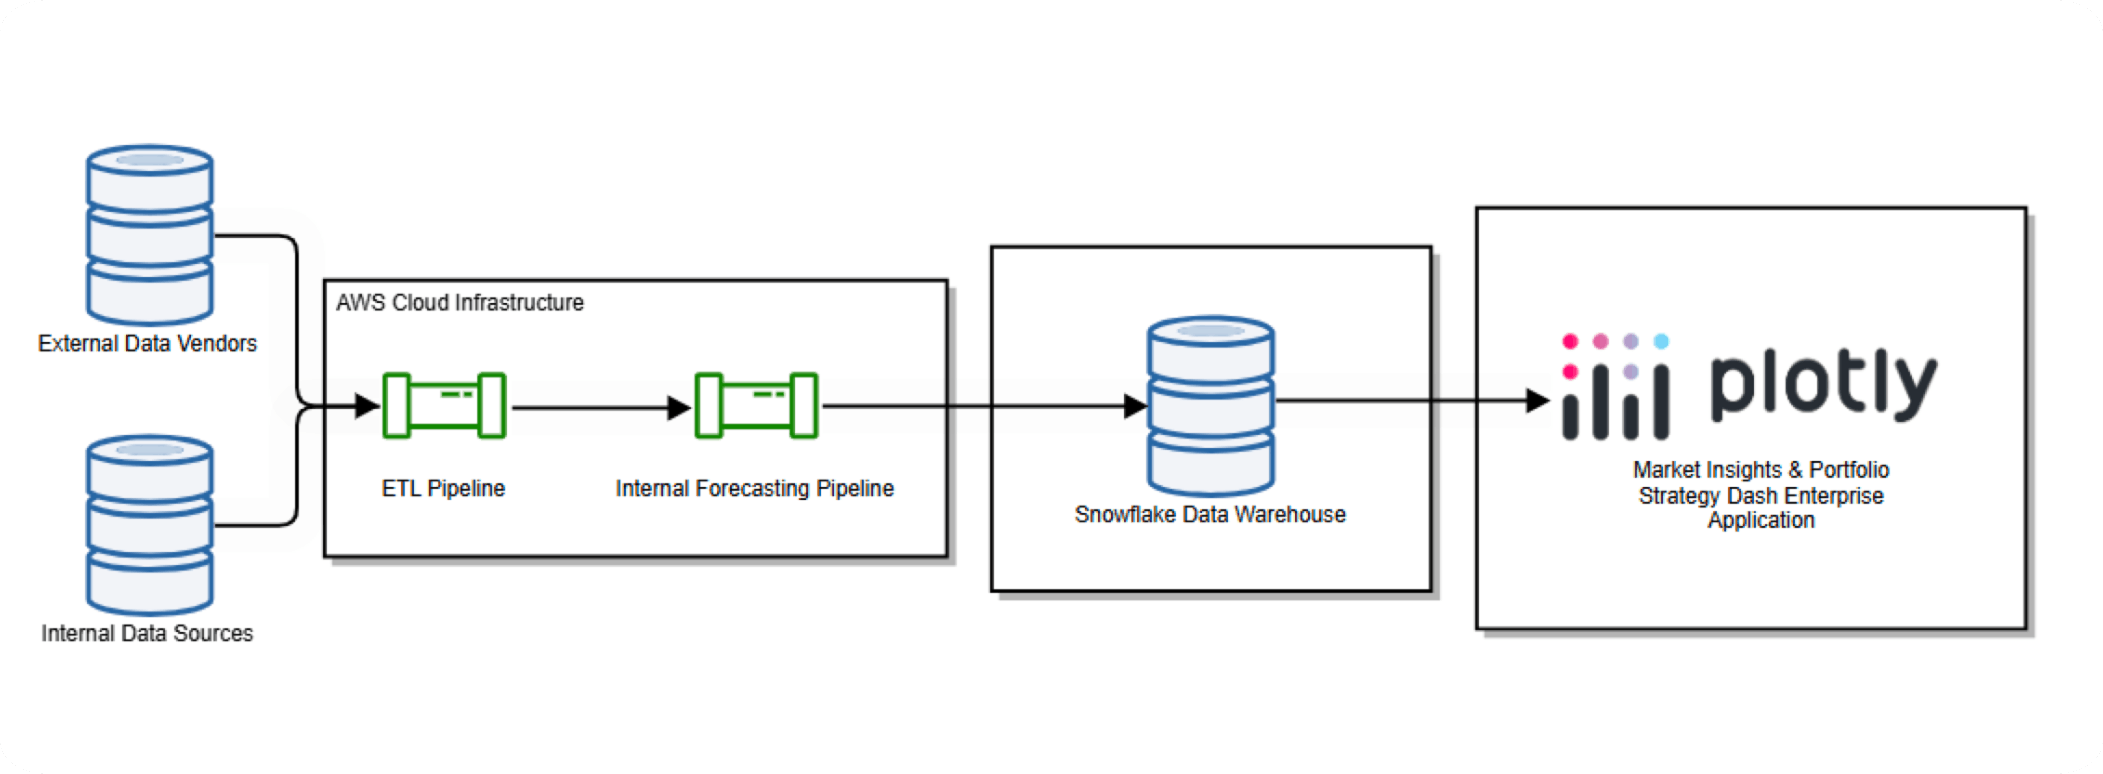
Exhibit 1: MIPS high-level architecture diagram
The team maintains development, staging, and production environments to ensure that changes do not disrupt end users. The forecasting process generates over 140,000 model outputs, which are then displayed in the Market Insights & Portfolio Strategy (MIPS) Dash application (Figure 2), the team's central internal web portal. This web portal includes charting, drilldowns, and integrations with cloud-based modeling services.
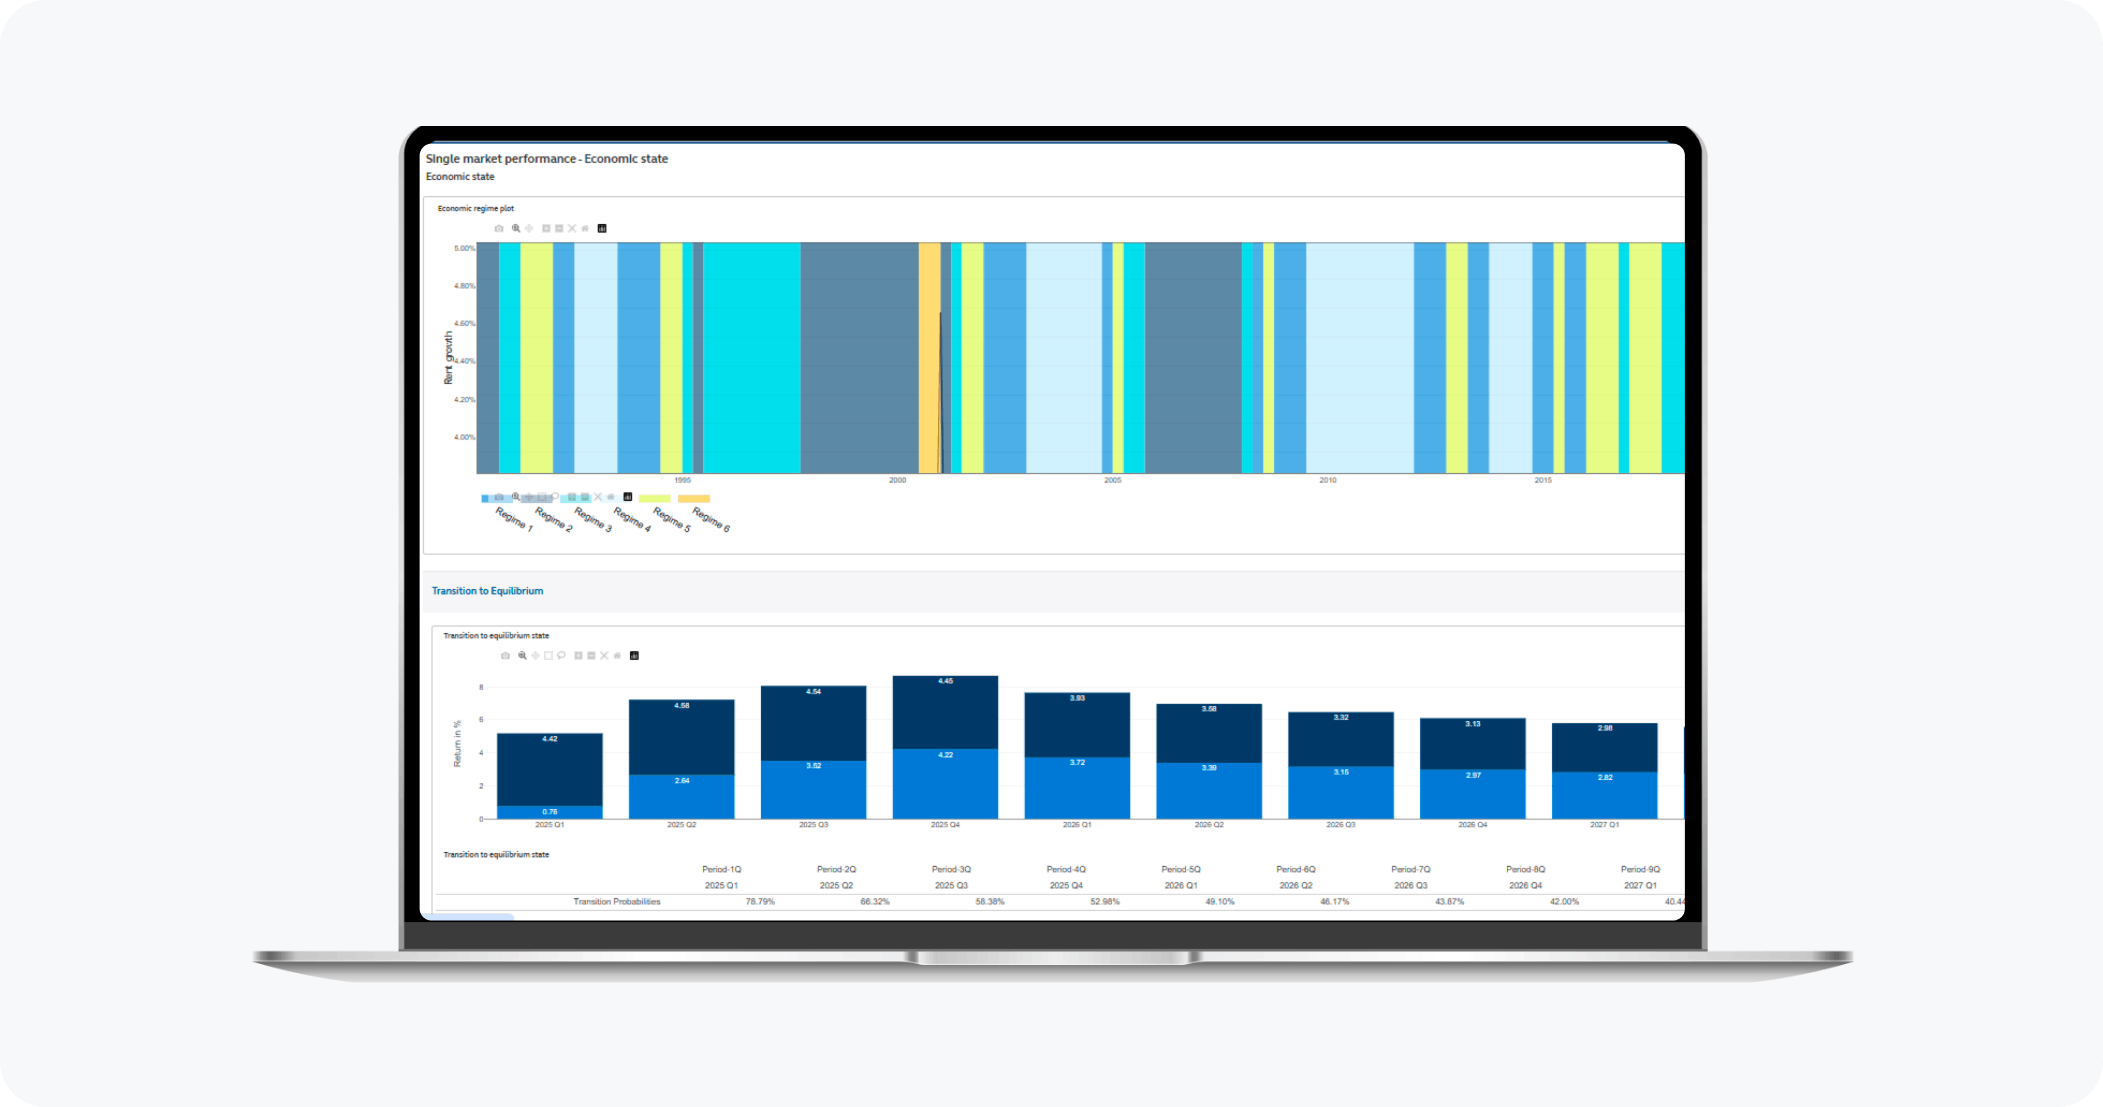
Exhibit 2: MIPS Economic State Model output screenshot
Within MIPS, portfolio managers can simulate allocations across markets and property types, then export the results to Excel for further analysis. Research professionals can also adjust forecast variables through a secure overlay interface, which writes custom inputs back to Snowflake without affecting global models. The system allows granular control over access, and user-specific changes are handled with strict governance through AWS APIs.
To support performance at scale, the team utilizes Dash Enterprise middleware (Redis) to cache frequently queried data and selectively preload high-interest datasets. The DSA team is also experimenting with AI summaries generated through an internal LLM platform using AWS Bedrock and Q, to provide investment teams with deeper insights beyond charts and data.
Plotly Dash Enterprise enables the Data Strategy and Analytics team to rapidly prototype applications directly in Python before handing them off to front end engineers for scaling and putting into production.
Results
The team’s approach made the speed to delivery and adoption of its solutions faster, more transparent, and easier to act on. Instead of long feedback loops or one-off report requests, researchers and portfolio managers now access forecasts, test scenarios, and generate insights directly within a single application.
“We are trying to learn what is useful (or not) at an accelerated pace while working closely with our stakeholders. Being able to quickly iterate and gather feedback on a flexible web development platform like Dash is critical”
Wesley Brueland, Principal Asset Management
What began as an effort to present modeling outcomes and quickly iterate on feedback has evolved into a scalable, self-service system that balances flexibility with governance.
- Dash apps now serve approximately 60 to 75 internal users throughout the organization
- The team maintains 10+ long-living real estate apps, many running for over two years
- Their forecasting system produces 140,000 model artifacts across 2,040 combinations and nine economic scenarios
- Users can interactively simulate model portfolios, export results, and adjust forecast outputs directly
- Engineering load has decreased as quant researchers and data scientists produce higher-quality Dash code with fewer refactor cycles
This setup has given the team more time to focus on improvements, new research, and better user experiences. By combining production-grade tooling with approachable code and AI-assisted workflows, the Principal Real Estate Data Strategy and Analytics team has built a durable foundation for decision support in a high-stakes, data-rich environment.
This article is for discussion and educational purposes only and should not be relied upon as a forecast, research or investment advice, a recommendation, offer or solicitation to buy or sell any securities or to adopt any investment strategy. Opinions expressed are subject to change without notice. References to specific securities, asset classes and financial markets are for illustrative purposes only and should not be relied upon as a primary basis for an investment decision. Rather, an assessment should be made as to whether the information is appropriate in individual circumstances before making an investment decision.
Subject to any contrary provisions of applicable law, the investment manager and its affiliates, and their officers, directors, employees, agents, disclaim any express or implied warranty of reliability or accuracy and any responsibility arising in any way (including by reason of negligence) for errors or omissions in the information or data provided.
This material may contain ‘forward looking’ information that is not purely historical in nature. Such information may include, among other things, projections and forecasts. There is no guarantee that any forecasts made will come to pass. Reliance upon information in this material is at the sole discretion of the reader.
© 2025 Principal Financial Services, Inc. Principal®, Principal Financial Group®, Principal Asset Management, and Principal and the logomark design are registered trademarks and service marks of Principal Financial Services, Inc., a Principal Financial Group company, in various countries around the world and may be used only with the permission of Principal Financial Services, Inc. Principal Asset Management℠ is a trade name of Principal Global Investors, LLC. Principal Real Estate is a trade name of Principal Real Estate Investors, LLC, an affiliate of Principal Global Investors.
Plotly, AWS, and Snowflake are not affiliated with any member of the Principal Financial Group.
More user stories like this

S&P Global Market Intelligence Powers ‘Workbench Data Apps’ Commercial Offering using Plotly with Databricks

CIBC Drives ML-Powered Quant Analytics with Plotly Dash Enterprise and Databricks

PriceLabs creates custom platform for vacation property management analytics