

Dr. Reddy's Laboratories Automates Pharmaceutical Regulatory Reporting with Plotly

Industry
Healthcare & Life Sciences
Summary
- The Digital Transformation team at Dr. Reddy's has built a solution that automates reporting to simplify the stringent documentation of the pharmaceutical manufacturing process to meet FDA regulations.
- The team also uses Plotly, integrated with the Mendix platform, to power critical and effective sales strategies for multiple departments across the organization.
- The use of Plotly with Mendix eliminated a manual report-generation process requiring multiple team members to work on Excel and Minitab.
Introduction
Dr. Reddy's Laboratories is a multinational pharmaceutical company headquartered in India and specializing in manufacturing affordable generic drugs. The company has a presence in almost 50 countries, with manufacturing operations in North America, Latin America, Europe, and India — and R&D primarily taking place in India.
The digital transformation team at Dr. Reddy's oversees the operations of the company across aspects of the value chain including R&D, manufacturing, and supply chain. The team also manages operations for the biologics business unit which produces biosimilar pharmaceuticals.
The team also plays a role in digital design, from user research to development, prototyping, and iterating digital products that are widely adopted by the +24k-strong organization.
Challenge
The digital transformation team at Dr. Reddy's faced challenges with a highly manual and time-consuming report preparation process. Reports were created using Excel and Minitab, then compiled into Microsoft Word documents.
Data had to be aggregated from multiple systems — the company’s ERP, manufacturing execution systems, laboratory information management systems, and multiple external databases. Moreover, data types ranged from procurement data and material attributes to text-heavy forms and documents.
The combination of manual processes and disparate data sources was not efficient and led to a lack of accuracy in reporting and decision making. To improve these KPIs, the team wanted to automate part or all of the reporting process. Despite reviewing a plethora of options, the team chose Plotly due to its customizable, interactive charts, and its seamless integration with Mendix, a Siemens-owned data analysis platform.
With the addition of Plotly solutions, the team wanted to simplify its processes, reduce costs, and grow revenue for the company.
Solution
The digital transformation team at Dr. Reddy's built a process for synthesizing and presenting market intelligence data, as well as to meet FDA regulatory obligations in documenting manufacturing processes.
“We chose Plotly because we needed to seamlessly integrate task-oriented workflows. Plotly allows us to embed dynamic visualizations within our interface, enhancing the user experience and enabling informed decision-making.”
Md Nasrullah Khan, Senior Principal - Digital product Management, Dr. Reddy’s Laboratories
Data is aggregated in a data lake on a private cloud platform and fed into consumable charts using Plotly and integrated with the Mendix platform for automated report generation. The solution provides an interface for users to explore the auto generated reports more efficiently, while eliminating much of the manual report preparation process.
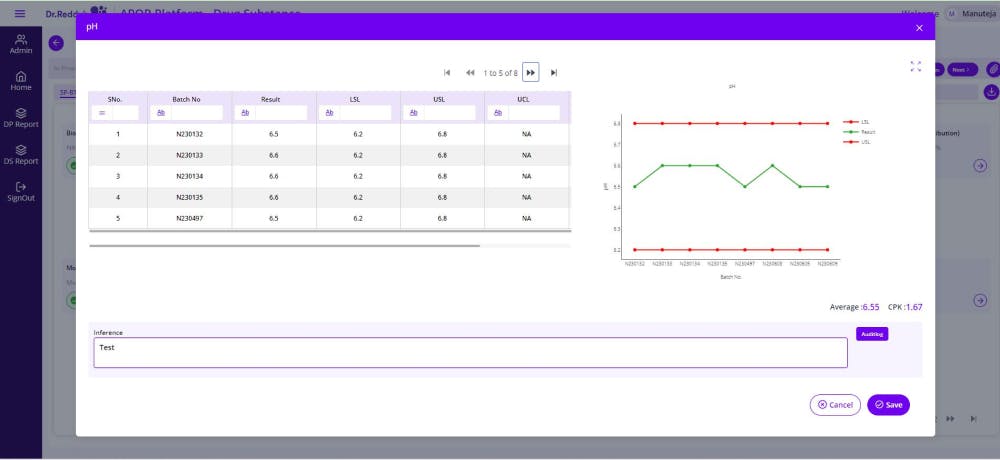
Consumable charts built by the Dr. Reddy's digital transformation team using Plotly.
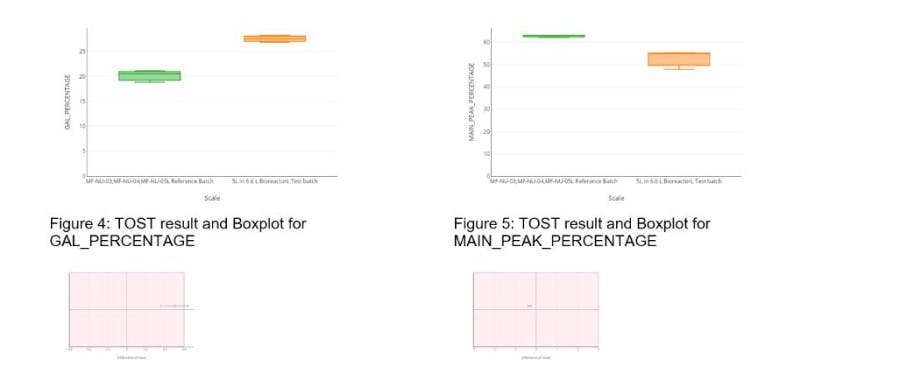
Dynamic charts and visuals programmatically generated using an API endpoint from Plotly.
The visuals are programmatically generated using an API endpoint from Plotly, dynamically displaying the required data for the organization. Users have the option to download reports, which renders the charts in PDF format for further publishing.
Results
Plotly integrated with Mendix enables Dr. Reddy's to support automated delivery of reports for regulatory compliance, as well as competitive intelligence data for more informed sales strategies, and helps the digital transformation team achieve the following results:
- Generate reports for multiple products, utilized by 1,000+ business stakeholders and 14 factory team members across the shop floor
- Achieve above-average adoption of the solution implemented across 14 factories covering four major business units
- Easily create dynamic charts and tables in sync with their sales strategy, so product managers can make and execute strategic decisions efficiently
- Deliver a working solution with elegant, intuitive charts in line with the organizational brand guidelines
About Dr. Reddy's Laboratories
Dr. Reddy's Laboratories is an Indian multinational pharmaceutical company based in Hyderabad, India. The company manufactures and markets a wide range of pharmaceuticals in India and across almost 50 countries, with manufacturing operations in North America, Latin America, Europe, and India.

More user stories like this

Singapore Institute for Clinical Sciences Enables Open Sharing of Health Research with Interactive Data Vault Platform

NovaLabs facilitates access to the most popular CFD methodology for stirred reactor scaling using Plotly Dash

Single Cell Data Visualization in Multinational Biopharma Org’s Fight Against Disease