How Crant Automated AI-driven Insight for Brand Building with Dash
Industry
Technology & Software
Infrastructure
GCP
Summary
- Crant, a leading creative artificial intelligence company reduces its analysis time by 28 hours per week by leveraging Dash Enterprise.
- The Crant team launched InkLantern, an AI platform that processes large volumes of social media data to generate daily metrics and engagement analysis in a multi-page Dash app, helping their customers measure brand love and differentiation in real time by drawing insights from historic, competitor, and benchmark data.
- The application identifies key drivers for user behavior and offers smart recommendations to drive higher social media engagement through natural language processing (NLP), semantic analysis, and computer vision.
Crant Webinar Highlight Reel
Introduction
Crant is a creative artificial intelligence company known for being thought leaders in data-driven marketing analytics, with recent wins for the Webby and the Anthem Awards. The company’s primary focus is on helping brands harness AI to grow their relevance in the most competitive markets.
Marketing teams are shifting focus from performance marketing to brand build- ing and actively seeking ways to incorporate AI for insight-generation. Crant’s solution, InkLantern, helps these teams measure the impact of their brand marketing efforts with metrics such as the proprietary “Brand Love”, which offers a daily overview of brand attractiveness by tracking post volume, interactions, and comment sentiment, incorporating a lookback period of several weeks.
One of Crant’s main goals was to reduce the time spent creating highly custom dashboards and to integrate OpenAI chatbot features to enhance user interaction. This need led the team to adopting Dash Enterprise to build tailored and scalable dashboards with greater efficiency.
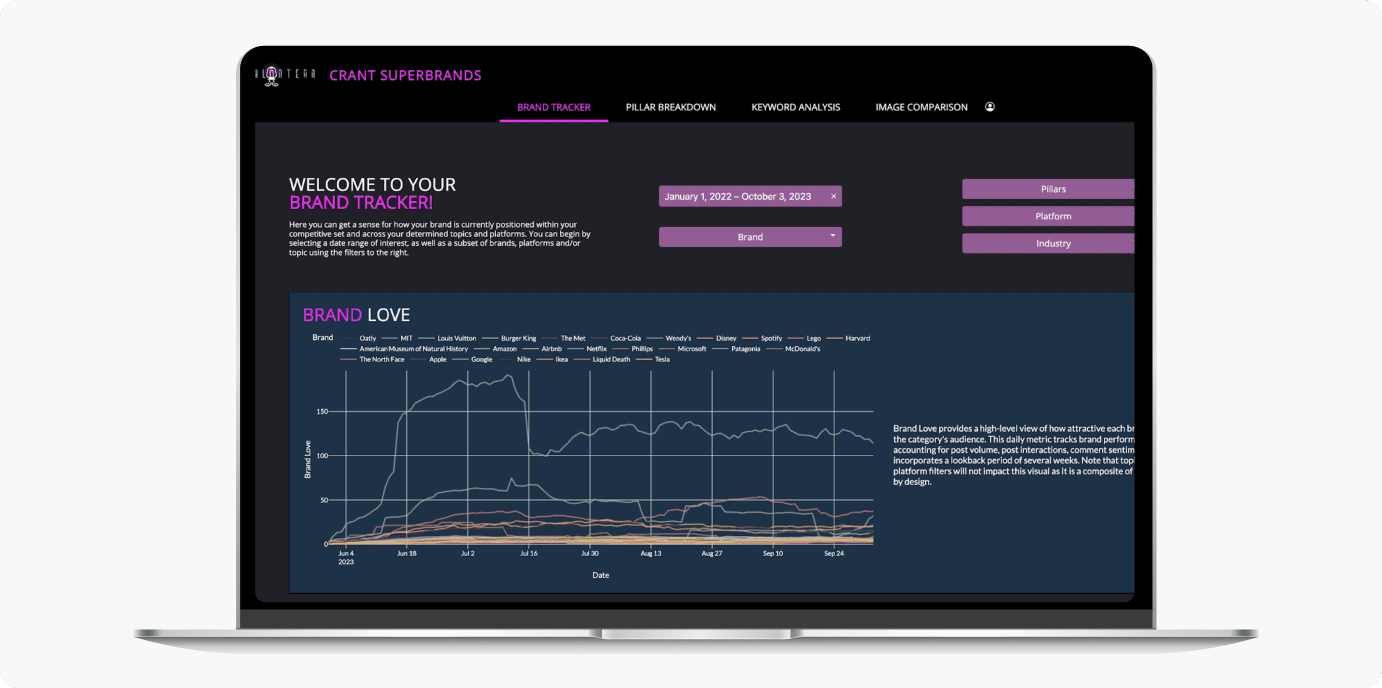
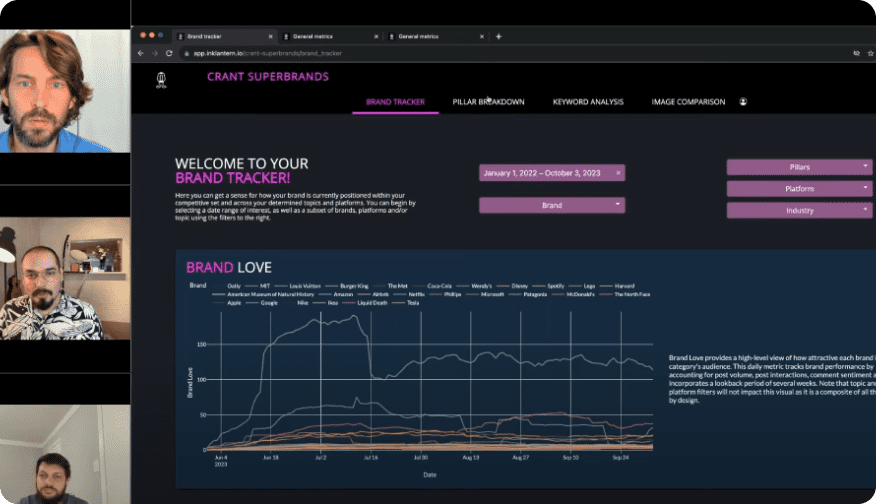
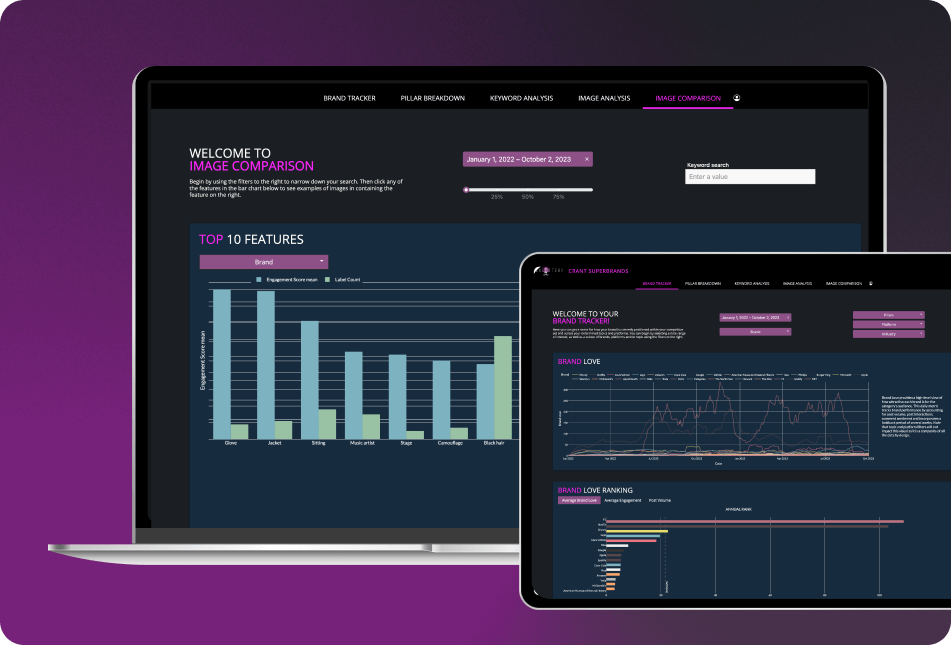
Brand tracker dashboard: the Brand Love performance tracking view within the InkLantern platform.
“With Dash Enterprise, our efficiency skyrocketed. We slashed 28 hours of complex analysis time each week, helping Marketing teams focus on creating stronger brands. We were able to provide AI driven recommendations to each customer through NLP and Computer Vision analysis based on massive social media datasets. And, the insights we've gained are mind-boggling — visualizing Brand Love from various angles. We're now on a continuous growth trajectory, replicating dashboards effortlessly.”
Alvaro Melendez, Co-Founder & CEO, Crant
Challenge
Brand performance is notoriously difficult to quantify and measure.
The analytics team at Crant needed to build a dynamic tool offering AI insights, enabling their customers to better analyze large amounts of social media data and ultimately calculate the ROI of marketing investments in brand building.
As the company’s customer base and global recognition continued to rapidly grow, the Crant team began creating highly customized dashboards for individual clients. The process of customizing dashboards for each user quickly became repetitive, time-consuming, and difficult to scale as the company continued to grow. The team faced challenges working with disparate large datasets across platforms, multimedia, and sentiments hidden within engagements and reactions.
Google’s Looker Studio, their previous tool for creating these interactive dashboards, lagged behind in accommodating the ever-changing sentiment data as well as fluctuations in high-volume social media engagement data representing multiple industries.
Crant needed a comprehensive solution that could empower the company to build custom dashboards that combined disparate, unstructured data from different platforms at scale and allowed customers to access and interact with the detailed results of brand sentiment analysis.
Solution
With a strategic switch to Dash Enterprise, Crant built InkLantern — an AI platform showcasing dynamic dashboards — for visualizing data and automating the deployment of multiple customer-specific dashboards. These dashboards shared insights and metrics like Brand Love, Diversity, Equity, and Inclusion (DE&I) metrics, Share of Voice, engagement metrics, sentiment analysis, and image-based intelligent recommendations, utilizing the PPAI (Promise, Pillars, Attributes, Influencers) Brand Model for trackable brand differentiation and relevance.
The Crant team significantly simplified their ETL (Extract, Transform, Load) pipeline and automated their backend workflow, saving development time. They were also able to build reusable, versatile dashboards aligned with customer use cases across industries that transformed complex and unstructured data into measurable social sentiment and other engagement metrics in real time. This allowed them to provide their customers with more actionable insights derived through advanced techniques such as Natural Language Processing (NLP), computer vision, and Large Language Models (LLMs) that could help them improve their brand reputation.
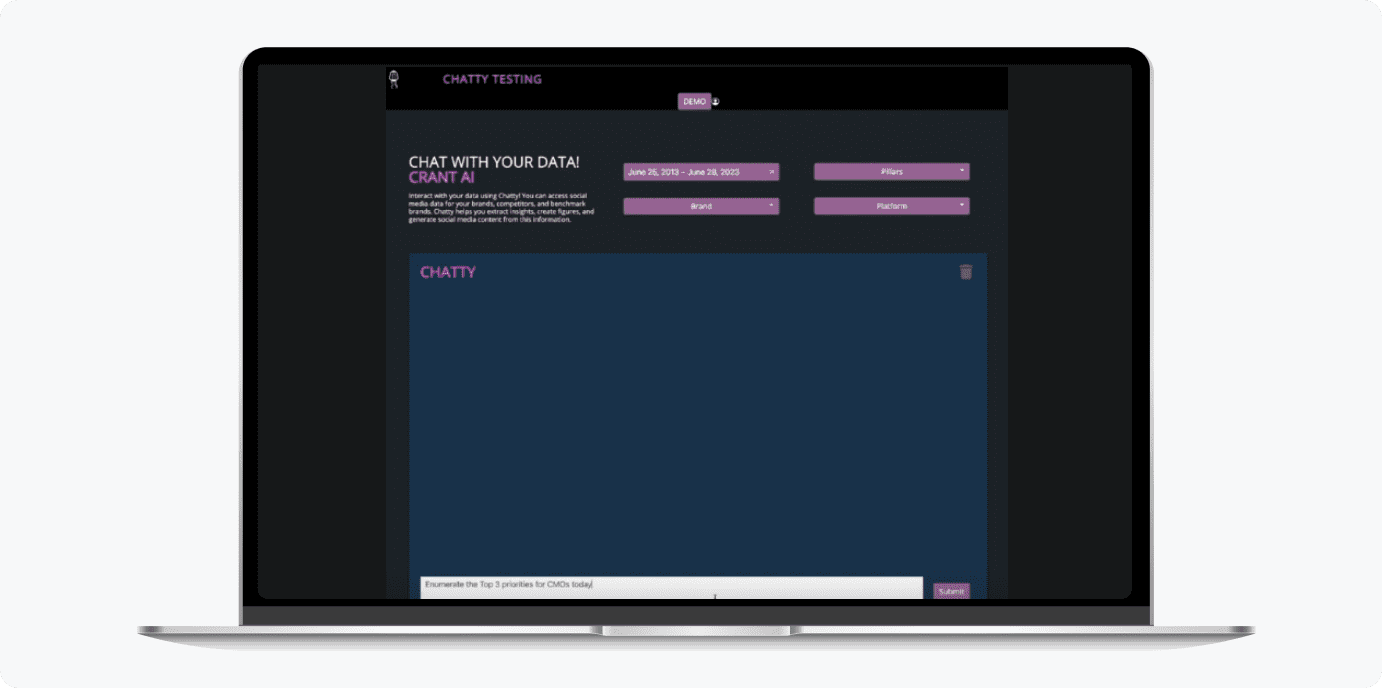
Chatty LLM chatbot to extract insights from social media data.
More specifically, the Crant team determined the language quality and characteristics of social media posts by integrating AI and semantic analysis. They were then able to correlate these insights to engagement-related metrics, pinpointing alternative strategies and alterations to text and images to improve these metrics. A custom NLP pipeline automatically generated pillar and keyword data, refreshed daily or weekly depending on the client’s needs.
The data apps built with Dash Enterprise were key to helping Crant’s customers understand how audiences were interacting with their brand and their competitors. Through insightful brand performance metrics such as pillar engagement, share of voice, top posts, relevant keywords, platform share, and more, InkLantern helped marketing teams attach solid numbers to fluid and hard-to-capture brand sentiment.
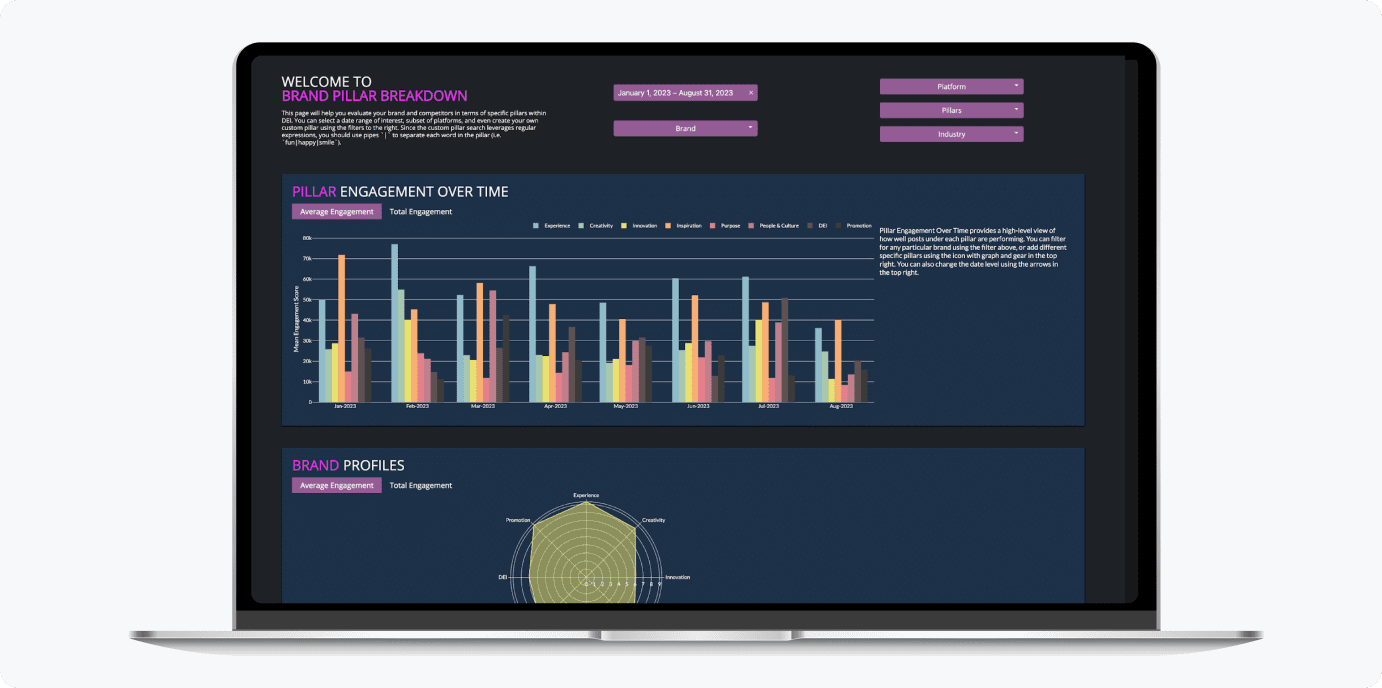
Brand pillar breakdown: one of the dashboards within the InkLantern platform.
Results
- By reducing analysis time by 28 hours per week, Crant was able to streamline the process of measuring brand marketing impact by eliminating repetitive and time-consuming tasks such as manually analyzing brand data.
- The Crant team increased the output of interactive plots 4X compared to their previous reporting solution, allowing customers to interact with data and access customized AI recommendations at scale. The interactive plots also improved interaction with callback upgrades and chatbot integration.
- By visualizing multiple dimensions of the 'Brand Love' metric, Crant gained richer insights. Replicating dashboards instead of building each one from scratch empowered Crant to maintain a focus on sustained growth.
In the future, Crant plans to expand its data sources to include a wider range of social media platforms, in addition to the team's current sourcing of data from Instagram, Facebook, Twitter, and YouTube.
About Crant
Crant, a US-based creative AI company, has rapidly emerged as a leader in the field of data-driven brand building. Located in Miami, Florida, Crant is dedicated to helping brands make a more positive impact on the world through innovative marketing efforts. The company's mission is to enhance brand love, differentiation, and reputation. Its flagship SaaS product, Ink Lantern, enables brands to make impactful, data-driven decisions, rethinking the way they approach brand building. Crant envisions a future where brands harness AI for transformative brand strategies that help make the world a better place for all.
More user stories like this

Gamma Technologies and Plotly Partner on Industry-Leading Simulation Platform
Sidmach launches AI-driven platform built with Dash Enterprise and Databricks

PriceLabs leverages Python and Dash for property management analytics