
Chris Parmer
November 22, 2026
A flood watch app for San Francisco Bay's king tide storm, built on open NOAA data
The app: Bay Flood Watch on Plotly Cloud. It refreshes the NOAA tide gauges every 10 minutes.
The numbers in this post are from the evening of Saturday, Nov 21. The app keeps updating its forecasts through the week.
TL;DR
- A storm reaches the San Francisco Bay Area this week on top of the year's highest tides.
- I created an app that pulls together 18 open data sources to help track the storm and showcase what can be created in an afternoon with a coding agent and a simple prompt to “make something extraordinary.”
- The prompt is below, along with screenshots of what the app shows. You can use the prompt to build your own version for your own coastline or river.
- While this app is built from public feeds, it hasn’t been formally verified. Please use official sources for guidance and decision making. I’ve included some links to official sources below.
A 100-year storm is approaching San Francisco. On Saturday morning the NWS San Francisco office put out a Coastal Flood Warning for the San Francisco and San Pablo Bay shorelines, from 6 AM Monday to 4 PM Thursday. The warning says the forecast tides "are approaching the highest tide ever recorded." Only two months since 1897 have had a tide this high at the San Francisco gauge.
There are a lot of public data feeds available to track and forecast the storm. NOAA has tide gauges that report every six minutes, two forecast models of the Bay's water level, satellite imagery every few minutes, a weather model that forecasts the atmospheric river, and a tide record that goes back to 1854. I wanted to see what an emergency preparedness app looks like when you put it all in one place, so I asked Claude Opus 5.5 to build one with Dash and Plotly and deploy it on Plotly Cloud.
The official sources for this week
If you’re preparing for the storm, please refer to official sources. Here are a few links:
- NWS San Francisco Bay Area has the warning, the forecast and the forecast discussion.
- ReadySF from the San Francisco Department of Emergency Management has preparedness guides. AlertSF sends emergency alerts by text and email.
- SMC Alert covers San Mateo County, and Alert Marin covers Marin County.
- Cal OES is California's Office of Emergency Services.
- NWS flood safety, Ready.gov on floods and the American Red Cross flood guide cover what to do before and during a flood.
- FEMA's Flood Map Service Center has the official flood maps for any address.
- The California King Tides Project also crowdsources photos of king tides from the public.
The prompts
I started with an open-ended request on Opus 5.5 with medium thinking, YMMV on a different model.
There's a storm coming into the San Francisco Bay Area on top of king tides, and NOAA has issued warnings about it. People are calling it a once in a century event.
Build a Dash app with Plotly that works like a NOAA warning app for this week:
- Pull in as many public NOAA feeds as you can, and use real data throughout
- Include satellite imagery, and draw the flood map with vector tiles from DuckDB
- Use the historical record to show how rare this is
Make it very high quality and meteorological, useful as a forecasting tool and for explaining what's happening. Be ambitious and make it impressive.
Everything in the screenshots below came from that prompt with a few small follow ups and a screenshot of the basic design I was after. Opus chose which NOAA products to use and built the pages with Dash.
Opus 5.5 is ambitious and very capable when given the right tools like Python and Dash. It is remarkable to see what it built on its own with an open ended prompt that asks it to “build something impressive.”
If you want to rebuild the exact app that we show in the post, you can give your agent a link to this blog post or start with the prompt below that specifies more of the details of the actual data feeds that were used.
Make a Dash app that tracks coastal flooding on San Francisco Bay this week, using NOAA's public data.
Data
- CO-OPS: 6-minute water levels and tide predictions at eight gauges from Point Reyes to Monterey, their datums and flood levels, San Francisco's monthly record since 1854 and hourly heights since 1898
- NWS API: the active coastal alerts and their zones, the San Francisco office's forecast discussion, and the hourly gridded forecast
- SFBOFS and STOFS-2D-Global water level forecasts on each gauge's MLLW datum
- GOES-18 water vapor and infrared scans, reprojected into hourly map frames
- GFS atmospheric river forecast (integrated water vapor transport) and sea-level pressure
- NOAA Sea Level Rise Viewer flood areas at 2, 2.5 and 3 ft, with Overture Maps buildings
- nowCOAST radar, satellite, Bay currents and warnings as live map layers
- NDBC offshore buoys and the CPC El Niño index
Pages
- Now: the warning, its five forecast tides and a chart against the record
- Flood map: DuckDB vector tiles of the flooded area and the buildings in it
- One page per gauge
- Satellite and storm: GOES-18 loops and the GFS atmospheric river forecast
- History since 1897: this week against every year, flood days and El Niño
- Forecast updates: snapshots saved every few hours by a scheduled agent
- How we calculate (the semantic layer) and MCP tools for AI assistants
Refresh the gauges every 10 minutes and the forecasts every 30.
Screenshots of the app
The warning and this week's tides
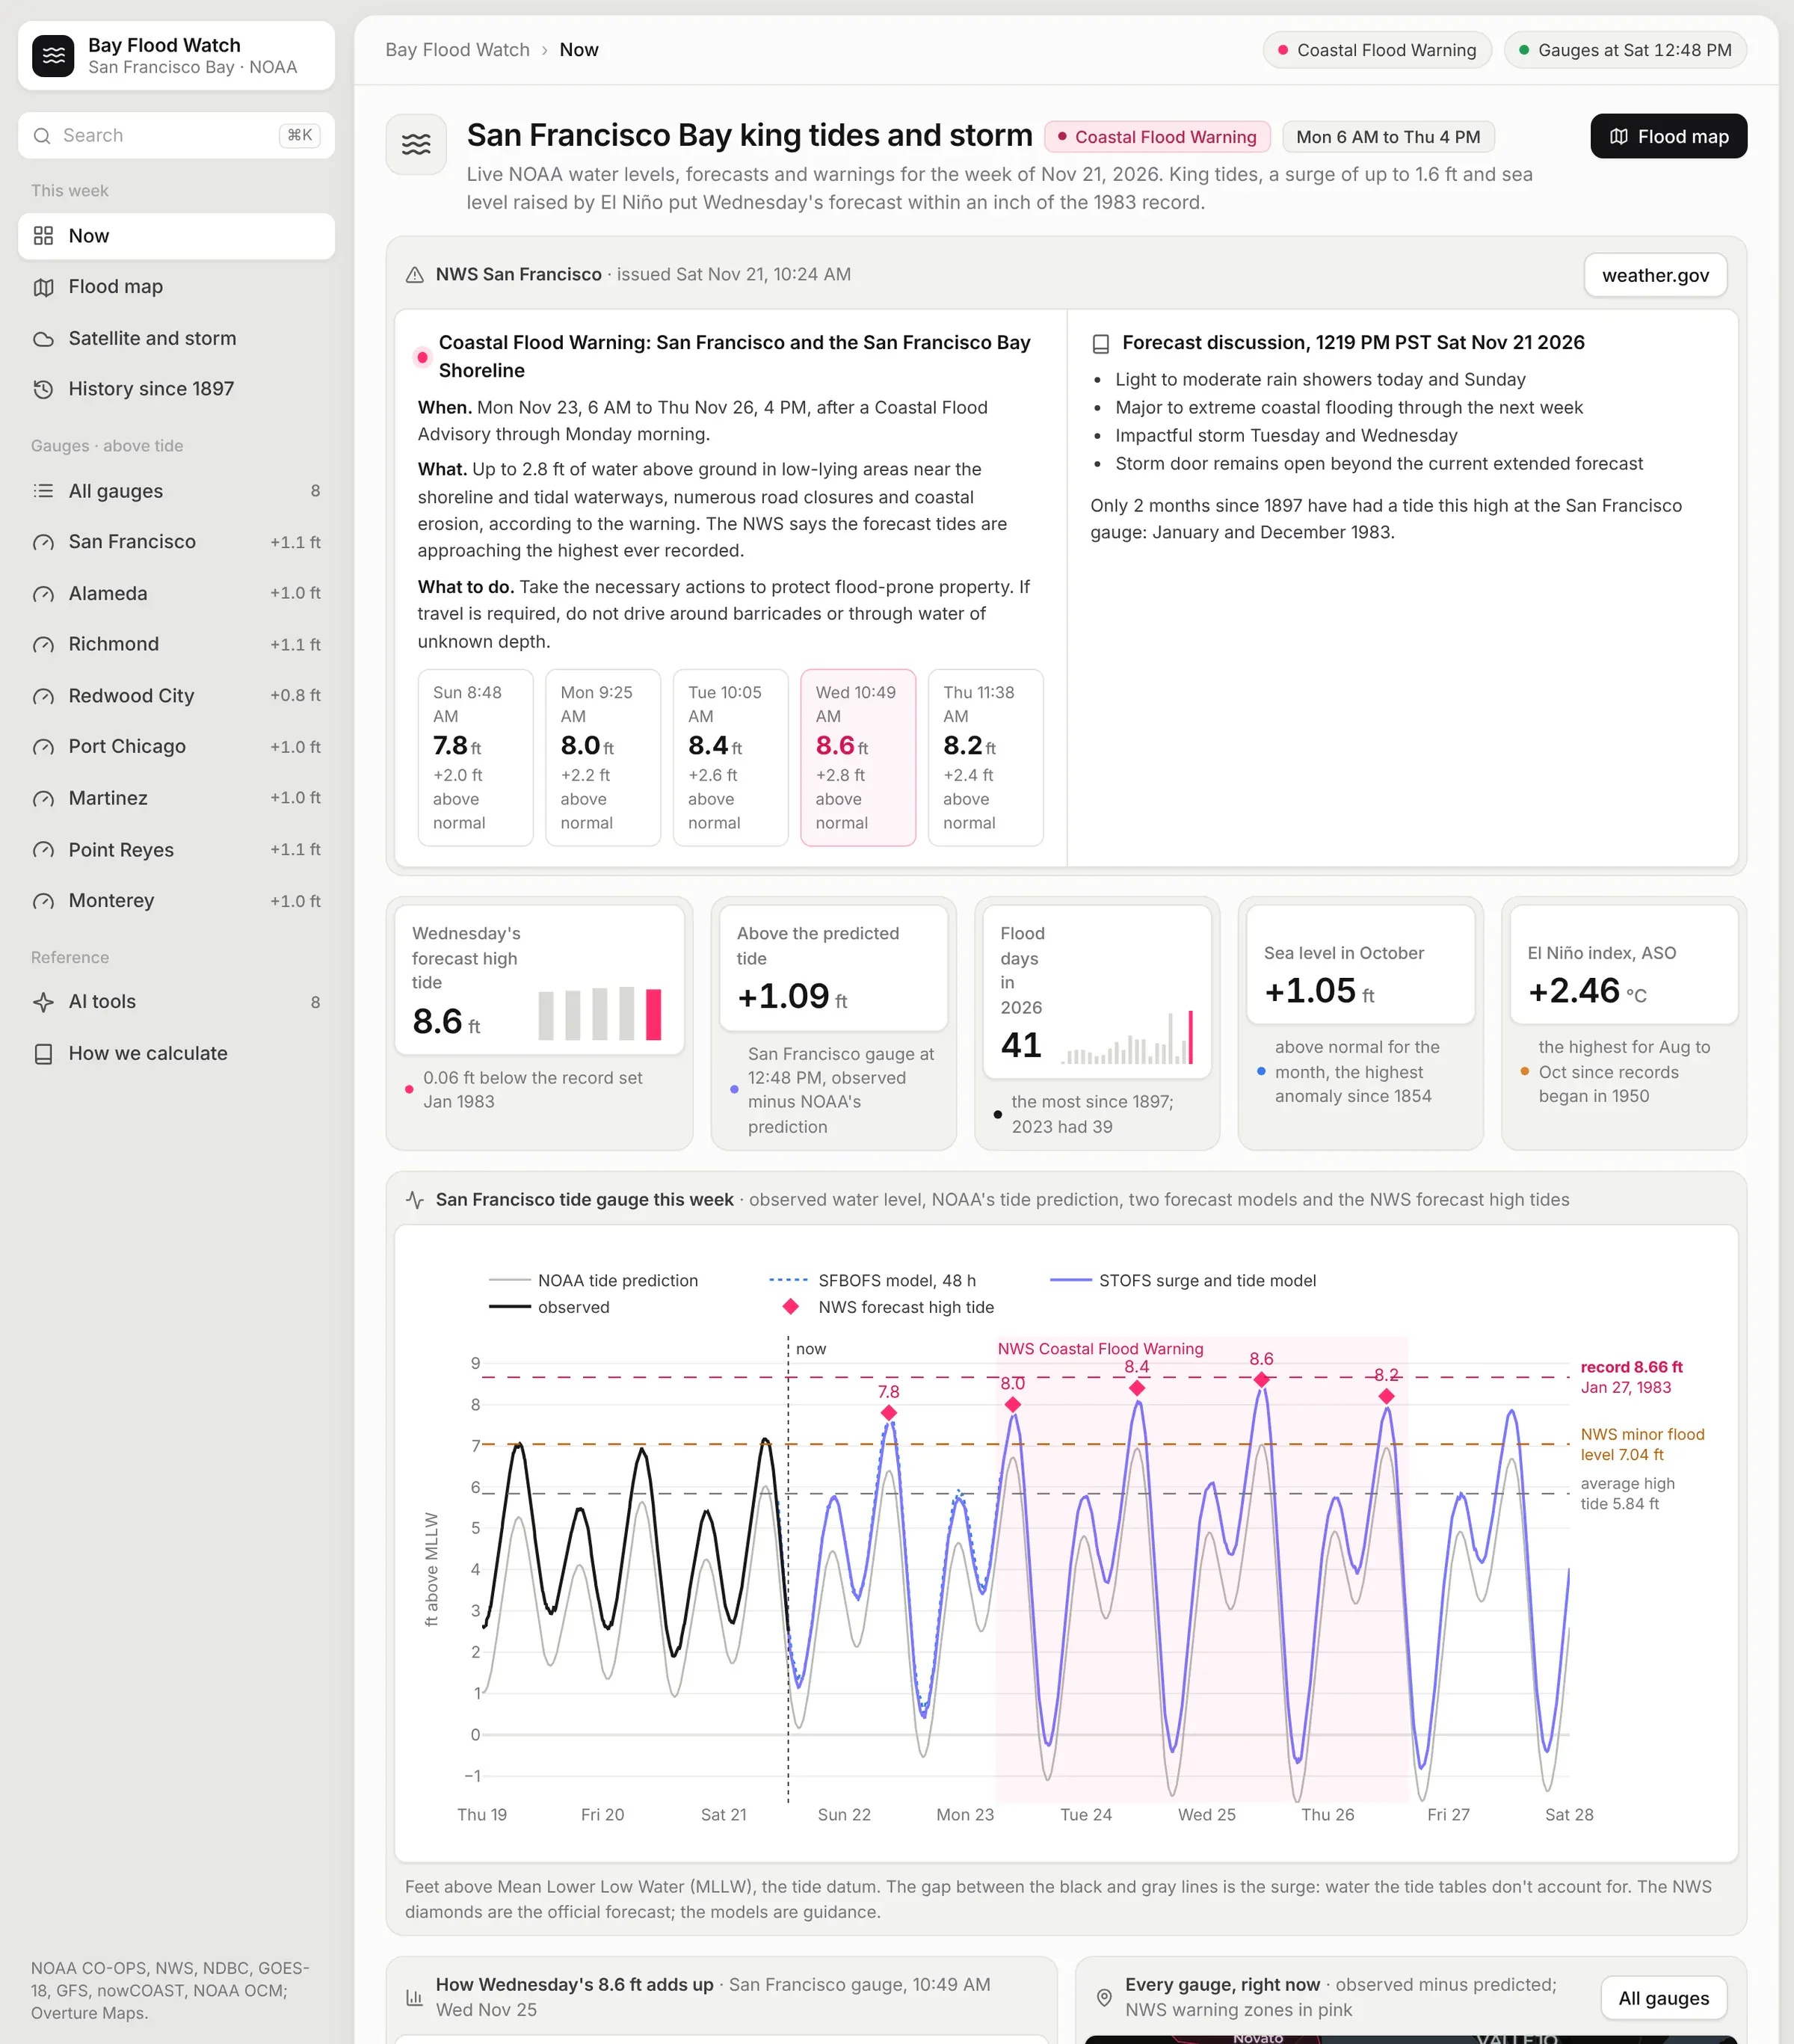
The first page has the NWS warning and its five forecast high tides: 7.8 ft on Sunday, 8.0 on Monday, 8.4 on Tuesday, 8.6 on Wednesday and 8.2 on Thursday.
The NWS publishes those numbers as sentences in the warning text (e.g. the San Francisco gauge is expected to be "2.8 ft above normal (8.6 ft MLLW) at 10:49 AM Wednesday.") and the app parses these numbers and displays them as cards in the warning panel.
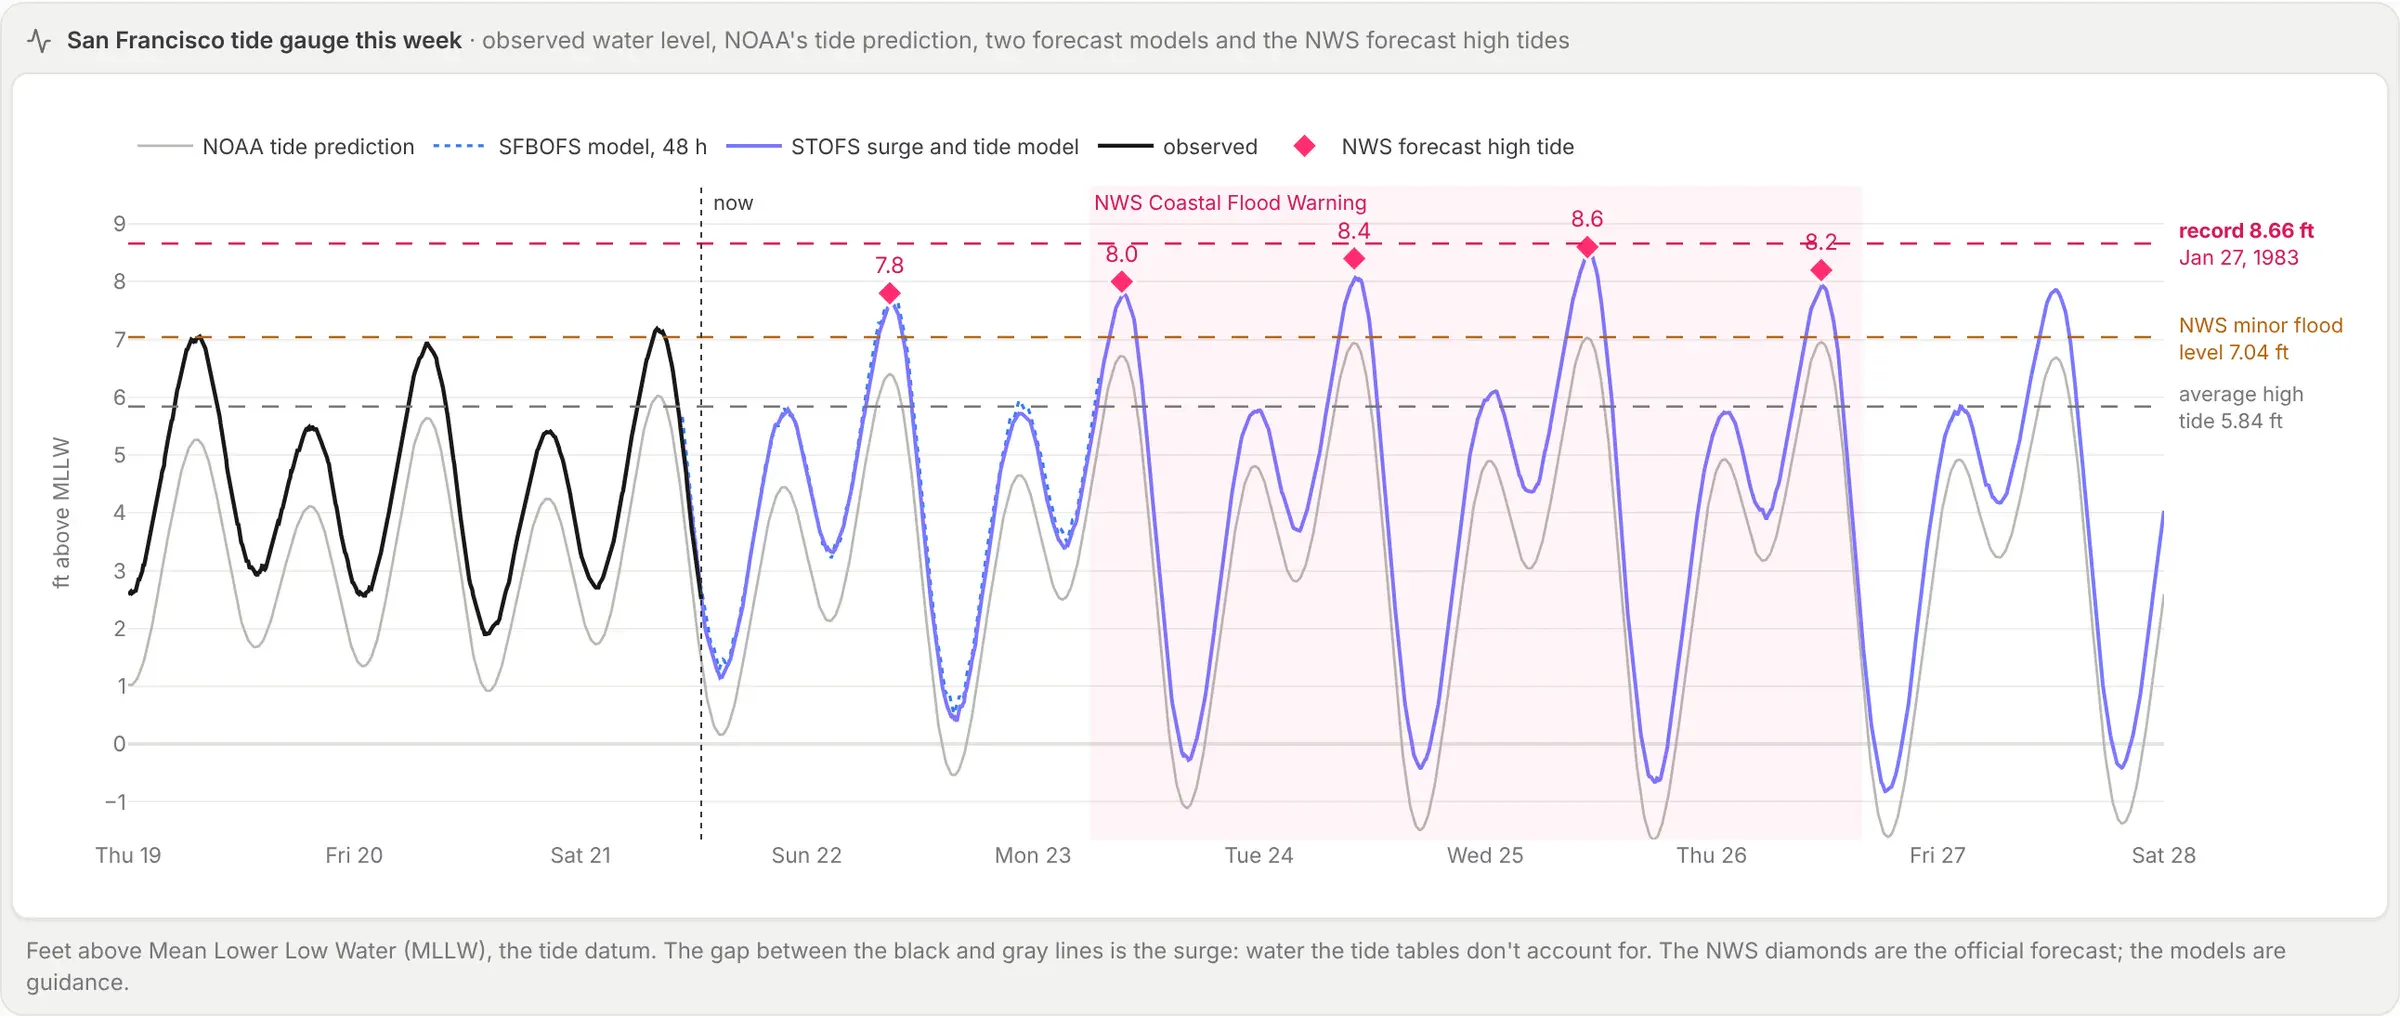
The black line is what the San Francisco gauge measured historically, the gray line is NOAA's tide prediction, and two NOAA forecast models carry it forward: SFBOFS models the Bay itself 48 hours ahead, and STOFS-2D-Global models surge and tide about a week ahead. Both forecasts agree with the NWS within a few tenths of a foot.
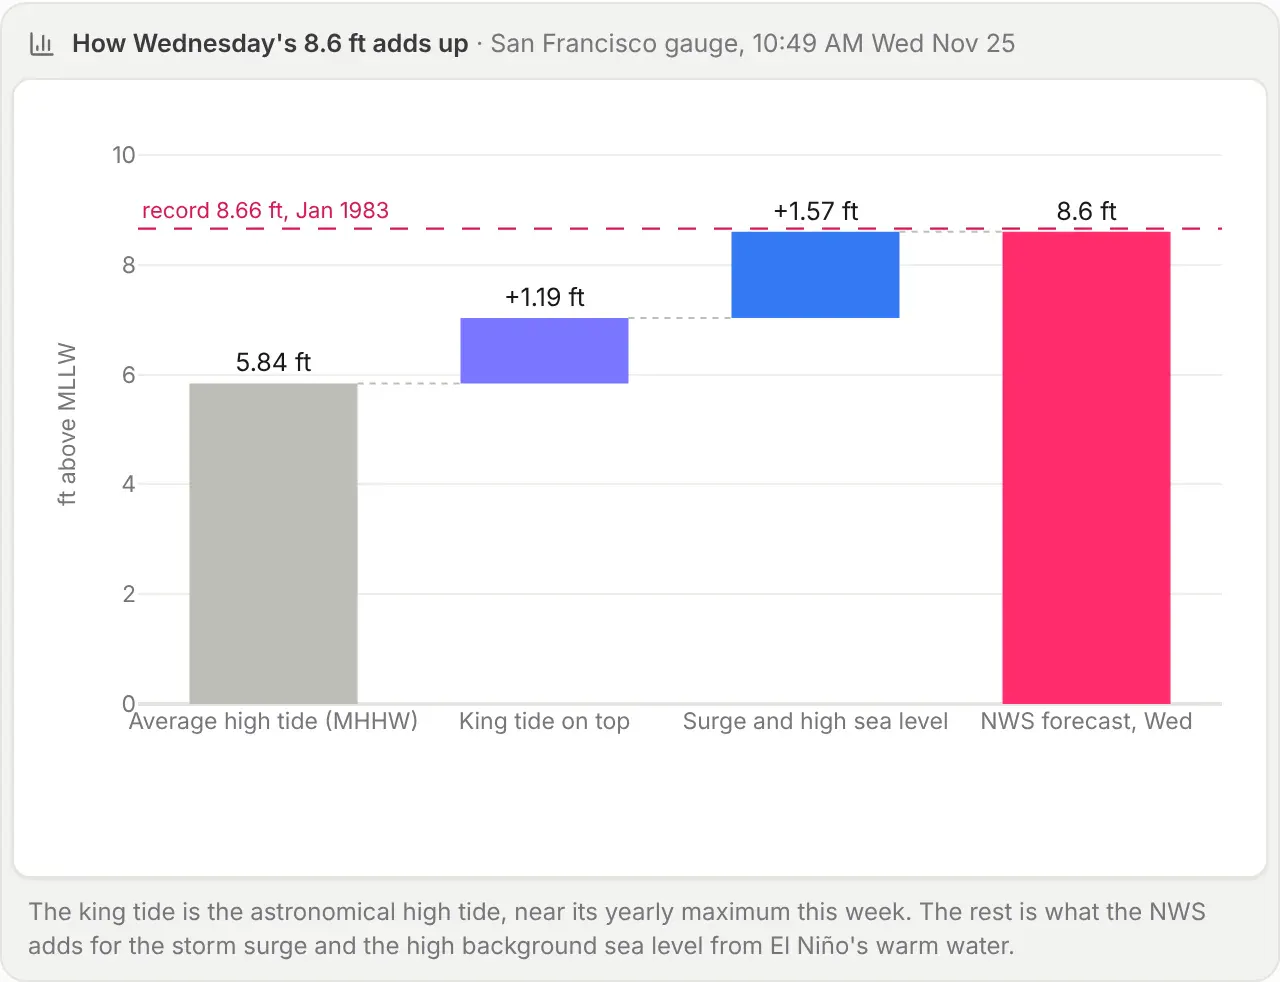
This chart splits Wednesday's forecast into parts. The average high tide at the gauge is 5.84 ft. The king tide adds 1.19 ft, and the last 1.57 ft is the storm surge plus a high background sea level.
Where the water goes
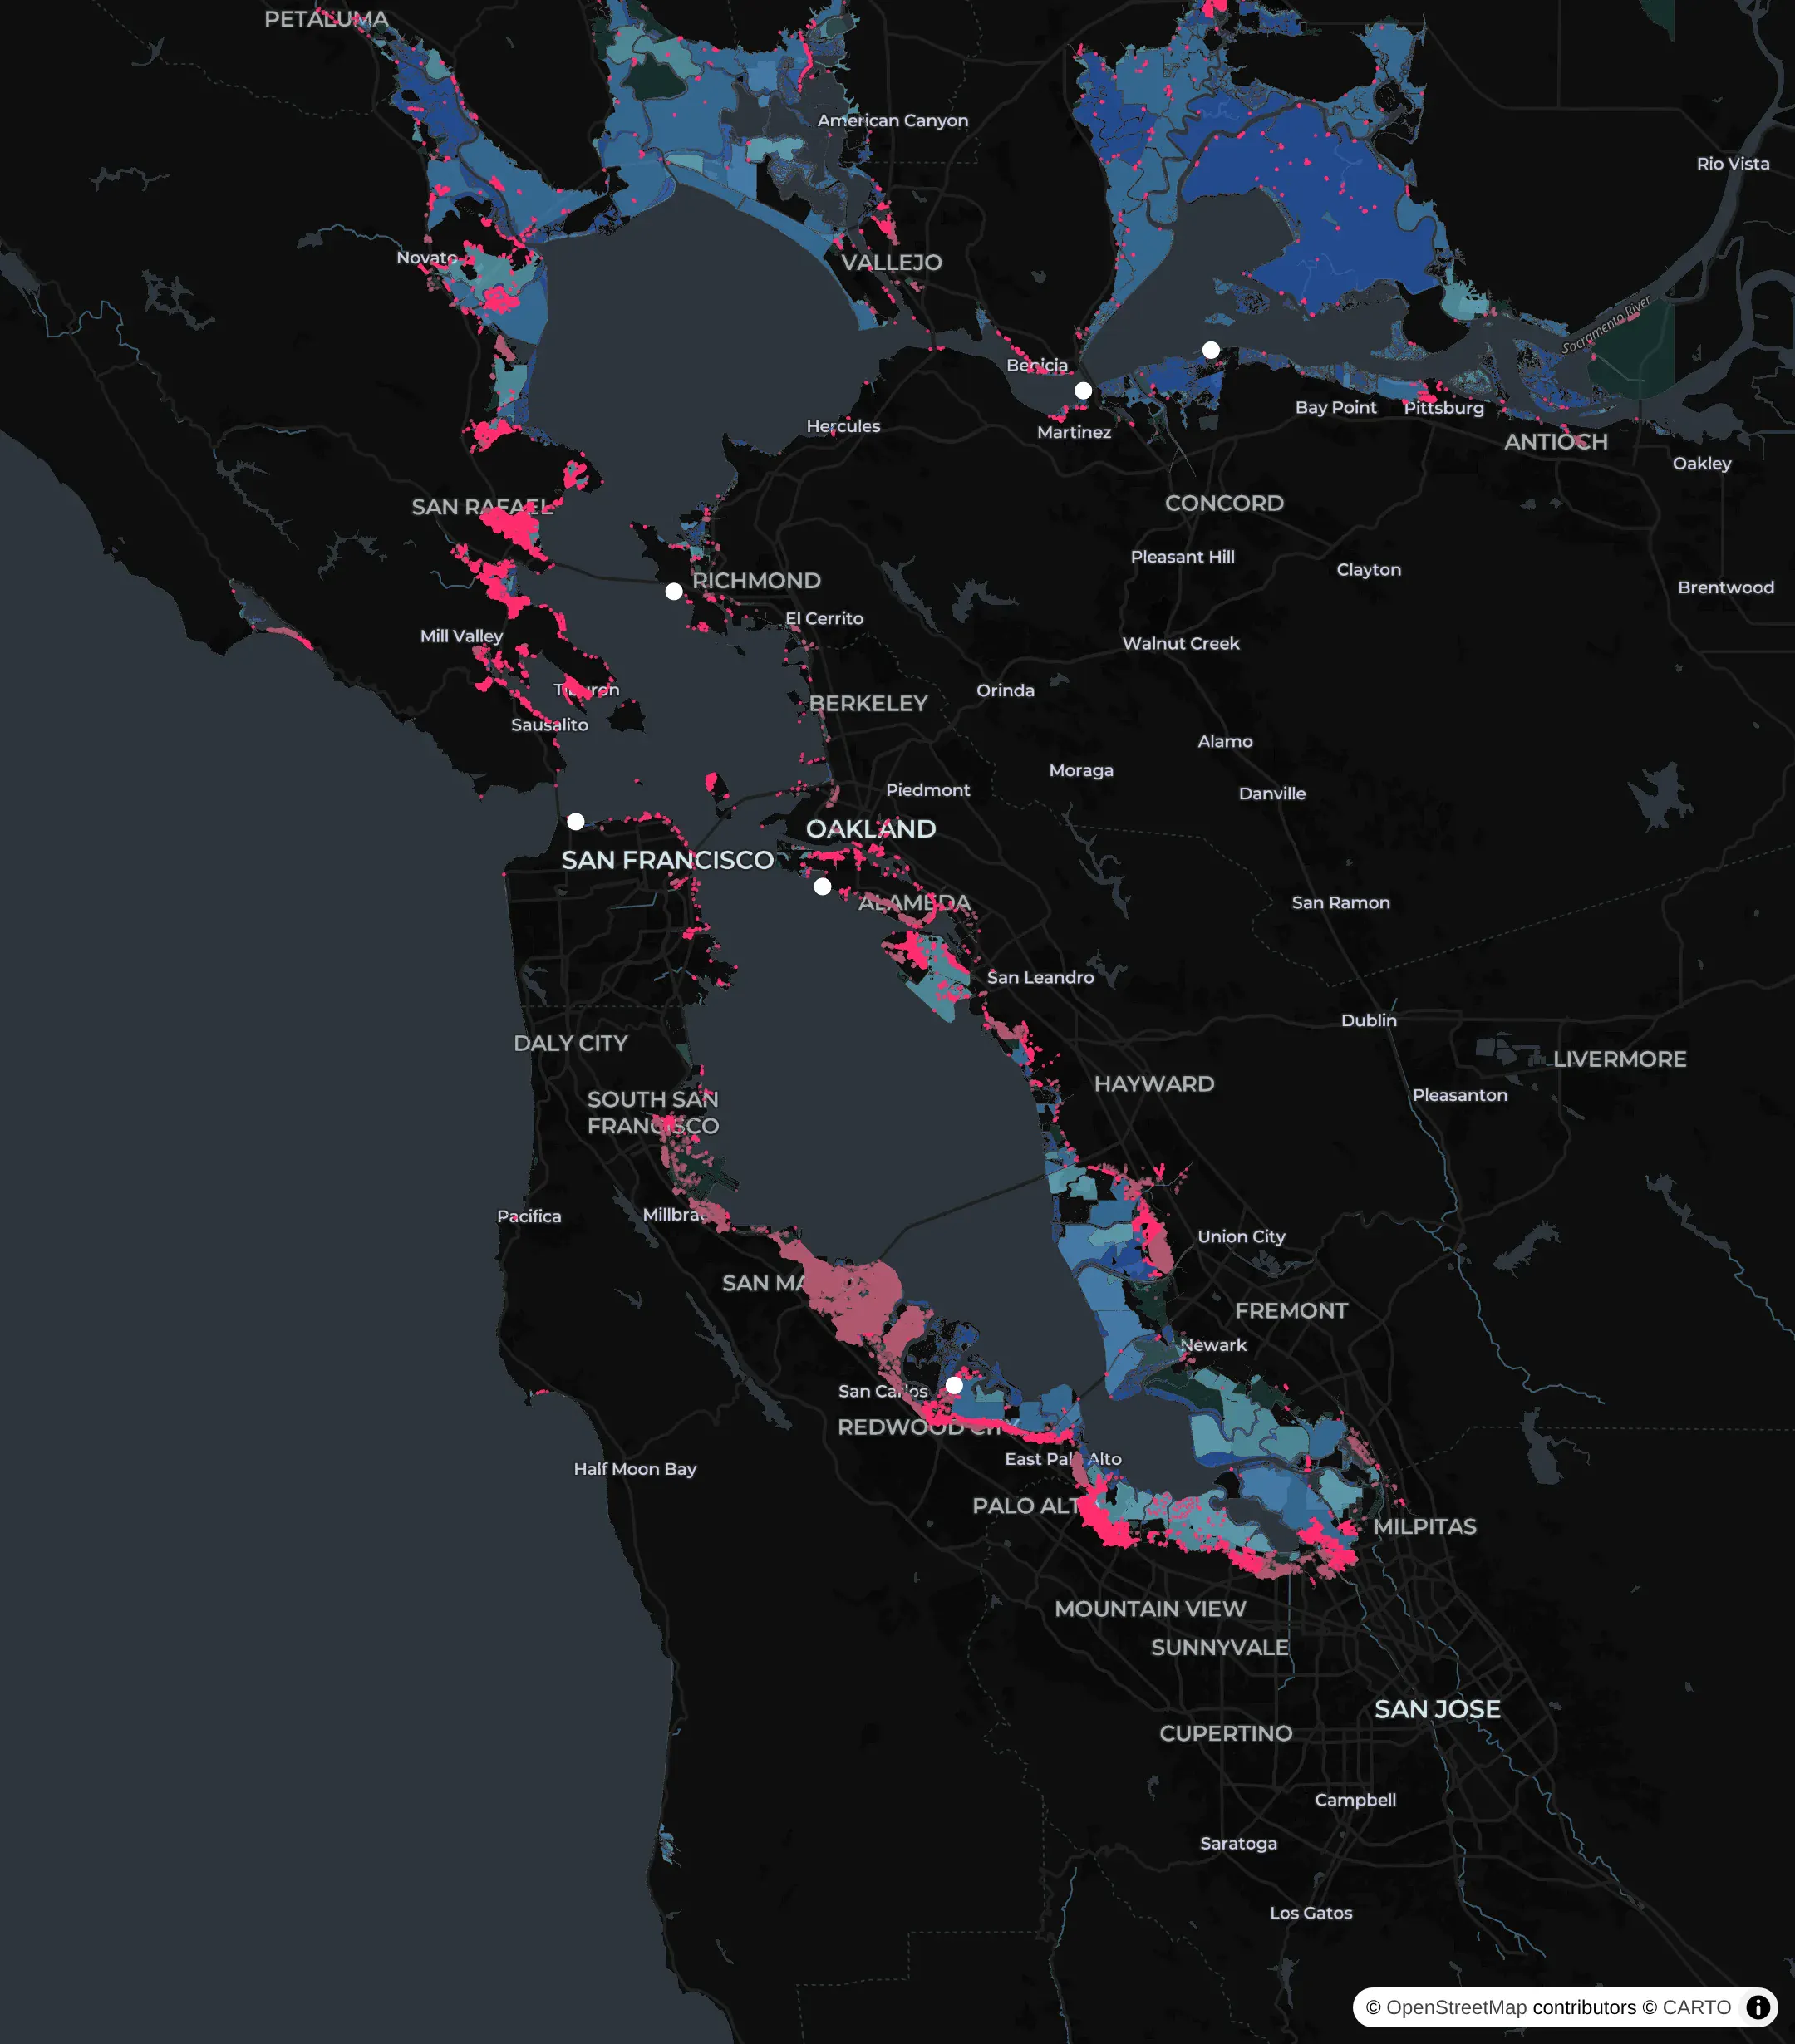
NOAA's Sea Level Rise Viewer maps the land that's underwater when the Bay stands a given height above its average high tide.
Wednesday's forecast is 2.8 ft above the average high tide.
The app draws them with 2 million Overture Maps building footprints as vector tiles built on the fly with DuckDB. At 3 ft, the app estimates that 21,585 buildings will be in the flood zone.
The number of buildings affected is computed in the app through a couple of data sources. The logic computes 1,996,999 Overture Maps building footprints (release 2026-11-18.0) in a box around the Bay and counted the ones that intersect NOAA's Sea Level Rise Viewer inundation area for 3 ft above the average high tide via a spatial join in DuckDB. NOAA publishes the inundation area as map tiles, so the app turned its tiles into polygons first, at about 15 m resolution.
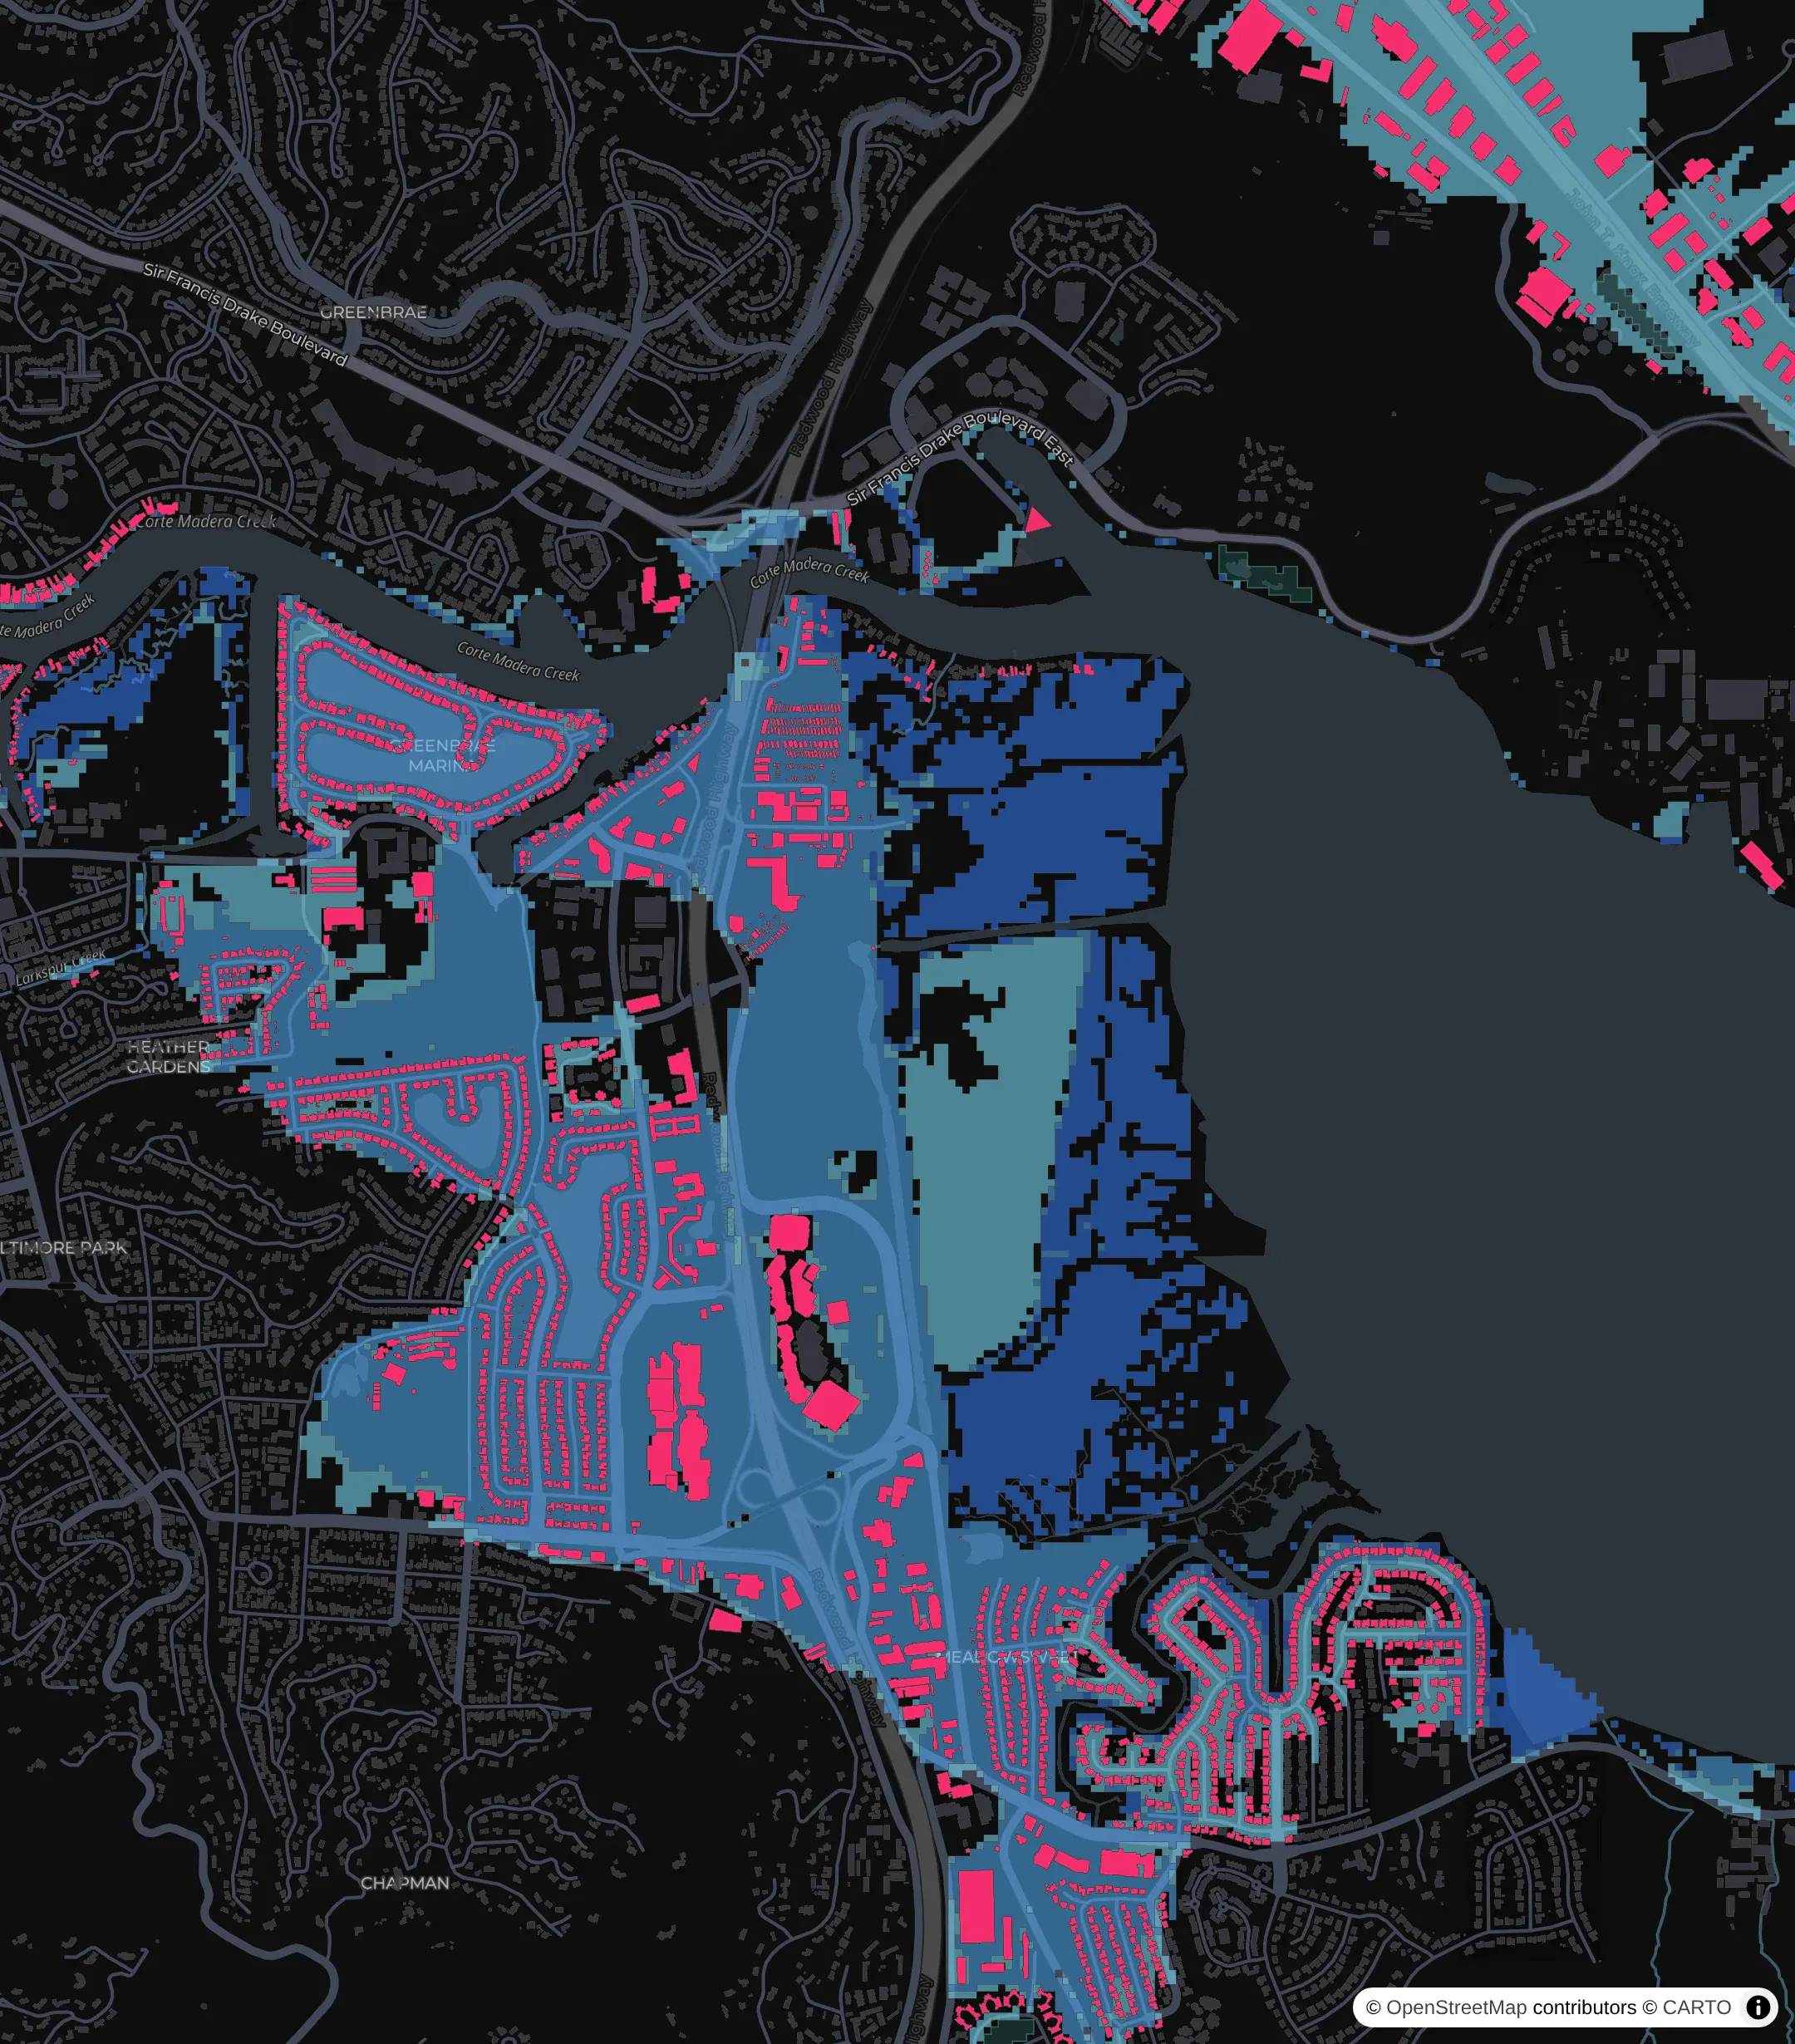
You can zoom down to single buildings. This is Corte Madera and Larkspur, where 1,268 buildings in Corte Madera touch the 3 ft area. The darker the blue, the deeper the water in NOAA's map.
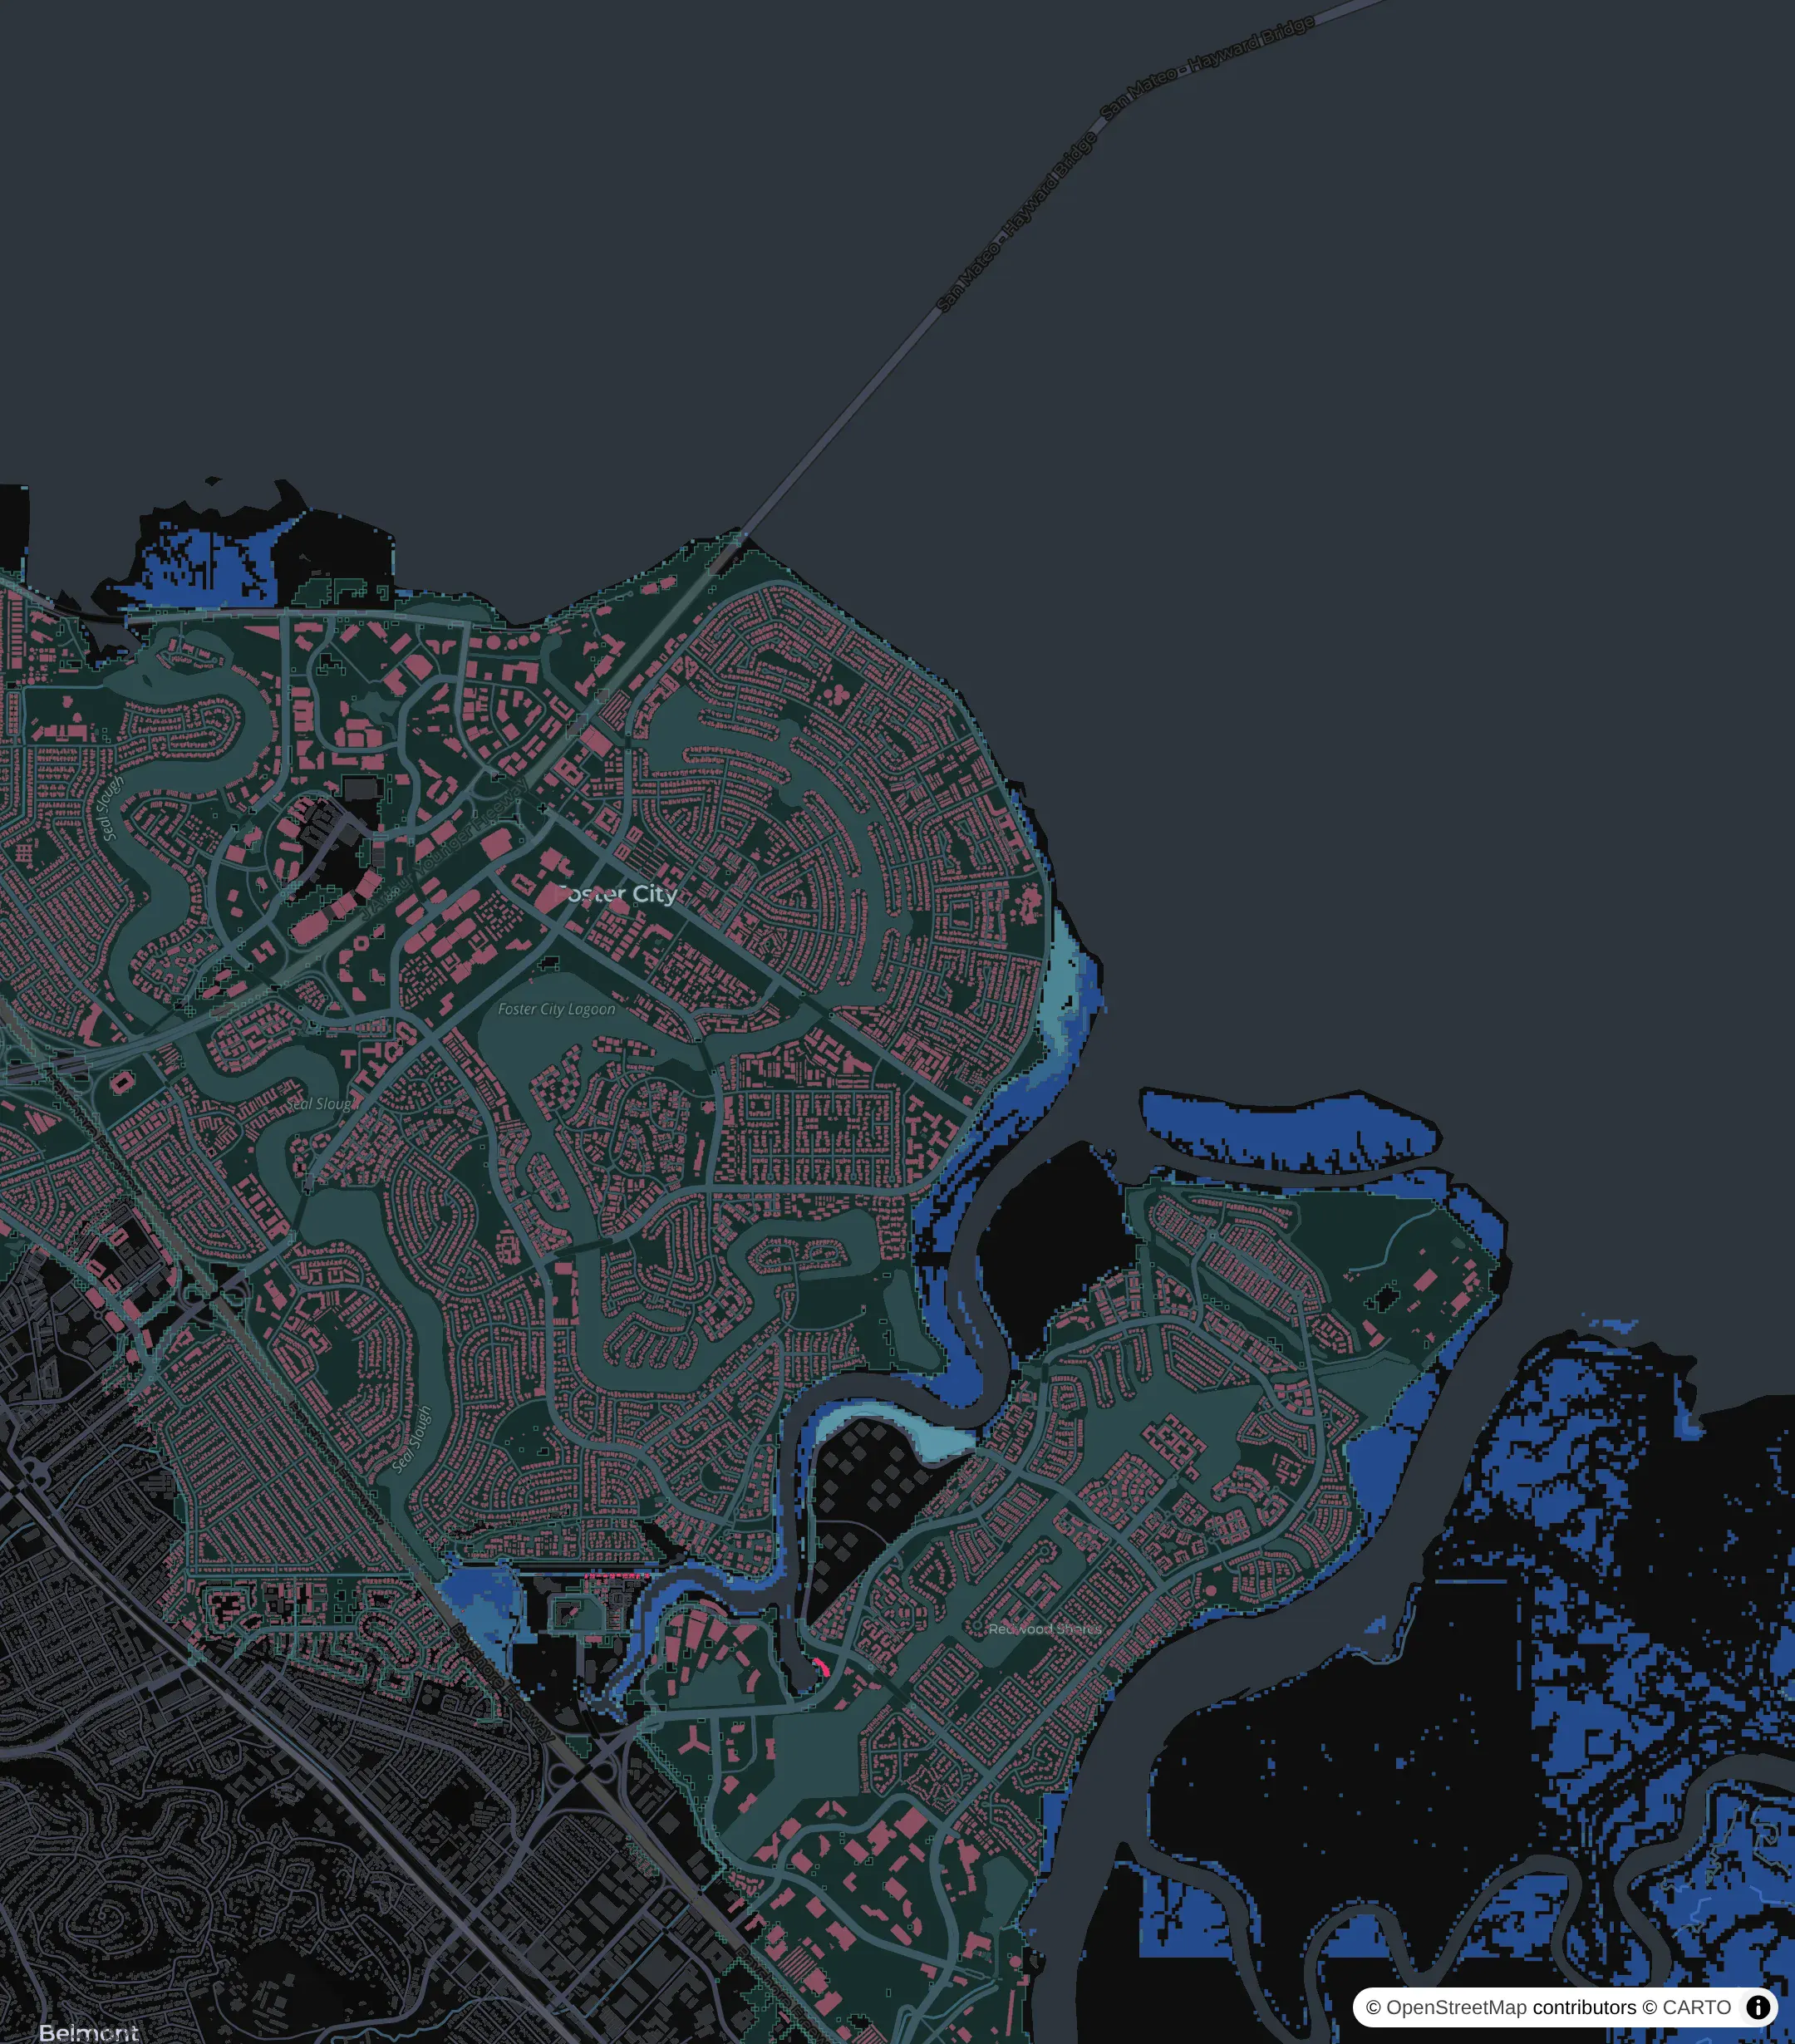
Most of Foster City sits lower than a 3 ft flood, but levees cut it off from the Bay, so NOAA marks it as low-lying land instead of flooded land. The app shows that land in teal and counts it separately. At 3 ft there are 32,155 buildings on it, mostly in San Mateo (10,245) and Foster City (7,060). They stay dry as long as the levees hold and the water doesn't go over them.
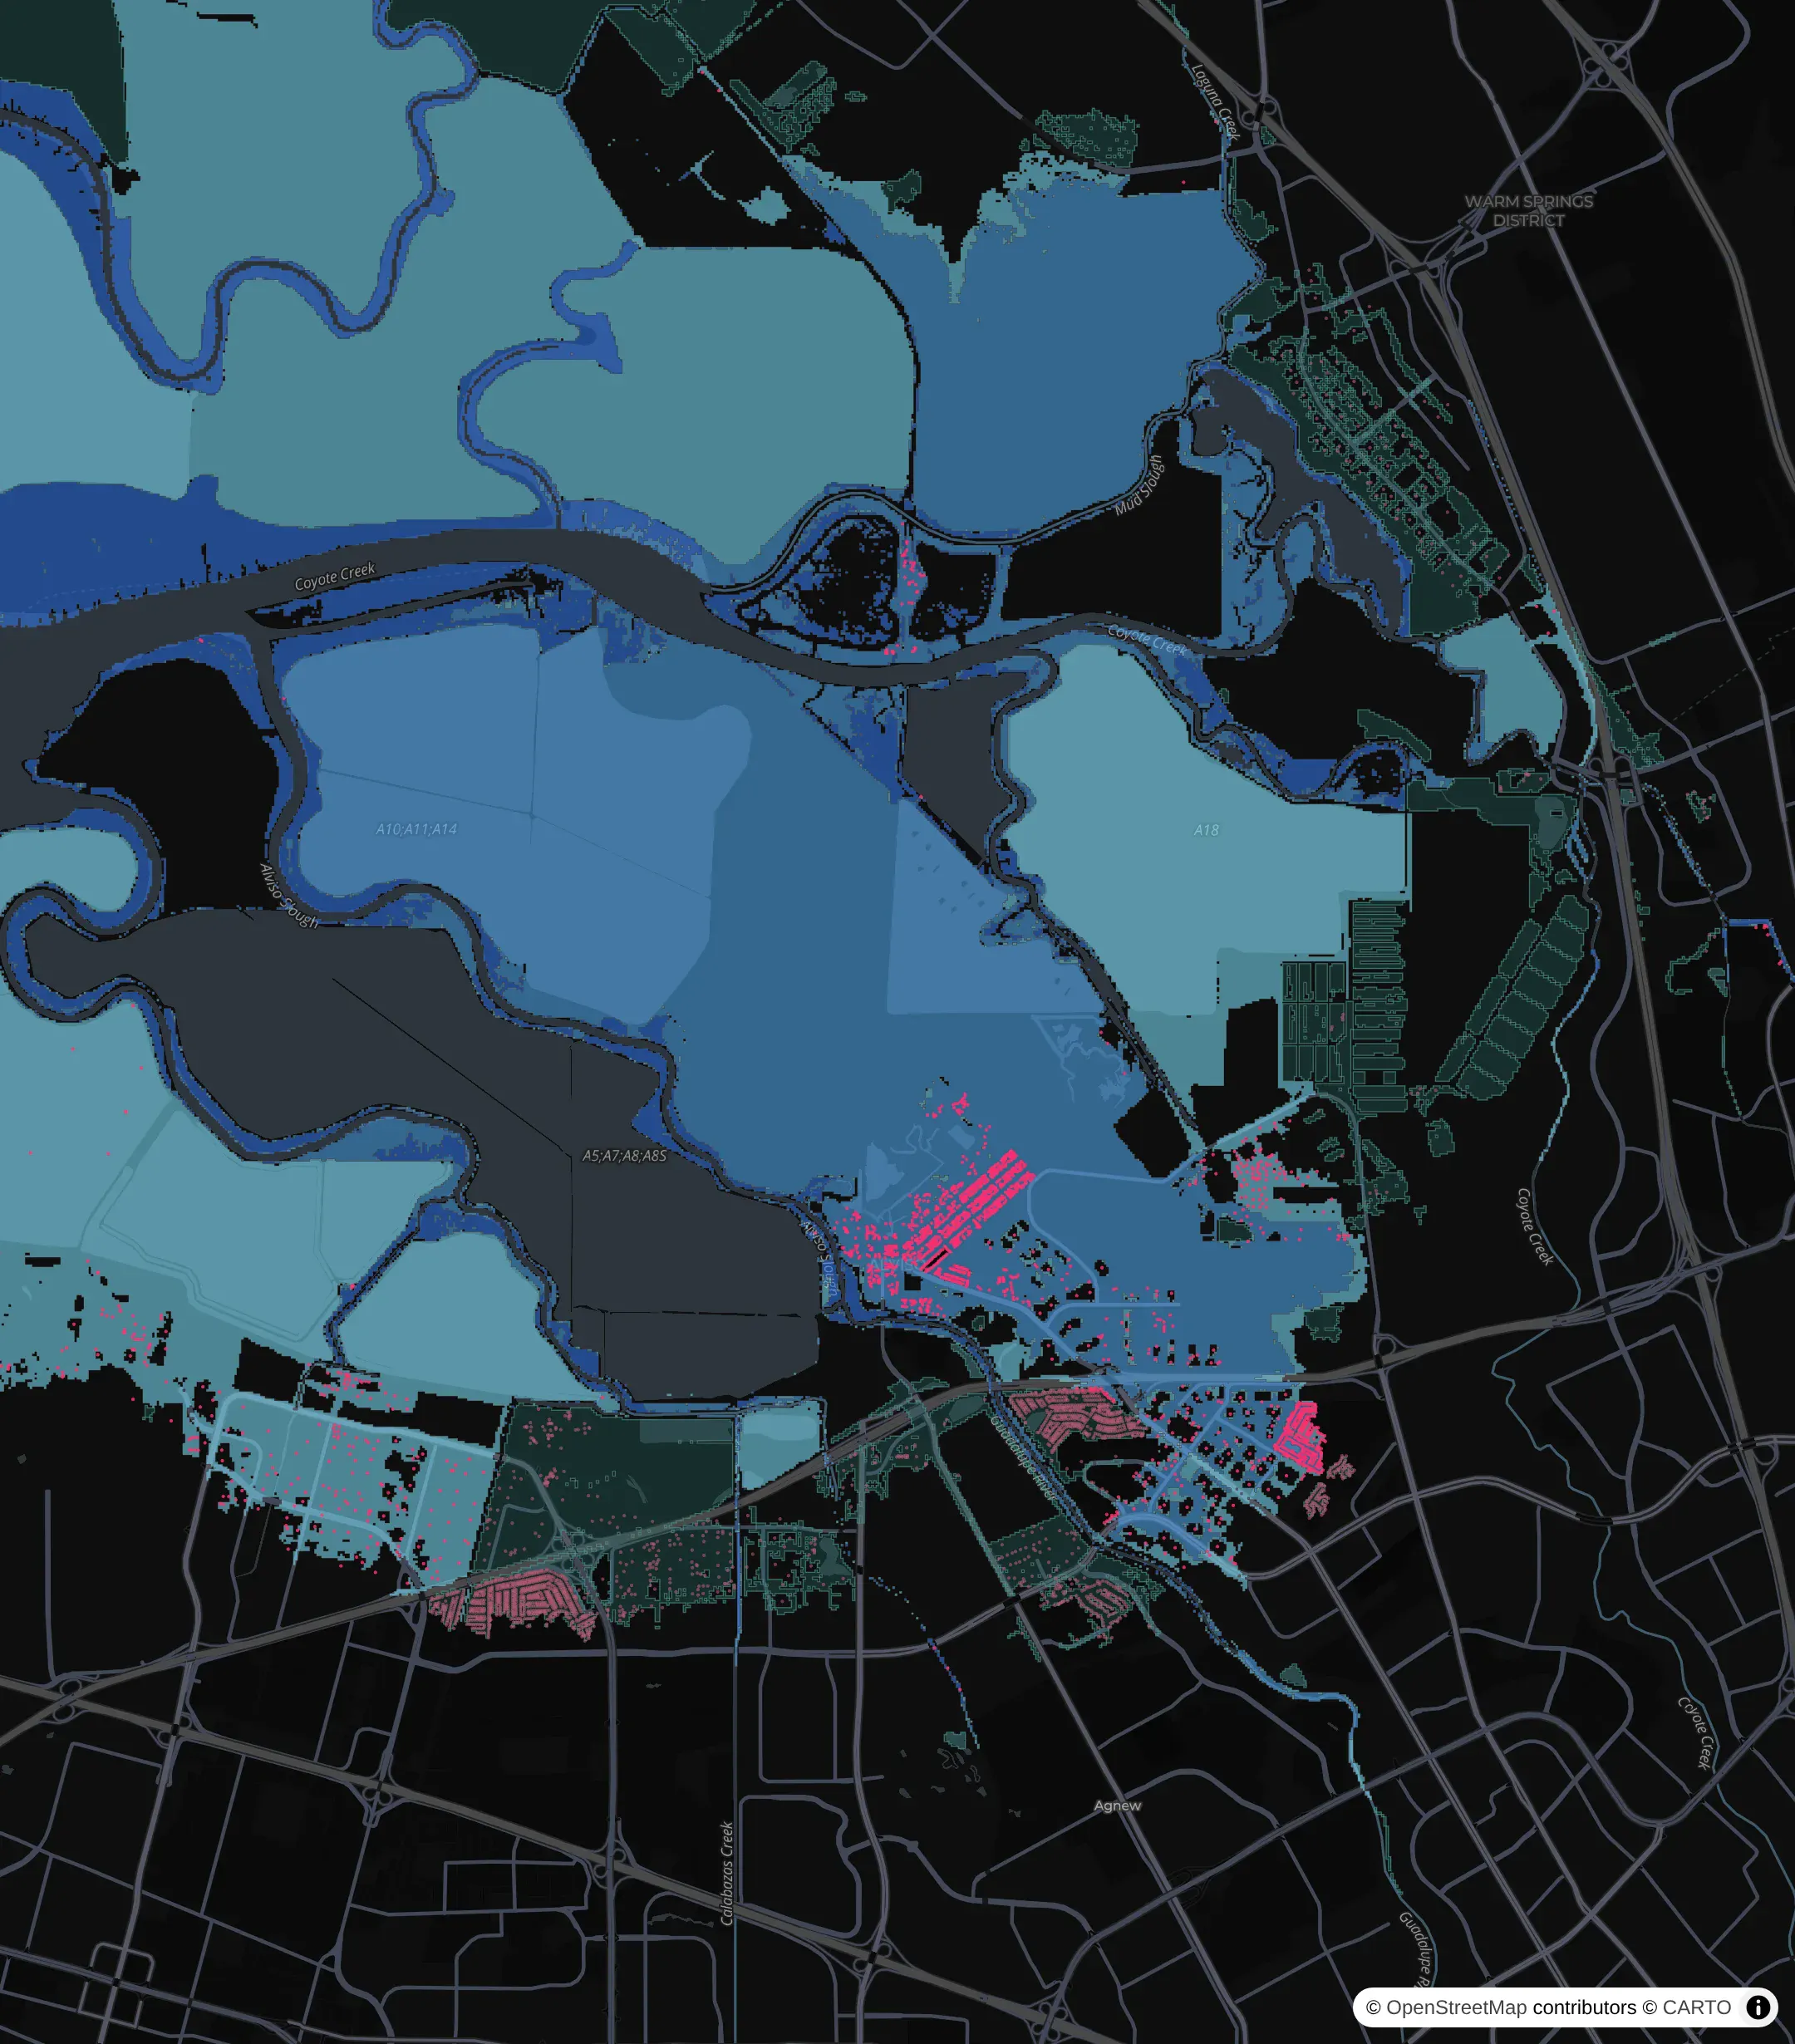
The South Bay has the most exposed land, including Alviso and the old salt ponds. Palo Alto has the most buildings in the connected 3 ft area of any city, with 3,137.
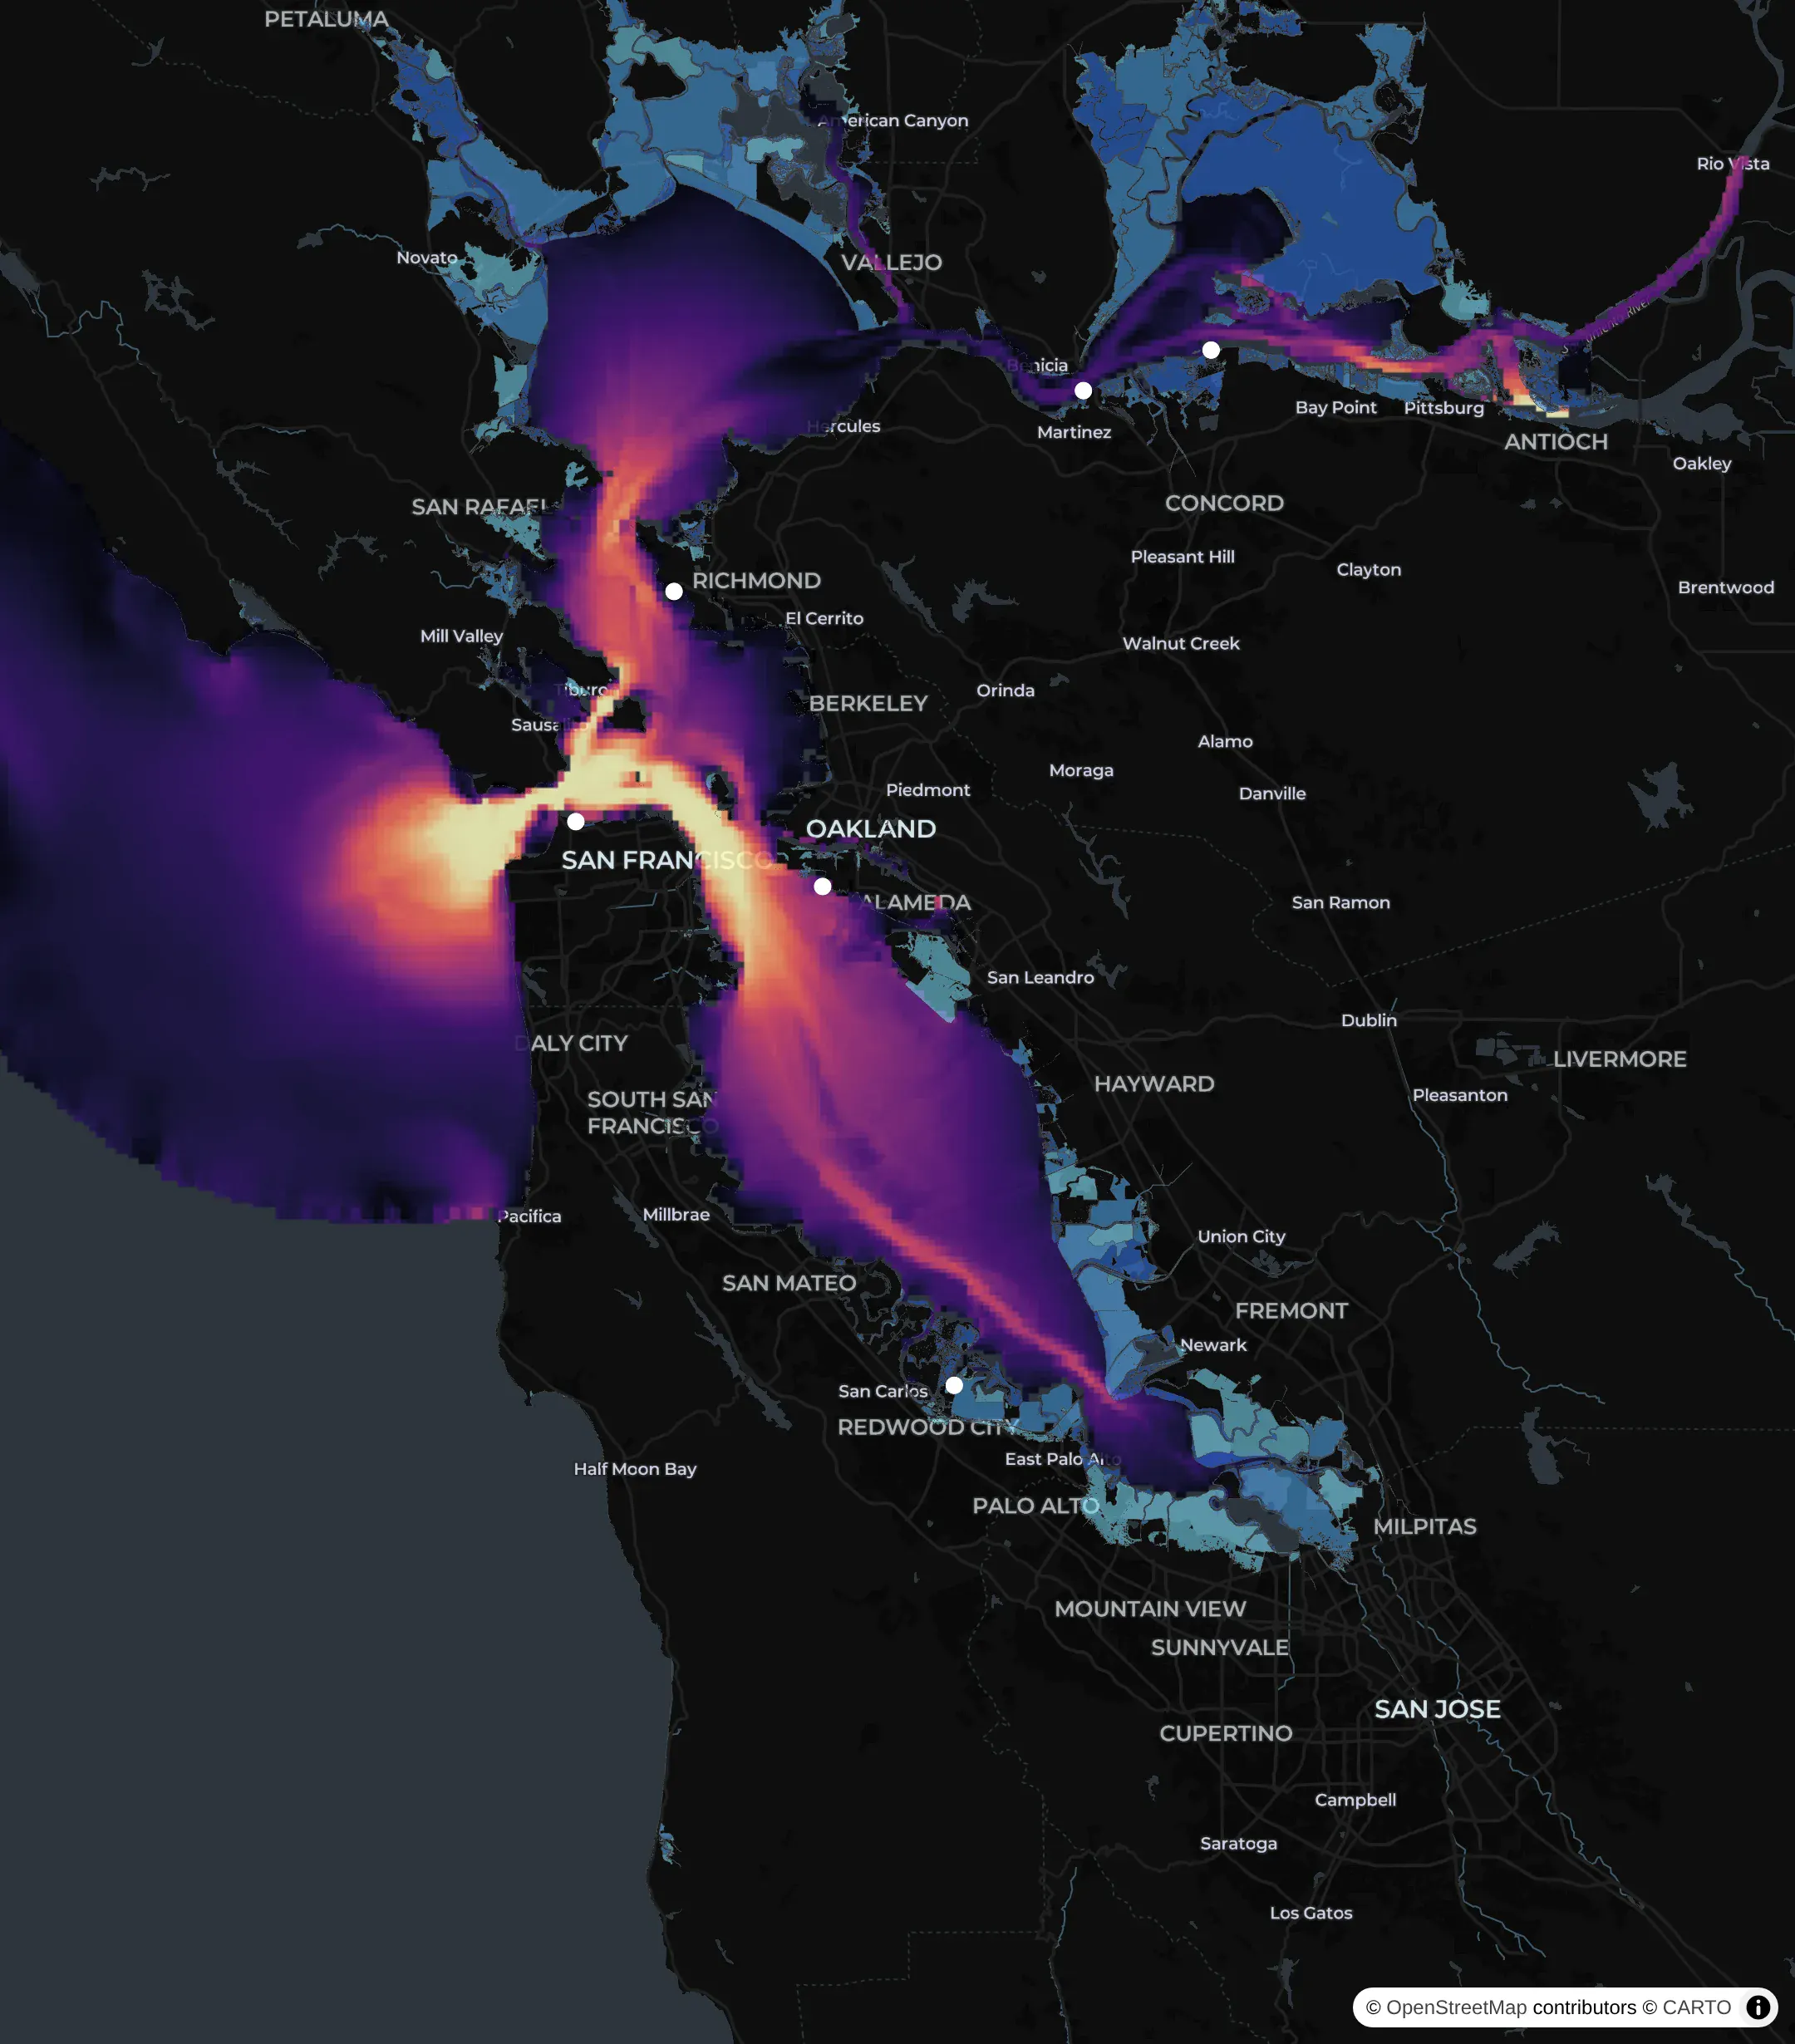
The map also has live layers from NOAA's nowCOAST service. nowCOAST serves each layer as a WMS (Web Map Service) map image. This one is the SFBOFS model's surface currents. The fastest water runs through the Golden Gate.
The storm
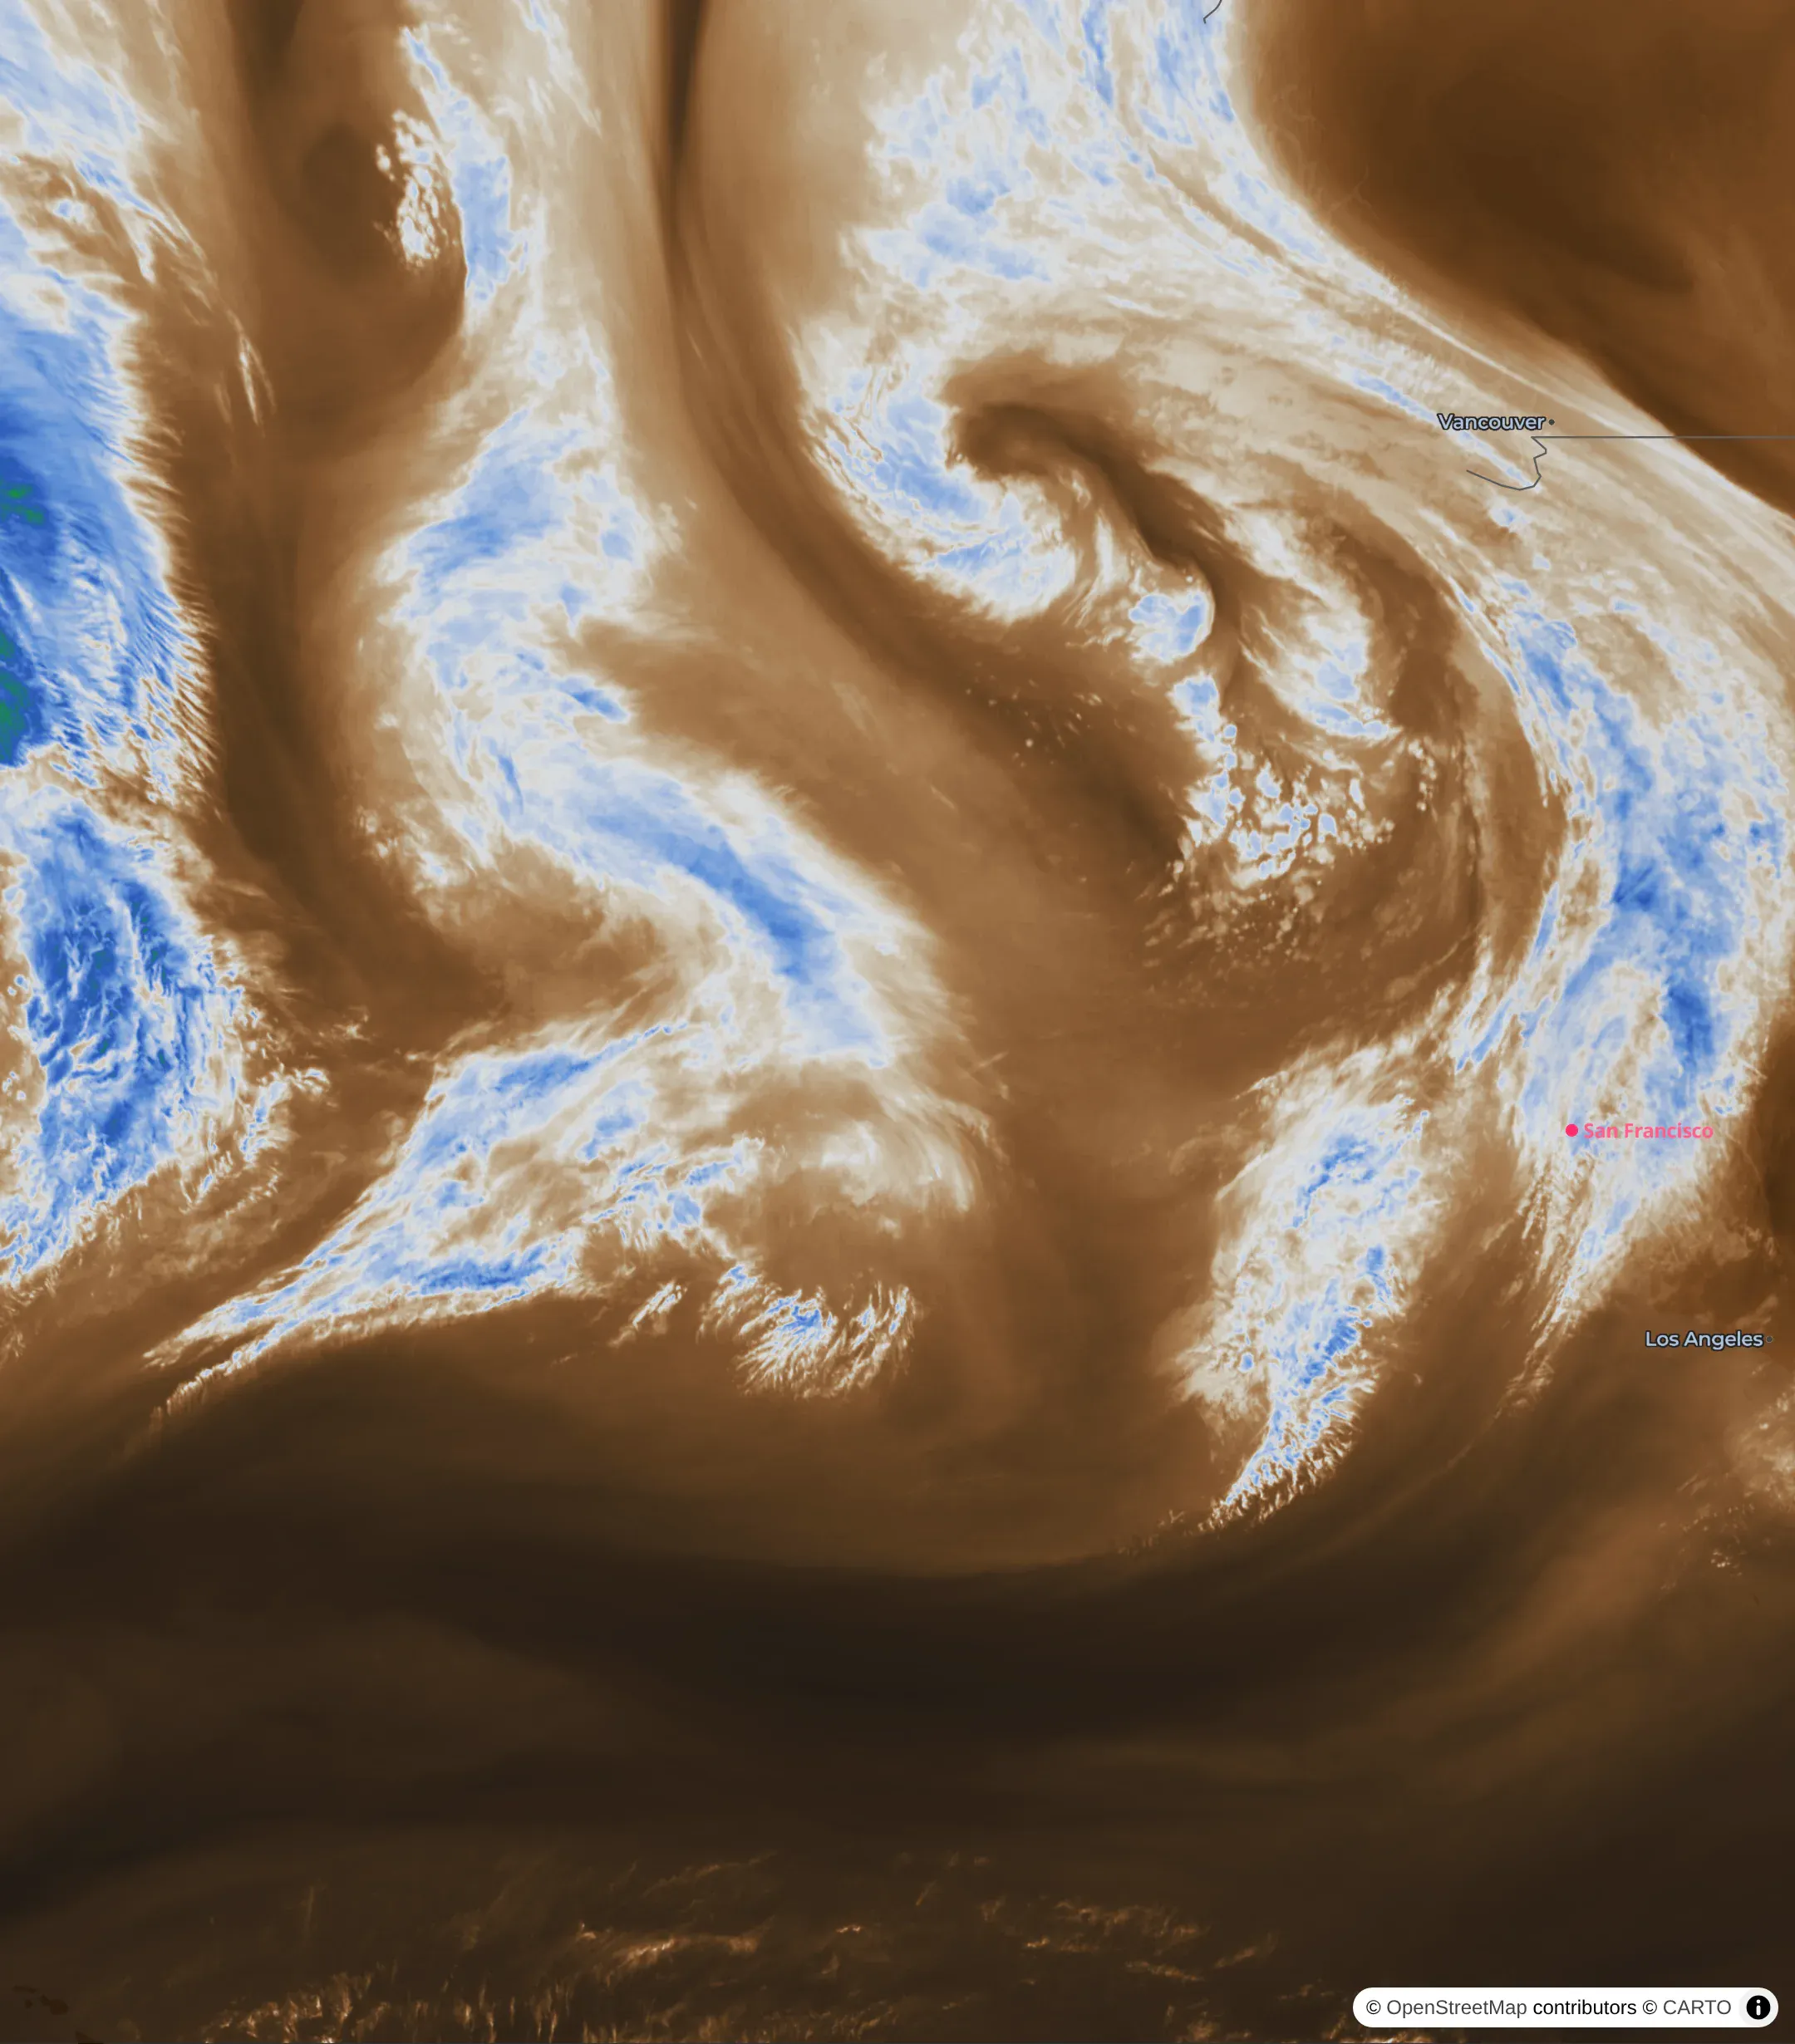
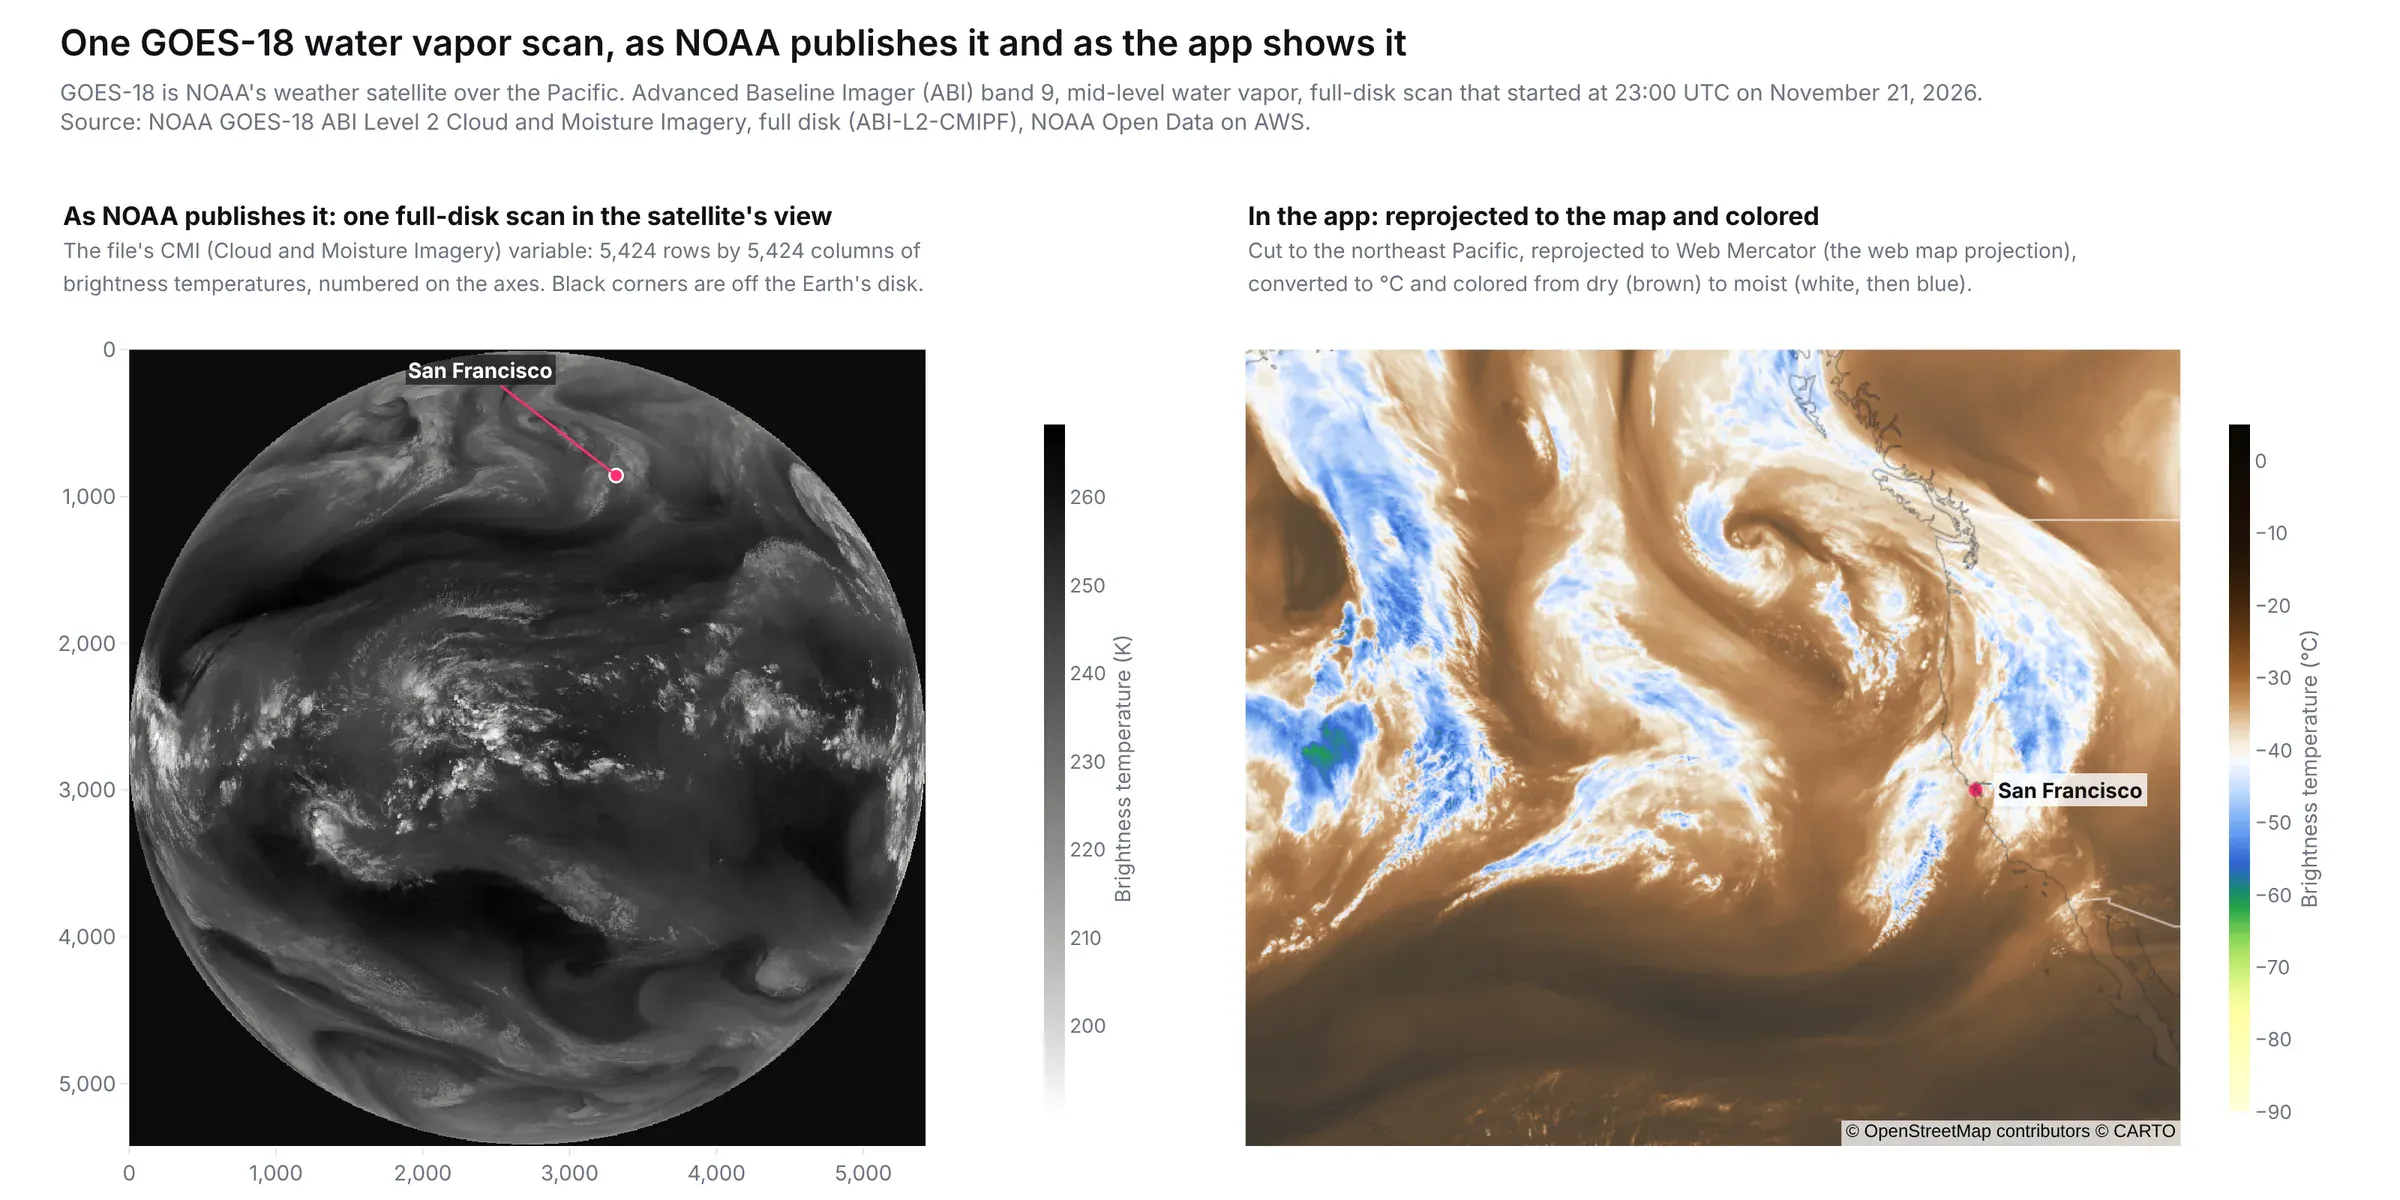
The storm page loops the last 14 hourly scans from GOES-18, NOAA's satellite over the West Coast. This is the mid-level water vapor channel, where moist air shows white and blue and dry air shows brown. We draw these frames ourselves from the satellite's raw data files instead of using NOAA's pictures.
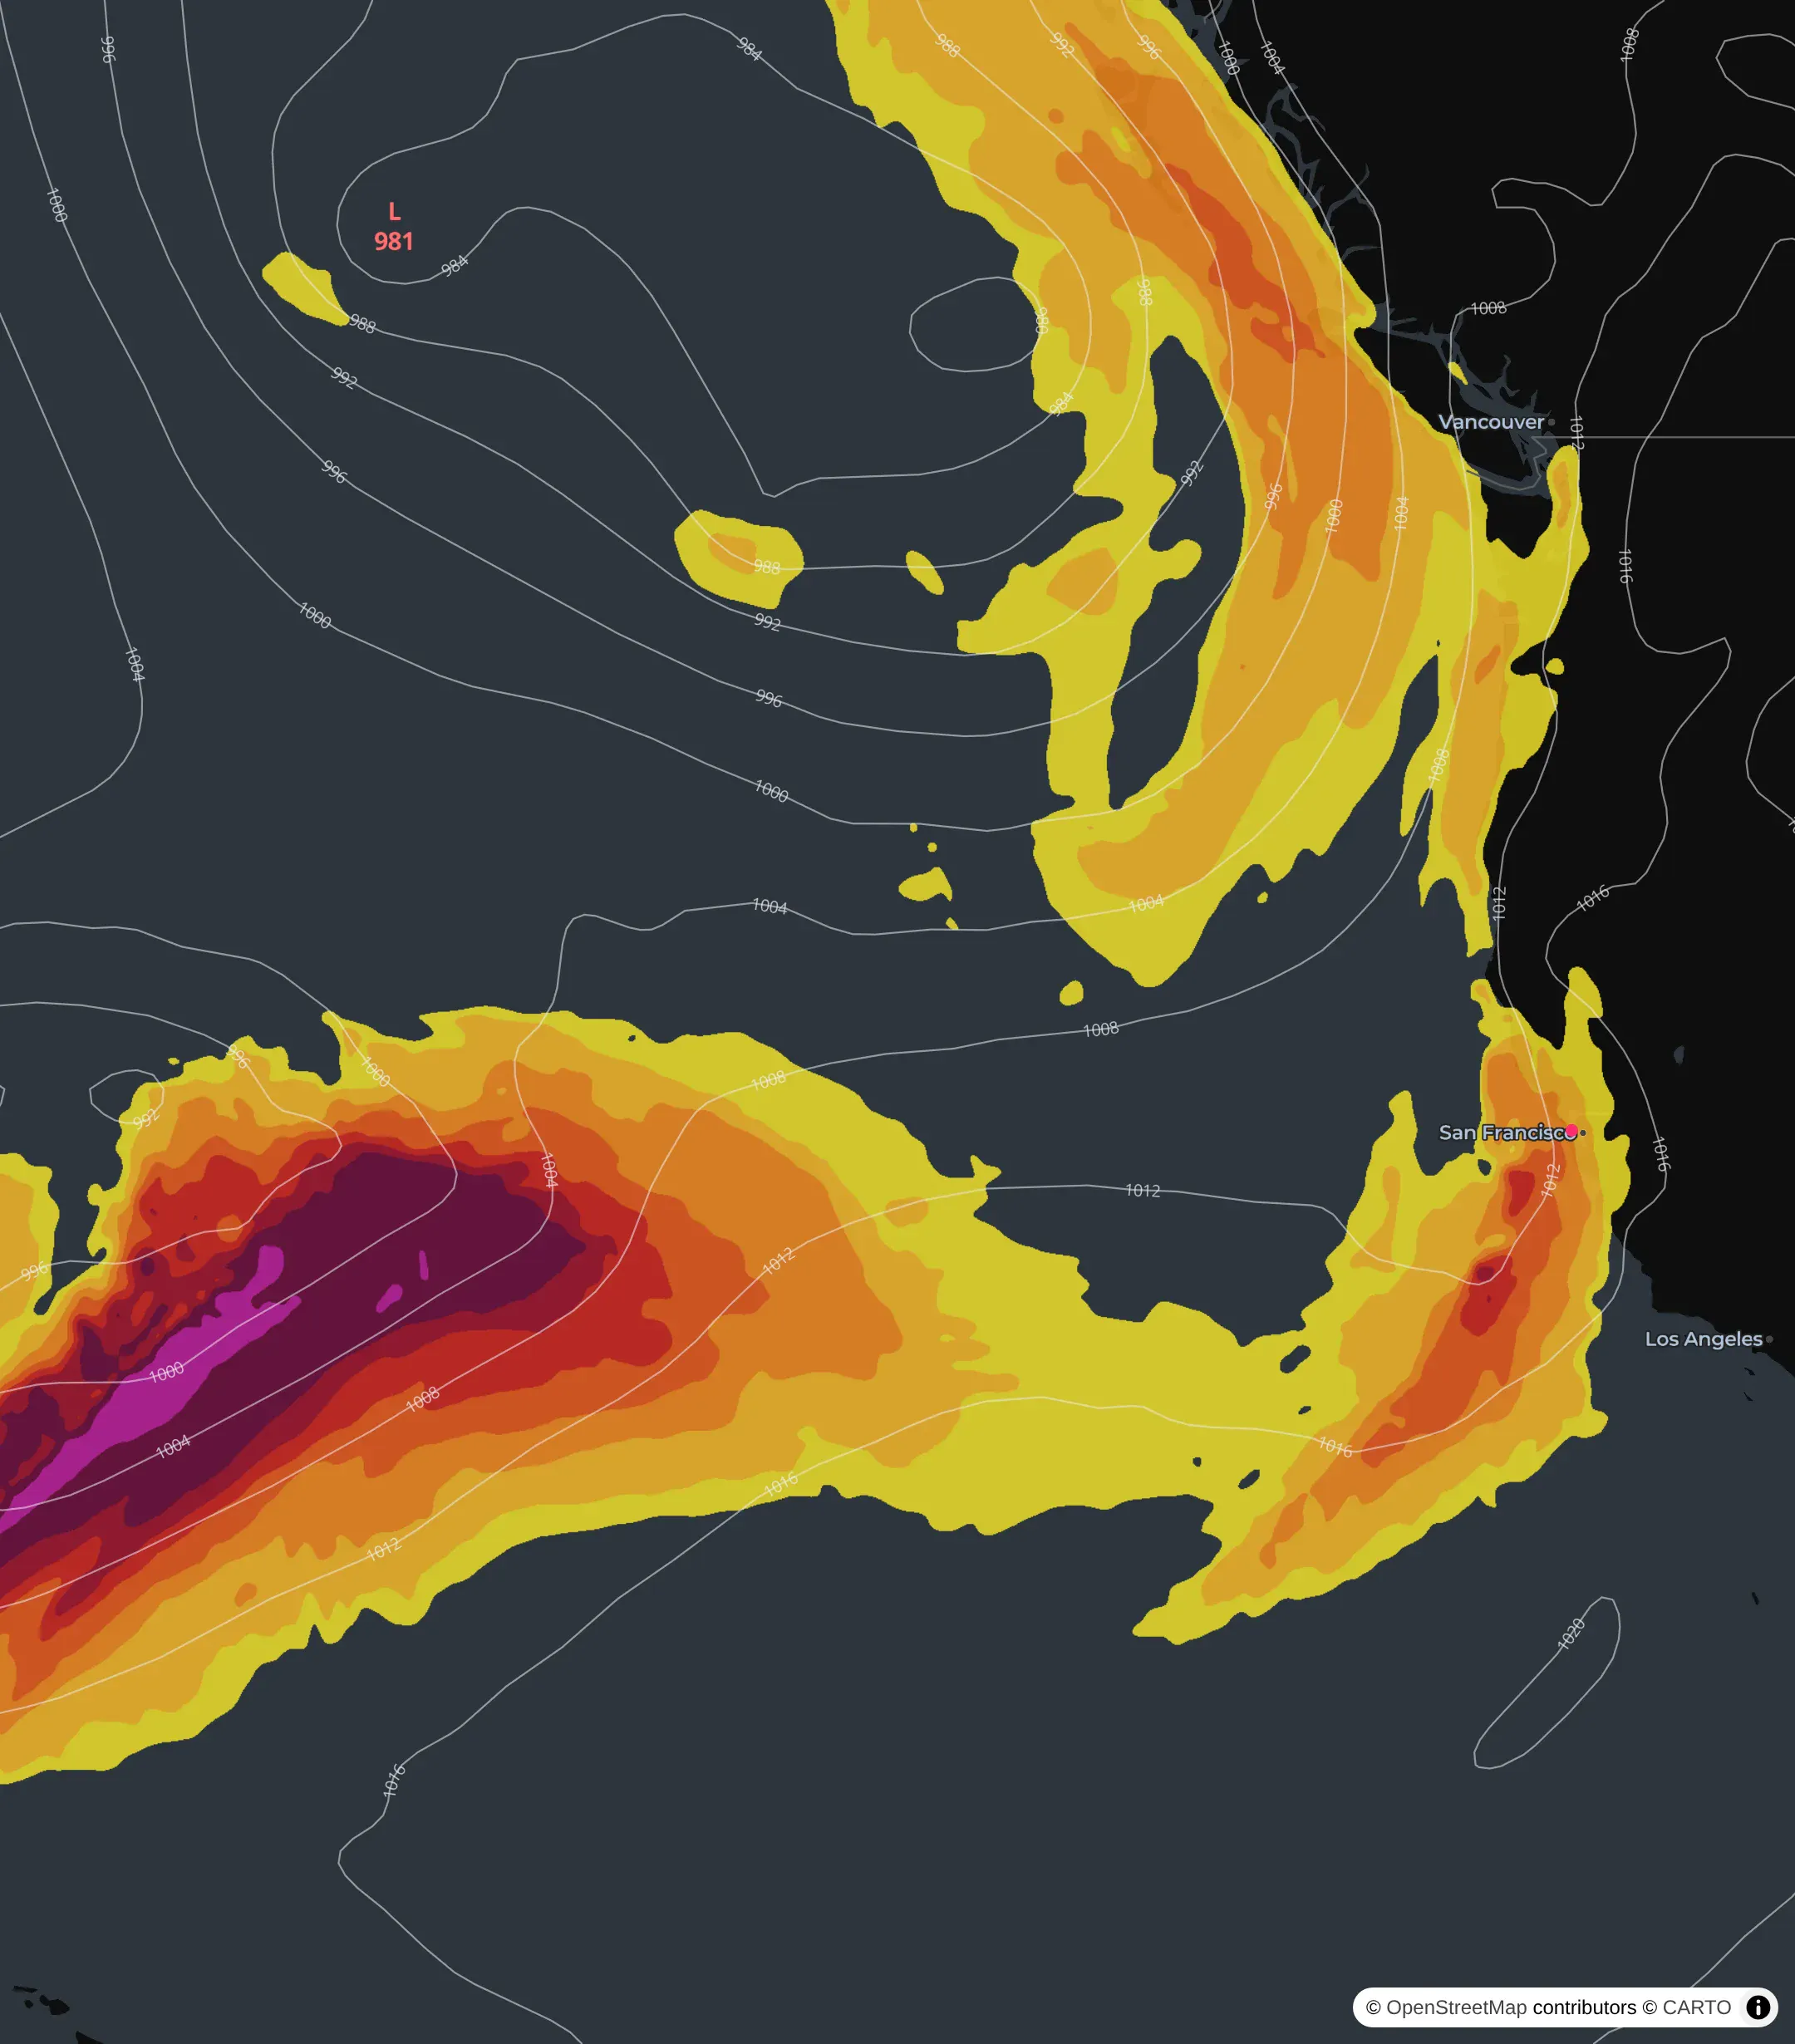
This is the GFS weather model's forecast of an atmospheric river, the long band of moist air behind many of California's big winter storms. The screenshot is from the run of 4 AM Saturday, when the moisture just off the Golden Gate peaked at 4 AM Wednesday.
Both storm maps are computed in the app from NOAA's raw data, not copied from a NOAA image.
The water vapor frames start from GOES-18's Cloud and Moisture Imagery, which NOAA publishes as netCDF files on AWS every 10 minutes. The fetch script takes one scan an hour, reprojects it from the satellite's view to Web Mercator with pyproj, and colors the brightness temperatures into a PNG that lies on the map.
The atmospheric river map starts from the GFS model's GRIB2 output on NOAA's NOMADS server: humidity and wind on eight pressure levels. Python adds those up into the integrated water vapor transport, colors it in bands from 250 kg/m/s, and traces the sea-level pressure every 4 hPa into the isobar lines.
Historical view
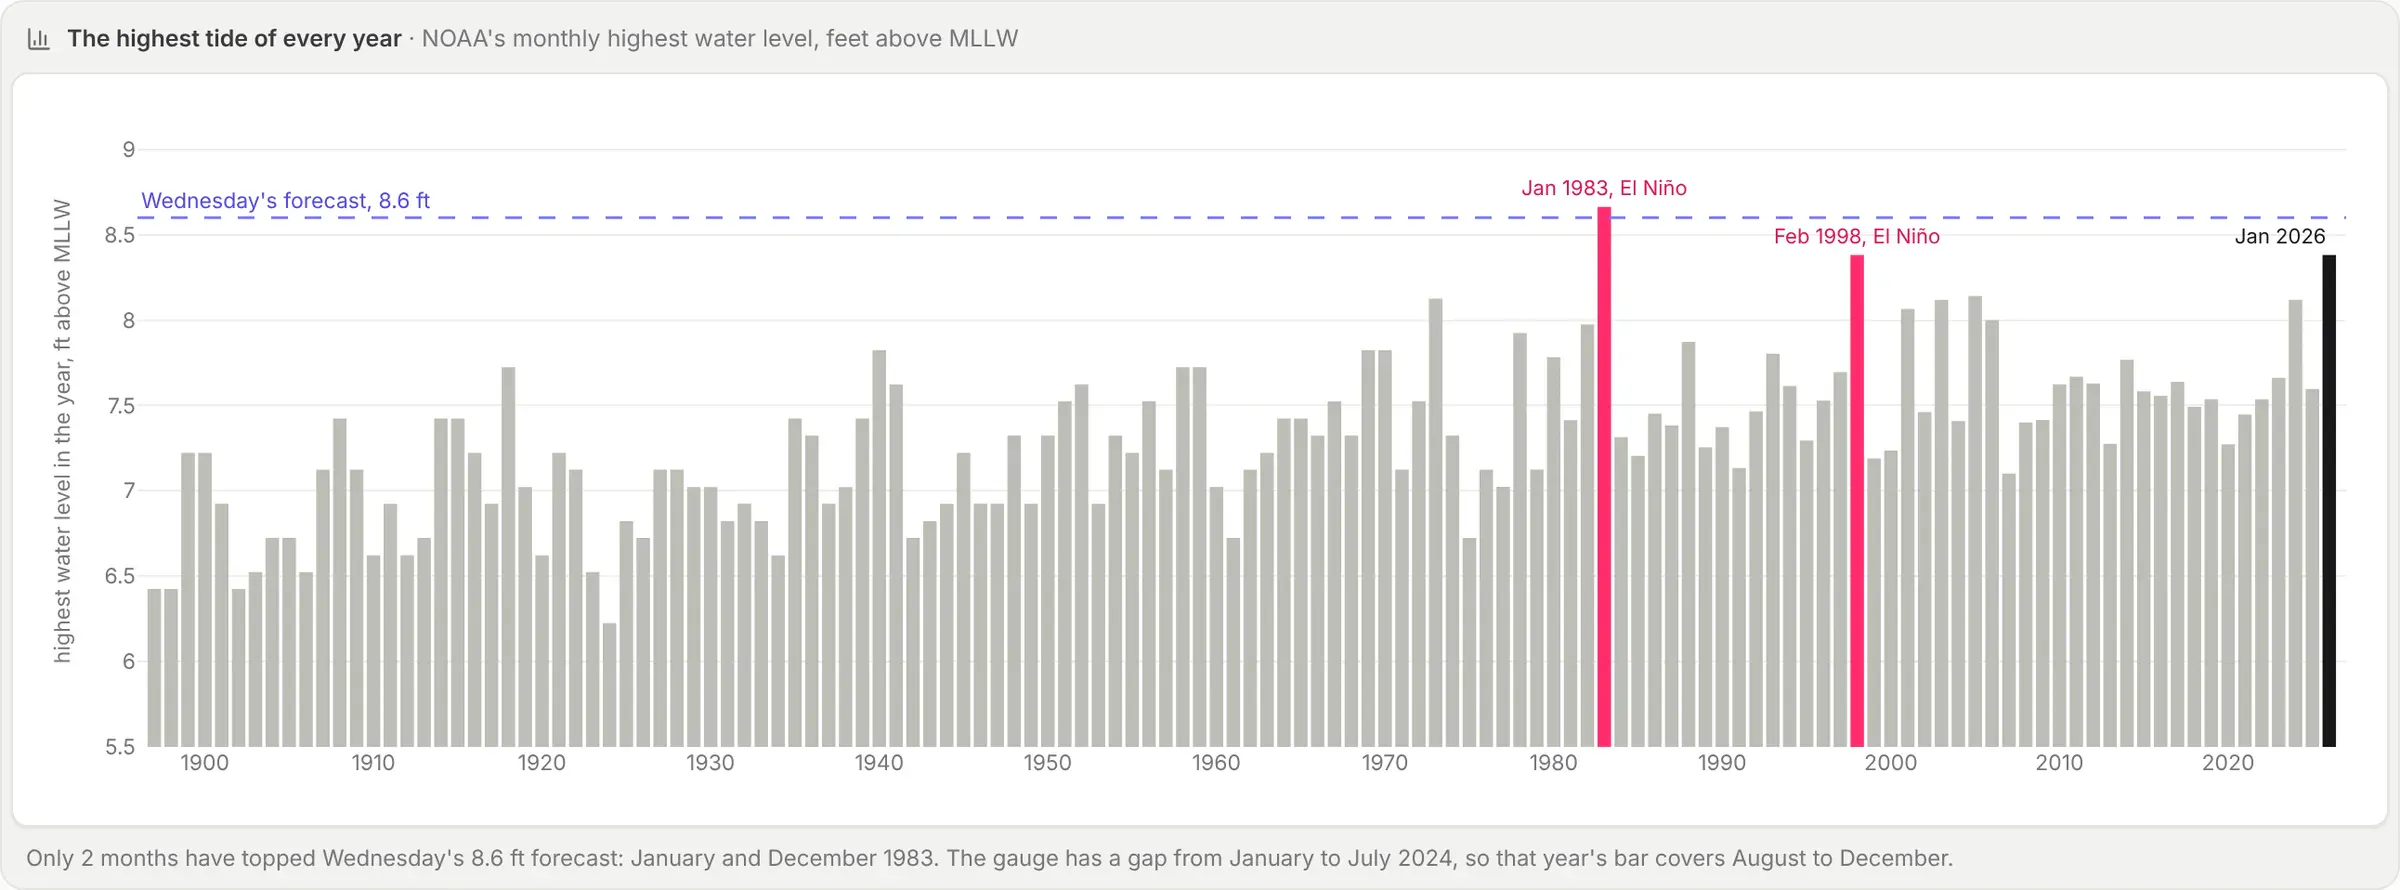
Each bar is the highest tide at San Francisco in one year. On Wednesday, the tide is forecast to be 8.6 ft. In 1983, the tides hit 8.66 ft in January and 8.65 ft in December.
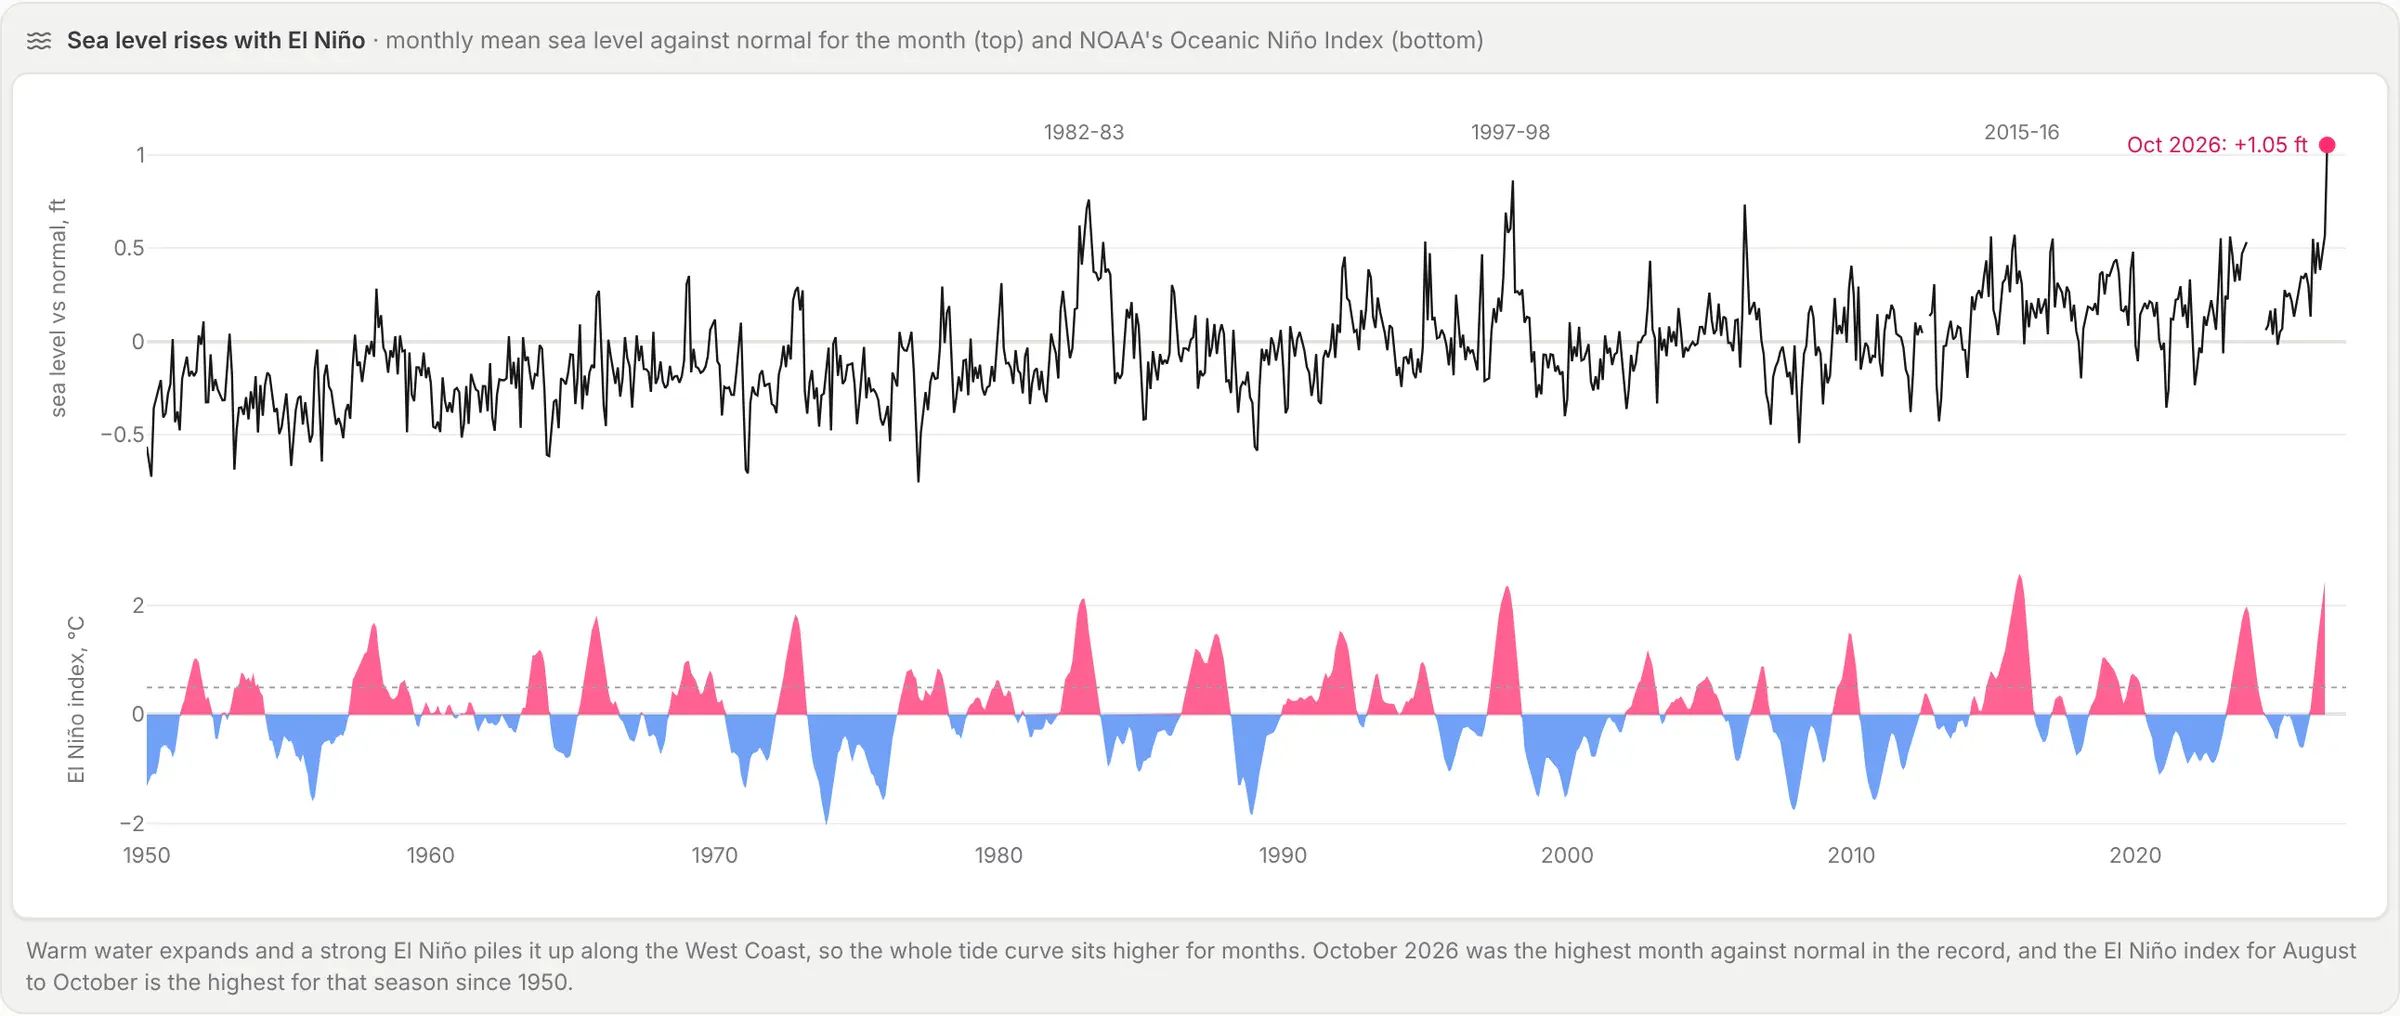
During a strong El Niño the warm Pacific expands and piles up along the West Coast. NOAA's El Niño index for August to October 2026 is +2.46 °C, the highest for that season since 1950. In October the San Francisco gauge sat 1.05 ft above normal for the month, the highest in its record.
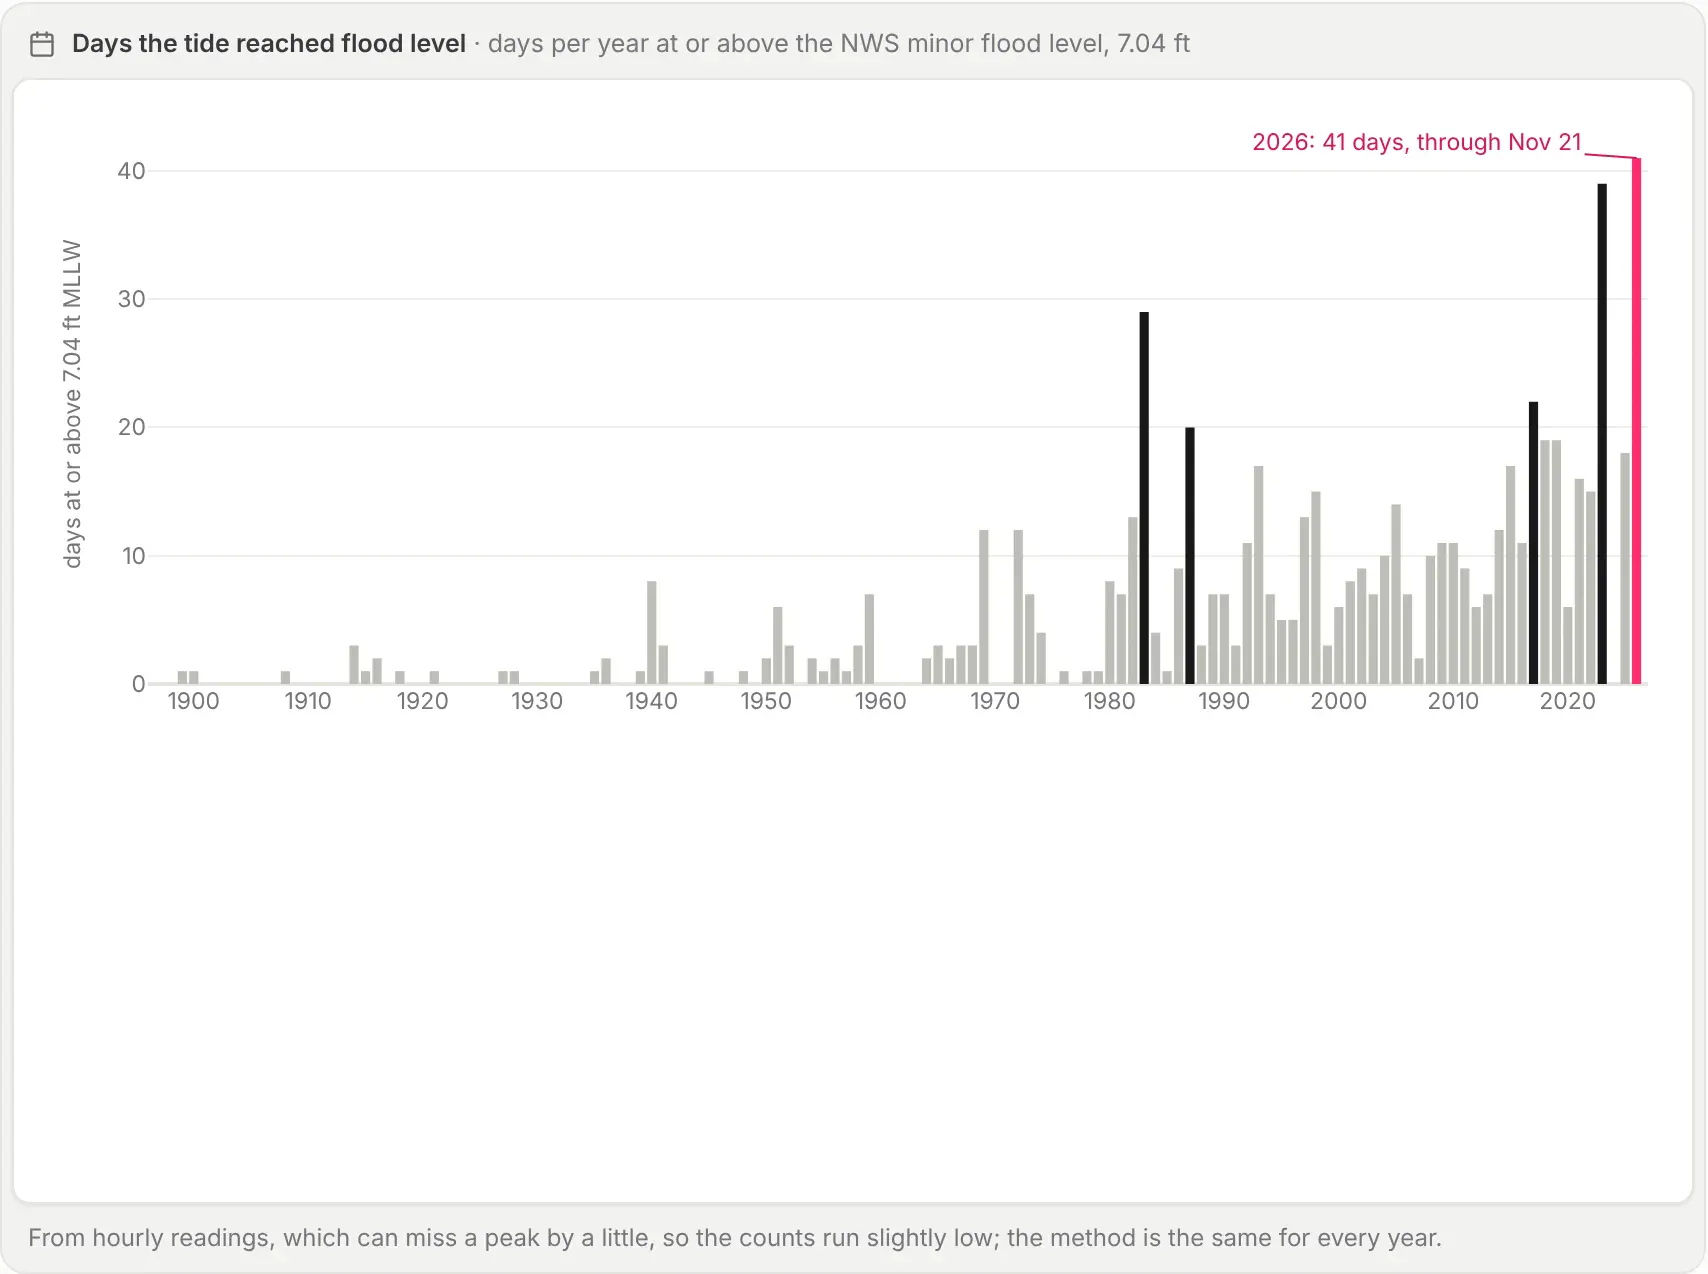
The smaller floods are getting more common. The gauge reached the NWS minor flood level of 7.04 ft on 41 days in 2026 before this week. No full year in the record has had more floods.
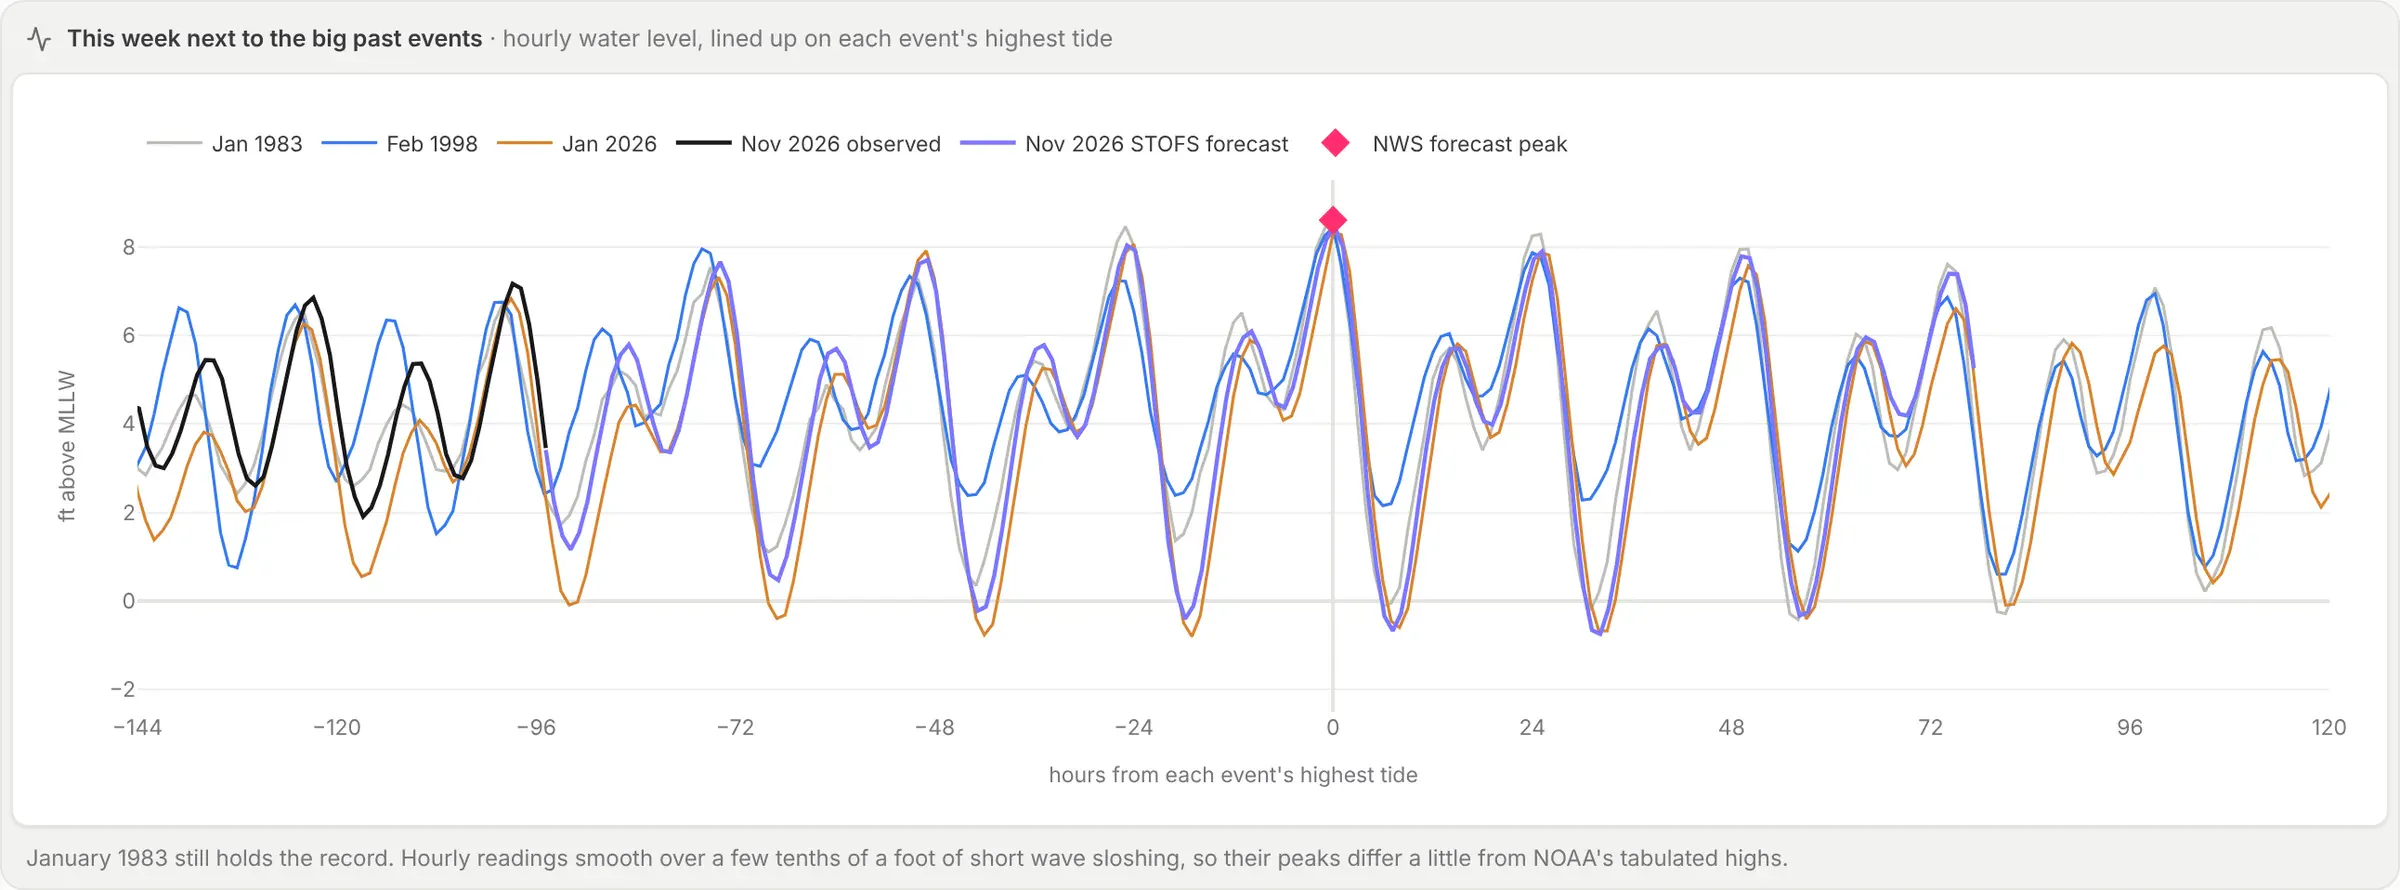
Lined up on their highest hour, this week's forecast follows the January 1983 record almost tide for tide.
Each gauge across the Bay
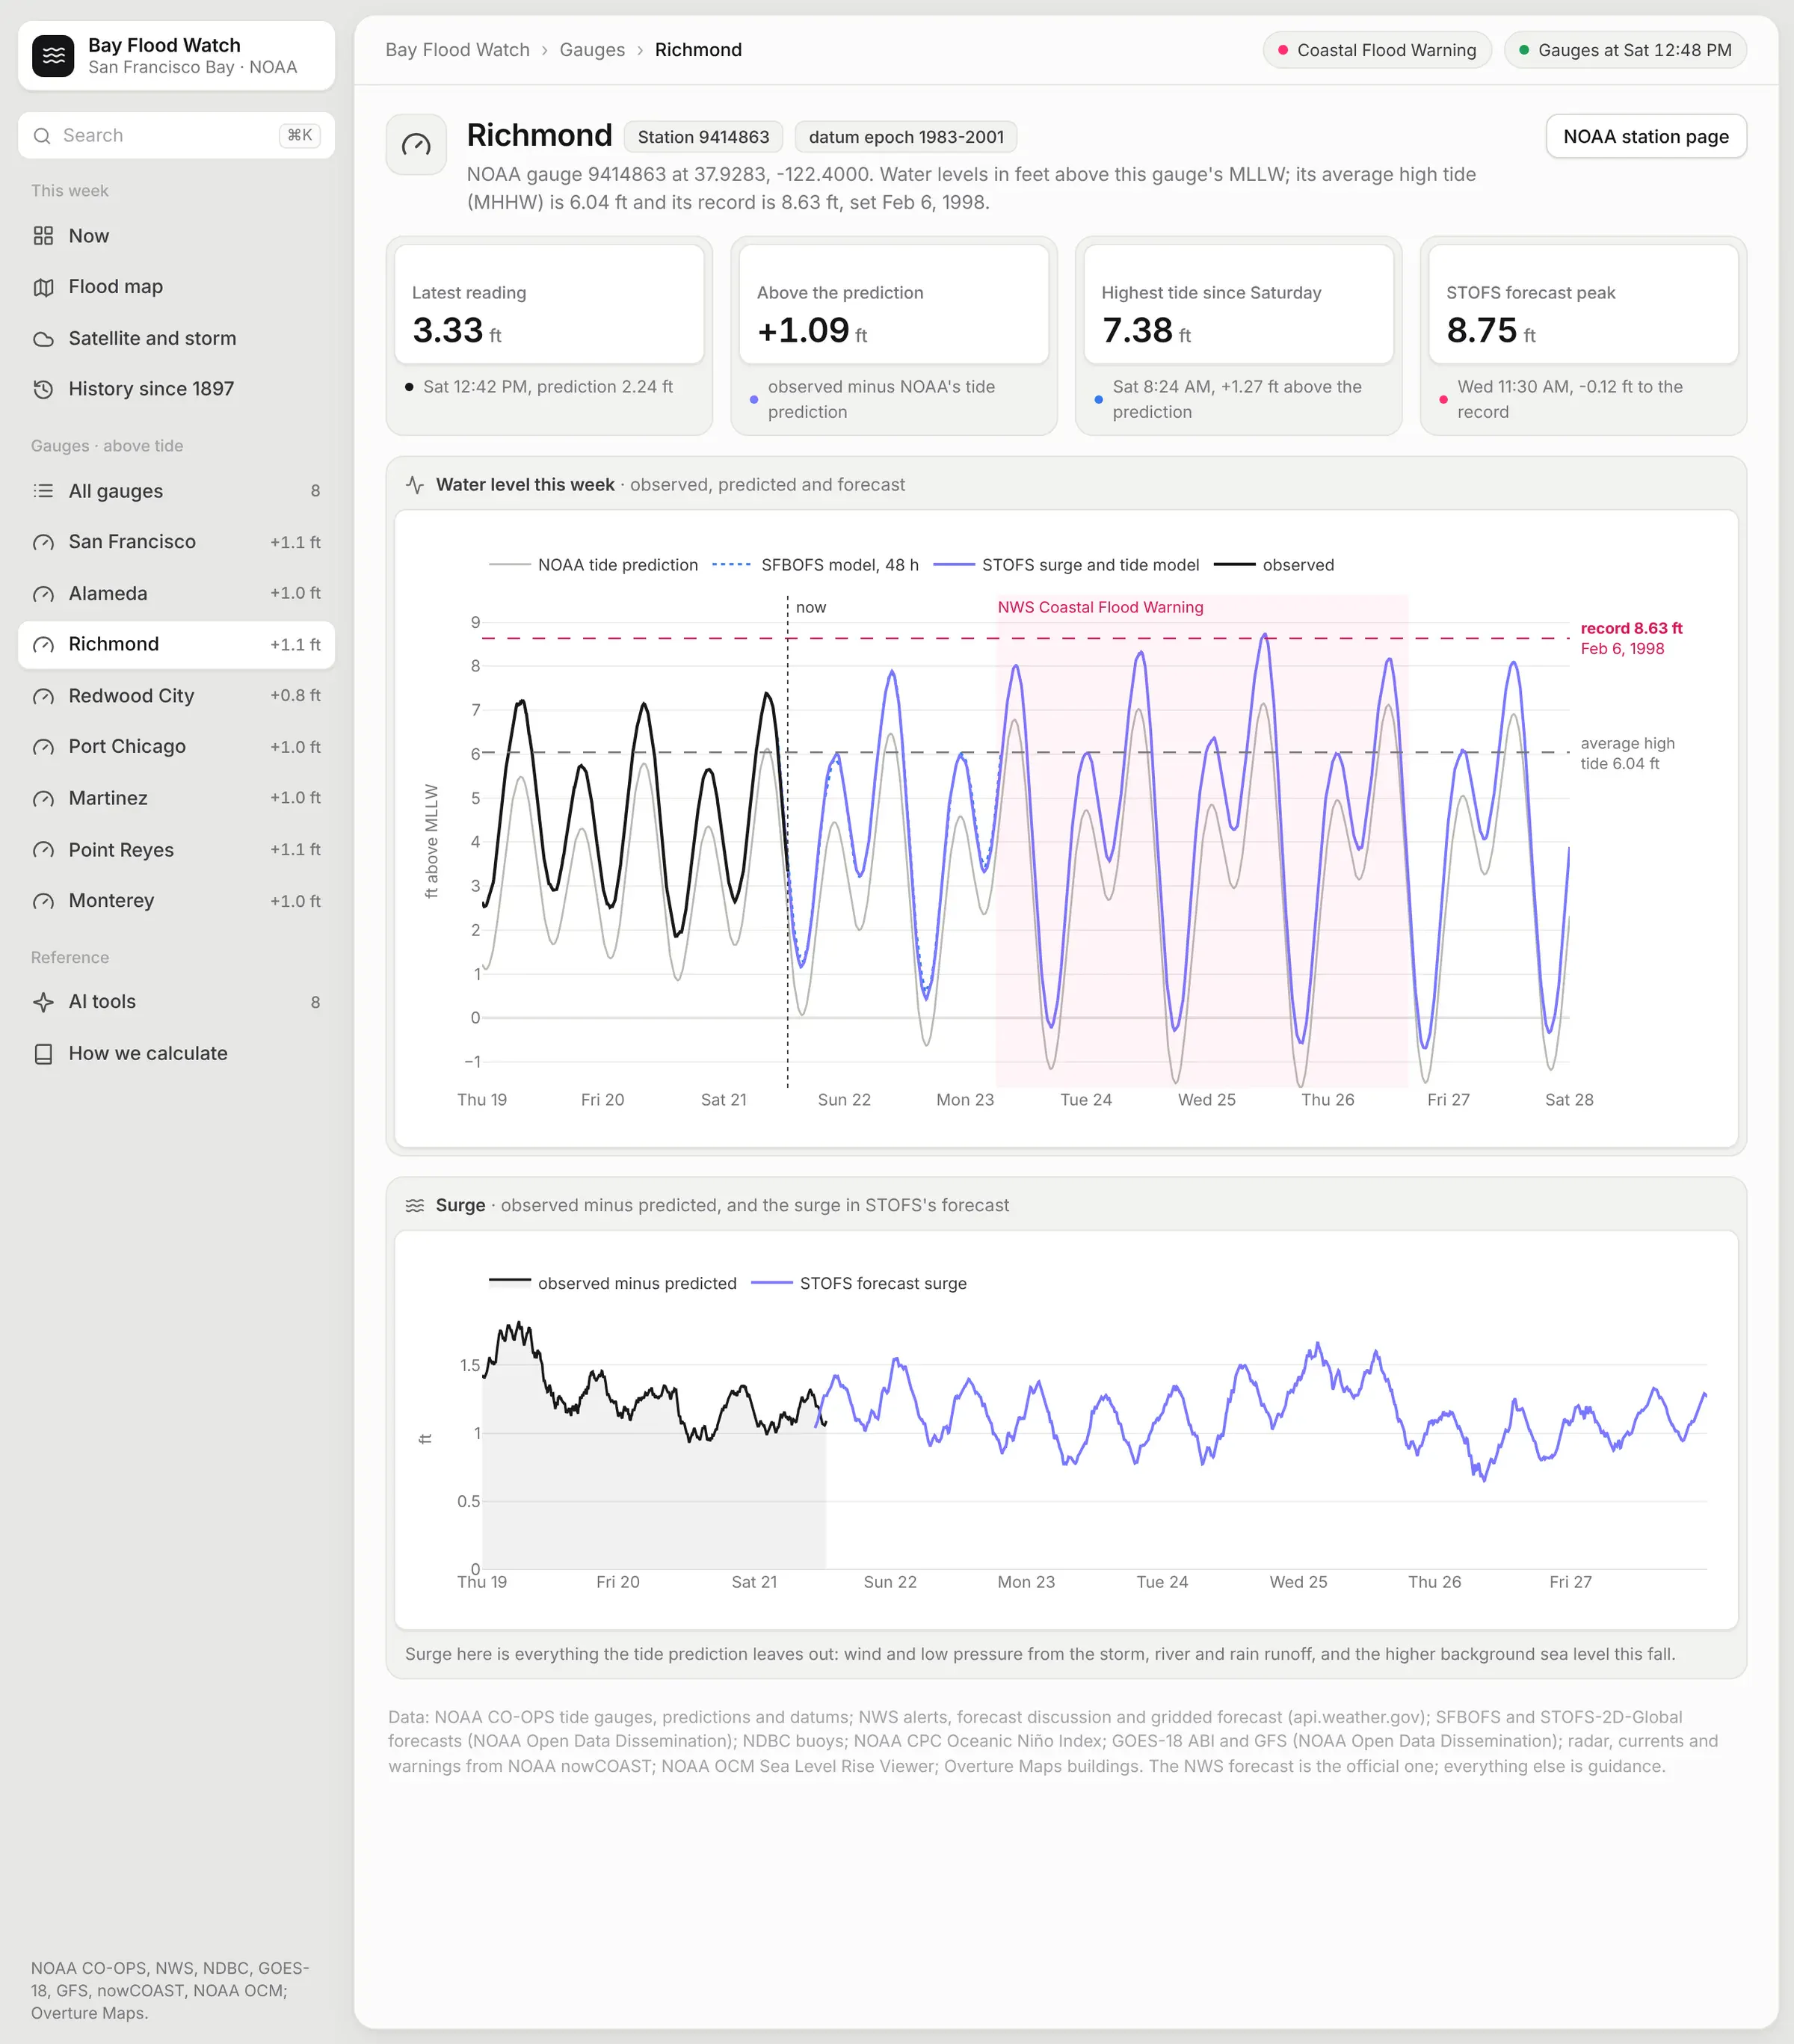
Each of the eight NOAA gauges from Point Reyes to Monterey has its own page in the app.
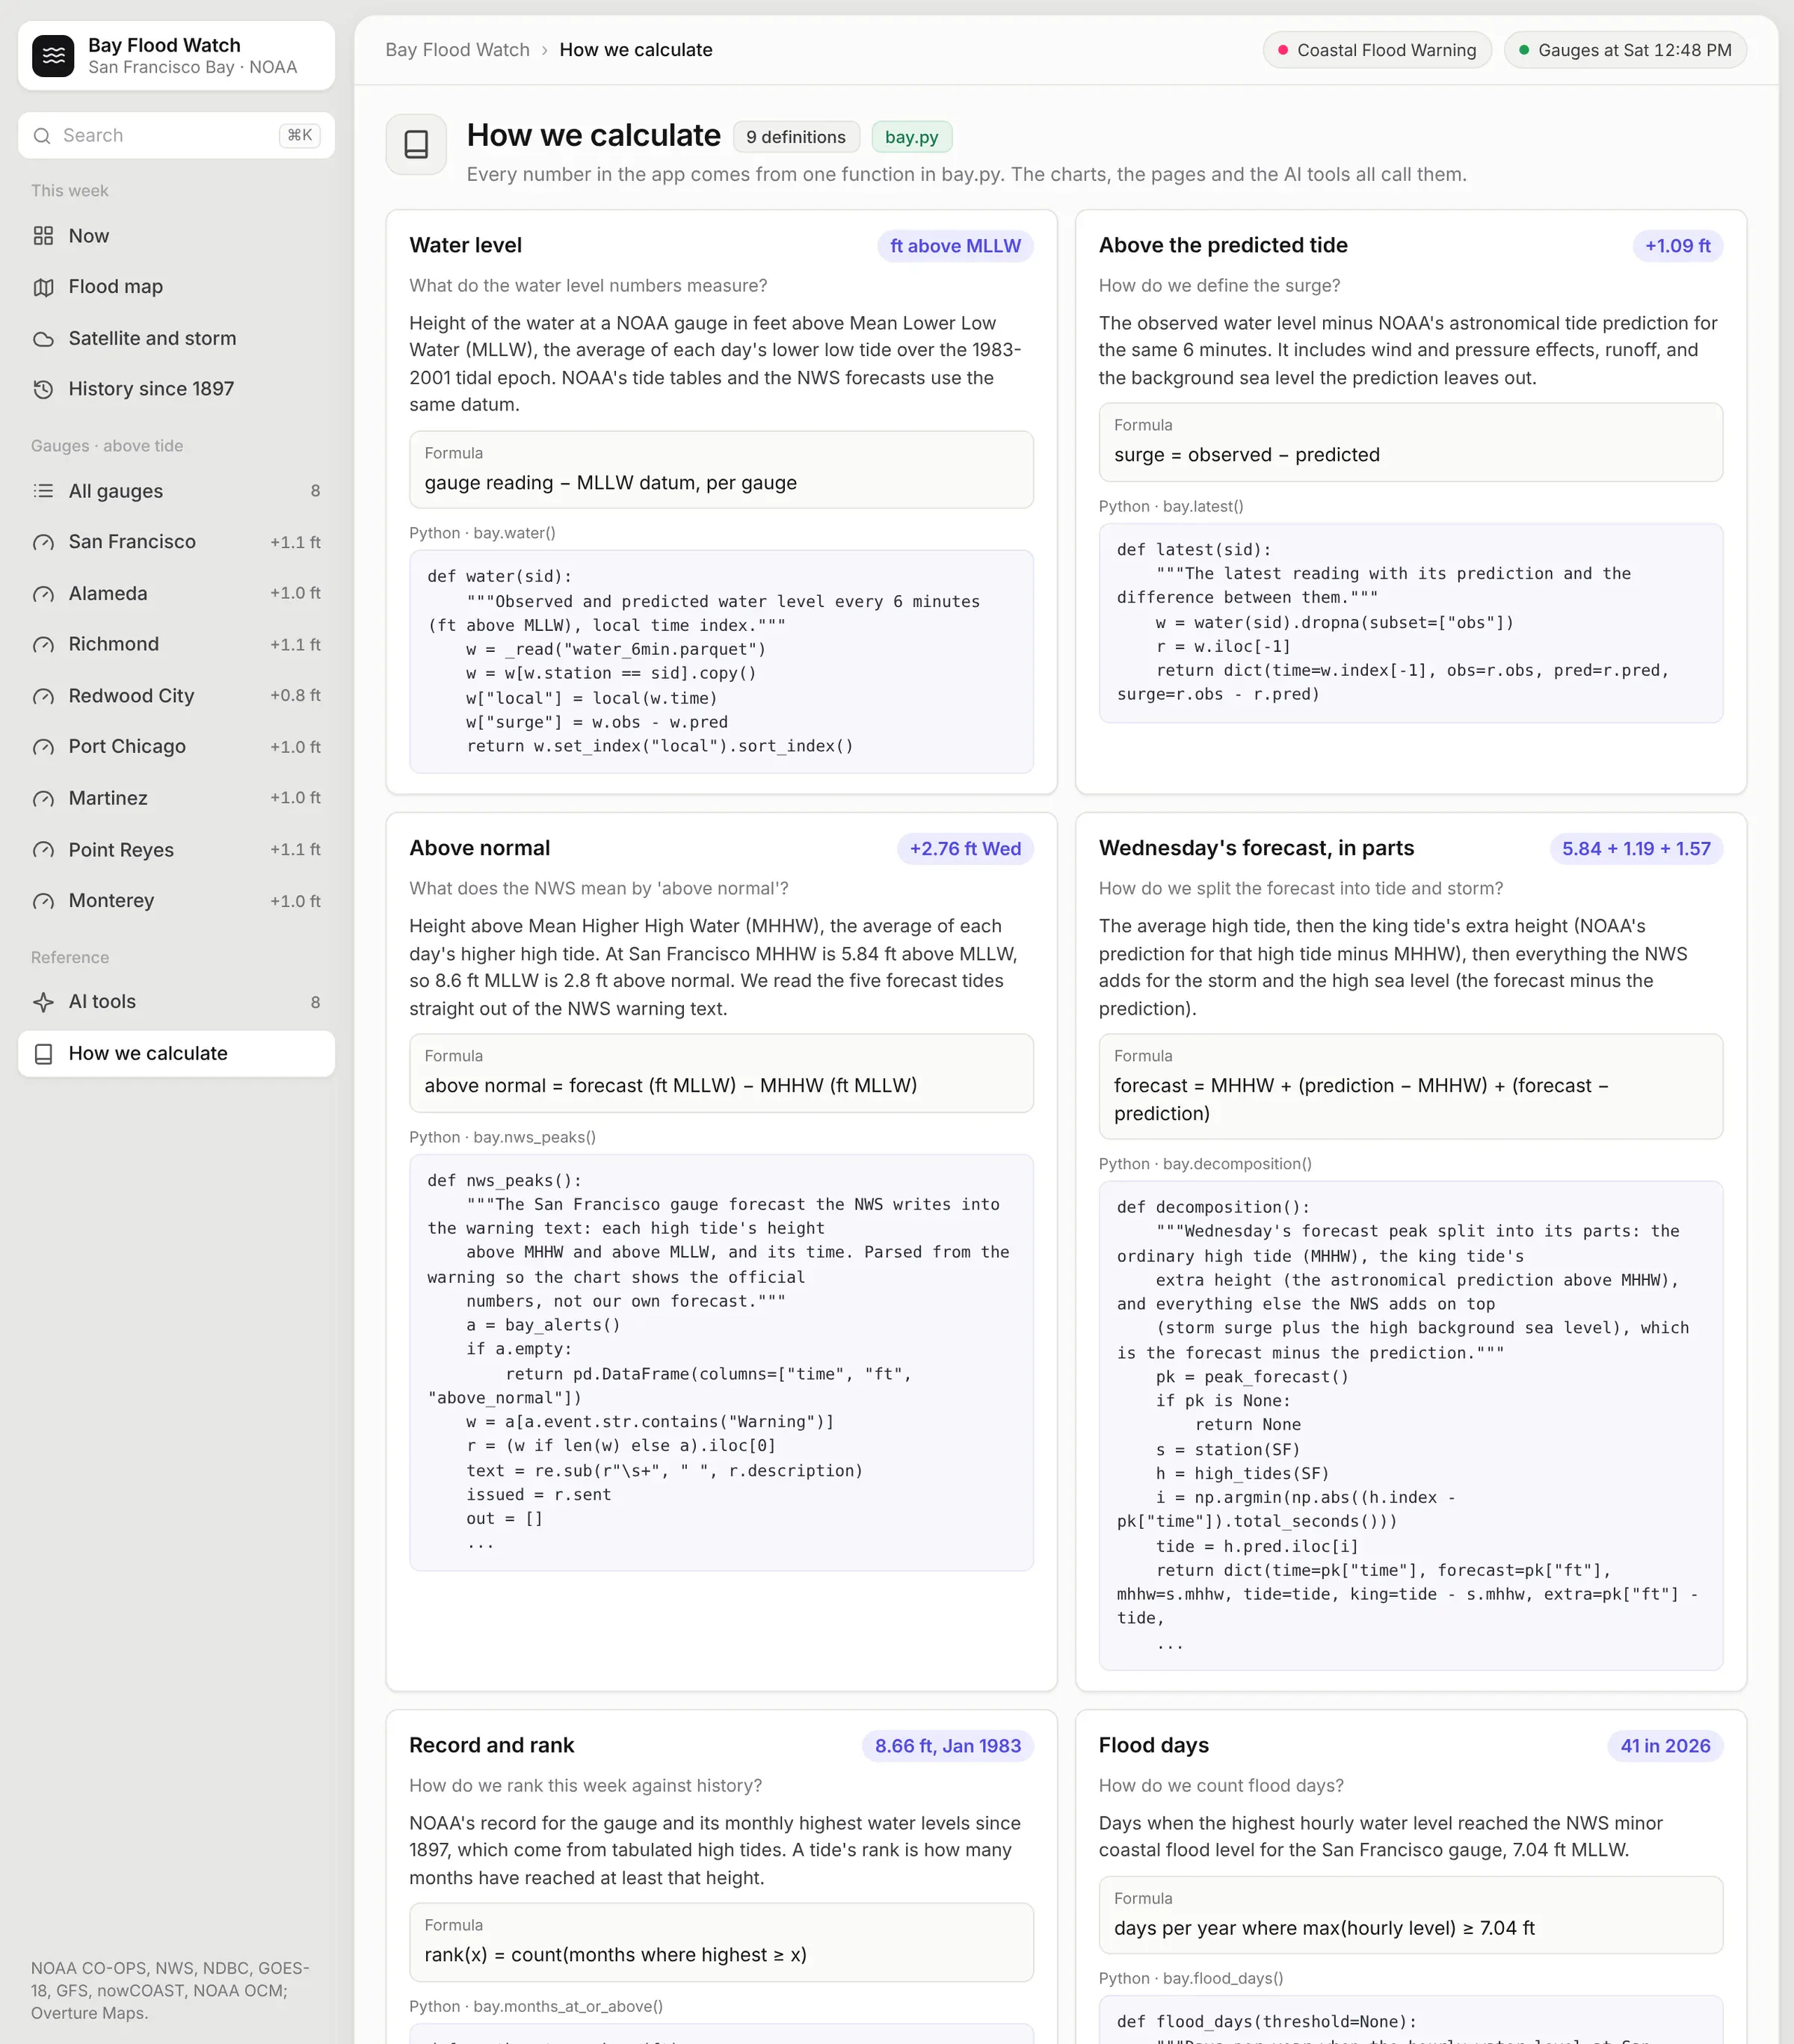
The last page is the semantic layer. It lists every number in the app with its definition and the Python function that computes it.
This page is a nice way to sanity check the numbers and share your work with your viewers.
There are lots of details in here that require care. For example, the forecast models report water level above mean sea level, while the gauges measure from the average lower low tide (MLLW). After converting, the SFBOFS model matched Saturday's observed high tide within 0.02 ft.
Remix it
Everything in the app is public. The NOAA tide data is available along every US coast and the Great Lakes, not just San Francisco. The NWS API covers the whole country, and the Sea Level Rise Viewer covers the coastal US. If you live near a river, NOAA's National Water Prediction Service has river gauges and forecasts that would fit the same kind of app.
The prompt above is a good starting point with your own gauges and alert pages swapped in. It was built with Dash, Plotly and DuckDB by Opus 5.5 and hosted on Plotly Cloud, using the Pro plan's persistent filesystem for the live data.
If you build one for your own coastline or river, please share, I’d love to see it!
How the app is built
The app is a multi-page Dash app in Python, and every chart and map in it is Plotly. These are the main pieces:
- Data. There's one Python script per source. They pull from NOAA's APIs (CO-OPS for the tide gauges and api.weather.gov for the warning and forecasts), from NOAA Open Data Dissemination on AWS (the SFBOFS and STOFS models and the GOES-18 imagery) and from NOAA's NOMADS server (the GFS model). Each script saves Parquet files, and the app reads those.
- Flood map. DuckDB's spatial extension joins the 2 million Overture building footprints with NOAA's inundation polygons and turns both into vector tiles with ST_AsMVT. The zoomed-out tiles are built ahead of time and stored in a DuckDB table, and DuckDB draws the close-up tiles when the map asks for them. A Flask route inside the Dash app serves the tiles to a Plotly map, which draws them with MapLibre. The radar, satellite, currents and warning layers go straight from NOAA nowCOAST to your browser.
- Semantic layer. Every number in the app comes from one Python function in a module called bay.py, and the charts and the AI tools both call those functions. The “How we calculate” page shows each one with its definition, its formula and its code. That's the app's semantic layer, so if a definition changes, it changes in one place.
- MCP tools. The app is created with Dash(enable_mcp=True), and eight of those functions are marked with @mcp_enabled. Each one becomes a tool that Claude, ChatGPT or another assistant can call over MCP. Its type hints become the tool's schema and its docstring becomes the instructions. If you connect an assistant to the app and ask how Wednesday's forecast ranks in history, it answers with the app's own numbers. On Plotly Cloud you can also switch on Plotly Studio Embedded, a chat panel inside the app that calls the same tools and charts what they return.
- Live data. The app runs on Plotly Cloud. A background thread in the app refreshes the tide gauges every 10 minutes and the NWS forecast, buoys and water level models every 30. It keeps those files on a persistent filesystem, a Plotly Cloud feature on the Pro plan, so when the app restarts or I publish a new version, it starts from the latest readings.
- Scheduled updates. A scheduled Claude Code agent runs every 6 hours, and every 3 hours from Monday. It refreshes the satellite loops and the GFS forecast and saves a snapshot that shows up under Forecast updates in the app. Then it takes new screenshots of the app for that update and republishes the app.
Each Layer of Data
Here’s a deep dive on the various data feeds available and what they look like in their raw form, in their post processed form, and combined with other sources.
Buildings Data
Overture Maps publishes building footprints for the whole world as GeoParquet files on Amazon S3. DuckDB reads release 2026-11-18.0 straight from the bucket and keeps the 1,996,999 footprints around the Bay in a 263 MB file. This is one row:
{"id": "00cd8ec7-f656-44d5-8612-4d20333bc460", "class": "apartments", "subtype": "residential","height": 4.1929, "num_floors": 1, "name": "Indian Creek Leasing Office and Rec Center","xmin": -122.24923, "ymin": 37.53883, "xmax": -122.24891, "ymax": 37.53914,"geometry": "010300000001000000170000007808E3A7F18F5EC03B5A30 ... (WKB bytes)"}
The app tests every footprint against NOAA's flood polygons with a spatial join in DuckDB. At 3 ft, 21,585 touch water connected to the Bay and 32,155 sit only on low-lying land behind levees. Overture has no Redwood City boundary in this release, so those buildings count as unincorporated San Mateo County.
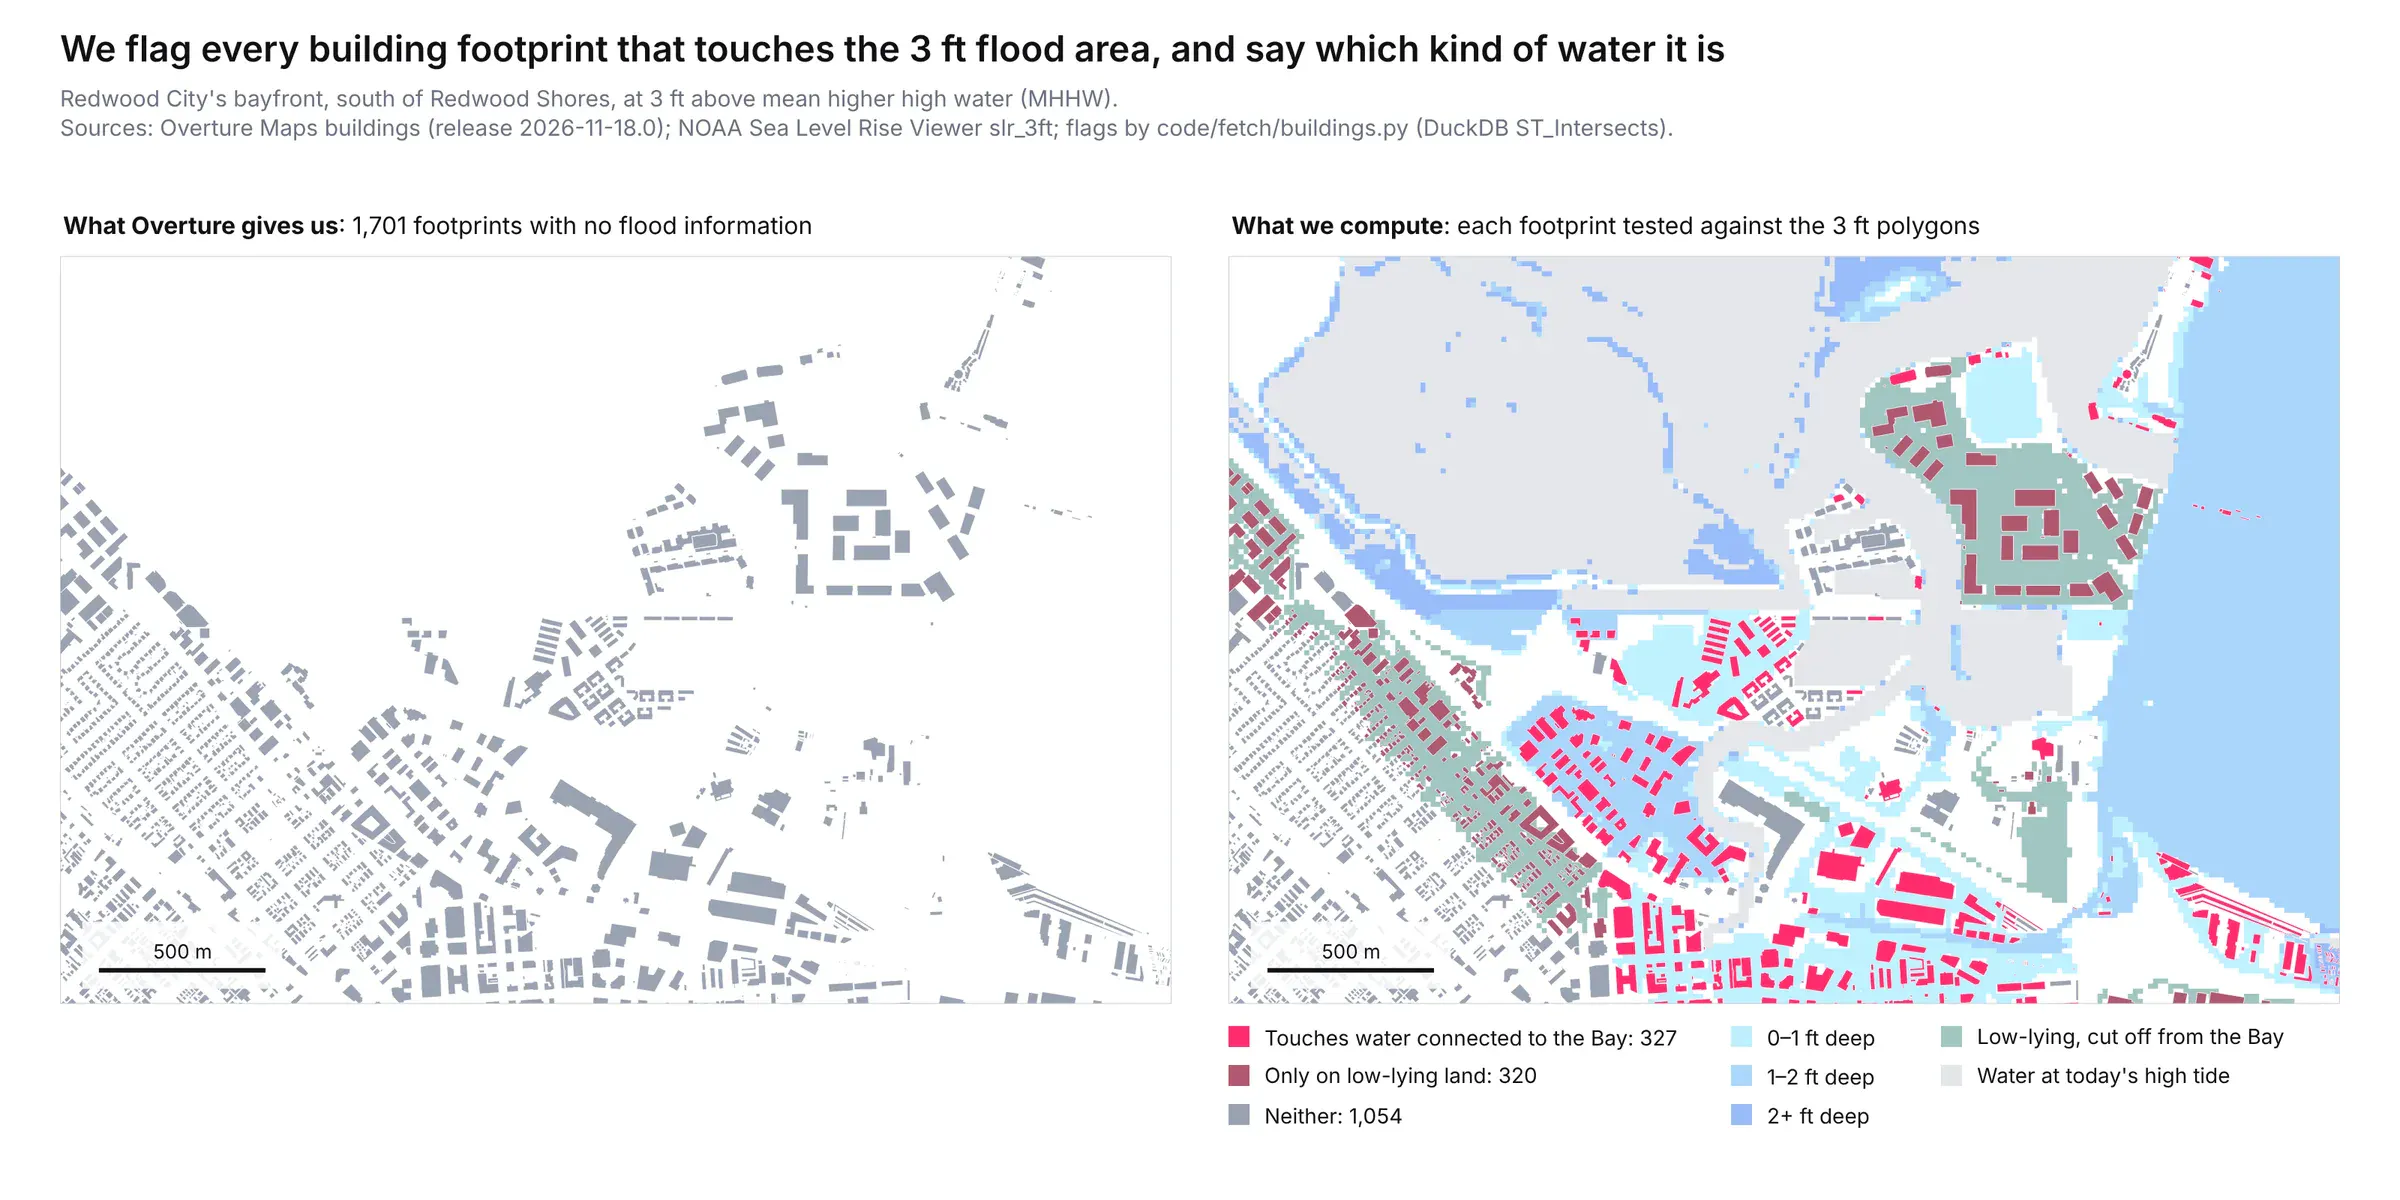
Redwood City's bayfront at 3 ft: 1,701 footprints, 327 touching connected water and 320 on low-lying land.
Inundation Data
NOAA's Sea Level Rise Viewer only publishes its flood areas as cached map tiles, so the app reads those. Each one is a small PNG with colors and no numbers:
https://coast.noaa.gov/arcgis/rest/services/dc_slr/slr_3ft/MapServer/tile/13/3166/1311-> 1,701 byte PNG, 256x256 px, mode P, 71 colors
The app turns 720 tiles per water level into polygons with this routine:
- Stitch the tiles into one image of 6,144 × 7,680 pixels.
- Read the depth from the half-foot level at which each pixel first turns wet.
- Trace the outlines with rasterio and smooth them with shapely.
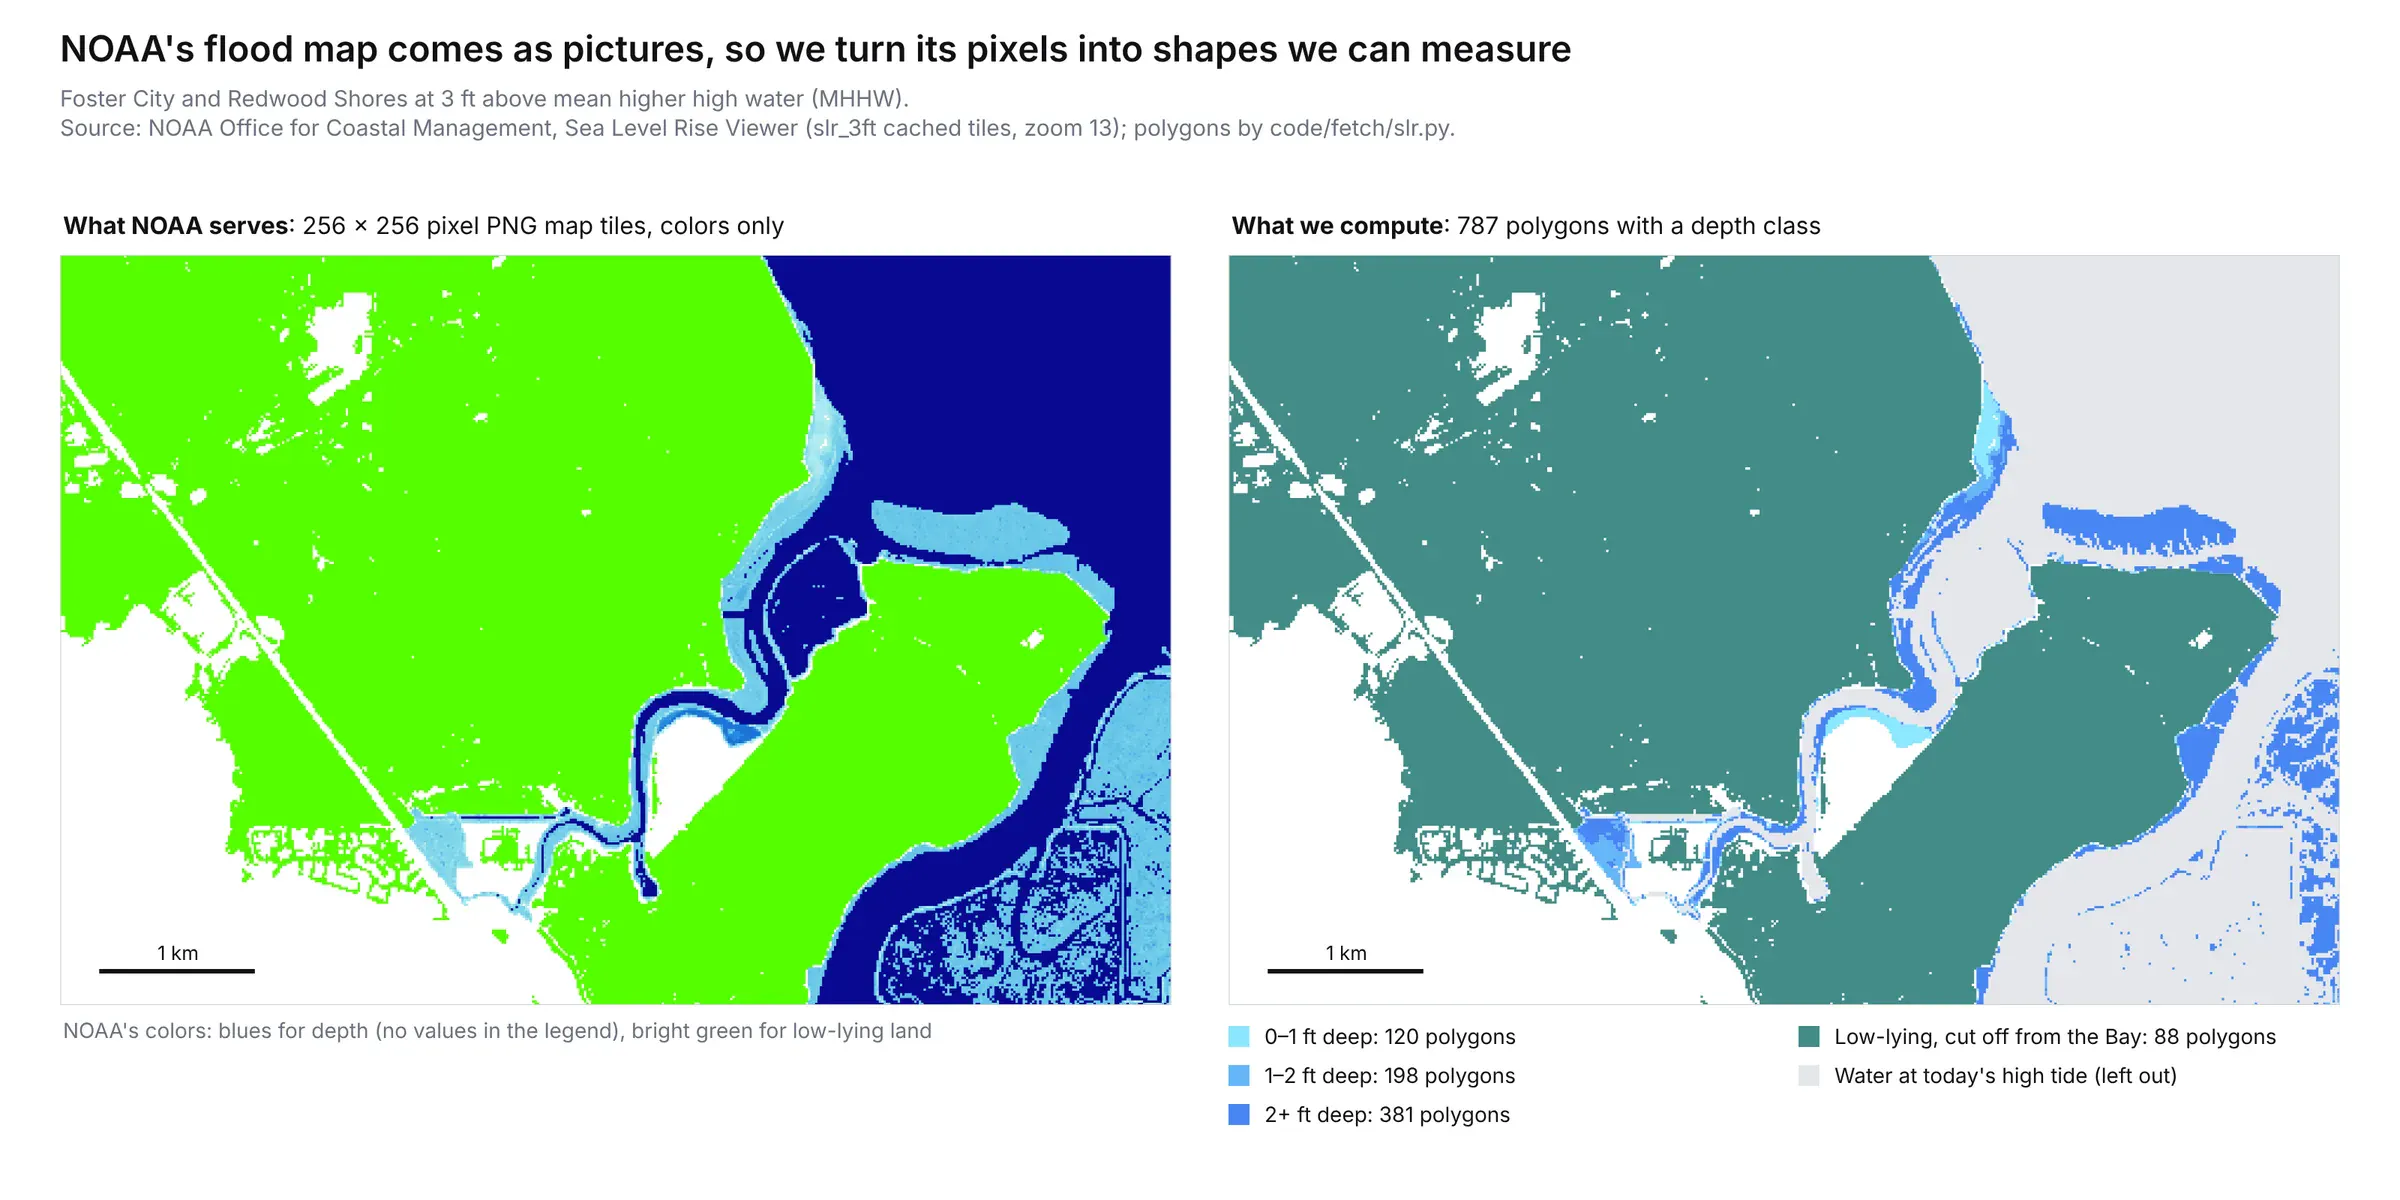
Foster City and Redwood Shores at 3 ft: NOAA's tiles as downloaded, then the 787 polygons the app generated from those images.
Tide Gauge Data
NOAA's CO-OPS API returns a gauge's water level as JSON, one reading every 6 minutes:
{"metadata": {"id": "9414290", "name": "San Francisco", "lat": "37.8063", "lon": "-122.4659"},"data": [{"t": "2026-11-22 01:12", "v": "2.583", "s": "0.141", "f": "1,0,0,0", "q": "p"}]}
Field
Value
What it means
t
2026-11-22 01:12
Time in GMT, 5:12 PM PST on Saturday
v
2.583
Water level in feet above MLLW
s
0.141
Standard deviation of the one-second samples behind it
f
1,0,0,0
NOAA's four quality checks; one sample was an outlier
q
p
Preliminary, not yet verified by NOAA
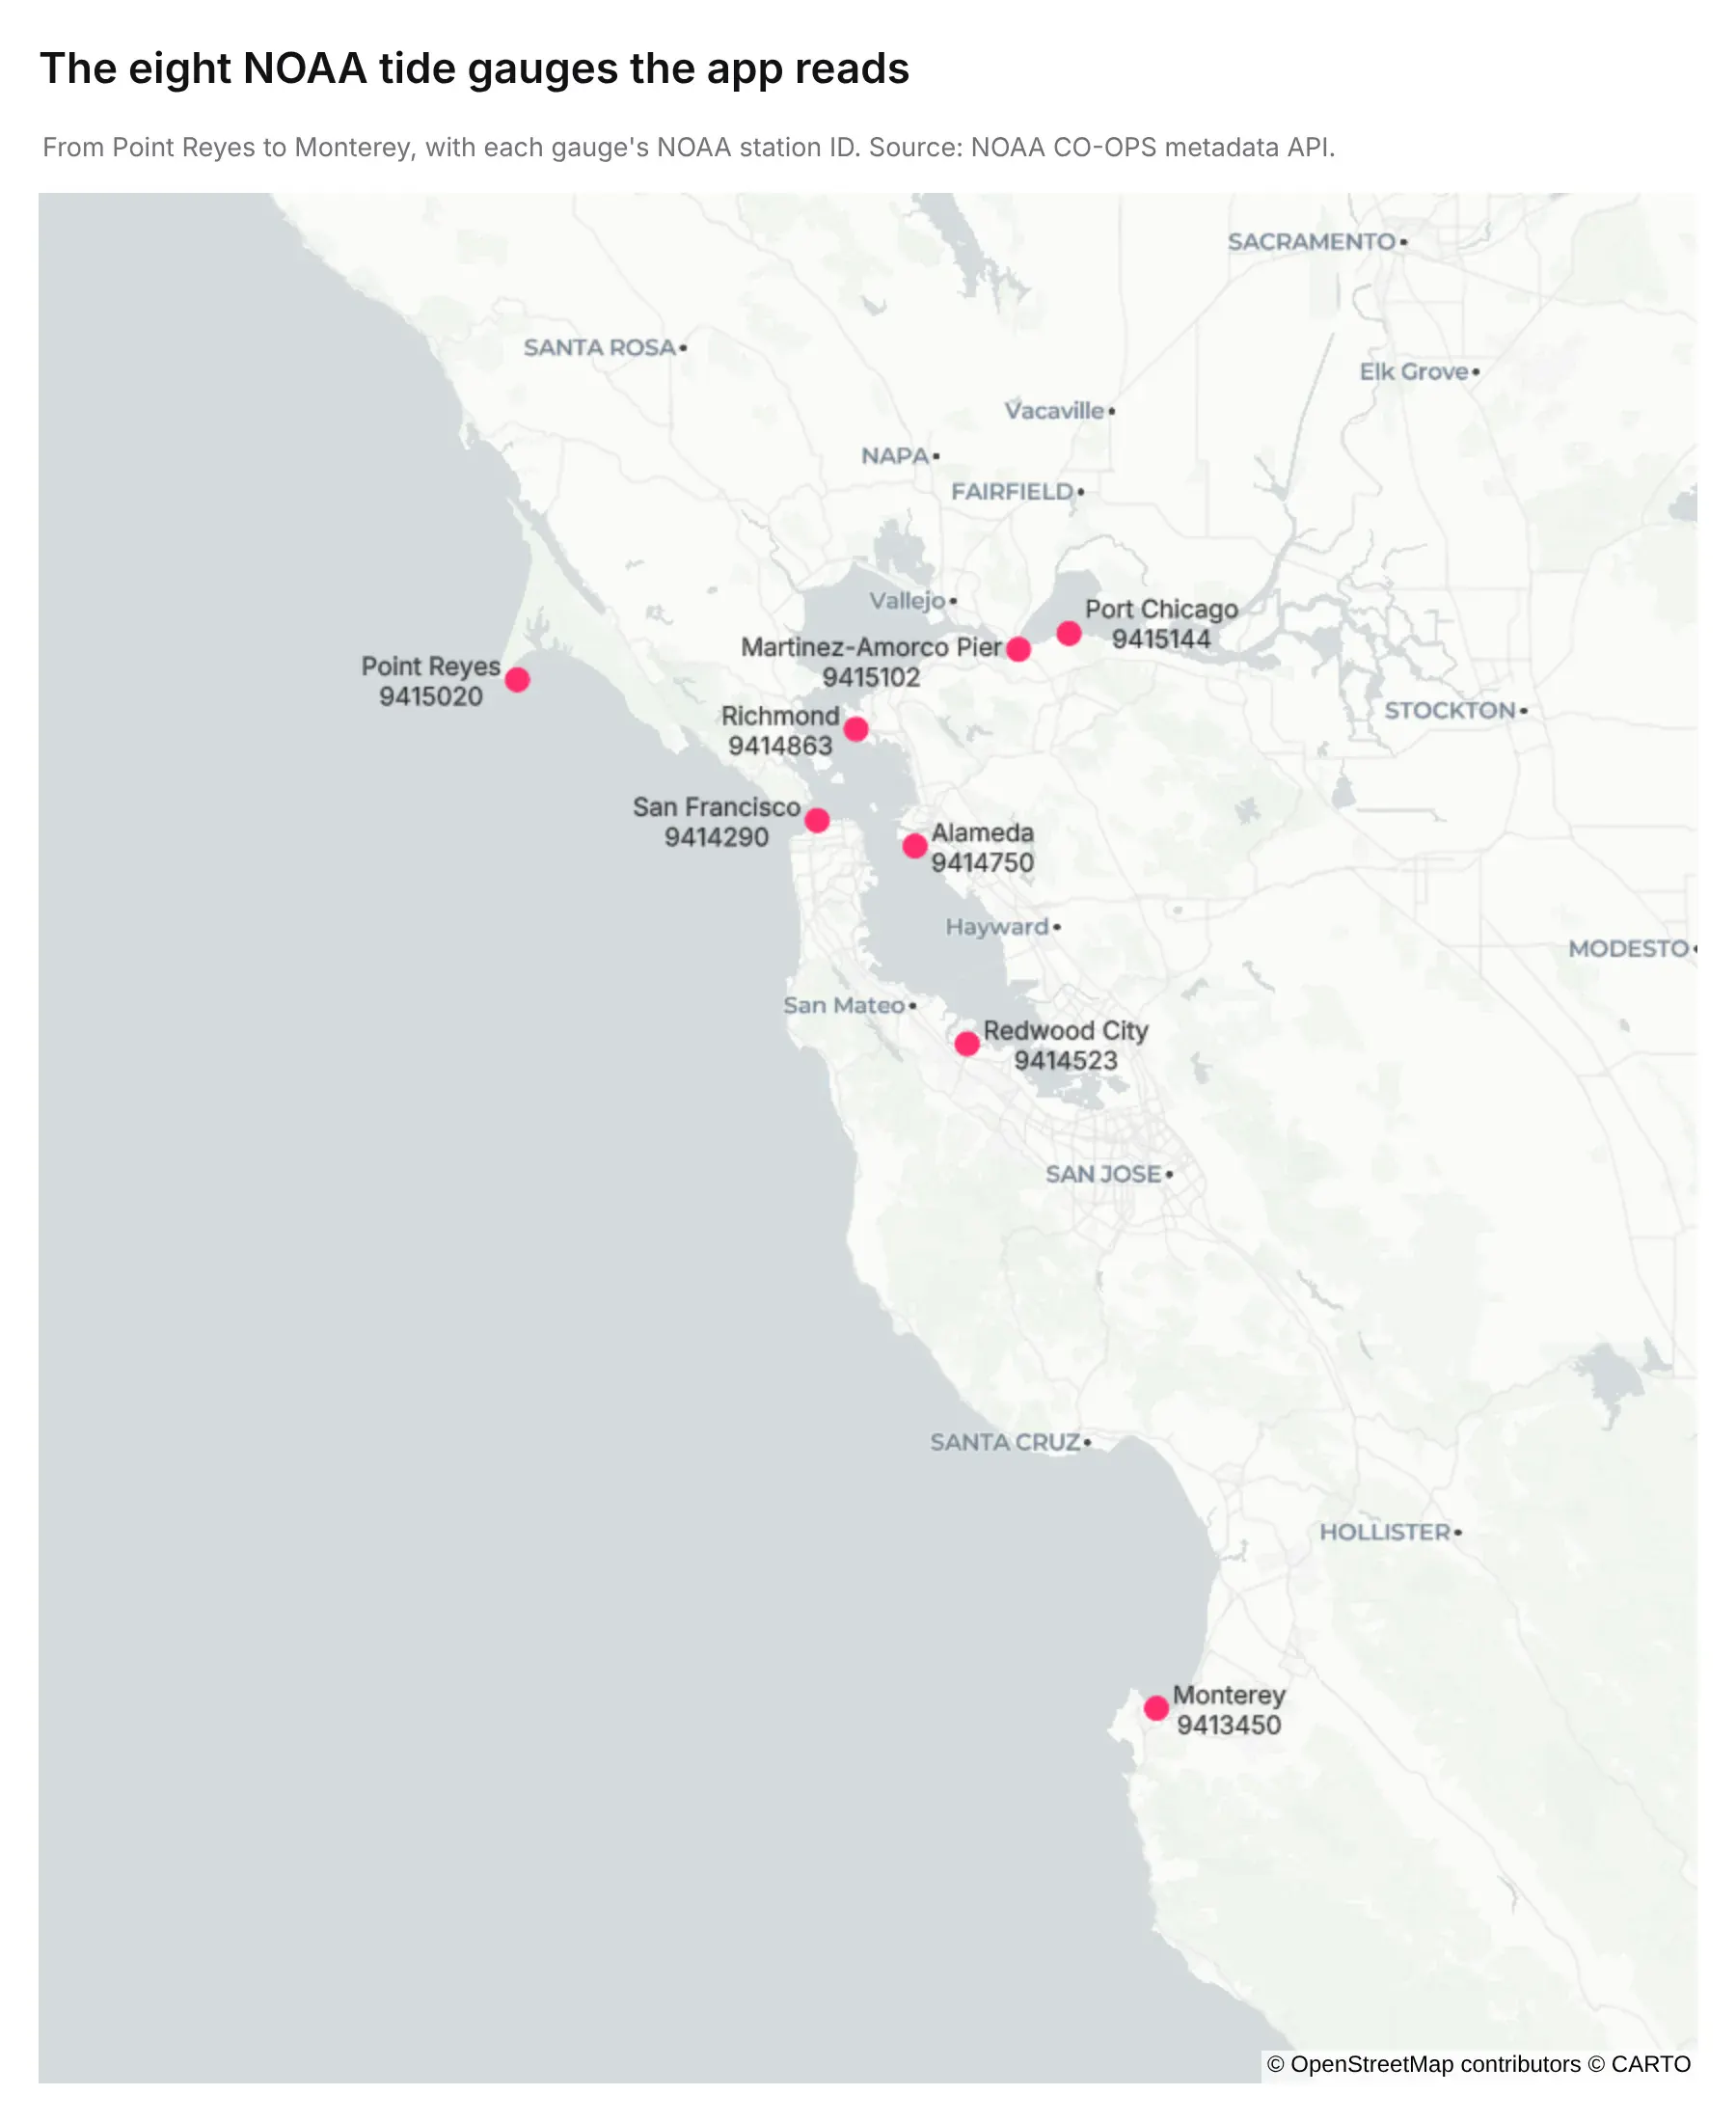
The eight gauges the app reads, with their NOAA station IDs.
Tide Predictions
NOAA's tide predictions come from the same API in the same shapes every 6 minutes. Tides are predictable years ahead. These are the minutes around Wednesday's high tide at San Francisco:
{"predictions": [{"t": "2026-11-25 18:36", "v": "7.013"},{"t": "2026-11-25 18:42", "v": "7.024"},{"t": "2026-11-25 18:48", "v": "7.029"},{"t": "2026-11-25 18:54", "v": "7.027"}]}
The app reads the readings and predictions at all eight gauges. The surge is the reading minus the prediction.
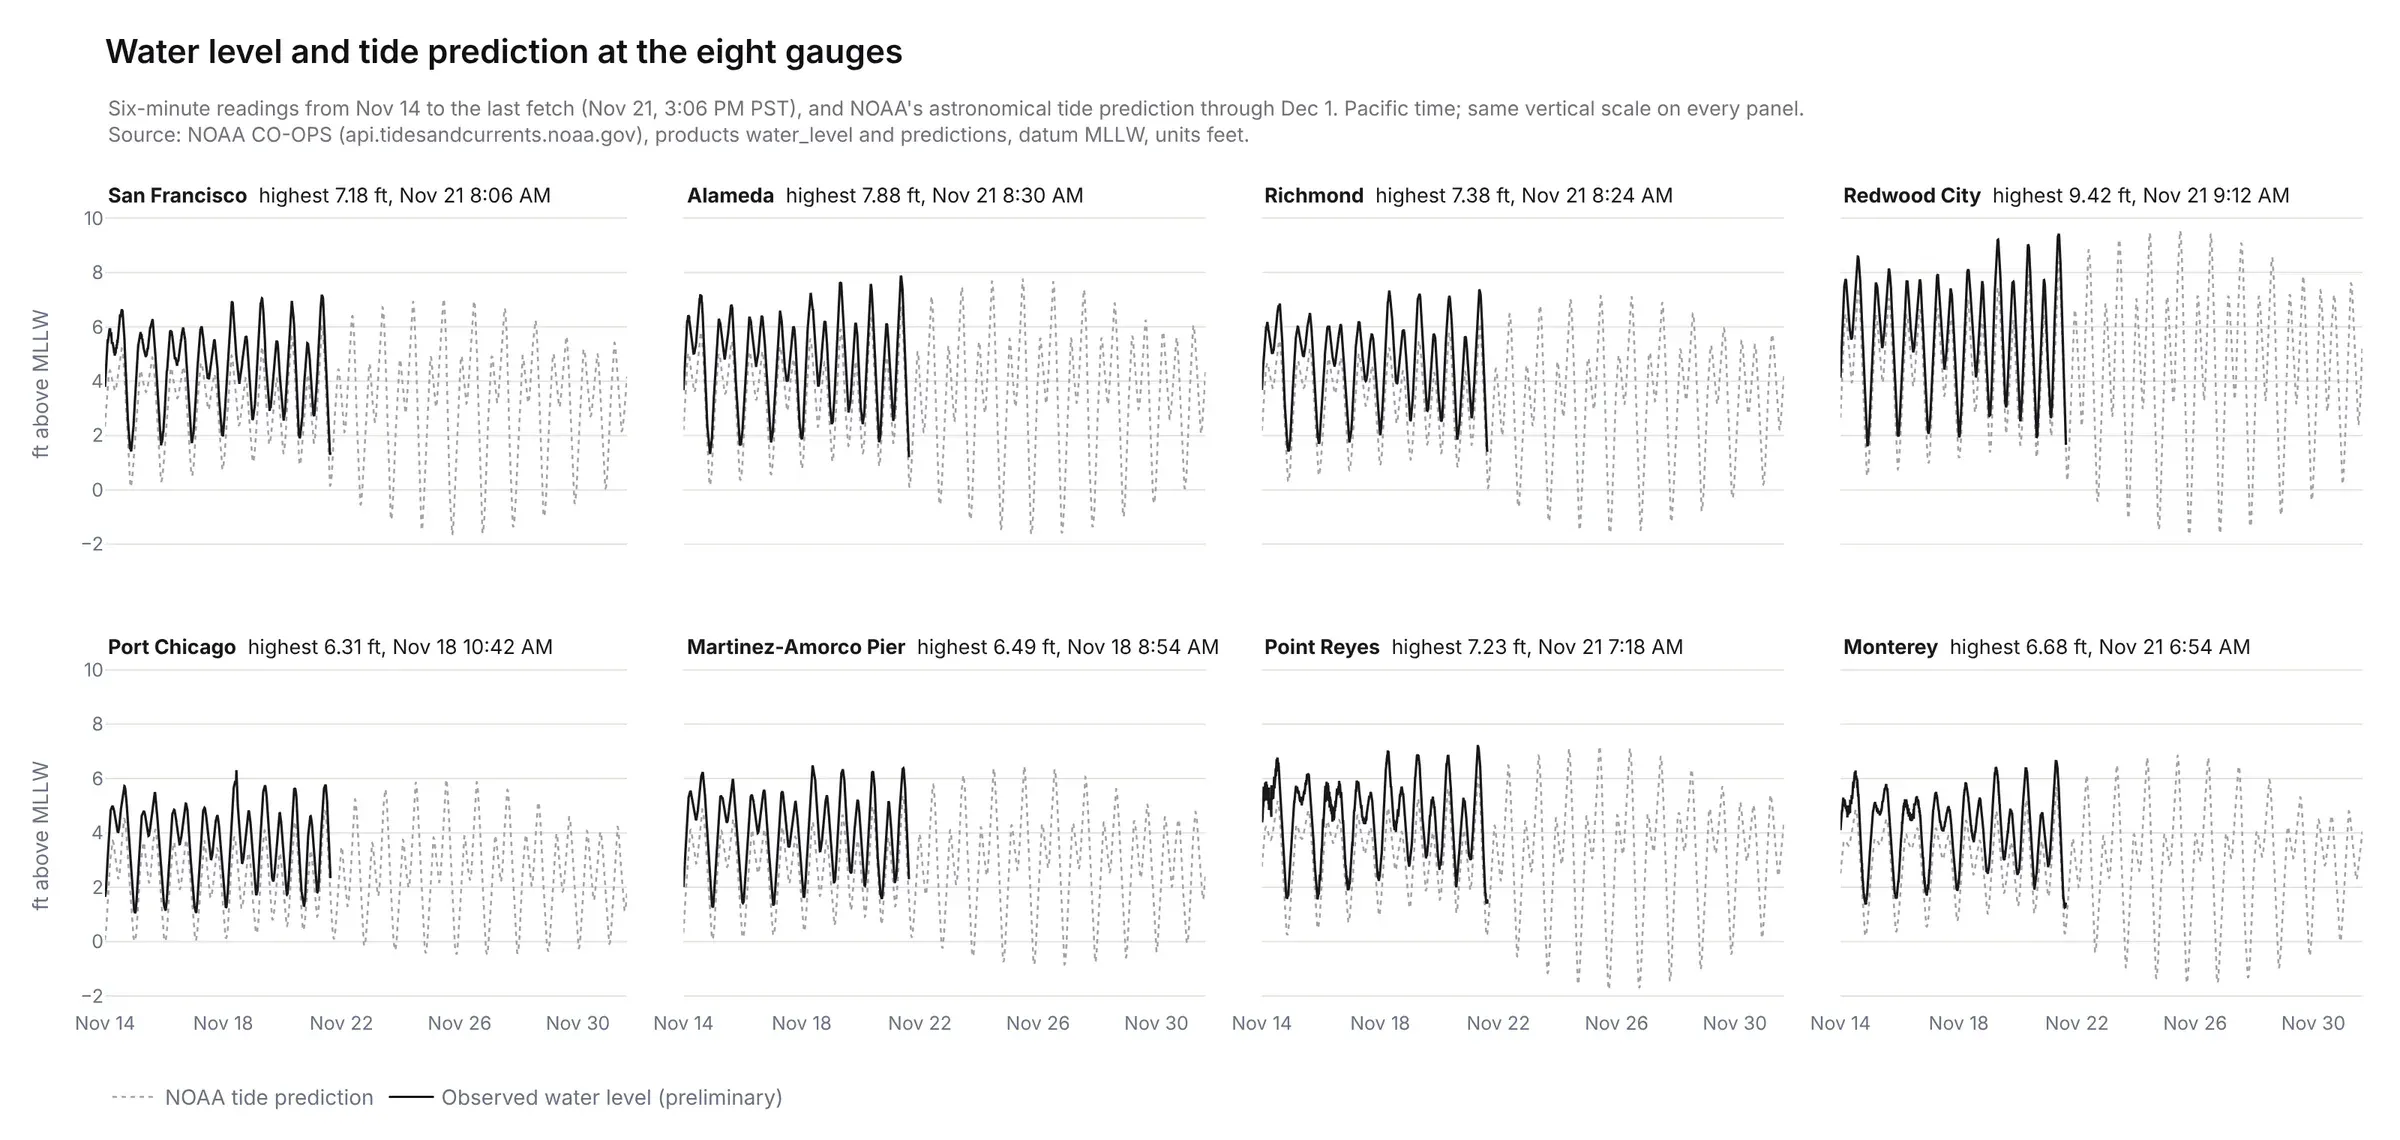
Readings in black and NOAA's prediction in gray. Saturday morning's high tide ran about a foot above the prediction at all eight gauges.
Datums and Flood Levels
The metadata API gives each gauge's datums and flood levels in feet above the station's own zero:
{"epoch": "1983-2001", "max": 14.639, "maxdate": "19830127","datums": [{"name": "MHHW", "description": "Mean Higher-High Water", "value": 11.82},{"name": "MSL", "description": "Mean Sea Level", "value": 9.1},{"name": "MLLW", "description": "Mean Lower-Low Water", "value": 5.98},{"name": "NAVD88", "description": "North American Vertical Datum of 1988", "value": 5.92}]}{"nos_minor": 13.69, "nos_moderate": 14.62, "nos_major": 15.89, "nws_minor": 13.02, "nws_moderate": null, "nws_major": null}
The app subtracts MLLW from each value. At San Francisco that puts the average high tide (MHHW) at 5.84 ft, the NWS minor flood level at 7.04 ft and the record from Jan 27, 1983 at 8.66 ft.
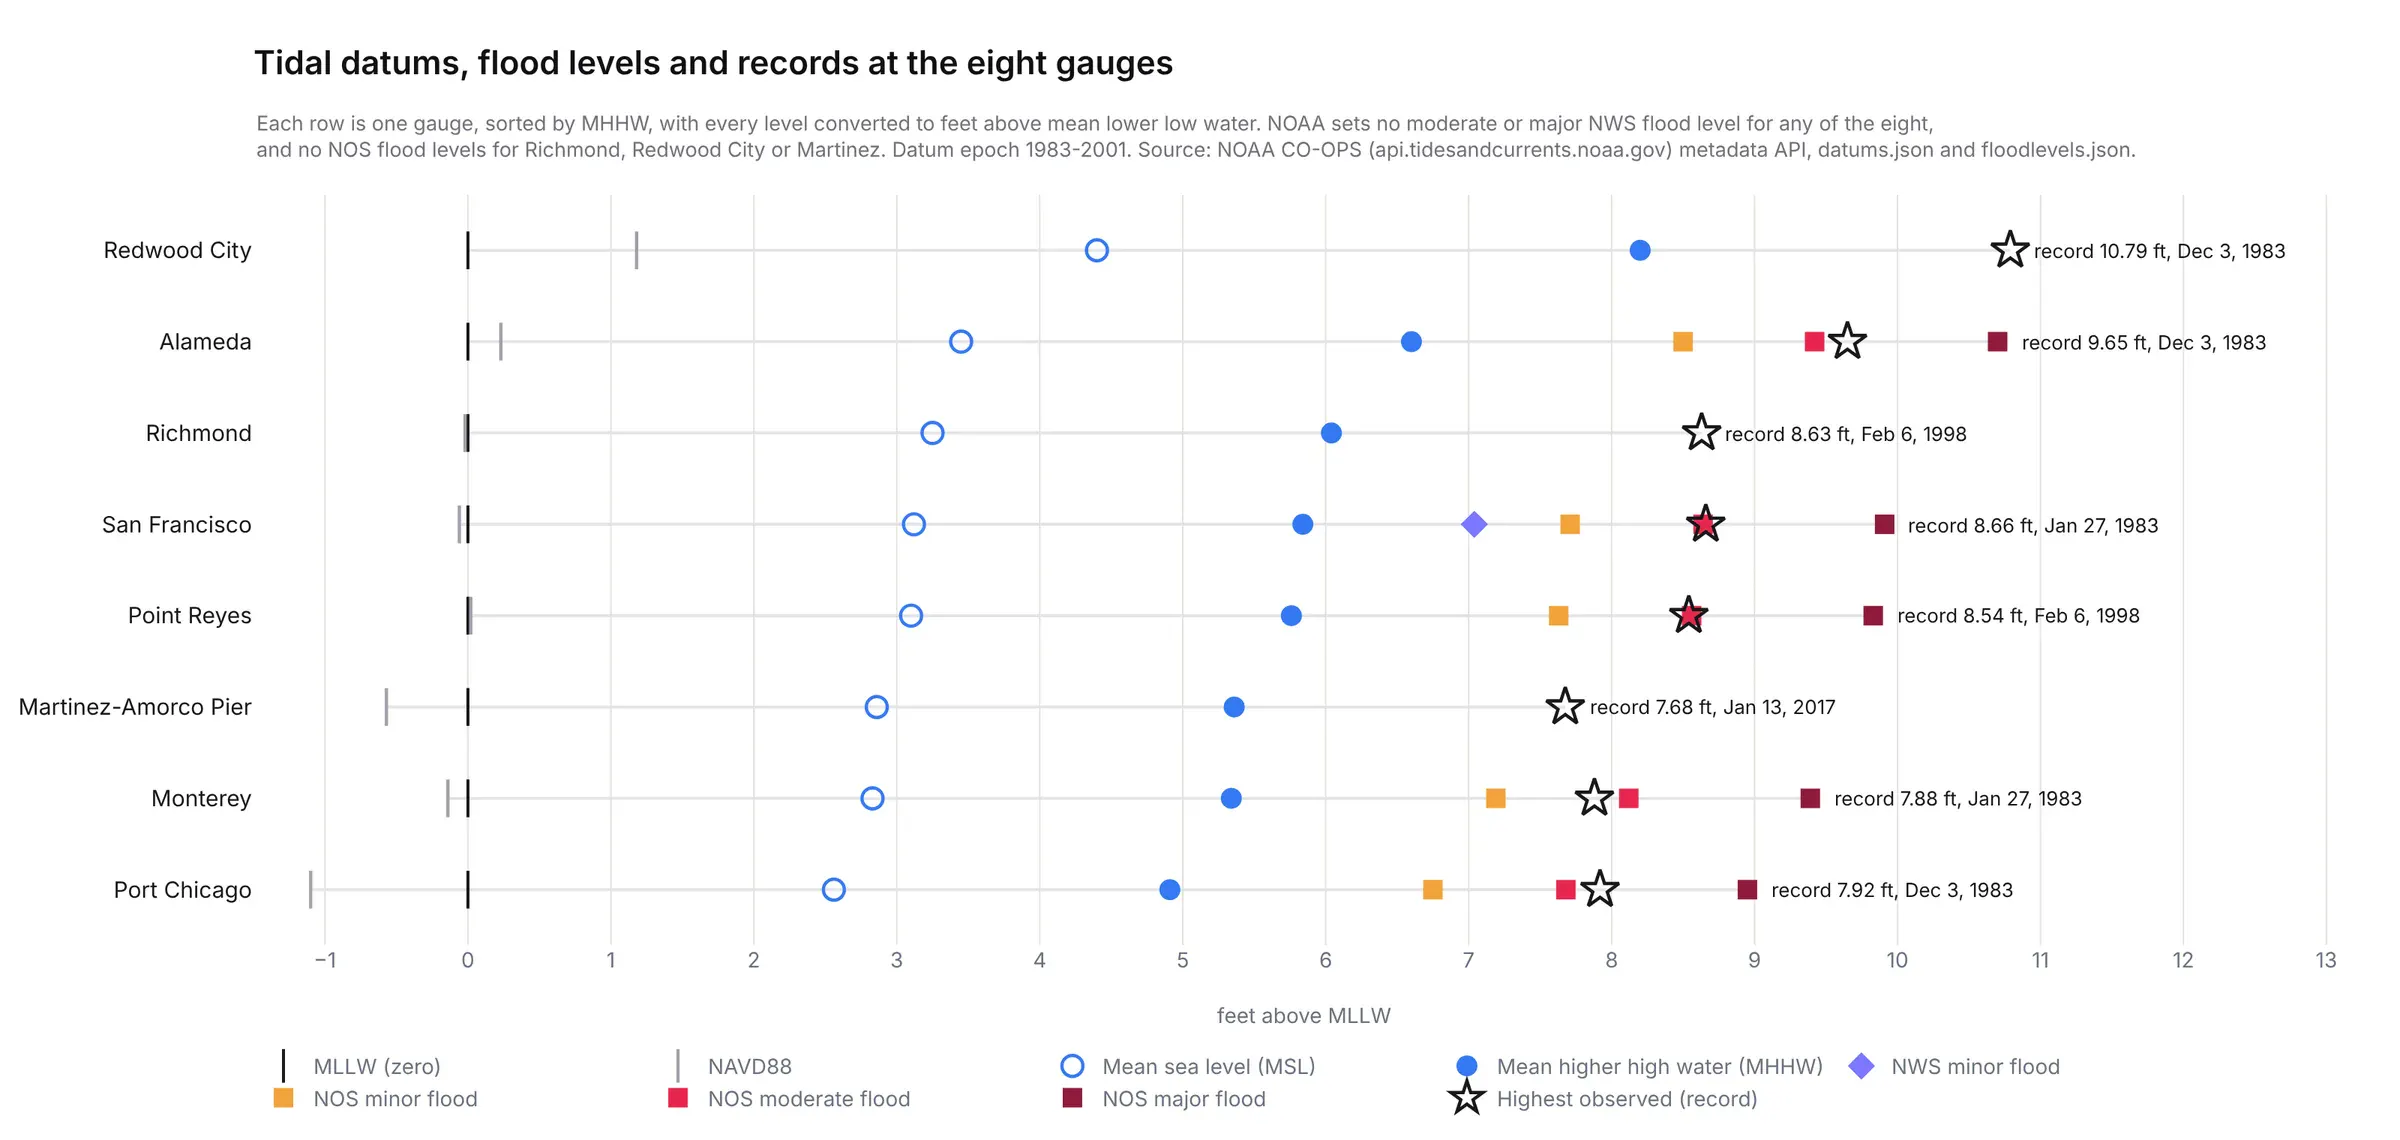
San Francisco is the only one of the eight gauges with an NWS flood level.
San Francisco's Monthly Record
The monthly means go back to 1854, one row per month with 18 fields. This is January 1983 (the record month):
{"data": [{"year": "1983", "month": "1", "highest": "8.663", "MHHW": "6.714", "MSL": "3.814", "lowest": "-1.206", "...": "12 more fields"}]}
The app keeps 2,059 months going back to 1897.
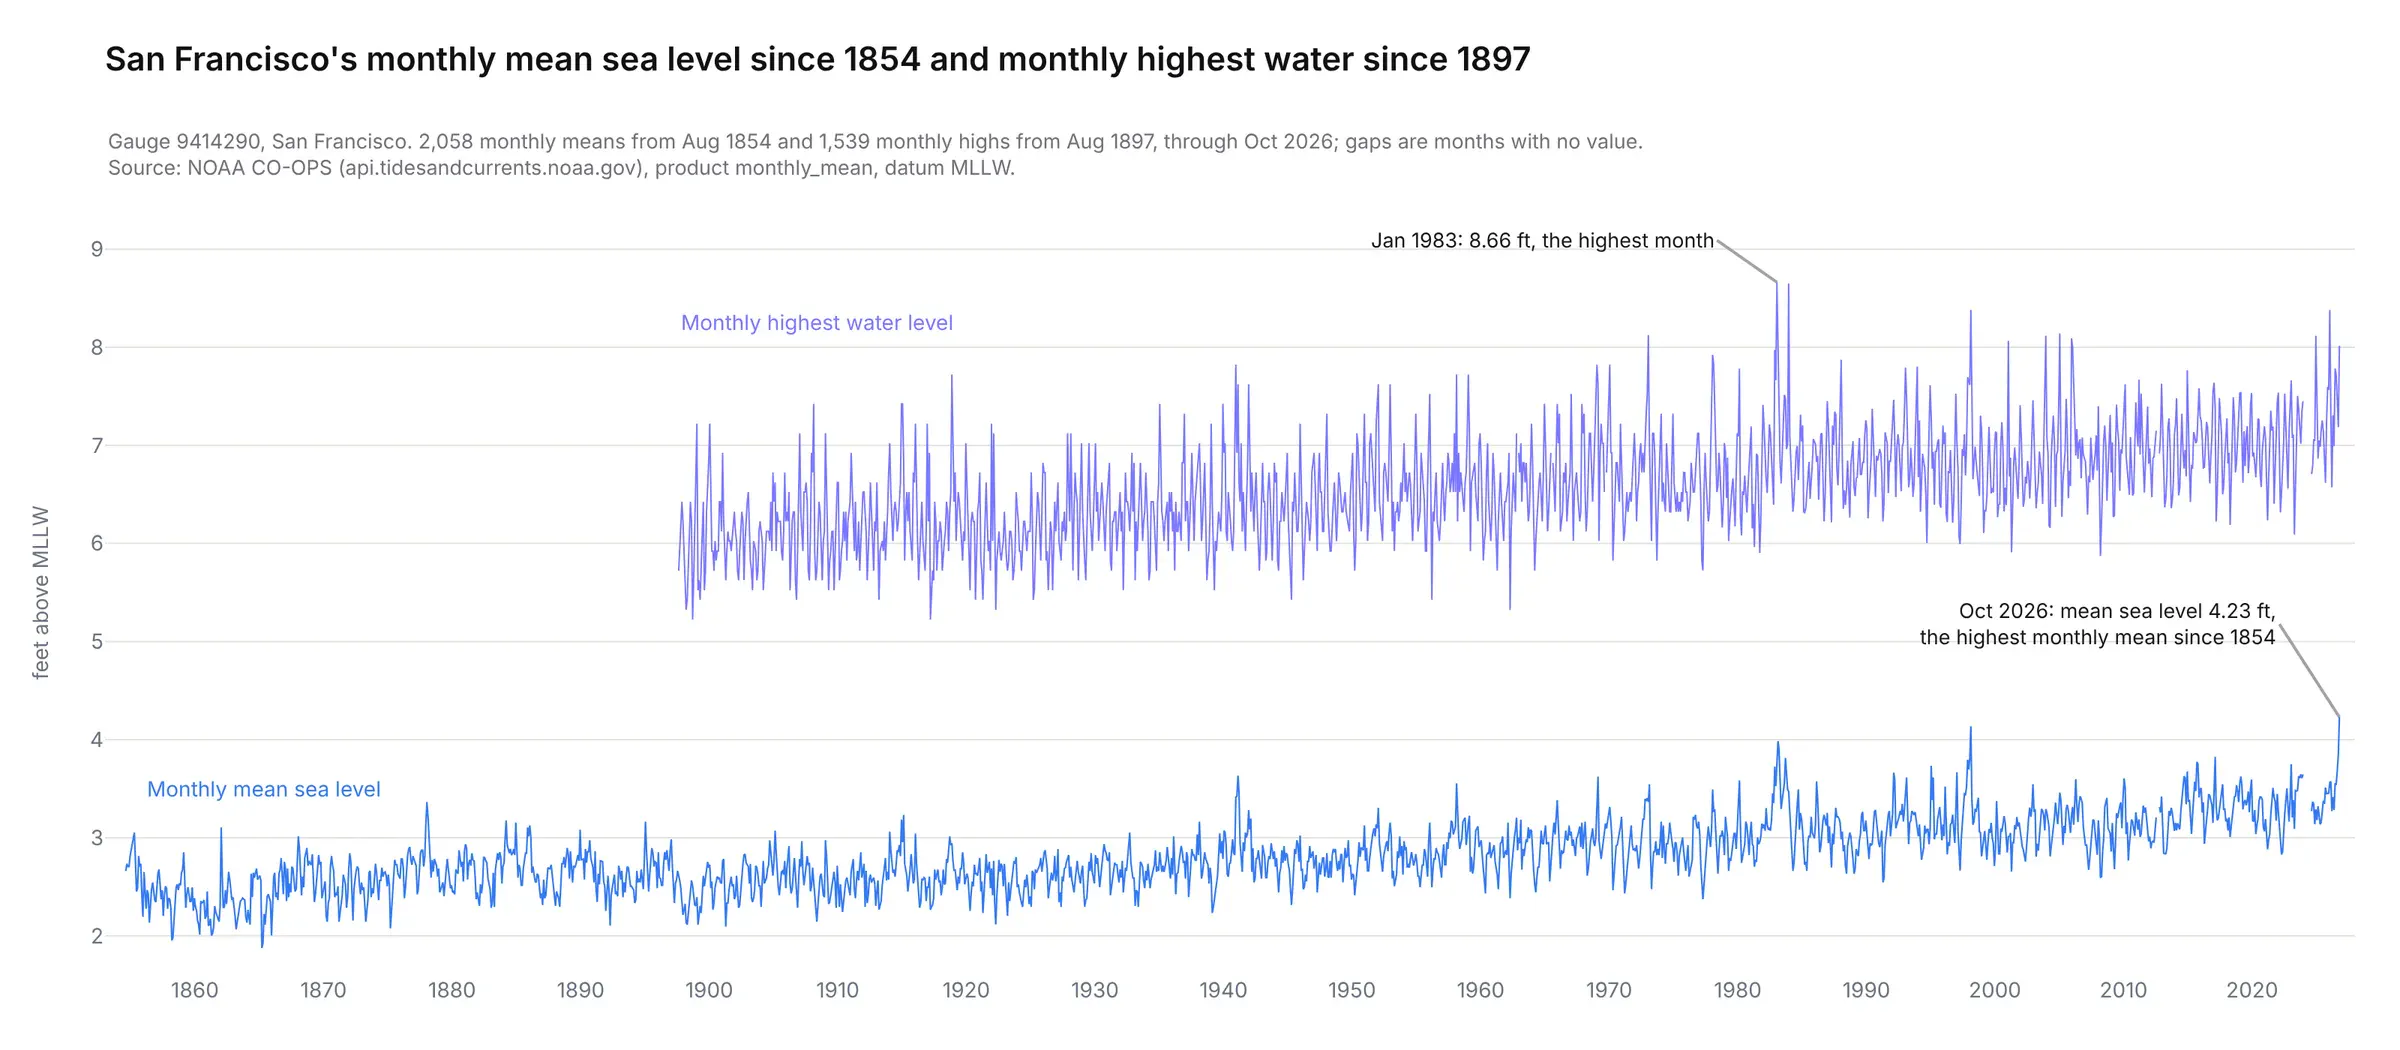
October 2026's mean sea level, 4.23 ft, is the highest monthly mean since 1854.
San Francisco's Hourly Record
The verified hourly heights start in 1898. These four are from the morning of the 1906 earthquake, which struck at 13:12 GMT:
{"data": [{"t": "1906-04-18 12:00", "v": "2.324", "s": "0.0", "f": "0,0"},{"t": "1906-04-18 13:00", "v": "2.925", "s": "0.0", "f": "0,0"},{"t": "1906-04-18 14:00", "v": "3.423", "s": "0.0", "f": "0,0"},{"t": "1906-04-18 15:00", "v": "3.925", "s": "0.0", "f": "0,0"}]}
The app keeps all 1,113,529 hours and counts the flood days in each year from them.
The gauge itself opened at the Golden Gate on June 30, 1854. Back then, it recorded data using a clockwork recorder that drew the tide on paper. The San Francisco Chronicle called it the oldest continually operating tide gauge in the Western Hemisphere on its 150th anniversary.
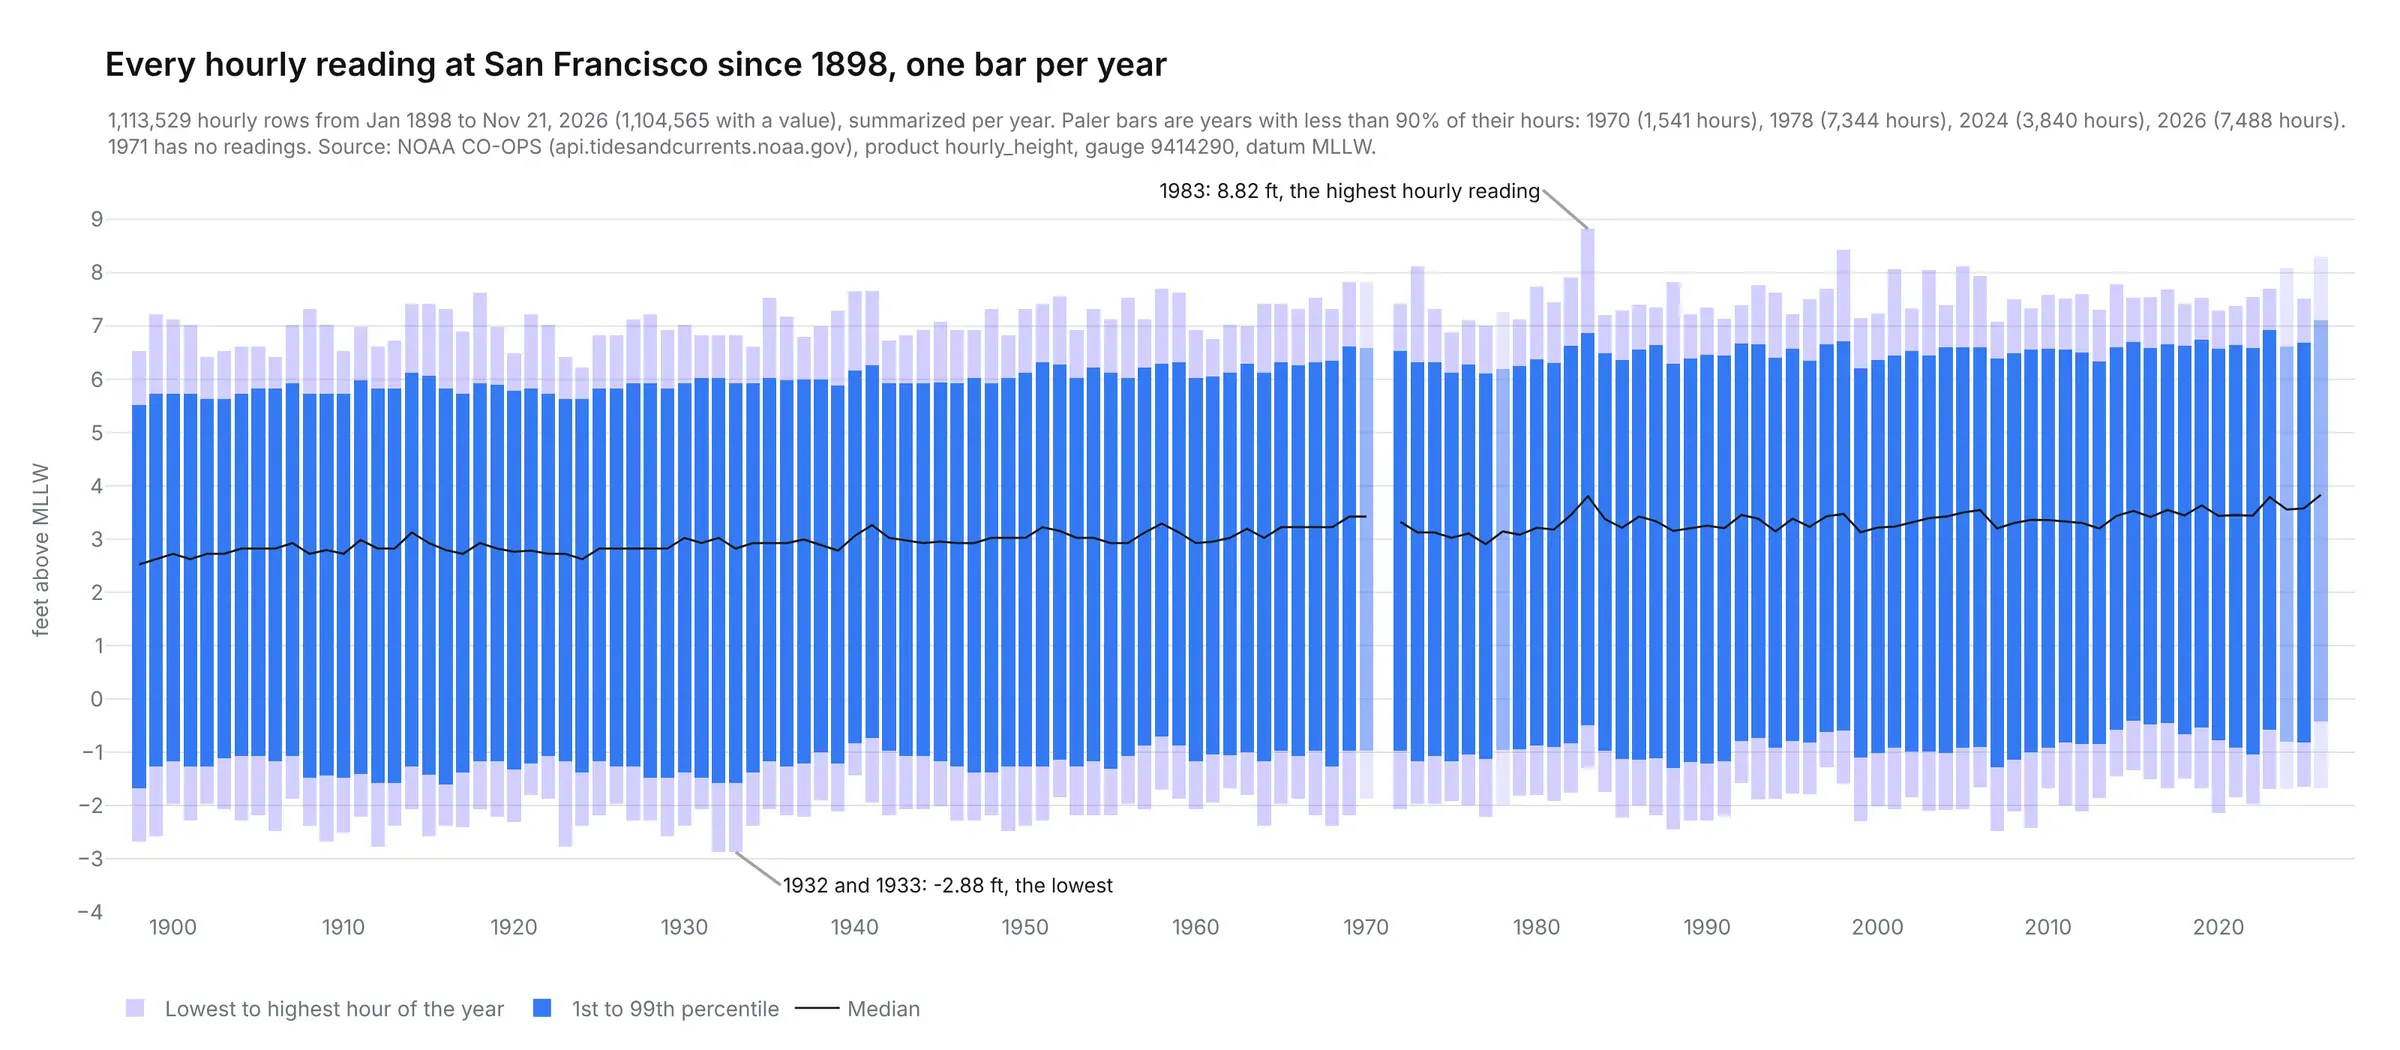
The hourly product peaks at 8.82 ft on Jan 27, 1983, above the 8.66 ft record NOAA lists for the gauge, so the app ranks tides against the monthly highs and the official record.
NWS Alerts and Zones
The NWS API serves each alert as a GeoJSON feature. This is the Bay's Coastal Flood Warning:
{"type": "Feature", "properties": {"event": "Coastal Flood Warning", "senderName": "NWS San Francisco CA","areaDesc": "San Francisco; North Bay Interior Valleys; San Francisco Bay Shoreline","onset": "2026-11-23T06:00:00-08:00", "ends": "2026-11-26T16:00:00-08:00","affectedZones": ["https://api.weather.gov/zones/forecast/CAZ006", "https://api.weather.gov/zones/forecast/CAZ506","https://api.weather.gov/zones/forecast/CAZ508"],"description": "* WHAT...For the Coastal Flood Advisory, Up to 2.0 ft of inundation above ground level is possible in low-lying areas near shorelines and tidal waterways. For the Coastal Flood Warning, significant coastal flooding with up to 2.8 feet of inundation above groun ..."}}
At the last fetch there were 15 alerts for the California coast:
Alert
NWS office
Area
From
Until
Coastal Flood Warning
San Francisco
San Francisco, North Bay Interior Valleys, San Francisco Bay Shoreline
Mon Nov 23, 6 AM
Thu Nov 26, 4 PM
Coastal Flood Advisory
San Francisco
San Francisco, North Bay Interior Valleys, San Francisco Bay Shoreline
Sat Nov 21, 2:30 PM
Mon Nov 23, 6 AM
Coastal Flood Advisory
San Francisco
Coastal North Bay Including Point Reyes National Seashore, San Francisco Peninsula Coast, Northern Monterey Bay, Southern Monterey Bay and Big Sur Coast
Sat Nov 21, 2:30 PM
Thu Nov 26, 4 PM
Coastal Flood Advisory
San Diego
San Diego County Coastal Areas, Orange County Coastal
Sun Nov 22, 4 AM
Tue Nov 24, 4 AM
Coastal Flood Advisory
Los Angeles/Oxnard
Ventura County Beaches
Mon Nov 23, 3 AM
Wed Nov 25, 3 AM
Coastal Flood Advisory
Los Angeles/Oxnard
San Luis Obispo County Beaches, Santa Barbara County Central Coast Beaches
Mon Nov 23, 3 AM
Wed Nov 25, 3 AM
Coastal Flood Advisory
Los Angeles/Oxnard
Malibu Coast, Los Angeles County Beaches
Mon Nov 23, 3 AM
Wed Nov 25, 3 AM
Coastal Flood Advisory
Los Angeles/Oxnard
Catalina and Santa Barbara Islands, Santa Barbara County Southwestern Coast, Santa Barbara County Southeastern Coast
Mon Nov 23, 3 AM
Thu Nov 26, 3 PM
Coastal Flood Watch
Eureka
Northern Coastal Humboldt
Sun Nov 22, 6 AM
Thu Nov 26, 2 PM
Coastal Flood Watch
San Diego
San Diego County Coastal Areas, Orange County Coastal
Tue Nov 24, 4 AM
Thu Nov 26, 1 PM
Coastal Flood Watch
Eureka
Coastal Del Norte, Southwestern Humboldt, Coastal Mendocino
Tue Nov 24, 10 AM
Thu Nov 26, 2 PM
Coastal Flood Watch
Los Angeles/Oxnard
Ventura County Beaches
Wed Nov 25, 3 AM
Thu Nov 26, 3 PM
Coastal Flood Watch
Los Angeles/Oxnard
San Luis Obispo County Beaches, Santa Barbara County Central Coast Beaches
Wed Nov 25, 3 AM
Thu Nov 26, 3 PM
Coastal Flood Watch
Los Angeles/Oxnard
Malibu Coast, Los Angeles County Beaches
Wed Nov 25, 3 AM
Thu Nov 26, 3 PM
High Surf Advisory
Los Angeles/Oxnard
San Luis Obispo County Beaches, Santa Barbara County Central Coast Beaches
Sun Nov 22, 6 AM
Thu Nov 26, 3 PM
The forecast tides only come as text. This text is structured and looks like this:
At the San Francisco tide gauge, high tide is expected to be 2.0 ft above normal (7.8 ft MLLW) at 8:48 AM Sunday, 2.2 ft above normal (8.0 ft MLLW) at 9:25 AM Monday, 2.6 ft above normal (8.4 ft MLLW) at 10:05 AM Tuesday, 2.8 ft above normal (8.6 ft MLLW) at 10:49 AM Wednesday, and 2.4 ft above normal (8.2 ft MLLW) at 11:38 AM Thursday.
The app pulls them out with this regular expression:
([\d.]+) ft above normal \(([\d.]+) ft MLLW\) at (\d{1,2}:\d\d) (AM|PM) (\w+)
Match
Above normal (ft)
Height (ft MLLW)
Time
AM/PM
Day
1
2.0
7.8
8:48
AM
Sunday
2
2.2
8.0
9:25
AM
Monday
3
2.6
8.4
10:05
AM
Tuesday
4
2.8
8.6
10:49
AM
Wednesday
5
2.4
8.2
11:38
AM
Thursday
Each alert lists its forecast zones, and the zones endpoint returns each one as a GeoJSON outline:
{"id": "CAZ508", "name": "San Francisco Bay Shoreline","geometry": {"type": "MultiPolygon","coordinates": [[[[-121.96737, 37.467636], [-121.96837, 37.463138], ... 1,296 points in all]]]}}
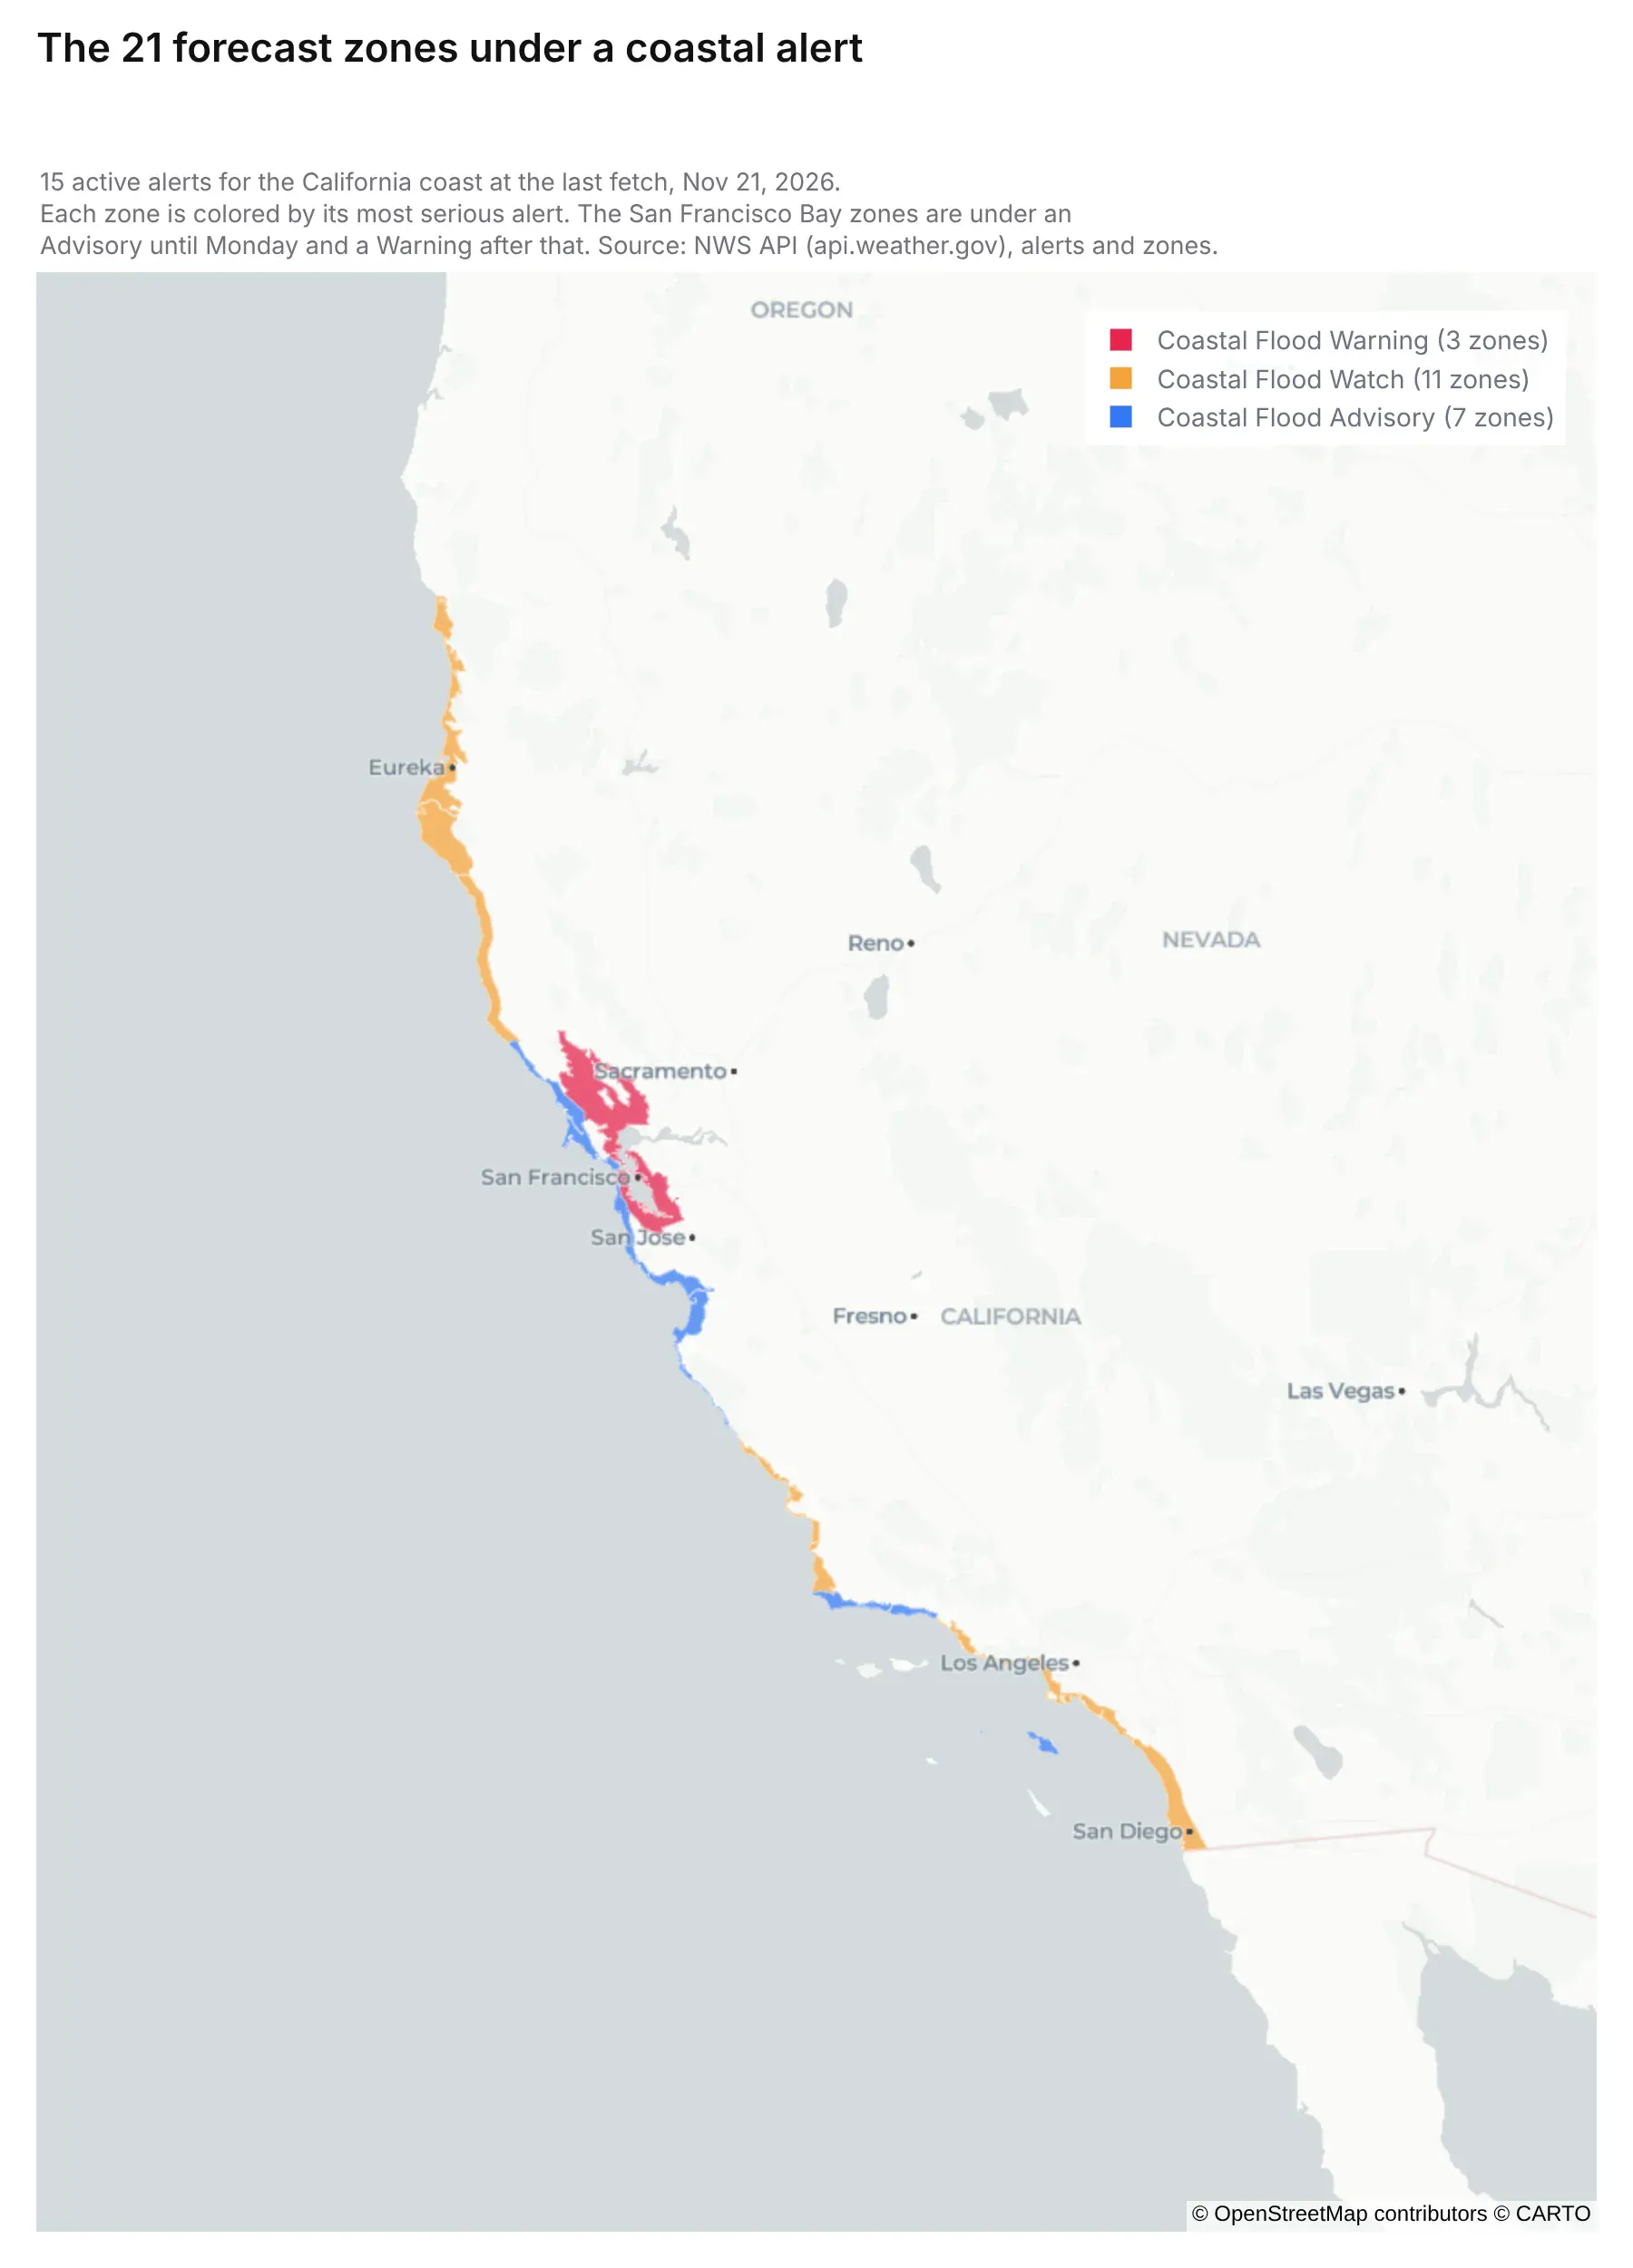
The 21 zones at the last fetch: 3 under the Coastal Flood Warning, 11 under a Watch and 7 under an Advisory.
NWS Forecast Discussion
The San Francisco office's Area Forecast Discussion is plain text that forecasters write a few times a day. The latest one is 231 lines, and it starts like this:
Area Forecast DiscussionNational Weather Service San Francisco CA1219 PM PST Sat Nov 21 2026.KEY MESSAGES...Updated at 1214 PM PST Sat Nov 21 2026- Light to moderate rain showers today and Sunday- Major to extreme coastal flooding through the next week- Impactful storm Tuesday and Wednesday- Storm door remains open beyond the current extended forecast
The app shows it as is, next to the warning.
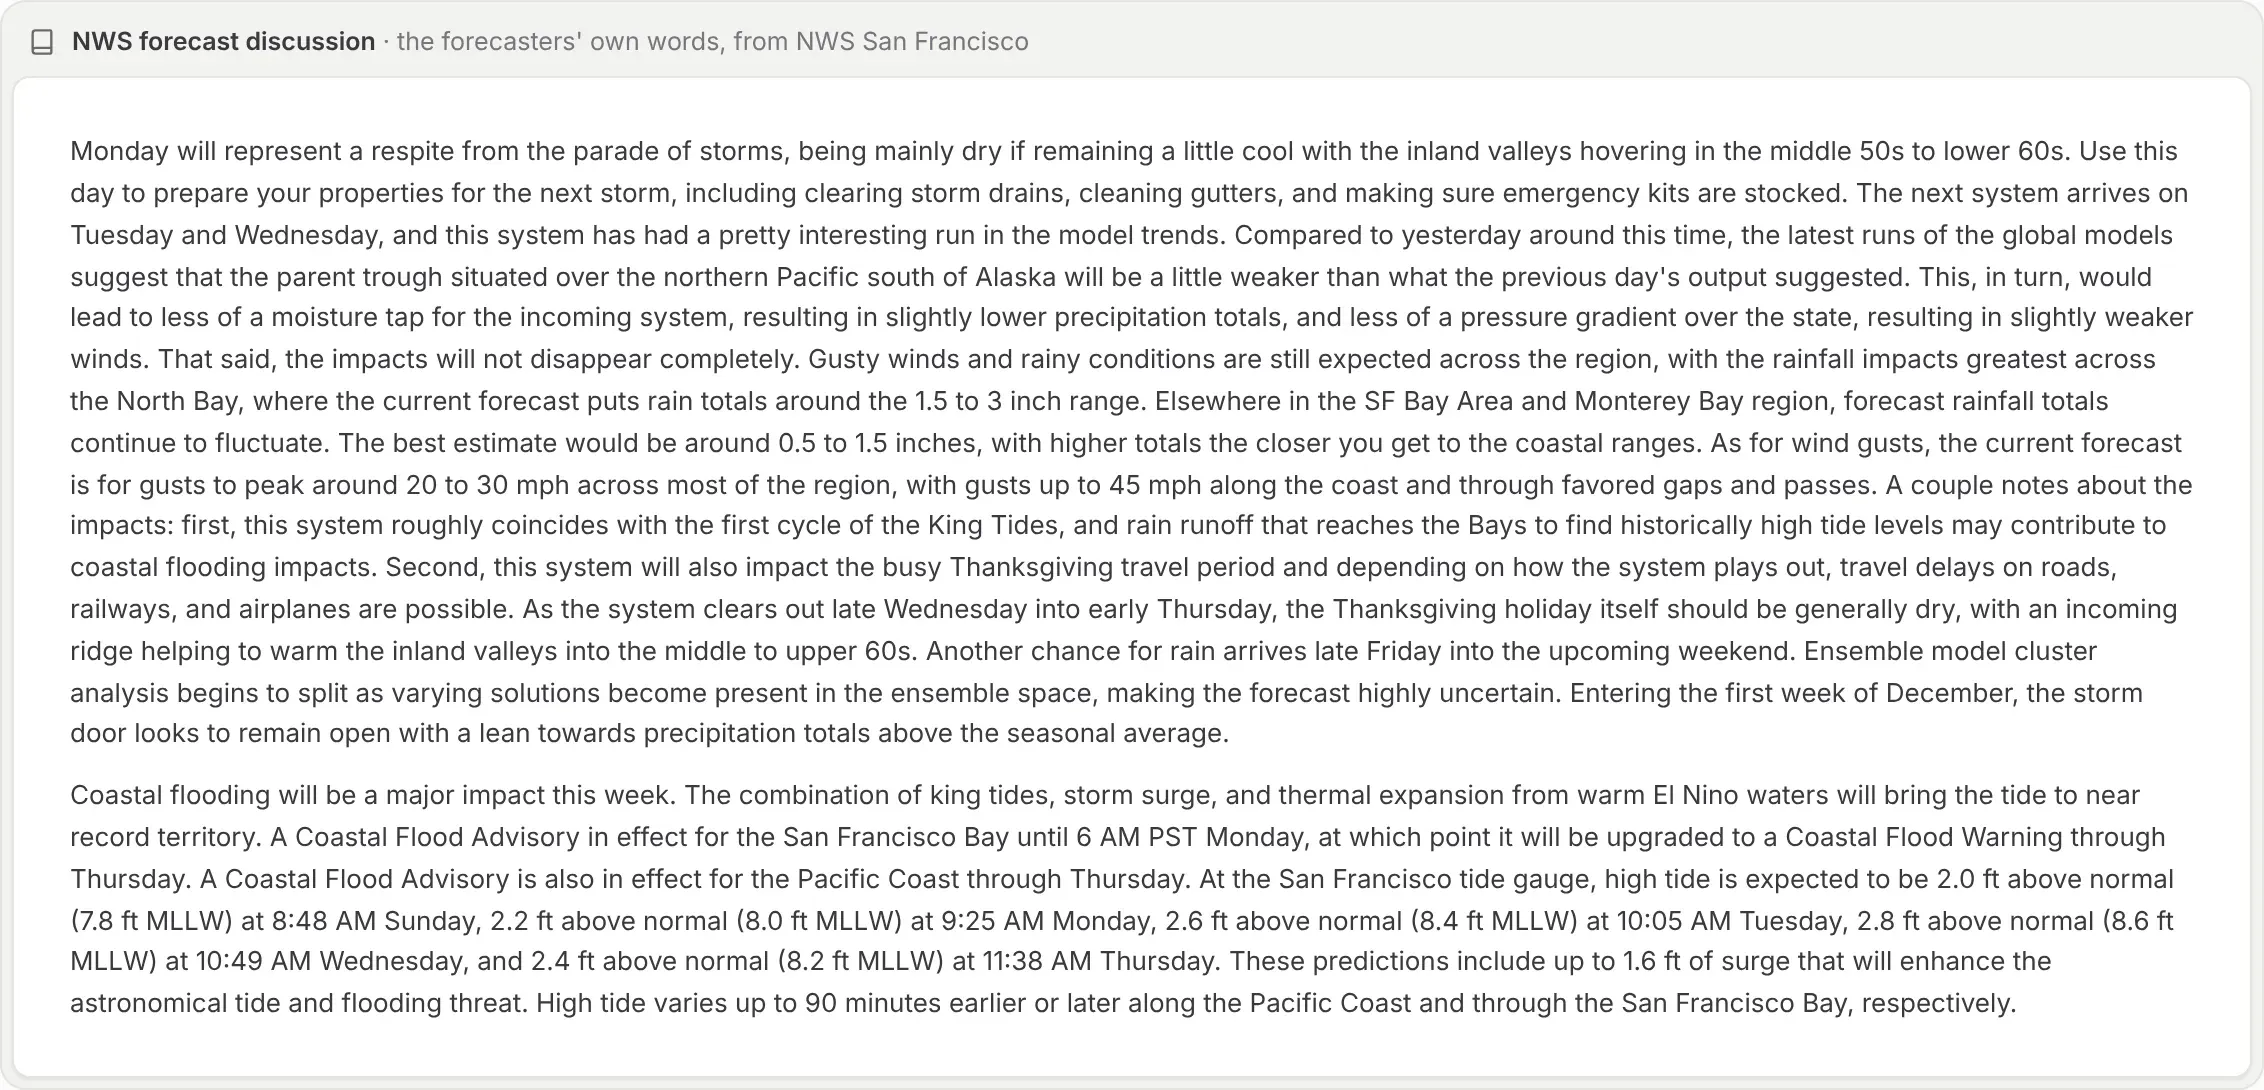
The storm page shows the long-term and beaches sections.
NWS Gridded Forecast
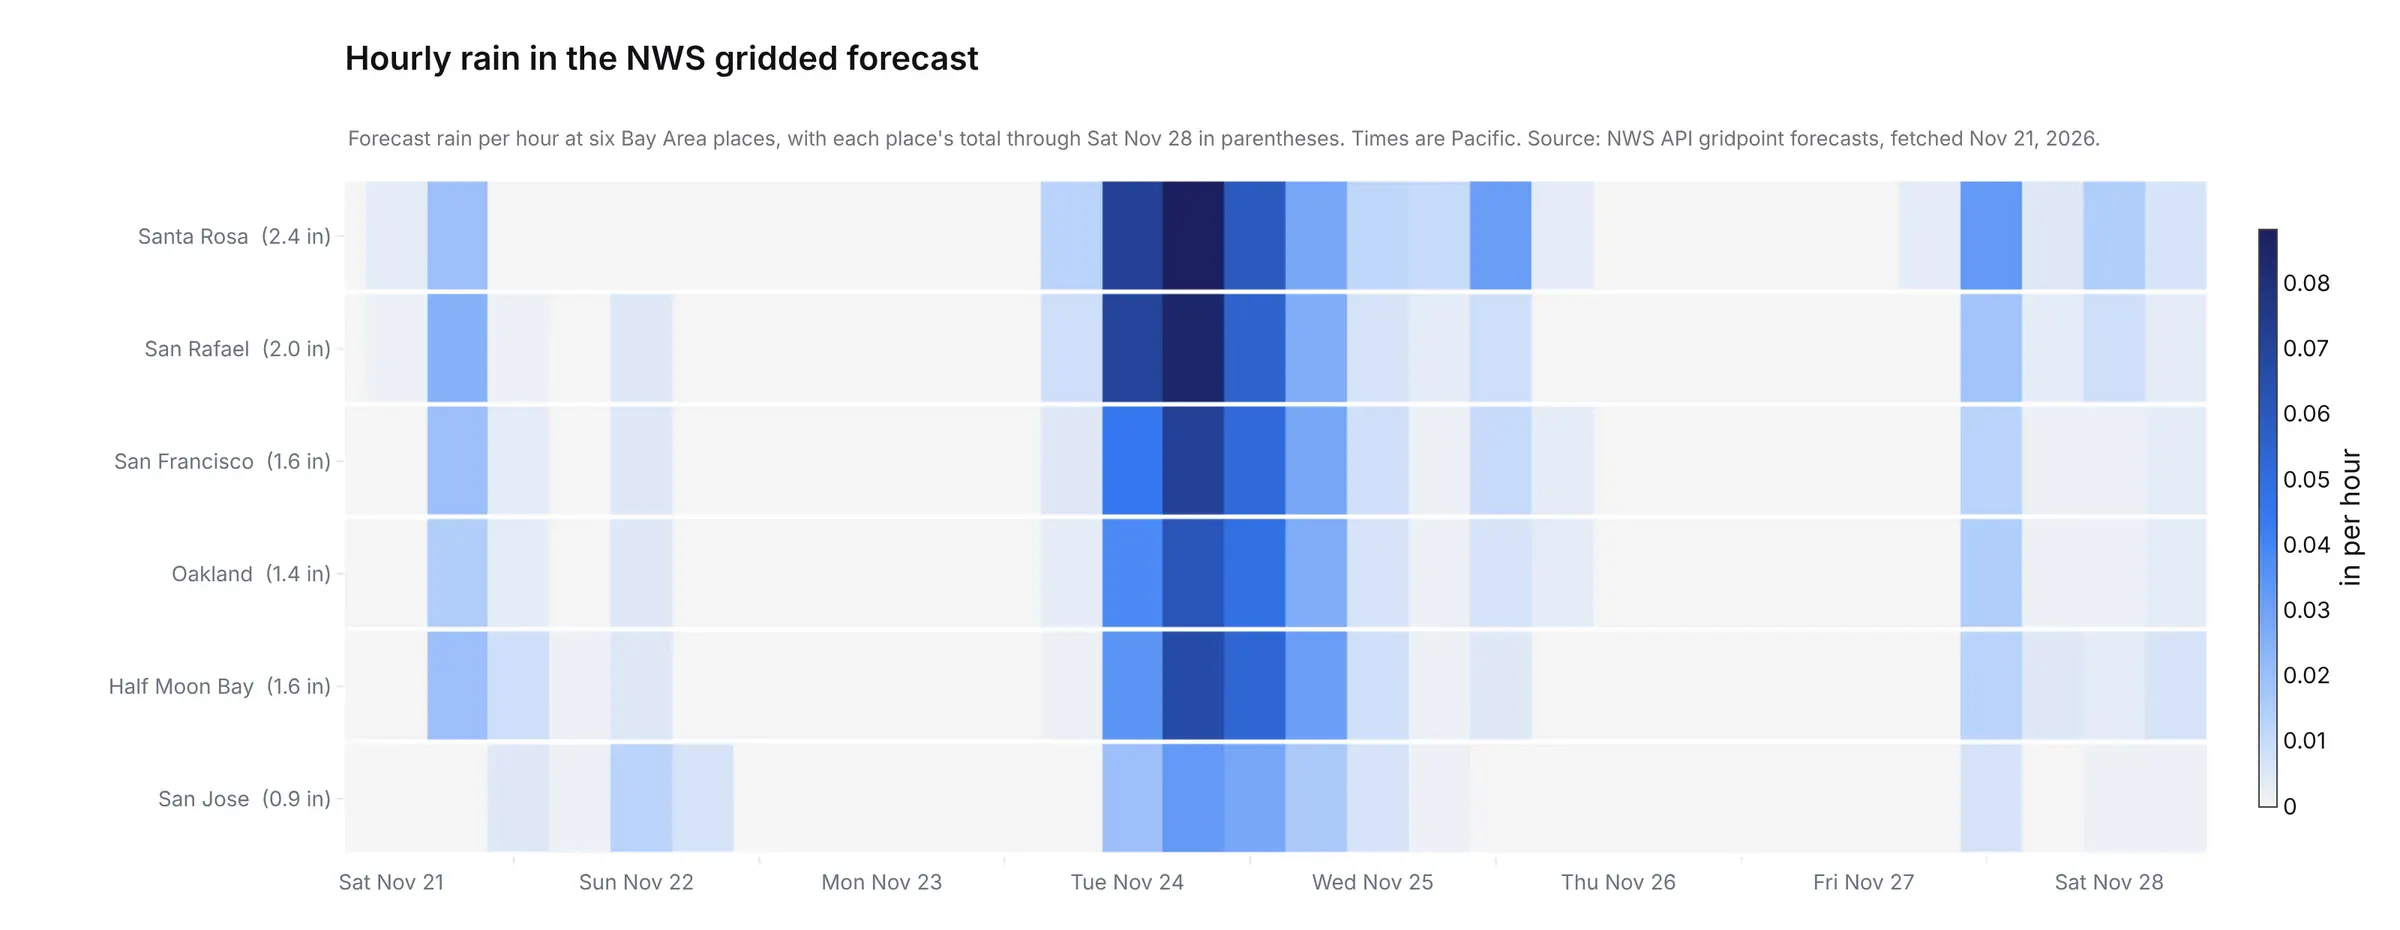
The gridded forecast gives rain, wind, gusts and the chance of rain for any point, in periods of a few hours. This is San Francisco's rain on Tuesday, in millimeters per 6 hours:
{"forecastGridData": "https://api.weather.gov/gridpoints/MTR/85,105", "uom": "wmoUnit:mm","values": [{"validTime": "2026-11-24T12:00:00+00:00/PT6H", "value": 0.762},{"validTime": "2026-11-24T18:00:00+00:00/PT6H", "value": 6.858},{"validTime": "2026-11-25T00:00:00+00:00/PT6H", "value": 10.922},{"validTime": "2026-11-25T06:00:00+00:00/PT6H", "value": 7.874}]}
The app spreads each period evenly over its hours for six Bay Area places. Totals through Nov 28 run from 0.9 in at San Jose to 2.4 in at Santa Rosa.
Water Level Models
Both models come as netCDF, a file format that holds several named arrays sharing dimensions like time and station, each labeled with its units. This data is parsed with xarray’s xr.open_dataset(path).
sfbofs.t21z.20261121.stations.forecast.nc (about 50 MB)Dimensions: station: 250, time: 481, siglay: 20 (depth layers)Variable Dimensions What it isname_station (station) station name, x941-4290 for San Franciscolat, lon, h (station) location and water depth (m)zeta (time, station) water surface elevation (m)u, v (time, siglay, station) currents at 20 depths (m/s)temp (time, siglay, station) water temperature at 20 depths (°C)salinity (time, siglay, station) salinity at 20 depthsuwind_speed (time, station) east windvwind_speed (time, station) north wind
A STOFS-2D-Global run is simpler: one zeta array with 1,860 time steps at 1,687 points. Both give meters above mean sea level, and the app converts them to feet above MLLW with the gauge's mean sea level (3.12 ft at San Francisco).
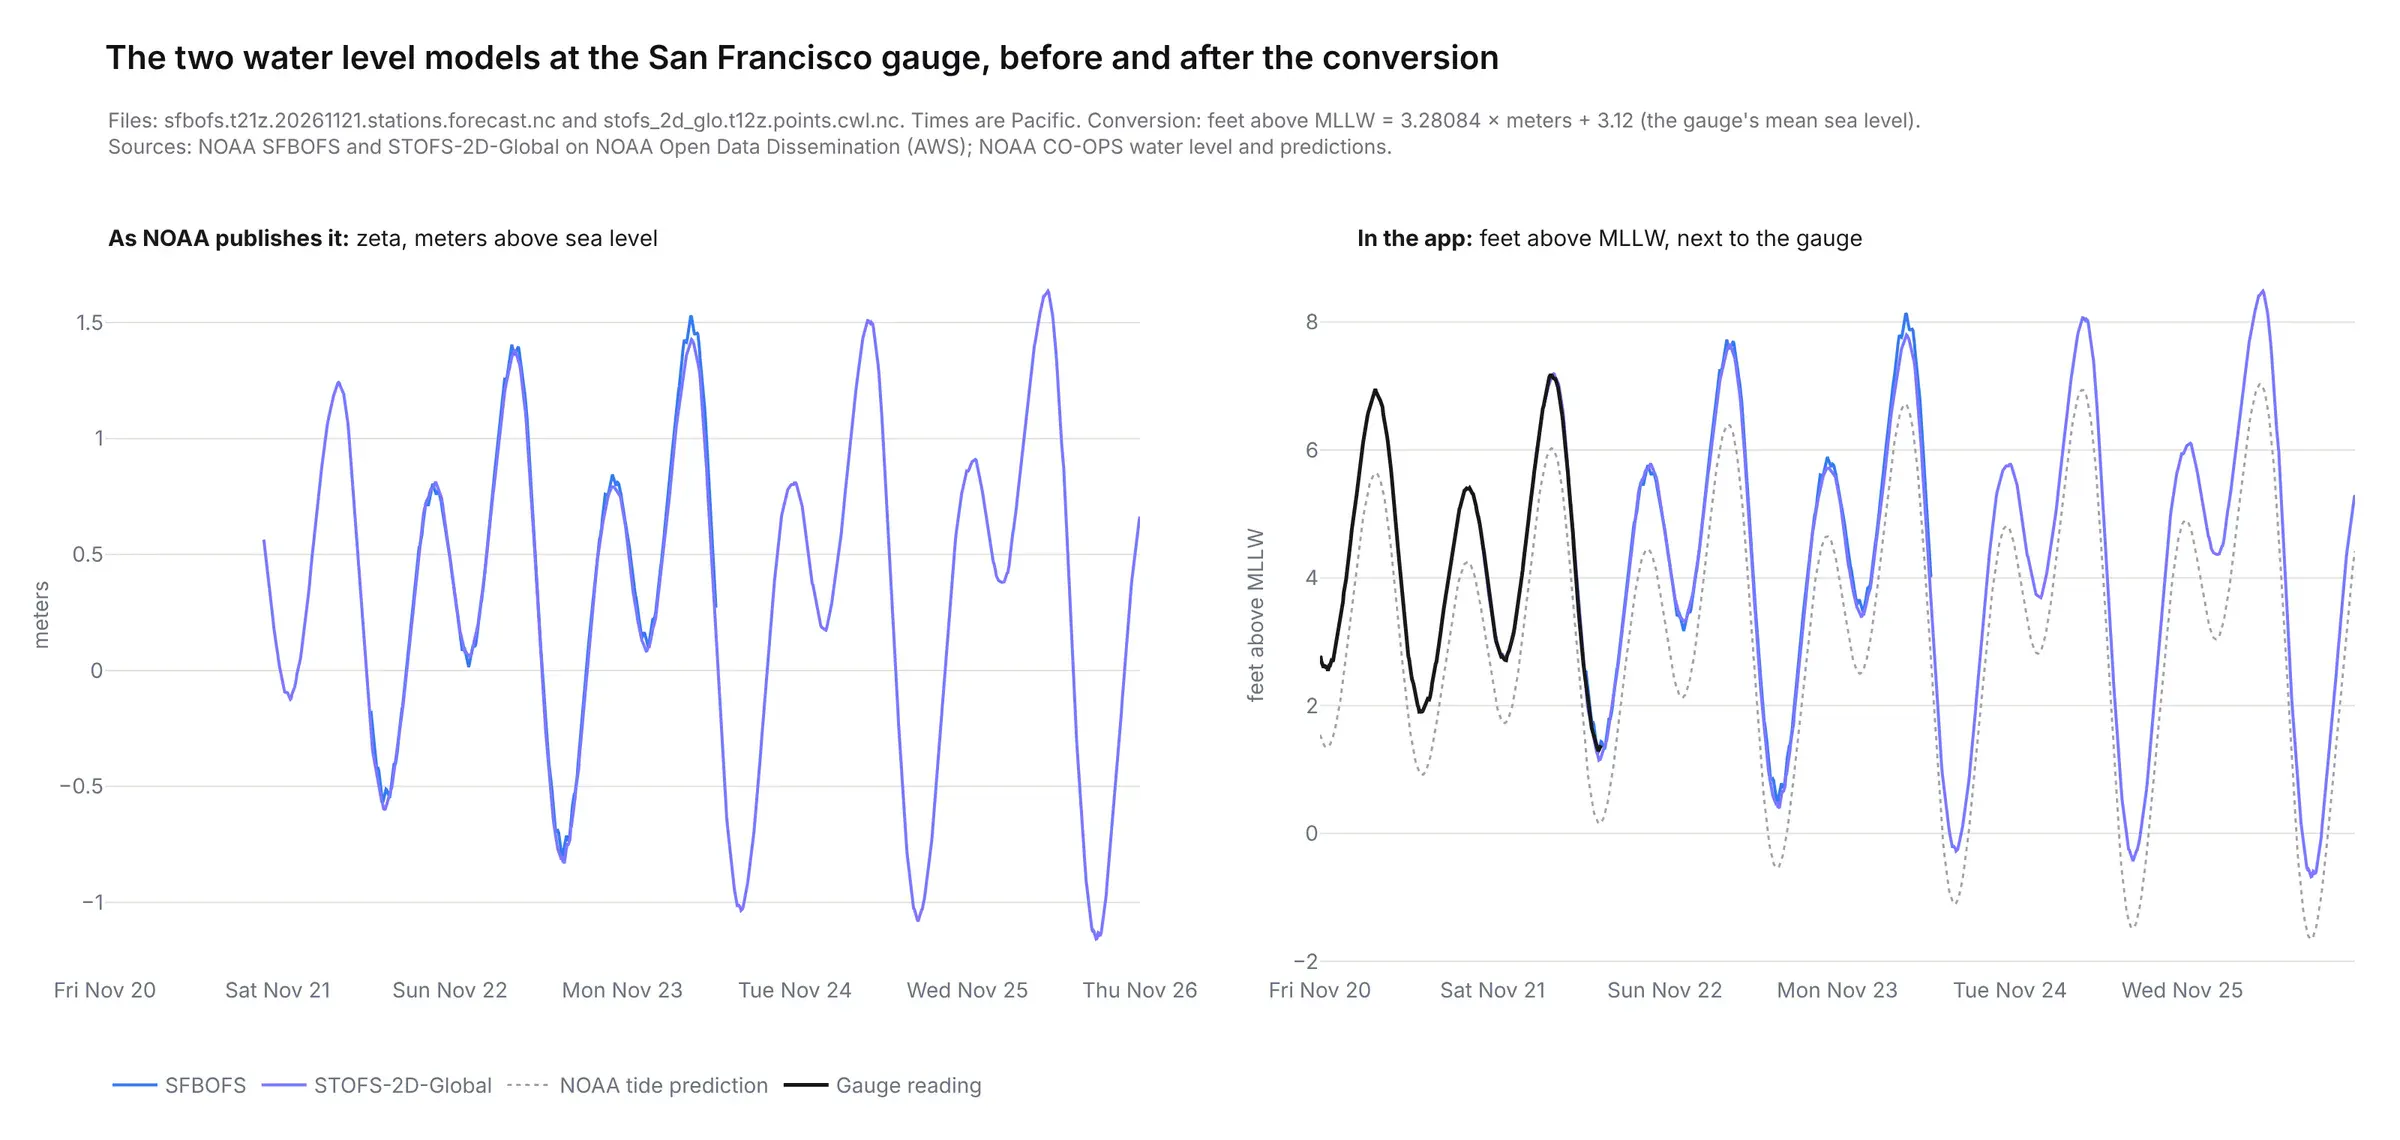
At Wednesday's high tide STOFS is 8.49 ft, about 1.5 ft above the prediction.
Satellite Data
GOES-18 scans the side of the Earth it can see every 10 minutes, and NOAA puts each scan on AWS as one netCDF file per band:
OR_ABI-L2-CMIPF-M6C09_G18_s20263252300223_e20263252309537_c20263252310009.nc (17 MB)CMI (y: 5424, x: 5424) ABI L2+ Cloud and Moisture Imagery brightness temperature, Kresolution 2km at nadir, scan start 2026-11-21T23:00:22.3Zgoes_imager_projection perspective_point_height 35,786,023 m, longitude_of_projection_origin -137.0CMI[2700, 2700:2704] = [248.5, 248.8, 248.4, 248.5] K
The app takes one scan an hour, reprojects it to Web Mercator with pyproj and colors it, from brown for dry air to white and blue for moist air.
Weather Model Data
NOAA's NOMADS server cuts the GFS output to the fields and area you ask for, one GRIB2 file per forecast hour:
gfs.t18z.pgrb2.0p25.f078.pacific.grb2 (1.5 MB, GRIB2)1: prmsl meanSea 0 221x141 grid valid 20261125 00002: q isobaricInhPa 300 221x141 grid valid 20261125 00003: u isobaricInhPa 300 221x141 grid valid 20261125 00004: v isobaricInhPa 300 221x141 grid valid 20261125 00005: q isobaricInhPa 400 221x141 grid valid 20261125 00006: u isobaricInhPa 400 221x141 grid valid 20261125 0000...29: pwat atmosphereSingleLayer 0 221x141 grid valid 20261125 000029 messages in all
None of those fields is the atmospheric river itself.
The app computes this data by multiplying humidity by wind on each of the eight levels and adds them up into the integrated water vapor transport (IVT).
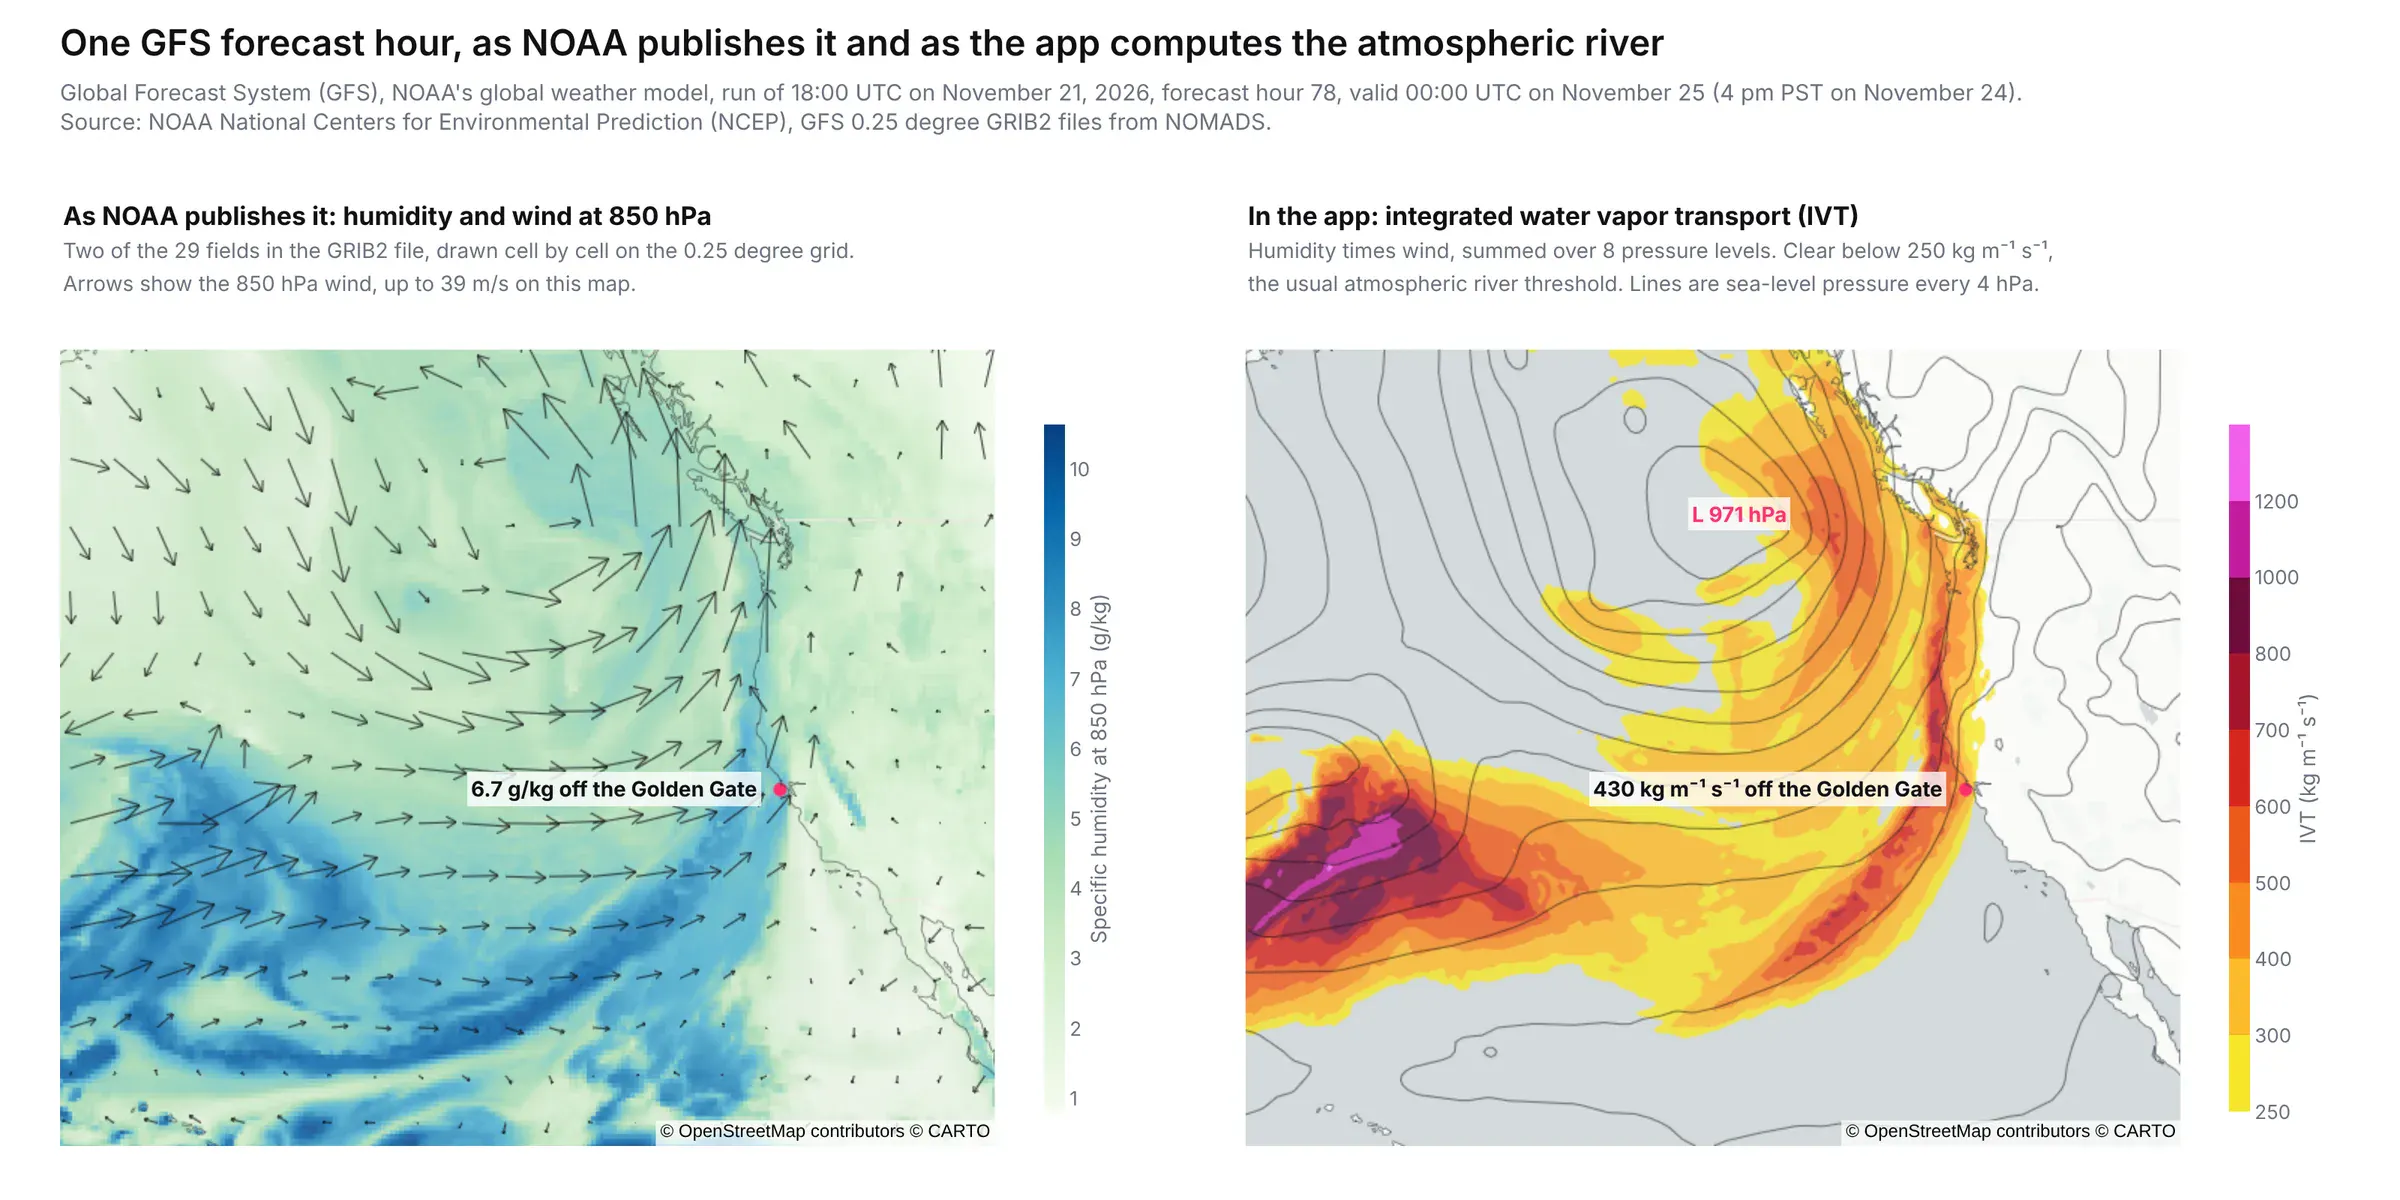
Off the Golden Gate the IVT peaks at 430 kg/m/s at 4 PM PST on Tuesday in this run.
Live Map Layers
The radar, satellite, currents and warning layers are the one place the app doesn't process anything. NOAA's nowCOAST draws each one as a PNG on request over WMS and are fetched directly from the browser:
https://nowcoast.noaa.gov/geoserver/ows?service=WMS&version=1.3.0&request=GetMap&layers=sfbofs:sfbofs_sfc_currents&styles=&format=image/png&transparent=true&crs=EPSG:3857&width=1024&height=1018&bbox=-13703429.32,4467020.99,-13547582.03,4621892.87
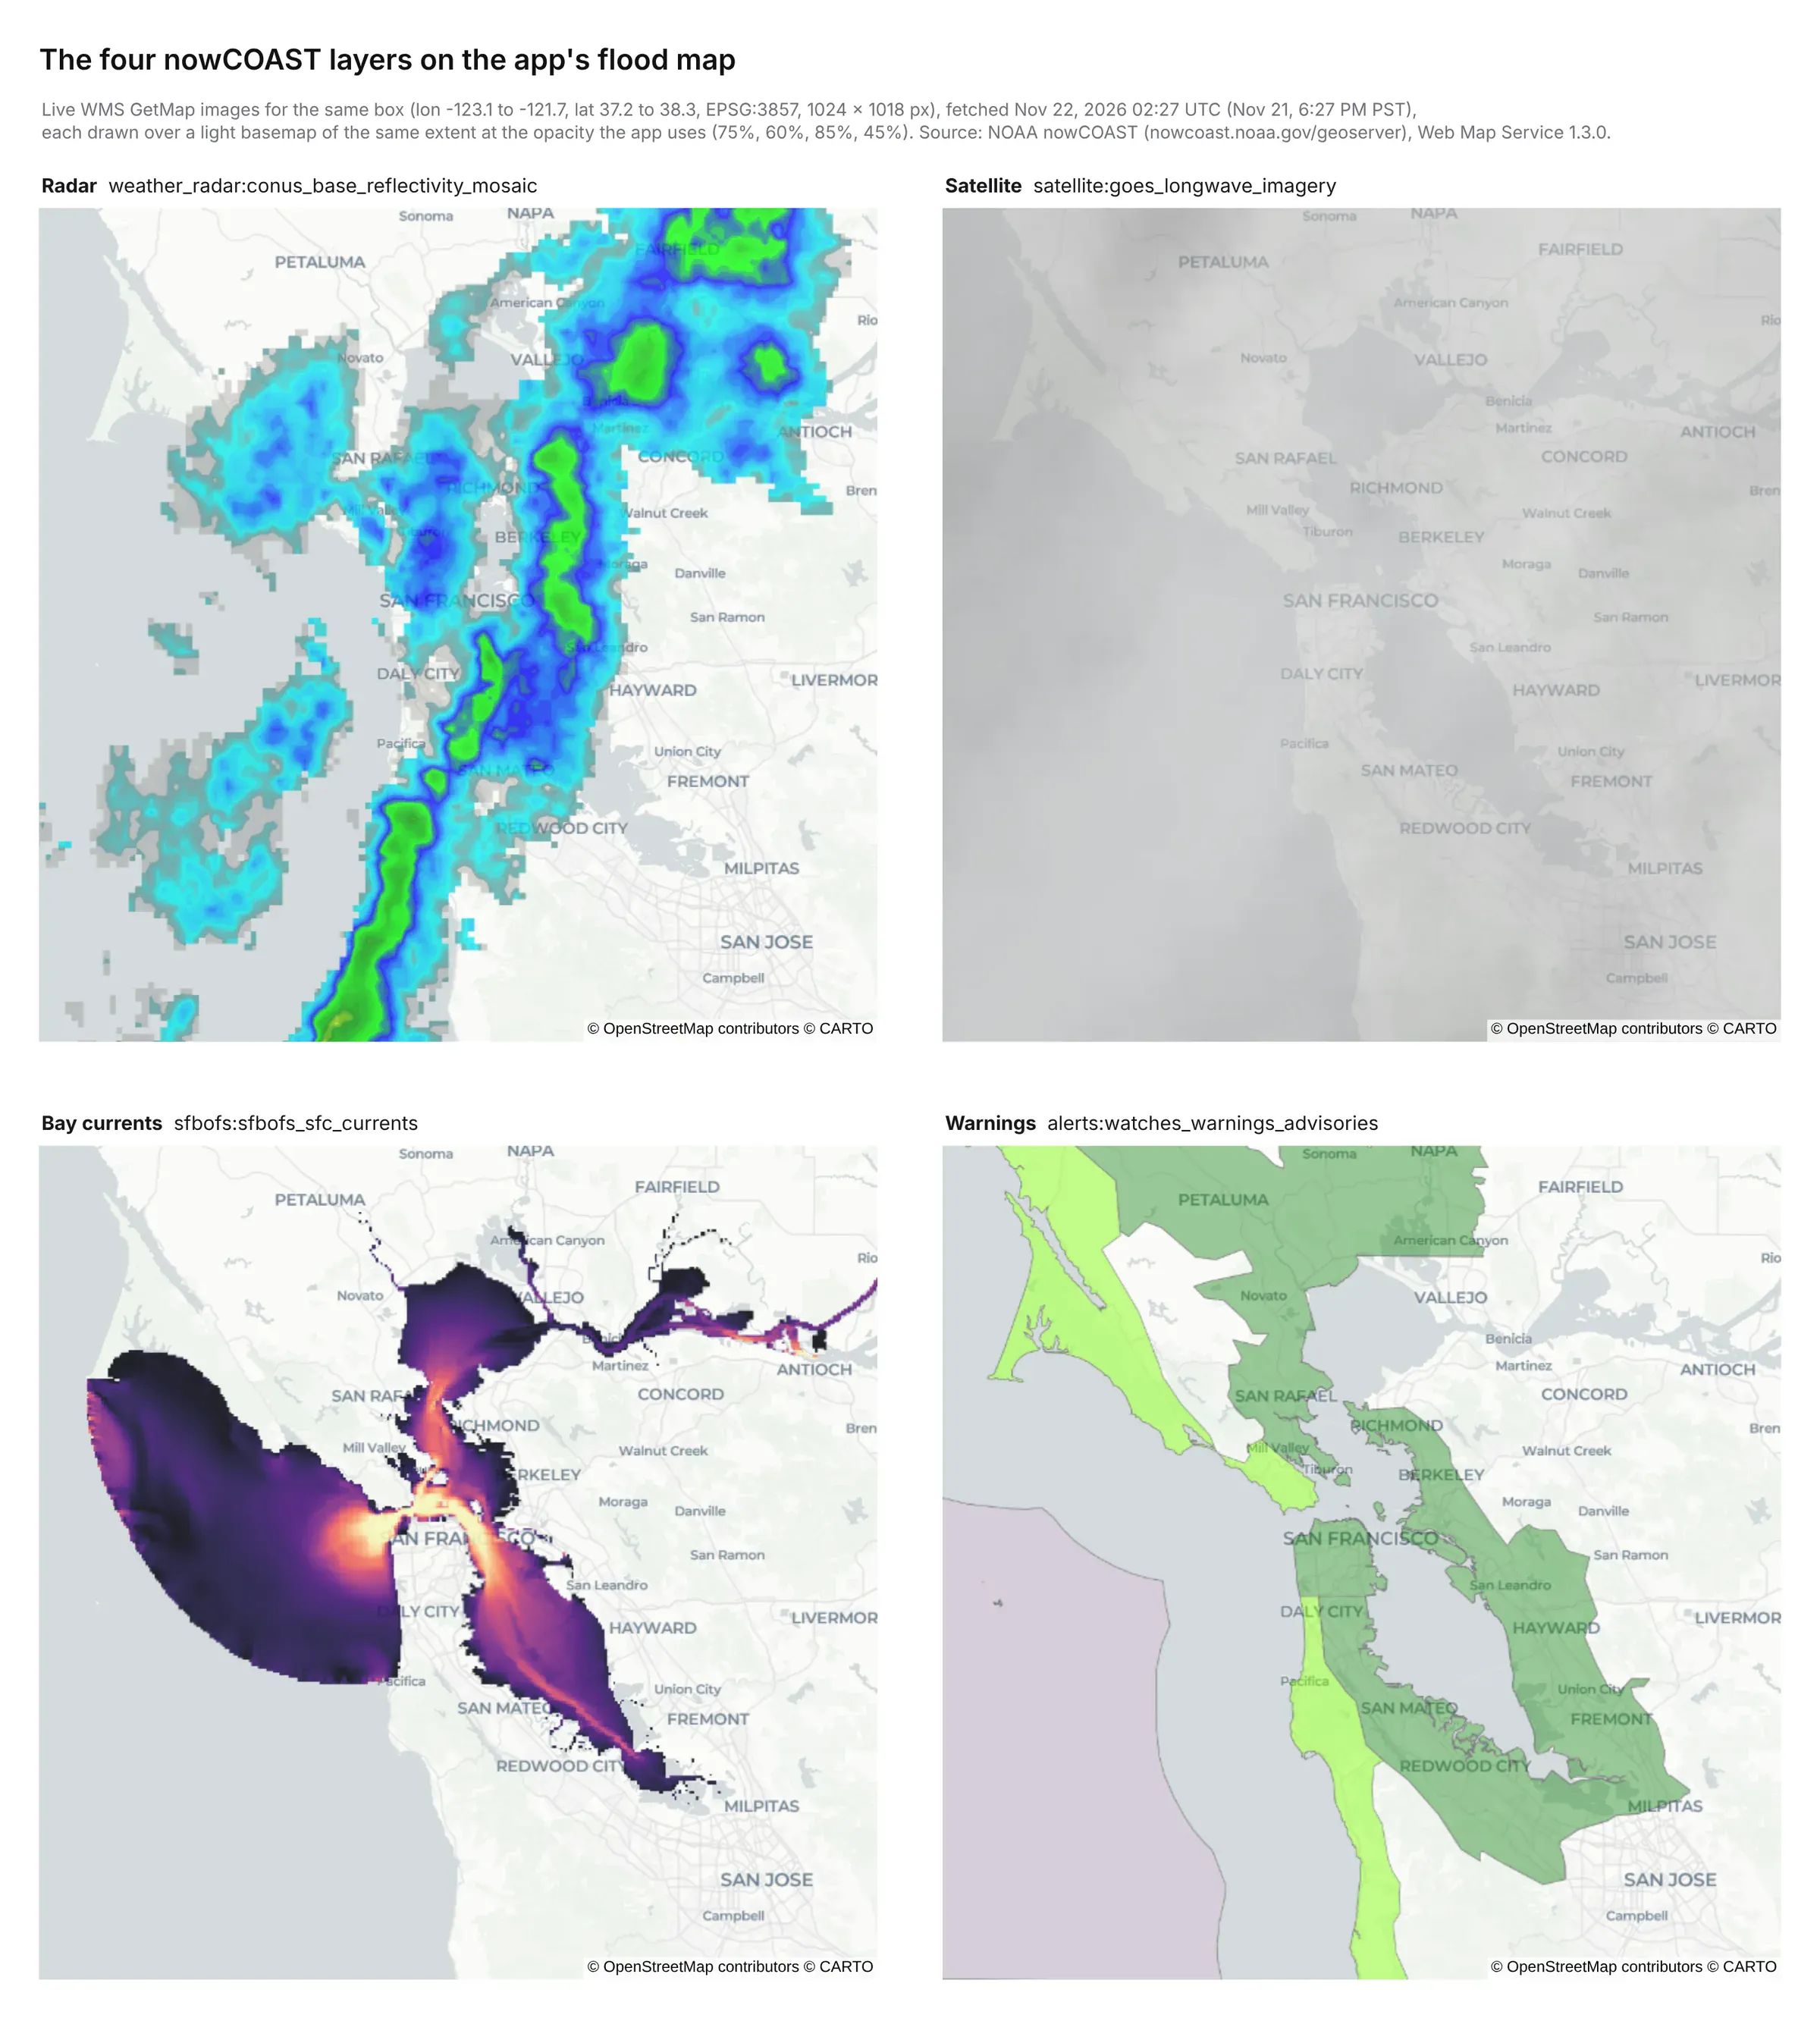
All four as nowCOAST drew them at 6:27 PM PST on Nov 21, when a band of rain was crossing the Bay.
Offshore Buoys
NDBC publishes each buoy's latest 45 days as a plain text table, with MM for a missing value:
#YY MM DD hh mm WDIR WSPD GST WVHT DPD APD MWD PRES ATMP WTMP DEWP VIS PTDY TIDE#yr mo dy hr mn degT m/s m/s m sec sec degT hPa degC degC degC nmi hPa ft2026 11 22 01 30 230 5.0 9.0 MM MM MM MM MM MM 18.5 MM MM MM MM2026 11 22 01 20 210 6.0 8.0 1.3 16 4.7 272 MM MM 18.5 MM MM MM MM2026 11 22 01 10 210 7.0 9.0 1.3 MM 4.7 272 MM MM 18.5 MM MM MM MM
The app reads six buoys between Bodega Bay and Monterey Bay, 24,862 rows of waves, wind, pressure and water temperature.
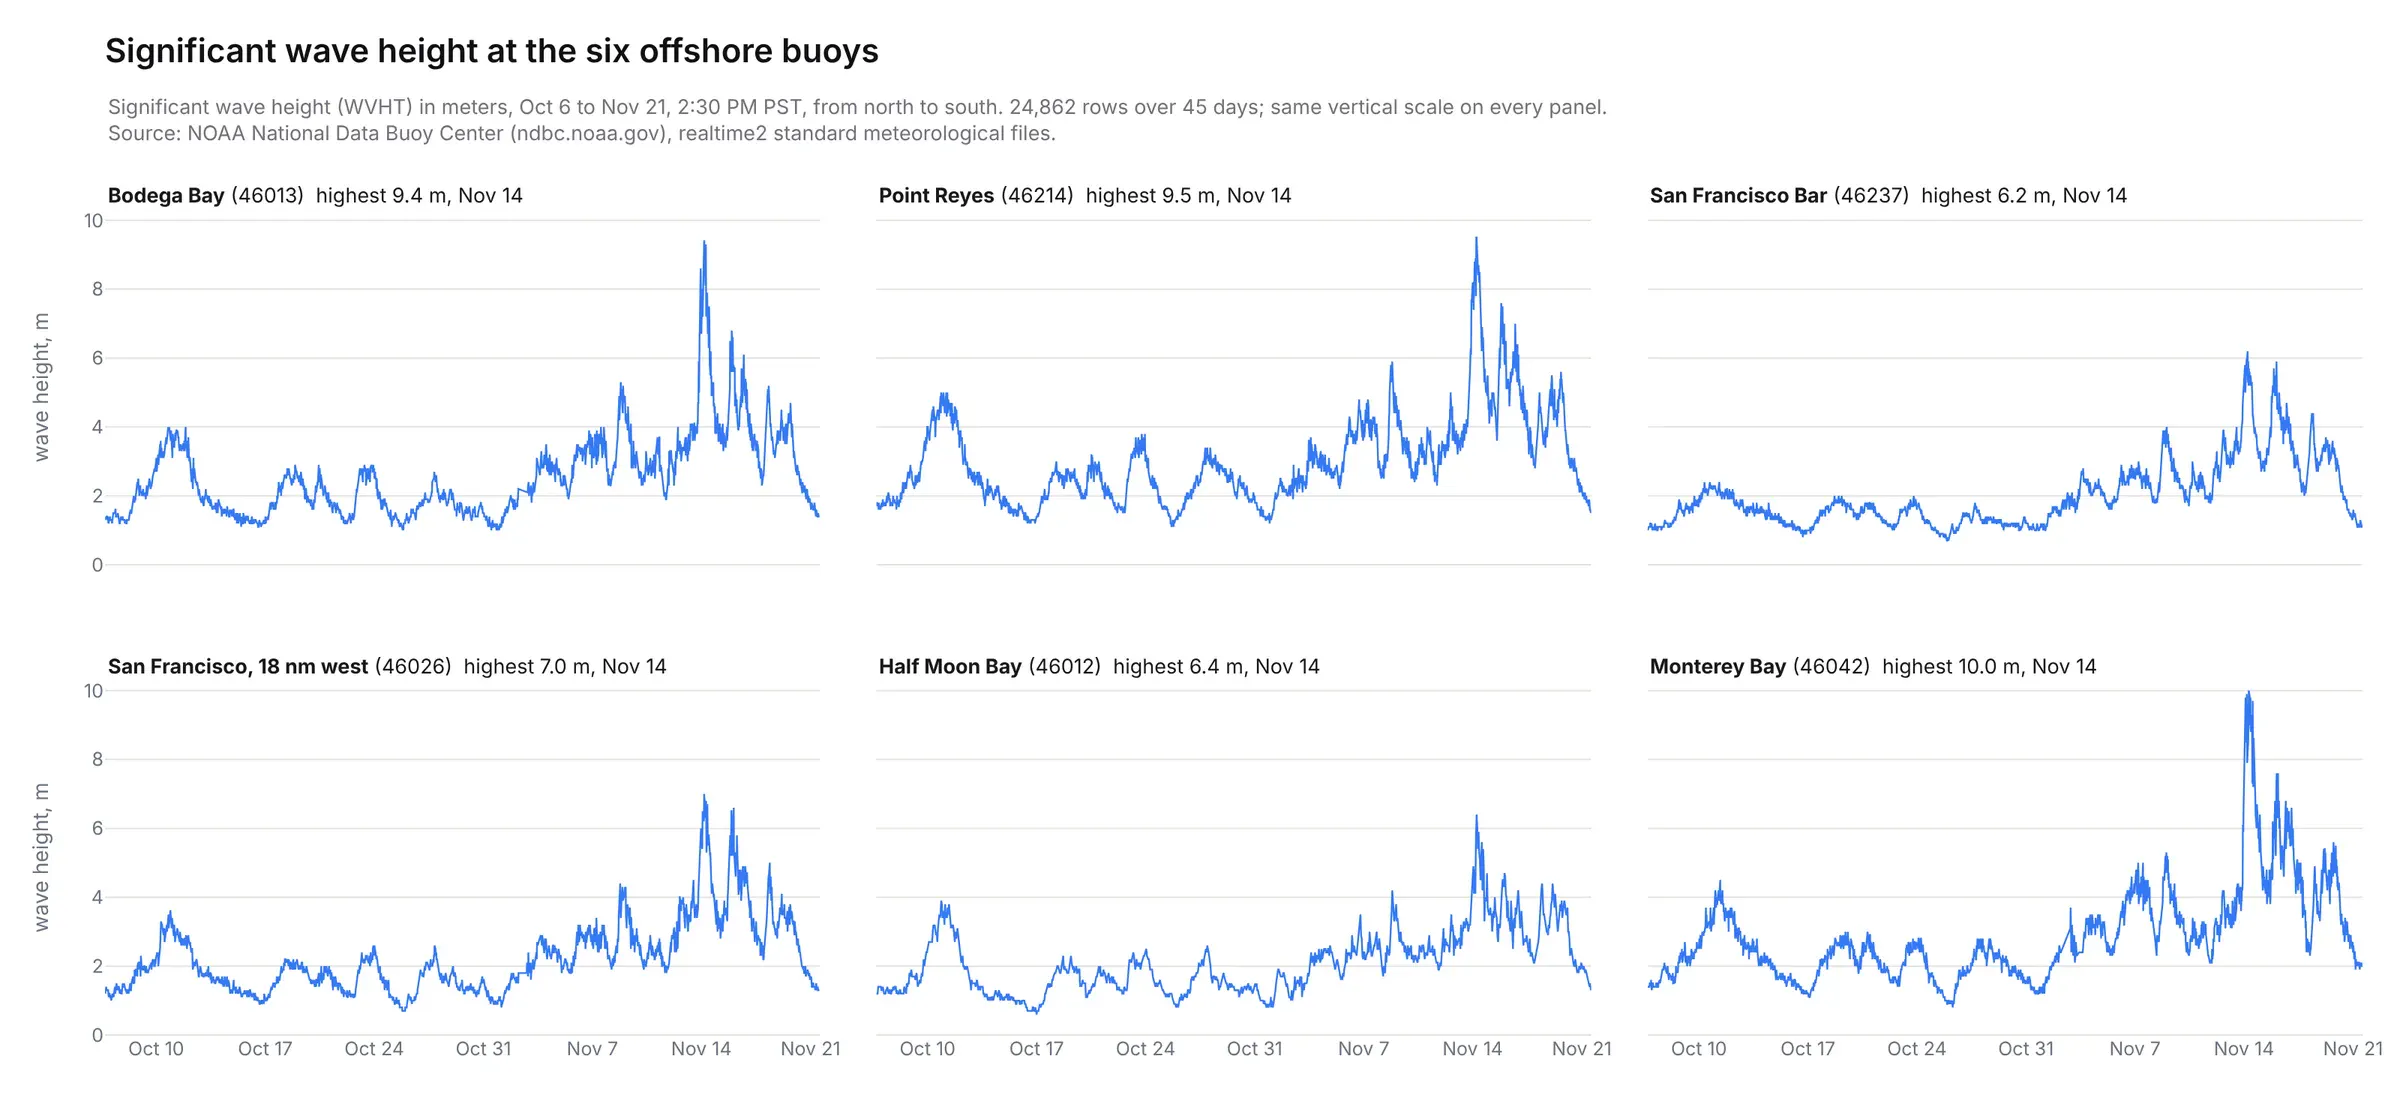
Every buoy peaked on Nov 14, up to 10.0 m at Monterey Bay.
El Niño Index
NOAA's Climate Prediction Center publishes the Oceanic Niño Index as a text table, one row per three-month season since 1950:
SEAS YR TOTAL ANOMDJF 1950 25.01 -1.32JFM 1950 25.36 -1.20...JJA 2026 29.09 1.80JAS 2026 29.12 2.16ASO 2026 29.23 2.46
The latest season, August to October 2026, is +2.46 °C. The app lines it up with San Francisco's monthly sea level.
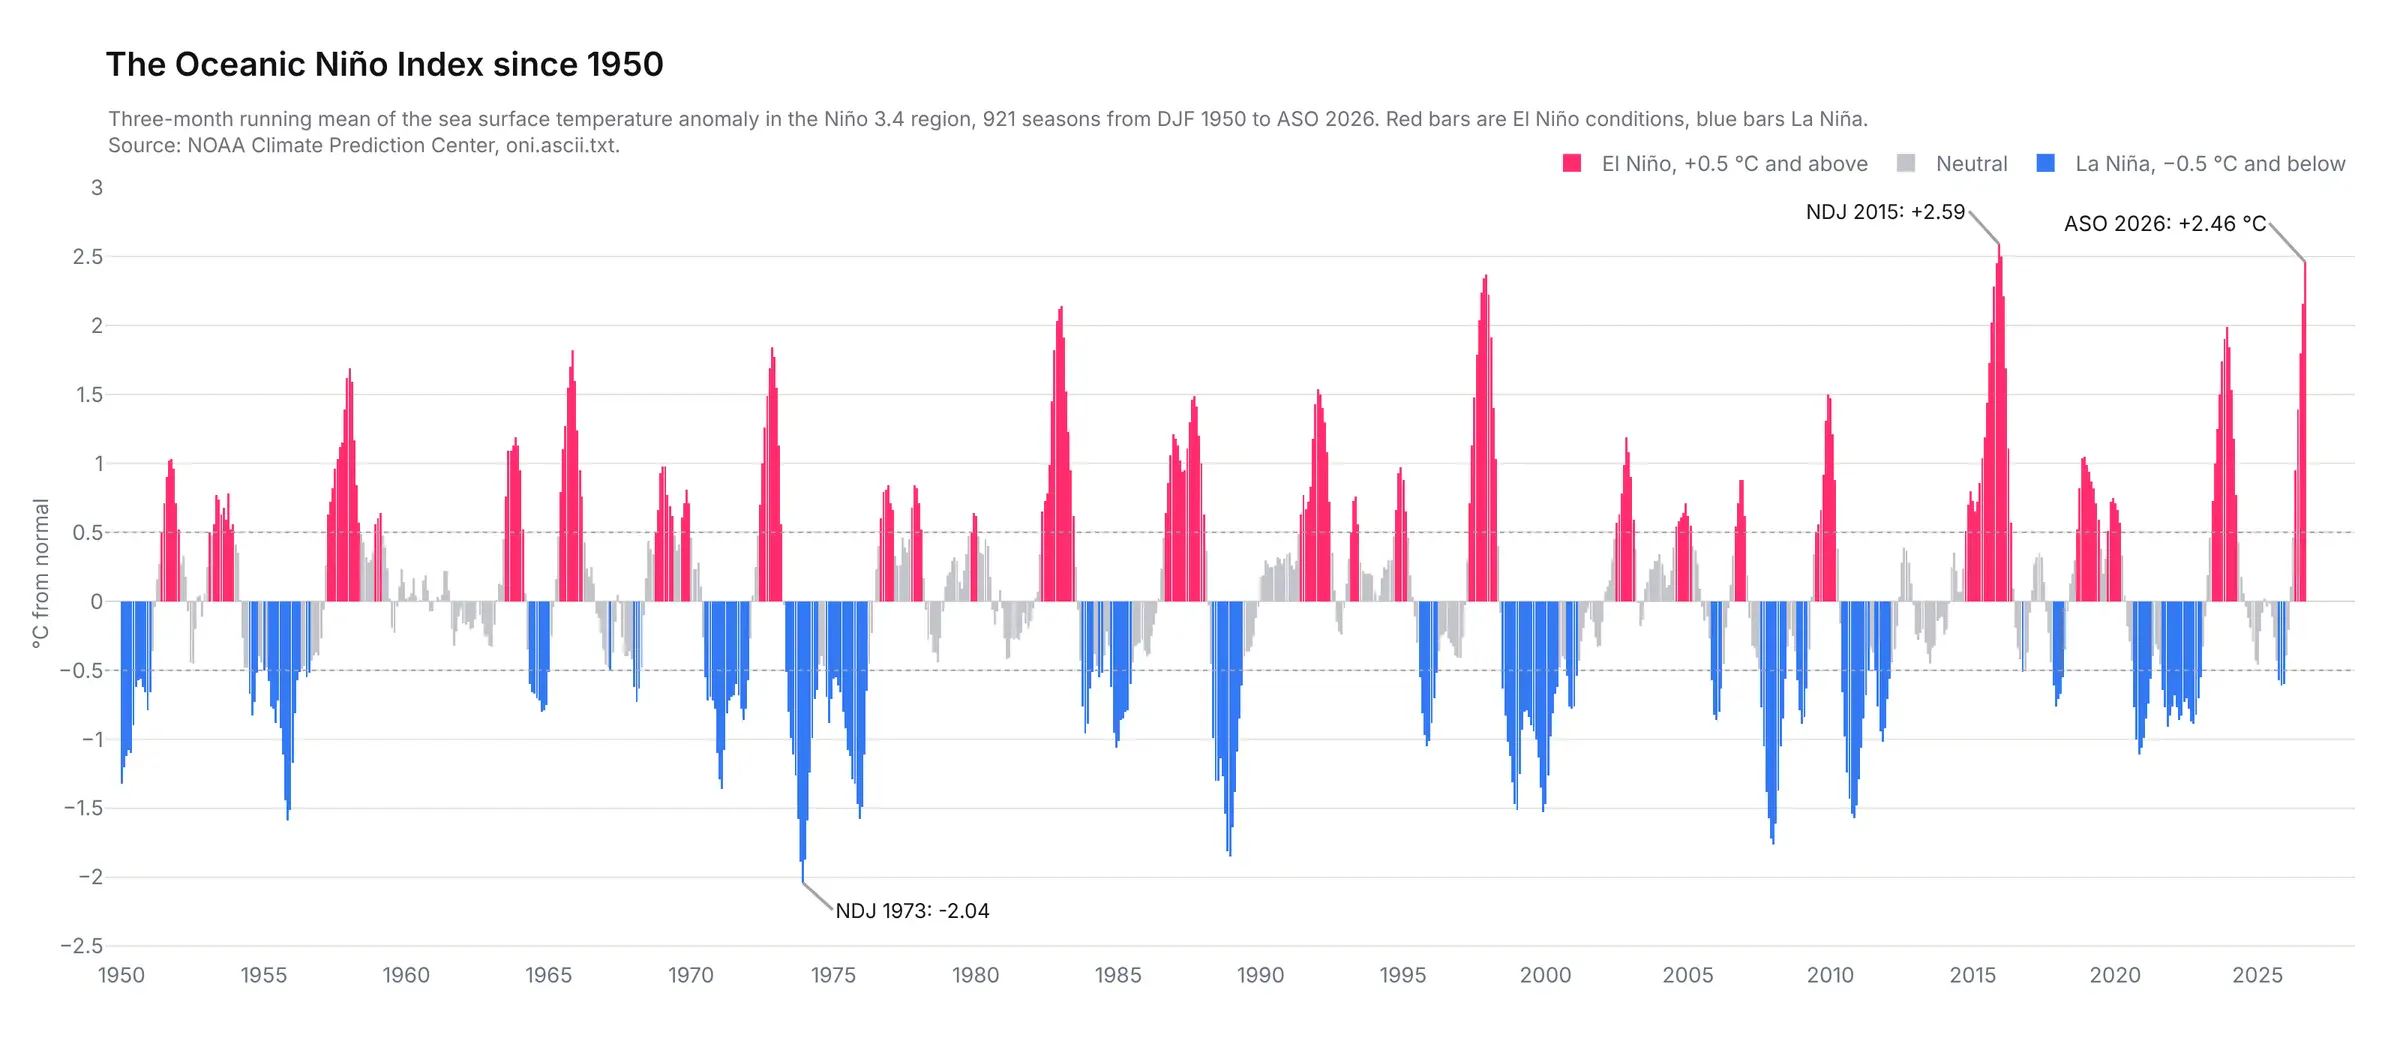
No August to October season since 1950 has been warmer. The highest of any season is +2.59 °C, at the end of 2015.
Conclusion
Today’s coding agents can build extraordinary data apps with Dash. It doesn’t require any advanced prompting. Just asking today’s models to “build something extraordinary” is enough to create something that would be considered world-class. Sophisticated data analysis, visualization, and geospatial analysis is available to anyone with a coding agent.
I’m finding that the most effective data apps make their underlying logic and data feeds transparent. Adding pages that show off the data catalog, metrics, and formulas helps illustrate the underlying work that the model did in a way that can be easier to review and share than the underlying code.
I continue to be amazed by the amount of public open data that’s out there. Hats off to all of the staff at NOAA, NWS, and others that do the hard legwork to make this data and forecasts widely available.