
Chris Parmer
November 3, 2026
Semantic Layer for Dash Enterprise Teams: A Complete Guide (2026)
TL;DR
- Every metric is already defined somewhere, usually in the code or spreadsheet that calculates it. What agents add is the need to have that definition written down where they can read it.
- Semantic layers are moving toward plain-text documents that agents read as context. Agents can now write the SQL from those definitions themselves, so the query compiler that semantic layer products were built around matters much less than it did.
- For most teams, that means you don't need to buy and run a separate semantic layer product. Keep the definitions as Python functions in your Dash app, or as markdown files in a shared repo. For those files we prefer Google's Open Knowledge Format (OKF) to Apache Ossie, which is more structured and strict, and a worse fit for agents.
- Coding agents are good enough to do this. In Plotly's DataAnalyticsBench, a 43-question exam against a 20-million-row warehouse, the best models answered every question correctly.
- If your company already defines its metrics in dbt, Snowflake, Databricks, Power BI, Looker or Cube, a Dash app can import them: run them inside the app, call the other system, or hand the definitions to agents over MCP.
Data work is full of ambiguity. Much of what you need to know isn't in the tables, such as which of three similar columns is the right one, or what units a column is in, like whether revenue is monthly or annual, and a metric like ARR changes with the fiscal calendar and with whether paid pilots count.
Those decisions usually live in the code or spreadsheet that produces the number, and in the heads of the people who work with it. A person who isn't sure can ask a colleague, but an AI agent doesn't know any of this unless you give it the context.
Writing definitions down for other tools is what the industry calls a semantic layer, and until recently that meant buying a product with its own modeling language and query compiler. This guide covers a cheaper and simpler way to do it, in plain text that agents read, and how a Dash Enterprise app can use the semantic layer your company already has in dbt, Snowflake, Databricks, Power BI, Looker or Cube. The examples use ARR at a software company and the treatment-emergent adverse event (TEAE) rate in a clinical trial, which is the share of patients who had a side effect after their first dose.
The options in brief
Semantic layers are moving toward plain-text documents that coding agents and analytics agents can read as context. That makes the compilation layer that semantic layer products provided much less necessary than it used to be, because agents can now write the SQL from the definitions themselves. Options 1 to 3 don't need a separate semantic layer product, which keeps the cost down and leaves you with fewer systems to run.
Option 1: write each metric as a Python function in the Dash app.
- Keep the functions in one file, such as metrics.py, with the semantic rules in the docstrings, and add a test for each number people report.
- The app's pages, its REST API, any gold tables it writes back to the warehouse, the Dash MCP tools that people's own agents call, and Plotly Studio Embedded (the in-app agentic analytics chat window in Dash) all use the same function, so every number agrees.
- This works best when one team owns the numbers.
Option 2: write the definitions in markdown, in a shared repo.
- Put column notes, known data problems, business terms and metric formulas in a repo like <org>/definitions, one file per concept.
- Domain experts update the files with a coding agent, and every builder's coding agent reads them and writes the SQL.
- Standards are emerging for how to write these files. Google published the Open Knowledge Format (OKF) in June 2026 and released version 0.2 in July, and Apache Ossie's last release is 0.1.1, with a 0.2 draft in progress. We prefer OKF, because Ossie is more structured and strict, which makes it a worse fit for agents. You can still export to Ossie when a tool needs to import it.
- This works best when the knowledge is spread across the company.
Option 3: precompute "gold" tables in the warehouse.
- A scheduled job writes numbers such as ARR by fiscal year and territory to a table that any tool can read.
- Gold tables can only answer the questions they were built for, so use them for a few company KPIs at one fixed grain, and keep everything people want to slice in Options 1 or 2.
Option 4: import the definitions from the tools your company already uses.
If your company already defines its metrics in dbt, Snowflake, Databricks, Power BI, Looker or Cube, a Dash app can use them in three ways:
- Compile it in the app. Run dbt's MetricFlow inside the Dash app. It writes the SQL, and your warehouse runs it.
- Run it in the other system. Send the request from a Dash callback or MCP tool to Snowflake, Databricks, Power BI, Looker, Cube or dbt Cloud. It's simple, but each request adds latency and usually costs money, so cache the results.
- Give agents the definition. Pull the definitions out as text, such as Ossie YAML from Snowflake or TMDL files from Power BI, and let agents write the queries.
What we'd do: start with Option 1 or 2, as plain text in a repo your company owns. That's the direction the vendors are moving in too, and you can add Option 4 for metrics another system owns without rebuilding the app.
You may not need a semantic layer product
There are two reasons most teams can skip a semantic layer product.
The team that owns the definition usually owns the app. Semantic layer products assume that each definition will have many consumers, with several BI tools, a notebook platform and a vendor's agent all needing the same ARR. In most companies it doesn't work that way. There's usually one sales dashboard, built by the team that knows what the numbers mean, and everyone else uses it or asks that team. Coding agents make this even more common, because the people who own the numbers, in finance or clinical operations for example, can now build that app themselves instead of waiting for a development team. When the definition and the app live in the same place, the owner can change both at once, and there's no other system to keep in sync.
The definitions fit in plain files. Agents need the definitions that people used to carry in their heads to be written down somewhere they can read them. That doesn't take a separate product. A Python file, or a few markdown files in git or in the internal knowledge base your company already uses, is enough, as long as agents can reach it, and coding agents can both read and write these files.
Here are three ways to do that, ordered from least to most work. They can be combined, and for many teams the first one is enough.
Option 1: domain experts build the app, and the definitions live in Python
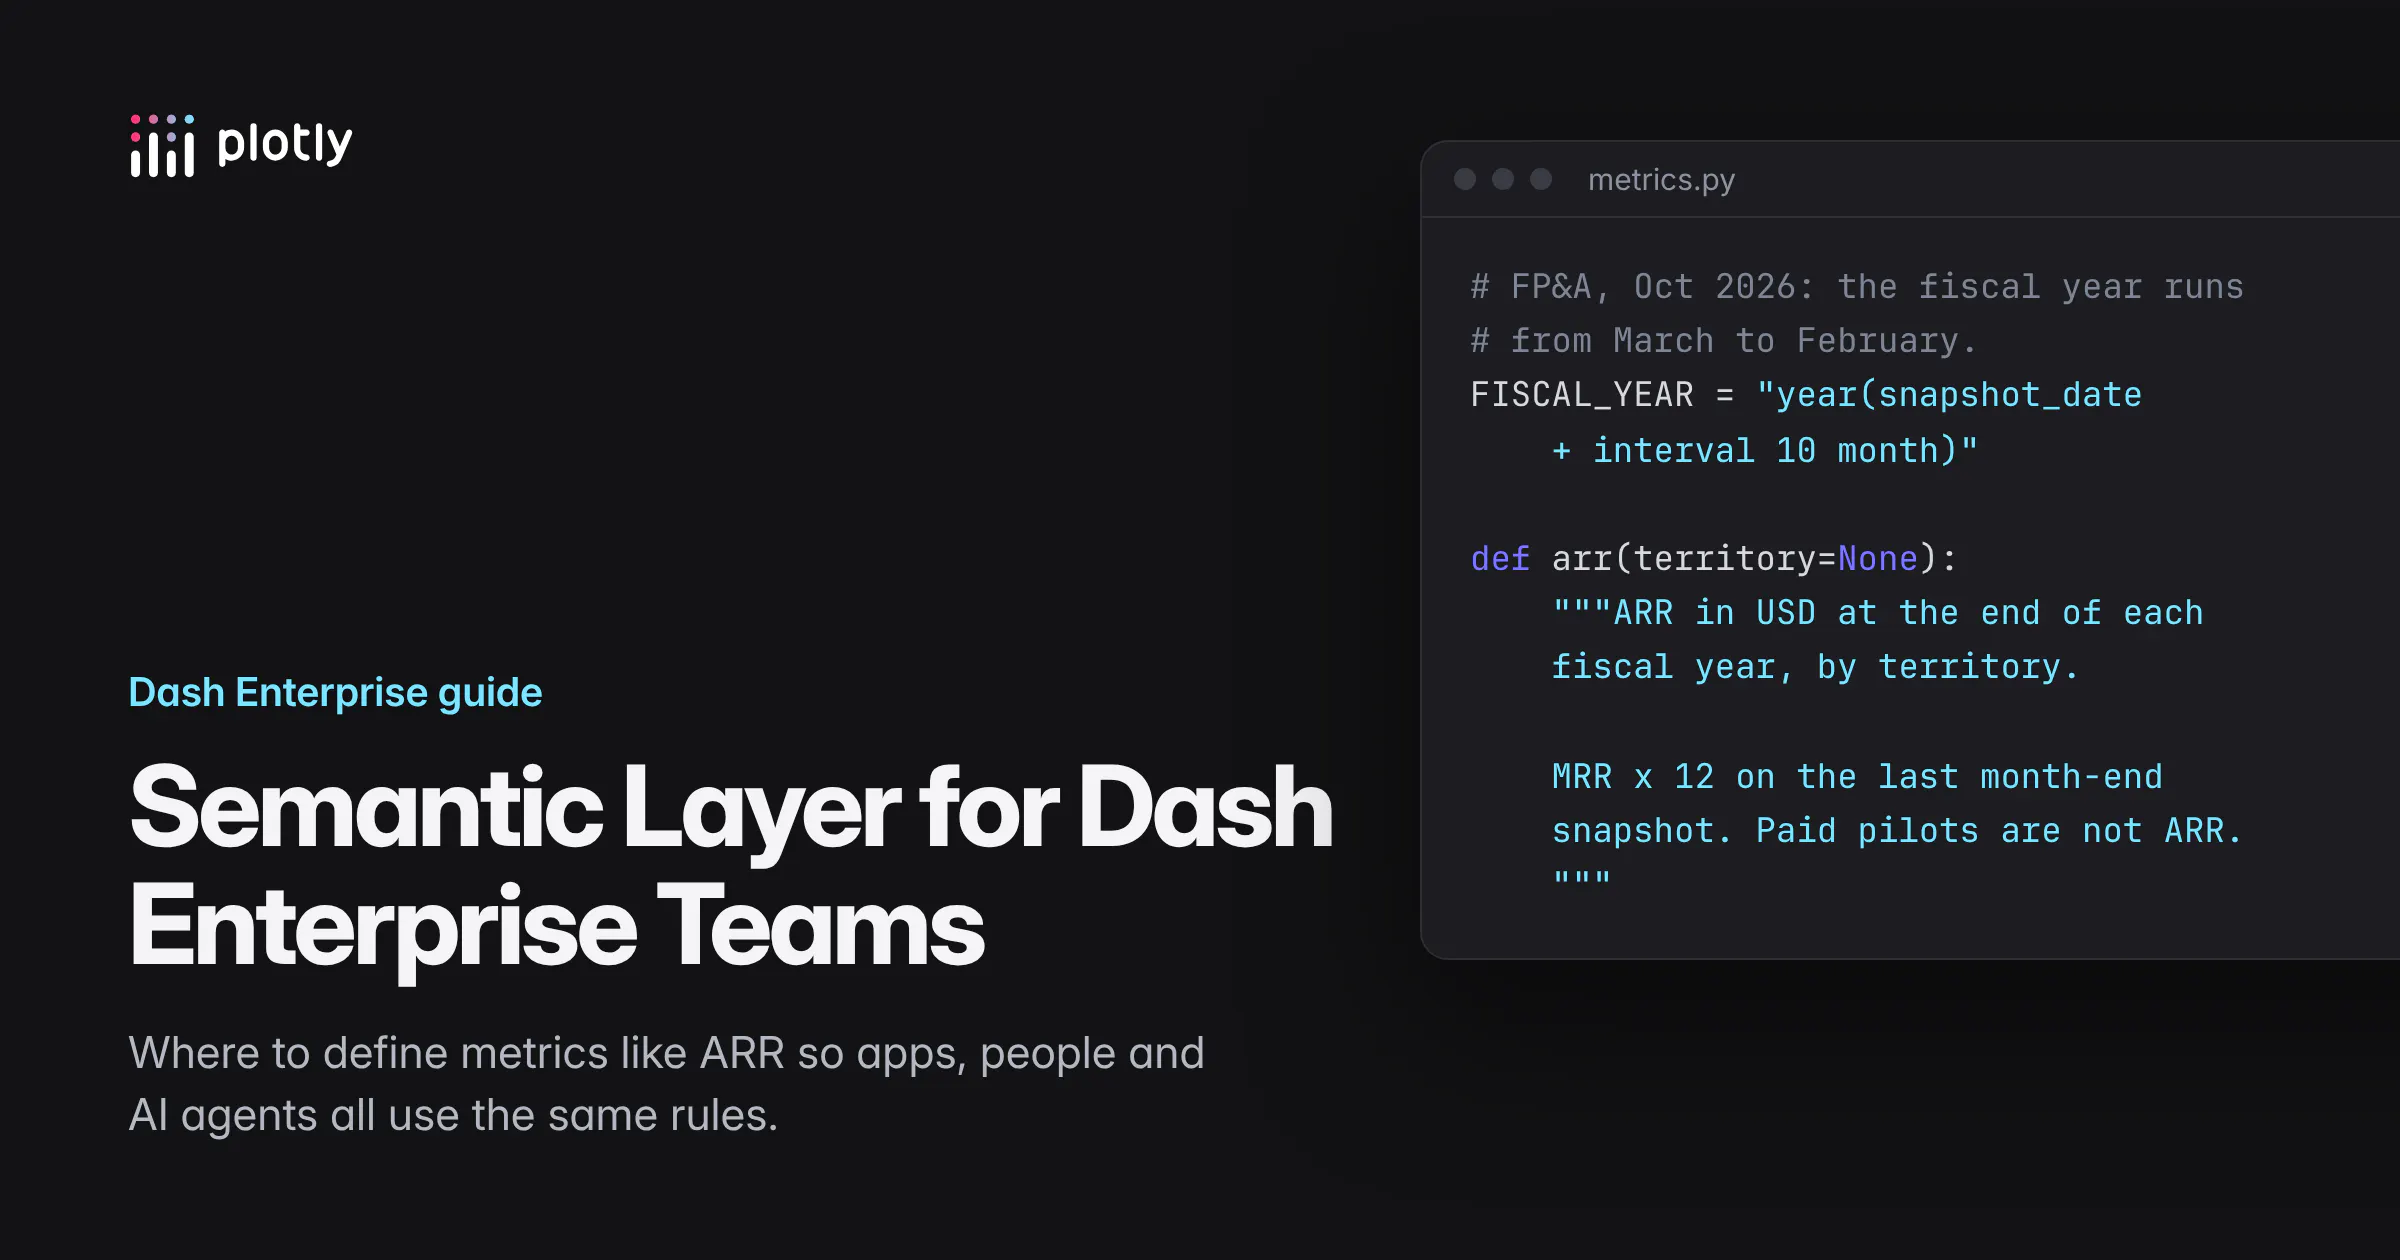
In this model the domain experts, such as FP&A for ARR or biostatistics for TEAE rates, build the app themselves with a coding agent. As they work, they tell the agent what each number means and how it should be calculated, and the agent hardens those decisions into code, with one Python function per metric. Ask it to keep the functions in their own file, such as metrics.py, which then becomes the source of truth.
# metrics.py: the definitions of our business metrics.import duckdb# FP&A, Oct 2026: the fiscal year runs from March to February.# FY2027 is 1 March 2026 to 28 February 2027.FISCAL_YEAR = "year(m.snapshot_date + interval 10 month)"def arr(territory=None):"""ARR in USD at the end of each fiscal year, by territory.ARR is MRR x 12, summed over the subscriptions that are active on the lastmonth-end snapshot of the fiscal year. Paid pilots are not ARR."""con = duckdb.connect("warehouse.duckdb", read_only=True)return con.execute(f"""with s as (select m.snapshot_date, m.mrr_usd, c.territory, {FISCAL_YEAR} as fiscal_yearfrom fct_mrr_monthly mjoin dim_customers c using (customer_id)where m.plan_type <> 'pilot'and ($territory is null or c.territory = $territory))select fiscal_year, territory, sum(mrr_usd * 12) as arrfrom swhere snapshot_date = (select max(snapshot_date) from s as s2where s2.fiscal_year = s.fiscal_year)group by fiscal_year, territoryorder by fiscal_year, territory""", {"territory": territory}).df()
Because the definition is hardened in code, anyone can read exactly how the number is calculated, down to the query itself. Metrics like this have subtleties that are easy to get wrong, and the code handles them so that nobody has to remember them, and a coding agent can work them out with you while you build the app. Here, the subscription table is a monthly snapshot: it has one row for each active subscription at the end of each month, so a subscription that ran all year appears twelve times. ARR for a year is the total on the last month-end of that year, so the query keeps only that last snapshot. Adding up all twelve months would count every subscription twelve times.
The comments and the docstring are part of the definition, because they record what FP&A decided and why. Every page and report calls arr(), and nothing else calculates ARR.
Add a test for each number people report. When someone changes the definition, the test fails, and the metric's owner has to approve the new number before it ships:
# test_metrics.pyimport metricsdef test_europe_arr_fy2026():df = metrics.arr("Europe")assert round(df[df.fiscal_year == 2026].arr.sum(), 2) == 7044140.64
When you build on Dash, people and programs can get to the same number in several ways: through the app's user interface, through their own chat client connected to the app's MCP server, through the chat panel inside the app, through a REST API that scripts, notebooks and other services call, or through a gold table that the app writes back to the warehouse for tools that only read tables. All five use the same arr() function, so they always agree. The app below sets up the first four, and the gold table takes a few lines in a scheduled job:
# app.py: the page, the MCP tools, the API and the data for Studio Embedded.import osimport duckdbfrom dash import Dash, dcc, htmlfrom dash.mcp import mcp_enabledfrom flask import jsonify, requestimport plotly.express as pximport metricsapp = Dash(__name__, enable_mcp=True)@mcp_enabled(expose_docstring=True)def arr(territory: str | None = None) -> list[dict]:"""ARR in USD at the end of each fiscal year, by territory.Fiscal years run March to February. Paid pilots are not included."""return metrics.arr(territory).to_dict("records")# A REST endpoint on the app's server. This uses Flask, Dash's default; with# Dash(backend="fastapi"), write the route as @app.server.get(...) instead.# Dash Enterprise serves each app under its own path, held in# DASH_ROUTES_PATHNAME_PREFIX.PREFIX = os.environ.get("DASH_ROUTES_PATHNAME_PREFIX", "/")@app.server.route(f"{PREFIX}api/arr")def arr_api():return jsonify(arr(request.args.get("territory")))# Studio Embedded registers module-level dataframes like these two.# You can add ARR across territories, but not across fiscal years.arr_by_year_and_territory = metrics.arr()# One row for each patient, so the mean of had_teae is the TEAE rate.con = duckdb.connect("warehouse.duckdb", read_only=True)safety_subjects = con.execute("""select s.usubjid, s.trt01a as arm, s.agegr1 as age_group,count(a.usubjid) filter (where a.trtemfl = 'Y') > 0 as had_teaefrom adsl sleft join adae a using (usubjid)where s.saffl = 'Y'group by all""").df()app.layout = html.Div([html.H2("ARR at each fiscal year end"),dcc.Graph(figure=px.bar(arr_by_year_and_territory, x="fiscal_year", y="arr", color="territory")),])if __name__ == "__main__":app.run()
- The app. The page calls metrics.arr() directly.
- Other programs, through an API or a gold table. app.server is the web server behind the app, either FastAPI or Flask, so a route on it gives scripts, notebooks and other services the same numbers as JSON, for example GET /api/arr?territory=Europe. For BI tools and pipelines that only read from the warehouse, a scheduled job can call metrics.arr() and write the result back as a gold table (Option 3), for example with con.execute("create or replace table gold_arr as select * from df") after df = metrics.arr() in DuckDB.
- Their own chat client, through Dash MCP. enable_mcp=True and @mcp_enabled turn the function into an MCP tool, using the type hints as the input schema and the docstring as the description. A user connects Claude, ChatGPT or Cursor to the app's /_mcp URL and asks "What's ARR in Europe?", and the agent calls the arr tool instead of writing its own SQL.
- Plotly Studio Embedded (the in-app agentic analytics chat window in Dash). Studio Embedded picks up the app's module-level dataframes and whatever a get_data() function returns, and its agent also reads the app's docstrings and markdown files, so the definitions travel with the data. It helps to shape the dataframes so that the obvious aggregation is the right one. In the example, ARR is already taken at each fiscal year end, so summing across territories is correct, and the trial data has one row per patient, so the mean of had_teae is the TEAE rate. Starting in early November 2026, Studio Embedded can also call the app's Dash MCP tools, which lets it use the functions directly. Studio Embedded is in beta on Plotly Cloud and is planned for Dash Enterprise in Q4 2026.
This model works because everything is in one place: the definition, the code that computes it, the tests and every interface people use. There are no copies to keep in sync, and because it's all in git, every change to a definition is version-controlled, and people can review each other's changes in a pull request on GitHub or a similar tool before they ship. If you also keep the definitions in markdown next to the code, a CI check can compare the two and fail when, for example, someone changes the fiscal year in the code but not in the docs.
Option 2: definitions in markdown, in a shared repo
In the second model, the people who know what the data means write it down as text, and everyone who builds something reads it. Domain experts in finance, clinical or sales operations use a coding agent to write and update the definitions, and builders' coding agents read them, so nobody in finance has to review Python.
Plain markdown works, but a standard gives the files a structure that agents can write to and tools can check. Two formats have emerged over the past year, and we prefer OKF:
- Google's Open Knowledge Format (OKF) is a folder of markdown files with YAML frontmatter, with one concept per file. Despite the name, it doesn't need any Google service or software: it's a plain-text convention for how to lay out the files, so any editor, git host or agent can work with it. It's easy for people to read and for agents to write.
- Apache Ossie is a single YAML file of datasets, fields, relationships and metrics written as SQL expressions. It's much more structured and strict than OKF. That helps when a tool such as Snowflake imports it directly, but it makes Ossie a worse fit for agents, because much of what agents need to know doesn't fit its fields and ends up as free text anyway.
We'd keep the definitions in a single GitHub repo, something like <org>/definitions, which builders' coding agents can reference from any project now that agents work across several repos. A monorepo works too, with several apps built in the same repo and the definitions in a shared folder. Add an AGENTS.md with rules for agents that edit the repo, such as "every column has a unit" and "never invent a date range", and a short script that checks the docs against the warehouse, failing when a column has no documentation or when a doc describes a column that no longer exists.
There are three kinds of definition to write down, and in the repo each gets its own folder:
definitions/ # the <org>/definitions repo├── AGENTS.md # rules for agents that edit this repo├── tools/│ └── check_docs.py # fails if a column has no docs, or a doc names a missing column└── knowledge/ # the OKF bundle├── index.md # optional: what's in the bundle, for agents to browse├── log.md # optional: a dated history of changes├── tables/ # column notes, one file per table│ ├── fct_mrr_monthly.md│ ├── dim_customers.md│ └── adae.md├── known-issues/ # data problems that the table files link to│ └── adae-missing-onset-dates.md├── glossary/ # business terms│ ├── fiscal-year.md│ └── europe-territory.md└── metrics/ # formulas├── arr.md└── teae-rate.md
OKF only asks for markdown files with a type in their frontmatter, and leaves the folder names up to you. It reserves index.md and log.md in every folder and treats every other markdown file as a concept, so AGENTS.md and the scripts sit next to the bundle rather than inside it. Any folder can also have its own index.md listing what's in it.
Column notes: units, caveats and joins. Each table gets a file with a bullet per column. This is tables/fct_mrr_monthly.md in Google's OKF format:
---type: Tabletitle: fct_mrr_monthlydescription: Month-end MRR for each active subscription.owner: Data team---# Columns- `subscription_id` (VARCHAR): not unique in this table, because there's one row per month.- `plan_type` (VARCHAR): `annual`, `monthly` or `pilot`. Pilots aren't recurring revenue; see [ARR](/metrics/arr.md).- `mrr_usd` (DOUBLE, USD per month): monthly recurring revenue on that date. Multiply by 12 for annual.
Data problems get their own file, such as known-issues/adae-missing-onset-dates.md, which the affected tables link to:
---type: Known Issuetitle: Missing adverse event onset datesdescription: 11 adverse events have no onset date, so they don't count as treatment-emergent.owner: Biostatisticsaffects: [adae.astdt, adae.trtemfl]---11 of 1,191 adverse events, from 8 patients, have no onset date. Under the analysis plan theyare not treatment-emergent, because the rule requires a start date on or after the first dose.
Column notes can also go into the database as comments, where every SQL editor and BI tool will show them. A short script can write the comments from the markdown, so the markdown stays the source:
-- DuckDB, Snowflake and PostgresCOMMENT ON COLUMN fct_mrr_monthly.mrr_usd IS 'Unit: USD per month. Multiply by 12 for annual.';-- DatabricksALTER TABLE fct_mrr_monthly ALTER COLUMN mrr_usd COMMENT 'Unit: USD per month. Multiply by 12 for annual.';
Database comments are worth having, but they aren't enough on their own, because some rules don't belong to any one column. "The fiscal year starts in March" applies to every date in the warehouse, so rules like that belong in a glossary entry or a metric file.
Definitions of terms. This is glossary/fiscal-year.md:
---type: Glossary Termtitle: Fiscal yeardescription: FP&A's fiscal year, March to February, named for the year it ends in.owner: FP&A---The fiscal year runs from 1 March to the end of February and is named for the calendar yearit ends in: FY2027 is 1 March 2026 to 28 February 2027. In SQL: `year(date + interval 10 month)`.
Formulas. A metric file, such as metrics/arr.md, states the formula in words and explains how the metric can be sliced:
---type: Metrictitle: ARRdescription: Annual recurring revenue at the end of a period, excluding paid pilots.owner: FP&A---# FormulaMRR x 12, summed over subscriptions active on the last month-end snapshot of the period,excluding paid pilots (`plan_type = 'pilot'`).# Slicing- Group or filter by territory, country or plan type: apply the filter before finding thelast snapshot date.- Never sum ARR across snapshot dates. By month means ARR on each month end.
The same definitions look like this in Ossie:
datasets:- name: fct_mrr_monthlysource: warehouse.main.fct_mrr_monthlyfields:- name: fiscal_yearexpression:dialects:- { dialect: ANSI_SQL, expression: "EXTRACT(YEAR FROM snapshot_date + INTERVAL '10' MONTH)" }description: FP&A fiscal year, March to February, named for the year it ends in.- name: mrr_usdexpression:dialects:- { dialect: ANSI_SQL, expression: mrr_usd }description: Monthly recurring revenue on the snapshot date, in USD per month.metrics:- name: arrexpression:dialects:- dialect: ANSI_SQLexpression: "SUM(CASE WHEN fct_mrr_monthly.plan_type <> 'pilot' THEN fct_mrr_monthly.mrr_usd * 12 END)"ai_context:instructions: >-Evaluate on a single snapshot date: the last snapshot_date in each period (fiscal year,month), after applying filters. Never sum across snapshot dates.
Ossie doesn't have a field for a rule like "take only the last month-end snapshot of each period, instead of adding up every month", so that rule goes into ai_context as plain text. This is the main reason we prefer OKF for agents: in a markdown file, the rule is just a sentence next to the formula, where an agent reads it as part of the definition.
These formats can look like a lot to maintain, but you don't have to write the files yourself or even know the spec, because coding agents can write to them as you work. Another benefit is that when you work through a question with a coding agent and refine a definition in the chat, the decision ends up written in these files, where everyone can read and review it, instead of getting lost in the chat history or saved in an agent's opaque memory.
Write definitions as instructions, because agents follow them literally. In our example company, Sales Ops moved the UK and Ireland out of the Europe territory in October 2026. Our Ossie file recorded that history as "Europe included GB and IE until October 2026", and in one of our tests an agent read the sentence as a rule to apply and added the UK and Ireland back into Europe. The definition should have said what to do, for example "Europe is DE, FR, NL and CH; use dim_customers.territory", and put the history in a separate note. Review definitions with the same care as code.
Over time this repo becomes the company's internal knowledge, and it's useful well beyond Dash apps.
In both models, there's no compilation layer
Most semantic layer products include a query compiler. You ask it for a metric, some dimensions and some filters, either in a user interface (dragging ARR and Territory onto a chart in a BI tool, or picking fields in a Looker Explore) or in code (a command like mf query, an API request, or a SQL function in the warehouse). The compiler then looks up the definitions, works out how the tables join, writes the SQL and sends it to the warehouse.
Here are some existing ones:
- Looker reads your LookML files and writes the SQL when you pick fields in an Explore.
- dbt MetricFlow reads the dbt YAML files when you run mf query --metrics arr --group-by metric_time__fiscal_year and writes the SQL.
- Cube writes the SQL when a request to its API names some measures and dimensions.
- Snowflake semantic views. The data team stores the definitions inside Snowflake as a semantic view, an object that lists the tables, how they join and the formula for each metric. You then query it with a short statement such as SELECT * FROM SEMANTIC_VIEW(finance.arr METRICS arr DIMENSIONS territory), and Snowflake expands that into the full SQL.
- Databricks metric views. This is the same idea in Databricks. A metric view holds the definitions, and you ask for a metric with the MEASURE() function in ordinary SQL, as in SELECT territory, MEASURE(arr) FROM finance.arr_metrics GROUP BY ALL. Databricks then applies the stored formula.
- Power BI calculates a DAX measure for whatever slice is on the page, and in DirectQuery mode it writes SQL for the source database too.
Each of these has become a query language of its own. Vendors design them for their own systems, often to match the user interfaces they built, and almost all of them compile down to SQL in the end. They're shorter to write than SQL: in MetricFlow, "ARR by fiscal year in Europe" takes three names and becomes about 70 lines of SQL, with the joins, the fiscal calendar and the rule that ARR comes from the last month-end snapshot filled in for you. That was a real help when the people asking for numbers couldn't write SQL. But it's also one more layer between the question and the warehouse, with its own syntax to learn, its own limits on what you can query, and its own ways to go wrong. Now that agents can write the SQL directly from the definitions, that layer matters much less.
In Options 1 and 2, nothing does this at runtime. A coding agent reads the definitions and writes the Python and SQL when the app is built, and a person reviews it, so the compiler's work happens once and the result is code people can read.
Agents are now good enough to do this reliably. In Plotly's DataAnalyticsBench, our benchmark for data analysis, which has 43 questions against a 20-million-row warehouse with ambiguous questions and messy data, the best models answered all 43 correctly and low-cost models answered close to 90%. In our tests for this guide, agents that only had the table schema wrote correct SQL but got the business answers wrong, because they couldn't know FP&A's rules, while agents that had the definitions got them right. The definitions are the part agents actually need.
That gives you two choices for Studio Embedded. Because it reads the app's docstrings and markdown files, you can put the definitions, or a copy of the definitions repo, in the app and let its agent write queries on the fly. If that worries you, write the important numbers as Python functions (Option 1) and have every interface use those.
Option 3: push the results into the warehouse
The third model is a data pipeline. Instead of calculating ARR when someone asks for it, you calculate it on a schedule and write it to the warehouse as a "gold" table. ARR is then just a table that any tool that can read the warehouse can use.
-- Runs every night.create or replace table gold_arr_by_fiscal_year_territory asselect fiscal_year, territory, arrfrom ...; -- the same logic as metrics.arr()
The downside is that a gold table is inflexible, since it can only answer the questions it was built for. The table above gives ARR in Europe for a fiscal year, but it can't give ARR by month, for one country, for annual plans only, or without the largest customer, because those columns aren't in it. To answer those, the data team has to build more tables and compute each possible answer before anyone asks.
Rates are harder still, because they don't average. If a gold table stores the TEAE rate for each age group, the mean of those rates isn't the rate for all patients. Keep the counts (patients with a TEAE, and all patients) in the table, so people can recalculate the rate for any group.
Gold tables are the right choice for numbers that many tools read at one fixed grain, such as a daily company KPI table. They're the wrong place for numbers people want to slice.
Option 4: import definitions from the tools you already use
The fourth option is to use definitions that already live in another system. If your company already has a semantic layer, or you're deciding whether to buy one, it helps to see how the definitions get written in the first place, and how many pieces are involved before a number reaches a Dash app.
How the definitions are written
In a semantic layer, someone on the data team (usually an analytics engineer or a BI developer) writes a model in the vendor's own format, and the business owner of each metric approves what it means. The model describes which tables exist, how they join, and how each metric is calculated. When someone later asks for "ARR by fiscal year in Europe", the semantic layer fills in its query from this model.
In dbt, for example, the model is YAML in the data team's dbt project. This example uses the semantic_models format that most projects have today, which dbt 1.12 still reads alongside a newer format:
semantic_models:- name: mrr_snapshotsmodel: ref('fct_mrr_monthly') # the tabledefaults:agg_time_dimension: snapshot_dateentities:- name: customer # the join key: this table links to customerstype: foreignexpr: customer_iddimensions:- name: snapshot_date # something you can slice bytype: timetype_params: {time_granularity: day}measures:- name: arr_usd # how the number adds upagg: sumexpr: mrr_usd * 12non_additive_dimension: # never sum across dates; take the latest onename: snapshot_datewindow_choice: max- name: customersmodel: ref('dim_customers')entities:- name: customer # the same key name, so dbt knows the tables jointype: primaryexpr: customer_iddimensions:- name: territorytype: categoricalmetrics:- name: arrtype: simpletype_params: {measure: arr_usd}
The fiscal calendar lives in a separate calendar table in the same project, and the pilot rule is a filter on the metric. Because this is plain text in a git repo, people edit it in any editor, review changes in pull requests, and can have any coding agent write it.
Not every product works this way. The systems differ in where the definitions are stored, whether they're written as text or built by pointing and clicking, and which AI tools can help edit them:
System
Where the definitions are stored
How people edit them
AI help for editing
How portable the definitions are
What can compile and run them
dbt Semantic Layer
YAML files in the data team's dbt project, in git
Any editor, or the dbt Cloud IDE
dbt Copilot in dbt Cloud, or any coding agent, since it's plain text
High: plain text in your own repo
Open-source MetricFlow, inside any Python process (including a Dash app) and against Snowflake, BigQuery, Databricks, Redshift, Postgres, DuckDB and a few others, or dbt Cloud's hosted API
Looker
LookML files in a git repo connected to Looker
The Looker IDE in development mode, or any editor
Gemini in Looker, or any coding agent
Medium: plain text in git, but in a language only Looker uses
Only Looker. Other tools send queries to Looker's API
Cube
YAML or JavaScript files in a git repo
Any editor, or the Cube Cloud IDE
Any coding agent
High: plain text in your own repo
Cube's open-source server, run yourself, or Cube Cloud. Other tools call its API
Power BI and Fabric
Inside the Power BI service, or a .pbix file. Saving as a PBIP project adds TMDL text files that can go in git
Mostly point and click in Power BI Desktop, plus DAX formulas. TMDL can also be edited as text
Copilot in Power BI. External agents can use Microsoft's MCP servers or edit TMDL files
Low by default, medium with PBIP in git
Only Microsoft's engine (the Power BI service, Fabric, Analysis Services or Excel). Other tools send DAX to it
Snowflake semantic views
An object inside Snowflake
SQL (CREATE SEMANTIC VIEW), YAML, or the Snowsight interface
Snowflake's Cortex features, or a coding agent writing the SQL
Medium: export with GET_DDL or as Ossie YAML, and keep that copy in git yourself
Only Snowflake. Other tools send SQL to it
Databricks metric views
An object in Unity Catalog
SQL with YAML, or Catalog Explorer
Databricks Assistant, or a coding agent writing the SQL
Medium: export with SHOW CREATE TABLE, and keep that copy in git yourself
Databricks today. The core is being contributed to Apache Spark, so open-source Spark may run it later
Python functions in the Dash repo (Option 1)
.py files in your own git repo
Any editor
Any coding agent
High
Any Python process: a Dash app, a notebook or a scheduled job, against any warehouse
A definitions repo in OKF or Ossie (Option 2)
Markdown or YAML in your own git repo
Any editor
Any coding agent
High: plain text that any tool or person can read
Nothing needs to compile it. Coding agents write the SQL or Python for whatever engine you use, Snowflake can import the Ossie version, and dbt can import Ossie 0.1 files
The last two columns are different questions. A definition can be stored as plain text in git and still only run inside one vendor's product, as LookML does. Where you have a choice, prefer definitions that are plain text in a git repo your company controls and that more than one engine can run. Any coding agent can read and edit them, not only the vendor's built-in assistant. Every change is reviewed in a pull request and kept in the history. And if you change tools, the knowledge comes with you. If your definitions live in a point-and-click tool or only inside a warehouse, you can still get most of these benefits by exporting them to text and keeping that copy in git: save Power BI models as PBIP projects, and keep the DDL or YAML for Snowflake and Databricks in a repo that a CI job deploys from.
A change then goes through that system. When FP&A moves the fiscal year to March, someone tells the data team, an analytics engineer edits the calendar table in the dbt project, a reviewer approves the pull request, and the change is deployed. Only then does the Dash app, which reads from the semantic layer, show the new numbers.
What that means for a Dash team
Compared with Option 1, a semantic layer product adds pieces. The definition lives in a separate project, often owned by a separate team, written in a separate language (dbt YAML, LookML, DAX or warehouse DDL), with its own deployment and often its own bill. The Dash app then needs code and credentials to reach it. Some of these formats suit coding agents well, because dbt YAML, LookML and TMDL files are plain text in git. Others are less agent-friendly: a Power BI model built by clicking through Desktop, or a semantic view that exists only as an object in the warehouse, has to be exported or reached through an API before an agent can read it.
That trade used to be worth it when many tools across the company needed the same numbers, because each tool reads one shared definition. Increasingly, though, those tools are agents, and an agent only needs files it can read, which a definitions repo already gives it. It's also worth looking at how people actually get the numbers. A single Dash app with an MCP server can serve thousands of people across an organization, through its pages and through their own agents, and when a data team delivers an app or an MCP connector that people can read the numbers from or use in their own agents, the numbers reach them faster than through semantic middleware that someone still has to build an interface on. When the numbers are mostly used through one team's apps, defining them in Python in the same project as the app, as in Option 1, gives you the same result with far fewer moving parts, and one pull request changes the definition, the code and the tests together.
Using an existing semantic layer from Dash
When the source of truth is dbt, Snowflake, Databricks, Power BI, Looker or Cube, a Dash app can use it in three ways, which differ in where the definition gets turned into a result.
- Compile it in the app. A library inside the Dash app reads the definition and generates the SQL. dbt's MetricFlow can do this in-process. Ossie has no such library yet, though a coding agent can write a small one for simple metrics.
- Run it in the other system. The app sends a request, such as "ARR by fiscal year where territory is Europe", and the other system calculates the result, so Python only makes the call. This is how you use Snowflake semantic views, Databricks metric views, Power BI measures, Looker, Cube and the dbt Semantic Layer in dbt Cloud. The trade-off is that every request is a round trip to another service, which adds latency to each page load and agent question, and usually costs money, because the warehouse or the vendor bills for the compute or the API calls. Caching results in the Dash app, for example by refreshing them on a schedule, keeps both down.
- Give agents the definition. The app pulls the definition as text, and an agent writes the Python or SQL. A coding agent can do this once when you build the app, and a person reviews and commits the result as in Option 1. An agent can also do it at runtime, when an MCP tool returns the definition and Studio Embedded or the user's chat client writes the query around it.
It's worth putting these behind one small Python interface in your app, with one function that returns rows for a metric and another that returns its definition as text, so the pages and MCP tools don't need to know which system is underneath. Here's how each system works.
dbt (dbt Core with semantic models)
- Compile it in the Dash app: load the dbt project and run MetricFlow inside the app, so a callback or MCP tool gets the number directly. You don't need dbt Cloud for this.
from pathlib import Pathfrom dbt_metricflow.cli.cli_configuration import CLIConfigurationfrom metricflow.engine.metricflow_engine import MetricFlowQueryRequestproject = Path("dbt_project").resolve() # the data team's dbt project, after `dbt parse`config = CLIConfiguration()config.setup(dbt_profiles_path=project, dbt_project_path=project, configure_file_logging=False)request = MetricFlowQueryRequest.create(metric_names=["arr"],group_by_names=["metric_time__fiscal_year"],where_constraints=["{{ Dimension('customer__territory') }} = 'Europe'"],)rows = config.mf.query(request).result_df.rows
MetricFlow doesn't have a query engine of its own. It runs inside the Dash app's Python process, writes the SQL for your warehouse, and sends it through the same dbt adapter that dbt run uses, so the warehouse does the work. With dbt-duckdb, the query runs in DuckDB inside the app, and with Snowflake or Databricks it runs in the warehouse. Compared with hand-written SQL, the extra cost is the planning step and SQL that's longer than a person would write; in our tests on DuckDB, a whole MetricFlow query took 37 to 66 ms. If you'd rather run the SQL yourself, for example on data the app already holds in memory, mf.explain(request) returns the SQL without running it.
The app needs the dbt project, a dbt parse at build time, the dbt adapter package and warehouse credentials. If the app also keeps its own Python function for a metric, add a test that checks the two give the same results.
- Give agents the definitions: dbt parse writes target/semantic_manifest.json, and a short script can turn each metric in it into a markdown file that agents read before they write their own queries. Include the rules agents need most, such as "ARR only adds up across subscriptions, never across dates", and the pilot filter.
dbt Cloud
- Run it in dbt Cloud from Dash: with the same YAML, dbt runs the queries and holds the credentials. Your callback or MCP tool sends the request with the dbt-sl-sdk package:
from dbtsl import SemanticLayerClientclient = SemanticLayerClient(environment_id=123, auth_token="...", host="semantic-layer.cloud.getdbt.com")with client.session():table = client.query(metrics=["arr"],group_by=["metric_time__fiscal_year"],where=["{{ Dimension('customer__territory') }} = 'Europe'"],)
- Give agents the definitions: the SDK can also list the metrics and their dimensions, with descriptions.
Snowflake
- Run it in Snowflake from Dash: your callback or MCP tool sends this query with the Snowflake Python connector (snowflake-connector-python), and Snowflake returns the rows.
SELECT * FROM SEMANTIC_VIEW(finance.semantic.arrDIMENSIONS calendar.fiscal_yearMETRICS subscriptions.arrWHERE customers.territory = 'Europe')
- Give agents the definitions: SELECT SYSTEM$READ_OSSIE_YAML_FROM_SEMANTIC_VIEW('finance.semantic.arr') returns the view as Ossie YAML, and GET_DDL('SEMANTIC_VIEW', ...) returns it as DDL. Column comments are in information_schema.columns.
- Agents: Cortex Analyst can handle long-tail questions behind its own MCP tool. Keep its verified queries in step with the important queries in your Dash app.
Databricks
- Run it in Databricks from Dash: your callback or MCP tool sends this query to a Databricks SQL warehouse with the Databricks SQL connector (databricks-sql-connector).
SELECT fiscal_year, MEASURE(arr) AS arrFROM finance.semantic.arr_metricsWHERE territory = 'Europe'GROUP BY ALL
- Give agents the definitions: SHOW CREATE TABLE finance.semantic.arr_metrics returns the metric view's YAML, and DESCRIBE TABLE returns the column comments.
- Agents: Genie uses "trusted assets", which are parameterized SQL queries and Unity Catalog functions. A Unity Catalog function is a good home for an important query, because Genie and a Dash MCP tool can then both call it.
Power BI and Fabric
- Run it in Power BI from Dash: your callback or MCP tool posts this DAX query to the Power BI executeQueries REST API with an Entra ID token, and gets the rows back as JSON.
EVALUATESUMMARIZECOLUMNS('Date'[Fiscal Year],TREATAS({"Europe"}, Customers[Territory]),"ARR", [ARR])
This is the reliable way to reuse DAX measures. Converters that turn DAX into SQL only manage simple measures, because DAX evaluates each measure in its own filter context.
- Give agents the definitions: if the model is saved as a PBIP project, its TMDL files in git hold every measure's DAX expression and description, and an agent can read them directly. Without PBIP, EVALUATE FILTER(INFO.VIEW.MEASURES(), [Name] = "ARR") returns the same information, but it has to run over the model's XMLA endpoint or from a Fabric notebook, because the executeQueries API doesn't run INFO functions, and it only returns the DAX expression to someone with write access to the model.
Looker and Cube
- Looker, from Dash: your callback or MCP tool calls run_inline_query in the Looker Python SDK with the model, explore, fields and filters.
- Looker, for agents: lookml_model_explore() returns each field's description, and its SQL for users with the see_lookml permission, and the LookML files are in git.
- Cube, from Dash: your callback or MCP tool sends POST /cubejs-api/v1/load with the measures, dimensions and filters.
- Cube, for agents: GET /cubejs-api/v1/meta returns every cube, measure and dimension, with descriptions where they're defined.
Ossie files
- Compile it in the Dash app: there's no Ossie-to-SQL compiler package today. A reference compiler is on Ossie's roadmap as a future effort, but for now a coding agent has to write one, which is quick for simple sums and counts: ours was about 60 lines of Python on top of the sqlglot SQL library. It doesn't work for ARR, because Ossie 0.2 has no way to say "take only the last month-end snapshot", so a compiler that adds up every monthly snapshot counts each subscription once per month and returns a number many times too large.
- Give agents the definitions: this is what Ossie is best at today. Tables, joins, descriptions and ai_context all reach the agent intact.
Exposing all of this to agents from Dash
Whichever system is underneath, a Dash app can give agents the same small set of MCP tools:
Tool
What it does
How it works
list_metrics()
Lists names, descriptions and allowed dimensions
query_metric(metric, by, where)
Returns rows calculated by the backend
Compile in the app, or run in the other system
get_definition(metric)
Returns the definition as text
Give agents the definition
The get_definition tool can be very simple:
from pathlib import Pathfrom dash.mcp import mcp_enabledDEFINITIONS = Path("definitions/knowledge/metrics") # the OKF metric files@mcp_enabled(expose_docstring=True)def get_definition(metric: str) -> str:"""Return the definition of a metric as markdown: the formula, the filters and the notes.Read it before you write SQL for this metric."""known = {p.stem for p in DEFINITIONS.glob("*.md")}if metric not in known:raise ValueError(f"Unknown metric {metric!r}. Known metrics: {sorted(known)}")return (DEFINITIONS / f"{metric}.md").read_text()
It checks the name against the known files first, because agents will try all kinds of values, and the check keeps an agent from reading anything else.
What to do, by situation
Your situation
What we'd do
No semantic layer product, and one team owns the numbers
Option 1: definitions as Python functions in the app repo, with tests, Dash MCP tools and prepared dataframes for Studio Embedded.
No semantic layer product, and the knowledge is spread across the company
Option 2: an <org>/definitions repo in OKF, kept up to date by domain experts with coding agents and read by every builder's agent. Export it to Ossie if a tool needs to import it.
Many tools read a number at one fixed grain
Option 3 for that number: a gold table. Keep everything people slice in Options 1 or 2.
dbt Core with semantic models
Run MetricFlow inside the Dash app, so your callbacks and MCP tools call dbt's metrics directly. For agents that write their own queries, a short script can turn the dbt metrics into markdown files they can read.
dbt Cloud
In Dash callbacks and MCP tools, query dbt Cloud through the dbt-sl-sdk Python package. Give agents the metric descriptions from the same SDK.
Snowflake semantic views
In Dash callbacks and MCP tools, send a SEMANTIC_VIEW() query to Snowflake with the Snowflake Python connector. Give agents the definitions from SYSTEM$READ_OSSIE_YAML_FROM_SEMANTIC_VIEW. Keep your important queries in step with Cortex Analyst's verified queries.
Databricks metric views
In Dash callbacks and MCP tools, send a MEASURE() query to a Databricks SQL warehouse with the Databricks SQL connector. Give agents the definitions from SHOW CREATE TABLE. Put important queries in Unity Catalog functions that Genie also uses.
Power BI is where the numbers live
In Dash callbacks and MCP tools, send DAX to the Power BI executeQueries REST API. Give agents the measure definitions from the model's TMDL files (save it as a PBIP project), or from INFO.VIEW.MEASURES() over the XMLA endpoint. Don't convert DAX by hand.
Looker or Cube
In Dash callbacks and MCP tools, call the Looker SDK or the Cube REST API. Give agents the definitions from LookML or Cube's /meta endpoint.
Several of the above
Give each metric one owning system and call that system for it. Collect the definitions from all of them in one place for agents, and don't copy formulas between vendors.
Dash Enterprise doesn't make you pick one of these for the whole company. One app can call MetricFlow for finance metrics, Databricks for R&D metrics and a Python function for a number only one team uses, and serve all of them to Studio Embedded and to people's own agents over MCP. You can start this week with a few text files and a Python file, and connect a metric to another system with Option 4 when that system already owns it, without rebuilding the app.
Where things are going
Over the past year, the companies that sell semantic layers have been moving their definitions out of proprietary tools and into open, plain-text formats:
- The formats are opening up. dbt Labs released MetricFlow under the Apache 2.0 license in October 2025, and dbt Core 1.12 can now read Ossie 0.1 files directly. Databricks announced in April 2026 that it's contributing the core of its metric views to Apache Spark. Snowflake can create a semantic view from an Ossie file and export one back to Ossie. Ossie itself, which Snowflake started as the Open Semantic Interchange in September 2025, entered the Apache Incubator in the summer of 2026 with more than 50 organizations behind it, and in October Microsoft said it's contributing a converter between Power BI models and Ossie in both directions (a first version is already in the Ossie converters repo), while Google said it would contribute too.
- Context is becoming markdown. Google published the Open Knowledge Format in June 2026 as plain markdown with YAML frontmatter, and added fields for who wrote and verified each file in version 0.2. AGENTS.md, a markdown file of instructions for coding agents, is used by more than 60,000 open-source projects, and OpenAI gave it to the Linux Foundation's new Agentic AI Foundation in December 2025, alongside Anthropic's MCP.
- Tools are moving from configuration to code. Hex announced a rebuilt product, Hex 4.0, in October 2026 in which every project is "backed by code files (rather than a YAML spec)", to make it easier for agents to work with. Power BI models can now be saved as TMDL text files in git instead of a binary .pbix file.
The reason is the same in each case. Agents work best with text they can read, edit and check into git, and companies don't want their business definitions locked inside one vendor's product when they might change tools or add new agents.
These standards are still early. Ossie's current spec is a draft (version 0.2.0.dev0), dbt only reads the earlier 0.1 versions, and the spec has no fields yet for who approved a definition or when it was last checked. OKF is a few months old and has few tools built on it so far. Converting between vendors still loses the parts that make metrics like ARR correct, as we found when we ran our ARR definition through the Ossie converters.
Still, the direction is clear enough to plan around. If the industry is converging on plain-text definitions in git that any agent can read, the simplest place to start is already there: definitions in Python and markdown, in a repo your company owns. You can export them to Ossie, or connect them to a semantic layer, when another tool needs them, and nothing you wrote has to be rewritten. Buying a heavy system now mainly so that future agents can use it means betting on a format that the vendors themselves are moving away from.
Sources
Product details are from vendor documentation as of October 2026: Dash MCP, Plotly Studio Embedded, Open Knowledge Format, Apache Ossie, dbt Semantic Layer, Snowflake semantic views, Snowflake: export a semantic view as Ossie YAML, Databricks Genie trusted assets, Power BI projects, Cube. Industry news: dbt open-sources MetricFlow, Databricks open-sources metric views, Snowflake launches the Open Semantic Interchange, Apache Ossie in the incubator, the rename to Apache Ossie, Microsoft and Google join Apache Ossie, OKF v0.2, the Agentic AI Foundation and AGENTS.md, Hex 4.0, what Ossie standardizes and leaves out.
Summary
Semantic layers are turning into plain-text definitions that agents read as context, and agents can now write the SQL from them, so for most teams a separate semantic layer product is more cost and complexity than they need. When one team builds the apps people use, Python functions and a few markdown files in the same repo give you a single, reviewable definition that pages, MCP tools and Studio Embedded all share. If your company already defines metrics in dbt, Snowflake, Databricks, Power BI, Looker or Cube, a Dash app can import them, and anything you write down in plain text today stays useful as the vendors move the same way.