
Chris Parmer
November 6, 2026
Plotly Studio Embedded now uses your Dash app’s MCP tools
TL;DR
- Plotly Studio Embedded is an AI chat panel you can switch on for any Dash app on Plotly Cloud, with Dash Enterprise coming in Q4.
- Until now, it answered questions from the dataframes your app defined at the top level or returned from a get_data() function.
- As of November 4, 2026, it also calls the tools your Dash app exposes with @mcp_enabled, the same tools Claude, ChatGPT, or Copilot call over MCP.
- That opens up four kinds of internal AI apps: certified metrics defined in Python, workflow apps that take actions, AI on top of the app people already use, and open-ended questions through a general SQL tool. Studio Embedded shows every query it ran, so you can check each answer.
- Tools can also hand the AI your company’s written definitions, such as a Google Open Knowledge Format (OKF) bundle, and call other internal MCP servers, so every number comes back with its formula, its owner, and any known data issue.
- If your app already has MCP tools, there’s nothing to change. Turn on Studio Embedded in the app’s settings, and the chat finds them.
Most companies that try to roll out an internal AI app get stuck on the setup. Each person needs credentials, the right connectors, and a sense of which MCP server or plugin does what, before they can ask their first question. The alternative is to point an agent straight at the data warehouse, which is quicker to set up, but with no semantic context the agent writes its own SQL, and two people asking the same question can get two different numbers.
Plotly Studio Embedded skips that setup. It adds a floating chat panel to a published Dash app, so anyone who can open the app can ask it questions and get charts, tables, and written answers back, with nothing to install. The development team decides what the chat can see in the app’s code. With this release, that code can now include tools: Python functions you write once and mark with @mcp_enabled.
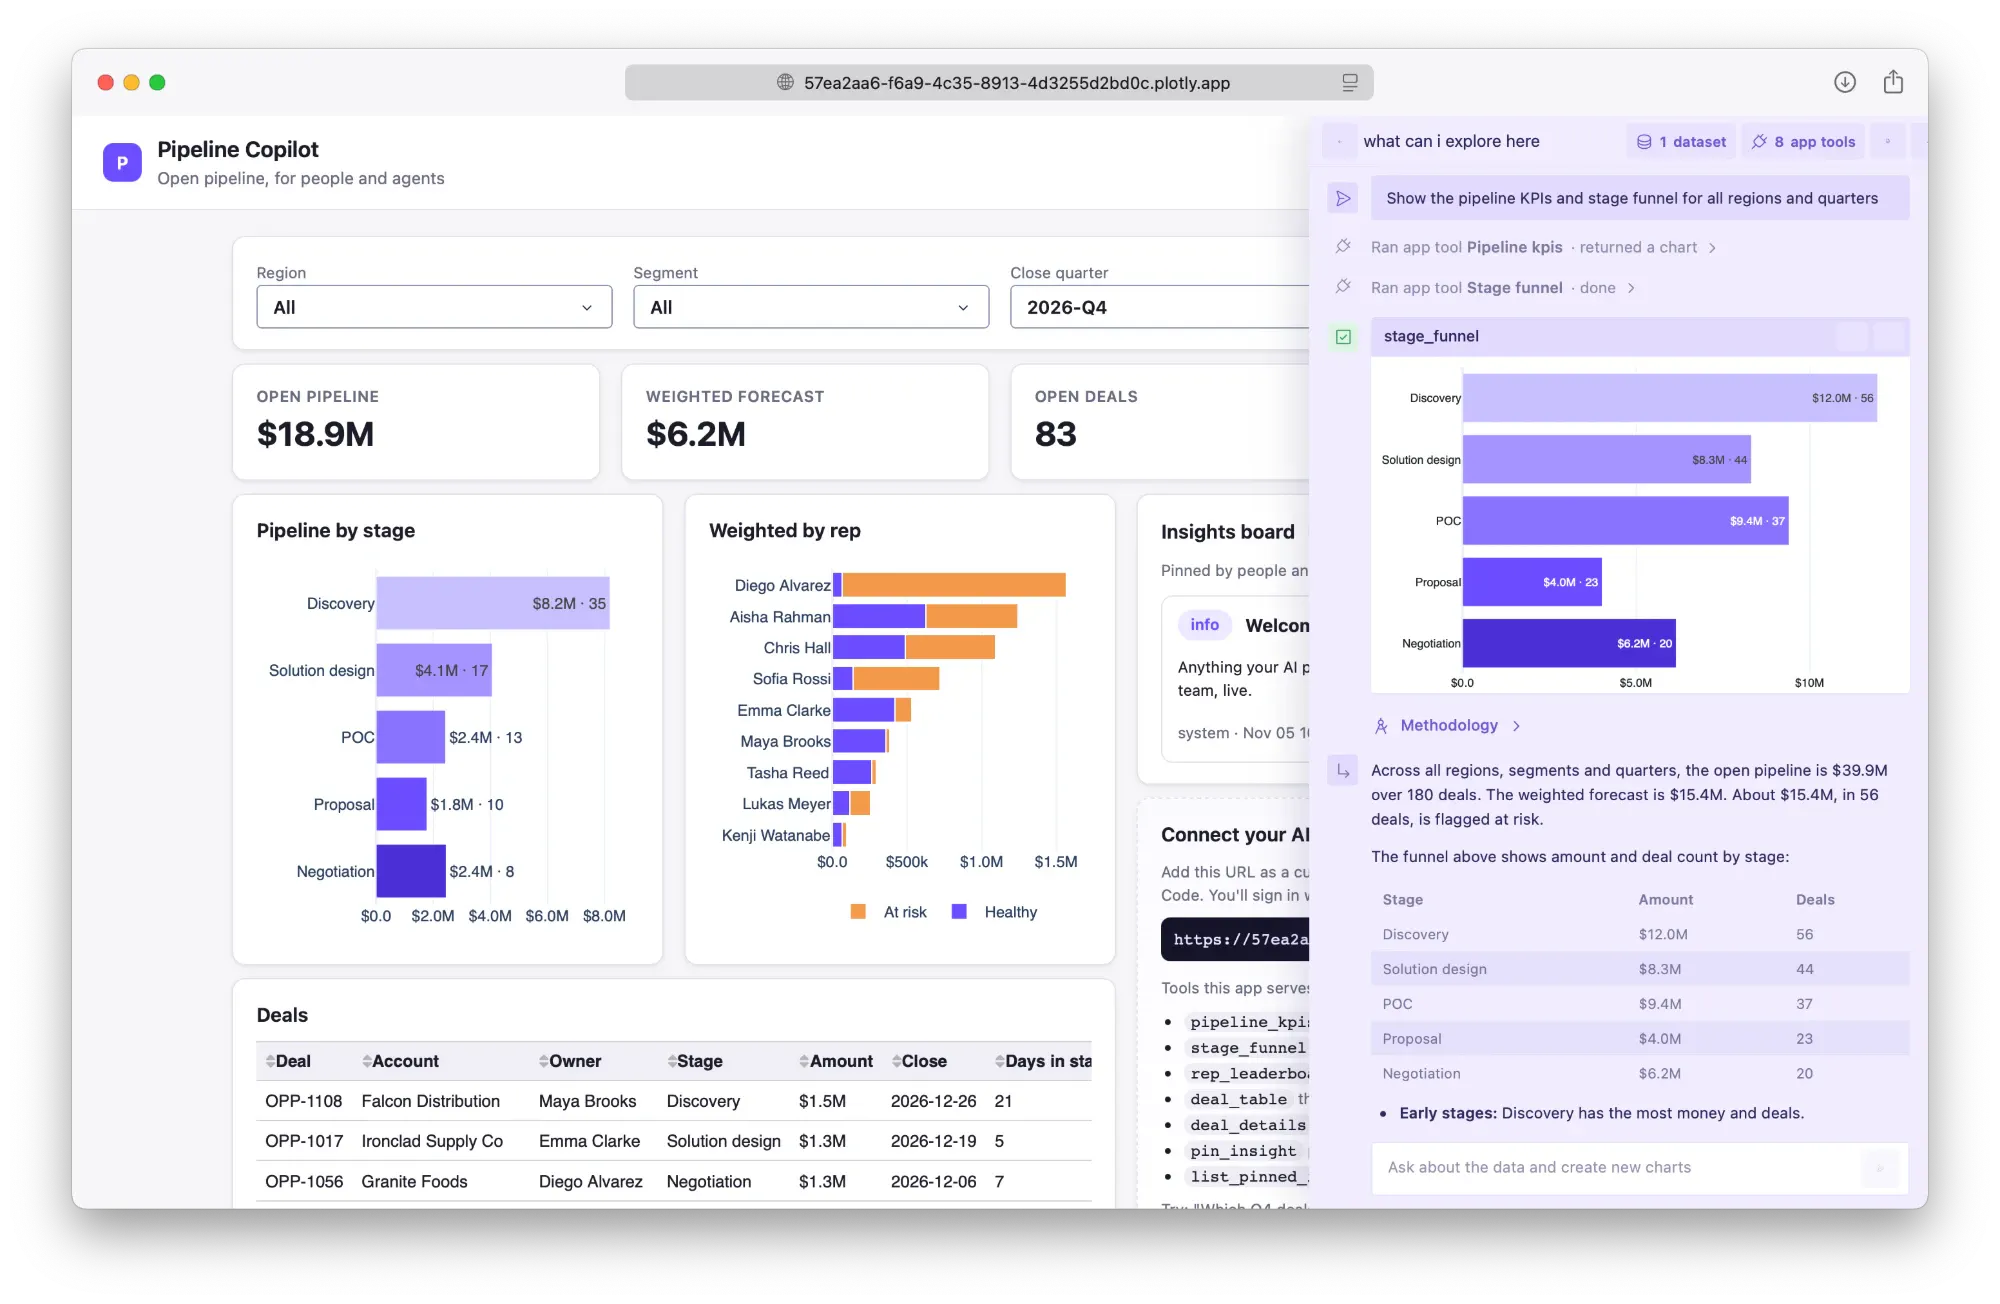
What changed in Plotly Studio Embedded?
When Plotly Studio Embedded launched in August, it registered the data in your app when the app started: any pandas, Polars, PyArrow, or GeoPandas dataframe defined at the module level, plus whatever a get_data() function returned. The chat could then query, join, and chart those datasets.
Now it also reads the app’s MCP tools. Since Dash 4.3, a Dash app can be an MCP server: you create it with enable_mcp=True, and every function you mark with @mcp_enabled becomes a tool, with its type hints as the schema and its docstring as the instructions. Callbacks can be tools too, so the functions that draw your charts are available to the chat. Studio Embedded lists everything it found in its App tools panel and calls those tools when a question needs them.
from dash import Dashfrom dash.mcp import mcp_enabledapp = Dash(__name__, enable_mcp=True)@mcp_enabled(expose_docstring=True)def get_budget(department: Department) -> dict:"""This quarter's budget for a department: total, spent, pending, and remaining."""return spend.budget(department)
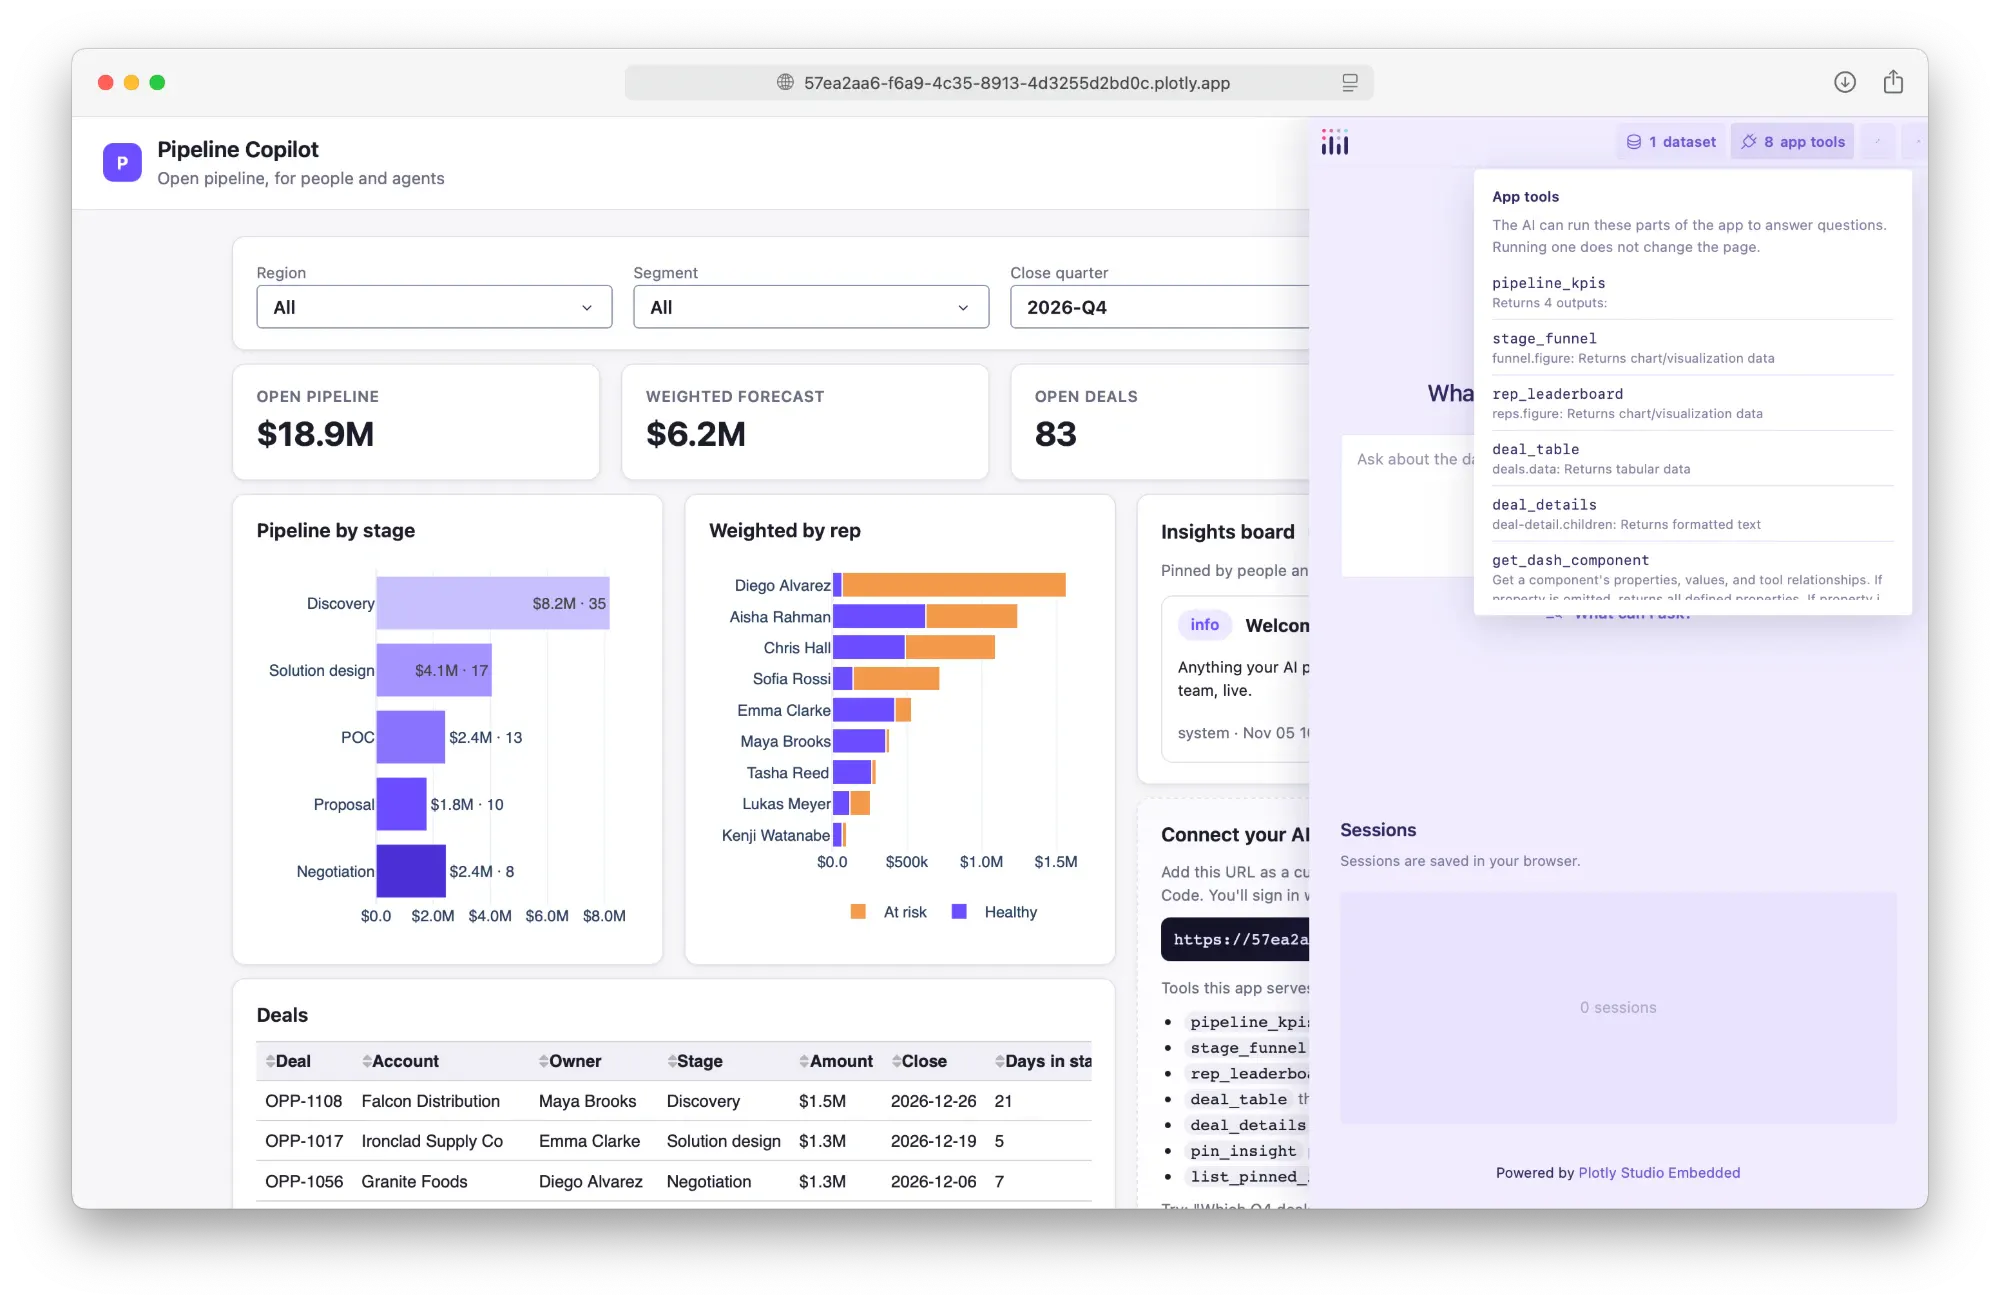
The same tools work over MCP in Claude, ChatGPT, or Copilot, so you write them once and people can reach them from the chat they already use or from inside the app.
What can you build with custom tools?
We see four strong use cases for delivering internal AI apps this way. Our five MCP server examples post has a working app, a prompt, and the code for each.
Semantic data: metrics defined in Python
Connecting an agent directly to a data warehouse means trusting it to write the right SQL every time, and it doesn’t always. A safer route is to define your metrics in Python, in reviewed code with one definition each, and expose them as tools. The agent can then only ask for metrics and slices you’ve defined, because Literal type hints become fixed lists of choices in the tool schema.
MetricName = Literal["arr", "new_arr", "churned_arr", "nrr", "logo_churn_rate"]Dimension = Literal["region", "segment", "industry"]@mcp_enabled(expose_docstring=True)def query_metric(metric: MetricName, start: str, end: str,group_by: Dimension | None = None) -> dict:"""Compute one certified metric. Always state its definition and owner."""return metrics.compute(metric, start, end, group_by)
The numbers in the chat then match the numbers in the app, because both come from the same function.
Workflow apps that take actions
Tools can do more than read. They can submit a ticket, log a call, file a purchase request, or flip a switch in an internal system. In the Spend Approvals app below, Studio Embedded checked the vendor list and the Marketing budget, asked the person to confirm, and filed the request with the app’s submit_purchase_request tool. The request showed up in the approval inbox as filed by an AI agent.
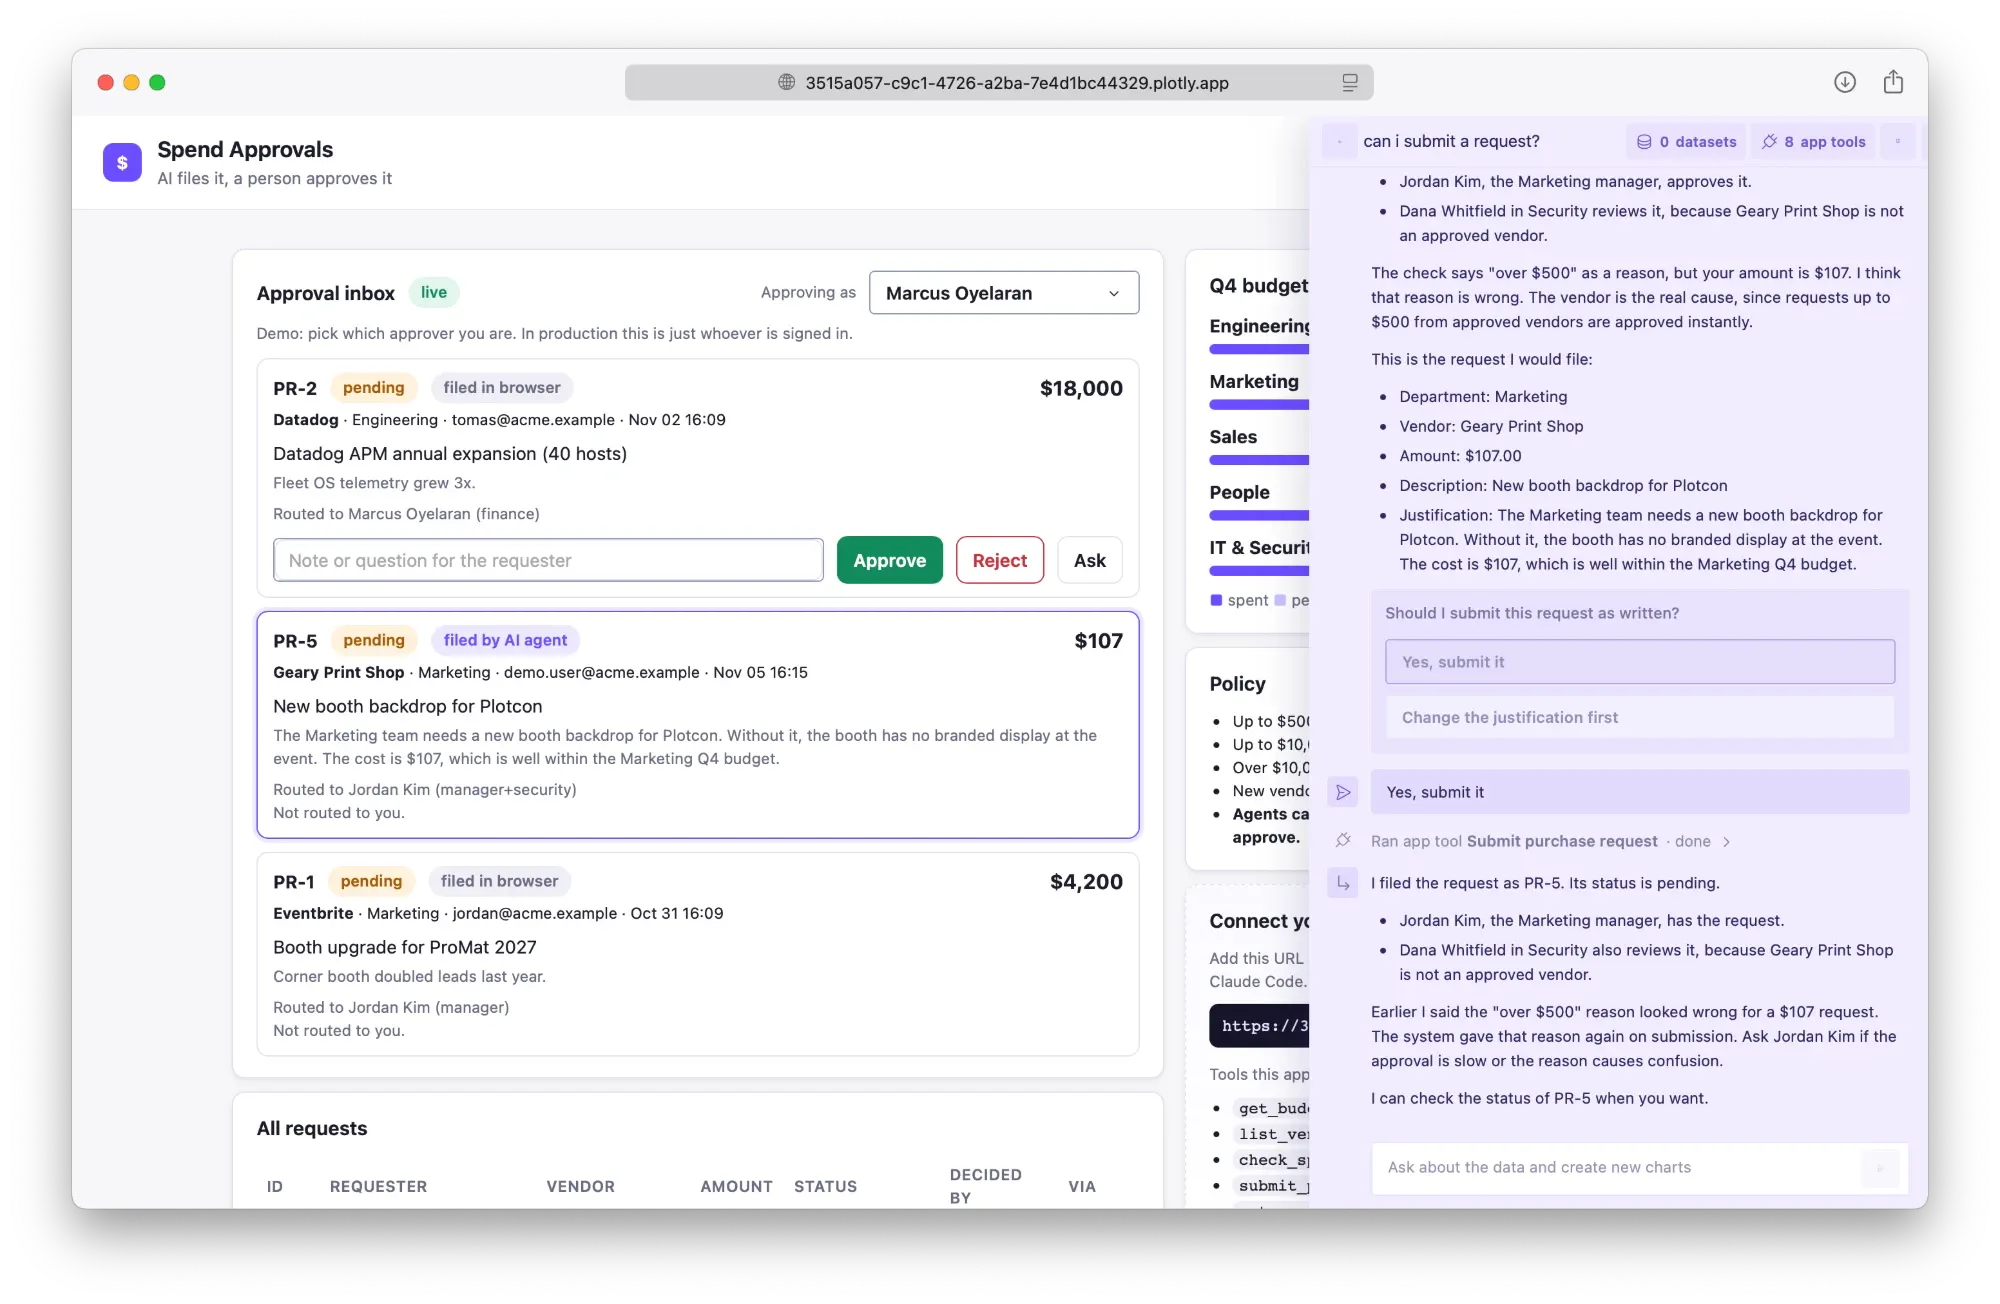
You decide what the chat can and can’t do by which tools you write. The Spend Approvals app has no approve tool at all, so approving stays a button that only a person can press.
AI on top of the app people already use
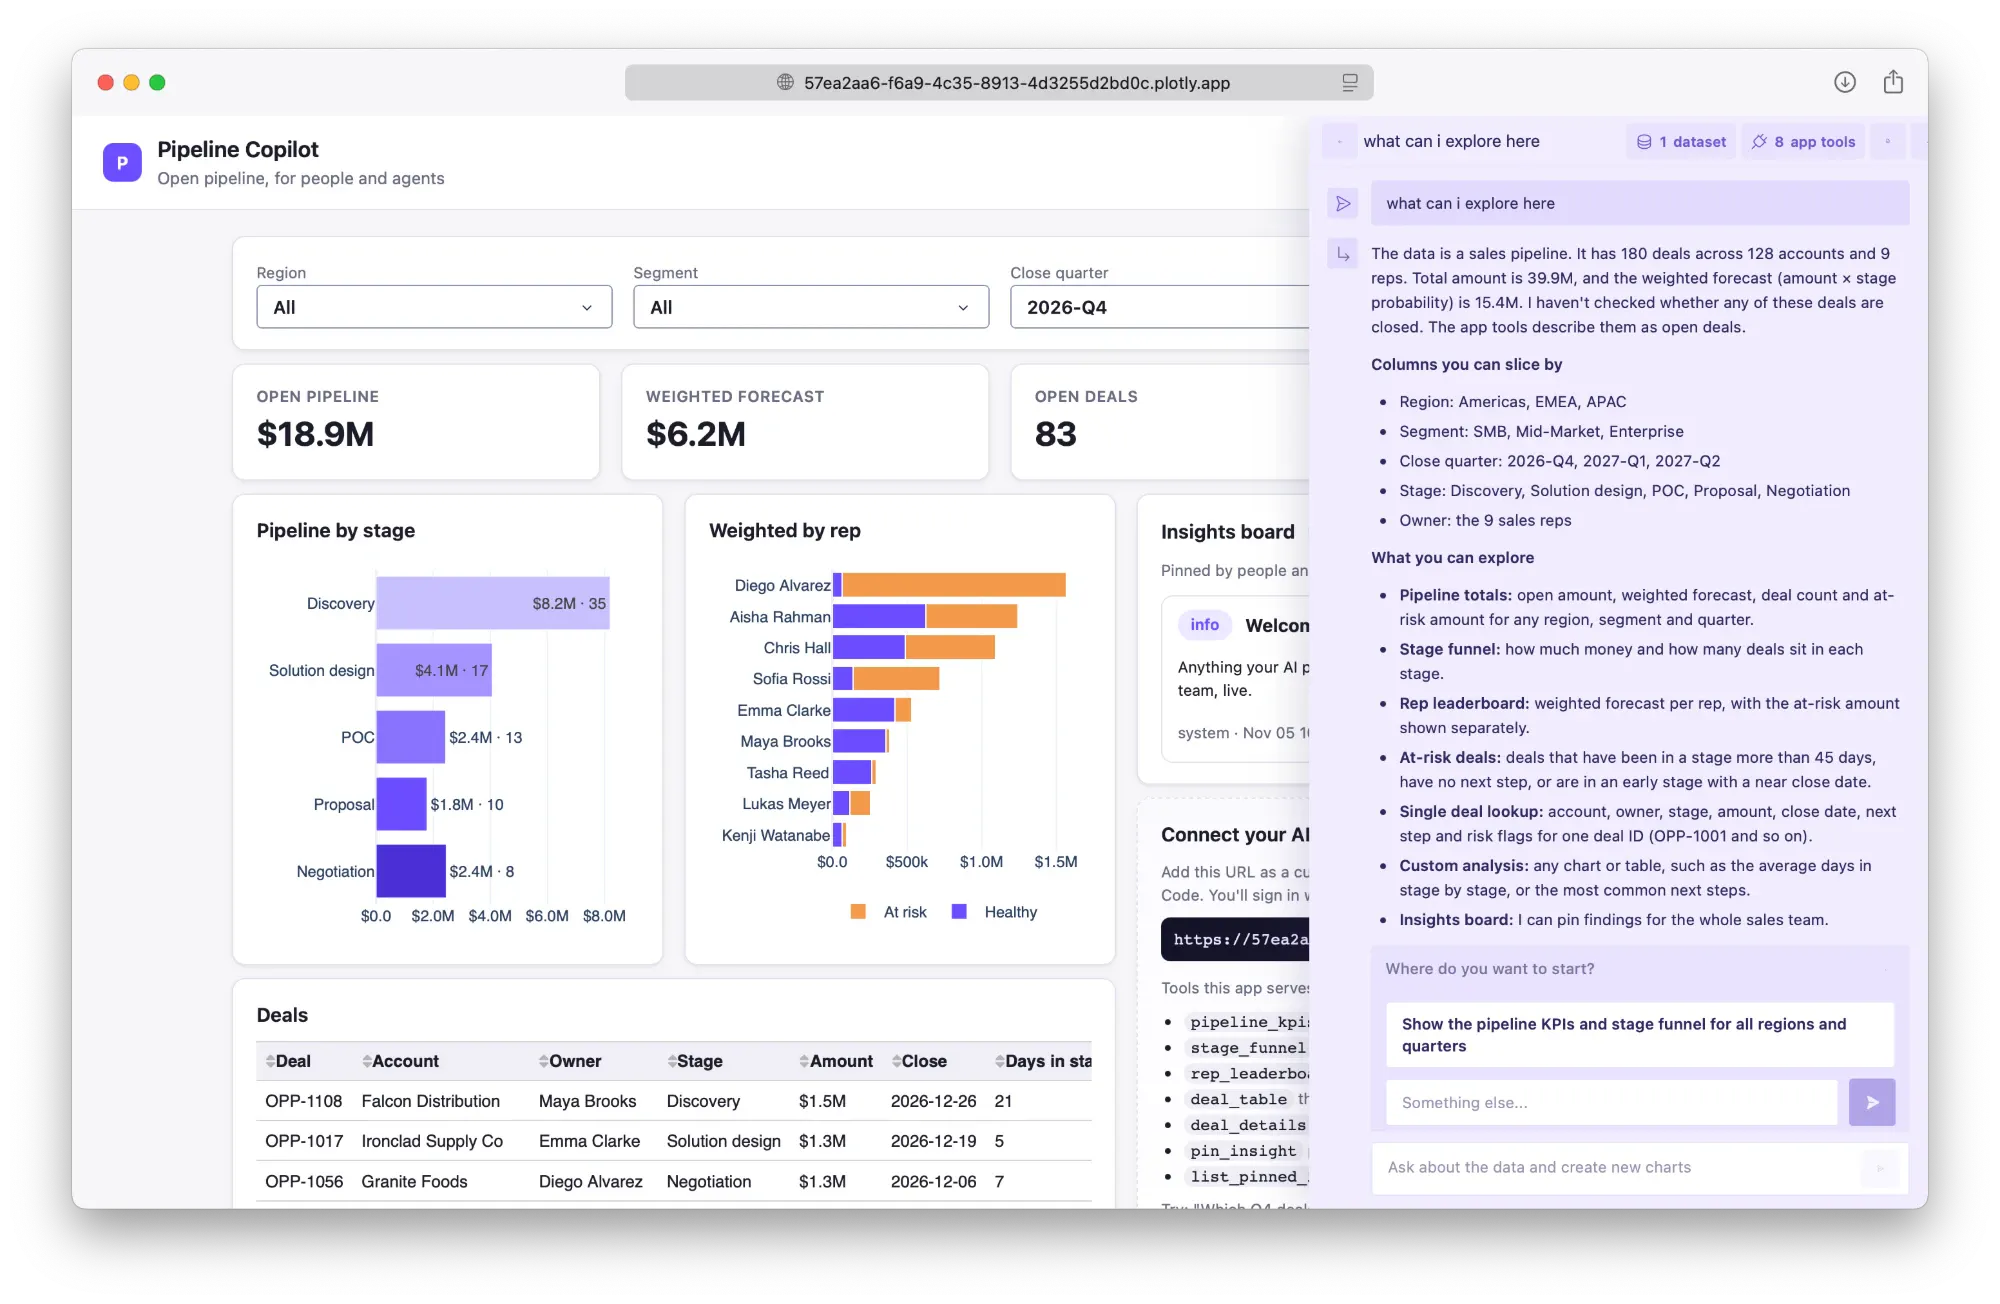
The third use case is the one we’re most excited about. A Dash app already answers the questions your team asks every week, and those answers cost nothing to look at again. Studio Embedded sits on top of it for everything else: the follow-up question, the comparison nobody built a chart for, the drill-down into one deal.
Because the app’s callbacks are tools, the chat uses the same logic as the charts on the page. In Pipeline Copilot, asking for the pipeline funnel ran the app’s own pipeline_kpis and stage_funnel callbacks, rather than having the AI reinvent the pipeline math from raw data. People stop spending tokens on the same question every week, and they can still ask their own.
Open-ended questions with a general SQL tool
Predefined metrics only answer the questions you planned for. For everything else, you can add a general query_data(sql) tool on top of the app’s structured tools, so the AI can write its own SQL against the same data when no metric fits. Give it a read-only connection, a short list of views, a row cap, and a companion tool that describes the columns:
import duckdbfrom dash.mcp import mcp_enabledcon = duckdb.connect("warehouse.duckdb", read_only=True)VIEWS = ["arr_monthly", "customers", "subscriptions"]@mcp_enabled(expose_docstring=True)def describe_tables() -> dict:"""Columns and types of the views query_data can read. Call this before writing SQL."""return {v: con.execute(f"describe {v}").df()[["column_name", "column_type"]].to_dict("records")for v in VIEWS}@mcp_enabled(expose_docstring=True)def query_data(sql: str) -> list[dict]:"""Run a read-only SQL query against arr_monthly, customers, and subscriptions.Prefer query_metric when a certified metric answers the question.Results are capped at 1,000 rows."""return con.execute(f"select * from ({sql}) limit 1000").df().to_dict("records")
The read-only connection stops the AI from changing data, but it can still read any table the connection can see, so point it at a database or a role that only has the views you list. The docstring tells the AI to prefer query_metric, which keeps the certified numbers in charge of the questions they cover.
Whichever tool answers a question, you can check its work. Studio Embedded shows every tool it ran in the conversation, and each result has a Methodology link with the query and code behind it, so a SQL answer is never a black box. You can read the query, run it yourself, and correct it if it’s wrong.
Handling the semantic layer
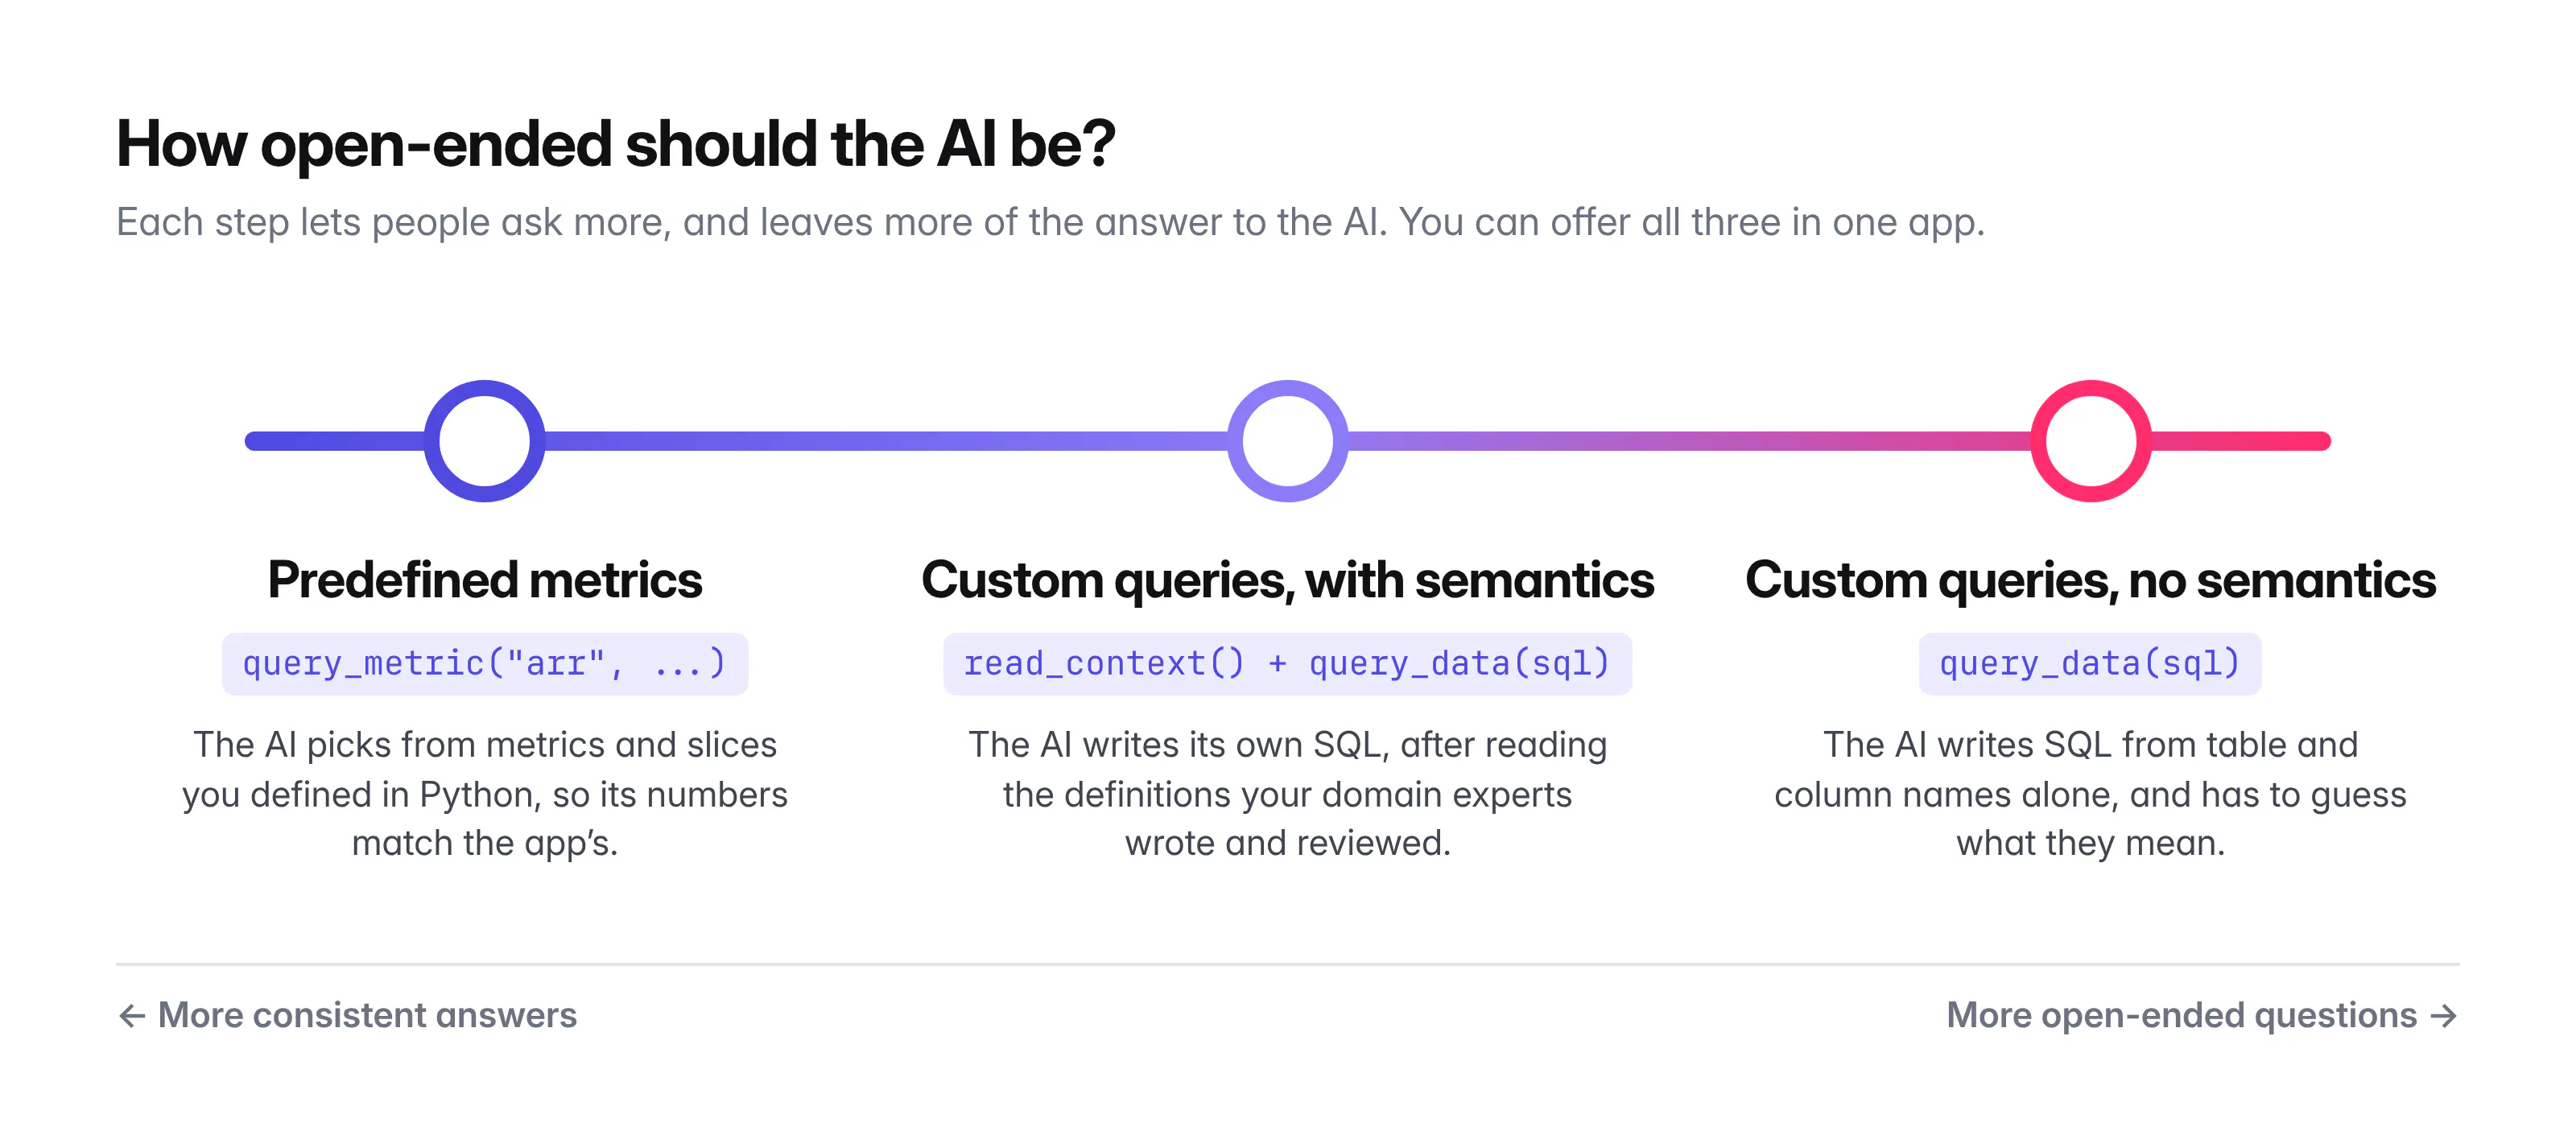
The tools above sit at different points on a scale of how open-ended the AI is. Predefined metrics give the most consistent answers, because the AI can only pick from what you defined. A general SQL tool answers the most questions, because the AI writes the query, and with nothing else to go on it has to guess what the columns mean. The middle option keeps most of that flexibility and removes most of the guessing: the AI still writes its own SQL, but only after reading definitions that the people who own the numbers wrote down. You can offer all three in one app.
Writing definitions down makes answers more consistent, but it isn’t a prerequisite. Data work is full of ambiguity, and we designed Plotly Studio to look out for it. When a question could mean more than one thing, or a column could be read two ways, the agent says which reading it chose, states its assumptions, and asks a follow-up question, so even when something isn’t perfectly defined, it tells you. We test this behavior in DataAnalyticsBench, our 43-question exam against a 20-million-row warehouse, which includes ambiguous questions, messy data, and questions the data can’t answer.
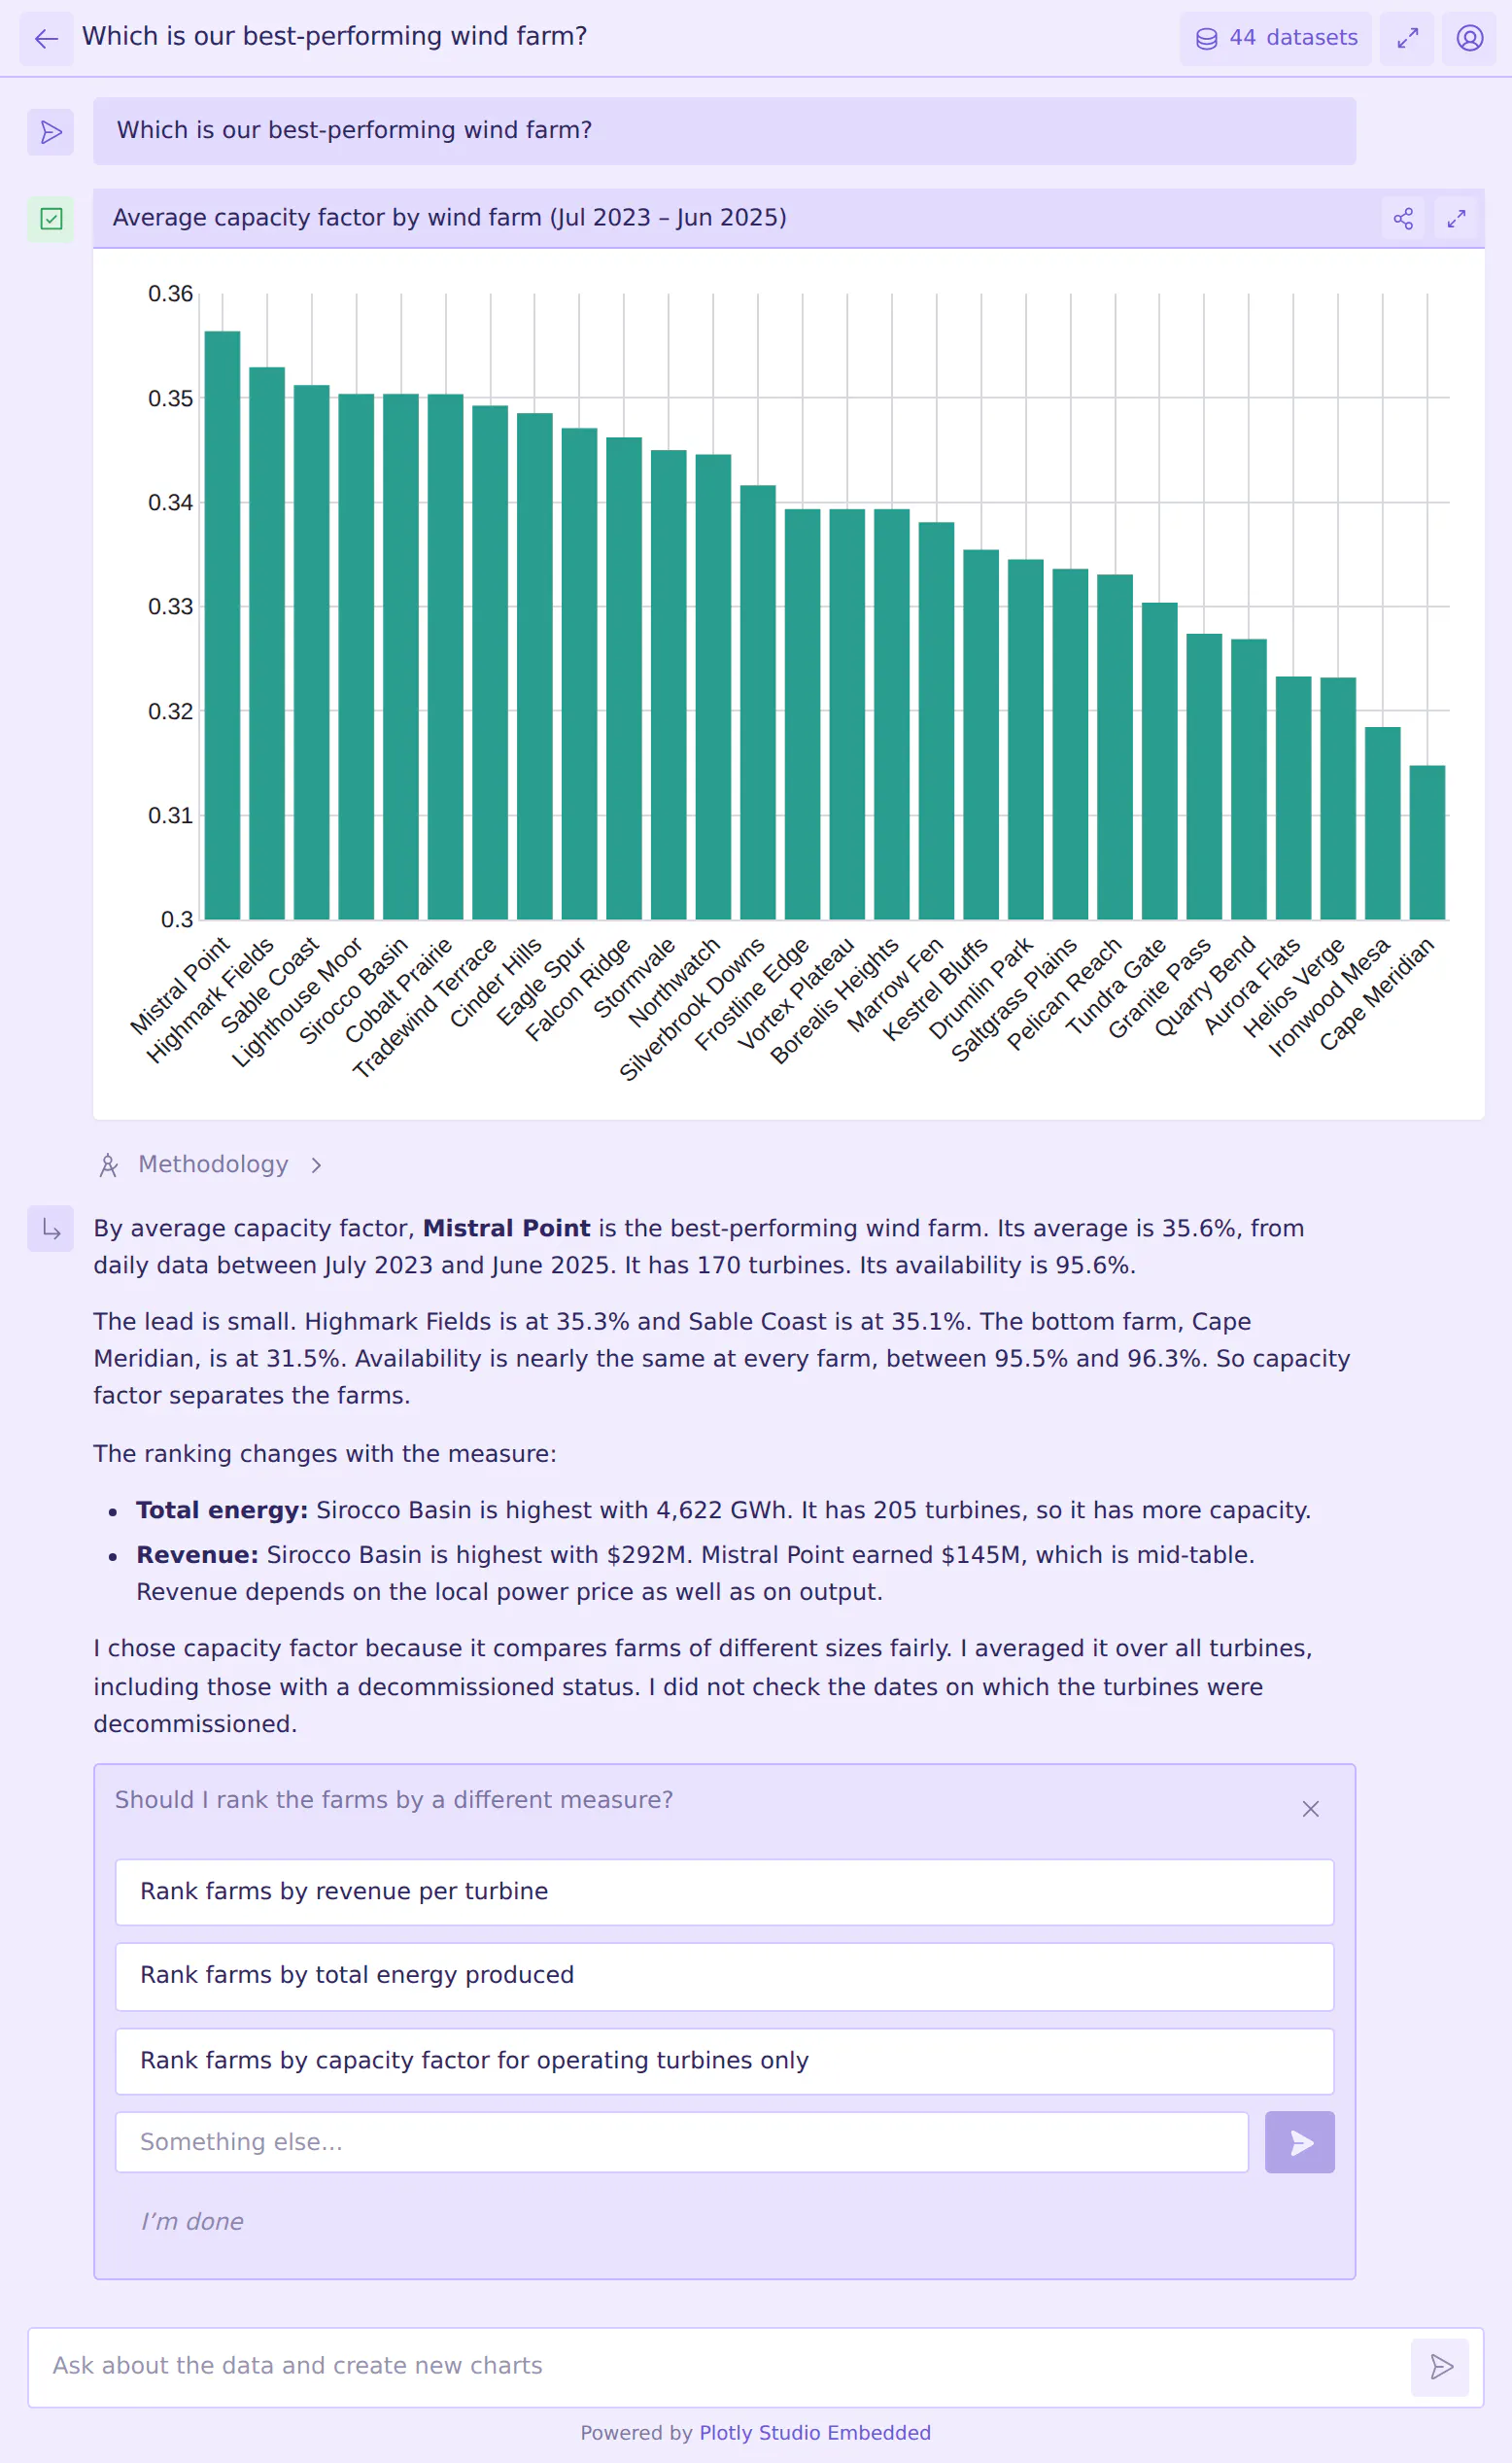
The semantic data example above puts the rules in docstrings, which works well for a developer. A CFO worried about the board seeing a wrong number will want more than that. Docstrings are short, they live in code that FP&A doesn’t review, and they rarely say why a metric is calculated the way it is. The rules that matter (the fiscal year starts in March, paid pilots aren’t ARR, 11 adverse events have no onset date) belong somewhere the people who own them can write, review, and sign off on them.
Our semantic layer guide recommends keeping those definitions as plain markdown in a repo your company owns, in Google’s Open Knowledge Format (OKF): one file per metric, table, glossary term, or known data issue, each with an owner in its frontmatter. Domain experts update the files with a coding agent, and every change goes through review like code.
Two tools are enough to give the chat inside your app access to that bundle. The first lists what’s been written down, and the second reads a file in full:
from pathlib import Pathfrom typing import Literalimport yamlfrom dash.mcp import mcp_enabledKNOWLEDGE = Path("definitions/knowledge").resolve() # the OKF bundle from <org>/definitionsdef _read(path: Path) -> dict:_, front, body = path.read_text().split("---", 2)return {**yaml.safe_load(front), "path": str(path.relative_to(KNOWLEDGE)), "body": body.strip()}@mcp_enabled(expose_docstring=True)def list_context(kind: Literal["Metric", "Table", "Glossary Term", "Known Issue"] | None = None) -> list[dict]:"""List the company's written definitions: metrics, tables, glossary terms, and knowndata issues. Call this before answering any question about a number, then read thedefinitions that apply with read_context."""docs = [_read(p) for p in KNOWLEDGE.rglob("*.md") if p.name not in ("index.md", "log.md")]return [{k: d.get(k) for k in ("path", "type", "title", "description", "owner")}for d in docs if kind is None or d.get("type") == kind]@mcp_enabled(expose_docstring=True)def read_context(path: str) -> dict:"""Read one definition in full, such as "metrics/arr.md". Follow its rules exactly,name its owner when you report a number, and mention any known issue it links to."""target = (KNOWLEDGE / path).resolve()if not target.is_relative_to(KNOWLEDGE) or target.suffix != ".md":raise ValueError("Use a path from list_context.")return _read(target)
The metric tools can do the same without being asked. If query_metric returns the metric’s file next to the numbers, every answer in the chat carries the formula and the owner:
return {"rows": rows, "definition": read_context(f"metrics/{metric}.md")}
For a CFO, this changes what an AI answer looks like. A number from the chat comes with the written definition FP&A approved, the name of the person who owns it, and the known issues that affect it, so anyone can check it before it goes in a deck. When someone changes a definition, the change shows up in the repo’s history, and the tests from the semantic layer guide fail if a reported number moves without the owner signing off.
To keep the bundle current in a deployed app, clone the definitions repo when the app builds, or have a scheduled job sync it to the app’s persistent filesystem on Dash Enterprise, so a definition change doesn’t need a redeploy. If your definitions live in an internal knowledge base such as Confluence or Notion instead, the same two tools can call its API rather than read files.
A coding agent can add this to an app you already have:
Add two Dash MCP tools to this app, list_context and read_context, that read our Open Knowledge Format (OKF) bundle in definitions/knowledge (markdown files with YAML frontmatter: type, title, description, owner). list_context returns the frontmatter of every file, filtered by type. read_context returns one file in full and refuses any path outside the bundle. Write their docstrings as instructions: read the relevant definitions before reporting any number, follow them exactly, and name the owner. Then make every metric tool return its metric file alongside the numbers.
Calling other MCP servers from your Dash app
Your company may already run MCP servers of its own: one in front of the CRM, the contract system, the ticketing system, or a vendor product. People using the chat inside a Dash app can’t connect those themselves, and you wouldn’t want them to, because a general-purpose server usually offers far more than the app needs.
A Dash app can be the MCP client instead. The app connects to the internal server with its own credentials, and you write a small tool that calls just the one or two things the app needs, with fixed arguments and your own checks. Studio Embedded, and anyone connecting over MCP, sees your tool, not the whole server behind it. This uses the official MCP Python SDK:
import asyncio, osfrom mcp import ClientSessionfrom mcp.client.streamable_http import streamablehttp_clientfrom dash.mcp import mcp_enabledCONTRACTS_MCP = "https://contracts.internal.example.com/mcp" # your internal MCP serverasync def _call(tool: str, args: dict) -> list[str]:headers = {"Authorization": f"Bearer {os.environ['CONTRACTS_MCP_TOKEN']}"}async with streamablehttp_client(CONTRACTS_MCP, headers=headers) as (read, write, _):async with ClientSession(read, write) as session:await session.initialize()result = await session.call_tool(tool, args)return [c.text for c in result.content if c.type == "text"]@mcp_enabled(expose_docstring=True)def renewal_terms(account_id: str) -> list[str]:"""Renewal date, term length, and price uplift from the signed contract for oneaccount. Use it with the ARR tools when someone asks about an upcoming renewal."""return asyncio.run(_call("get_contract_terms", {"account_id": account_id, "fields": ["renewal"]}))
This lets one app combine sources that no single server has. In a revenue app, the ARR comes from your metric functions and the renewal terms come from the contracts server, so a question like “which Europe accounts renew next quarter, and what’s their ARR?” gets answered in one place.
Keep two things in mind. The app calls the other server with its own credentials, so the tool sees whatever that service account can see, and any filtering by viewer has to happen in your tool. And keep the token in the app’s environment variables or secrets, never in the code.
How do I add Plotly Studio Embedded to a Dash app?
- Expose tools in your app. Create the app with Dash(__name__, enable_mcp=True) and mark the functions you want the chat to call with @mcp_enabled(expose_docstring=True). Write each docstring as instructions to the AI, and use type hints for every argument.
- Publish the app to Plotly Cloud. Studio Embedded runs on apps published there, and comes to Dash Enterprise in Q4.
- Turn it on. Open the app’s Plotly Studio Embedded tab and select Enable Plotly Studio Embedded for this app. The app rebuilds, and the chat appears for everyone who can view the app.
If you work with a coding agent, a prompt like this one adds tools to an app you already have:
Add Dash MCP tools to this Dash app (dash>=4.4.1). Create the app with enable_mcp=True. For each metric or action people ask about, write a function marked @mcp_enabled(expose_docstring=True) with Literal type hints for every fixed choice and a docstring that tells the AI when to use it. Reuse the functions the callbacks already call, so the chat and the charts give the same numbers. Don’t add tools for anything only a person should do. Read the Dash MCP docs before writing the code.
Summary
Plotly Studio Embedded started as a way to let people ask questions of the data behind a Dash app. Now that it calls the app’s MCP tools, the app’s own Python decides what the AI can do: which metrics it can report, which actions it can take, and which charts it can draw. Write the tools once, and people can use them from the chat inside the app or from Claude, ChatGPT, or Copilot over MCP.