Debugging Code in Dash Enterprise
Meet the Speaker

Austin Kiesewetter
Austin Kiesewetter is a Plotly community member and software engineer at Martin Engineering.
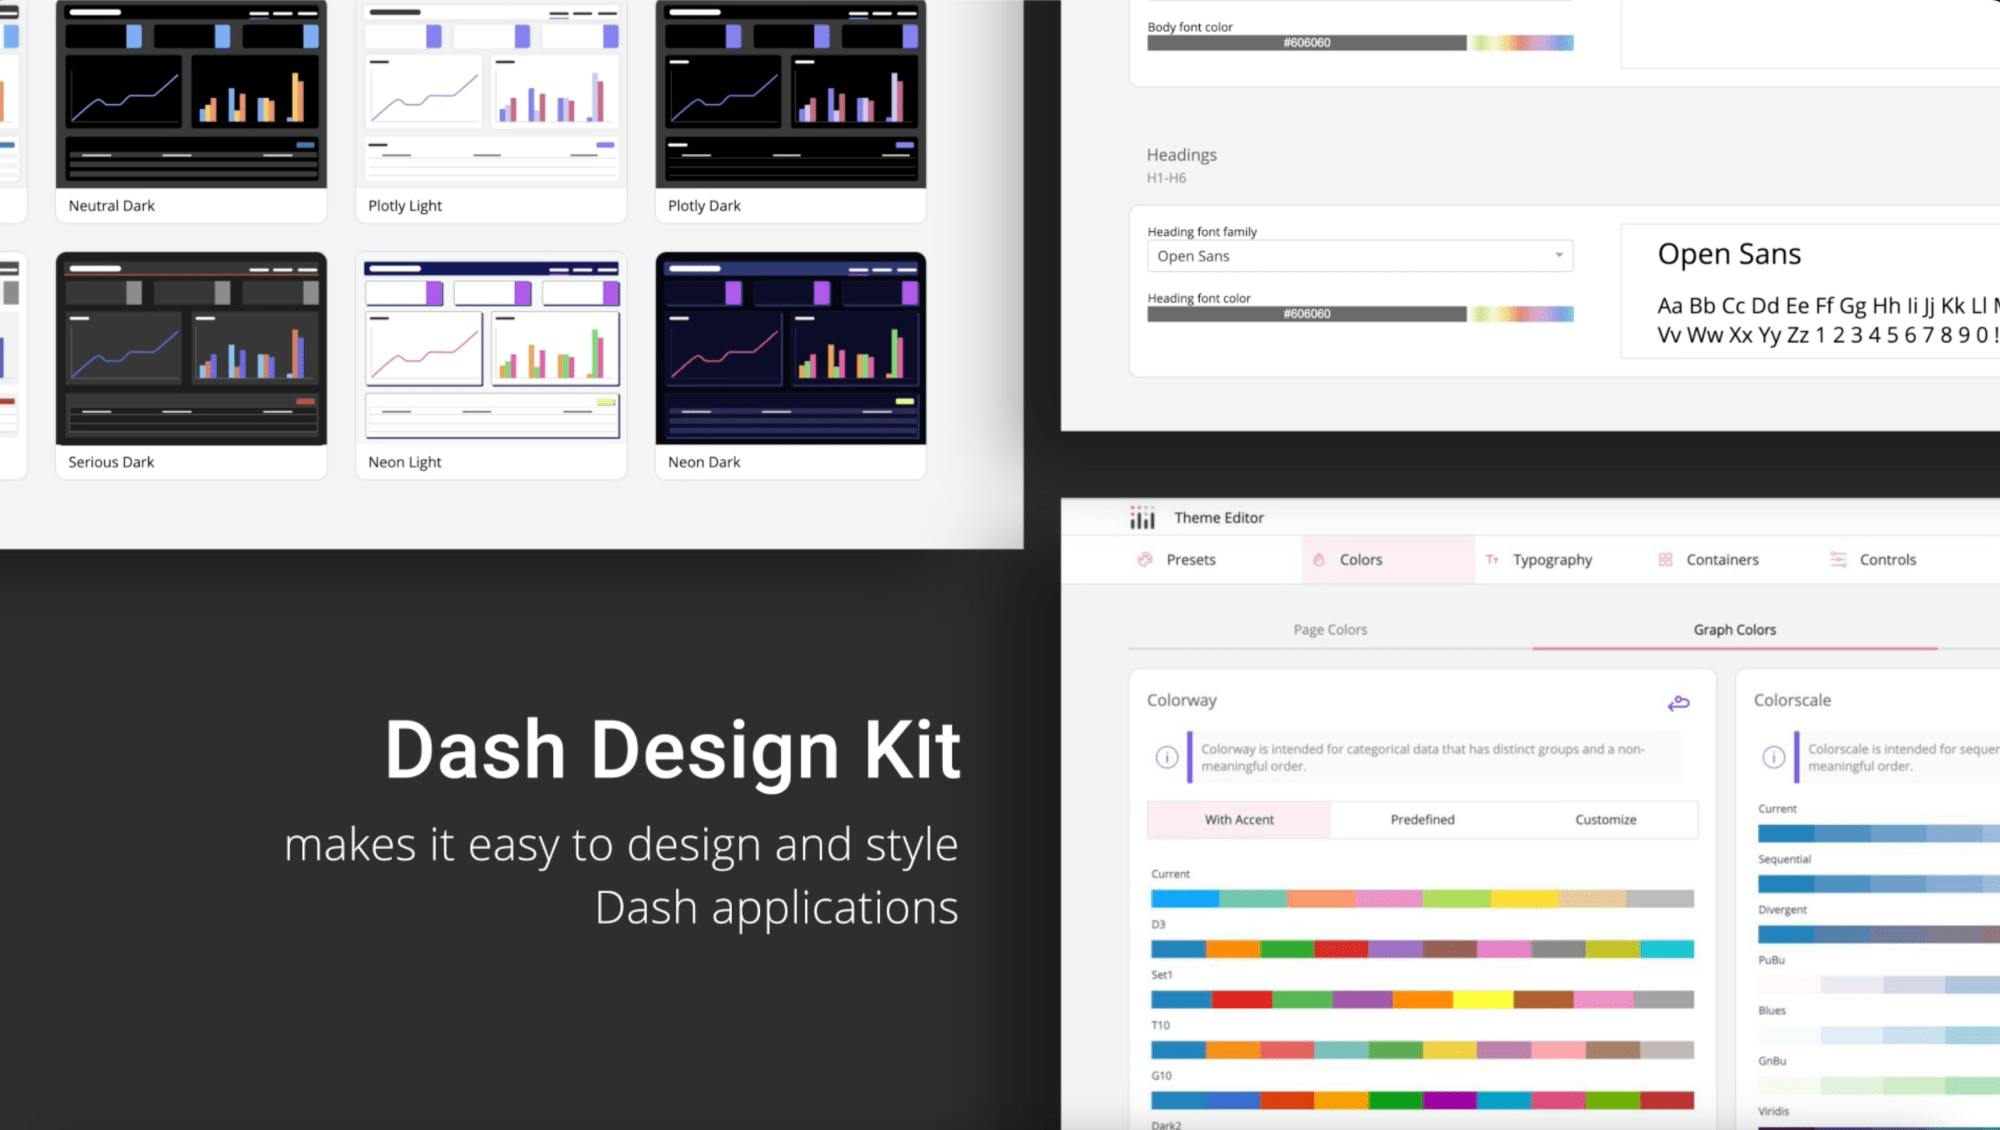
This video introduces updates in Dash 3.0 and walks through how to debug and deploy Dash apps effectively. Key changes in the release include faster callbacks that now execute within their own components, plus a refreshed debug toolbar that flags outdated versions and helps surface issues earlier.
It then covers how to use Python’s logging module to track errors more reliably than with print statements. Logging can be scoped to different parts of your app, giving better visibility into callback problems and general application state.
- Use import logging to set up structured logs
- Separate logs by severity: info, debug, warning, error
- Helps pinpoint bugs during both development and deployment
- Enables persistent logs in production apps
A live demo shows a common checklist input error and how Dash reports the issue. Wrapping a string in a list resolves it, showing how Dash surfaces and guides fixes for type mismatches.
The video ends with a look at deployment logs. It explains how to interpret build vs deploy errors and shows how a missing app.server definition can break deployment even when the build passes.
- Build logs check requirements and file structure
- Deploy logs reveal app-specific problems
- Errors can be downloaded and searched
- Logs remain visible after deployment for continued debugging
Watch the video to see each step in action.