
Chris Parmer, Co-founder & Author of Dash
October 20, 2026
Delivering Data Analytics and Internal Apps with Dash Enterprise: 2026 Complete Guide
This guide covers how we recommend delivering internal apps and analytics with Dash Enterprise in 2026. It's the full picture we'd walk through with a new customer: how to organize the people who build apps, how to use AI coding agents, how IT sets up the platform, and then the practical details of building apps that teams rely on, from connecting to data through to logging.
The short version is that coding agents have made code the fastest way to build these apps. Tool builders in teams across the organization can now build apps and dashboards for their colleagues on the side of their day jobs, using AI coding agents and the Dash framework, while IT manages the Dash Enterprise platform that every one of those apps runs on. Almost everything in this guide is done by prompting a coding agent, so most sections include a sample prompt along with the code or page it produces.
The examples come from a working demo: two Dash apps for Summit Outfitters, a fictional outdoor-gear wholesaler, built entirely with a coding agent. You can open the Sales Overview and the Returns Desk and click around as you read. For more examples of internal apps, see How to Build Internal Apps in 2026, or for why we think coding agents and Dash are the future of BI, see Dash vs. Power BI.
The operating model
Why code, and why now
For most of the last decade, teams that needed internal analytics had three options: a BI tool, a low-code app builder, or a request in IT's backlog. Writing an app in code was always the most capable option, but it was slow and needed developers, so most teams didn't do it.
AI coding agents have changed that. Tools like GitHub Copilot, Claude Code, Codex and Plotly Studio can write a working Dash app from a plain description, run it, look at the result and fix what's wrong. For a lot of internal apps, describing what you want to a coding agent is now faster than configuring a point-and-click tool, and you keep everything code can do. Agents also work much better with code than with a drag-and-drop interface. Given a codebase, an agent can query the data, explore it and troubleshoot its own errors, and it can keep going for hours without supervision.
Tool builders in every team
The traditional way to deliver analytics is top-down: a central team gathers requirements, builds a dashboard and hands it over months later. We recommend the opposite. Give motivated people across the organization a coding agent and access to Dash Enterprise, and let them build apps for their teams. These people know their team's problems, data and domain best, and they're well equipped to build software that suits their team and makes it more efficient.
In the model we see working, about one person in ten is a tool builder: an analyst, engineer, scientist, ops lead or manager who builds apps and dashboards for their team on the side of their main job. Tool builders don't need to be software engineers, but they do need to know their data. Because they're spread across the organization, nearly every team ends up with one, and the other nine people in ten use what they build, either in the browser or through their AI assistant.
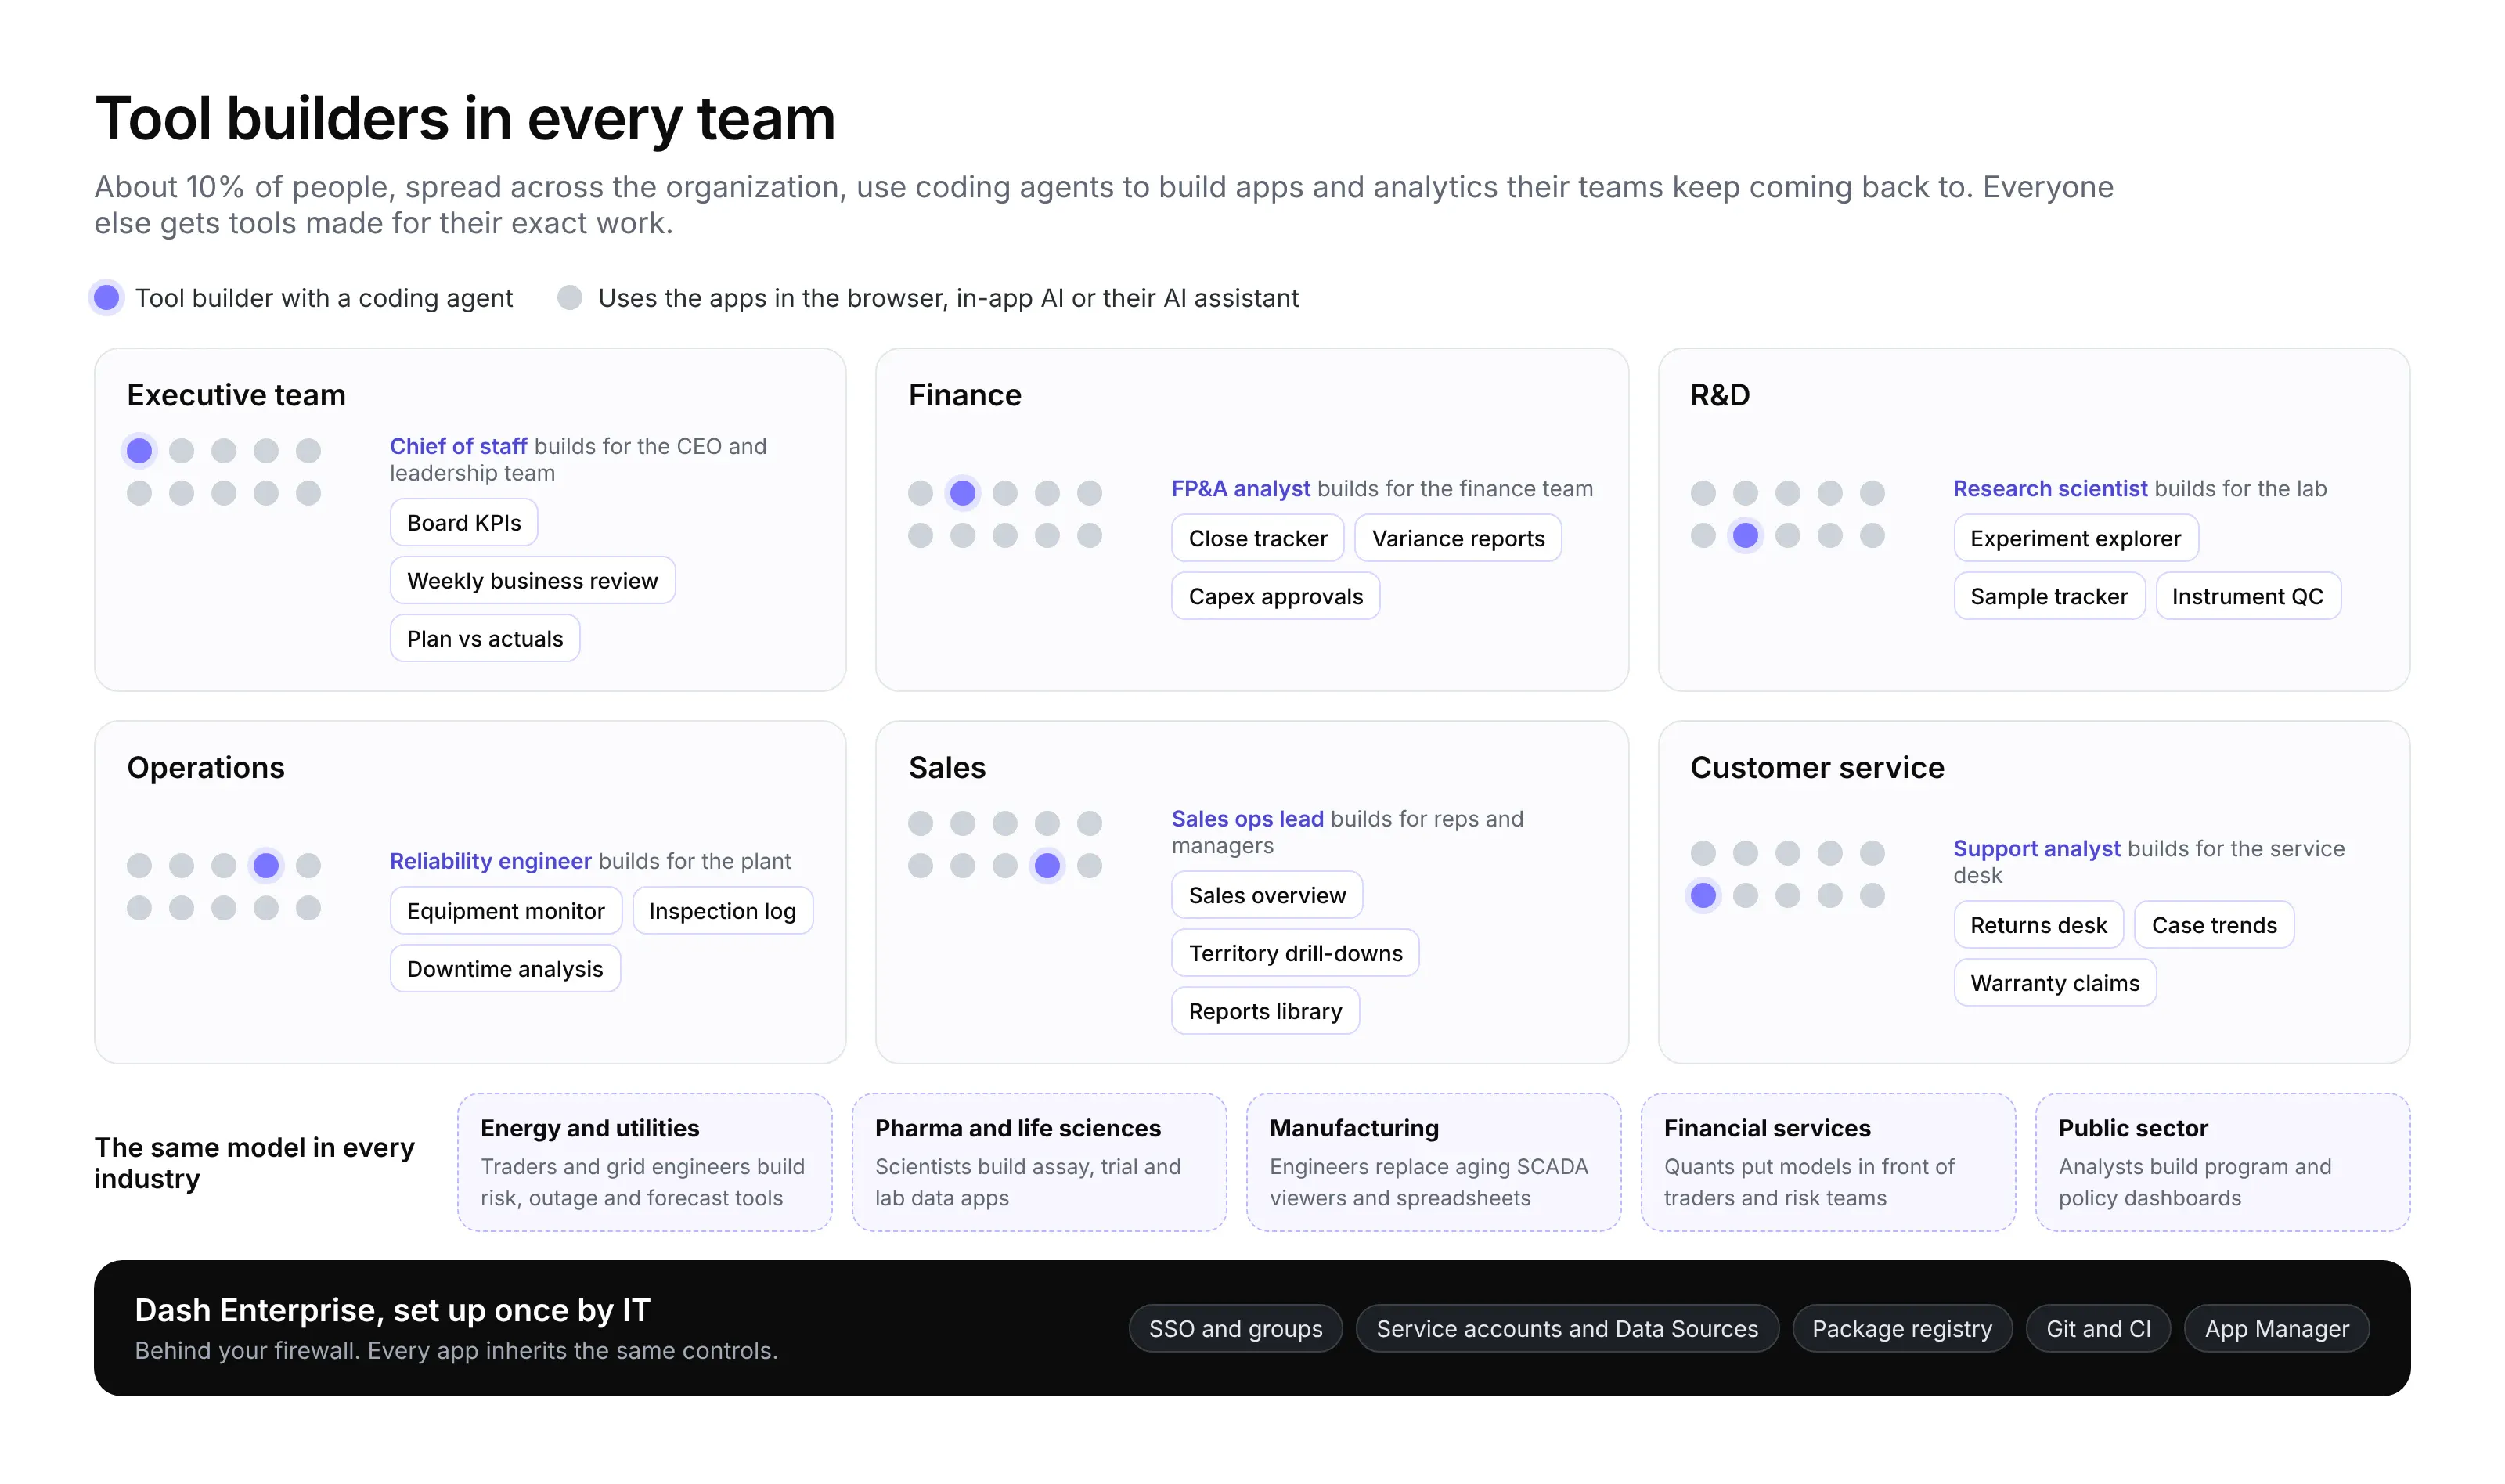
IT is responsible for managing the platform to enable these users. It sets the guardrails once, and every app built on the platform inherits them. Here's how ownership usually splits:
Who
What they own
IT and platform team
Installing and running Dash Enterprise, SSO, networking, data access, package registry, git integration and upgrades
Data and analytics leadership
Setting up the platform, giving staff the tools, and then getting out of the way
Tool builders (about one person in ten)
Building and maintaining apps for their teams, the data cleaning behind them, and answering their team's questions about them
Everyone else
Using the apps, asking for new reports, and optionally adding their own with a coding agent
What teams get out of it
The most immediate change is efficiency. Teams get software suited to how they actually work, rather than bending their process around a generic tool, so everyday tasks get quicker. Better tools can also surface new insights, by bringing in more data sources or showing data in new ways, and manual processes can become automated through workflow software. Building it is quick too: a coding agent can work through a whole feature while you review the result, so a team can try an idea before committing to it, and when a new question comes up, the agent can build a report for it against the same data and definitions the rest of the app uses.
With the platform, and by working in code, this work becomes more centralized and collaborative, rather than living in one-off AI chats. An organization's internal knowledge and expertise grows as it builds and manages its own software. Data cleaning, metric definitions, business rules and the apps themselves sit in code repositories instead of being scattered across a warehouse, a BI tool, a few spreadsheets and several teams. Because it's code, anyone with access can read a definition or propose a change, and every change is reviewed and reversible.
Doing the data work in code is a big part of this. A pipeline written in Python, with DuckDB or Polars, can pull from any source, clean and join the data however the app needs, and run on a schedule right next to the app that uses it. When a source changes or a new question needs a different cut of the data, the tool builder changes a few lines of code instead of waiting on a separate pipeline project, and every page picks up the same cleaned data. We cover this in more detail in the pipeline section below.
You also get full control over how apps look and behave, so they can match your brand and your users' workflow, and the same app can serve a browser interface, an AI chat panel inside the app, and a connector for people's own AI assistants. For a detailed comparison with a traditional BI tool, see Dash vs. Power BI.
Building it once with AI coding agents
Our approach to AI in analytics is to have an AI coding agent build an app or chart once, then publish and share it on Dash Enterprise so the whole team can keep coming back to it, rather than asking a chatbot every time someone needs a number. The agent still writes the first version, so you keep the productivity gains, but after that the answer lives in code that anyone can open again. This has several practical advantages.
- Token costs are lower, especially at scale, because a chatbot recreates the same chart from scratch every time someone asks for it. In DataAnalyticsBench, we estimated what AI analytics costs when 1,000 people each ask 10 questions a day. That's 2.5 million questions a year, which comes to about $7,500 a year with the cheapest capable model, $152,000 with one that answered every question correctly, and over $1 million with the most expensive models. A dashboard that answers the same question every week costs nothing extra to open.
- Definitions can be trusted. The logic is in code, so anyone can verify it, someone owns and maintains it, and every change is reviewed and auditable.
- Everyone is looking at the same data, graphs and metrics.
- Messy data gets cleaned up once. When the data has quality problems, they're fixed in one place in the pipeline, and every page and every later question benefits.
- You can use AI to its full potential. AI's killer use case is coding agents, and this approach gives you the best return on an AI rollout, because people have a place to manage and share what they create with AI instead of leaving it in short-lived chat sessions.
In our experience this covers around 80% of what people ask: the recurring metrics, reports and views a team relies on. The remaining long tail of one-off questions can go to AI inside the Dash app, through Plotly Studio Embedded or MCP, which we cover below. There, the data person defines what data the AI can see, usually the cleaned and documented tables from the pipeline, so people get quick answers to new questions without querying the raw warehouse and getting tripped up by duplicate rows, test orders or half-migrated tables.
Dash Enterprise platform setup
Dash Enterprise is the platform every app runs on, and IT manages it for every team. This is the checklist we walk through with new customers to get it running; the next section covers how IT governs the apps that run on it.
Install and harden
Dash Enterprise installs with Helm on your own Kubernetes cluster (EKS, AKS or GKE, running Kubernetes 1.30 or later). Dash Enterprise 6 runs in a single namespace and can share a cluster with other workloads, and air-gapped installs are supported with an image bundle from Plotly.
- Expose the platform through an internal load balancer, with TLS from your own certificate authority and your corporate proxy settings, so apps, data and credentials stay inside your network.
- Store app images in a container registry you control, such as Artifactory, Azure Container Registry, Google Artifact Registry, Quay or Nexus.
- As of 6.2, apps, workspaces and services run on read-only root filesystems with seccomp profiles, and apps can't use sudo by default. Exceptions are off unless an admin turns them on.
- Plotly ships CVE fixes and component upgrades in point releases, and 6.2 added guards against sensitive data reaching logs.
- Upgrades are a helm upgrade, and the Plotly team can walk through each one with you. Back up first with the built-in backup and restore.
Identity and access
Connect your identity provider through SAML, OIDC or LDAP (for example Entra ID, Okta or Active Directory), and map its groups into Dash Enterprise so tool builders can share an app with a whole team in one step.
Packages
Point Dash Enterprise at your internal Python package index, such as Artifactory or Nexus, so every app installs packages from a registry IT already approves.
Tools for tool builders
Each tool builder needs a coding agent; any of the major ones works, including GitHub Copilot, Claude Code, Codex and Plotly Studio. They also need a git repository, a CI pipeline, and a Dash Enterprise account with the Dash Enterprise CLI, de (pip install dash-enterprise-libraries). In practice their agents will do most of the work with these tools, so set up access the agent can use, like a CLI login, rather than shared passwords. Where the agent itself runs is a choice of its own, which we cover in the agent development environment section below.
No infrastructure team? Start with Plotly Cloud
Dash Enterprise runs in your own infrastructure, which assumes you have a team to install and run it. If you don't, use Plotly Cloud instead. It has many of the same features as Dash Enterprise, but it's managed by Plotly, it's multi-tenant, and it's more affordable. It's also a good place to try this approach before a wider rollout: a tool builder can publish an app to Plotly Cloud today and get a feel for building with coding agents while IT plans the Dash Enterprise install. The demo apps in this post run on Plotly Cloud.
Governance
Once tool builders across the organization are shipping apps, IT needs to see what's running and to set the rules in one place. Dash Enterprise splits the work cleanly: IT manages the platform, and tool builders build and run their apps on it. Every app inherits the platform's controls, and everything a tool builder needs to run an app on their own is built into the platform, including monitoring, logs, credentials, access control, and Postgres and Redis for apps that need to store data or run background jobs. IT doesn't have to stitch together separate products and keep them in sync, and staff can work almost entirely in Dash Enterprise without needing access to other cloud services.
App Manager and ownership
The App Manager lists the apps on the platform. Admins see every app under All Apps, and everyone sees the apps they own or co-own under My Apps. Each app shows its owner, when it was created and last updated, when it was last viewed and its total views, and you can search the list or sort it by date, title, views or how recently each app was viewed. As more people build, apps accumulate, so once a quarter we'd sort by least recently viewed and check with the owners of anything nobody opens before archiving it.
Every app has an owner, who can add co-owners and decide who can view it. View access can be limited to specific users and groups, opened to anyone who's signed in, or made public. We recommend sharing apps with groups from your identity provider, like a team or department, rather than lists of names, so access follows people as they join and leave. For any app a team depends on, add a teammate as a co-owner so it doesn't rest on one person.
Monitoring
The Monitoring page shows how the platform and each app are doing, with tabs for memory and CPU. At the top you see usage for the whole instance, and below it every app gets a row with its current usage, a seven-day trend, its owner, when it was last viewed, its total views and how many replicas are running. Selecting an app shows plots of its usage over time. Because usage and views sit side by side with the owner's name, it's quick to spot an app that's growing fast or one that's using resources nobody needs, and to know who to talk to about it.
The Portal
With dozens or hundreds of apps on the platform, people need an easy way to find the ones that matter. The Portal is the home page of Dash Enterprise, and you can promote the main apps there, like the company KPI dashboard or a team's most-used tools, so people land on them first instead of searching through the App Manager.
Shared data credentials
Apps need a way to reach data without anyone pasting passwords into code, and IT decides how that works. Dash Enterprise supports several mechanisms, which we compare in more detail in the data credentials section below:
- Kubernetes service accounts mapped to cloud identities (workload identity, added in Dash Enterprise 6.0). These are the most secure option, so make them the default for apps that read from cloud warehouses and buckets.
- Data Sources, which admins create once and link to apps, for Databricks, Snowflake, BigQuery, Redshift, S3, Azure Data Lake, SQL databases and custom sources. A custom source can hold any set of credentials, which Dash Enterprise stores securely and makes available to the users and apps it is shared with.
- Global environment variables for shared secrets that apps can use without developers ever seeing them, rotated centrally by IT. As of 6.3, managed database credentials are stored as Kubernetes Secrets.
Code integration
There are two ways to get code onto the platform: deploying straight from GitHub, or deploying from CI/CD with the Dash Enterprise CLI. With the GitHub integration, merging a pull request in your GitHub organization triggers the build. That mode uses one repository per app and replaces CLI deploys, so decide which one you want up front. If you want several apps in one repository, or a review app for every pull request (both covered later), use the Dash Enterprise CLI. Either way, give tool builders' repositories access to your CI platform, such as GitHub Actions, GitLab CI or Azure DevOps, so that agents can run tests and publish review apps, and create a Dash Enterprise service user for CI to deploy with.
Dev, test and production
Run separate dev, test and production environments, either as separate installs or at least as separate staging apps with restricted access. We suggest opening dev to anyone who wants to try building; it's where people get comfortable with coding agents and this way of working, without any risk to production. Apps then move to test and production through review.
AI assistants and custom MCP servers
Dash MCP, which lets AI assistants like Claude, ChatGPT and Copilot connect to an app, is off until an app's owner switches it on in the MCP tab. People who connect sign in with their Dash Enterprise account, so the same access rules apply as in the browser.
This also gives IT and data teams a safer way to bring AI assistants to company data. Rather than giving people direct access to the warehouse, where the data might still need cleaning, metrics might not be well defined and nothing has been validated, you can build custom MCP servers with Dash that serve cleaned, documented data and certified metrics. The data people decide what's exposed, and everyone's AI assistant gets the same answers the dashboards show. See 5 MCP server examples you can build in Python for some patterns.
Review as the last check
Platform controls decide who can reach what; code review decides what each app does. Every change goes through a pull request and a review app, and AGENTS.md records the standards leadership wants every coding agent to follow. Both are covered later in this guide.
Agent development environment
Coding agents need somewhere to run: a machine with the code checked out, a terminal, and ideally access to the same data and services the app uses. There are three common setups, and each has real tradeoffs; we're fairly neutral between them, and many teams use more than one.
Where the agent runs
Strengths
Tradeoffs
Your laptop
Familiar setup with your own editor and tools, and quick to start
Often can't reach internal data or has different permissions from the deployed app, so the agent works on sample data or exported copies
The agent vendor's cloud, such as Claude Code on the web, Codex cloud tasks or the GitHub Copilot coding agent
Nothing to install, and tasks can run in parallel and keep going while your laptop is closed
Runs outside your network, so internal databases and APIs usually aren't reachable without opening access or copying data in
A Dash Enterprise workspace
Same operating system, network permissions and credentials as the deployed apps, so the agent can query real data, run the app as it runs in production and read its logs
A browser terminal instead of your own editor, and IT needs to allow the agent's model API from the platform or point it at an approved endpoint
The data question tends to decide it. An agent can only check its work against data it can reach, so when it runs somewhere that can't see the warehouse or internal APIs, someone ends up exporting a copy for it. Copies go stale, they're one more place sensitive data can leak from, and the agent still can't test the app against the real thing.
A Dash Enterprise workspace avoids that problem. Every app can have one: an in-browser development environment with Python, git and the Dash Enterprise CLI already installed, where you can run terminal coding agents like Claude Code, Codex or the GitHub Copilot CLI. Because the workspace runs on the same platform as the deployed apps, with the same operating system, network permissions and credentials, the agent can query the real sources, run the app the way it will run in production and read its logs, which lets it go much further on its own.
In practice, a tool builder might prototype on their laptop against sample data and move to a workspace once the app needs real data. The rest of this guide applies wherever the agent runs: sample data so it can work anywhere, tests and screenshots so it can check its own work, and review apps so a person sees every change before it ships.
Plotly Studio for day-to-day exploration
Not every piece of work needs a coding agent. Plotly Studio is a desktop app for power users who explore data day to day: you point it at a dataset, ask questions, and it builds charts and a Dash app around the answers. It's lighter weight than setting up a coding agent with a repository and CI, and it keeps the data front and center the whole time, where coding agents tend to work in the code and keep the data more in the background. When something is worth sharing, you can publish it straight to Dash Enterprise, where it gets the same access controls as every other app.
We'd reach for Studio when the goal is to look at the data and find something, and for a coding agent when the goal is an app the team will rely on and keep changing. Plenty of apps start in Studio and move into a repository once they become part of how a team works.
Deploying behind your firewall
Because Dash Enterprise runs in your own cluster, you can keep the whole platform behind your firewall, air-gapped from the public internet if you need to, where not even Plotly can reach your data. This matters more now than it used to. The AI era has brought a very different security environment; swarms of agents, like those in the Hugging Face attack, showed a new level of offensive autonomy and capability. Running your data stack behind your own network is the simplest step with the biggest payoff, because it doesn't depend on trusting anything else in the stack. If the network is closed, malicious agents find it hard to get in and your data has no easy way out.
For sensitive data, we'd also avoid services that run on a vendor's network, where the vendor can reach your data through the software and its instrumentation. Many BI tools and multi-tenant SaaS products work that way. Our most security-conscious customers, including labs, banks and government agencies, keep their data and Dash Enterprise on their own infrastructure.
Inside the network, Dash Enterprise follows a zero-trust model. Every app sits behind SSO, access is granted per app by user or group, and apps can reach data only through the identities and credentials IT grants. Because the platform runs in your cluster, your existing admission and policy controls, such as Open Policy Agent (OPA), apply to it as well.
Running next to your data also keeps networking simple. Because the apps sit inside your network alongside the data sources they read, you can keep the network between them locked down; there are no IP allowlists to maintain for an outside service and no VPC peering to set up. It usually costs less too, since moving data within a data center or cloud region is often free, while sending it out to a hosted service is not.
Building analytics apps with these pages
With the platform in place, the rest of this guide is about building the apps themselves, starting with analytics.
Why generic self-service doesn't scale
The promise of self-service BI was that every user would build their own dashboards. In practice, most people don't want to configure data models, join tables or learn a tool's quirks, so self-service with generic tools ends up as too much work for too many people. The result is usually a sprawl of slightly different dashboards that disagree with each other.
Instead, have the tool builder in each team build the dashboards and apps the team needs. End users get analytics made for their exact use case, and the tool builder is the directly responsible individual (DRI) for that app, so when something looks wrong, everyone knows who to ask.
The pages of a good analytics app
We recommend building every analytics app around a few kinds of pages:
- Fixed views for the questions the team asks every day or every week. These are the pages people open first, with one page per view.
- A Reports page for one-off requests. When a teammate asks why returns spiked in March, the tool builder has a coding agent build a new report in the app rather than answering in a chat thread.
- AI for quick one-off questions. Plotly Studio Embedded adds an AI chat panel inside the app, and MCP endpoints let people who prefer Claude, ChatGPT or Copilot chat with the app from the AI client of their choice.
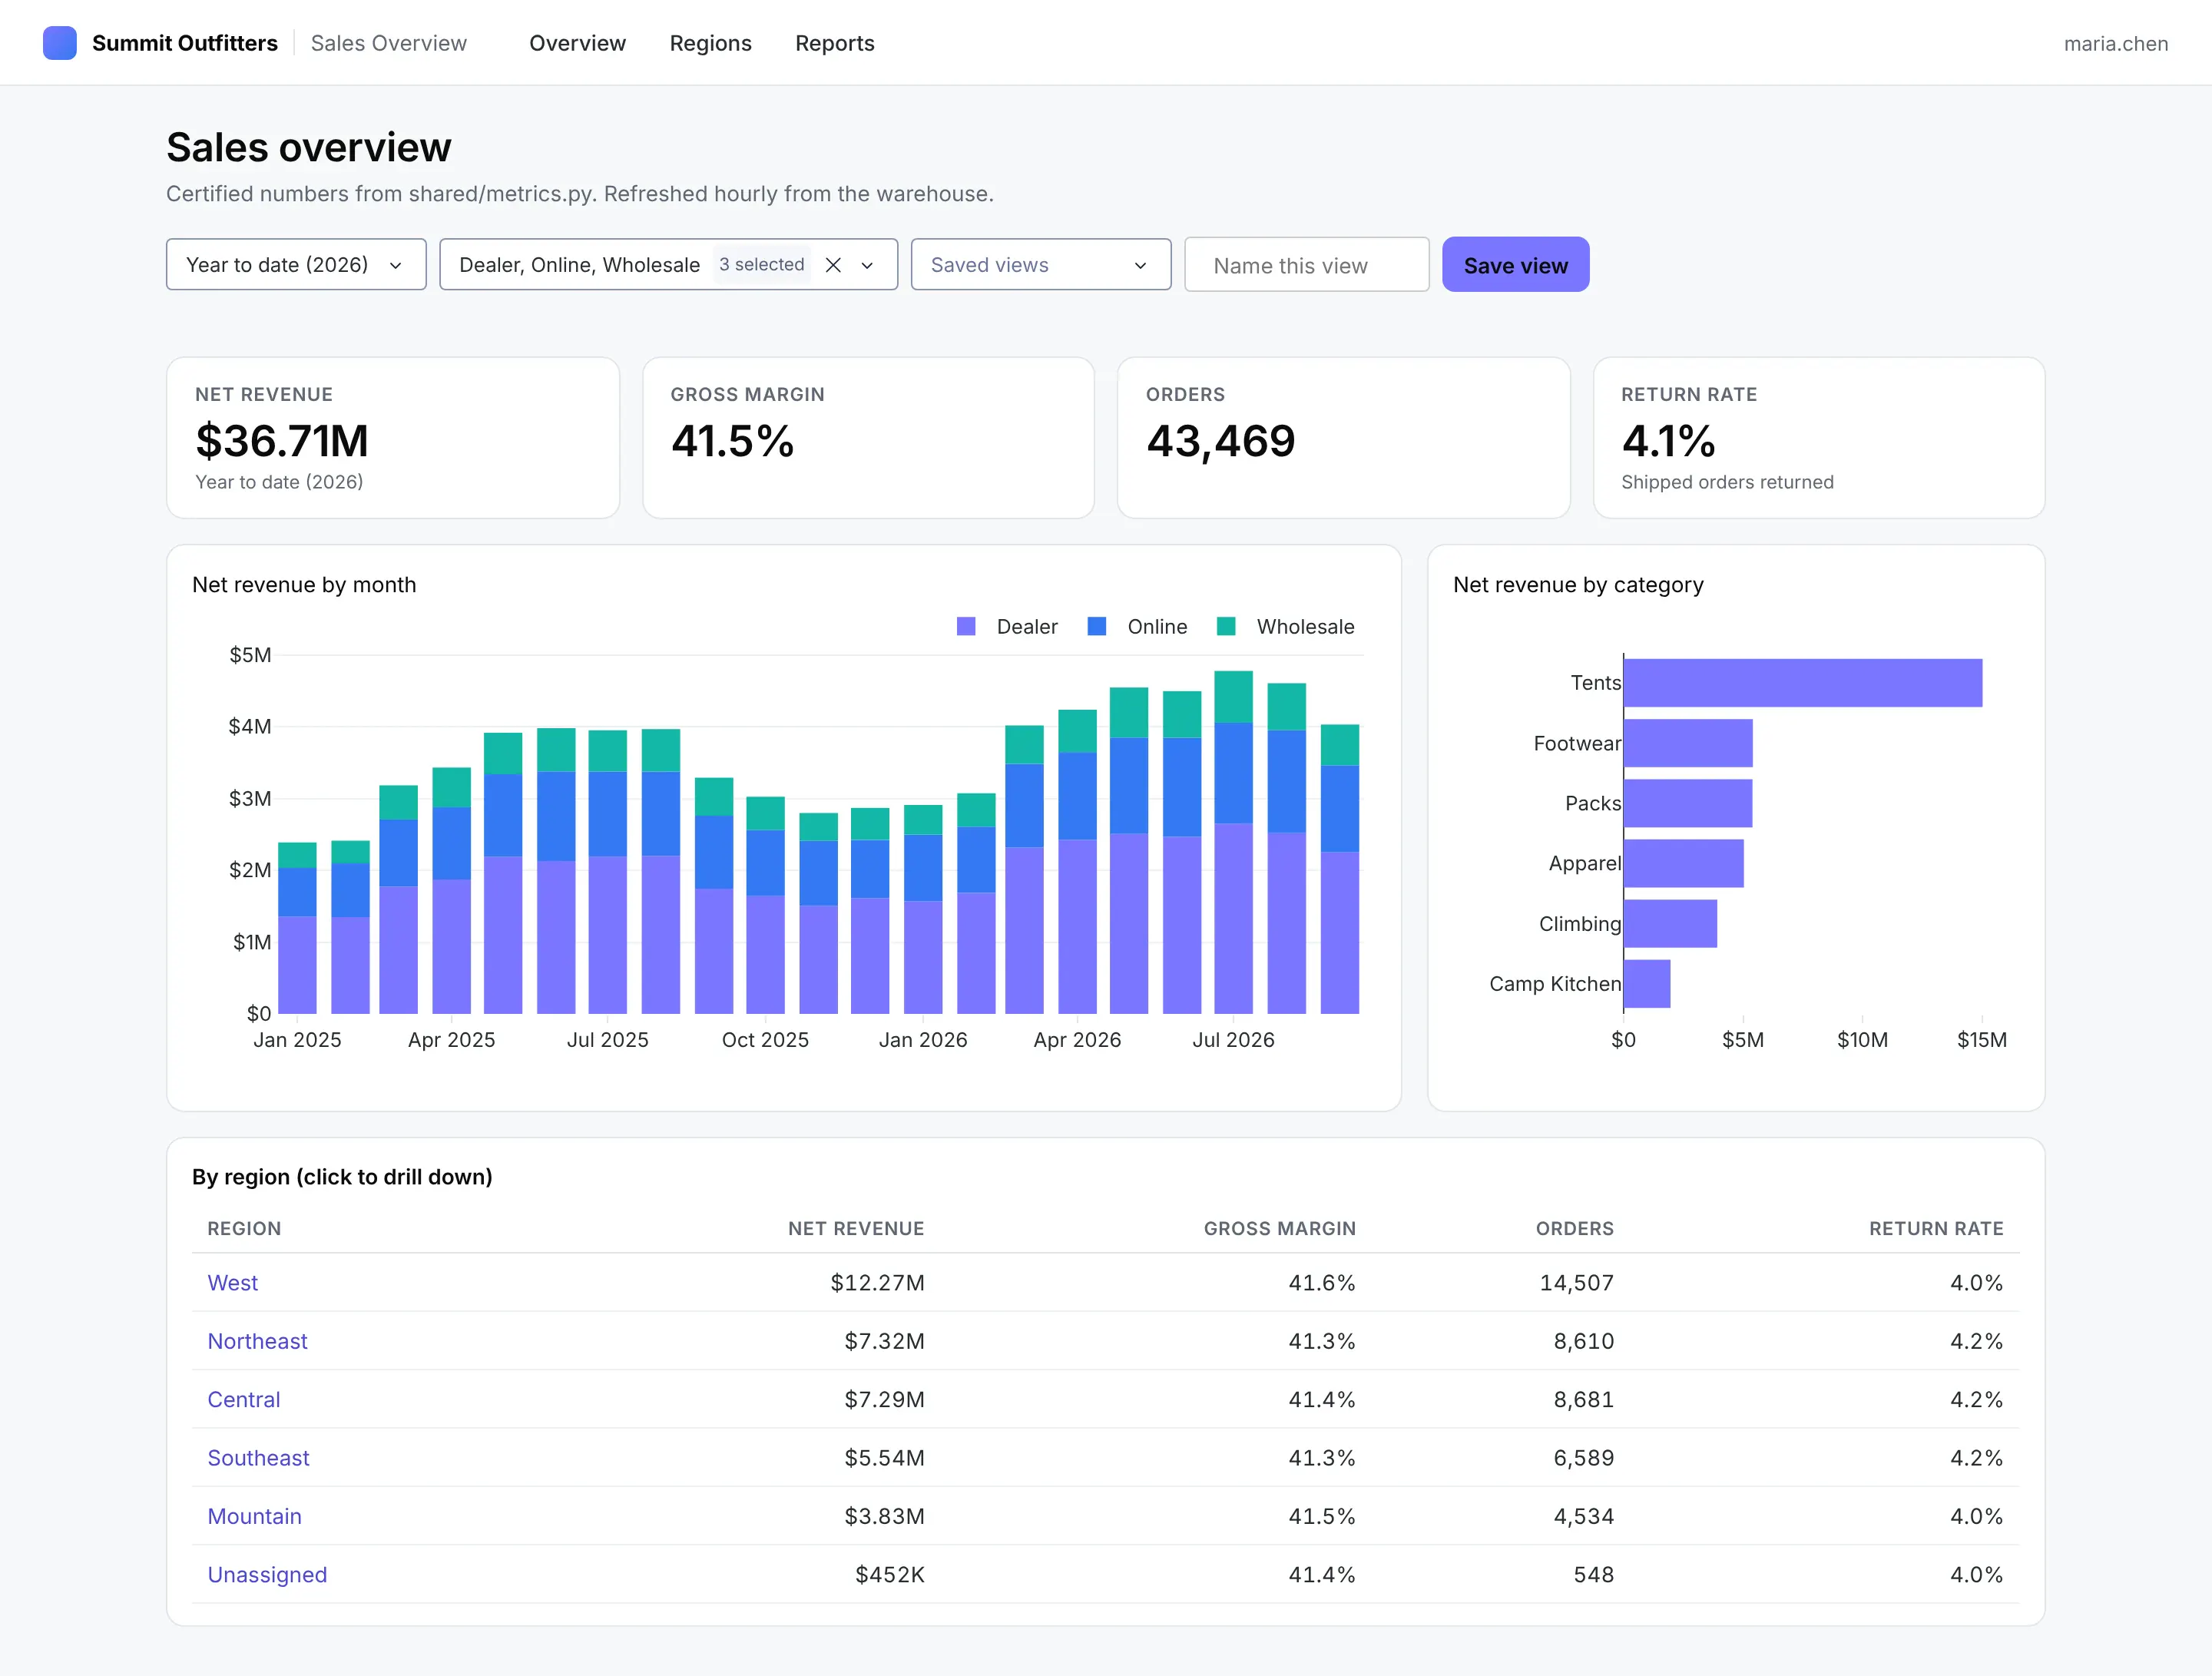
The Sales Overview Dash app, with fixed views for the questions the sales team asks every week.
The Reports page is the part most teams are missing. Without one, investigations get shared as screenshots or AI chat transcripts that nobody can rerun. With one, every answer becomes a reviewed page that uses the same data and definitions as the rest of the app, and anyone on the team can open it again next quarter. Here's a sample prompt for adding one:
Prompt
Add a Reports page to the Sales Overview app. Each report is its ownPython file in a reports/ folder with a title, a one-line summary, thedate, who asked and who built it, and a layout() function. The Reportspage lists them as cards, newest first, and each one opens at/reports/<name>. Use the metrics in shared/metrics.py.
Each report is then its own small file. Here is the one from the demo, slightly shortened:
# reports/returns_spike_march_2026.py: one report, one fileTITLE = "Why did returns spike in March 2026?"SUMMARY = ("Nearly all of the increase is one SKU, the Ridgeline 2P tent, ""shipped from the Reno warehouse, returned for seam tape failure.")DATE = "2026-04-06"ASKED_BY = "Dana Ruiz, VP Sales"BUILT_BY = "Maria Chen with a coding agent"def layout():march = metrics.filter_period(load_orders(), date(2026, 3, 1), date(2026, 3, 31))tent = march.filter(pl.col("sku") == "Ridgeline 2P")by_sku = (march.group_by("sku").agg(returns=pl.col("returned").sum()).sort("returns", descending=True).head(8))fig = px.bar(by_sku.to_pandas(), x="returns", y="sku", orientation="h",title="March 2026 returns by SKU")return html.Div([theme.kpi("March return rate", theme.pct(metrics.return_rate(march))),theme.kpi("Ridgeline 2P return rate", theme.pct(metrics.return_rate(tent))),theme.card(theme.graph(fig)),theme.card(html.Ul([html.Li("Without the Ridgeline 2P, March returns were in line with the rest of the year."),html.Li("Most of its returns cite seam tape failure, which points to one bad batch."),]), title="What we found"),])
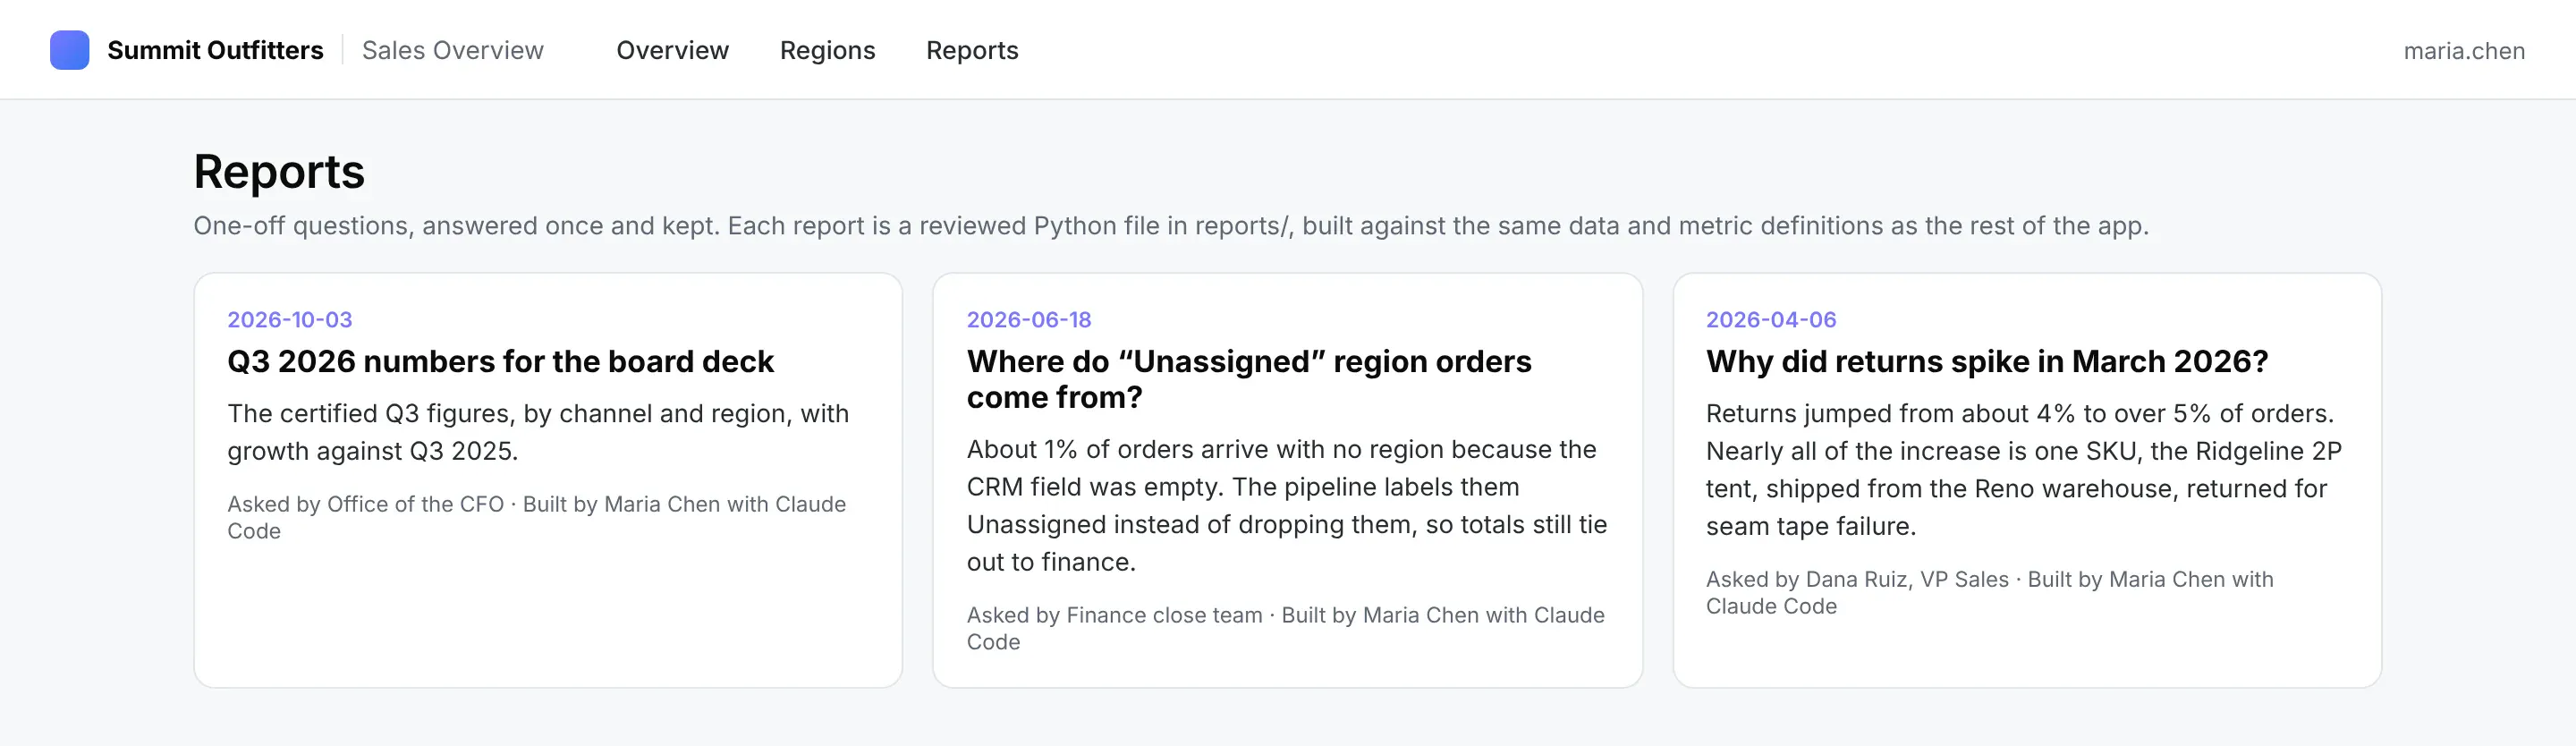
The Reports page lists every one-off investigation, newest first, with who asked and who built it.
In the demo, the VP of Sales asked why returns spiked in March, so the tool builder gave the agent the question and it built a report. It found that one SKU from one warehouse, returned for one defect, accounted for nearly all of the increase.
Prompt
Dana asked why returns spiked in March 2026. Investigate it and add areport to reports/ with the findings. Break returns down by SKU,warehouse and return reason, and show March with and without anythingunusual you find.
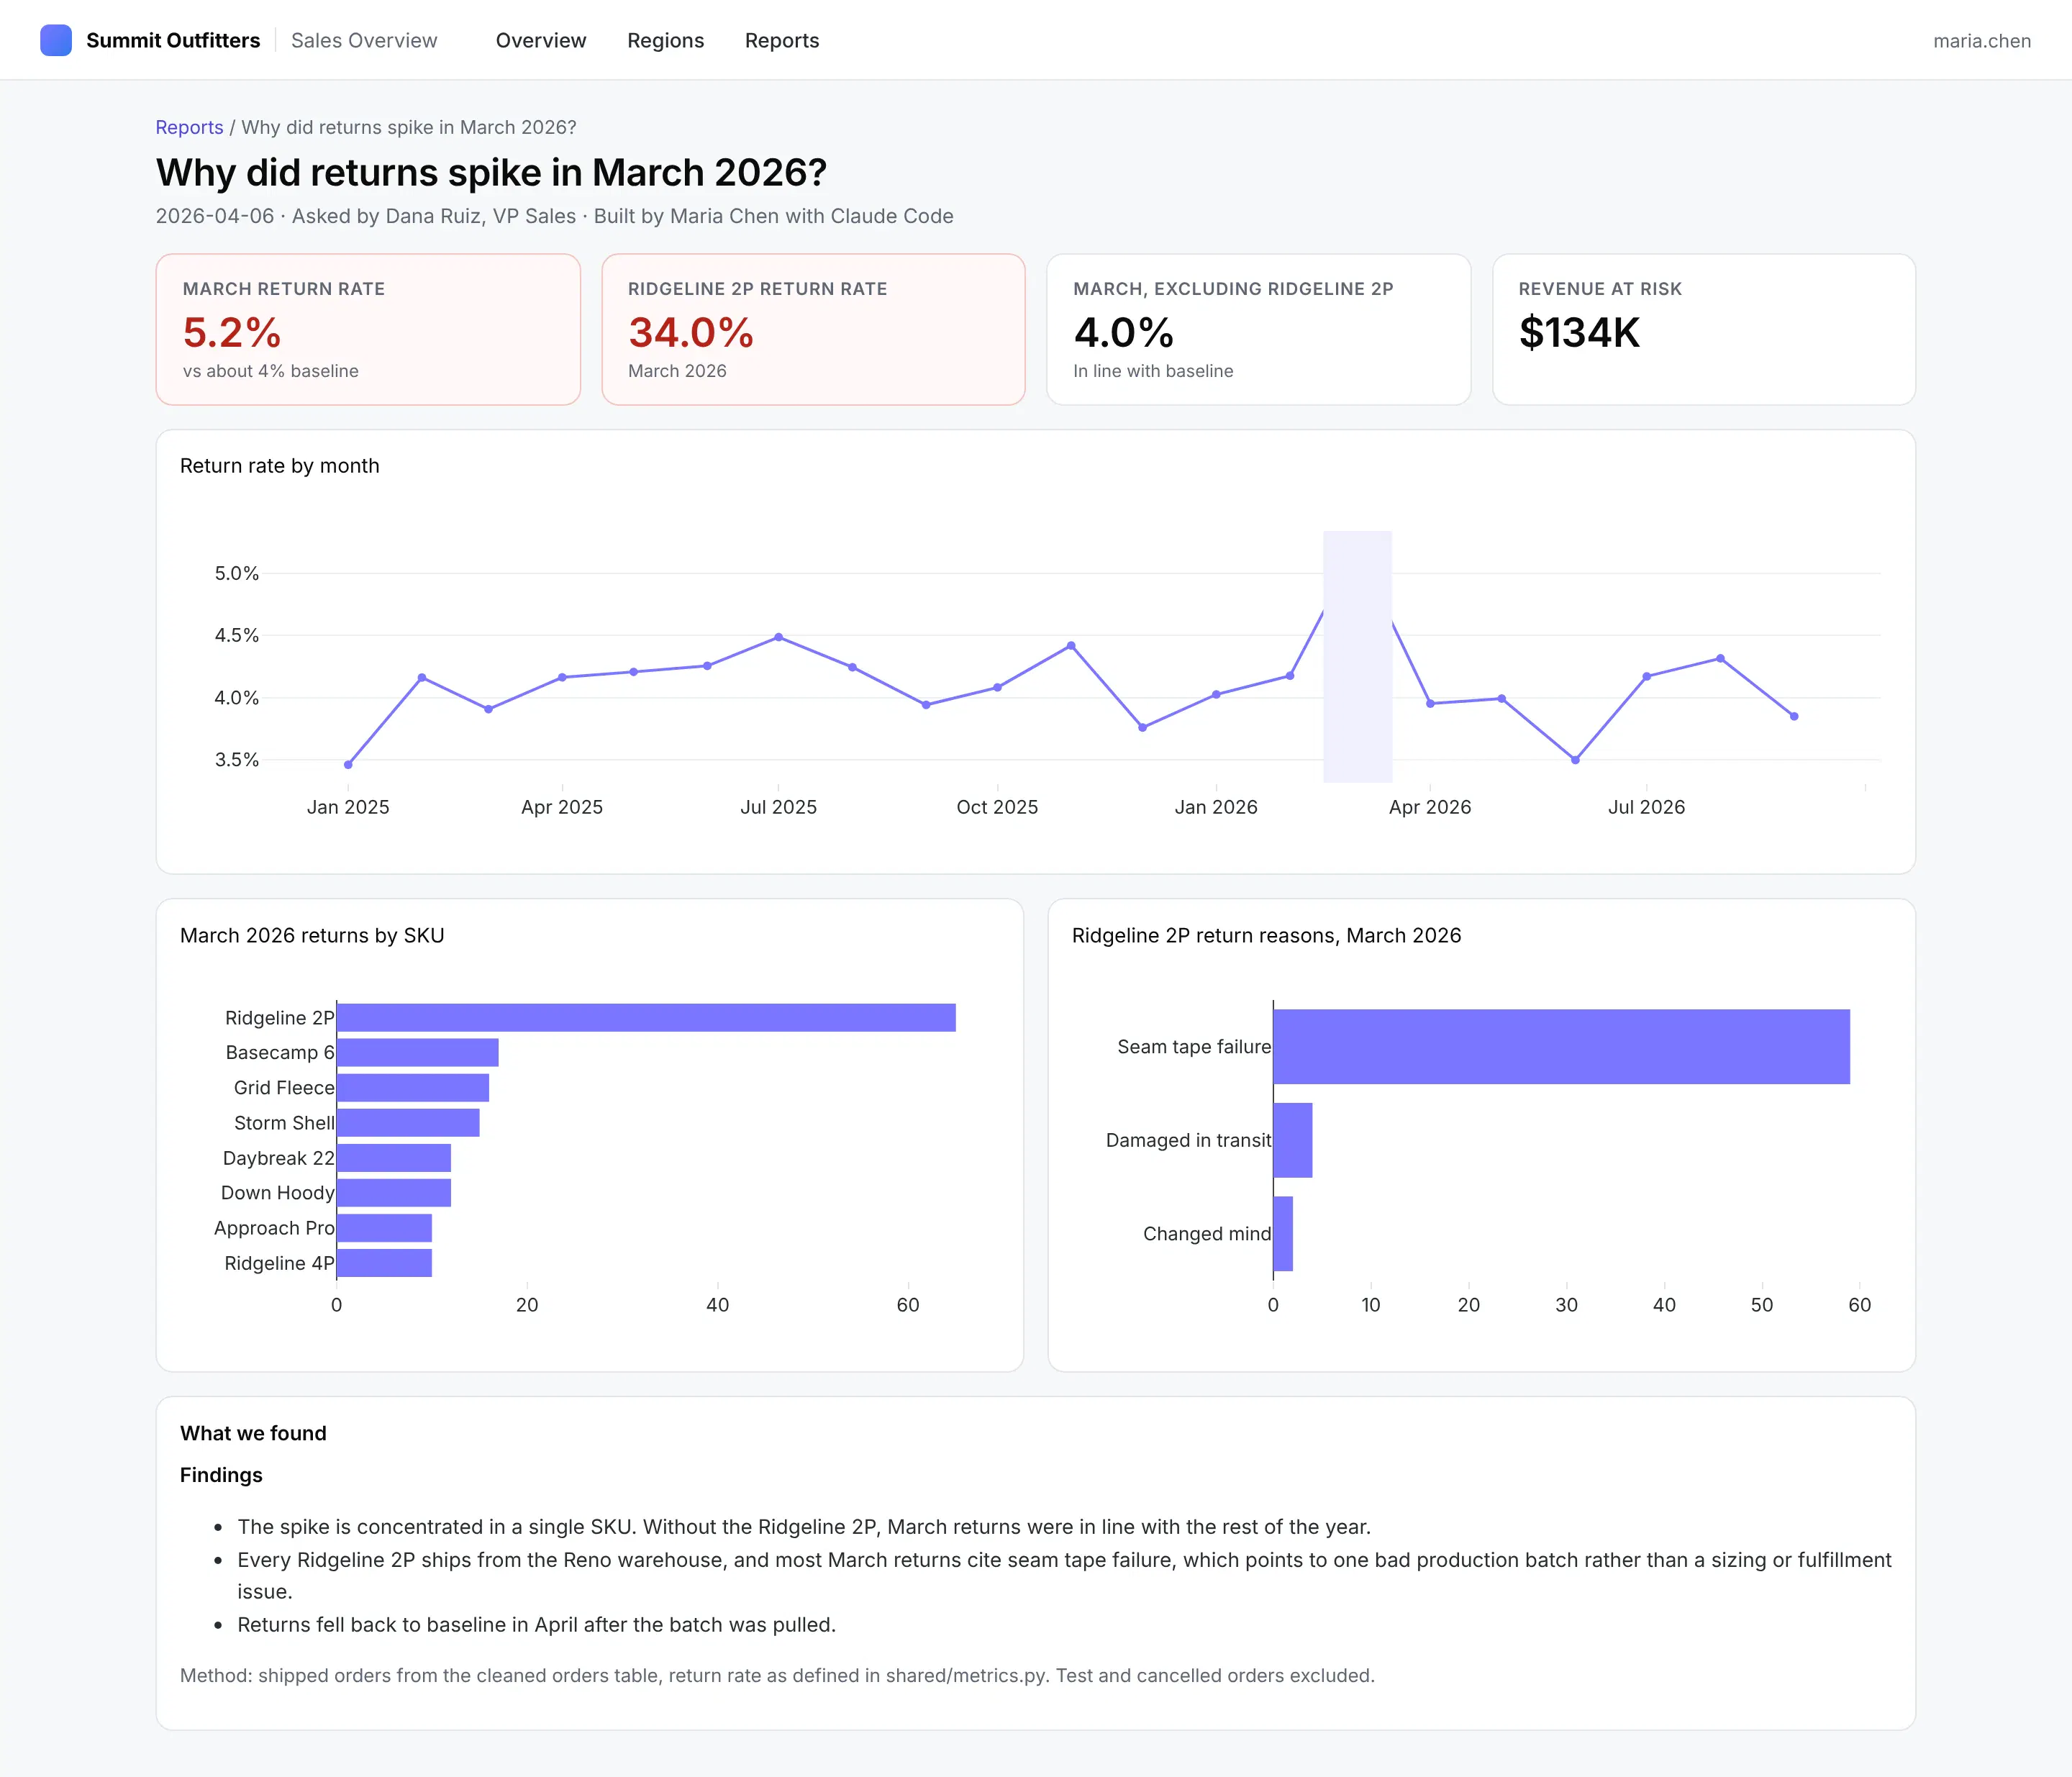
The returns report the agent built: one SKU from one warehouse explains nearly all of the March spike.
Plotly Studio Embedded for ad hoc questions
Plotly Studio Embedded is an AI chat panel you can turn on inside a Dash app, so end users can ask their own questions about the app's data and make one-off charts without waiting for anyone. It works from the DataFrames the app already loads, and conversations run in a sandbox with no code execution, network or filesystem access. It's in beta on Plotly Cloud today and planned for Dash Enterprise in Q4 2026.
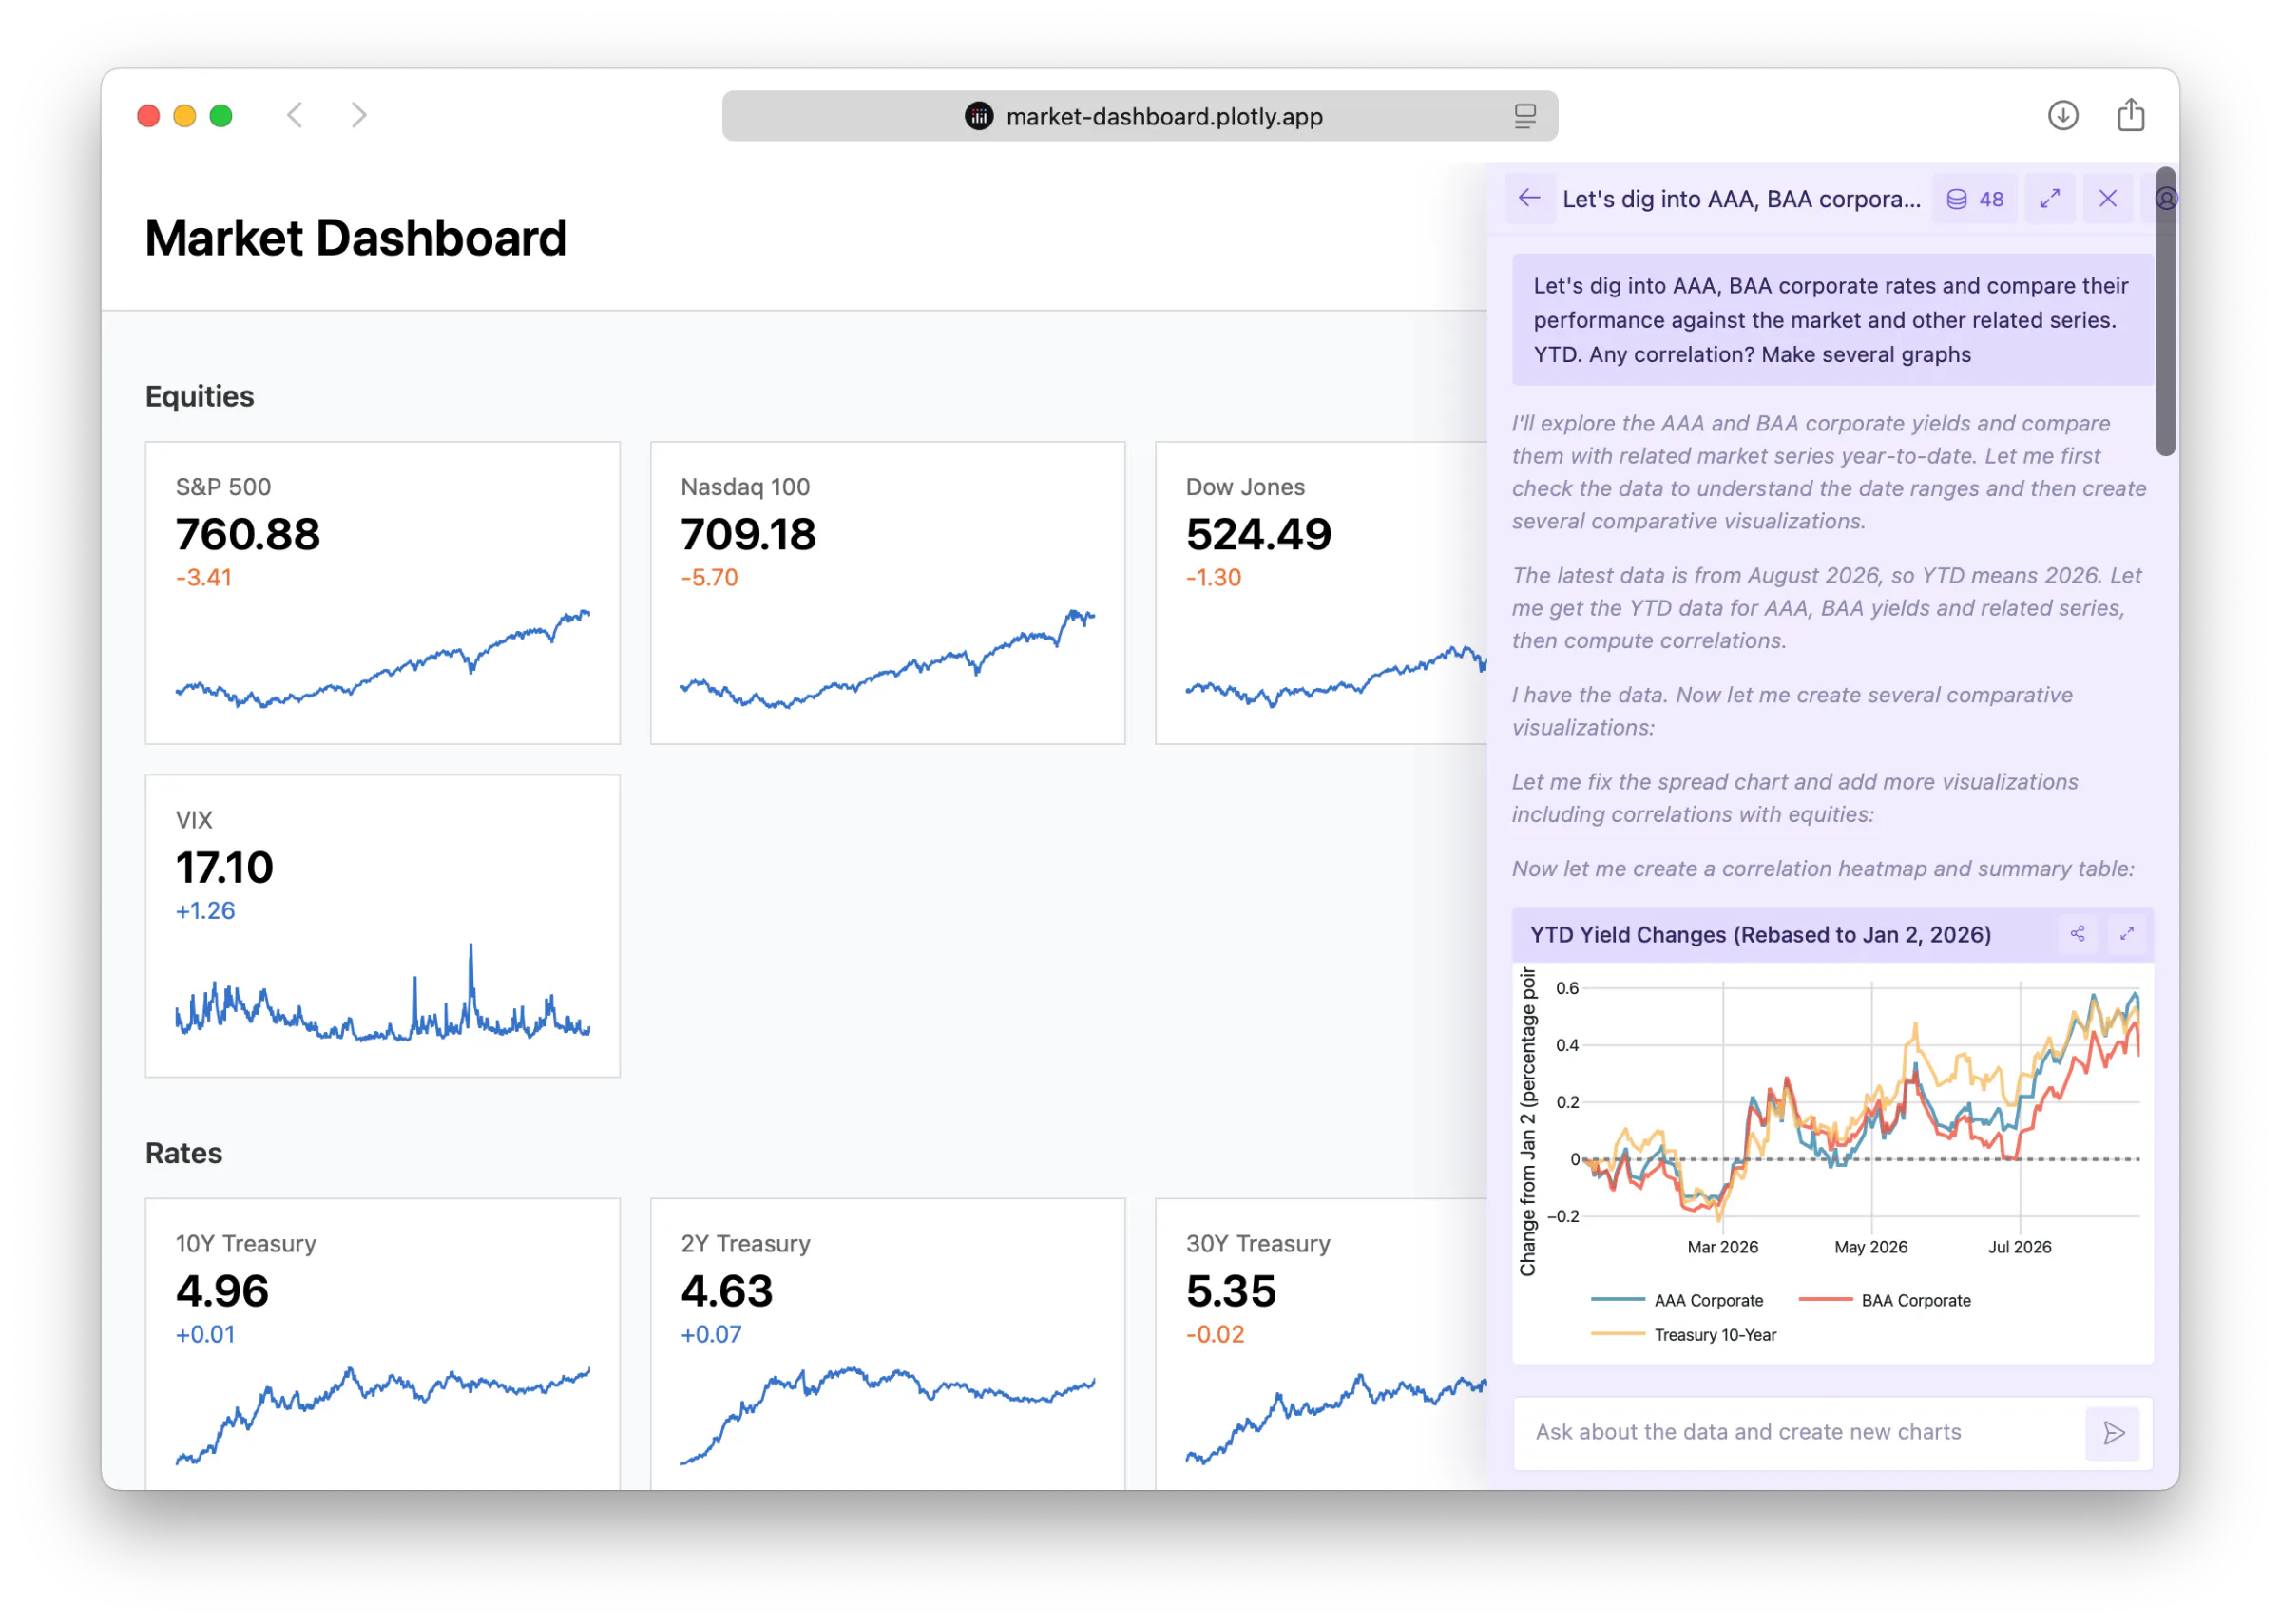
Plotly Studio Embedded inside a Dash app: people ask their own questions and get charts back, next to the views the app already has.
AI is now good enough to trust with this kind of work. In DataAnalyticsBench, our benchmark of 43 analytics questions against a 20-million-row data warehouse, the agent ran inside Plotly Studio Embedded. The best models answered all 43 correctly, and low-cost models still scored close to 90%. The models that did well stated their assumptions and said when a question couldn't be answered with the data.
When a question needs a deeper investigation, it's better to have a coding agent build a new page in the app. Agents can now do much of this on their own; in the same benchmark, models decided for themselves what to query and how many queries to run, and the best ones found planted data quality issues and hidden patterns they were never told to look for. With a codebase to work in, an agent can chase an issue like that, fix the cleaning step and turn the result into a page the whole team can reuse.
MCP endpoints where people want them
MCP (the Model Context Protocol) is how AI assistants like Claude, ChatGPT and Microsoft Copilot connect to outside tools. Dash MCP turns a Dash app into a custom connector for those assistants. On Dash Enterprise 6.3, app owners switch it on per app in the MCP tab, and users sign in with their Dash Enterprise account when they connect. We'd add MCP endpoints when a team's users prefer working in an AI assistant; for most people, most of the time, opening the app in a browser is still the better experience, so it doesn't need to be on every app by default.
Letting end users add their own reports
Some end users will want to go further. If you give them a coding agent connected to the app's repository, they can add their own reports, which go through the same review as everyone else's. This is often how new tool builders appear: someone starts by adding one report and ends up learning how to create their own apps.
One codebase for context, semantics and data
A nice pattern is to keep the data cleaning, metric definitions, business context and apps in a single codebase, so everything can be shared across apps. This is the monorepo pattern, and it's coming back into fashion in the era of coding agents. The dashboard, the AI chat panel, the MCP connector and any API all call the same functions, so they always agree. Data can still come from many places, as the diagram below shows.
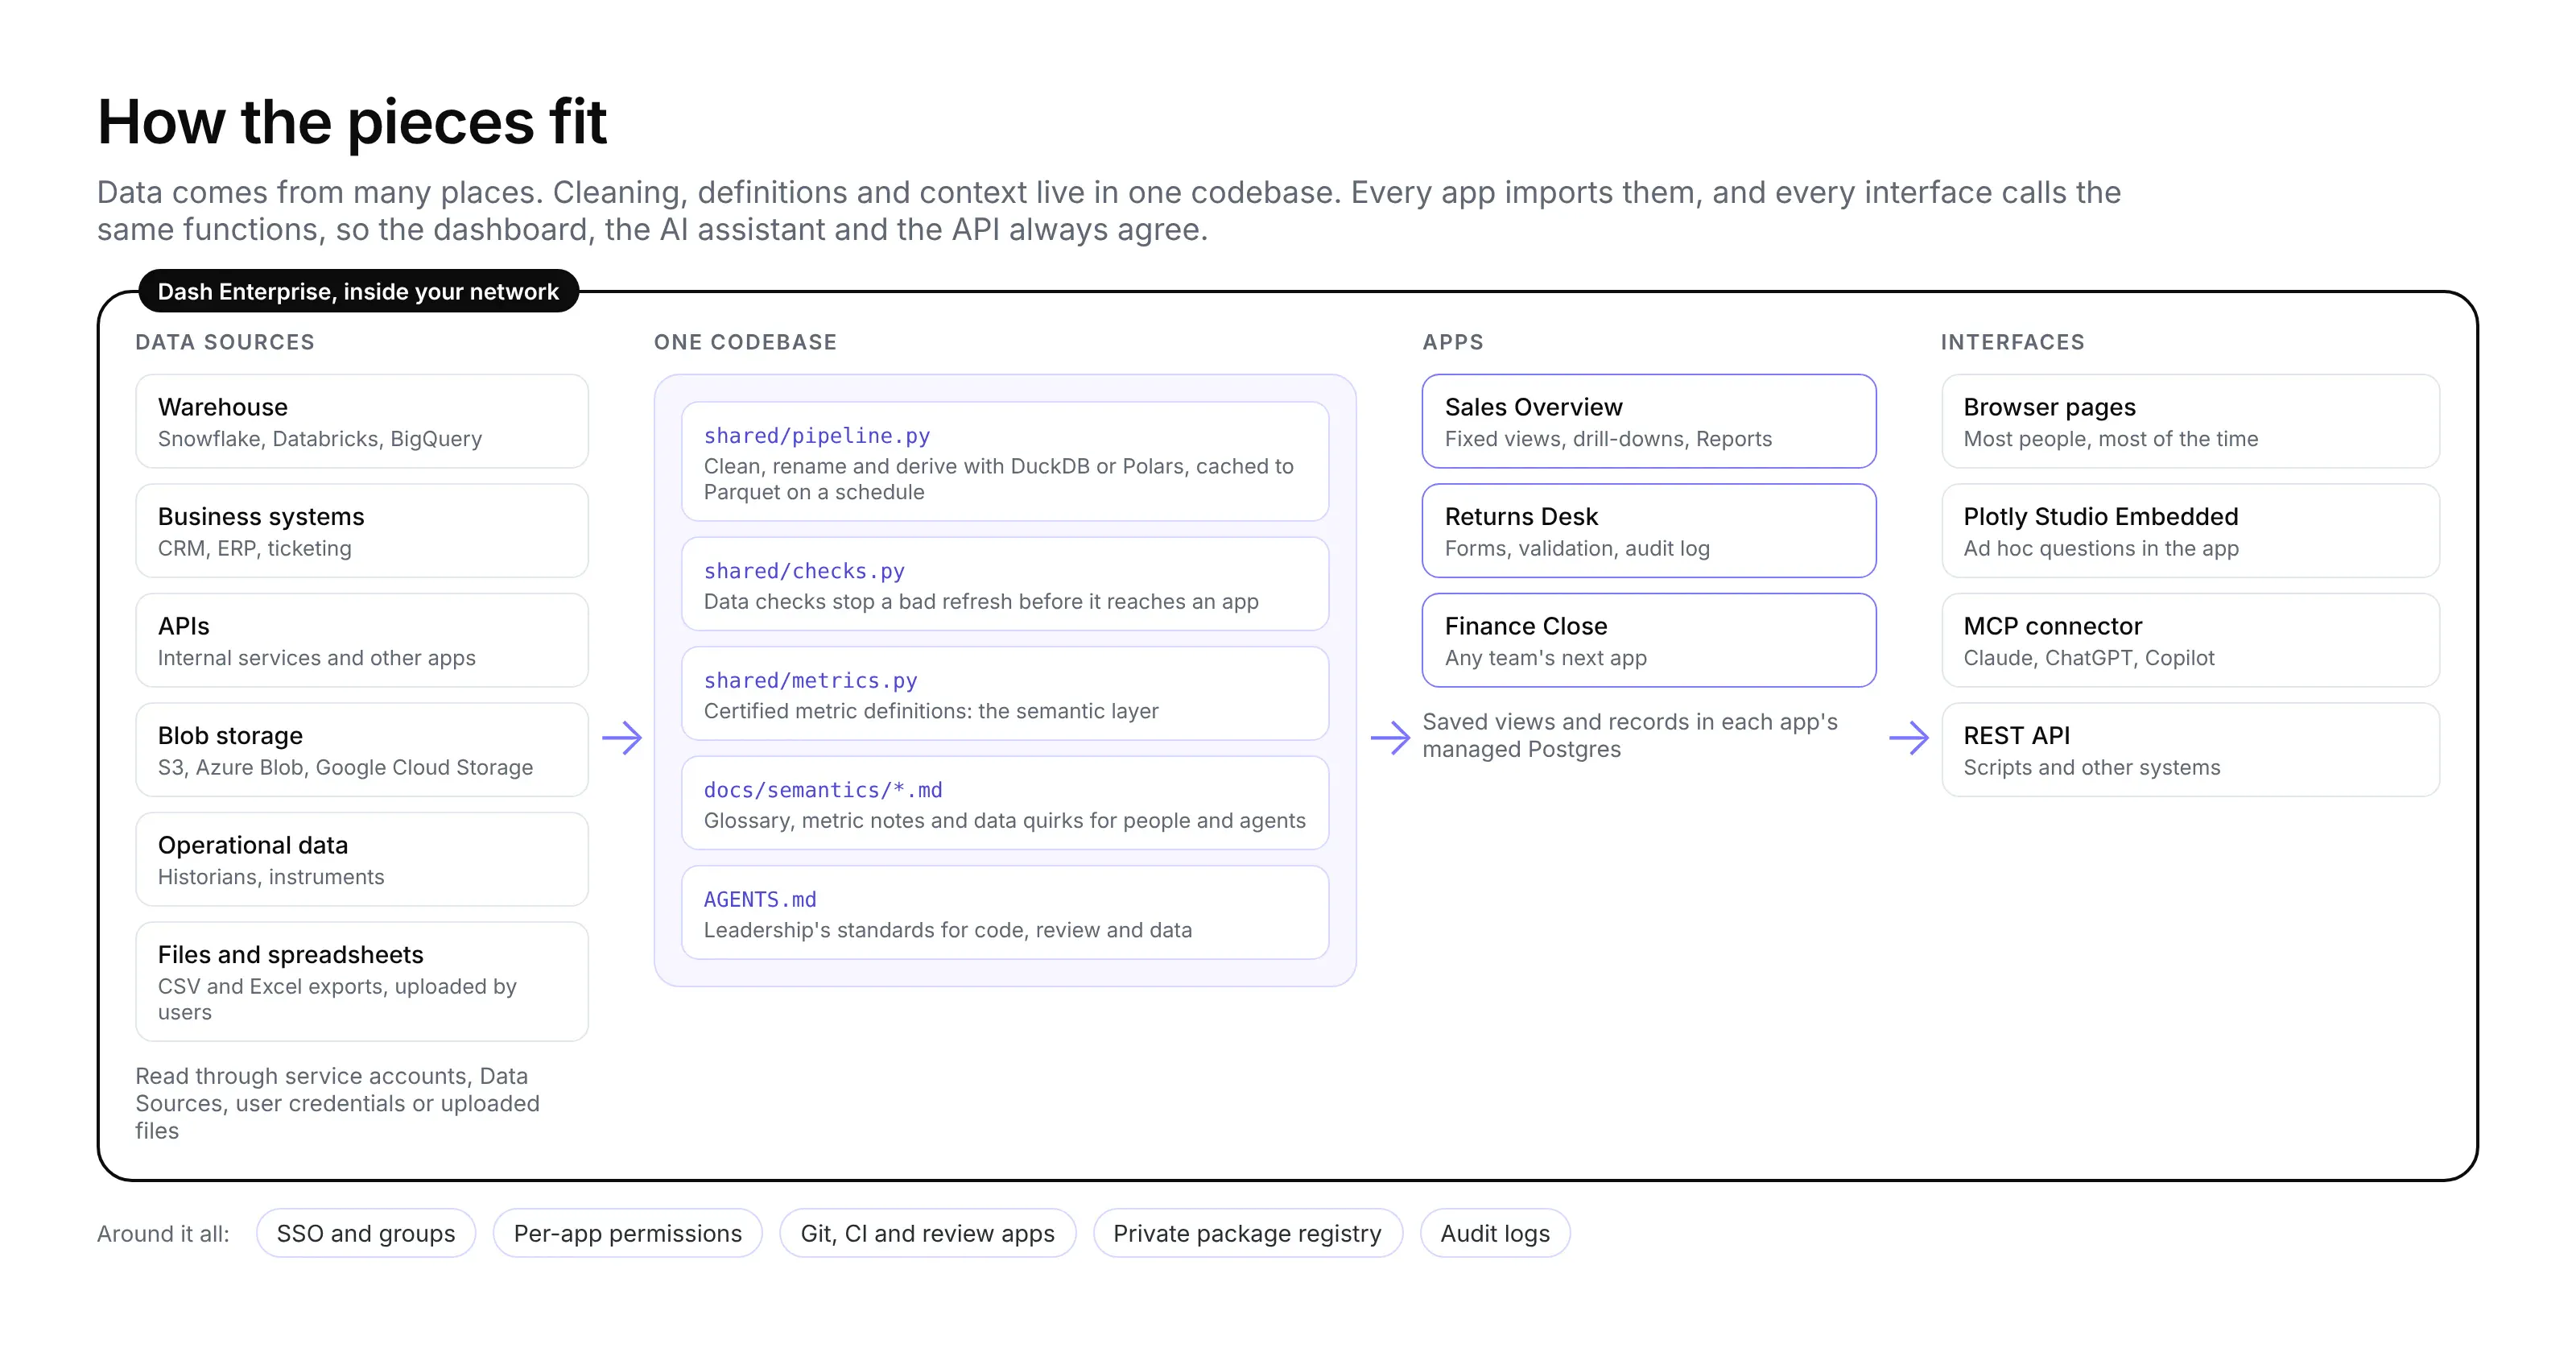
Interface
Best for
Who uses it
Fixed views in the browser
Daily and weekly questions, scanning lots of data
Everyone on the team
Reports page
One-off investigations that should be kept and shared
Everyone, built by tool builders or their agents
Plotly Studio Embedded
Quick ad hoc questions and one-off charts
End users, inside the app
MCP connector
Specific questions from people who work in an AI assistant
End users who prefer Claude, ChatGPT or Copilot
Coding agent on the repo
New pages, new reports and deeper investigations
Tool builders and motivated end users
Connecting to data
Python has a package for almost every data source, including database drivers, warehouse connectors, cloud SDKs and client libraries for most SaaS APIs. Those packages are what your apps use, and coding agents already know them well.
Sometimes you can skip the warehouse entirely. An app can call a system's API directly, download the data on a schedule and cache it next to the app, which is lightweight and quick to set up. Since one app can have many pages, a whole team can then work off that one cached source just by working in the same app.
Other times the API isn't built for analytics. Google Analytics is a good example, with quotas, sampling and a deeply nested report format, and there it's better to use an official connector to move the data into a warehouse first. In the Google suite, sending Google Analytics to BigQuery is a built-in export you switch on in one click, and for other sources, vendors like Fivetran will run these pipelines for you. Once the data is in one place, everything downstream gets easier.
Even so, don't let a data pipeline project hold you up. A big advantage of connecting directly to the source of truth is speed and cost. Because code is flexible, you can start with the sources you can reach today instead of waiting years for a company-wide pipeline project to finish, and there is less data to copy and store along the way. When the warehouse catches up, you change one function in the pipeline and every page keeps working.
Prompt
Our support tickets live in Zendesk. Write shared/sources/zendesk.pythat pulls the last 90 days of tickets with the zenpy package, using theAPI token in the ZENDESK_TOKEN environment variable, and caches them todata/cache/tickets.parquet every hour. Fall back to sample data when thetoken isn't set.
The pipeline in the app
Do the data work in code, next to the app
We recommend using DuckDB or Polars to clean and shape data inside the app's codebase. Which one you pick doesn't matter much, since both are fast, run in-process and handle tens of millions of rows on a single machine. Typical work that belongs here includes removing test and bad rows, renaming columns into business terms, deriving metrics like margin, and joining sources.
Conventional wisdom says this belongs in a separate pipeline owned by a data engineering team. In practice, most of this logic is specific to one project, and the person building the app is the one who understands the data best, so putting it in the app's codebase means it actually gets done, by the person best placed to do it. If a definition later matters across the company, you can promote it upstream then. Because the pipeline lives in a shared module, every page and every app in the repository gets the same cleaned data.
Prompt
Write shared/pipeline.py with DuckDB. Clean the raw orders: drop testand cancelled orders, label orders with no region as "Unassigned"instead of dropping them, and add net_revenue (gross minus discount) andgross_profit. Every app should read the result from one Parquet cache.
This will result in code that looks like this:
# shared/pipeline.pydef build_orders(con: duckdb.DuckDBPyConnection) -> None:"""Turn raw_orders into the cleaned orders table every app uses."""con.execute("""CREATE OR REPLACE TABLE orders ASSELECTorder_id,CAST(created_at AS DATE) AS order_date,DATE_TRUNC('month', CAST(created_at AS DATE)) AS order_month,account_id, account_name,COALESCE(region, 'Unassigned') AS region,channel, category, sku, warehouse, quantity,gross_amount - discount_amount AS net_revenue,gross_amount - discount_amount - cost AS gross_profit,returned, return_reasonFROM raw_ordersWHERE order_id IS NOT NULLAND status = 'shipped' -- drops test and cancelled orders""")
Cache to Parquet on a schedule
Rather than hitting the warehouse on every page load, run the pipeline on a schedule, write the results to Parquet files, and have the app read from those. Pages get fast, and warehouse costs can drop dramatically, since each scheduled run replaces hundreds or thousands of interactive queries. On Dash Enterprise, a Celery worker using the app's managed Redis can run the refresh on a schedule (the App Catalog includes a "Periodic Tasks with Celery" template), and the files can live on the app's persistent filesystem, or in an object store like S3 when several apps share them.
Prompt
Add a refresh() function that extracts raw orders, runs the data checks,builds the cleaned table and writes it to data/cache/orders.parquet withan atomic swap, so an app never reads a half-written file. Schedule ithourly with Celery.
This will result in code that looks like this:
def refresh(path: Path = CACHE_PATH) -> Path:"""Run the pipeline and write the Parquet cache. Schedule this (e.g. hourly)."""raw = extract_raw()check_raw(raw) # stop before bad data reaches the cachecon = duckdb.connect()con.register("raw_orders", raw)build_orders(con)orders = con.execute("SELECT * FROM orders").pl()check_orders(orders)tmp = path.with_suffix(".tmp")orders.write_parquet(tmp)tmp.replace(path) # atomic swap, so the app always sees a full filereturn path
Pick the refresh interval to match how fresh the data needs to be; hourly or nightly covers most analytics. Keep live queries for the pages that genuinely need up-to-the-minute data, and make sure those are filtered and parameterized at the source.
Data credentials
Data rarely lives in one place. A single app might read a warehouse, call another team's API, pick up files from S3 and use a spreadsheet someone exported last week, and each source can use a different pattern for credentials. These are the five we see:
Pattern
How it works
Use it when
Service accounts (recommended)
The app runs as a Kubernetes service account that IT maps to a cloud identity (workload identity, Dash Enterprise 6). The cloud issues short-lived tokens that refresh automatically
Your data is in a cloud warehouse or bucket and everyone who can open the app may see the same data. This is the most secure option
Admin-managed credentials
An admin creates a Data Source (Databricks, Snowflake, BigQuery, Redshift, S3, Azure Data Lake, SQL databases and more) or a global environment variable once, and links it to apps
The source doesn't support workload identity, and you want IT to own and rotate credentials centrally
OAuth (on behalf of the user)
The app queries the source as the signed-in user, so the source's own row and column permissions apply
Different users must see different data, and those rules already live upstream
User-managed credentials
The app's owner adds their own key, token or password as a secret environment variable in the app's settings, and the app reads it at runtime
Prototypes, or sources IT doesn't manage centrally, like a team's own SaaS API key. The owner is responsible for rotating it, so move to a service account or Data Source once the app matters
Flat files (no live connection)
Someone exports data from a source system as CSV, Excel or Parquet and uploads it, through an upload page in the app or to its persistent filesystem or S3. The pipeline reads the file like any other source
The source has no connection you can use, or a periodic snapshot is good enough. Show the file's date on every page so people know how fresh the numbers are, and run the same data checks on each upload
Service accounts are the most secure way to connect apps to data. With a service account, no secret ever changes hands, so there's no password or key file to paste into an environment variable, hand to a developer or leak from a repository. The credentials are also short-lived: the cloud provider issues tokens that typically expire within about an hour, and the platform refreshes them automatically, so a leaked token is soon useless and there's nothing to rotate. They work natively with the major clouds through AWS IAM roles for service accounts, Google Cloud's Workload Identity Federation for GKE and Microsoft Entra Workload ID on AKS, and Google's own documentation describes service account keys as a security risk and recommends workload identity instead. In Dash Enterprise, an admin allows a service account once, and the app owner then picks it in the app's settings. This is a big advantage of running Dash Enterprise in your own infrastructure: apps can use the patterns your cloud provider recommends, which most hosted app platforms don't offer. Our customers asked for features like this, and it's one of the reasons we're all in on software that runs in our customers' infrastructure.
Admin-managed global environment variables are the fallback for shared secrets. Apps can use them, but app developers and their coding agents never see the values, and when IT rotates one, every app picks up the new value.
The OAuth pattern keeps data permissions where they already are, but it changes how you handle caching. Each user's query results are different, so you can't build one shared Parquet cache for everyone; instead, cache per user or per permission group, or query live with tight filters.
App patterns
Separate pages with clear URLs
Rather than putting everything on one page, use Dash Pages to give each view its own page and URL, and let people drill down by following links, from the overview to a region and from a region to an account. People can then bookmark and share any view, and agents can open and screenshot any page directly. Each page also stays far less cluttered than an old-school BI dashboard that packs all of its drill-down logic into one view.
Prompt
Add a page for each region at /region/<region>, linked from the regiontable on the overview. Show year-to-date KPIs against the same periodlast year, revenue by month and category, and the top accounts, eachlinking to /account/<account_id>.
This will result in code that looks like this:
# pages/region.pydash.register_page(__name__, path_template="/region/<region>", name="Region")def layout(region="West", **_):df = load_orders().filter(pl.col("region") == region)ytd = metrics.filter_period(df, date(2026, 1, 1), date(2026, 9, 30))py = metrics.filter_period(df, date(2025, 1, 1), date(2025, 9, 30))growth = metrics.net_revenue(ytd) / metrics.net_revenue(py) - 1return html.Div([html.H1(f"{region} region"),html.Div(className="kpis", children=[theme.kpi("Net revenue YTD", theme.money(metrics.net_revenue(ytd)), f"{growth:+.1%} vs 2025 YTD"),theme.kpi("Gross margin", theme.pct(metrics.gross_margin(ytd))),]),theme.card(theme.graph(revenue_by_month_and_category(df))),theme.card(top_accounts_grid(ytd), title="Top accounts, year to date"),])
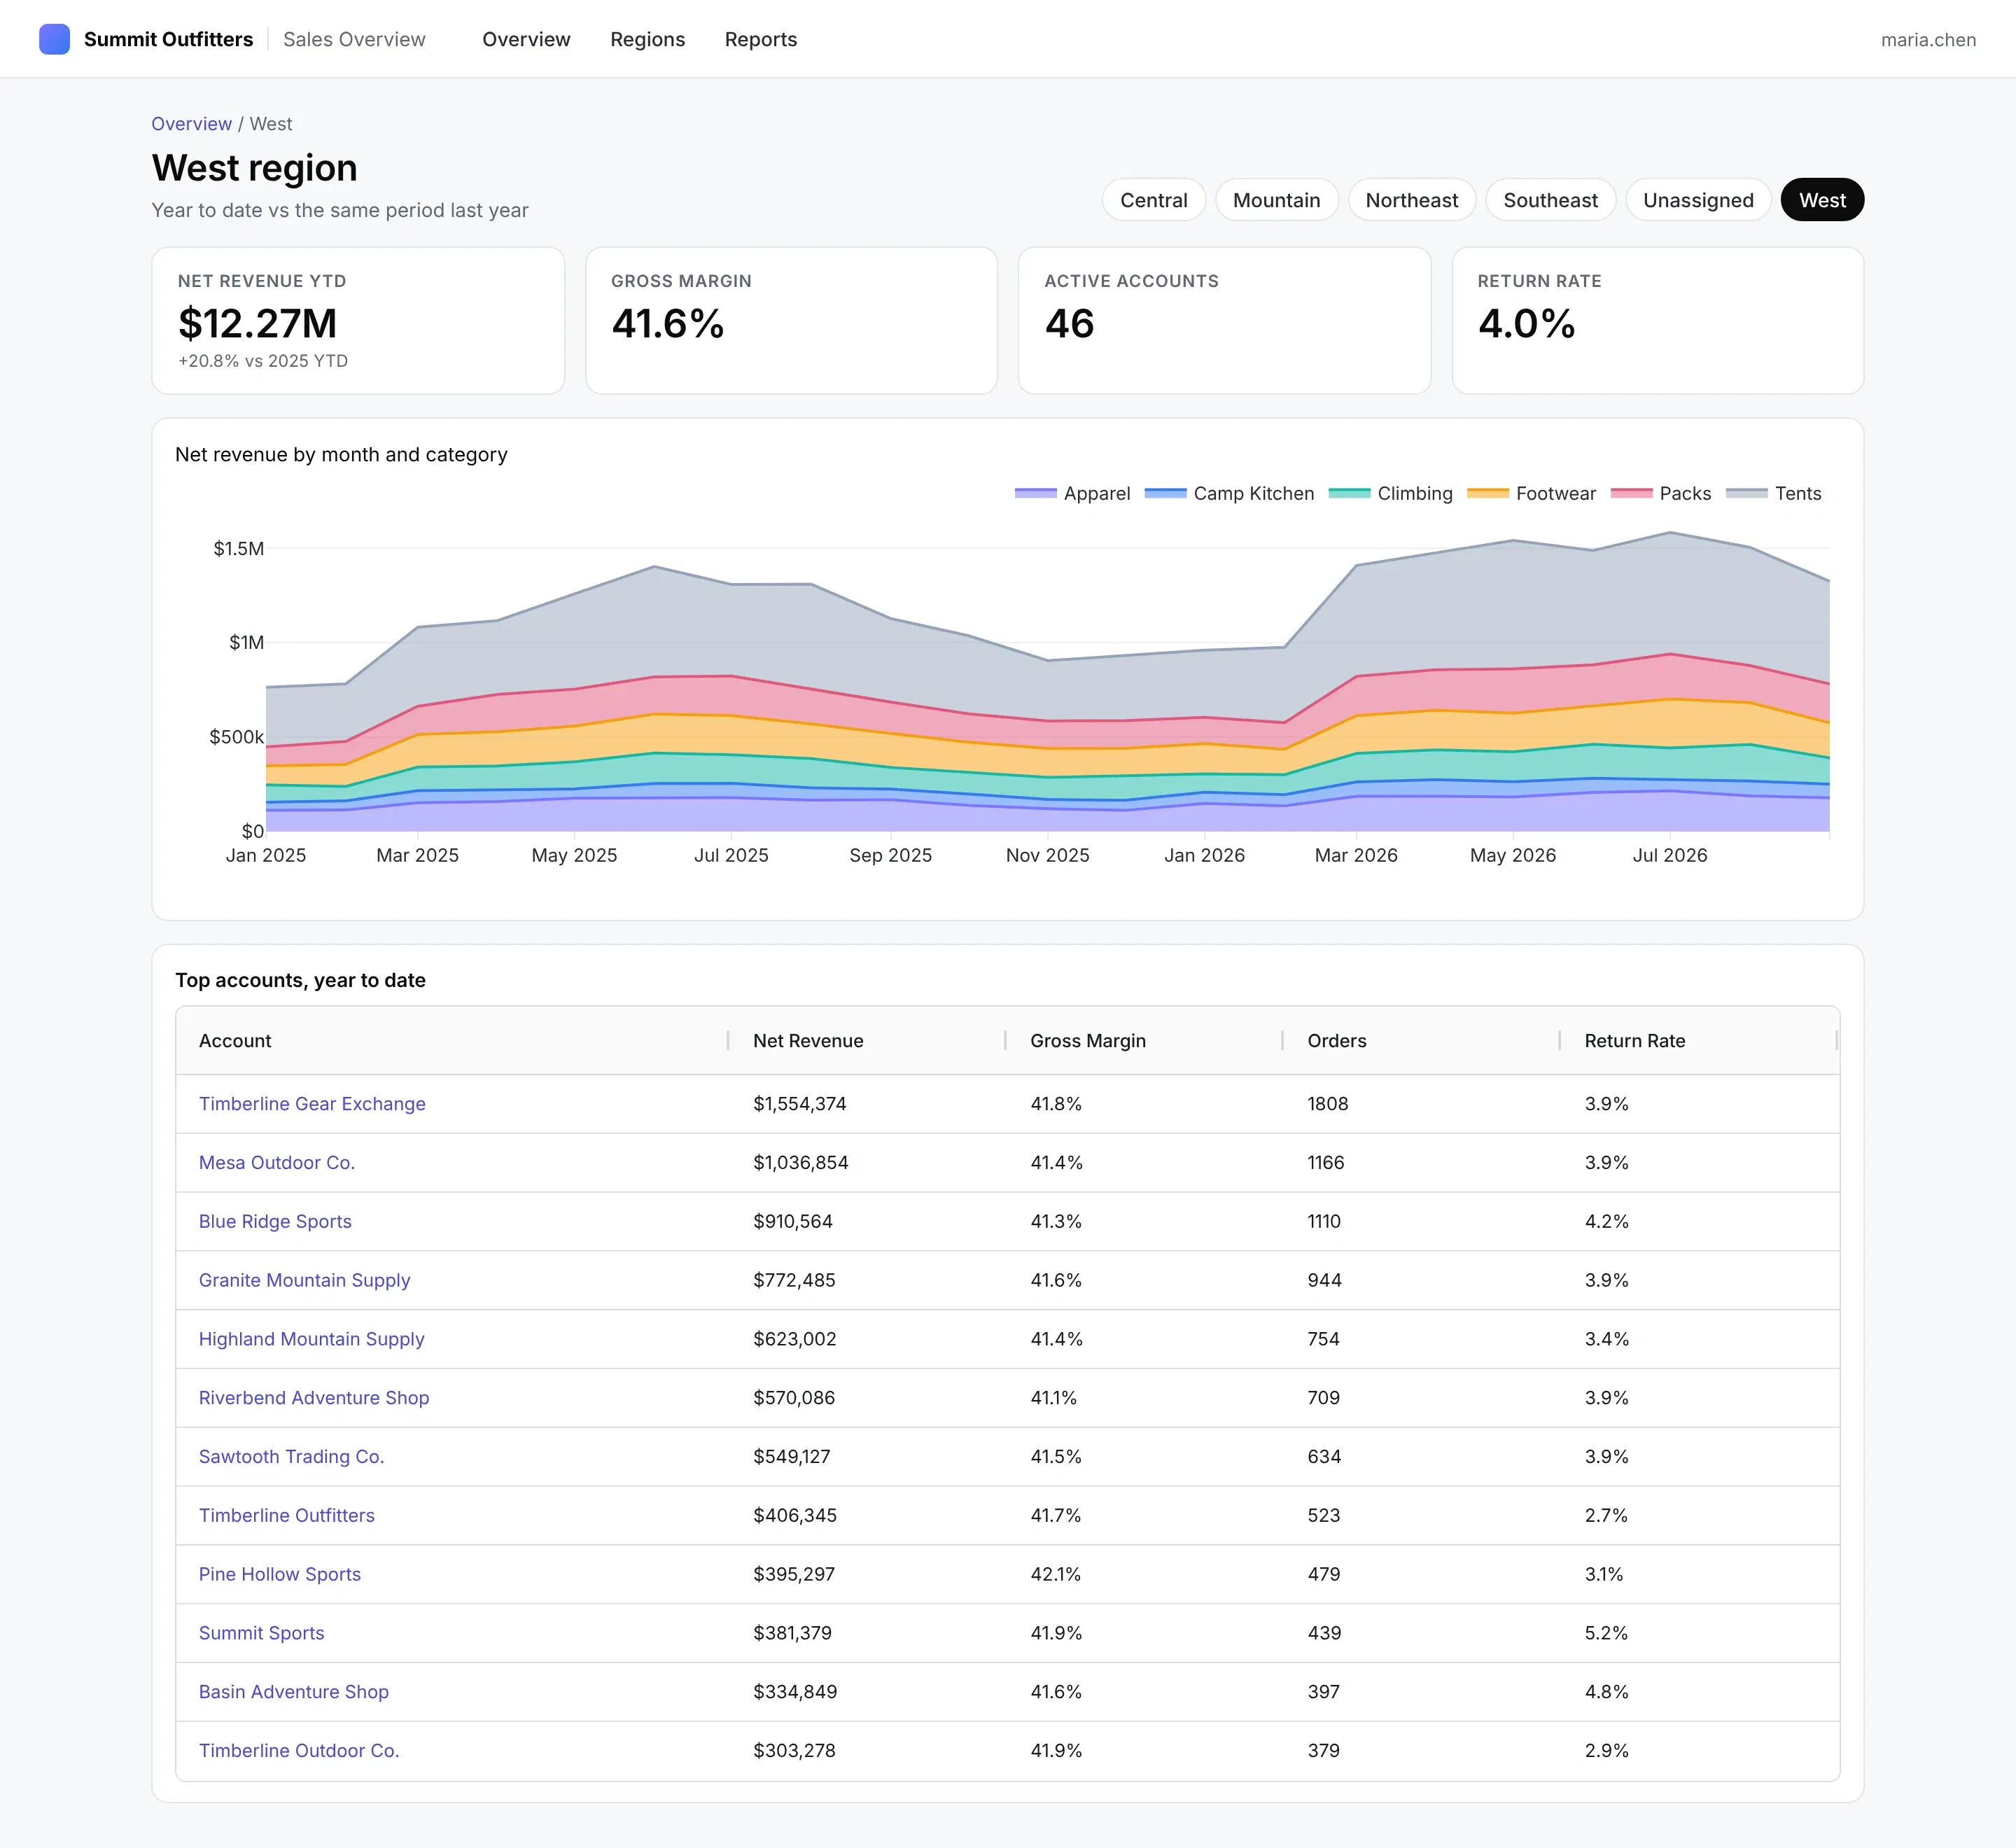
A region drill-down page, opened by following a link from the overview.
Saved views and reports in Postgres
Dash Enterprise can attach a managed Postgres database to any app from its Services tab (or from the Dash Enterprise CLI with de services create --type postgres), and the app reads the connection string from DATABASE_URL. It's the right place for anything users create and want to keep, such as saved filter views, bookmarked reports, annotations or a "New report" builder.
Prompt
Let people save the overview's current filters as a named view and loadsaved views from a dropdown. Store them in Postgres using DATABASE_URL,with the owner's username, and fall back to SQLite locally.
This will result in code that looks like this:
# shared/views.pyengine = sa.create_engine(os.environ.get("DATABASE_URL", "sqlite:///data/app_state.db"))saved_views = sa.Table("saved_views", meta,sa.Column("id", sa.Integer, primary_key=True, autoincrement=True),sa.Column("owner", sa.String(200), nullable=False),sa.Column("name", sa.String(200), nullable=False),sa.Column("page", sa.String(200), nullable=False),sa.Column("filters", sa.JSON, nullable=False),sa.Column("created_at", sa.DateTime(timezone=True), nullable=False),)def save_view(owner: str, name: str, page: str, filters: dict) -> None:with engine.begin() as con:con.execute(saved_views.insert().values(owner=owner, name=name, page=page, filters=filters,created_at=datetime.now(timezone.utc)))
Forms instead of editable grids for CRUD apps
Many internal apps exist to edit records, whether that's approving requests, correcting master data or logging inspections. These are often called CRUD apps, for create, read, update and delete. It's tempting to make a spreadsheet-like grid editable, but forms make the interaction much clearer. We recommend showing records in a read-only list and giving each record its own form page at its own URL, like /requests/RR-7410. A form page has room for the things a grid handles poorly: validation with error messages next to the field, a loading state while saving, a confirmation, and the context someone needs to make the decision, like the order details, the account's history and an audit trail.
On the server, write through one function per action that validates the input and records who changed what, and give the app only the write access it needs. When the app owns the records, the managed Postgres database that comes with every Dash Enterprise app is the natural place to keep them; when another system is the source of truth, write back to it through the same kind of function.
Prompt
Build a Returns Desk app. The home page is a read-only list of returnrequests where each request ID links to /requests/<id>. That page showsthe order and account context next to a form with an outcome (approve,reject, needs info) and a note to the dealer. Require a note whenrejecting. Show errors next to the field, disable the button whilesaving, and record every decision in an audit log with the user andtime.
This will result in code that looks like this:
# shared/returns_db.py: the only write pathdef validate(new_status, note) -> dict[str, str]:"""Return {field: message} for every problem with a decision."""errors = {}if new_status not in STATUSES or new_status == "Pending":errors["status"] = "Choose Approve, Reject or Needs info."if new_status in ("Rejected", "Needs info") and len((note or "").strip()) < 10:errors["note"] = "Tell the dealer why, in at least 10 characters. They see this note."return errors# pages/request.py@callback(Output("rq-status-err", "children"), Output("rq-note-err", "children"),Output("rq-result", "children"), Output("rq-history", "children"),Input("rq-save", "n_clicks"),State("rq-id", "data"), State("rq-status", "value"), State("rq-note", "value"),running=[(Output("rq-save", "disabled"), True, False)], # loading stateprevent_initial_call=True,)def save(_, request_id, status, note):errors = validate(status, note)if errors:return errors.get("status", ""), errors.get("note", ""), None, no_updatedecide(request_id, status, current_user(), note or "") # validates again and writes the audit logreturn "", "", html.Div(f"Saved. {request_id} is now {status}.", className="alert alert-ok"), history(request_id)
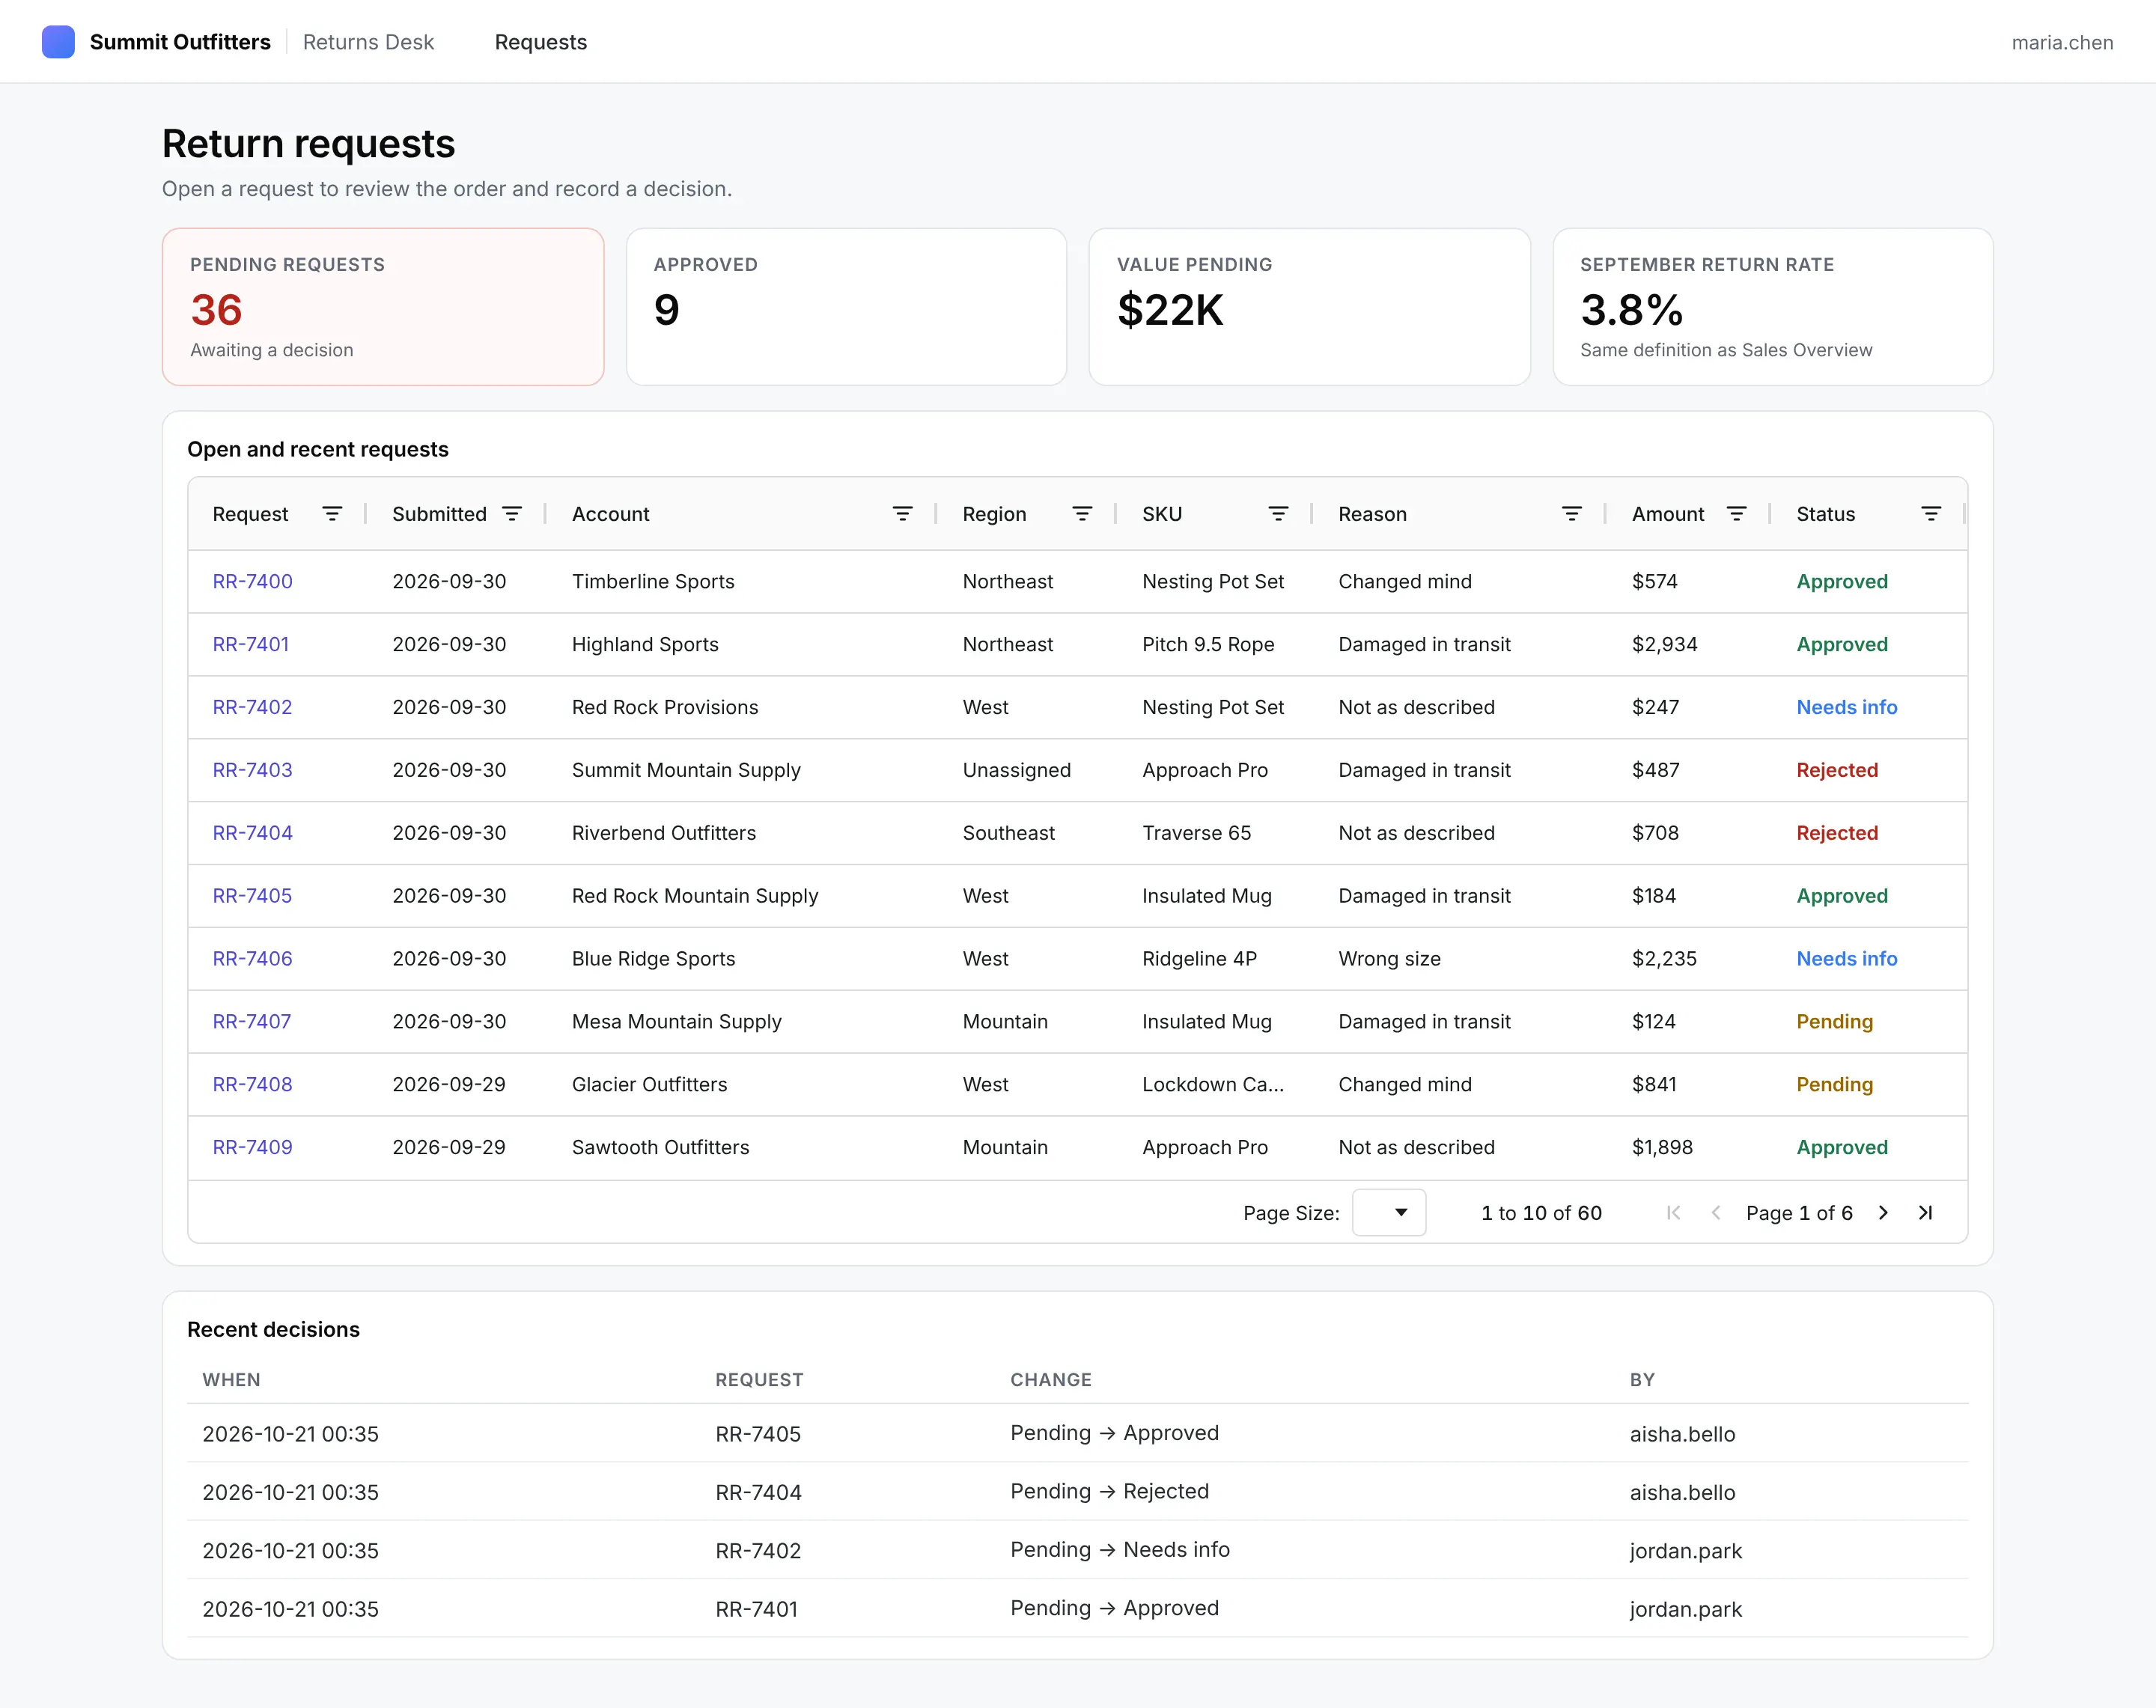
The Returns Desk lists requests read-only; each one opens its own form page.
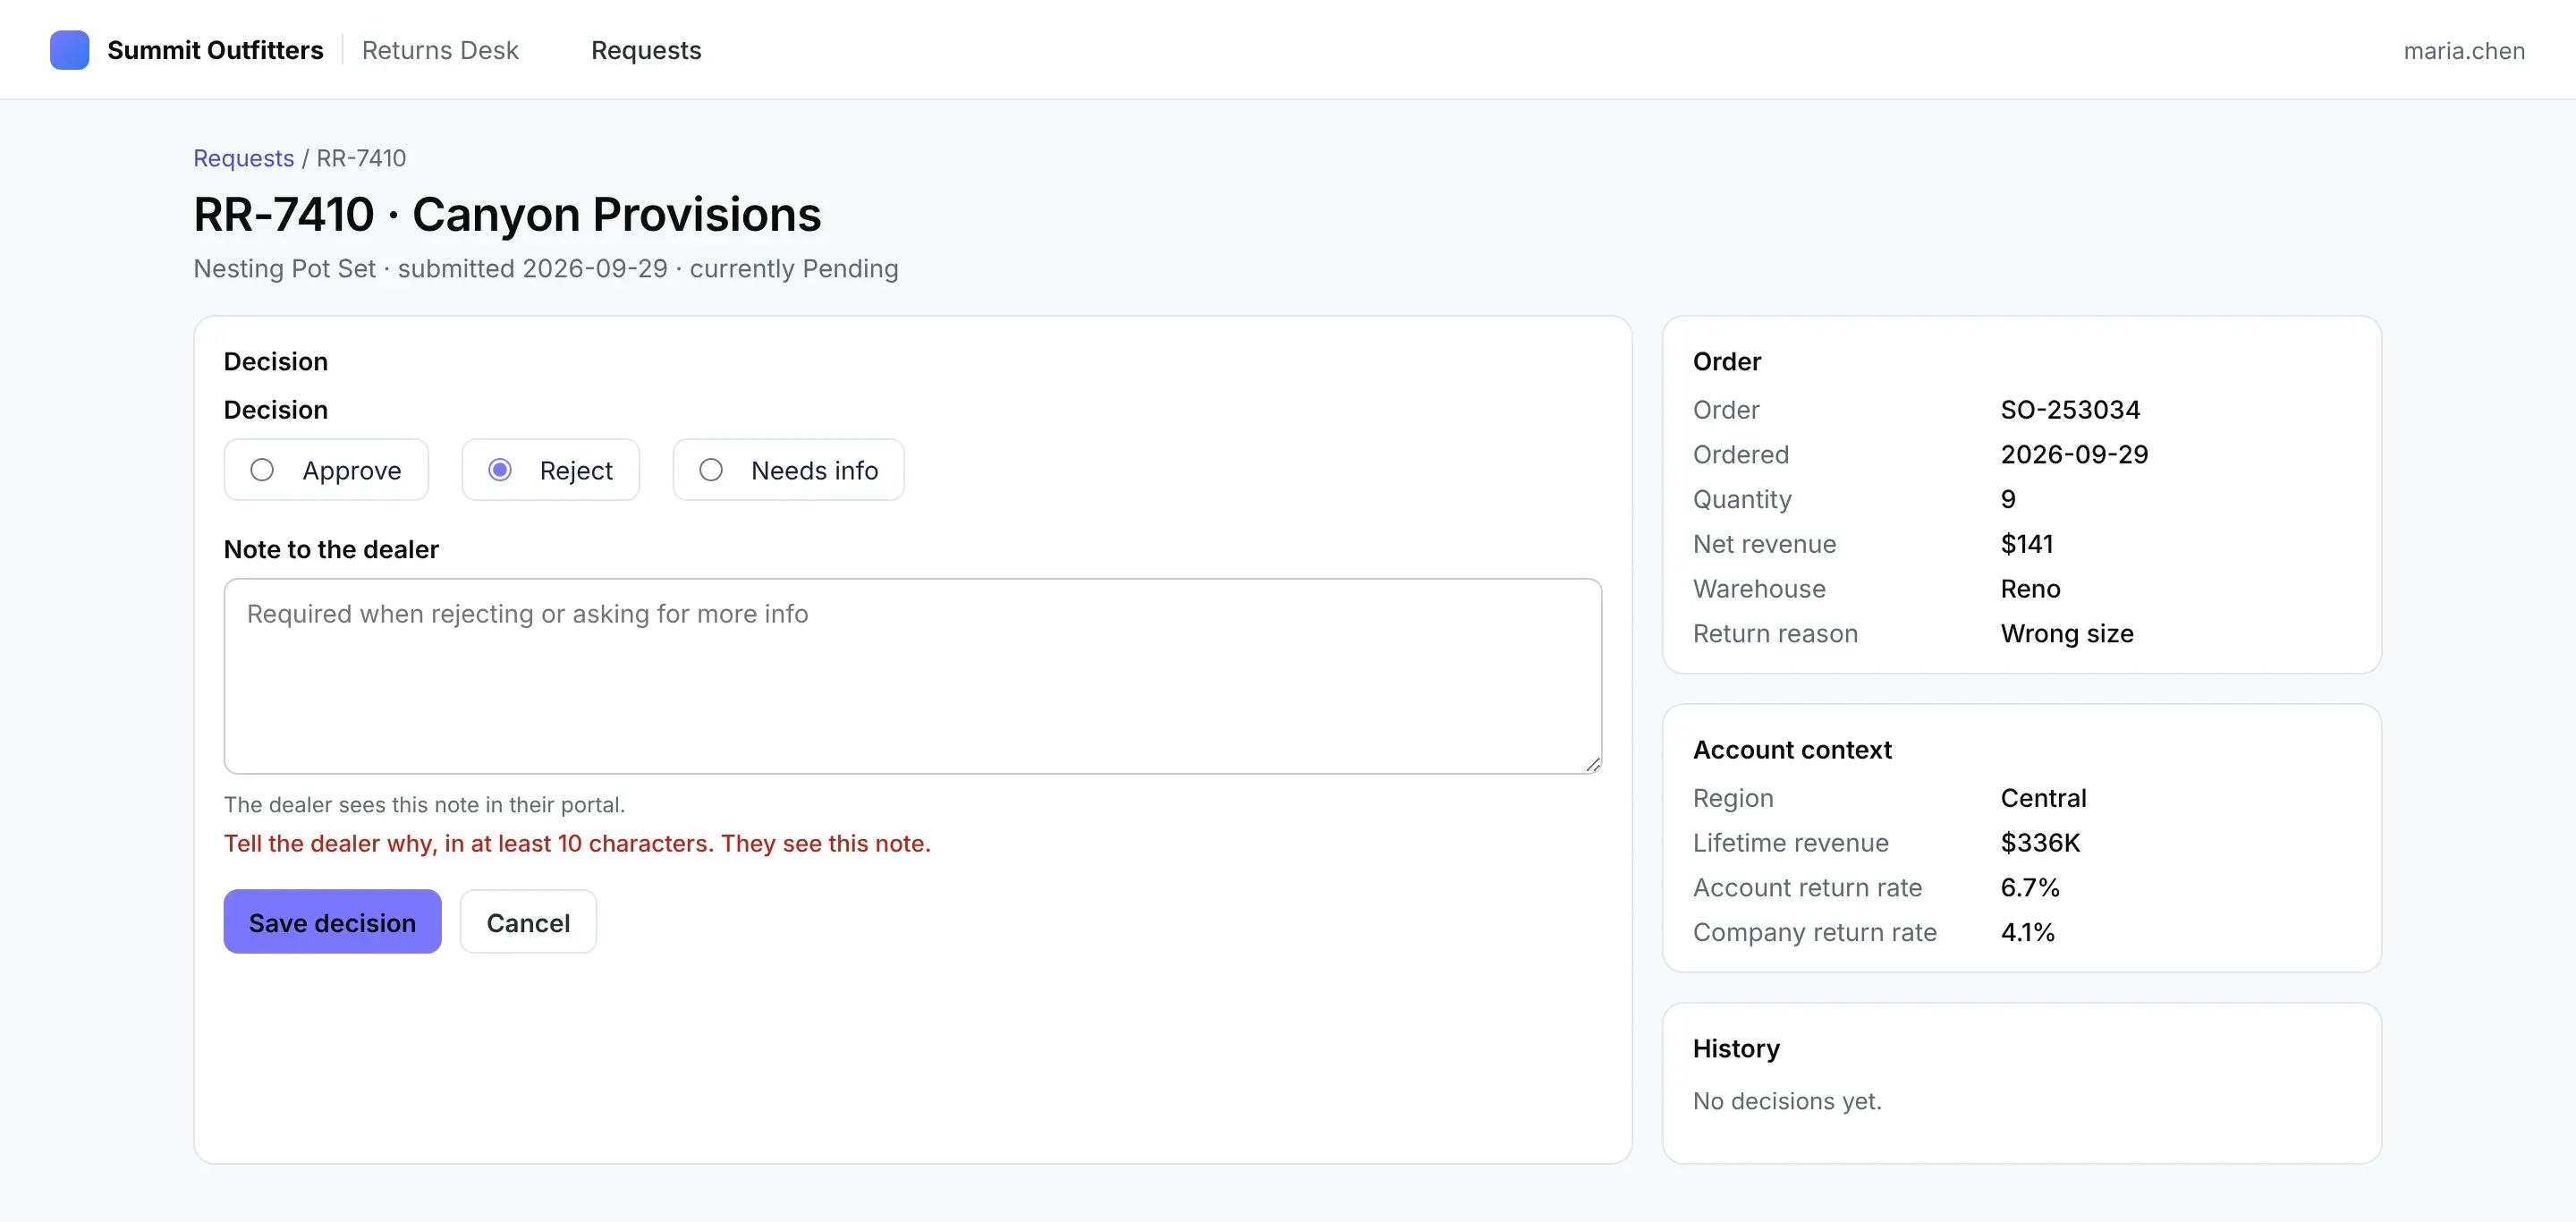
Validation errors appear next to the field, with the context needed to make the decision.
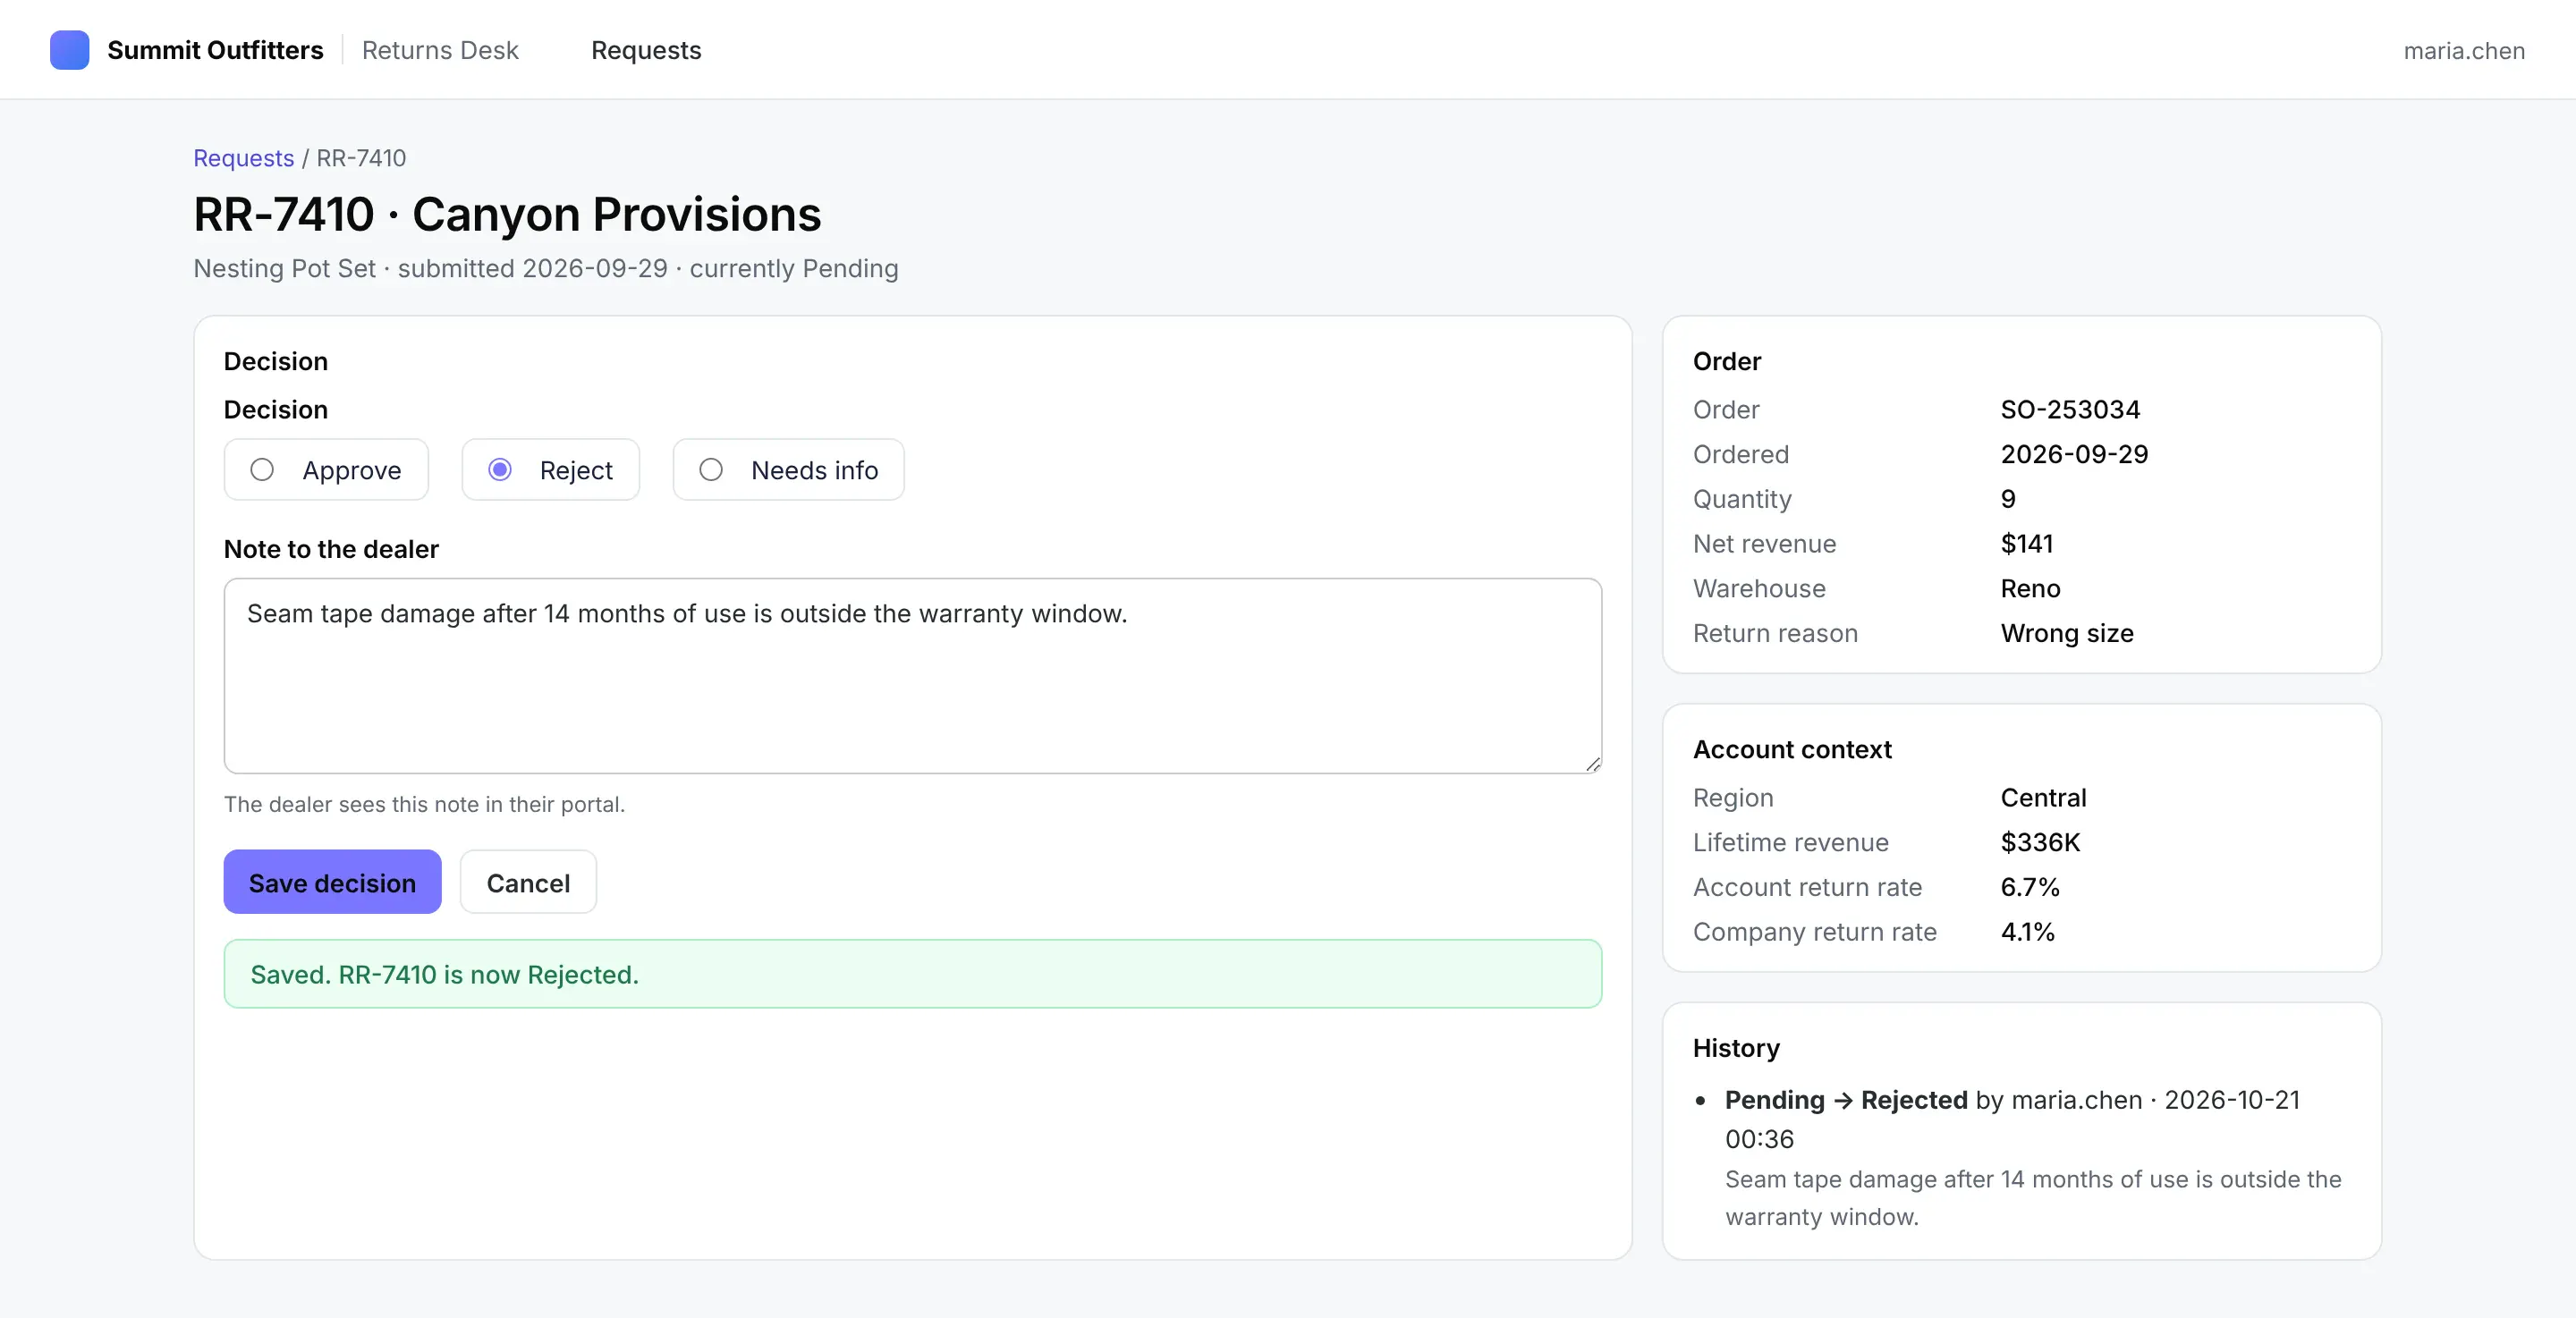
After saving, the form confirms the decision and the audit log records who changed what.
APIs and MCP endpoints
Logic written once in a Python module can serve the browser interface, an MCP tool and a REST endpoint. Add a Flask route on app.server for scripts and other systems, and turn on Dash MCP for AI assistants.
Prompt
Expose regional revenue for a month as an MCP tool and as a RESTendpoint at /api/regional-revenue/<month>. Both should callmetrics.revenue_by_region. Don't expose any other callbacks over MCP.
This will result in code that looks like this:
app = Dash(__name__, use_pages=True, enable_mcp=True)configure_mcp_server(include_callbacks=False, include_layout=False) # only what we decorate@mcp_enabled(expose_docstring=True)def regional_revenue(month: str) -> list[dict]:"""Certified net revenue, gross margin and order count by region for one month.`month` is YYYY-MM, for example 2026-03."""return metrics.revenue_by_region(month)@app.server.route("/api/regional-revenue/<month>")def regional_revenue_api(month):return {"month": month, "data": metrics.revenue_by_region(month)}
See 5 MCP server examples you can build in Python for more patterns.
Charts your users already know
Plotly graphs are powerful, and with a coding agent they can produce visualizations you'd rarely attempt by hand in a BI tool. Most teams stop at bar and line charts, but your users work in specific domains, and those domains often have one chart everybody in the field already knows how to read: a Kaplan-Meier curve in a clinical trial, a well log in petrophysics, a wafer bin map in a fab, or a yield curve on a fixed income desk. Ask the agent for the chart your users would recognize.
Here are a few collections, all made with coding agents and Plotly:
- A Compendium of Canonical Charts has around 70 domain-specific charts, including Skew-T diagrams for meteorology, Smith charts for RF engineering, control charts and Pareto charts for manufacturing, volcano plots for genomics, Piper diagrams for hydrogeology, order-book depth charts for trading, Marey diagrams for rail and a 3D LiDAR point cloud.
- Plotly for Highly Customizable Print-Ready Data Visualization covers data journalism and publication figures, such as climate spirals, Minard's map, Nightingale's rose, small multiples, a journal figure, a forest plot, a 3D terrain surface, a ball-and-stick molecule and a 139,000-point city map.
- 19 extraordinary charts made with Opus 5.5 and Plotly goes further, with a Circos genome plot, a radial dendrogram, a horizon chart, an airport Voronoi map, a topographic map and an xkcd-style chart.
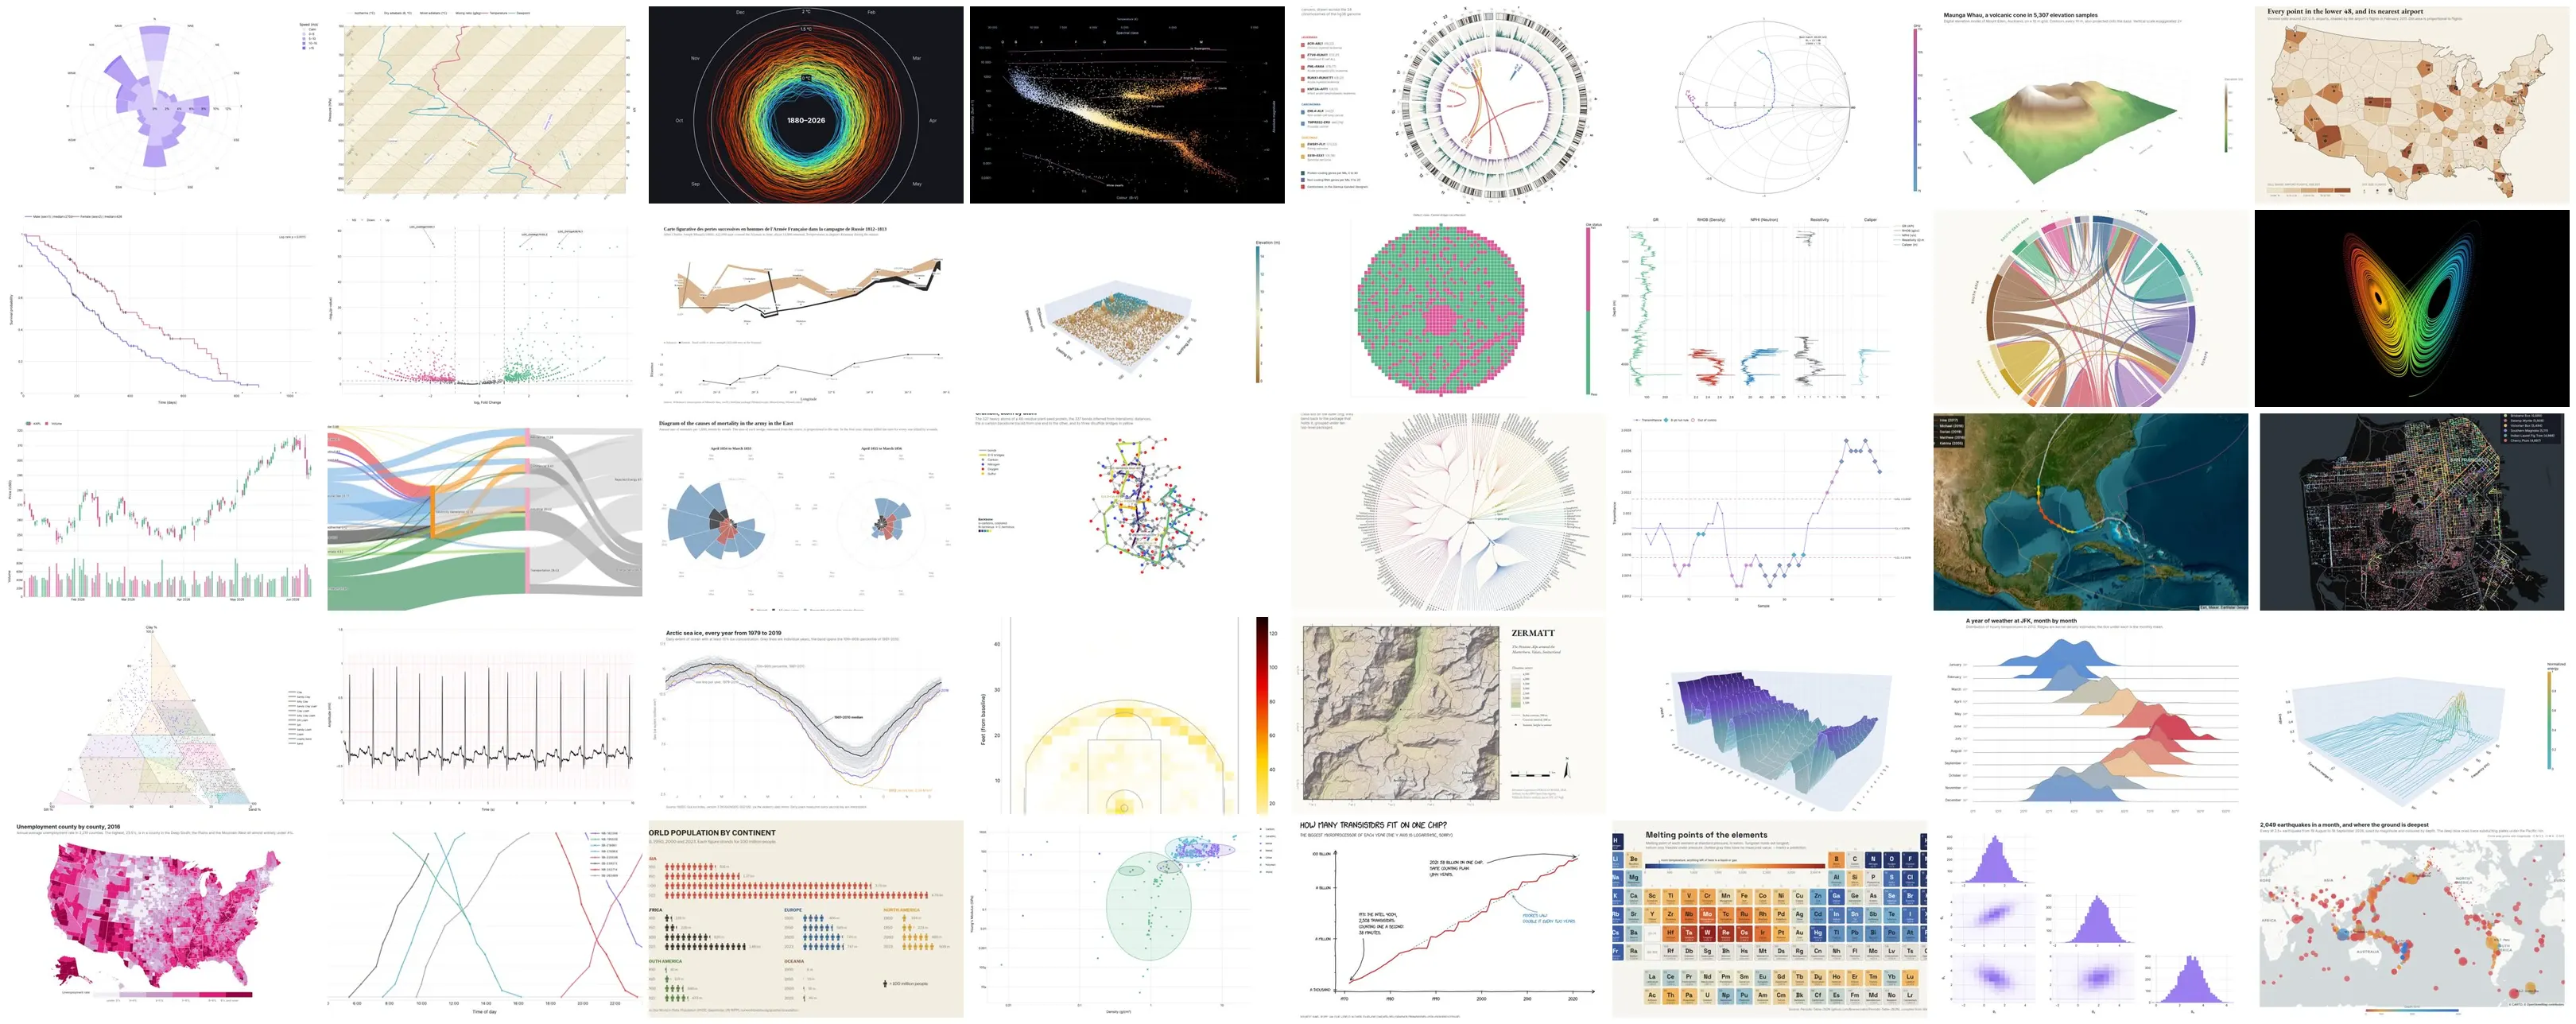
In your prompt, name the chart and describe what should stand out. The agent knows the conventions of most fields, and it can screenshot the result and refine it until it reads well. For example, to keep an eye on the Ridgeline 2P tent from the returns report:
Prompt
Add a Quality page to the Returns Desk with a control chart of theRidgeline 2P tent's weekly return rate. Use a p-chart with 3-sigmalimits from 2025, mark every week above the upper limit in red, andannotate the worst one with its date and top return reason.
This will result in a page like this:
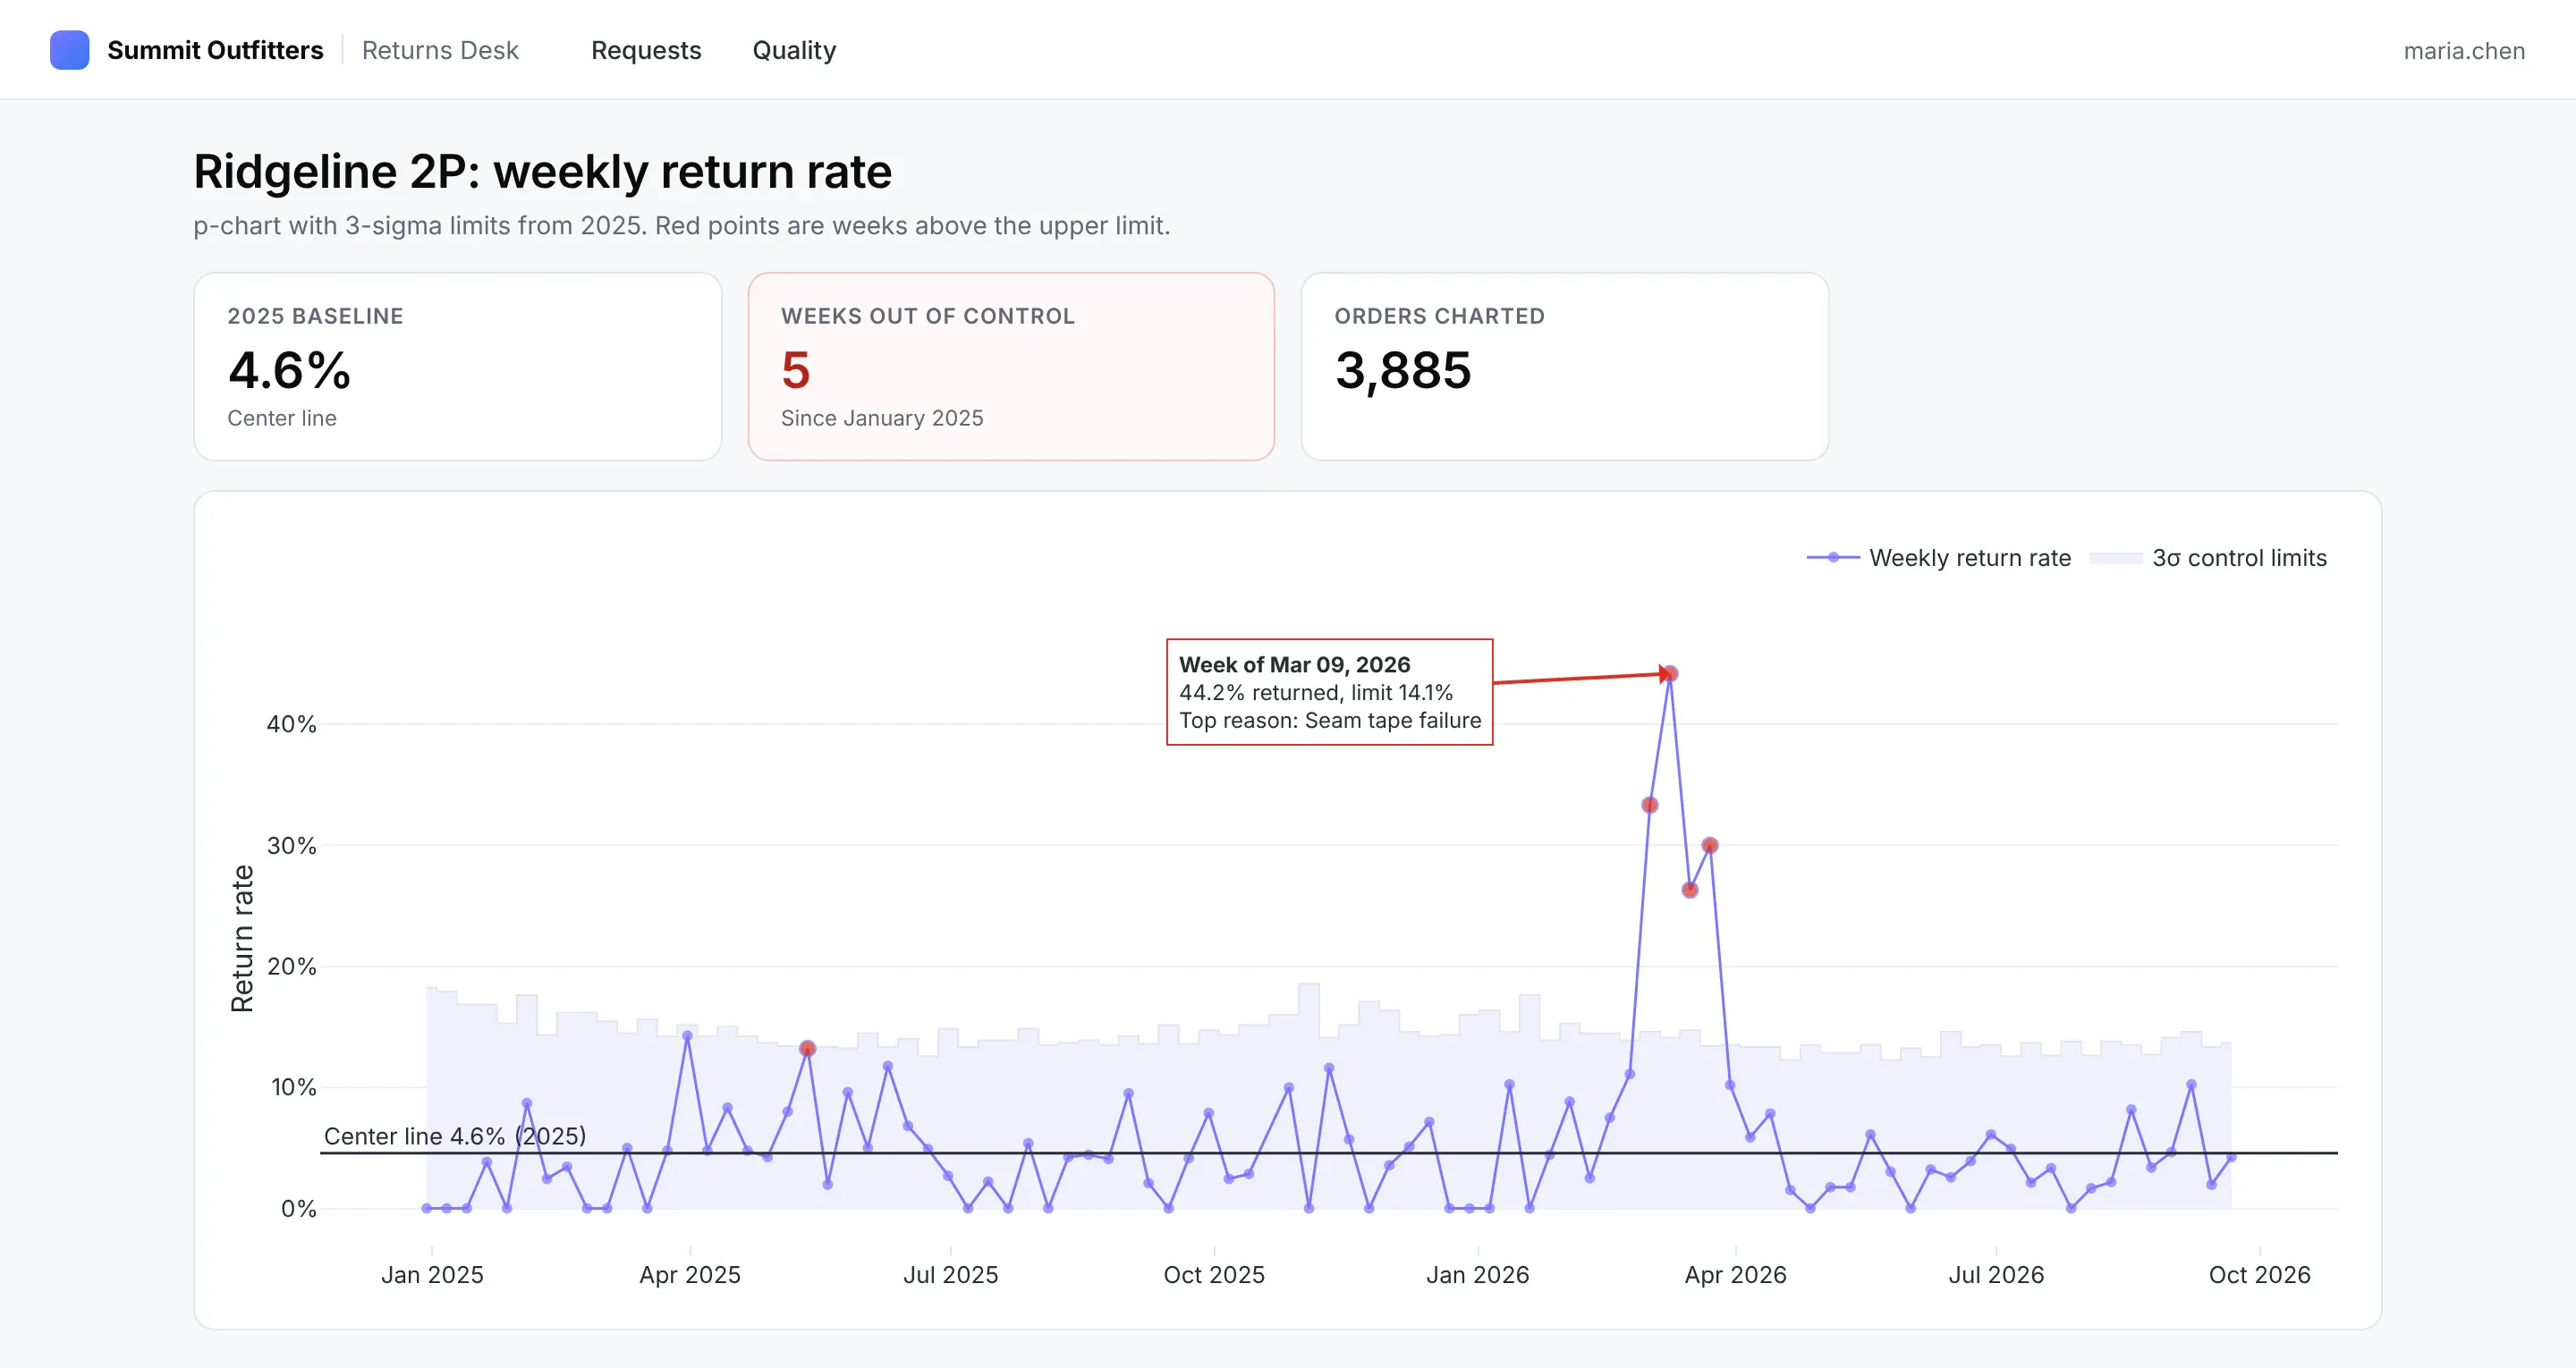
A control chart the agent added to the Returns Desk, with out-of-control weeks marked in red.
One repository with shared definitions
A monorepo when apps share definitions
When several apps share data sources, metric definitions or context, we recommend putting them in one repository (a monorepo), with every app importing from a shared/ folder. When finance changes the definition of net revenue, the change happens in one file, gets reviewed once, and every app picks it up on its next deploy.
analytics/AGENTS.md # leadership's standards for every changeRECOMMENDATIONS.md # this guide, for people and agentsdocs/semantics/metrics.md # what each metric means, who owns itglossary.md # business termsdata-sources.md # where data comes from and its known quirksshared/pipeline.py # cleaning and derived tableschecks.py # data checksmetrics.py # metric definitions (the semantic layer)observability.py # structured loggingtheme.py, assets/ # shared look and feelapps/sales_overview/returns_desk/tests/
Dash Enterprise's GitHub integration deploys one app per repository and doesn't support apps in subfolders. For a monorepo, deploy each app from CI with the Dash Enterprise CLI (de) instead: the CI job copies shared/ into the app's folder (or installs it as a package from your private registry) and runs de deploy for each app that changed.
Your semantic layer is code, plus a few markdown files
A semantic layer is the set of agreed business definitions, like what counts as revenue or an active customer, that every report should use. You may not need a separate product for it. Metric definitions written as Python functions are versioned, tested, reviewed and readable by both people and agents, and every page, report, MCP tool and API endpoint can call them.
# shared/metrics.py"""Certified metric definitions. Owner: Finance Analytics.Change a definition only through a reviewed pull request."""def net_revenue(df: pl.DataFrame) -> float:"""Gross amount minus discounts, shipped orders only."""return float(df["net_revenue"].sum())def gross_margin(df: pl.DataFrame) -> float:"""(Net revenue - cost) / net revenue."""rev = net_revenue(df)return float(df["gross_profit"].sum()) / rev if rev else 0.0def return_rate(df: pl.DataFrame) -> float:"""Share of shipped orders that were returned."""return float(df["returned"].mean()) if df.height else 0.0
The business context that code can't express, such as what each metric means, who owns it, the glossary, and where each data source comes from along with its known quirks, goes in plain markdown files next to the code. These are written for people and read by agents, and they stay accurate as models change. If your company already has a semantic layer, like dbt metrics or Cube, keep it; the apps can call it from shared/ like any other source.
AGENTS.md for leadership's standards
AGENTS.md is a file at the root of a repository that coding agents read before they start work. We'd avoid using it to describe the repository. Coding agents are very good at reading a codebase and figuring out how it's organized, and a file that describes the code goes stale as the code changes. Instructions written to work around a particular model's weaknesses go stale too, usually within a few months, as new models come out.
Instead, use AGENTS.md for the decisions leadership has made and wants applied to every change, such as quality standards, review rules, how data may be written, security requirements, and conventions for reports and pages. Those stay relevant whichever model or agent your tool builders use.
# AGENTS.mdStandards for everyone who changes this repository, people and coding agents alike.## Numbers- Every metric comes from shared/metrics.py. Never compute revenue, margin or returnrate inline in a page, a report or an MCP tool.- Changing a metric definition needs approval from Finance Analytics in the pull request.## Changes- Every change goes through a pull request with a review app and before/after screenshots.- Add or update tests with every change. pytest must pass, including the data checks.## Writing data- Use a form on its own page to edit a record, with field-level validation and a loadingstate. Don't edit records in a grid. Every write records who made it and when.## Security- No credentials in code. Apps use service accounts or admin-managed Data Sources.- MCP tools are opt-in with @mcp_enabled.
Letting the agent work in a loop
Most of the speedup from coding agents comes from letting them check their own work. The more the agent can run, see and verify for itself, the longer it can work without you. These are the pieces we set up for that.
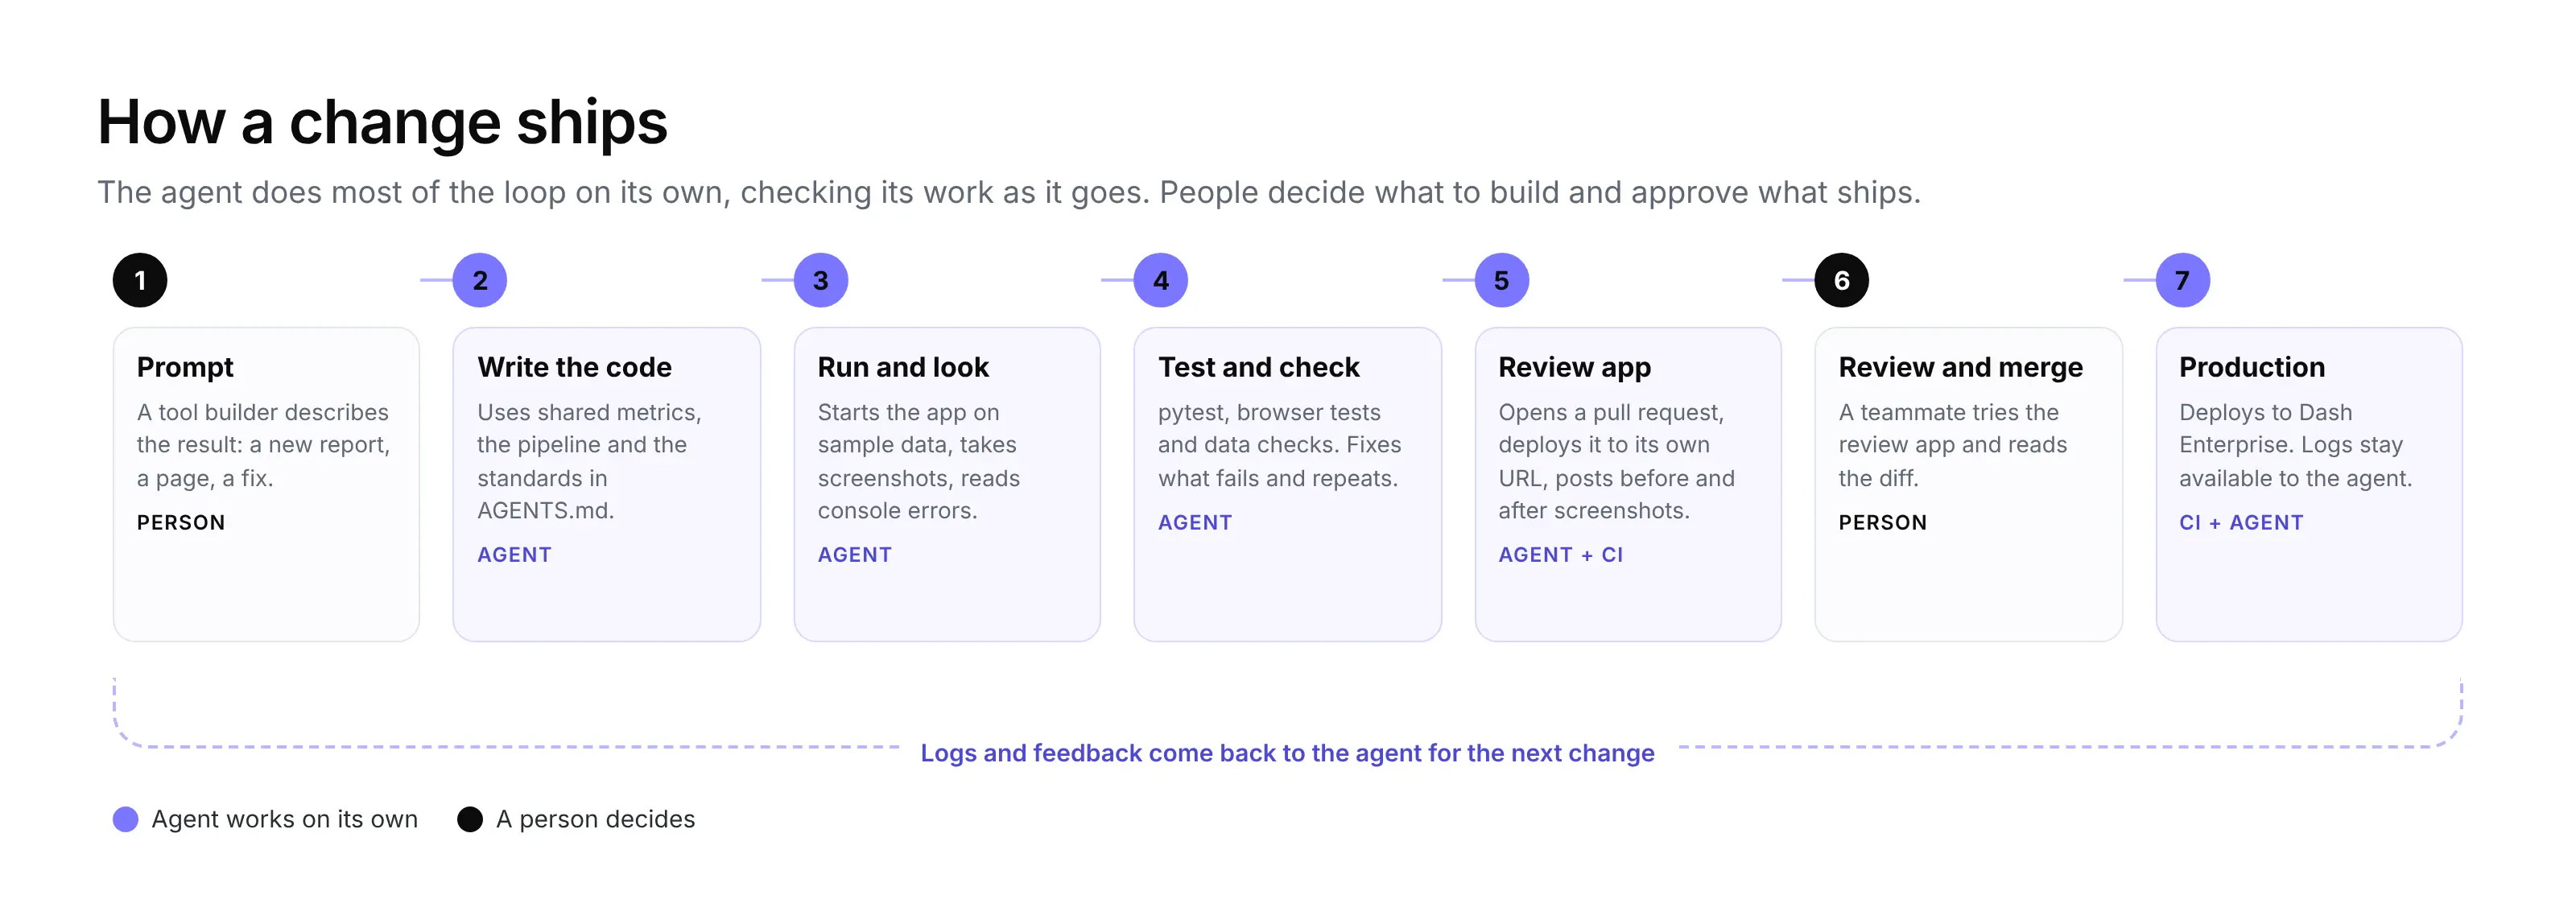
Review apps
A review app is a temporary copy of an app, deployed from a pull request at its own URL, so people can try a change before it reaches production. We recommend deploying one for every pull request.
Prompt
Set up a CI pipeline for the apps in this repository on our DashEnterprise server at dash.yourco.com, using the Dash Enterprise CLI(https://dash.plotly.com/dash-enterprise/cli). Sign in as a DashEnterprise service user whose credentials are stored asDASH_ENTERPRISE_USERNAME and DASH_ENTERPRISE_PASSWORD secrets, using--no-keyfile. On every pull request, run pytest and the browser testsfor each app that changed. If they pass, deploy a review app named<app>-pr-<number>, wait until it's built, and post its URL on the pullrequest. If the build fails, post the build logs instead. Give thereview app the same viewers as production. Take before and afterscreenshots of the main pages and add them to the pull request. Deletethe review app when the pull request closes.
Review apps rely on deploys from the Dash Enterprise CLI. If your server uses the GitHub integration, de deploy isn't available, so production deploys come from merges and review apps need a different setup. Talk to your Plotly contact about which fits your team.
Screenshots
Give the agent a headless browser, such as Playwright or a browser MCP server, so it can run the app, load each page, take screenshots, click through flows and read the browser console. Most layout bugs and broken callbacks show up in a screenshot or a console error long before a person would notice them. Every screenshot in this post was taken that way, by the same agent that built the apps, and along the way it caught and fixed a crashed form page and an unsorted table.
Prompt
Write scripts/screenshots.py that opens each page of the app in aheadless browser at 1440px wide, saves a full-page screenshot, and failsif the browser console shows any errors.
Sample data for development
Make every app run without production credentials by falling back to a small, realistic sample dataset when a connection isn't configured. Agents can then build and test anywhere, including in sandboxes with no network access, and you point the app at real data once it's deployed. It helps to make the sample realistic, problems included; our demo data has test orders, missing regions and a returns spike, so the pipeline, checks and reports have something real to catch.
Data checks
Upstream schemas change without warning, so add checks that run on every refresh and in CI, using Great Expectations, Pandera or plain assertions, to confirm the expected columns, types, row counts, null rates and value ranges. When a check fails, the refresh stops and the app keeps serving the last good data, rather than quietly showing wrong numbers.
Prompt
Add data checks in shared/checks.py that run before the cache iswritten: every expected column is present with the right type, there areat least 10,000 rows, and no more than 5% of orders have no region.Raise a clear error if a check fails, and add a test that a missingcolumn is caught.
This will result in code that looks like this:
def check_raw(df: pl.DataFrame) -> None:for col, dtype in RAW_COLUMNS.items():if col not in df.columns:_fail(f"raw_orders is missing column {col!r}")if df.schema[col] != dtype:_fail(f"raw_orders.{col} is {df.schema[col]}, expected {dtype}")if df.height < 10_000:_fail(f"raw_orders has only {df.height} rows; the extract is probably incomplete")null_region = df["region"].null_count() / df.heightif null_region > 0.05:_fail(f"{null_region:.1%} of orders have no region (threshold 5%)")
Tests
Ask the agent to write tests with every change. Metric definitions and pipeline steps get ordinary pytest tests, and browser tests check that pages load without console errors. Tests are what make it safe to let agents make larger changes.
def test_regional_revenue_ties_to_total():rows = metrics.revenue_by_region("2026-03")march = metrics.filter_period(load_orders(), date(2026, 3, 1), date(2026, 3, 31))assert sum(r["net_revenue"] for r in rows) == pytest.approx(metrics.net_revenue(march), abs=1)
Logs agents can read
One of the best things about working with coding agents is that they can watch an app run and fix problems on their own, but that only works if the app tells them what's happening. We recommend adding structured logging from day one, writing one JSON line per event that covers who accessed what, slow requests, memory, unhandled exceptions with full tracebacks, data refreshes and changes in the shape of the source data.
Prompt
Add structured JSON logging to both apps in shared/observability.py. Logevery page view and callback with the user, path, status and duration;log slow requests with memory usage; log unhandled exceptions with thefull traceback and the request that caused them; and log each datarefresh, failed data checks and any schema drift in the source data.
This will result in code that looks like this:
# shared/observability.pydef setup(app, user_fn, slow_ms=1000):server = app.server@server.after_requestdef _access(resp):ms = round((time.perf_counter() - g.t0) * 1000)fields = {"path": request.path, "status": resp.status_code, "ms": ms, "user": user_fn()}event("access", **fields)if ms > slow_ms:event("slow_request", logging.WARNING, memory_mb=memory_mb(), **fields)return resp@server.errorhandler(Exception)def _unhandled(e):event("unhandled_exception", logging.ERROR, exc_info=sys.exc_info(),path=request.path, user=user_fn(), memory_mb=memory_mb())raise e# shared/pipeline.pydrift = schema_drift(raw)if drift: # new, missing or retyped columns upstreamevent("schema_drift", logging.WARNING, **drift)
The logs look like this, which makes them easy for both people and agents to filter:
{"ts": 1792543214.89, "level": "INFO", "event": "startup", "app": "Sales Overview", "memory_mb": 153.0}{"ts": 1792543214.94, "level": "INFO", "event": "access", "path": "/api/regional-revenue/2026-03", "status": 200, "ms": 36, "user": "maria.chen"}{"ts": 1792543301.12, "level": "WARNING", "event": "schema_drift", "missing": [], "added": ["promo_code"], "retyped": {"quantity": "Int64 -> Float64"}}
With the Dash Enterprise CLI, an agent can read these logs directly with de apps logs --type runtime (and --type build for failed deploys), find the cause and fix it in the same session. Logs are kept for seven days, so you can also set up an agent to run on a daily or weekly schedule, check the logs for errors and slow pages, and propose fixes, or look through them yourself.
Migrating from BI tools
Coding agents are good at recreating existing dashboards. You can take screenshots of a Tableau, Power BI or Looker dashboard and ask the agent to rebuild it in Dash, usually with a cleaner and more modern design. If you have the source files, agents can read those too: Tableau workbooks (.twb) are XML, and Power BI projects saved in the PBIP format store the data model and measures as text, so an agent can translate calculated fields and DAX measures into Python.
Prompt
Here are screenshots of our Regional Sales dashboard in Power BI and thePBIP project folder. Rebuild it as pages in apps/sales_overview usingthe metrics in shared/metrics.py. Translate any DAX measure that isn'talready defined there into a new function in shared/metrics.py with adocstring. Match the numbers: write a test that compares each KPIagainst the values in the screenshots for March 2026. Use our theme fromshared/theme.py.
We'd start with the dashboards people complain about most, or the ones that need features BI tools struggle with, like editing records or complex calculations. Running the old and new versions side by side for a few weeks is the easiest way to build trust in the numbers.
Your first 30 days
When
What
Week 1
IT installs Dash Enterprise, connects SSO and the package registry, and sets up service accounts or Data Sources for one or two systems
Week 2
Pick three to five tool builders. Give them a coding agent, a monorepo with AGENTS.md, RECOMMENDATIONS.md and shared/, and access to the dev environment
Weeks 3 and 4
Each tool builder ships one app their team asked for, with tests, review apps, logging and a Reports page. Migrate one BI dashboard
Day 30
Review usage, collect feedback, and decide which teams get tool builders next
Summary
Coding agents have made code the fastest way to build internal apps, and Dash Enterprise gives an organization one place to run them. Tool builders in teams across the organization use agents like GitHub Copilot, Claude Code, Codex and Plotly Studio to build apps and dashboards for their colleagues, and IT manages the platform and its guardrails so those apps can be shared safely. Monitoring, logs, credentials and access control come with the platform, so tool builders can run what they build on their own.
Within each app, the pattern stays the same. Connect to the data directly, clean it once in a pipeline that lives next to the app, and define metrics in shared code. Build pages people can bookmark, add a report for each one-off question, and leave the long tail to AI inside the app. Give the agent what it needs to check its own work, from sample data and tests to screenshots, review apps and logs, and keep a person reviewing every change before it ships.
Frequently asked questions
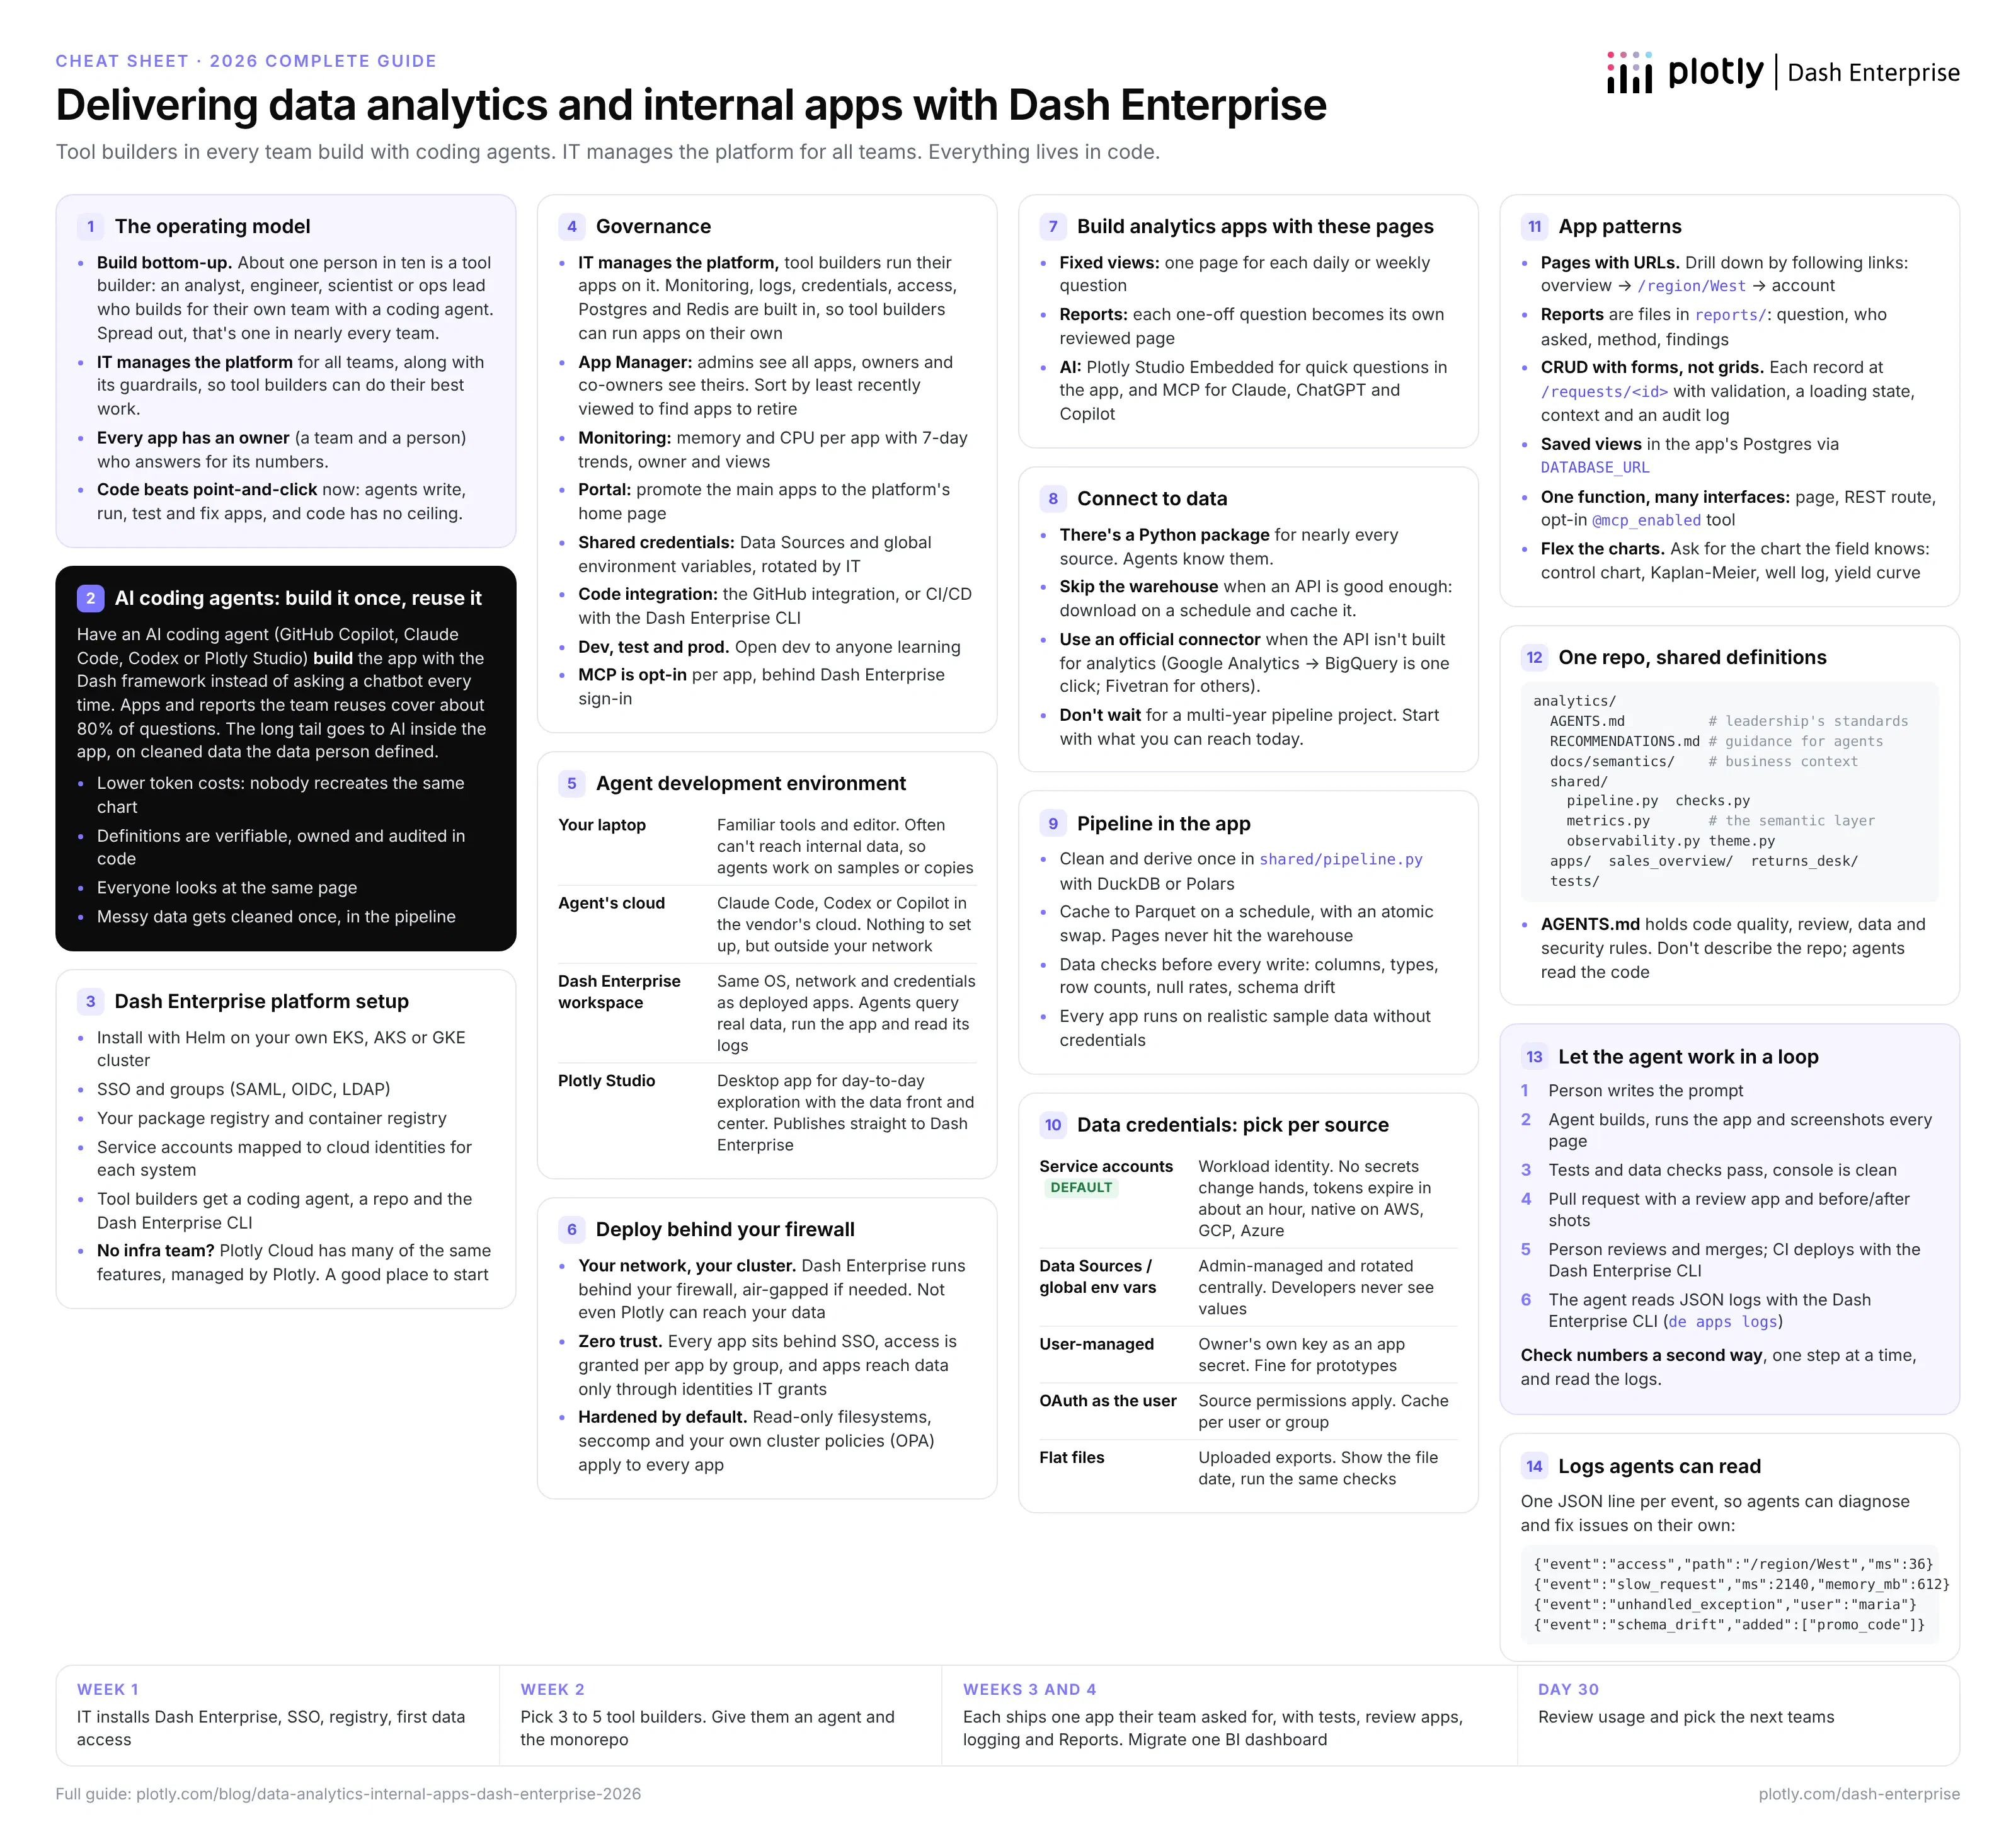
The cheat sheet
Here's the whole guide on one page. You can download the PDF to print it or share it with your team.
RECOMMENDATIONS.md
These are the recommendations from this post that a coding agent acts on, collected into one file. Put it in your repository next to AGENTS.md, and point your coding agent at it when you start.
# RECOMMENDATIONS.mdHow to build internal apps and analytics with Dash on Dash Enterprise.Written for coding agents. Leadership's own rules for this repo are in AGENTS.md.## Pages and apps- Give each view its own page and URL with Dash Pages. Drill down by following links,not tabs inside one page.- Analytics apps have fixed views for recurring questions and a Reports page. Eachreport is its own file in `reports/` with the question, who asked, the method and thefindings.- Answer a one-off question by adding a report to the app, not with a chat reply.- Use the chart the users' field already knows (control charts, Kaplan-Meier curves,well logs, yield curves). Annotate what should stand out.- Put logic in Python modules so the page, an MCP tool and a REST endpoint can all callit. MCP tools are opt-in with `@mcp_enabled`; don't expose callbacks by default.## Data- Use the source's maintained Python package or API client. For APIs, download on aschedule and cache to Parquet instead of calling the API on every page load.- Clean and derive data once, in the shared pipeline (DuckDB or Polars). Pages read thecleaned Parquet cache; they never query the warehouse directly.- Write the cache with an atomic swap so an app never reads a half-written file.- Run data checks before the cache is written: expected columns and types, row counts,null rates. Stop the refresh if a check fails, and log schema drift.- Make every app run on realistic sample data when no credentials are configured.- Never put credentials in code. Read them from the app's environment: service accounts,Data Sources or secret environment variables. For uploaded files, show the file's dateon every page and run the same checks.## Metrics and context- Every metric comes from the shared metrics module. Never compute a metric inline in apage, report or tool.- Business context lives in `docs/semantics/` (metrics, glossary, data sources). Read itbefore changing a definition, and update it when you learn something new about the data.## Writing data- Edit records with a form on its own page (for example `/requests/<id>`), not aneditable grid.- Validate on the server, show errors next to the field, disable the submit button whilesaving, and show the context someone needs to decide.- Write through one validated function per action, and record who changed what and when.- Store user-created state (saved views, notes) in the app's Postgres via `DATABASE_URL`,with SQLite as the local fallback.## Logging- Log one JSON line per event: page views and callbacks with user, path, status andduration; slow requests with memory; unhandled exceptions with tracebacks; datarefreshes, failed checks and schema drift.- Read the logs to diagnose problems with the Dash Enterprise CLI:`de apps logs --type runtime`, and `--type build` for failed deploys.## Checking your work- Run the app, open every page you changed in a headless browser, take screenshots andfix any console errors before asking for review.- Add or update tests with every change: unit tests for metrics and pipeline steps,browser tests for pages.- Check important numbers by computing them a second way, one step at a time, andcompare. Explain the check in the pull request.- Open a pull request with a review app and before/after screenshots of the pages youtouched.
Get started
If you're a Dash Enterprise customer, this is the conversation we have with every new team, and we're happy to have it with yours. Talk to us about Dash Enterprise, or try the approach today on Plotly Cloud.