
Priyaanka Arora
April 14, 2025
Practical Guide to Using AI in Data Science Workflows
There’s been a wave of speculation about AI replacing data scientists. If that worries you as a data analyst or scientist, the better question is: how can AI help you work faster and get your insights into production? Most of the real value of AI today comes from smoother workflows and removing bottlenecks.
The focus of this guide is using AI tools to enhance your existing data science workflows. For cleaning data, writing Python scripts, exploring datasets, or building data apps, AI can handle code & chart generation and help you move faster through the parts of your job that often slow you down.
AI in data science: where it works today
AI adoption in data science has moved beyond experimentation. It now plays a hands-on role in saving time on everyday tasks to boost the ROI of analytics teams. Things like writing boilerplate code, generating visualizations, and helping app end users make decisions with smart insights. Knowing where it fits best is key to deciding how and when to use it effectively.
Understanding the relationship between AI, machine learning, and data science
Before jumping into specific workflows, let’s first clarify how AI fits into the broader data science umbrella. The terms AI, ML, and data science are often thrown around together, but they refer to different parts of the puzzle.
AI, machine learning (ML), and data science serve these functions:
- Artificial intelligence (AI) refers to systems that mimic human reasoning or behavior. Most modern tools used by data teams today fall under narrow AI, such as large language models (LLMs).
- ML is a subset of AI that uses algorithms to learn from data. Examples include regression models, decision trees, or neural networks.
- Data science is the broader discipline that includes working with data to draw conclusions, make predictions, and communicate findings. It combines programming, statistics, domain expertise, and often data visualization.
How to become an AI-focused data scientist
If your goal is to become a data scientist who works with or builds AI systems:
- Start with core Python skills, especially with libraries like pandas, scikit-learn, and Dash
- Learn foundational ML concepts: supervised vs unsupervised learning, evaluation metrics, model selection
- Study how LLMs and transformers work (recommended: Hugging Face tutorials)
- Practice with AI APIs (like OpenAI, Ollama, or Cohere) and build small projects that solve real problems
- Get comfortable with cloud tools and containerization if you're deploying models into production
Data analysts and scientists who use AI daily can focus on learning to prompt, interpret, and apply AI outputs effectively.
Here are real areas where AI already helps:
- Writing and debugging Python code
- Suggesting visualizations based on a dataset
- Cleaning and transforming data
- Summarizing outputs or generating documentation
- Helping users explore dashboards via embedded chat
- Generating layout code for dashboards or apps
- Assisting with performance tuning and optimization
All of these use cases are practical and available today. AI capabilities are often built directly into the tools you're already using.
How AI helps with writing data apps faster
Let’s say you want to build a simple interactive app with Dash. Here’s a baseline version of the code:
import dashfrom dash import html, dccimport plotly.express as pximport pandas as pd# Load sample datasetdf = px.data.gapminder().query("year == 2007")app = dash.Dash(__name__)app.layout = html.Div([html.H1("GDP vs Life Expectancy"),dcc.Dropdown(options=[{"label": c, "value": c} for c in df['continent'].unique()],value="Asia",id="continent-dropdown"),dcc.Graph(id="scatter-plot")])@app.callback(dash.dependencies.Output("scatter-plot", "figure"),[dash.dependencies.Input("continent-dropdown", "value")])def update_figure(selected_continent):filtered_df = df[df['continent'] == selected_continent]fig = px.scatter(filtered_df, x="gdpPercap", y="lifeExp",size="pop", color="country",hover_name="country", log_x=True)return figif __name__ == '__main__':app.run_server(debug=True)
This is about 40+ lines of Python to build a data app. It covers layout, interactivity, and data binding. Now with Plotly AI (built into Dash Enterprise), you can describe this app in plain language and generate the same layout and callback logic instantly.
Example prompt:
"Create a Dash app with a dropdown to filter Gapminder data by continent, and display a scatter plot of GDP vs Life Expectancy sized by population."

Plotly AI code assistant offers multiple interfaces for assistance, including an AI chat window, inline prompt suggestions, and code completion.
Plotly AI will generate most of the above code in seconds, with layout, figure, and callback wired up. You can then edit it, apply a theme, add styling, and deploy it directly from the browser with one click. This makes prototyping new apps or customizing internal dashboards significantly faster.
Dash apps run entirely in Python. With AI-assisted scaffolding, you can avoid front-end and full-stack development costs.
Using AI for data cleaning and transformation
Data cleaning is still a time sink. AI can speed up:
- Standardizing column names
- Filling in missing values
- Detecting outliers
- Explaining pandas operations in plain language
- Detecting and resolving data type mismatches
- Suggesting data enrichment or merging strategies
You can paste a DataFrame into an LLM and get working pandas code with comments. Dash Enterprise’s AI features make this even faster by embedding this capability directly into your dev environment—no switching tabs, no copying and pasting.
It also helps with documenting your cleaning steps, so you can share repeatable workflows with colleagues or reviewers. That means fewer errors and clearer lineage.
AI in data visualization and analysis
AI helps speed up exploratory data analysis. Inside Dash Enterprise, AI can:
- Recommend chart types based on the data
- Autogenerate code for common visualizations (bar, scatter, heatmap, etc.)
- Provide summary statistics and trends
- Create multiple variants of a chart for comparison
- Suggest dashboard layouts or visual groupings
This lets you move from raw data to analysis-ready charts in minutes. You can generate visuals faster, test ideas more quickly, and focus your time on interpreting what the charts are actually telling you.
Embedding AI in dashboards to surface insights
Dash apps built with Dash Enterprise can include an AI chatbot interface so your end users can:
- Ask natural language questions about the data
- Get instant explanations of charts or KPIs
- Explore the dashboard without needing help from the data team
- Interact with filters, tables, and charts through text queries
- Identify patterns or exceptions flagged by AI inside the app
This reduces back-and-forth, improves decision speed, and extends the reach of your analytics beyond technical teams. It also helps non-technical users become more self-sufficient in understanding data.
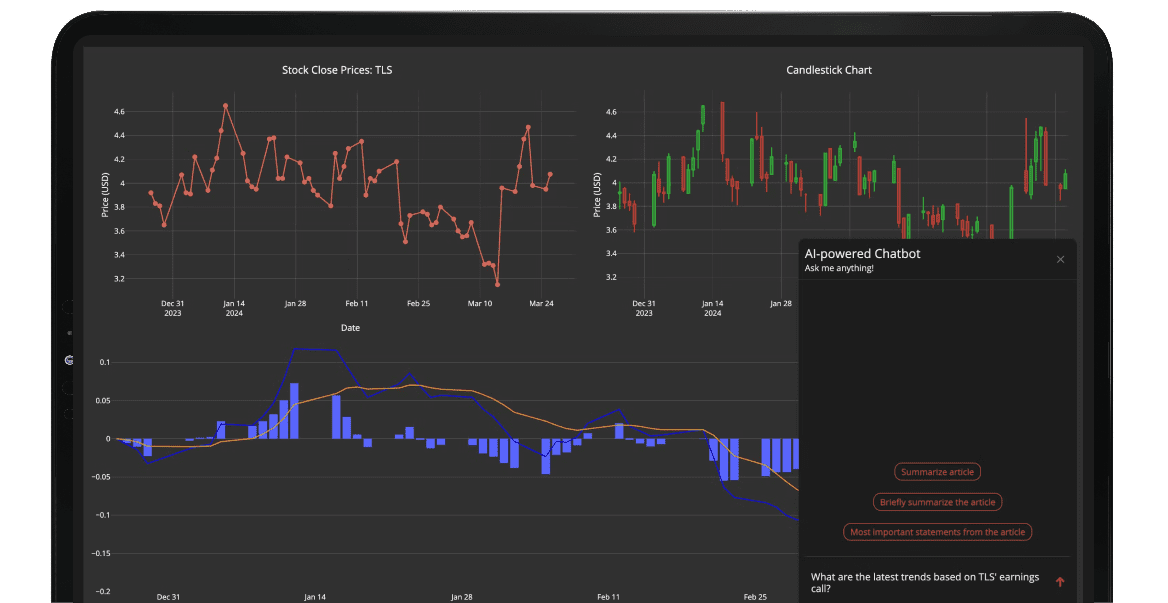
Example: AI chatbot inside a telecom analytics dashboard
The Broadband Insights team recently enhanced their Monthly Metrics data app with an AI-powered chatbot using the Dash Enterprise Chatbot Builder. The chatbot supports both operations teams and investors in identifying trends across monthly financial and subscriber data.
Users can toggle between OpenAI and Ollama models using a built-in radio button, depending on their preferences or use case.
In one mode, the chatbot connects to the underlying database schema and interprets natural language prompts to generate raw SQL. This makes it easier for analysts to explore deeper insights from the data without writing queries manually.
AI is a multiplier, not a replacement
Domain context, thoughtful questions, and good judgment still matter. AI helps by reducing boilerplate, speeding up repetitive tasks, and shortening the path from data to production. Teams that use AI effectively can increase their output without scaling headcount, and reduce the time from idea to deployment.
When integrated into platforms like Dash Enterprise, AI goes beyond coding assistance to integrate directly into how your team builds and ships analytics. It shifts the bottleneck from tooling to thinking. That’s the real opportunity.
Watch our recent webinar to see agentic AI for analytics in action.