
Chris Parmer
November 19, 2026
Create graphs from MCP tool calls
Now available in Plotly Studio Embedded
Plotly Studio Embedded can now chart the results of your Dash app's MCP tools. There are two ways to give the chat your data through MCP tools, and we recommend both:
- Functions for your metrics. Write one Python function for each metric or formula your team reports, so the AI uses your definition instead of its own.
- A query function with context. For everything else, give the AI a read-only query(sql) function and a read_data_context() function that returns your notes on what each table holds and how your team defines its terms.
from pathlib import Pathfrom dash import Dashfrom dash.mcp import mcp_enabledapp = Dash(__name__, enable_mcp=True)# 1. A function for each certified metric@mcp_enabled(expose_docstring=True)def get_revenue(start: str, end: str, grain: str = "year", group_by: str | None = None) -> dict:"""Revenue between two ship dates (YYYY-MM-DD), by year, quarter or month,optionally split by region. Uses the certified revenue definition."""return metrics.revenue(start, end, grain, group_by) # {"rows": [...], "definition": ..., "sql": ...}# 2. A general query function, plus the context to use it well@mcp_enabled(expose_docstring=True)def read_data_context() -> str:"""What each table holds, what its columns mean and how the team definesits metrics. Read this before writing SQL with query."""return Path("data_context.md").read_text()@mcp_enabled(expose_docstring=True)def query(sql: str) -> list[dict]:"""Run one read-only SQL SELECT against the sales warehouse and return the rows.Prefer a metric function such as get_revenue when one fits the question."""return warehouse.run_read_only(sql)
Turn on Studio Embedded for the app on Plotly Cloud and ask a question. The AI calls the MCP tools it needs, queries the rows they return and draws the chart.
TL;DR
- When an MCP tool in your Dash app (a Python function exposed with @mcp_enabled over the Model Context Protocol) returns rows, the AI in Plotly Studio Embedded can now query and chart those rows with SQL, and it shows that SQL under every chart. Until now it could only quote them.
- The rows stay behind the scenes. They aren't listed with the app's datasets, only the viewer who asked can query them, and a follow-up question reuses them without calling the MCP tool again.
- For organizations rolling out agentic analytics, MCP tools do three jobs: they define metrics your team can trust, they connect to each data source once so nobody else has to set up their own access, and the same Python functions draw the app's charts and answer questions in the chat.
- Today's models are good at data analysis: on DataAnalyticsBench, our 43-question exam, five of the 76 models we've tested scored 100%. The harder part is a question with more than one reasonable answer, and that's where an MCP tool can provide your team with verified, trusted answers.
- Your MCP tools need no changes. Turn on Studio Embedded in the app's settings on Plotly Cloud and the chat finds them.
On November 6, Plotly Studio Embedded started calling the MCP tools your Dash app exposes. Any Python function you decorate with @mcp_enabled becomes an MCP tool the chat can call, and the pattern we recommend is to write each number the business reports as one such function, such as get_revenue, and let the AI call that function instead of writing its own SQL. The AI could then quote certified numbers with their definition and owner, but it couldn't put them in a chart or do arithmetic on them, because the rows an MCP tool returned only existed as text in the conversation.
This release changes that. The rows an MCP tool returns now become data the AI can query and chart, so a certified function can sit at the start of a longer analysis instead of ending it.
Why define your metrics as MCP tools?
For organizations rolling out agentic analytics, MCP tools do three jobs.
- Metrics you can trust. The models are rarely the problem now: on DataAnalyticsBench, our 43-question data analytics exam, five of the 76 models we've tested scored 100%. Where they still differ is on questions with more than one reasonable reading. In our own tests, "How many customers had their 1997 margin fall to less than half of their 1996 margin?" came back as 96,481 twice and 150,524 once, depending on whether customers with no 1997 orders counted. An MCP tool holds the definition your team agreed on, so the AI reports that one.
- One connection to the data. The function connects to your warehouse, database or API once, with credentials that stay in the app, so the people asking questions don't each need their own access, connectors or setup.
- One set of functions for the app and the chat. The same Python functions draw the charts in your Dash app and answer questions in the chat, so a number in the chat matches the number on the chart.
With this release, the AI can also compare, rank and chart what those MCP tools return, so it answers more questions without choosing the definitions itself.
An example
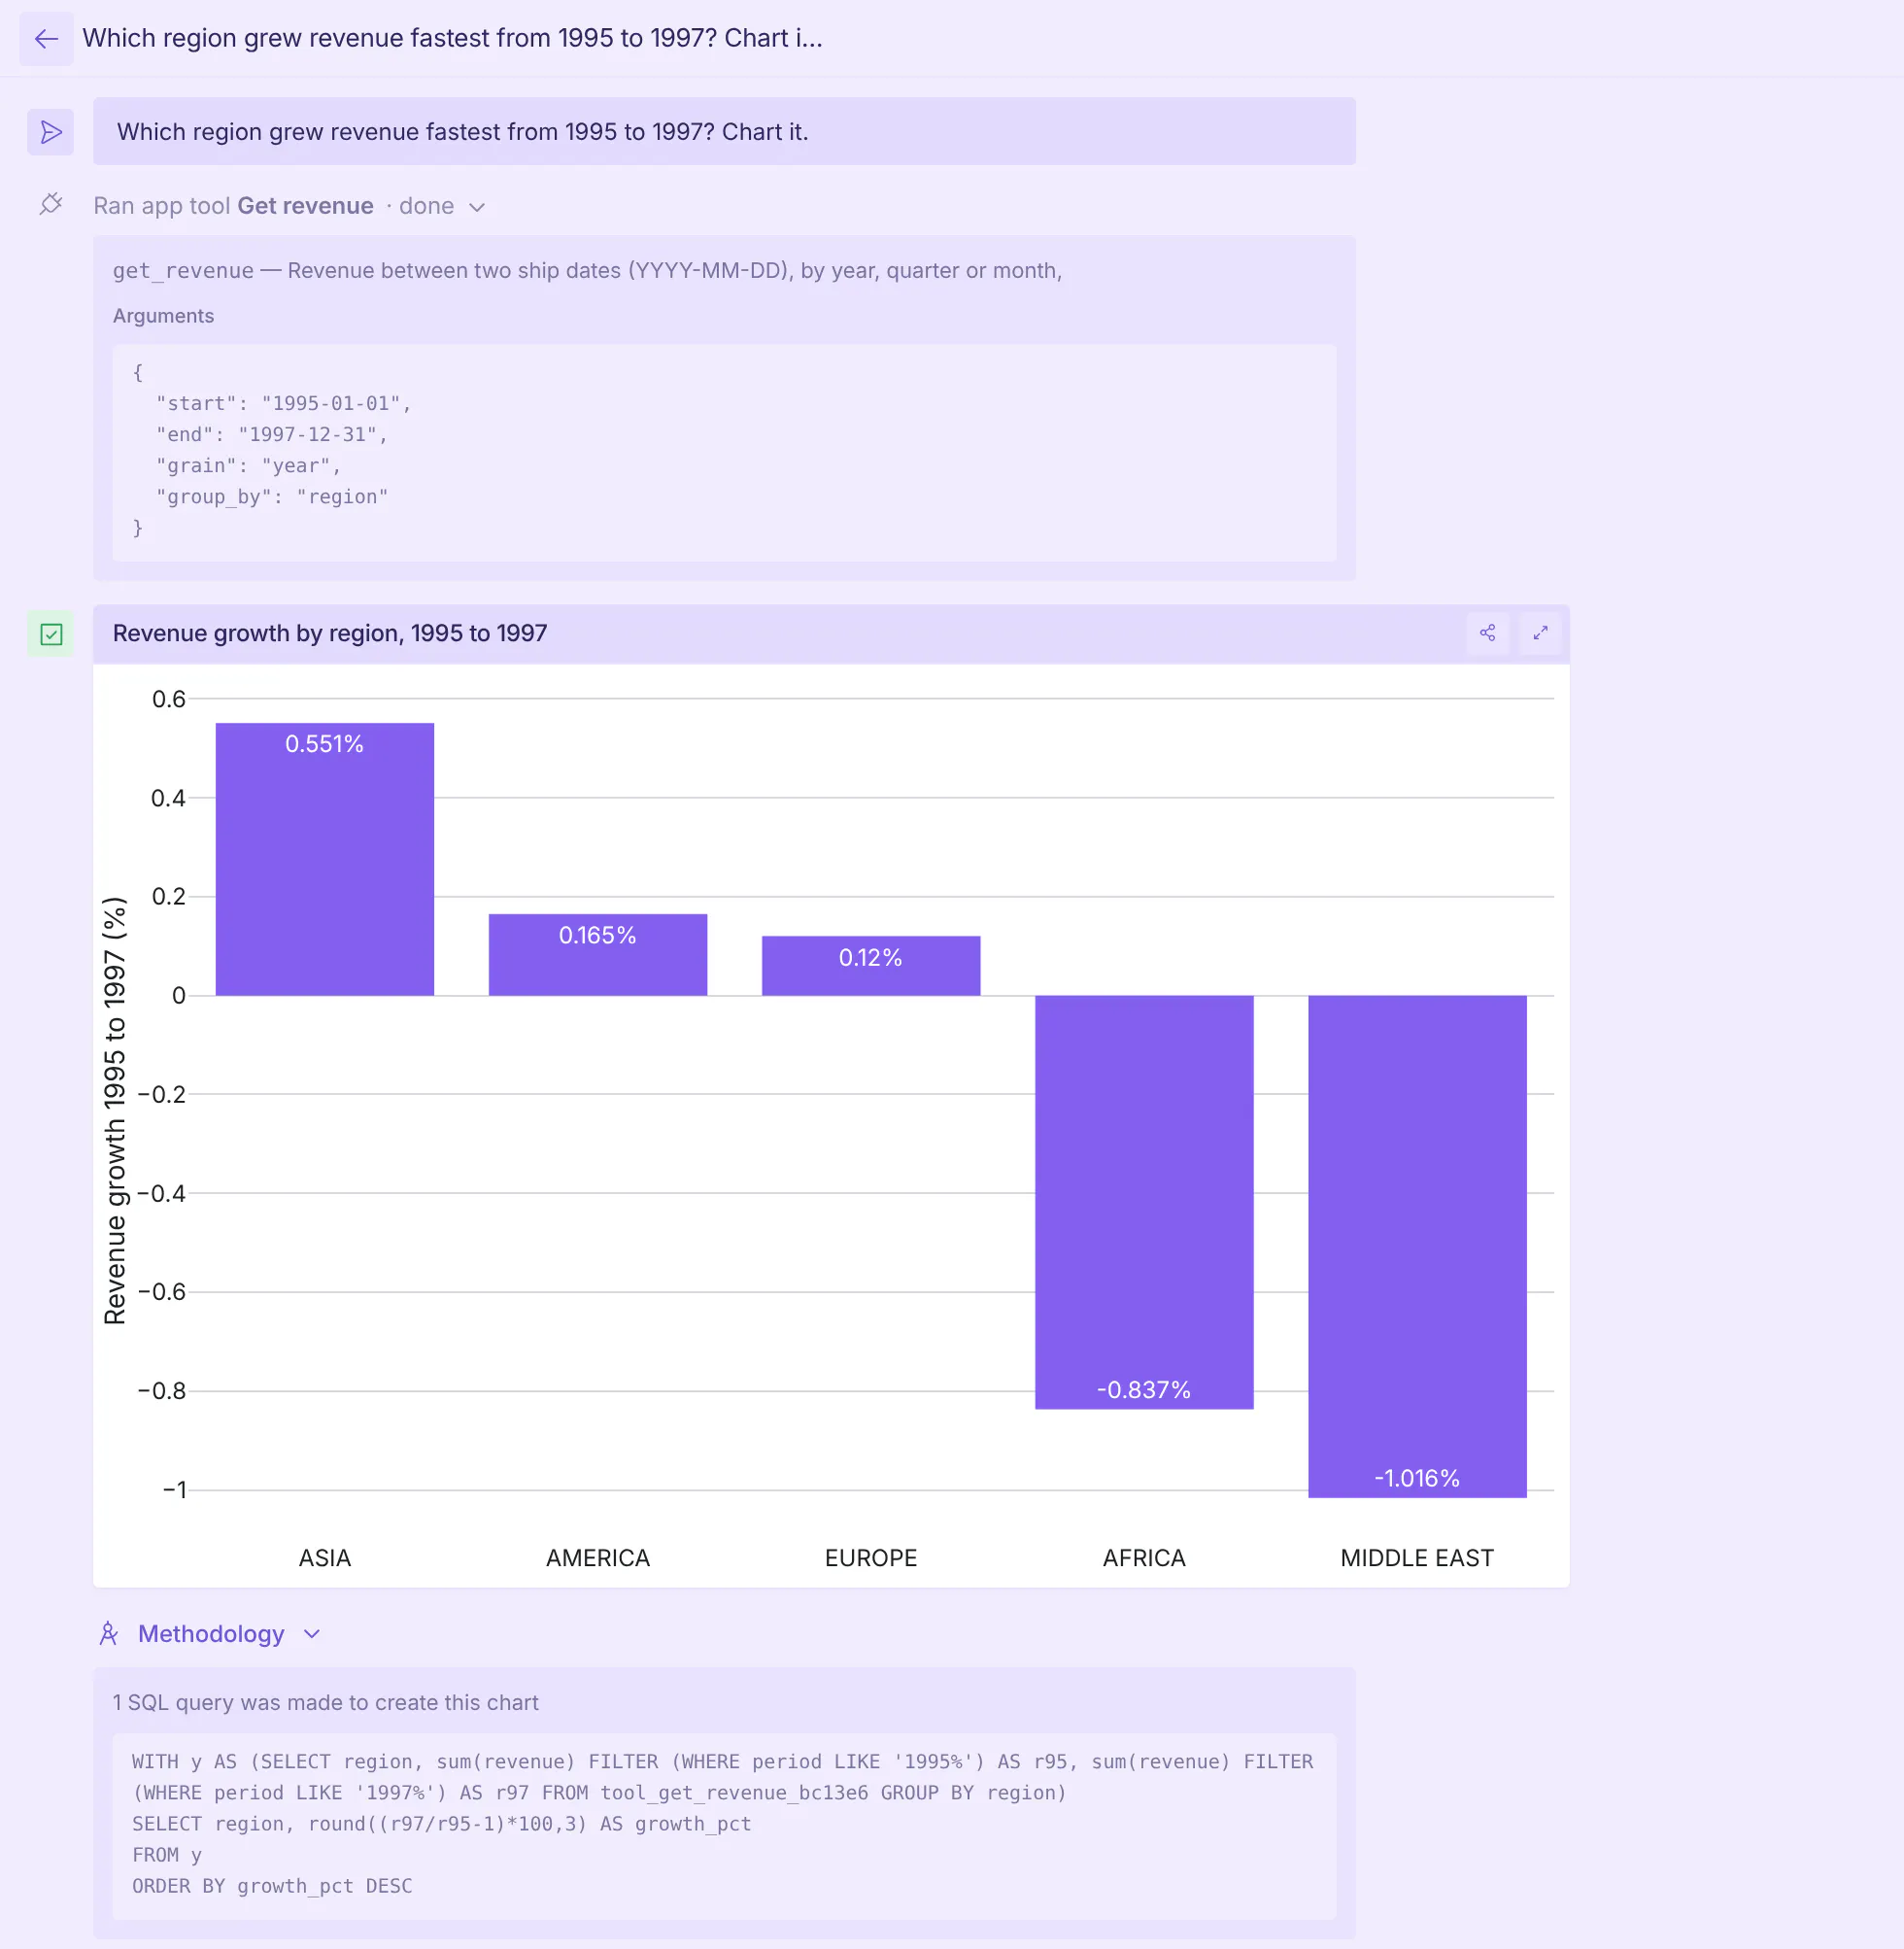
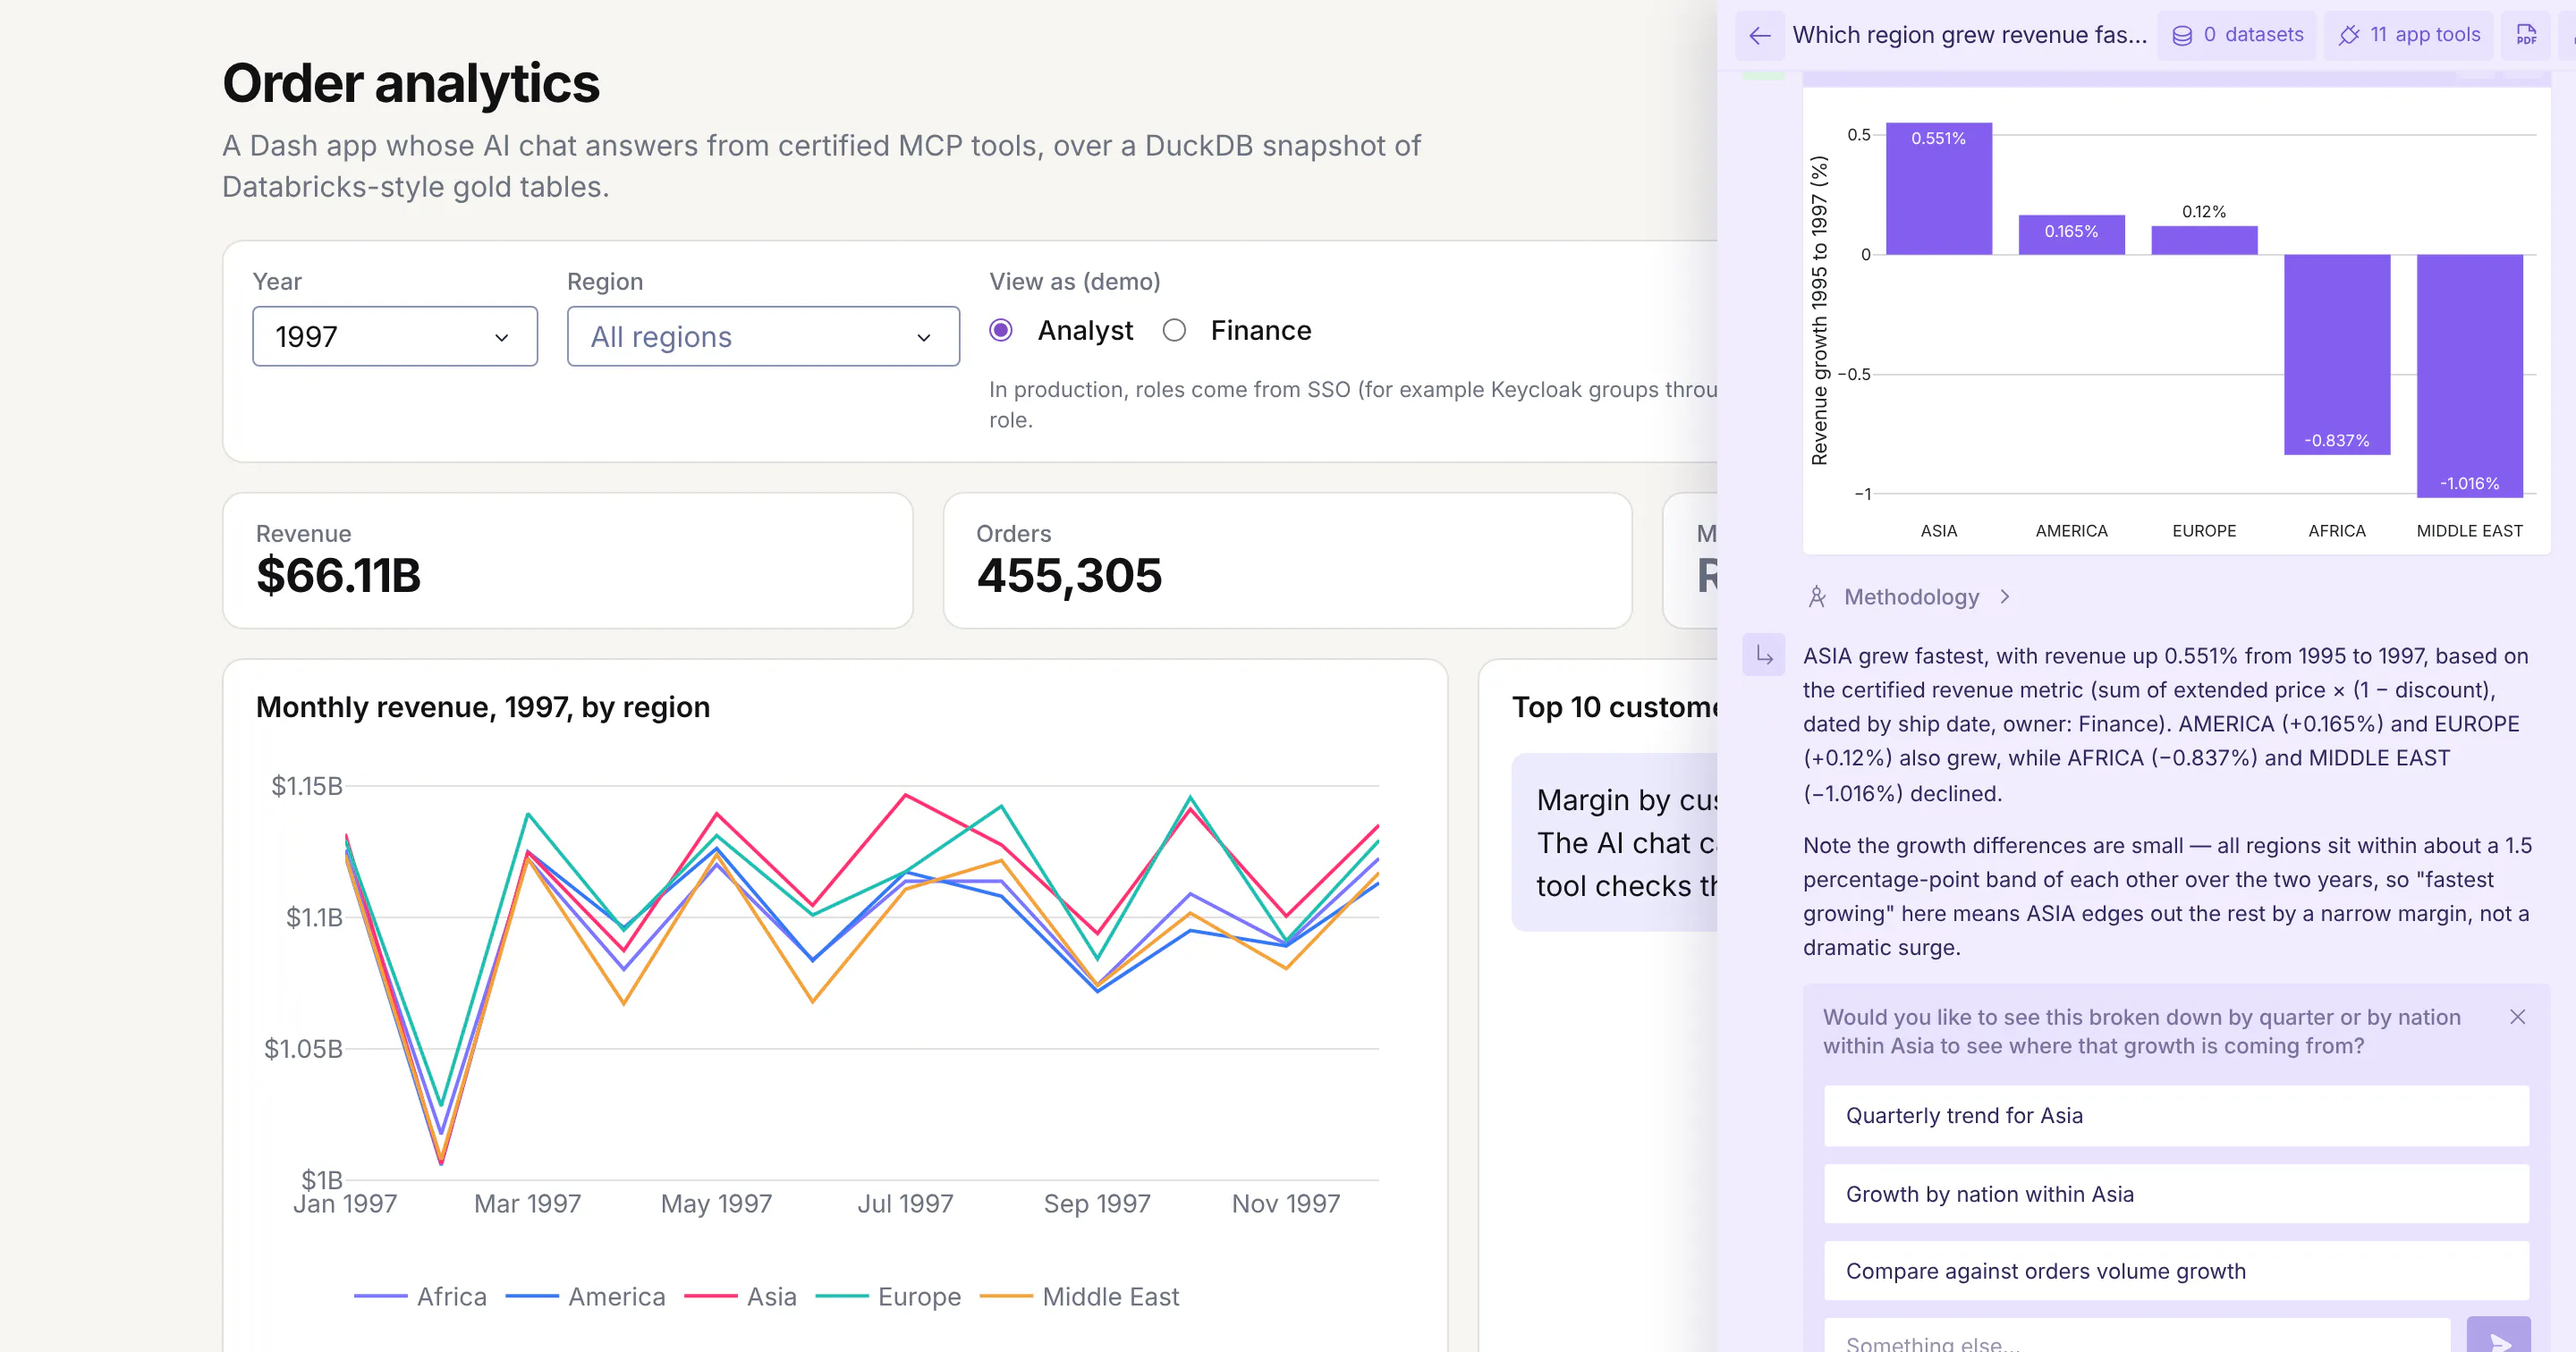
In a demo Order analytics app, we asked "Which region grew revenue fastest from 1995 to 1997? Chart it." The AI called the get_revenue MCP tool once, worked out the growth from the rows it returned and drew the chart at the top of this post: Asia grew 0.551% and Middle East fell 1.016%. The Methodology panel under the chart shows the query, so you can check that the revenue came from the certified function.
Follow-up questions reuse the same rows
We then asked "Which region added the most revenue in dollars over the same period? Chart the change." The AI didn't call the get_revenue MCP tool again. It ran a new query over the rows it already had and charted the difference: Asia added $73.1 million between 1995 and 1997, and Middle East lost $134.6 million.
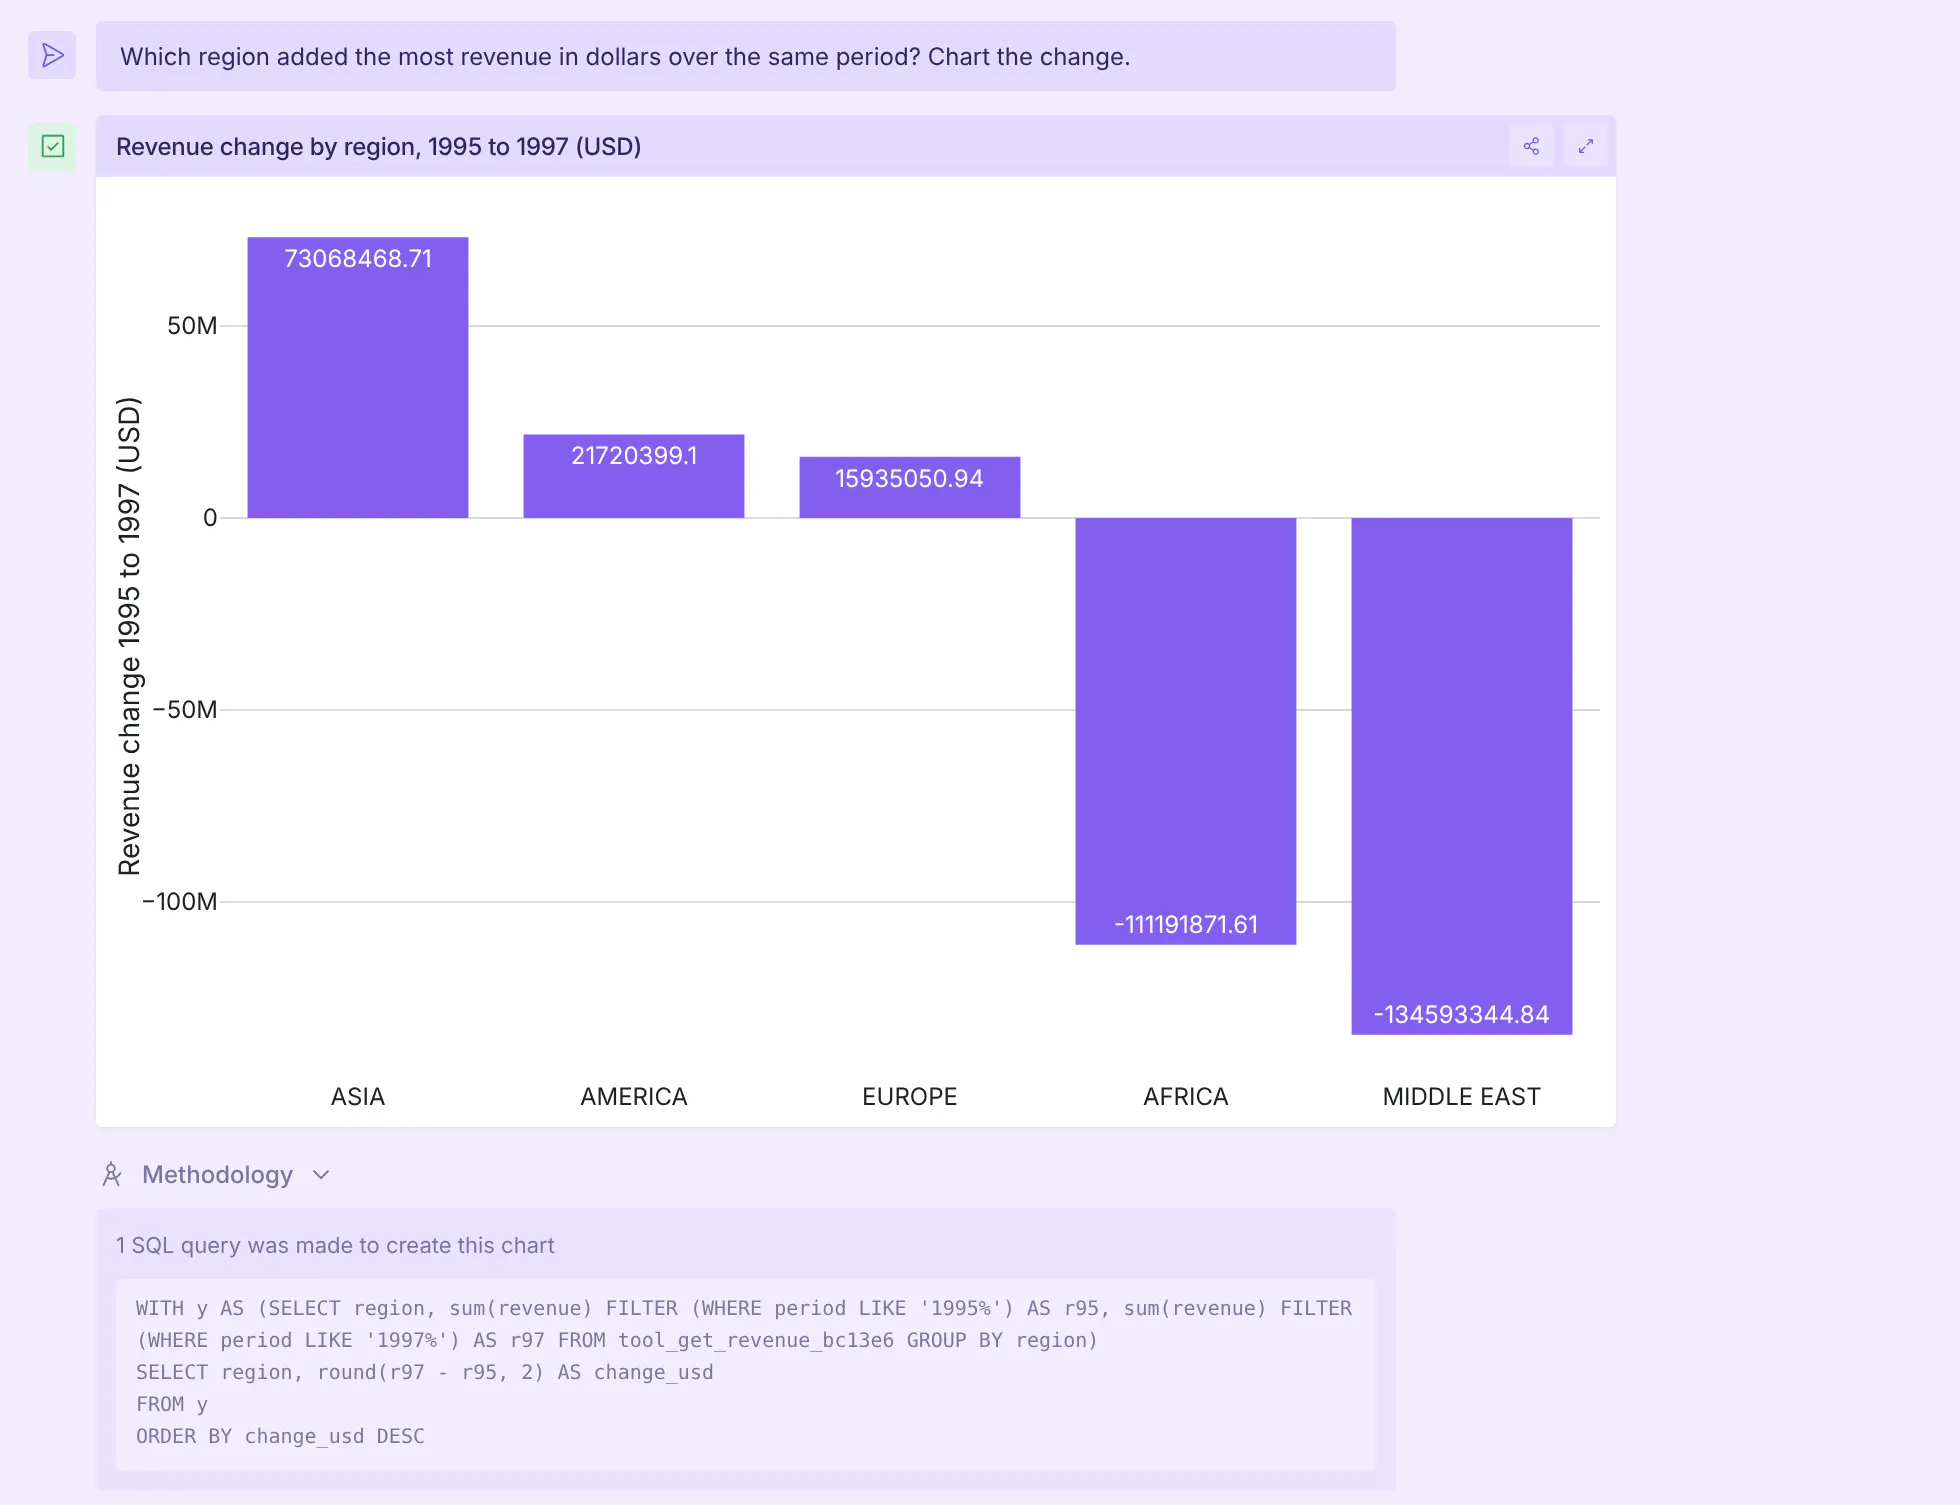
Reusing the rows keeps follow-ups consistent with the first answer, because every number still comes from the one call to the certified function.
Any MCP tool that returns rows works, including a callback that returns a DataTable's data. Return numbers as numbers rather than display strings like "$1.5M", so the AI can add them up.
Which MCP tools can the chat use?
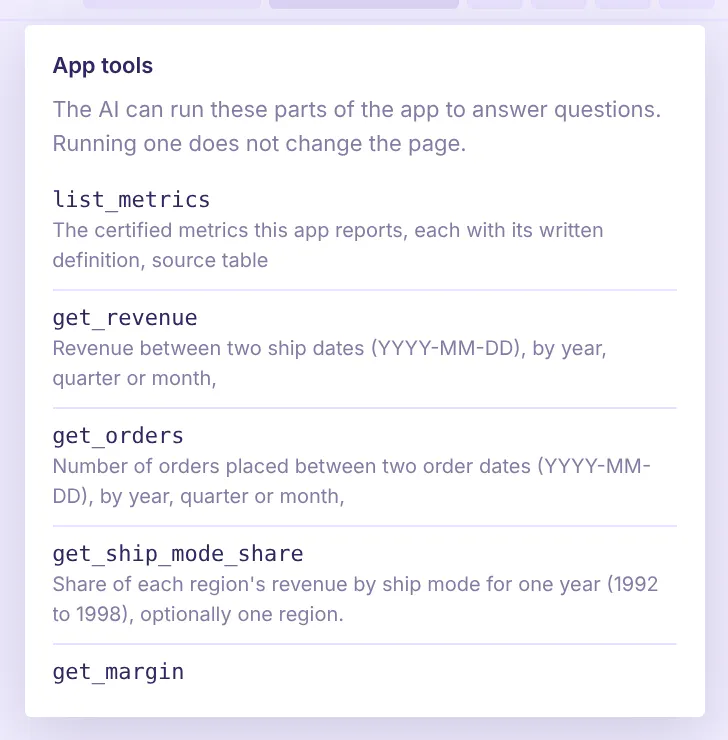
The chat can use every function your app exposes with @mcp_enabled, plus any callbacks you expose through Dash MCP. The app tools list in the chat header shows each MCP tool with the first line of its docstring, which is also what the AI reads when it decides which MCP tool to call, so a clear docstring matters as much as the code.
Prompts to try
Questions that name a number your MCP tools report and ask for a chart work best, because the AI calls the MCP tool and then does the rest in SQL. These are the prompts we ran against the Order analytics app:
- Which region grew revenue fastest from 1995 to 1997? Chart it.
- Which region added the most revenue in dollars over the same period? Chart the change.
- How did Europe split its 1997 revenue across ship modes? Chart it.
Swap in your own metrics, periods and breakdowns.
How to try it
- In your Dash app, add enable_mcp=True to Dash(...) (Dash 4.4 or later) and mark the functions the AI may call with @mcp_enabled. The Dash MCP docs cover the options.
- Deploy the app to Plotly Cloud.
- Open the app's settings, go to the Plotly Studio Embedded tab, and select Enable Plotly Studio Embedded for this app.
Viewers then sign in with their Plotly Cloud account in the chat panel and can ask questions straight away. Plotly Studio Embedded is in beta on Plotly Cloud and comes to Dash Enterprise in Q4 2026.
A coding agent can do the first step for you. A prompt to start from:
Turn on Dash MCP in this Dash app with enable_mcp=True, and expose our metric functions as MCP tools with @mcp_enabled. Give each one a docstring that says when to use it and what its arguments mean, and have it return its rows as a list of dictionaries with numeric columns. Then add a read-only query(sql) MCP tool for everything else, and a read_data_context() MCP tool that returns our notes on the tables and how we define our metrics.
The demo in the screenshots is an Order analytics Dash app on TPC-H synthetic benchmark data at scale factor 2 (12 million order lines).
Summary
Certified metric functions used to stop at a quoted number. With this release, the rows their MCP tools return become data the AI can query and chart, and follow-up questions reuse them instead of calling the MCP tool again. If your app already exposes MCP tools, there's nothing to change: turn on Studio Embedded and ask it a question that needs a chart.