
Celia Lopez
May 28, 2025
Why Logs and Dev Tools Are the Key to Reliable Dash Apps
As a developer, my motto is “Break it till you make it”. I like issues and error messages because they help me learn and improve my understanding of Python in general and Dash apps in particular. In the short term, issues slow me down, yes, but in the long term, they make me a better developer. My Dash apps are more reliable now because I ran into issues in the past and took the time to learn from them.
In the previous post of this series, I talked about how I use The Journalistic Six (What, When, Where, Who, Why, and How) to create precise issue definitions. I shared how an issue is an unwanted behavior in our Dash app that we intend to change, but whose nature and cause we don’t understand. As a first step to understanding it, we describe the app’s expected vs unexpected behaviors and progressively add details to that description. The Journalistic Six helps us as a checklist so that we don’t forget any aspect that might be relevant to understanding why the issue is happening.
A quick recap of the value of well-crafted issue definitions
You may be wondering what the added value of creating an issue definition is when what you’re worried about is finding a solution quickly. The main reason why I find creating precise issue definitions valuable is that they save time:
- Writing down what I see in an app is similar to the Rubber Duck Debugging technique. More than once, I have found the cause and the solution to an issue while I was writing a detailed definition to ask a colleague for help. So, because I had created the definition, I didn’t need to send that message anymore.
- When I ask another developer for help, they need to have as much information as possible because they don’t have access to my laptop or my brain. Creating a precise issue definition from the start spares both of us from a chain of one-line emails with questions like “Which Dash version are you using?” or “Did you already try passing it as a State instead of an Input?”.
- I do have access to my brain, but my memory is not my greatest asset and I work in multiple Dash apps simultaneously. That means that, if I don’t document things as soon as they happen (screenshots, environment specifications, what I tried and didn’t work, etc), I will need to spend extra time some days later trying to replicate the issue based on potentially incomplete or inaccurate memories.
Collecting as much information as possible from the first moment that the issue happens will make the issue definition and the debugging process more efficient and useful both in the short and long term.
In this post, I will share with you, with practical examples, my toolkit to find the answers to the Journalistic Six questions in Dash data apps. I will talk about logging and Dev Tools (both within Dash and the browser). In addition to showing you where to find and how to use those resources, I will explain how to interpret the information they provide, which will be the first step to answering the “Why is this happening?” question from our framework.
Where to look first: App Logs
When my apps show unexpected behavior, the first place I go for information is the logs.
Logs are the text records of the events that happen in our app, like loading resources and running callbacks. Depending on the specified level of detail, we may only see logs for errors (like a failed callback) or we may also see logs for events with the expected results (like a successful callback or a print statement). Every new event record is added at the end of the existing log file, so logs are meant to be read from the bottom to the top: the most recent information is at the bottom. If we want to know how the app got to that point, we should progressively scroll up.
Depending on how the Dash app is running, we can find the logs in different places:
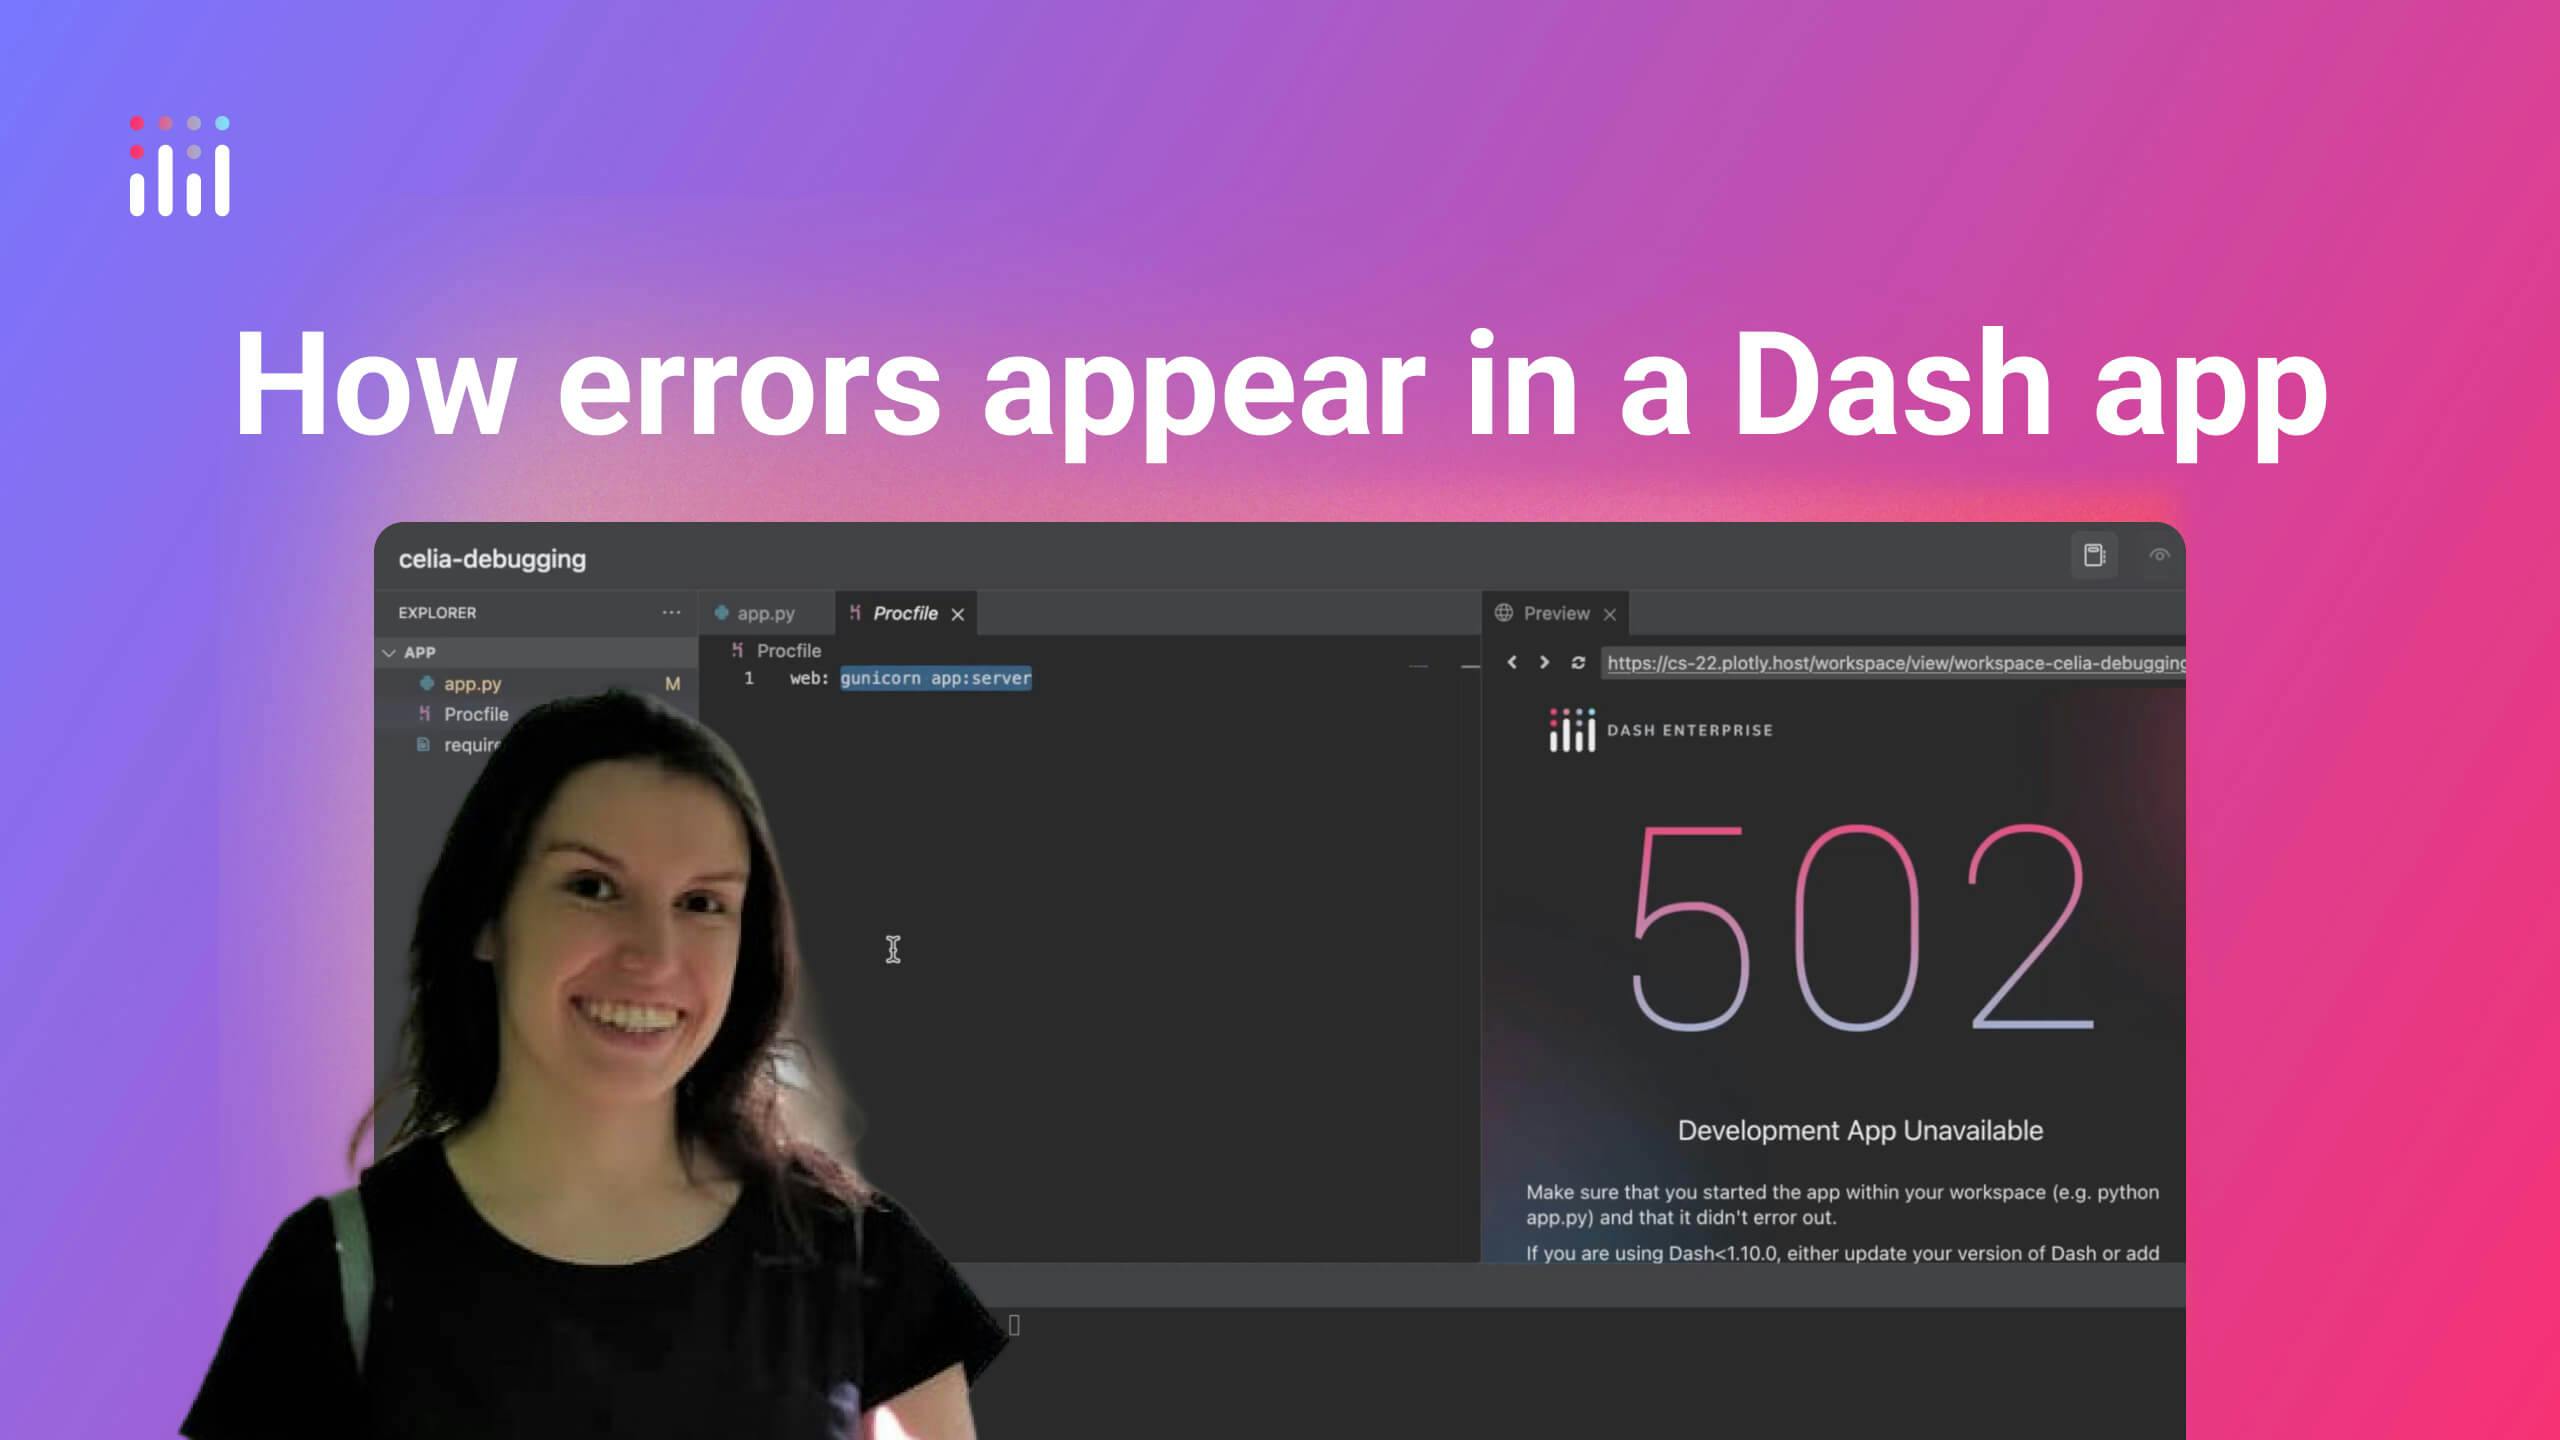
- When we run the app in a development environment (locally or a DE workspace) with debug=True, we will get error messages in a pop-up notification in the bottom (with dash>=3.0.0) or top (with dash<3.0.0) right corner of the window. That’s part of Dash Dev Tools and was included so that developers can see relevant information without needing to switch between the app window and the Python terminal.
- When we run the app in a development environment with debug=False, we see the logs in the terminal. The logs will be different if we run the app with python app.py vs gunicorn app:server.
- When the app is deployed, we can check the logs in their corresponding tab of the user interface or by logging into the server through a terminal.
In this video, I’ll show how error information would appear in the development and deployment scenarios described before:
Tips to find error tracebacks in logs
Considering the amount of information they include, reading logs can feel like looking for a needle in a haystack. Fortunately, error tracebacks are usually easy to spot among regular logs: they are typically indented blocks, and they include the words “ERROR”, “Traceback” and/or “Exception”.
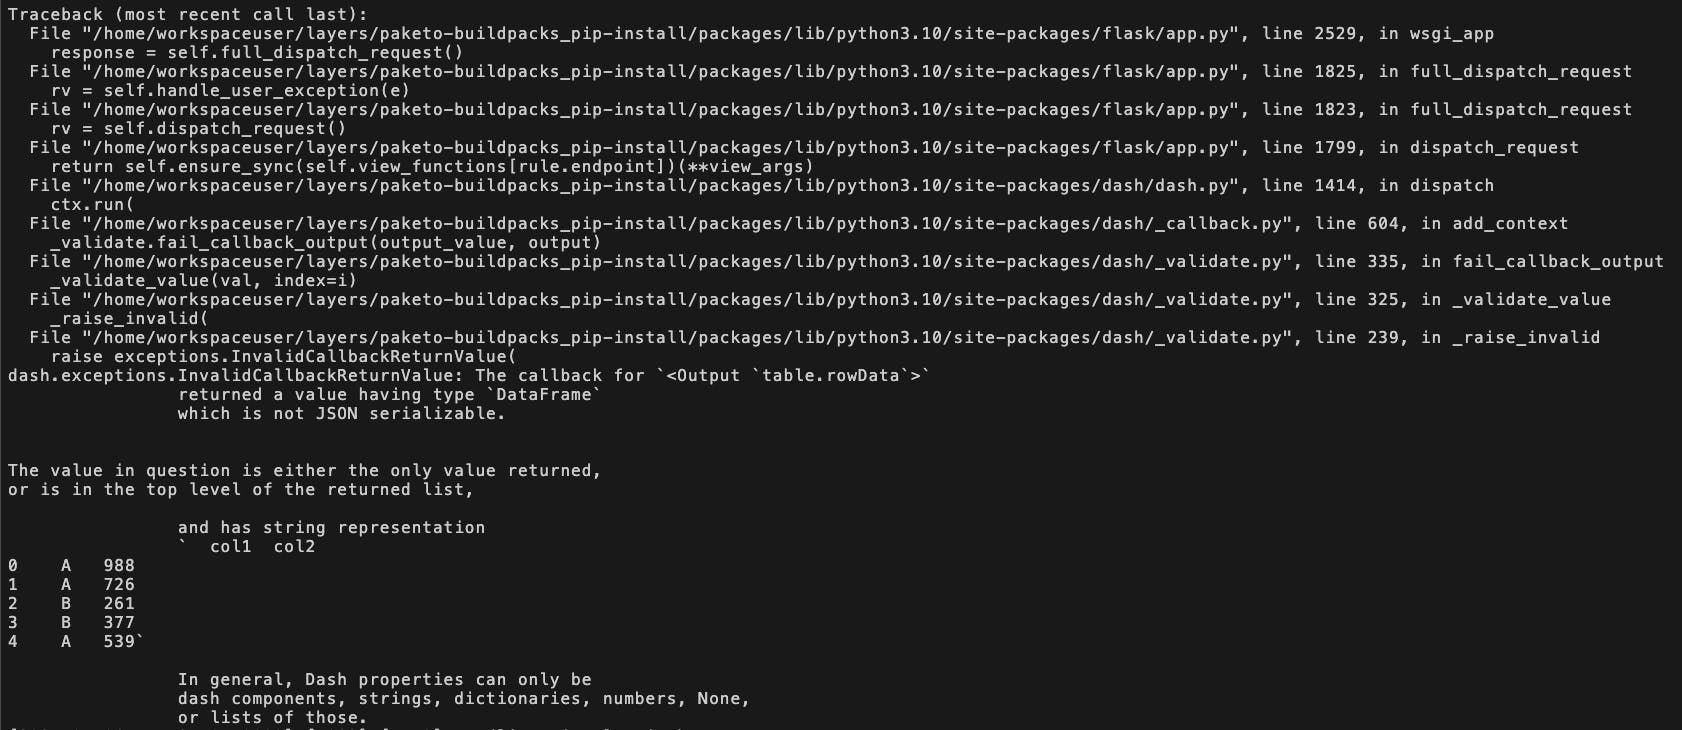
Full traceback:
Traceback (most recent call last):File "/home/workspaceuser/layers/paketo-buildpacks_pip-install/packages/lib/python3.10/site-packages/dash/_callback.py", line 579, in add_contextjsonResponse = to_json(response)File "/home/workspaceuser/layers/paketo-buildpacks_pip-install/packages/lib/python3.10/site-packages/dash/_utils.py", line 26, in to_jsonreturn to_json_plotly(value)File "/home/workspaceuser/layers/paketo-buildpacks_pip-install/packages/lib/python3.10/site-packages/plotly/io/_json.py", line 142, in to_json_plotlyjson.dumps(plotly_object, cls=PlotlyJSONEncoder, **opts), _swap_jsonFile "/Library/Frameworks/Python.framework/Versions/3.10/lib/python3.10/json/__init__.py", line 238, in dumps**kw).encode(obj)File "/home/workspaceuser/layers/paketo-buildpacks_pip-install/packages/lib/python3.10/site-packages/_plotly_utils/utils.py", line 56, in encodeencoded_o = super(PlotlyJSONEncoder, self).encode(o)File "/Library/Frameworks/Python.framework/Versions/3.10/lib/python3.10/json/encoder.py", line 199, in encodechunks = self.iterencode(o, _one_shot=True)File "/Library/Frameworks/Python.framework/Versions/3.10/lib/python3.10/json/encoder.py", line 257, in iterencodereturn _iterencode(o, 0)File "/home/workspaceuser/layers/paketo-buildpacks_pip-install/packages/lib/python3.10/site-packages/_plotly_utils/utils.py", line 133, in defaultreturn _json.JSONEncoder.default(self, obj)File "/Library/Frameworks/Python.framework/Versions/3.10/lib/python3.10/json/encoder.py", line 179, in defaultraise TypeError(f'Object of type {o.__class__.__name__} 'TypeError: Object of type DataFrame is not JSON serializableDuring handling of the above exception, another exception occurred:dash.exceptions.InvalidCallbackReturnValue: The callback for `<Output `table.rowData`>` returned a value having type `DataFrame` which is not JSON serializable. In general, Dash properties can only be dash components, strings, dictionaries, numbers, None, or lists of those.
Sometimes, error messages already include a verbose explanation of why the error happened and a suggested solution, so reading them points us in the right direction to solve the issue. In the example, the issue comes from a wrong data type passed as a callback Output because dataframes need to be converted into a dict-like format to be JSON-serializable to be used as in callbacks. Spoiler: Using return df.to_dict(‘records’) instead of return df solves the issue!
At other times, it’s less evident what the error message is referring to:
ValueError: numpy.dtype size changed, may indicate binary incompatibility. Expected 96 from C header, got 88 from PyObject
Full traceback:
[2025-01-21 16:15:08 +0000] [24] [INFO] Booting worker with pid: 24[2025-01-21 16:15:09 +0000] [24] [ERROR] Exception in worker processTraceback (most recent call last):File "/layers/paketo-buildpacks_pip-install/packages/lib/python3.10/site-packages/gunicorn/arbiter.py", line 583, in spawn_workerworker.init_process()File "/layers/paketo-buildpacks_pip-install/packages/lib/python3.10/site-packages/gunicorn/workers/base.py", line 119, in init_processself.load_wsgi()File "/layers/paketo-buildpacks_pip-install/packages/lib/python3.10/site-packages/gunicorn/workers/base.py", line 144, in load_wsgiself.wsgi = self.app.wsgi()File "/layers/paketo-buildpacks_pip-install/packages/lib/python3.10/site-packages/gunicorn/app/base.py", line 67, in wsgiself.callable = self.load()File "/layers/paketo-buildpacks_pip-install/packages/lib/python3.10/site-packages/gunicorn/app/wsgiapp.py", line 49, in loadreturn self.load_wsgiapp()File "/layers/paketo-buildpacks_pip-install/packages/lib/python3.10/site-packages/gunicorn/app/wsgiapp.py", line 39, in load_wsgiappreturn util.import_app(self.app_uri)File "/layers/paketo-buildpacks_pip-install/packages/lib/python3.10/site-packages/gunicorn/util.py", line 358, in import_appmod = importlib.import_module(module)File "/layers/paketo-buildpacks_cpython/cpython/lib/python3.10/importlib/__init__.py", line 126, in import_modulereturn _bootstrap._gcd_import(name[level:], package, level)File "<frozen importlib._bootstrap>", line 1050, in _gcd_importFile "<frozen importlib._bootstrap>", line 1027, in _find_and_loadFile "<frozen importlib._bootstrap>", line 1006, in _find_and_load_unlockedFile "<frozen importlib._bootstrap>", line 688, in _load_unlockedFile "<frozen importlib._bootstrap_external>", line 883, in exec_moduleFile "<frozen importlib._bootstrap>", line 241, in _call_with_frames_removedFile "/workspace/app.py", line 2, in <module>import pagesFile "/workspace/pages/__init__.py", line 1, in <module>from . import details, page_not_found # noqa: F401File "/workspace/pages/details.py", line 1, in <module>from utils.chart_utils import graph_modebarFile "/workspace/utils/__init__.py", line 1, in <module>from . import data_utils # noqa: F401File "/workspace/utils/data_utils.py", line 4, in <module>import pandas as pdFile "/layers/paketo-buildpacks_pip-install/packages/lib/python3.10/site-packages/pandas/__init__.py", line 22, in <module>from pandas.compat import (File "/layers/paketo-buildpacks_pip-install/packages/lib/python3.10/site-packages/pandas/compat/__init__.py", line 15, in <module>from pandas.compat.numpy import (File "/layers/paketo-buildpacks_pip-install/packages/lib/python3.10/site-packages/pandas/compat/numpy/__init__.py", line 7, in <module>from pandas.util.version import VersionFile "/layers/paketo-buildpacks_pip-install/packages/lib/python3.10/site-packages/pandas/util/__init__.py", line 1, in <module>from pandas.util._decorators import ( # noqaFile "/layers/paketo-buildpacks_pip-install/packages/lib/python3.10/site-packages/pandas/util/_decorators.py", line 14, in <module>from pandas._libs.properties import cache_readonly # noqaFile "/layers/paketo-buildpacks_pip-install/packages/lib/python3.10/site-packages/pandas/_libs/__init__.py", line 13, in <module>from pandas._libs.interval import IntervalFile "pandas/_libs/interval.pyx", line 1, in init pandas._libs.intervalValueError: numpy.dtype size changed, may indicate binary incompatibility. Expected 96 from C header, got 88 from PyObject[2025-01-21 16:15:09 +0000] [24] [INFO] Worker exiting (pid: 24)
In those cases, a simple Google search for the exact error message can help because it’s common that other developers have run into the same issue in the past, and have found a solution with the help of the community.
I ran into the error from the screenshot during my work as a Support Engineer. Once I identified that the error was related to pandas, I started by looking at the library documentation and changelog. I found that the NumPy 2.0.0 version release was causing that incompatibility error with pandas, so pinning a previous version until a pandas update was released and fixed it.
That was a tricky one, but I wanted to share that example with you to highlight the importance of searching the library changelogs and the community knowledge as part of the debugging process.
When those strategies don’t work, I look at the complete traceback to find the error’s origin. A good way to learn how to read tracebacks in details is to pass them to ChatGPT (or your preferred AI assistant) with a prompt like:
“I’m developing a Python Dash App and I got this error. Explain the traceback step by step and suggest a solution: <COMPLETE TRACEBACK>”.
What if there’s no error in the logs?
As I explained in the previous post, an issue is not necessarily a Python error, it can be simply an unexpected and unexplained behavior, for example, a callback taking too long. In those cases, logs aren’t as helpful because by default they only show general information like “a callback has run” (a _dash-update-component POST request), with no details of which callback it was or which values were passed as inputs and returned as outputs.
We could include print statements at every step of callback functions to check the values of relevant variables, but there are more efficient ways to get that information in a Dash app:
- Callback Graph in Dash Dev Tools
- Network tab in the browser’s Developer Tools
The Callback Graph is part of Dash Dev Tools and shows an interactive representation of the callbacks of a Dash app and the components that are involved in them as Inputs, Outputs, and States. By clicking on each of the elements, we can get more information about the mean and last execution values of each callback. You can learn more about the Callback Graph and how to use it here.
The Callback Graph has two limitations for debugging:
- Since it’s part of the Dev Tools, it is only available in the development mode of apps (when you run them locally or in a workspace with debug=True), so it’s not as useful if the issue is happening in a deployed app.
- If the Dash app is complex, with more than ten callbacks, the user interface of the Callback Graph can become hard to navigate.
Fortunately, the Network tab of the browser’s Developer Tools addresses both limitations. You can find out here how to access the Network tab in the browser you’re using.
I mentioned earlier that logs reflect every action that the Dash app executes. Each of those actions is a request from the end user’s browser (“clientside”) to the server where the app is running (“serverside”).
The requests that represent callbacks are identified by the _dash-update-component name in the “File” column. If we click on one of them, we will get details about that request that don’t appear in the logs:
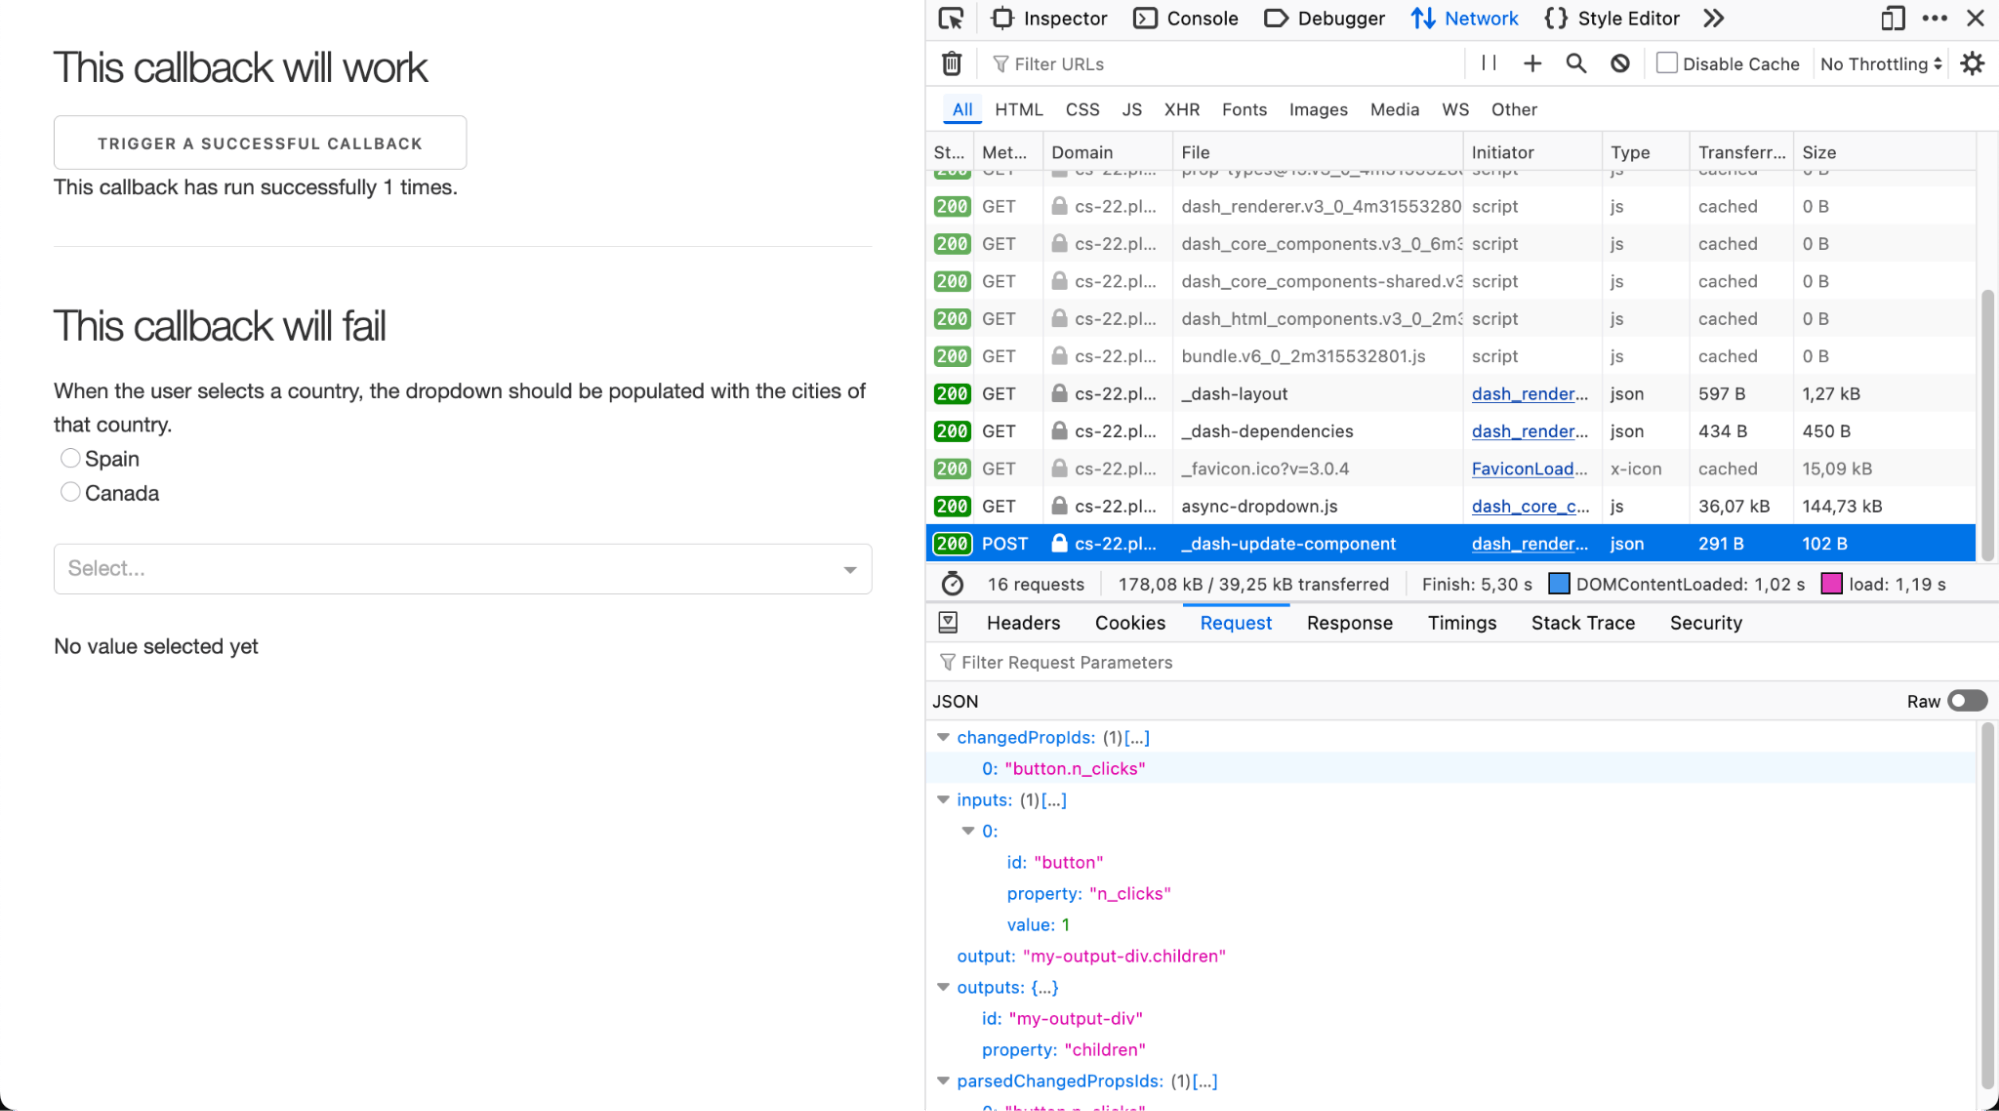
- In the “Payload” (Chrome) or “Requests” tab (Firefox) we will see the component id, component property, and value for the Inputs and States that have been sent to the browser when the callback has been triggered. We will also see the component id and component property of the Outputs, but not their values. If our Dash app has multiple callbacks, the information of the component ids and properties will help us identify which callback this request represents.
- In the “Response” tab, we can find the Outputs’ values. It is here and not in Payload/Requests because it’s the information that the server sends back after running the code inside the callback function. When the callback fails, what we see in this tab will depend on the settings of the server where the app is running: it may be the error message and its traceback, or a more general “Internal Server Error”.
- The “Timing” tab will be relevant if the issue we’re investigating is related to performance, since it will help us answer questions like: “How much of the waiting time is spent doing the calculations vs sending the data from the server to the client?”
- The “Headers” tab contains information about the source (cookies, device metadata, authentication) and size of the request. This information can be helpful when the issue happens only in some environments or for some users, for example, we can check if an up-to-date authentication cookie is present in the request or not, or if the request pathname is correct for a Dash Embedded app.
Some notes about the Network tab:
- The requests that are not callbacks typically represent the loading of assets and JavaScript libraries, so analyzing their details can be helpful if the issue is, for example, a logo not appearing in a deployed Dash app.
- There are two checkboxes at the top of the requests list that can be useful in some cases:
- Disable cache: if we want to check if having cache enabled or disabled affects the issue.
- Preserve log: if we want to keep the records of the requests that happened before refreshing the page.
- If you are checking the Network tab for a development app with app.run(debug=True), you will see a reload-hash request every second. You can remove the information about this request while keeping the dev tools and hot reloading functionalities by adding devtools_silence_routes_logging=True to app.run().
What if the issue is related to the app's appearance?
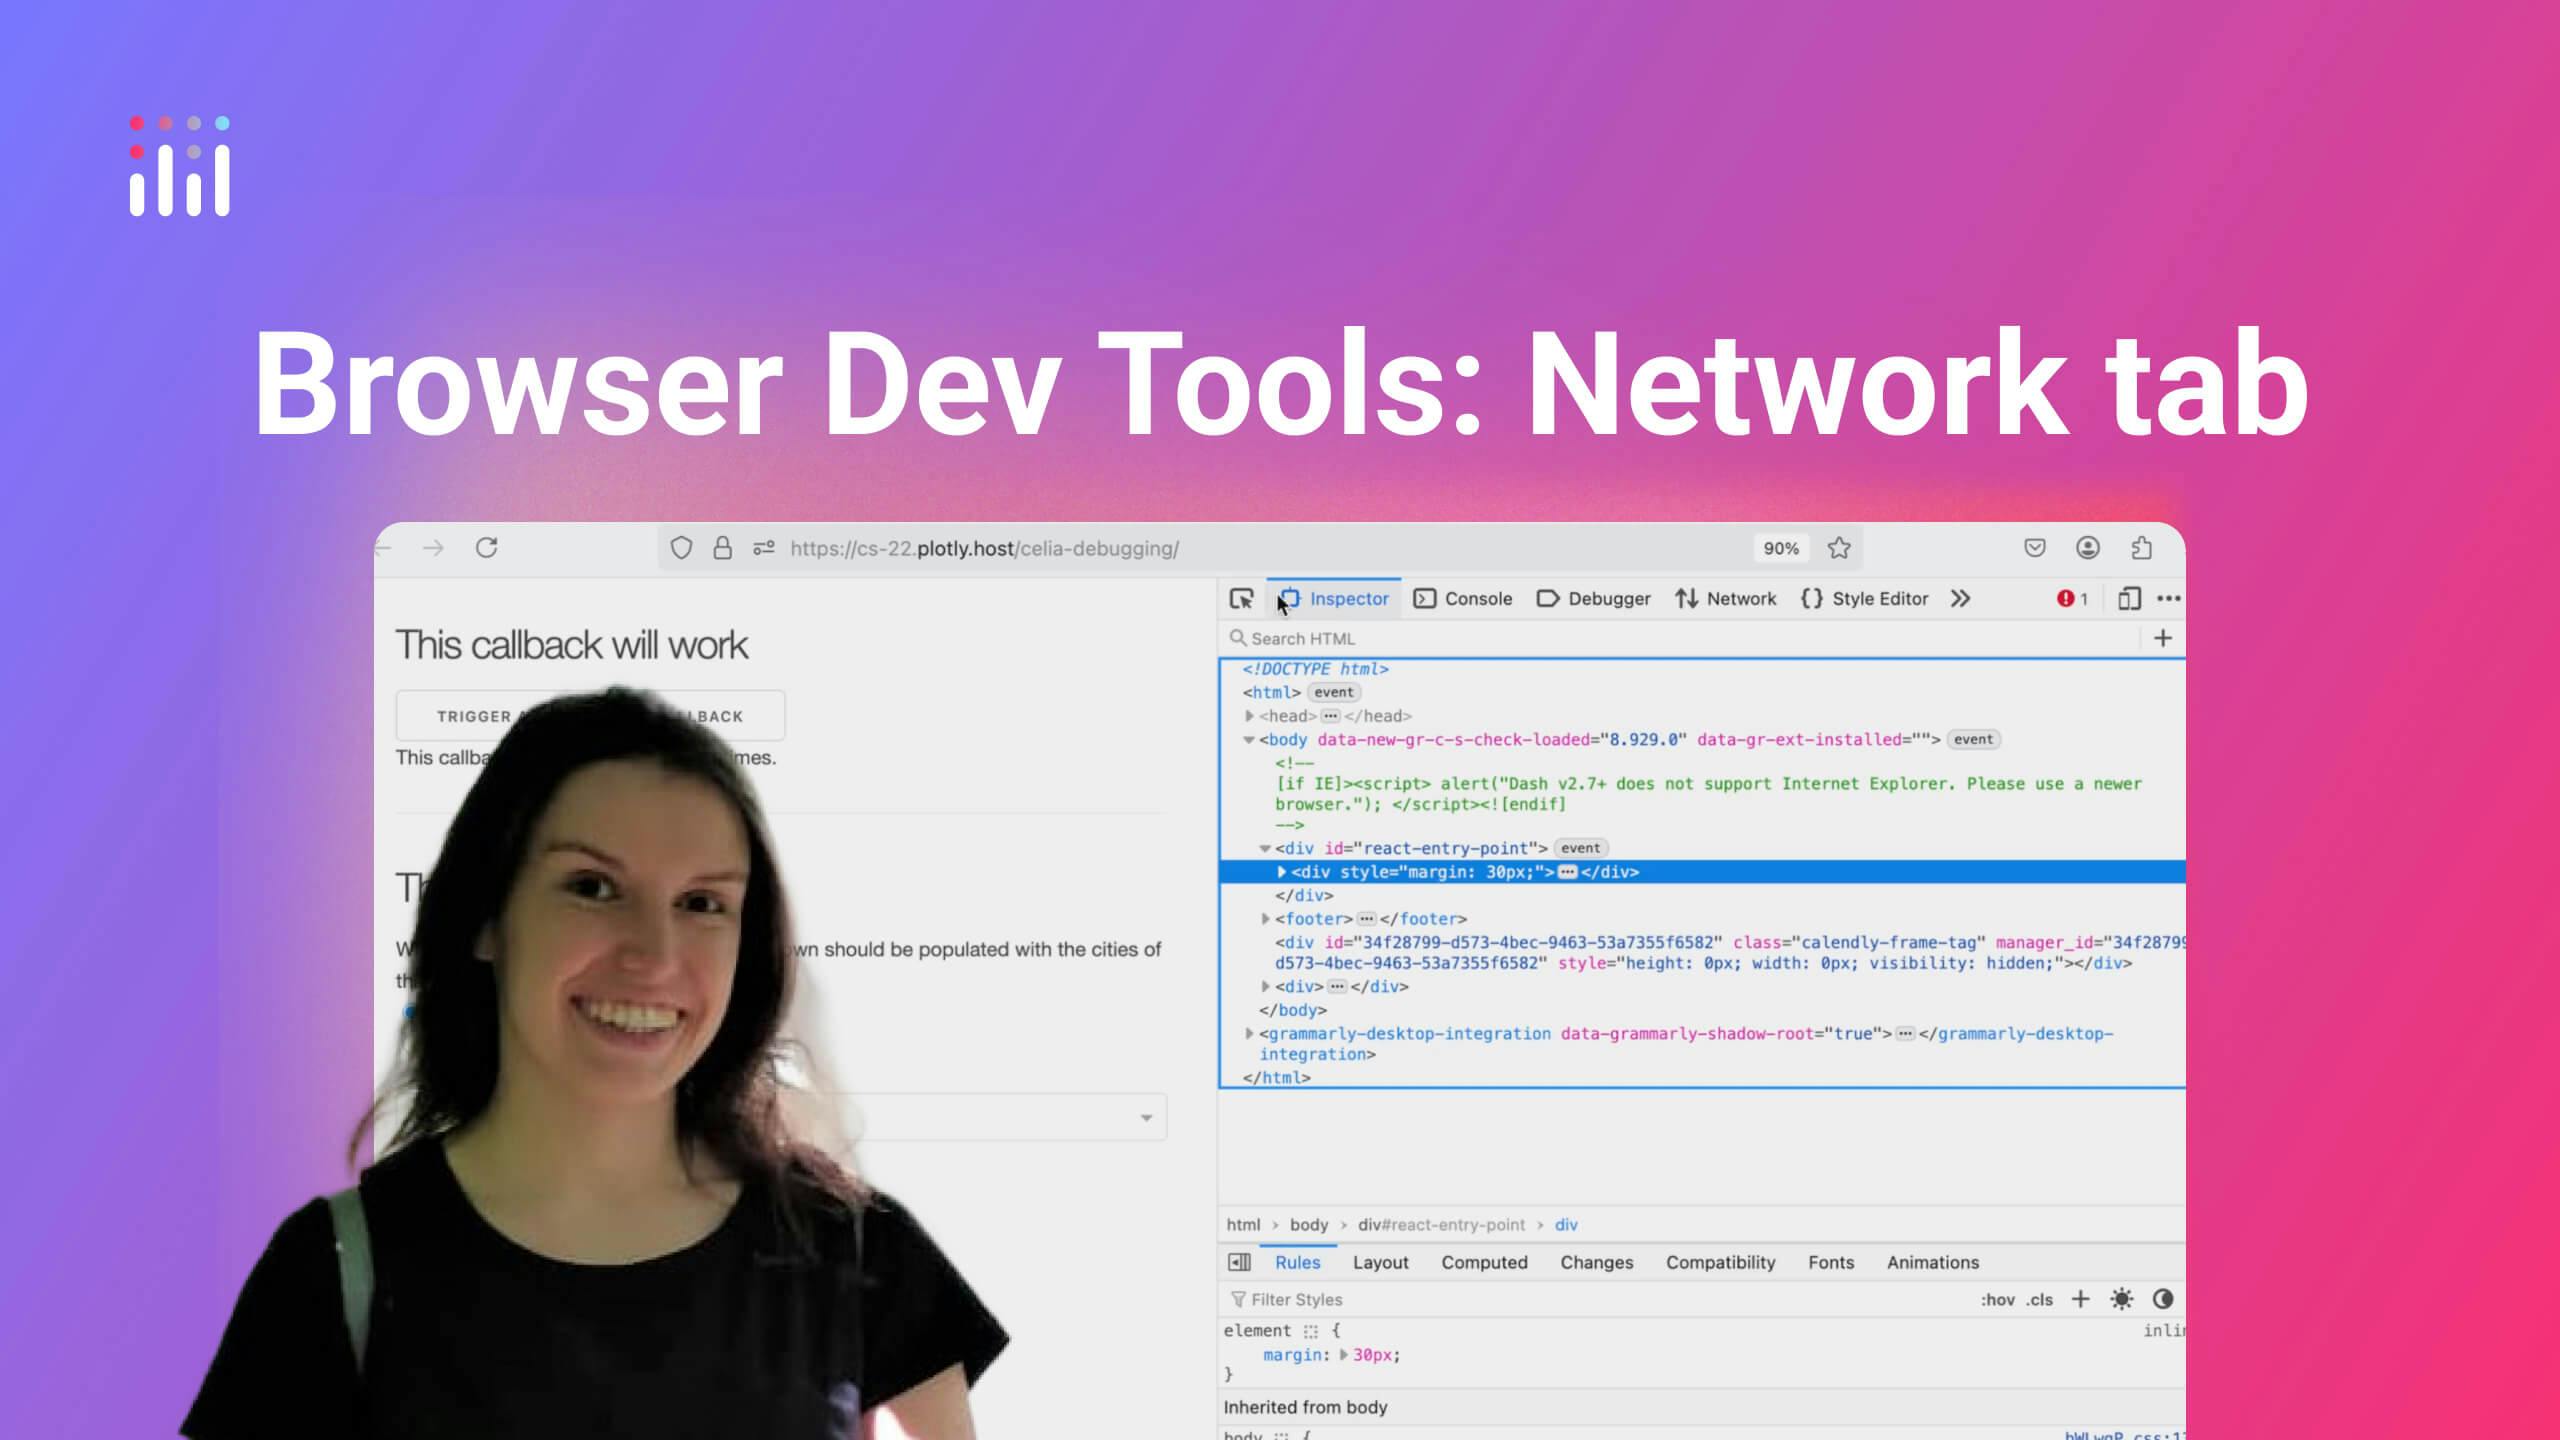
While the Network tab allows us to get details about callbacks, when we want to analyze the app’s appearance, the Elements tab is more useful.
In the Elements tab, we can see the HTML structure of the Dash components currently rendered on the page, as well as the CSS classes and styles that are being applied to them:
- The HTML structure doesn’t have a one-to-one relationship with the app’s layout code; most Dash components result in the creation of multiple HTML elements. We can identify the outermost HTML element of a Dash component because it will be the element that includes the component id (if we have specified one).
- Most CSS classes and styles are the default ones that come with the component library (Dash HTML, Dash Mantine, Dash Bootstrap); we can add our own with className, style and similar arguments.
These concepts are easier to understand with examples by experimenting like I do in this video:
When I started developing Dash apps I was not familiar at all with HTML or CSS. Back then, App Studio didn’t exist yet, so I had to learn how default and custom styles affect the Dash components in a layout to make it look as I wanted to. Now, App Studio allows easier creation and appearance customization of Dash apps.
Now, I’m still not an expert, but with these resources, I know enough to understand my Dash apps better:
- Chrome Devtools CSS section: useful even if you use another browser
- CSS selectors: although, even if you have CSS selectors knowledge, in many cases, the easiest option is to ask ChatGPT or your AI assistant of choice to “generate a CSS query selector for a HTML element with class ABC that is a descendant of an element with id XYZ”.
- Understanding the DOM (Document Object Model): also useful for Clientside Callbacks!
Takeaways
An issue in a Dash app is unexpected and unexplained behavior. The first step to finding the explanation and the rules behind it is creating a precise issue definition, for which we can use the Journalistic Six as a framework:
- What symptoms do we see? (e.g. error messages)
- How does the related code look?
- When does it happen? (e.g. when the Input for a specific callback is X)
- Where is it happening? (e.g. local environment vs deployed app)
- Who does it happen to? (e.g. every user vs users with certain browsers)
- Why does this happen? Our goal with this process is to answer this question, so at the start, it is typically unanswered.
A more detailed explanation of this methodology and a list of examples can be found in the previous post of this series.
To answer the questions from the Journalistic Six framework in a Dash app, logs, and browser devtools are a helpful resource both in development environments and deployed apps.
If there’s an error, the complete message and its traceback will appear in the logs, which are the text records of the events that happen in the app. The error message may already include a suggested solution or point us to the documentation where we can find it. If that isn’t the case, we can rely on search engines to find community solutions or AI assistants to explain the tracebacks in detail.
However, when the issue is not an error, logs don’t provide enough information because we need a more detailed report of the events. For that purpose, we can use the browser’s devtools. If the issue is related to callbacks, we should check the _dash-update-component requests in the “Network” tab. If the issue is related to the app’s appearance, we should check the CSS classes and styles applied to the HTML elements of the layout in the “Elements” tab.
Here’s a summarised decision tree that we can apply to get information from logs and devtools:
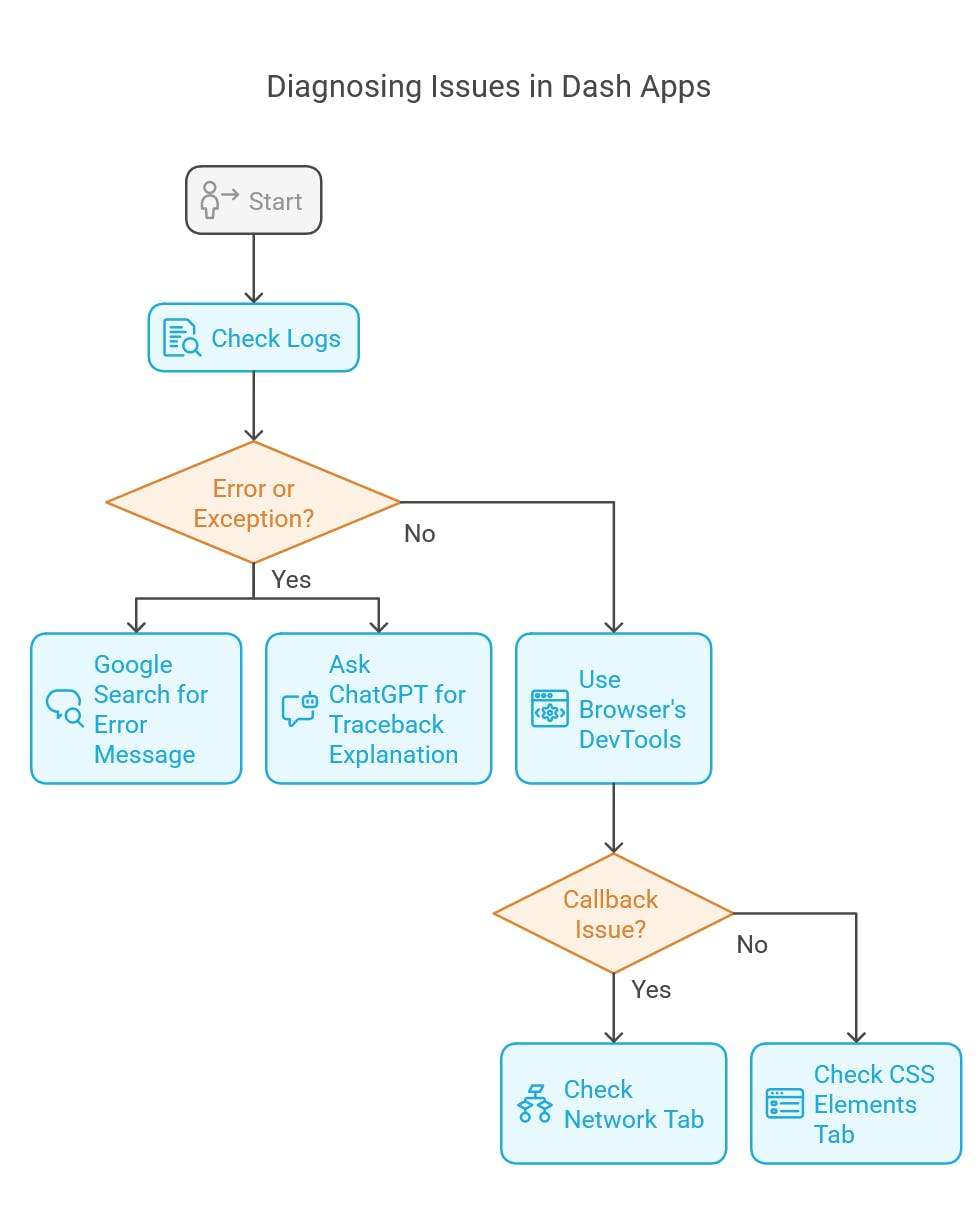
Now that we have all of this information, we should do something with it. That something, as I have hinted in the last video, is experimentation. The next step in the debugging process is to systematically modify the variables that we have identified in the information-gathering phase. That will allow us to see which variable values cause a change in the behavior of the app.
In the next part of this series, I will share how to implement said systematic experimentation.
Thanks for reading!